the Creative Commons Attribution 4.0 License.
the Creative Commons Attribution 4.0 License.
 | 13 Oct 2023
Climatological assessment of the vertically resolved optical and microphysical aerosol properties by lidar measurements, sun photometer, and in situ observations over 17 years at Universitat Politècnica de Catalunya (UPC) Barcelona
Michaël Sicard
Francesco Amato
Adolfo Comeron
Cristina Gíl-Diaz
Tony C. Landi
Constantino Munoz-Porcar
Daniel Oliveira
Federico Dios Otin
Francesc Rocadenbosch
Alejandro Rodriguez-Gomez
Andrés Alastuey
Xavier Querol
Cristina Reche
Aerosols are one of the most important pollutants in the atmosphere and have been monitored for the past few decades by remote sensing and in situ observation platforms to assess the effectiveness of government-managed reduction emission policies and assess their impact on the radiative budget of the Earth's atmosphere. In fact, aerosols can directly modulate incoming short-wave solar radiation and outgoing long-wave radiation and indirectly influence cloud formation, lifetime, and precipitation. In this study, we quantitatively evaluated long-term temporal trends and seasonal variability from a climatological point of view of the optical and microphysical properties of atmospheric particulate matter at the Universitat Politècnica de Catalunya (UPC), Barcelona, Spain, over the past 17 years, through a synergy of lidar, sun photometer, and in situ concentration measurements. Interannual temporal changes in aerosol optical and microphysical properties are evaluated through the seasonal Mann–Kendall test. Long-term trends in the optical depth of the recovered aerosol; the Ångström exponent (AE); and the concentrations of PM10, PM2.5, and PM1 reveal that emission reduction policies implemented in the past decades were effective in improving air quality, with consistent drops in PM concentrations and optical depth of aerosols. The seasonal analysis of the 17-year average vertically resolved aerosol profiles obtained from lidar observations shows that during summer the aerosol layer can be found up to an altitude of 5 km, after a sharp decay in the first kilometer. In contrast, during the other seasons, the backscatter profiles fit a pronounced exponential decay well with a well-defined scale height. Long-range transport, especially dust outbreaks from the Sahara, is likely to occur throughout the year. During winter, the dust aerosol layers are floating above the boundary layer, while during the other seasons they can penetrate the layer. The analysis also revealed that intense, short-duration pollution events during winter, associated with dust outbreaks, have become more frequent and intense since 2016. This study sheds some light on the meteorological processes and conditions that can lead to the formation of haze and helps decision makers adopt mitigation strategies to preserve large metropolitan areas in the Mediterranean basin.
- Article
(3082 KB) - Full-text XML
- BibTeX
- EndNote


Aerosols are small particles suspended in the air and can have a significant impact on both human health and the environment. These short-lived forcers have a brief atmospheric lifetime, typically a few days to a few weeks, and they play a crucial role in shaping the Earth's climate and air quality. These particles come from a variety of sources, including natural processes such as dust and sea salt and human activities such as burning fossil fuels, industrial processes, and agriculture.
The effect of aerosols on human health is mainly through inhalation. Particles can cause respiratory problems, such as asthma and bronchitis, and have been linked to increased rates of heart disease and stroke. Long-term exposure to aerosols has also been associated with lung cancer and other respiratory diseases. The elderly and children, who are more susceptible to respiratory problems, are particularly vulnerable to the negative effects of aerosols (Pope III and Dockery, 2006). In addition, in urban environments, aerosols contribute to modulating the urban heat island effect (Xue et al., 2023) during heat waves.
Aerosols also have a profound impact on climate because they can directly scatter and absorb solar radiation, influencing the energy balance of the Earth and causing cooling or warming (Crosier et al., 2007; Landi et al., 2021). Natural and anthropogenic emissions have different effects on incoming short-wave (SW) solar radiation and outgoing long-wave (LW) radiation emitted by the Earth's surface. Some aerosols, such as sulfates and marine aerosols, reflect short-wave radiation and cool the surface by increasing the planetary albedo. However, the black carbon aerosol layers absorb the incoming SW radiation, warming the air around them during the day. Dust aerosols can affect both incoming SW radiation and outgoing LW radiation, although to a lesser extent. The cooling effect (at surface) of aerosols is significant in regions with high levels of particulate pollution, such as South Asia and East Asia (Bilal et al., 2019; Yang et al., 2020; Huang et al., 2021) and certain areas of the United States (Tosca et al., 2017). The warming effect is most pronounced in the Arctic, where the concentration of aerosols is relatively low.
The presence of aerosols in the atmosphere also has an impact on atmospheric stability, vertical movements, and large-scale circulation. They can also affect regional hydrological cycles and cause significant regional climate sensitivity. In recent decades, industrial human activities have significantly altered the net aerosol radiative effect (RE) at the surface, particularly due to increased anthropogenic emissions.
The Fifth Assessment Report (AR5) of the Intergovernmental Panel on Climate Change (IPCC; Stocker, 2014) highlighted that aerosols have a negative effective radiative forcing (ERF) of −1.3 W m−2 with respect to the industrial era (1750–2014). Effective radiative forcing due to aerosol–cloud interactions is the largest contributor to total aerosol ERF, −1.0 W m−2 (medium confidence level), while the rest is due to aerosol–radiation interactions, −0.3 W m−2. Regarding the Fifth Assessment Report, the estimate of the total aerosol ERF has improved with a higher magnitude and reduced uncertainty. This is supported by advances in understanding, modeling, and observational analysis. The new Sixth Assessment Report (AR6; Adler et al., 2022) undoubtedly shows that the total aerosol ERF is negative. Compared to previous assessments, the ERF due to aerosol–cloud interactions has increased, but the ERF due to aerosol–radiation interactions has decreased. The total aerosol ERF of 1750–2019 is less certain with a magnitude of −1.1 W m−2, mainly due to recent changes in emissions. For this reason, it is of paramount importance to quantitatively assess how the optical and microphysical properties have changed in the past decades.
The uncertainties inherent in current aerosol emission databases are particularly pronounced for absorbing aerosols such as biomass burning and dust, which is a focus of the present research. Some literature (Cohen and Wang, 2014; Qin et al., 2023) suggests that the emission values of these absorbing aerosols (Wang et al., 2021) derived from remote sensing (referred to as “top-down” approaches) can be significantly higher, ranging from 2 to 4 times, compared to the “bottom-up” methodologies that are predominantly adopted by entities such as the IPCC and in many modeling studies. In particular, the findings of these top-down methodologies align more consistently with data from sun photometer (e.g., AERONET) (Burton et al., 2012) and lidar networks. This congruence underscores the potential relevance of these top-down datasets to our research outcomes. The granularity of these datasets, both in time and in space, could offer critical insights into phenomena such as extreme events or long-range transportation of aerosols. This is especially relevant when studying cases such as wildfires and events that involve the transport of mixed sources of aerosols, both anthropogenic and dust-related, as investigated in this study, where we quantitatively evaluated changes in aerosol optical and microphysical properties by combining long-term data (2004–2020) in situ concentrations of PM10, PM2.5, and PM1; aerosol optical depth; and the Ångström exponent (AE) obtained from NASA AERONET (AErosol RObotic NETwork; Holben et al., 1998) sun photometer network and lidar measurements obtained over the past 17 years at the Universitat Politècnica de Catalunya (UPC) in Barcelona, Spain. These measurements were obtained using a lidar deployed as part of the permanent observational network of EARLINET (European Aerosol Research Lidar Network; Bösenberg and Matthias, 2003; Pappalardo et al., 2014), which is dedicated to the study of atmospheric aerosols and clouds as part of the ACTRIS (Aerosols, Clouds, and Trace gases Research Infrastructure), which aims, in fact, to understand the properties and behavior of aerosols and clouds in the atmosphere of the Earth and to use this information to improve air quality and climate models.
Barcelona is one of the main industrialized metropolitan areas of the Mediterranean: a coastal city where air pollution is also exacerbated by the pollution of sea vessels (Mueller et al., 2011). In addition, Catalunya is in the middle of a complex region, the Mediterranean, where the climate changes faster than in other parts of the world. In fact, according to IPCC AR6 (Ali et al., 2022) and other studies (Nicholls et al., 2008; Lewis et al., 2019), temperatures in the Mediterranean are increasing at a rate of 20 % faster than the global average. The region's temperatures have already risen to 1.5 ∘C higher than preindustrial levels. In contrast, the global temperature increase has been slower, reaching approximately 1.1–1.3 ∘C. If human greenhouse gas emissions were to stop immediately, the Mediterranean region would be expected to experience a temperature increase of 2–4 ∘C above 19th century levels by 2100. According to Cramer et al. (2018), the evidence is clear: the Mediterranean regions that are already dry are becoming even drier. This is a milestone that the IPCC predicts the Mediterranean region will reach by the end of the century or even sooner. This analysis suggests that climate change at this level will transform large areas of southern Spain into deserts. Scrubber vegetation will replace deciduous forests, which will then move upward, replacing alpine conifer-based ecosystems. For all the previous reasons, quantifying changes in aerosol loading during the last 17 years can help shed some light on how these short-lived tracers can offset climate changes and help implement future adaptation strategies.
2.1 Instruments
(a) Lidar
Light detection and ranging (lidar) is an optically active remote sensing technique that has been increasingly used in atmospheric studies over the past few decades. Lidar measurements can provide valuable information on the vertical distribution of aerosol, cloud, and gas properties, including their optical and microphysical properties. Lidar measurements have been used in a variety of atmospheric studies, including monitoring air quality (Lolli et al., 2008, 2019), studying the vertical structure of clouds (Campbell et al., 2016, 2018; Lolli et al., 2017; Lolli, 2023), and measuring greenhouse gases such as carbon dioxide (Abshire et al., 2010) and methane (Ehret et al., 2017). The very high spatial and temporal resolution of lidar measurements makes them particularly valuable for studying atmospheric processes on regional and local scales. Various lidar techniques, such as elastic lidar, Raman lidar (Ansmann et al., 1990; Whiteman, 2003), dial lidar (Browell et al., 1998), Doppler lidar (Lolli et al., 2013), and high-spectral-resolution laser (HSRL; Grund and Eloranta, 1991), make different assumptions, allowing retrieval of optical and microphysical properties with varying degrees of accuracy.
Lidar observations are available within the framework of the EARLINET/ACTRIS project, as stated in Sect. 2.1.5. The lidar instrument, deployed at UPC and part of the EARLINET/ACTRIS project since 2000, is a multiwavelength Raman lidar using a Nd:Yag laser source, which is much more suitable than other sources such as CO2 (Ciofini et al., 2003).
The UPC multispectral lidar system, which has eight channels, is the third lidar station conceptually designed at the Remote Sensing Laboratory since the beginning of lidar research in 1993. The station is classified as a 3β + 2α +1WV +2δ elastic, Raman aerosol, or water-vapor system. The laser source is a pulsed Nd:YAG (350 mJ per pulse) that emits simultaneously at the 1064 nm (near-infrared, NIR) and 532 nm (VIS) wavelengths. The system has eight channels:
-
three elastic channels (355, 532, and 1064 nm wavelength),
-
three Raman channels (two channels, 387 and 607 nm wavelength in response to N2 532 nm excitation, and one channel, 407 nm in response to water vapor 532 nm excitation), and
-
two depolarization channels (355 and 532 nm wavelength).
The lidar is then able to retrieve the aerosol profile of the particles at the three fundamental harmonics of 355, 532, and 1064 nm.
(b) Sun photometer
Sun photometers are powerful passive remote sensing instruments that measure the optical and microphysical properties integrated into the atmospheric column of aerosols. These instruments work by measuring the intensity of direct solar radiation at different wavelengths, allowing us to estimate atmospheric aerosol loading, optical properties, and their size distribution.
In this study, we used data from the Aerosol Robotic Network (AERONET; Holben et al., 1998) station deployed at the North Campus of the UPC and located in conjunction with the lidar instrument (41.38∘ N, 2.11∘ E; 125 m above sea level).
Rodríguez-Gómez et al. (2017)Klett (1981)Fernald (1984)Zenteno-Hernández et al. (2021)Ansmann et al. (1990)Marenco et al. (1997)Rodríguez-Gómez et al. (2017)Cairo et al. (1999)Zenteno-Hernández et al. (2021)Freudenthaler et al. (2009)Rodríguez-Gómez et al. (2022)Holben et al. (1998)Eck and Holben (1999)Dubovik et al. (2002)Reche et al. (2022)Charron et al. (2004)Table 1Remote sensing and in situ instruments and the main relative measured variables used for this study.
(c) PM sensor
The hourly concentrations measured in micrograms per cubic meter (µg m−3) of PM10, PM2.5, and PM1, corrected by gravimetry (Charron et al., 2004), are taken with the commercially available GRIMM OPC (optical particle counter), which is an instrument used to measure the size and number of particles in the air. This measurement was obtained by continuously sampling the air and counting the number of particles that passed through the instrument's optical sensor.
Data for this study are obtained from the observational site deployed at CID (Center d'Investigació i Desenvolupament) CSIC (Consejo Superior de Investigación Cientificas) in Barcelona (43.38∘ N, 2.11∘ E; 77 m above sea level). All the measured variables, with specifications and references, are reported in Table 1.
2.1.1 Networks of instruments
(a) EARLINET
The European Aerosol Research Lidar Network (EARLINET; http://www.earlinet.org, last access: 6 October 2023), established in 2000, is the first coordinated aerosol lidar network whose main objective is to provide a comprehensive, quantitative, and statistically significant database on the spatial and temporal distribution of aerosols on a continental scale (Bösenberg and Matthias, 2003; Pappalardo et al., 2014). Currently, the network includes 31 active stations spread across Europe (Pappalardo et al., 2014). Lidar observations within the network are performed on a regular schedule of one daytime measurement per week around 12:00 solar time, when the boundary layer is usually well developed, and two nighttime measurements per week, with low background light, to perform Raman extinction measurements. In addition to routine measurements, further observations are devoted to monitoring special events such as desert dust outbreaks, for example, Ansmann et al. (2003), Mona et al. (2006), Papayannis et al. (2008), Guerrero-Rascado et al. (2008), Mamouri et al. (2013), Nisantzi et al. (2015); forest fires, for example Müller et al. (2005), Amiridis et al. (2009), Alados-Arboledas et al. (2011), Nisantzi et al. (2014); photochemical smog, for example, Carnuth et al. (2002); and volcanic eruptions, for example Pappalardo et al. (2004), Wang et al. (2008), Mattis et al. (2010), Ansmann et al. (2010), Gross et al. (2012), Papayannis et al. (2012), Sicard et al. (2012), Wiegner et al. (2012), Navas-Guzmán et al. (2013), and Pappalardo et al. (2013). EARLINET started correlative measurements for the spaceborne lidars on board NASA's CALIPSO (Cloud-Aerosol Lidar and Infrared Pathfinder Satellite Observation) in June 2006 (Pappalardo et al., 2010) and ESA's AEOLUS in August 2018. EARLINET is currently a key component of the ACTRIS infrastructure, which represents a great step toward better coordination of atmospheric observations in Europe towards the establishment of the European component of an Integrated Atmospheric Global System as part of GEOSS, the Global Earth Observation System of Systems (Lautenbacher, 2005). EARLINET is also a contributing network to the Global Aerosol Watch Program of the World Meteorological Organization.
The Barcelona lidar station has been a member of EARLINET since its inception in 2000. The Barcelona lidar group at CommSensLab-UPC has been developing lidar instruments since 1993. The present system has just been updated with a new laser in June 2022. The general characteristics appear in Rodríguez-Gómez et al. (2022). The system at present, differently from the configuration during 2004–2017, has three elastic channels (UV, VIS, IR), two Raman channels using the pure rotational Raman effect (UV, VIS), two depolarization channels (UV, VIS), and one water vapor channel. The implementation of a new broadband fluorescence channel is ongoing.
For this study, we used the level 2 backscattering coefficient (quality guaranteed) at 532 and 1064 nm. Measurements are taken following the EARLINET measurement schedule, as shown in Bösenberg and Matthias (2003) and D'Amico et al. (2015). The observational site is located on campus north of the UPC at 41.38∘ N, 2.12∘ E; 125 m above sea level.
(b) AERONET
The NASA Aerosol Robotic Network (AERONET) is a globally distributed network of ground-based sun photometers operated by academic institutions and government agencies. These are commercially available sun photometers manufactured by Cimel Electronique (Holben et al., 1998). AERONET has become a critical tool for studying aerosol properties, as the network provides long-term high-quality measurements that can be used to validate satellite observations and improve our understanding of aerosol impacts on the environment. The AERONET database (https://aeronet.gsfc.nasa.gov/, last access: 6 October 2023) is openly available to the public and is widely used by researchers, government agencies, and other stakeholders around the world to inform policy decisions and advance scientific understanding of the Earth system. The success of AERONET can be attributed to the standardization of instrumentation, measurement protocols, and data processing algorithms, which ensure the quality and consistency of the data collected by the network.
2.2 Retrieval methods
2.2.1 Optical properties
(a) The atmospheric backscatter profile by Raman lidar
The main advantage of Raman lidar is that it can independently retrieve vertically resolved backscatter and extinction coefficients without assuming an approximate range-independent lidar ratio, i.e., the ratio between the aerosol extinction coefficient and the aerosol backscatter coefficient, which shows very large variability for aerosols (20sr-120sr; Ackermann, 1998). Multiple studies (Ferrare et al., 2006; Reichardt et al., 2012) have demonstrated that the precision of the optically resolved vertical properties of the aerosol obtained from Raman lidar is significantly influenced by the solar background. Therefore, to improve their accuracy, measurements are performed primarily at night. The Raman lidar inversion algorithm is generally based on Ansmann et al. (1990) to independently retrieve the vertical profile of aerosol extinction and aerosol backscatter at the elastic wavelength λ0 (λ0=355, 532 nm) and hence the aerosol lidar ratio profile given the Raman backscattered lidar return at λR (λR=387, 607 nm, respectively). Here, λR denotes the Raman-shifted wavelength associated with the elastic wavelength λ0.
The backscatter coefficient analyzed in the present study is obtained with the more accurate available technology, on a profile-by-profile basis, i.e., Raman at 532 nm at night, Klett–Fernald inversion, and iterative method during the day or at 1064 nm.
The lidar backscatter profiles have a vertical resolution of 60 m and are averaged seasonally (see Sects. 3.1 and 3.2). However, it is important to note that the lidar database is not uniform across all years. Some periods have more measurements than others, which affects the level of uncertainty associated with the different average profiles. The seasonal Mann–Kendall test (see Sect. 2.3.3) accounts for these differences in measurement frequency by weighting the averaged profiles accordingly.
(b) Aerosol optical depth
Another fundamental parameter linked to the aerosol optical properties, the aerosol optical depth (AOD), is a measure of the attenuation of light due to the presence of aerosols in the atmosphere and can be retrieved both by lidar, by integrating the extinction lidar profile over the altitude, and by sun photometer, by measuring the amount of direct sunlight that reaches the Earth's surface and comparing it to the amount of sunlight that would have reached the surface if there were no aerosols in the atmosphere. To retrieve the AOD, a sun photometer typically takes measurements of the solar irradiance at several wavelengths.
The measurements are then used to calculate the AOD by applying the Beer–Bouger–Lambert law (Beer, 1852), which describes the intensity of a light beam propagating in an inhomogeneous medium (the atmosphere) in relation to the total extinction coefficient (i.e., scattering + absorption) and hence to the aerosol presence. In Table 1 all the different optical and microphysical variables measured by lidar, sun photometer, and in situ sensors with relative specifications are reported. The other variables are retrieved from the main variables in Table 1.
2.2.2 Microphysical properties
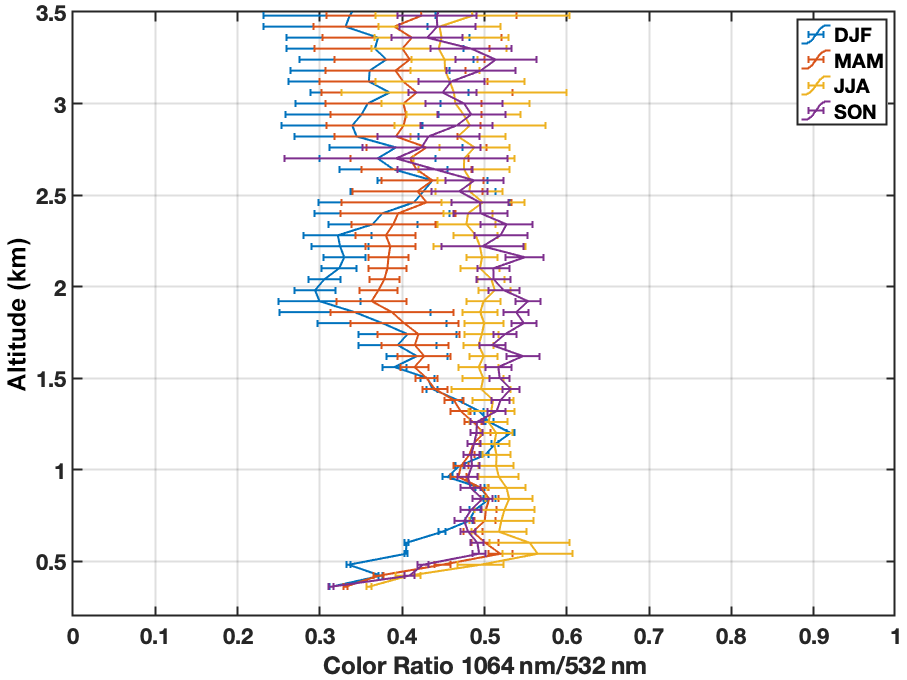
(a) Color ratio
When comparing backscattered signals from two different wavelengths, lidar can distinguish between coarse and fine modes of aerosols, providing important information on their size (Vaughan, 2004; Liu et al., 2017). Coarse-mode aerosols are generally larger than 1 µm in diameter and include particles such as dust (Landi et al., 2021), pollen (Sicard et al., 2021), and sea salt. These aerosols are typically emitted from natural sources, such as deserts, oceans, and vegetation, as well as anthropogenic sources, such as construction sites and agriculture.
Hess et al. (1998)Mazzola et al. (2010)Smirnov et al. (2002)Eck and Holben (1999)Smirnov et al. (2002)Eck and Holben (1999)
Fine-mode aerosols are generally smaller than 1 µm in diameter and include particles such as sulfate, nitrate, ammonium, organic carbon, and black carbon. These aerosols are typically emitted from anthropogenic sources, such as fossil fuel combustion, biomass burning, and industrial processes, as well as from natural sources such as volcanoes and wildfires. They often exhibit complex mixtures, particularly when they are not sourced locally. It is noteworthy that smaller particles, specifically those under 2 µm, showcase this complexity vividly. These particles, often born as carbon-centric cores, over time, get enveloped by both organic and inorganic layers, forming shells around them. In certain observed cases, there is even evidence that dust particles become coated with anthropogenic pollutants. Such interactions can be particularly relevant in instances where collisions occur between dust and human-induced sources. Analyzing these particle structures using a core–shell framework, or other Mie-scattering-based mixing methodologies, aligns with practices already employed by AERONET. Consequently, adopting such an approach in the research presented here would likely produce results consistent with the existing literature and observations.
The aerosol backscatter coefficient at a wavelength of 1064 nm, obtained from the ACTRIS/EARLINET UPC lidar, is used to determine the aerosol size together with the aerosol backscatter coefficient at 532 nm. Shorter wavelengths (such as 532 nm) are more sensitive to the aerosol fine mode, whereas longer wavelengths (such as 1064 nm) are more sensitive to the aerosol coarse mode. Therefore, the color ratio is often used to differentiate between the coarse and fine modes of aerosols. The color ratio (CR) is defined at each altitude z as the ratio between the backscatter coefficient at 1064 nm β1064(z) and the backscatter coefficient at 532 nm.
The color ratio χ is typically expected to fall between zero and 1. In general, smaller values of the color ratio are indicative of smaller particles, while larger values (χ≈1) correspond to larger particles for which geometric optics can provide an adequate approximation of the scattering process. As shown in Haarig et al. (2018), CR values greater than 0.7 are related to dust aerosols from the Sahara, while CR values lower than 0.5 indicate smaller particles related to anthropogenic emissions. Between these values, it is likely to be a mixture of anthropogenic aerosols and dust aerosols. This observation may suggest the presence of heavily aged anthropogenic or fire-origin aerosols that have persisted in the atmosphere for an extended period. Over time, these aerosols may have gradually increased in size, approaching the boundary between fine and coarse modes.
CR can also be computed from in situ sensors by taking the ratio between PM10 and PM2.5 concentrations as shown in Fan et al. (2021). Again, values close to 1 indicate coarse aerosol, while values lower than 0.5 indicate a predominance of fine aerosol mode.
(b) Ångström exponent retrieval
Likewise, the Ångström exponent (AE) can differentiate between coarse- and fine-mode aerosols. It is defined as the slope of the logarithm of the aerosol optical depth (AOD) at two different wavelengths (440–870 nm in this study). The most common way to retrieve AE is by measuring AOD at two or more wavelengths using remote sensing techniques such as sun photometry (Dubovik et al., 2002) or satellite-based instruments (Levy et al., 2010). The sun photometer measures solar irradiance at multiple wavelengths. The AOD is then calculated by comparing the measured solar irradiance with the modeled solar irradiance, assuming a clear sky. The Ångström exponent can be calculated from the AOD measurements at different wavelengths.
The Ångström exponent is an important indicator of the primary size range of columnar aerosols (see Table 2), as the AOD spectral curve is strongly associated with the particle size distribution (Dubovik et al., 2002). Typically, AE falls within the range of 1.3 to 1.7 in urban or continental sites, has lower values between 0 and 0.6 when there is desert dust, and ranges between 0 and 0.35 in the presence of marine particles, as shown in Hess et al. (1998), Smirnov et al. (2002), Eck and Holben (1999), and Mazzola et al. (2010). In this study, AE is retrieved from 440–870 nm wavelengths. For future studies, it would be valuable to explore the utilization of different metrics to weigh distinct independent wavelengths. This approach could potentially reveal nuanced information about the composition and characteristics of mixed aerosol types.
(c) Lidar volume depolarization ratio
UPC lidar instrument is also equipped with a depolarization channel at 532 nm (Rodríguez-Gómez et al., 2017, 2022; Zenteno-Hernández et al., 2021). The laser signal emitted is 100 % linearly polarized in a direction. The depolarization channel is measuring the backscattered energy in a direction that is perpendicular to the laser polarization, and then the degree of depolarization is measured. In this study, we use the Level 2.0 volume depolarization product, which is the sum of the molecular and particle depolarization. Detailed information on the volume depolarization channel can be found in Rodríguez-Gómez et al. (2017) and Zenteno-Hernández et al. (2021). More generally, lidar depolarization processes can be found in Cairo et al. (1999) and Freudenthaler et al. (2009).
(Giles et al., 2019)(Giles et al., 2019)(Reche et al., 2022)(D'Amico et al., 2015, 2016)(D'Amico et al., 2015, 2016)Table 3Unprocessed temporal resolution of the data and new Level 3 used to determine long-term temporal trends.
(d) Aerosol typing
Through the lidar volume polarization channel, it is possible to distinguish between different types of aerosol. Dust particles have irregular shapes that cause them to scatter light in a highly depolarized manner. On the other hand, other types of aerosol, such as water droplets or pollution particles, have more spherical shapes and cause less depolarization of scattered light (Freudenthaler et al., 2009; Lolli et al., 2011; Haarig et al., 2018).
Combustion products and anthropogenic aerosols, in general, found mainly in an urban environment or large metropolitan areas, are predominant spherical (Volume Depolarization < 10 %), whereas dust particles and ash from volcanic eruptions (especially fresh) show irregular shapes, with a much higher volume depolarization value, as shown in (Haarig et al., 2018). Volume depolarization is defined as the ratio between the cross-backscatter coefficient and the parallel backscatter coefficient at 532 nm.
(e) Fine and coarse mode and implication for aerosol microphysics
Using two independent lidar measurements at two different wavelengths allows the differentiation between coarse and fine aerosols, providing important information on aerosol microphysics (Mamouri and Ansmann, 2014). This is because the size of the aerosol particles affects the way they interact with light at different wavelengths. The backscattered signal by fine particles is more sensible at 532 nm than at 1064 nm, whereas coarse particles are less wavelength selective, and the difference in backscattering at the two wavelengths is much less with respect to smaller particulate.
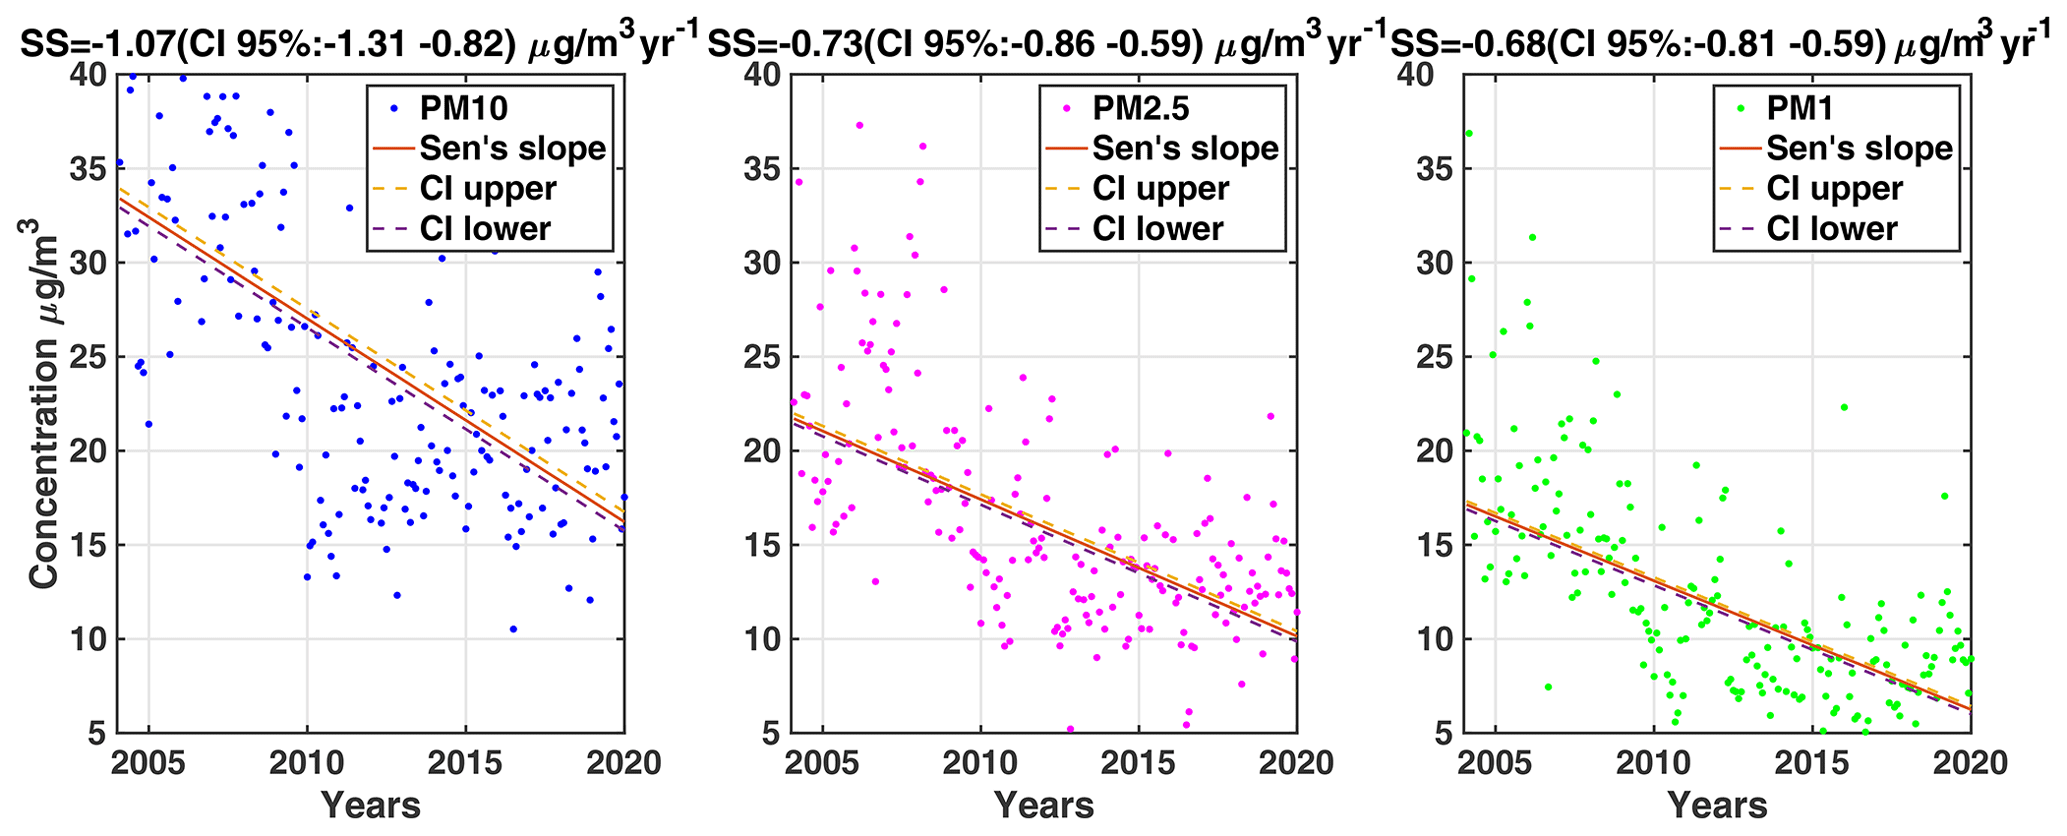
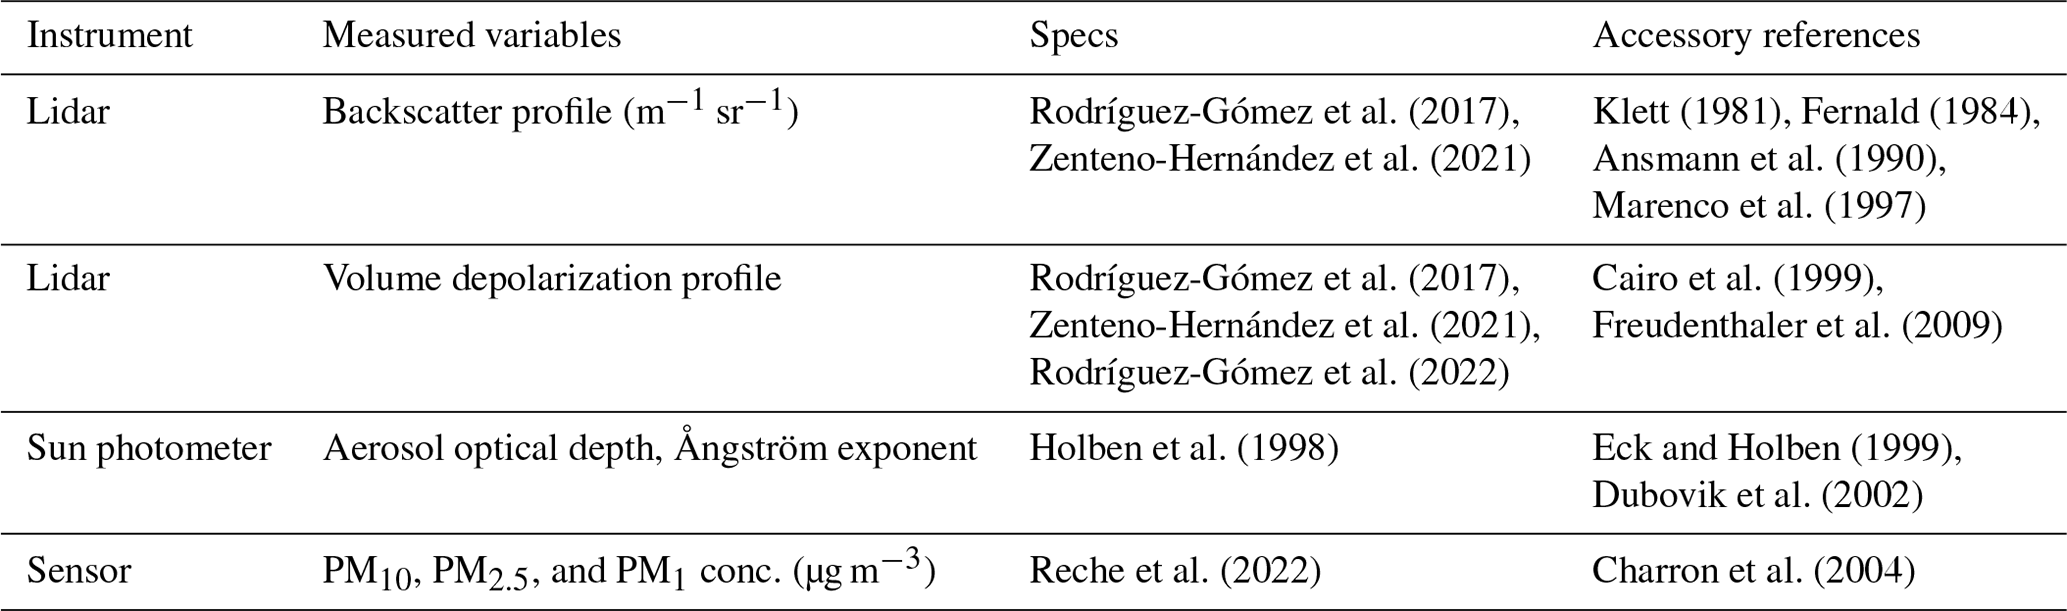
Figure 1Plot of seasonal MK test for monthly averages of PM10, PM2.5 and PM1. A trend is evident at a confidence level 95 % with a Sen slope of −1.07 (CI 95 % −1.31 −0.82), −0.73 (CI 95 % −0.86 −0.59) and −0.68 (CI 95 % −0.81 −0.59) µg m−3 yr−1 respectively. These values correspond to a decrease of 54 %, 61 %, and 68 % over 17 years.
2.3 Statistical methods
2.3.1 Quality assurance screening
To guarantee the highest possible quality of the final products and, at the same time, to ensure the homogeneity of the data from different types of lidar systems, the EARLINET infrastructure has implemented a rigorous quality assurance program that all affiliated stations are expected to meet (D'Amico et al., 2015, 2016). The implementation of the quality assurance program has been and still is one of the main activities of the infrastructure and is a prerequisite to establish and monitor the performance of different lidar systems that are part of the infrastructure over time. The quality control of EARLINET applies to both lidar instruments and analysis algorithm levels. Without the requirements of the quality assurance program, it is not possible to submit data to the data center. Data that do not comply with the EARLINET standards are rejected already in the submission phase. Automatic feedback is provided to the “data originator” reporting all the problems incurred for each rejected file, fostering the prompt resubmission of the data. There are two types of quality control procedures:
-
basic quality control (BQC), which is a technical quality control on the submitted product, executed to ensure that the product is mainly compliant from a technical point of view with the defined standard, and
-
advanced quality control (AQC), which is a series of physical checks applied to the input product, performed to assess the quality from a physical point of view of the product.
If one or more basic quality controls fail, the submitted product is rejected, and detailed feedback is sent to the data source. If the product satisfies the basic quality controls, it is sent in batches to the advanced quality controls. If the input product fails at least one advanced quality control, the product is labeled as Level 1, otherwise Level 2. Level 1 data are intended as data that users should treat with caution considering failed QC procedures. Information on the result of the QC procedure is reported in the file itself for complete traceability. Level 2 data are, instead, data that are fully compliant with what a user can expect from the ACTRIS/EARLINET infrastructure and with data documentation.
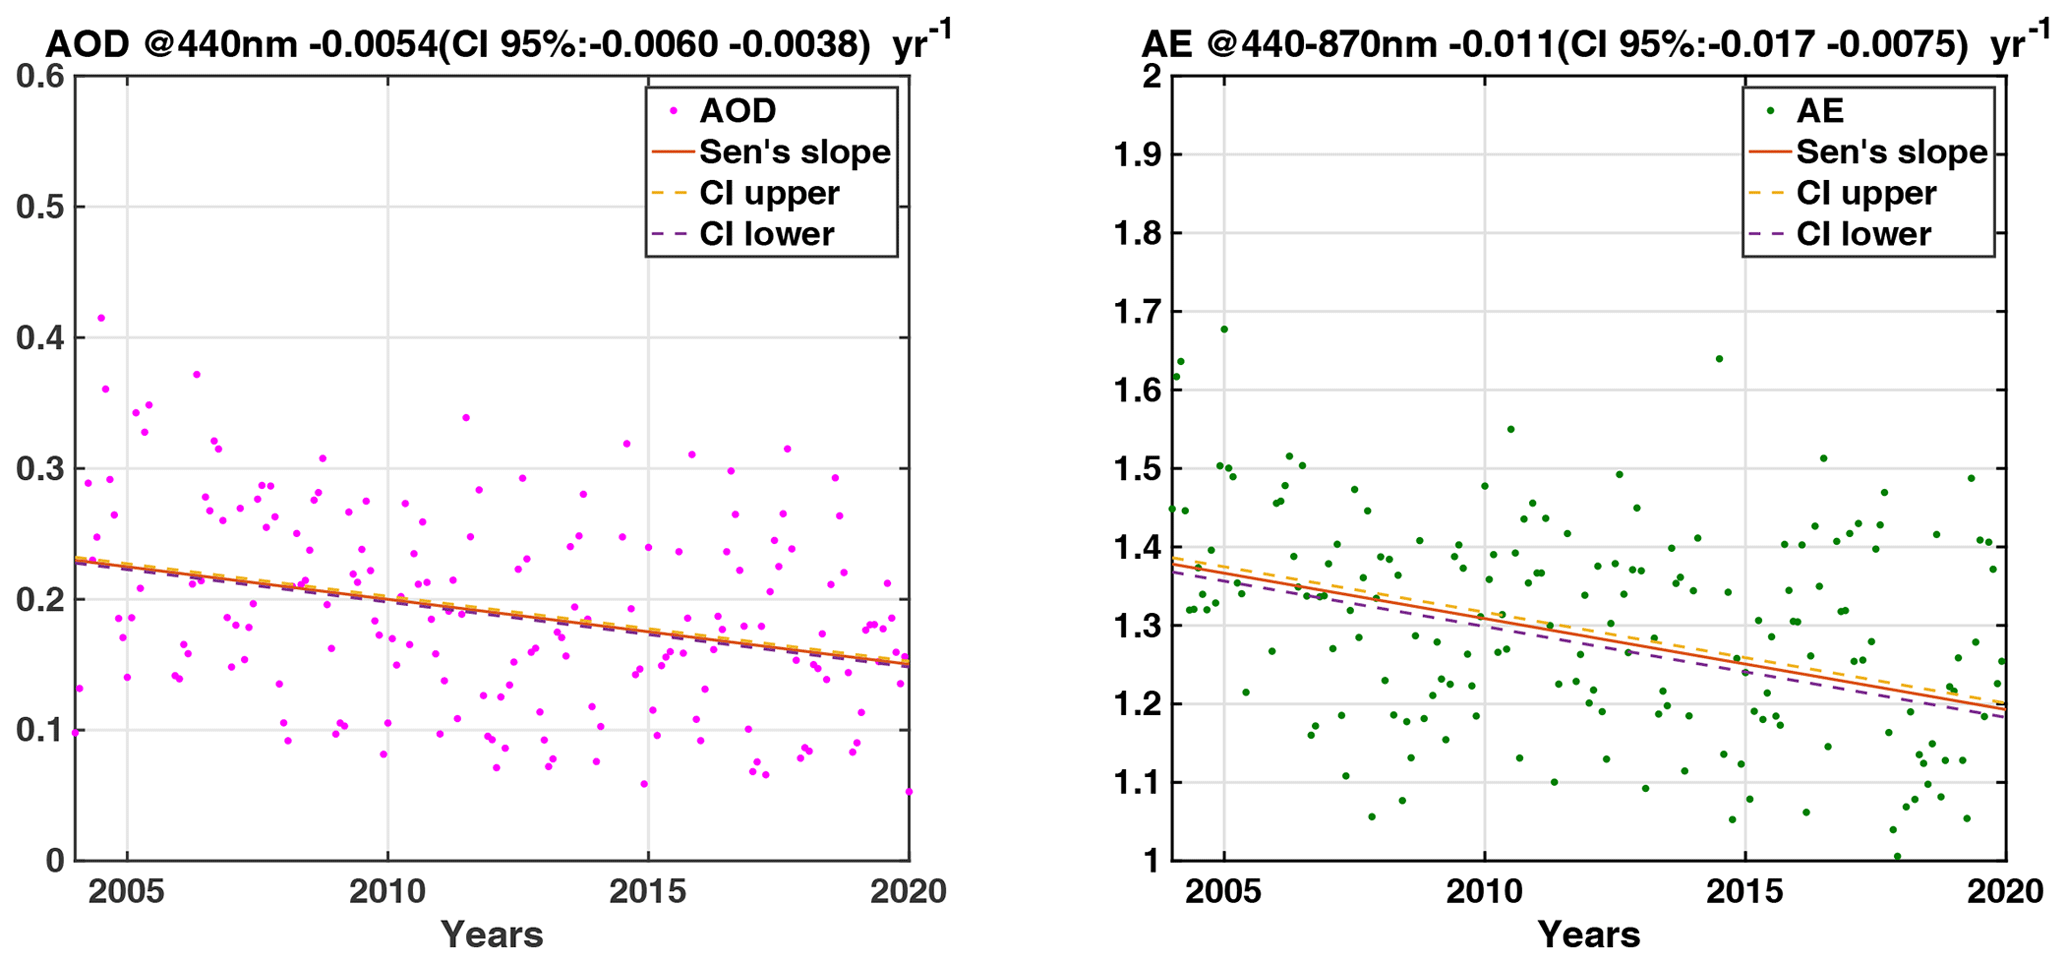
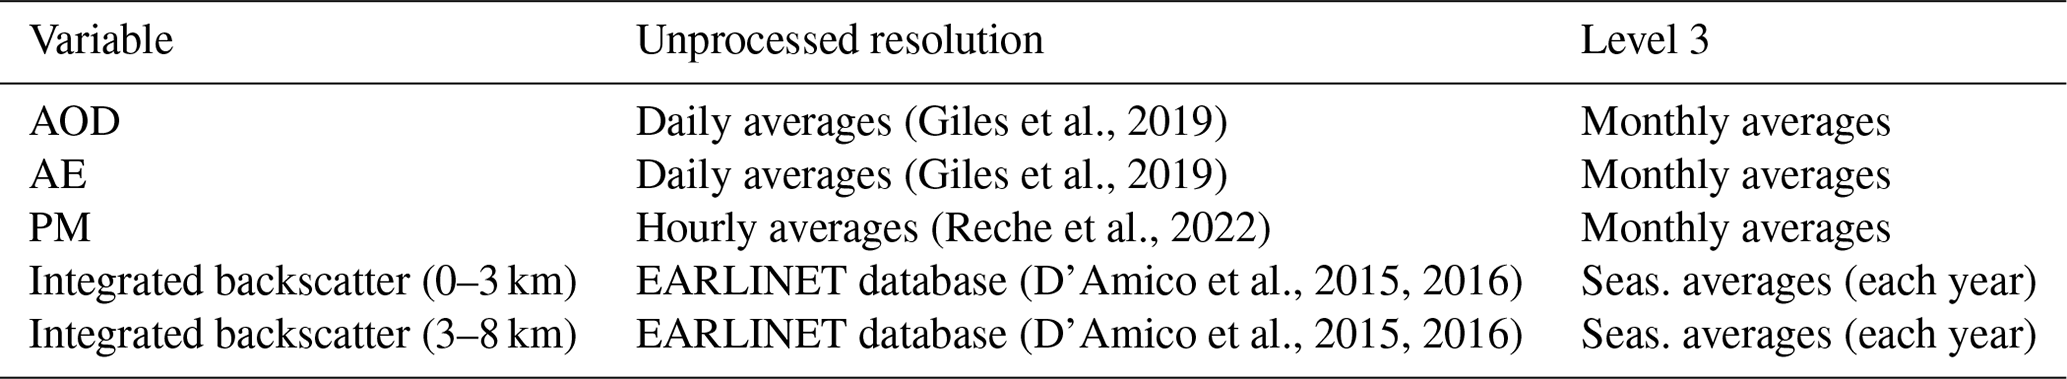
Figure 2Plot of seasonal MK test for AOD monthly averages at 440 nm and Ångström exponent from AERONET data. A trend is evident at a confidence level of 95 % with a Sen slope of −0.0054 (CI 95 % −0.0060 −0.0036) for the AOD and −0.011 (CI 95 %: −0.017 −0.0075) for Ångström exponent.
2.3.2 Year-by-year and seasonal statistical significance
Seasonal Mann–Kendall test
The most suitable way to determine temporal trends in aerosol optical depth (AOD), Ångström exponent (AE), and PM concentrations is through a rank-based non-parametric method, which does not require a specific statistical distribution and can handle missing values, negative or below detection limit values. In this study, the Mann–Kendall (MK) test is used to identify increasing or decreasing long-term monotonic trends. The Sen slope estimator, which is based on the median of slopes calculated from all possible data pairs, is then used to calculate the slope and confidence limits (95 % confidence level in this study). Due to the presence of distinct seasonal patterns in a large number of time series, the modified seasonal MK test (Hirsch et al., 1982) was consistently used to assess trends over 12 months. The MK test is intended for data that are not serially correlated, so the presence of autocorrelation in a time series can affect the results and lead to a higher chance of erroneously rejecting the null hypothesis of no trend. This is known as a type 1 error or false positive. We ran a test on the monthly averaged data without finding any significant correlation (not shown). We then analyze the long-term trends for both AOD and AE retrieved from AERONET and PM10, PM2.5, and PM1 from in situ observation.
Data are aggregated on a monthly average (see below), and the seasonal Mann–Kendall (MK) test with the Sen slope is computed to establish statistically significant temporal trends. The MK test takes into account seasonality. The MK test was first proposed as an extension of the Spearman rank (Yue et al., 2002) correlation test. Although Spearman's rho can identify linear relationships between two variables, the Mann–Kendall test can detect both linear and non-linear changes over time. Furthermore, unlike other trend tests, such as least-squares regression or analysis of variance, which require large sample sizes for accurate estimates, Mann–Kendall is suitable for small samples that are often encountered in environmental studies (Von Storch and Zwiers, 2002).
For this study, we applied the seasonal Mann–Kendall test in AERONET Version 3 Level 2 quality-checked AOD, AE observations (Giles et al., 2019), and monthly averaged data of Level 2 PM concentration (see Sect. 3.1). The temporal resolution of the unprocessed AOD, AE, PM, and lidar observations can be found in Table 3.
The seasonal MK test is considered better than other temporal trend tests due to its ability to handle tied data, which can occur frequently in environmental data sets. Additionally, the Mann–Kendall test has greater statistical power than other trend tests, meaning that it is more likely to detect a trend when one exists, and it has a lower type I error rate, which reduces the chances of falsely detecting a trend when one does not exist.
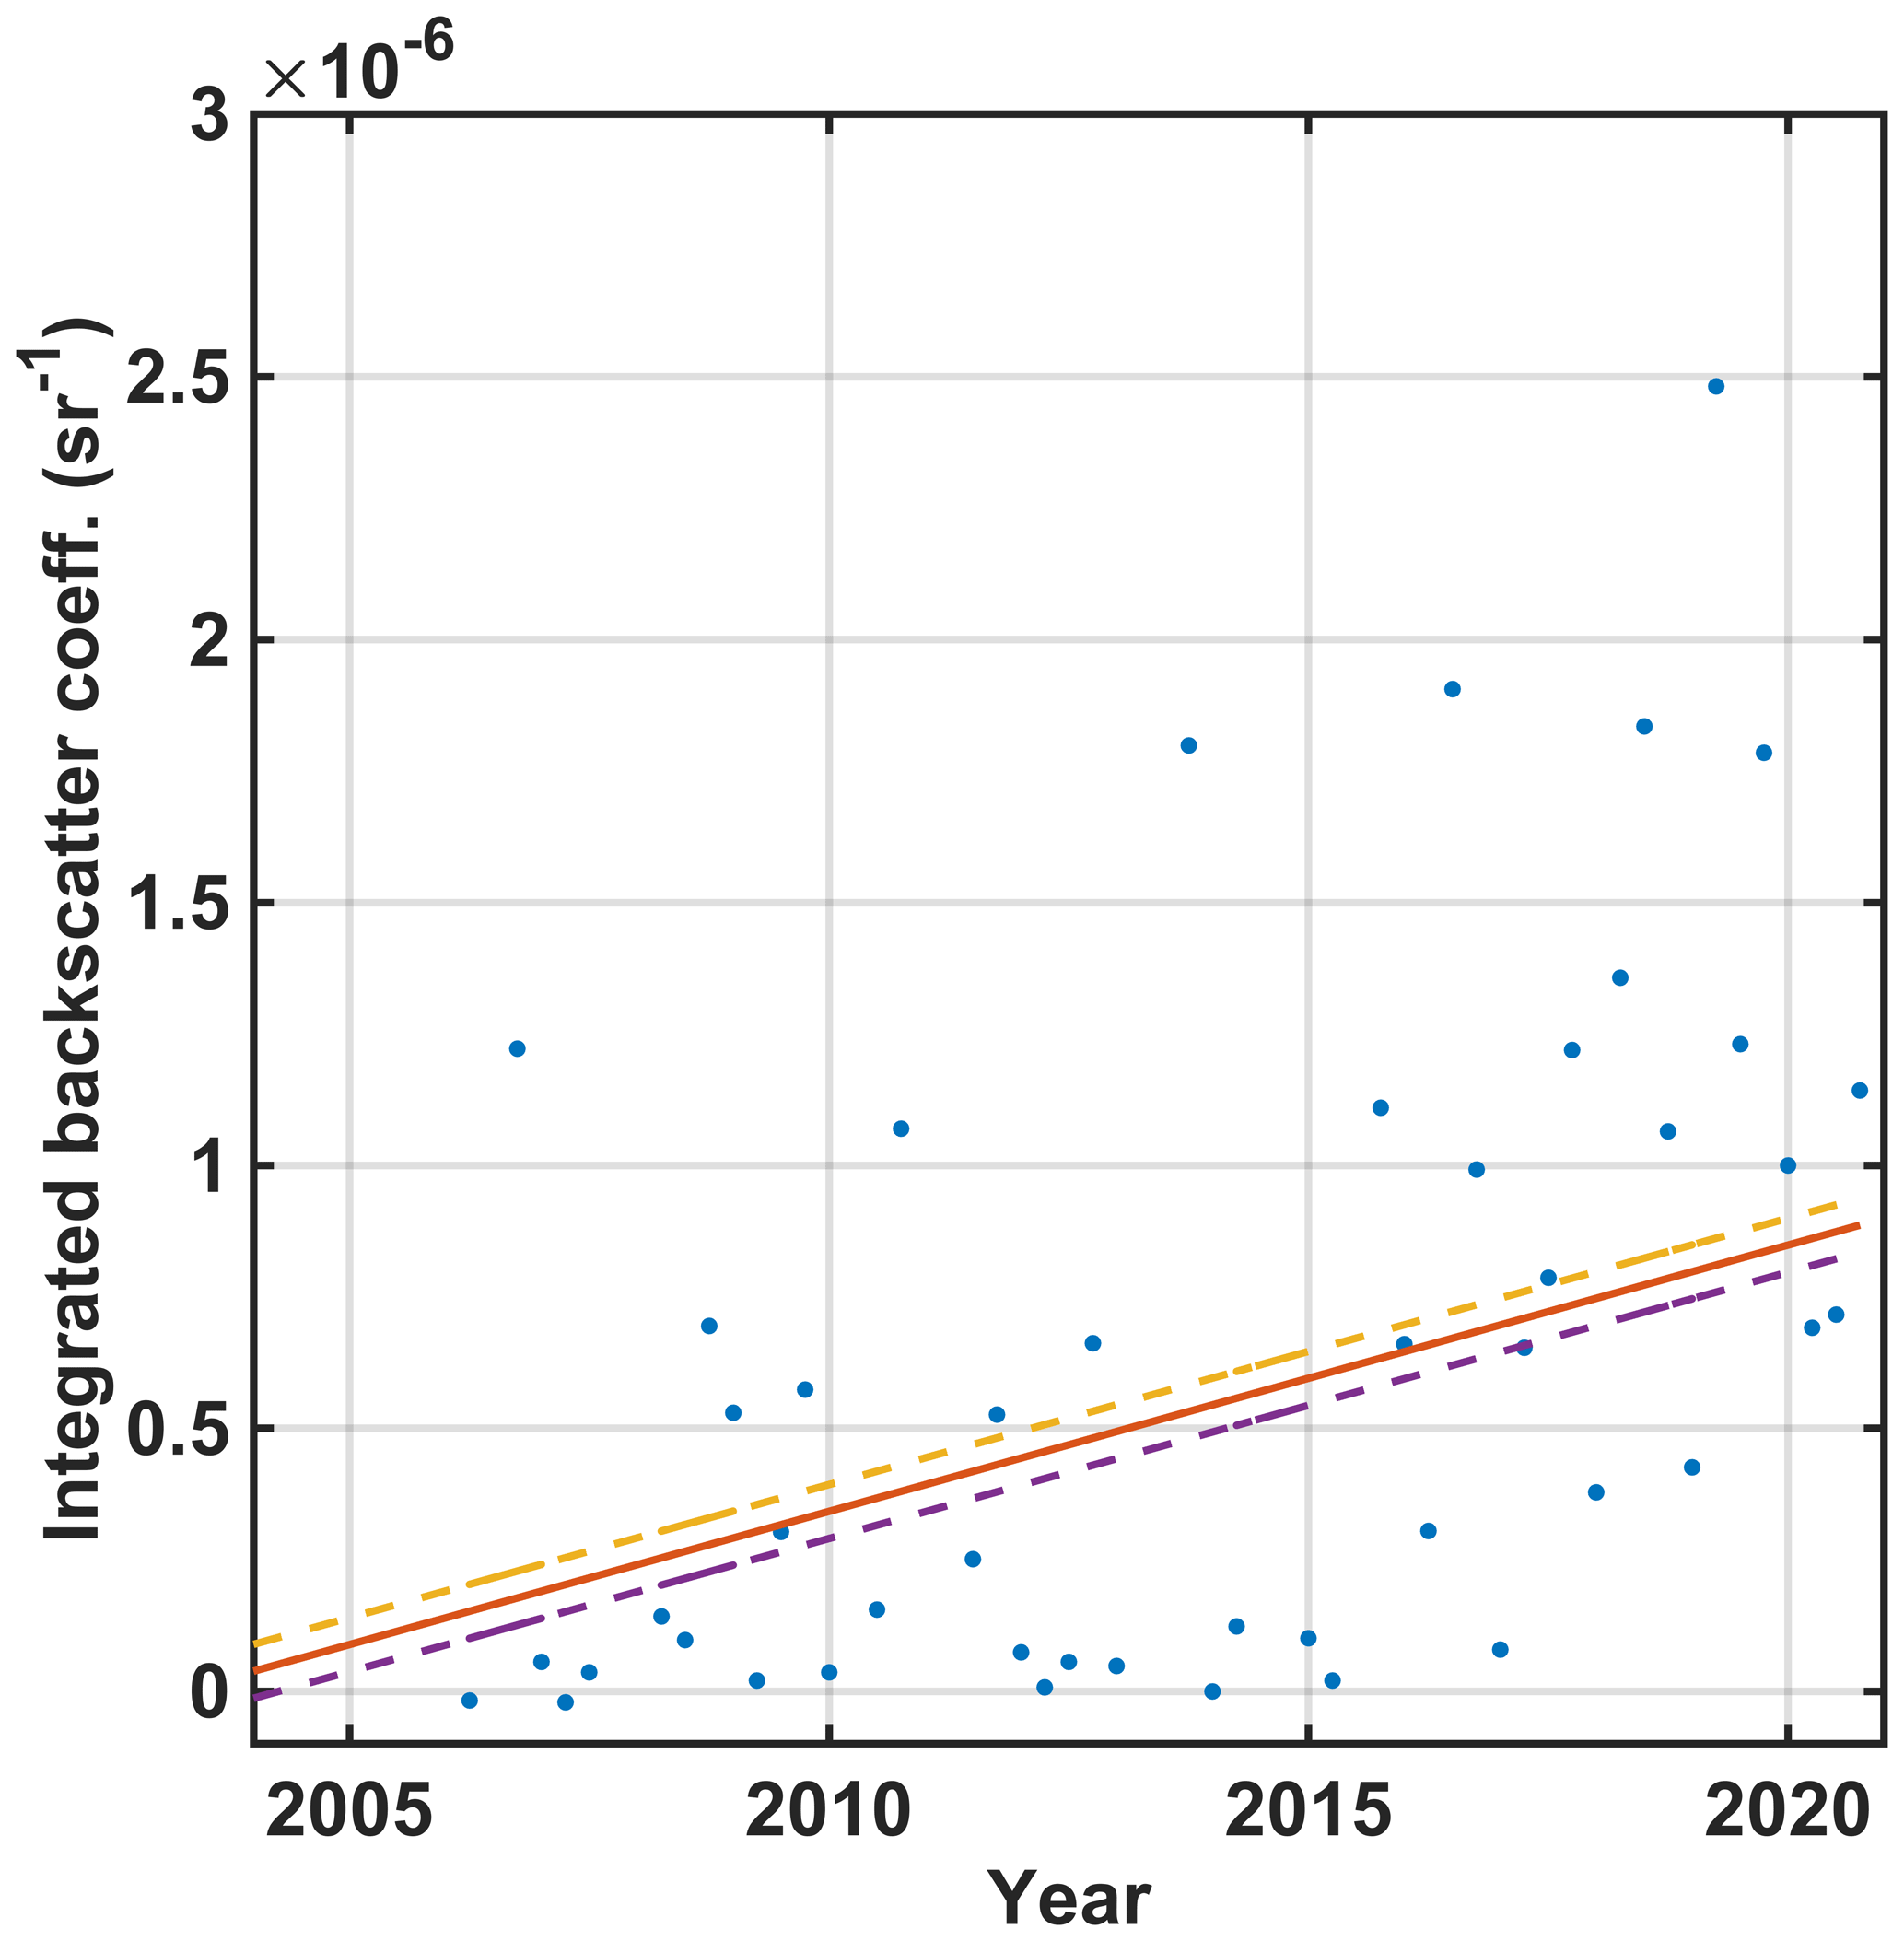
Figure 3The MK test was applied to the averaged integrated backscatter profiles averaged by season (for each year) from 3 to 8 km. The Sen slope is sr−1 yr−1 (CI 95 %: sr−1 yr−1– sr−1 yr−1).
Average daily AOD and AE values are obtained from the data processing of AERONET level 2 version 3 (Giles et al., 2019). The standard error on the monthly averages is calculated by dividing the standard deviation by the square root of the averaged number of samples, as shown in Eq. (1):
where σ is the standard deviation from the measurements n.
Seasonal variability
We also checked the seasonal variability of AOD, AE, PM concentrations, and lidar backscatter profiles by averaging the variables and lidar profiles over four seasons, namely December–January–February (DJF), March–April–May (MAM), June–July–August (JJA), and September–October–November (SON). Unprocessed temporal resolutions of AOD, AE, and PM concentrations are reported in Table 3, while single-calculus-chain (SCC) lidar profiles are quality-assured at Level 2, as reported in Sect. 2.3.1.
The vertically resolved lidar profiles for backscatter are seasonally averaged strictly following the ACTRIS/EARLINET schedule. Out-of-schedule measurements are ignored to avoid any possible bias due to particular conditions, i.e., biomass burning or dust outbreak.
For AOD and AE, even if they are not normally distributed (see Fig. 9), if we take more than 30 samples, they are approximately normally distributed. Again, the error in mean can be computed by dividing the standard deviation by the square root of the averaged samples.
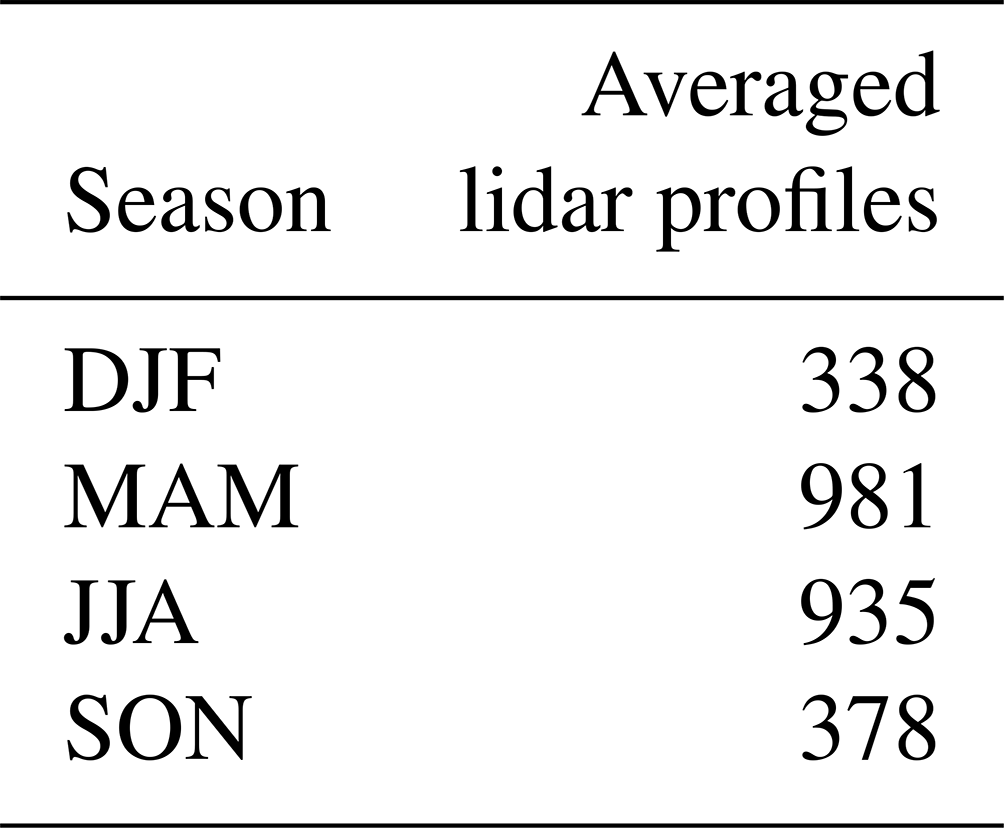
Table 4Number of averaged lidar profiles by season from 2004–2020.
Lidar observations, due to the complexity of the instrument and the EARLINET measurement schedule, are much less dense with respect to PM10, PM2.5 and PM1 and AERONET AOD and Ångström exponent measurements.
3.1 Long-term aerosol-load concentration trends (2004–2020)
As shown in Fig. 1, the seasonal MK test with Sen's slope on the concentrations of PM10, PM2.5, and PM1 at the surface level has decreased since 2004 with a statistically significant slope of −1.07 (CI 95 % −1.31 −0.82), −0.73 (CI 95 % −0.86 −0.59), and −0.68 (CI 95 % −0.81 −0.59) µg m−3 yr−1, respectively. This corresponds to a reduction of 11.5, 9.5, and 8.5 µg m−3 in 17 years, which corresponds to a decrease in the concentration of PM10, PM2.5, and PM1 by approximately 54 %, 61 %, and 68 % (95 % confidence level).
This is an important result that confirms that the reduction policies implemented in recent decades were effective in improving air quality. In fact, PM1 is much less related to natural pollution episodes compared to PM10 and PM2.5 concentrations because fossil fuel combustion products are much smaller in size than dust, ash, and marine salt outbreaks. However, reduction policies are ineffective in reducing the effects of natural and/or biogenic aerosol outbreaks, such as dust, marine salt, and volcanic eruptions.
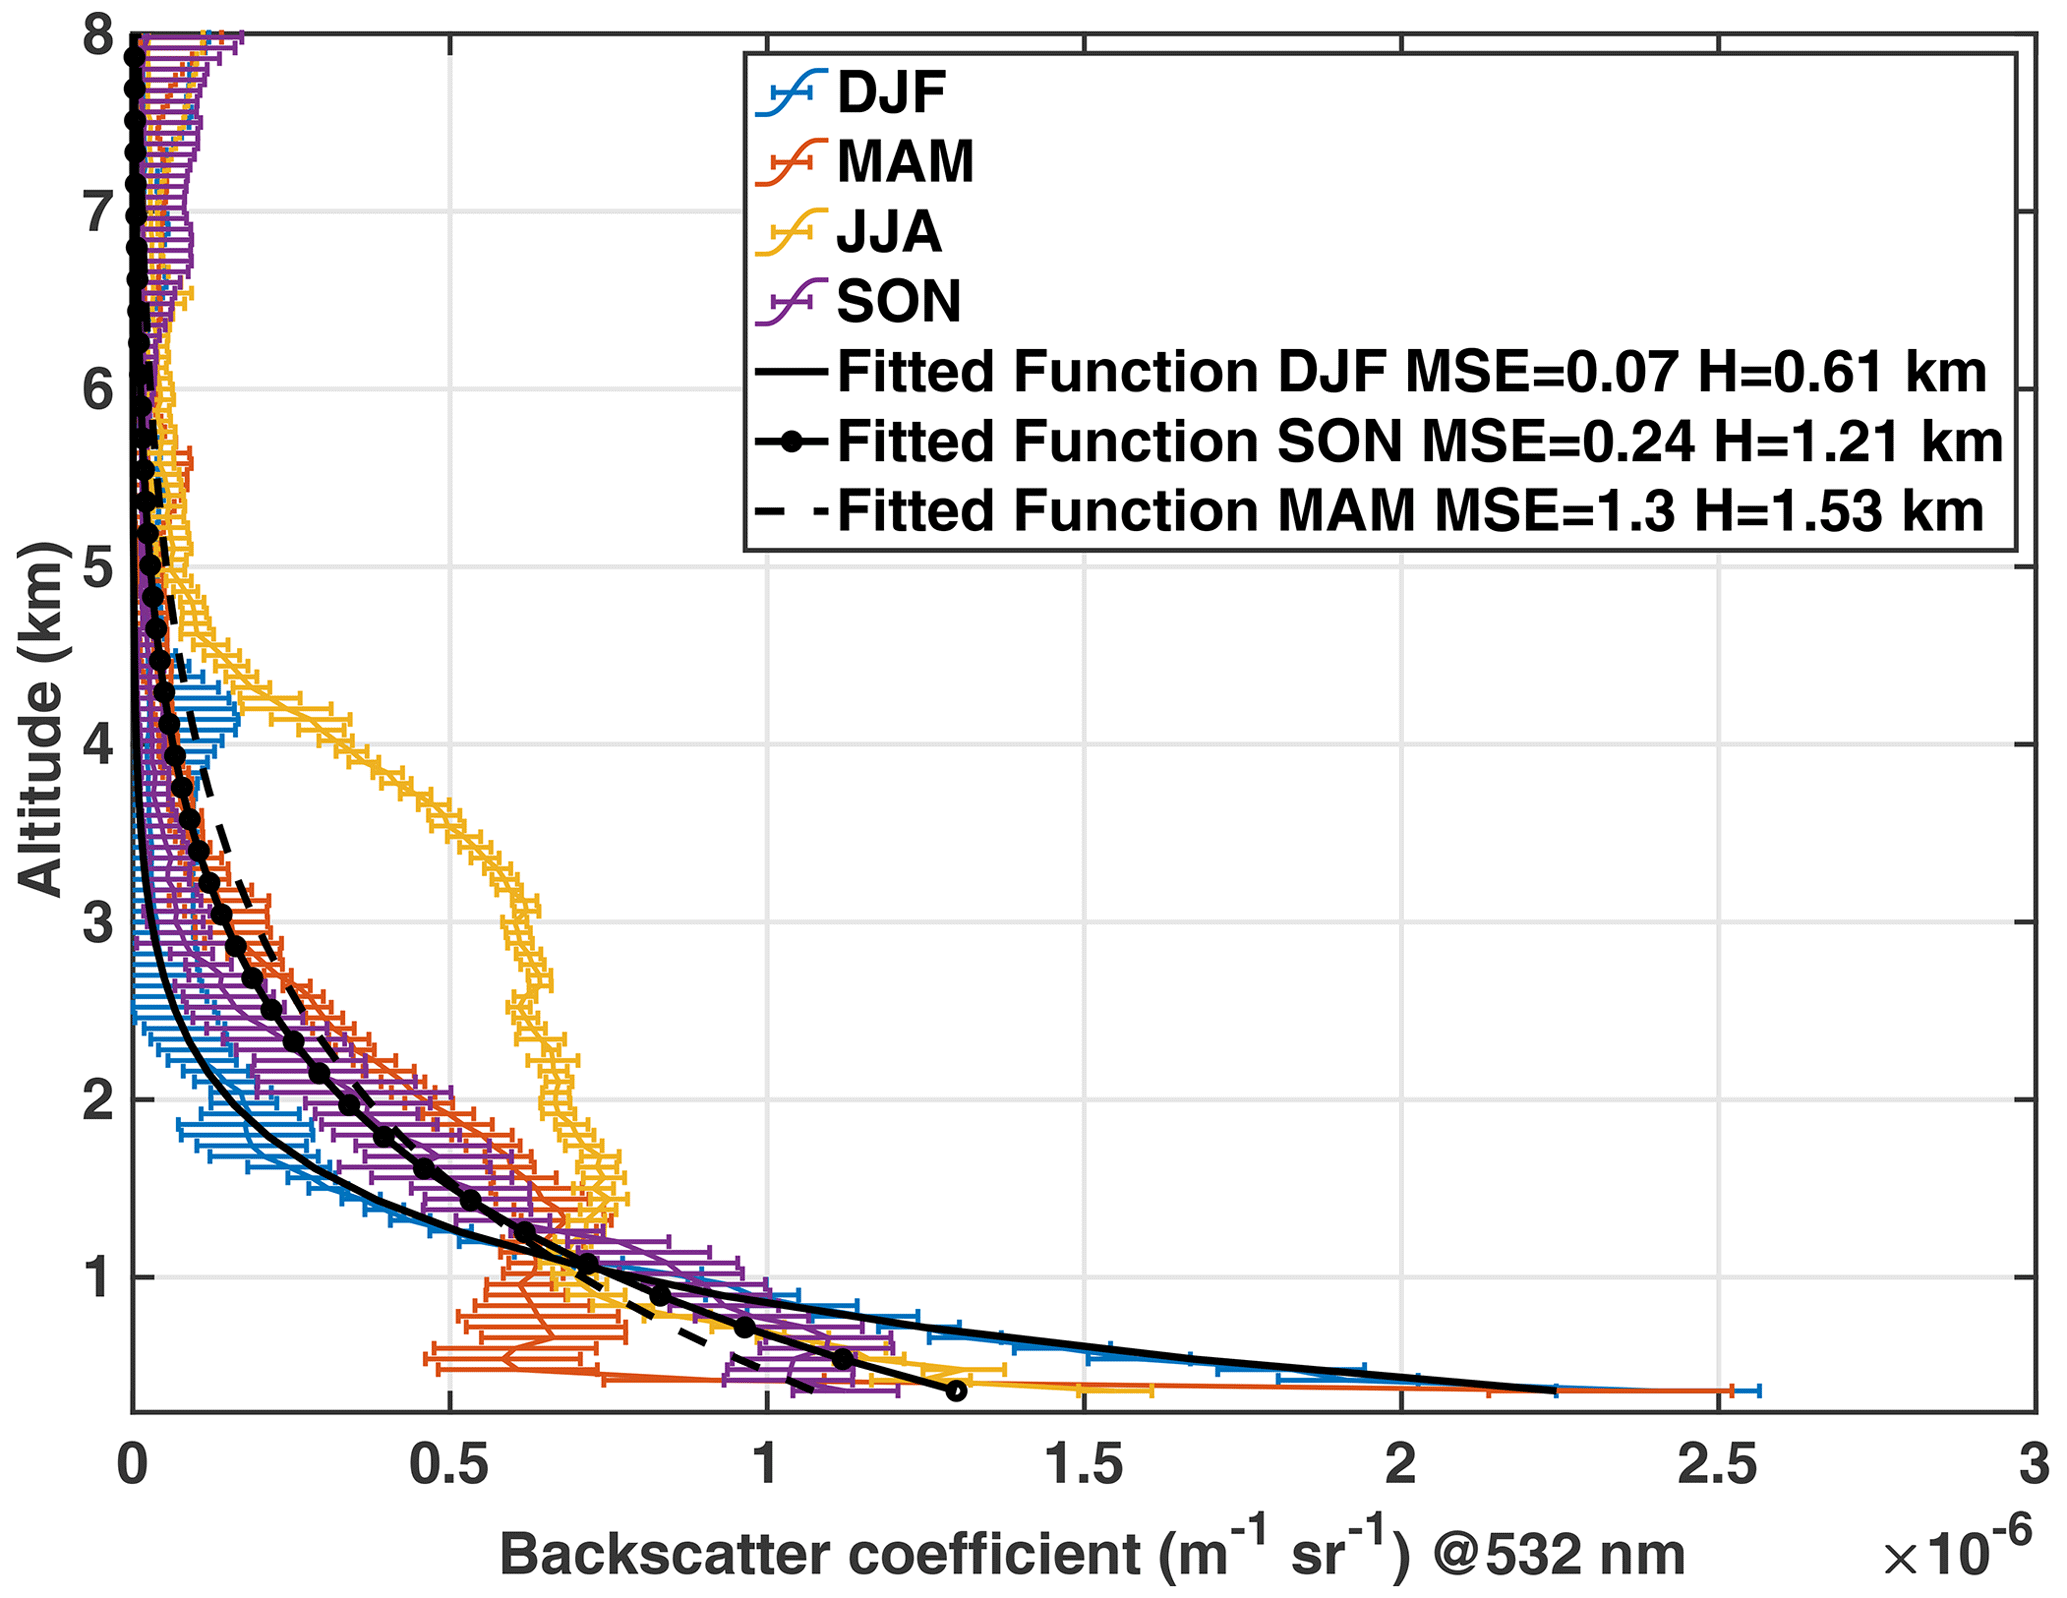
Figure 4Vertically resolved median backscattering profiles for DJF, MAM, JJA, and SON. Error bars are obtained by computing the standard error (value ± 1 σe; Eq. 1). The spatial resolution is constant and fixed at 60 m. Black curves: scale height retrieval and relative mean square error fitting the backscatter profiles through a monoexponential function.
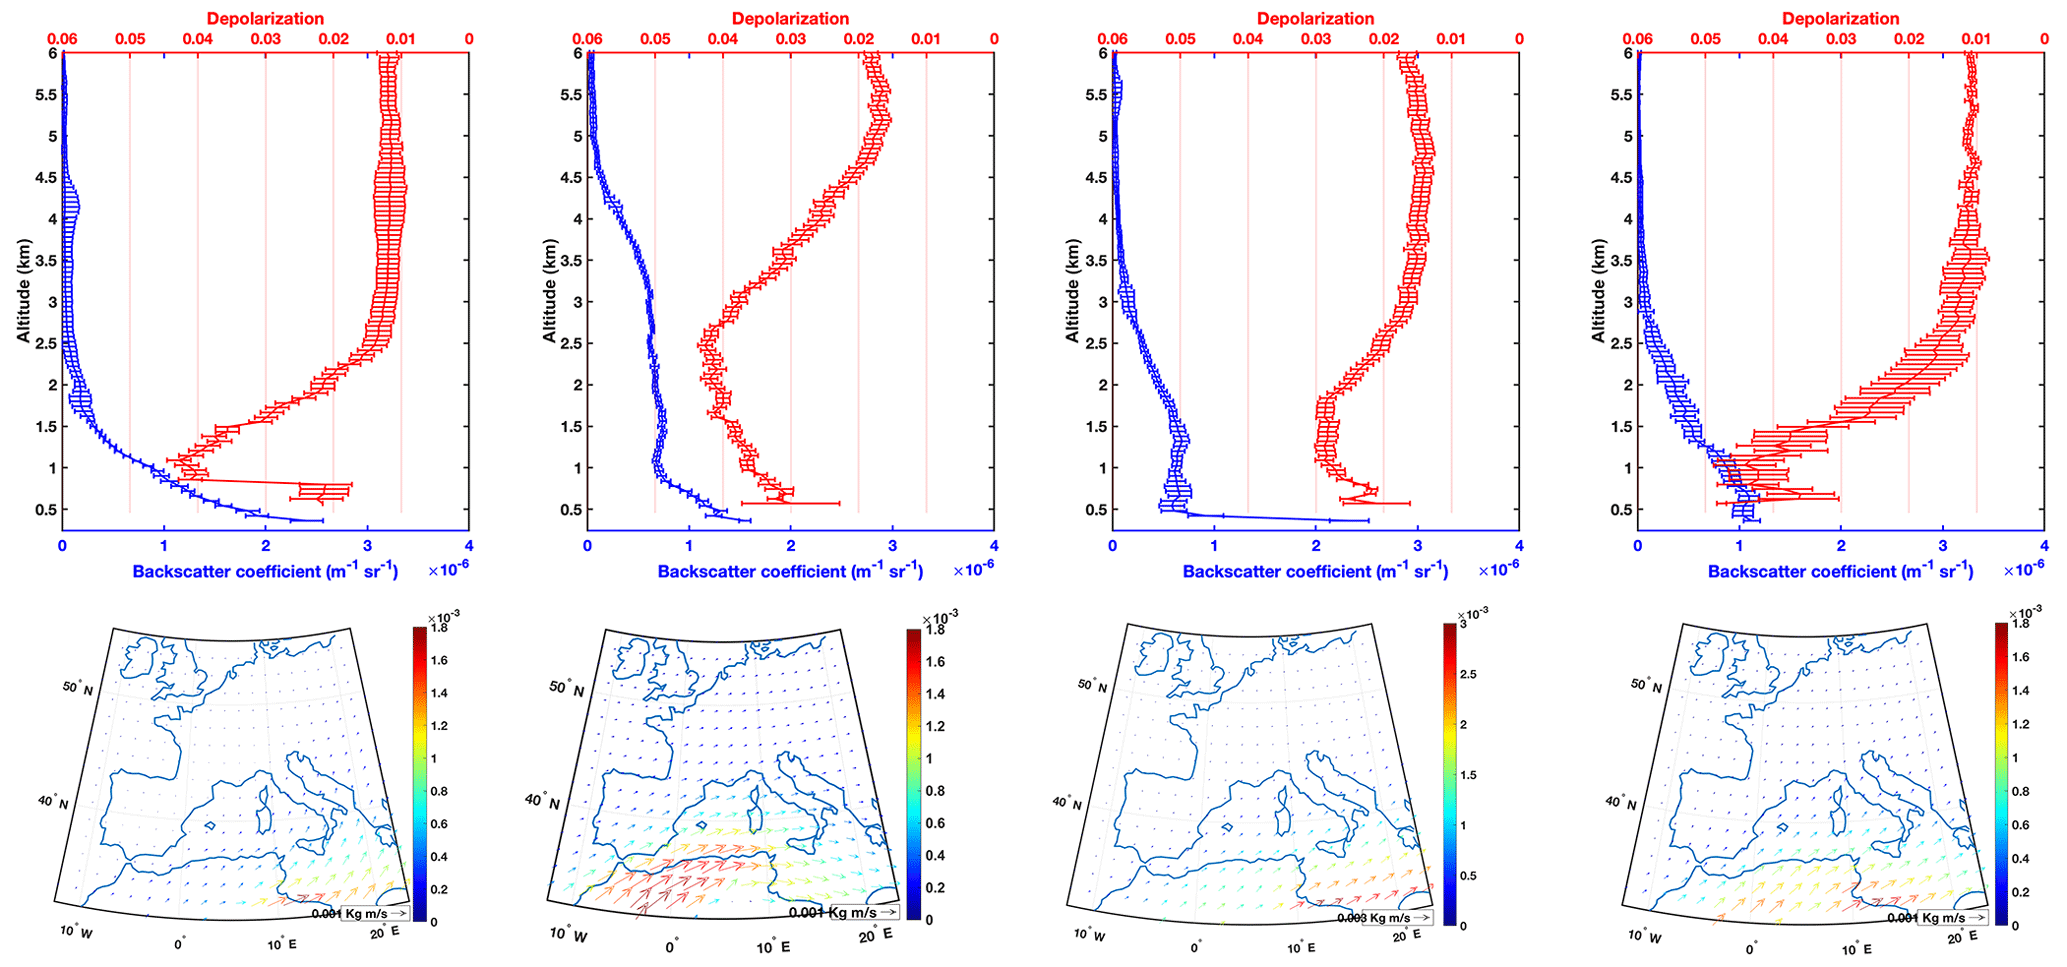
Figure 5DJF, MAM, JJA, and SON backscatter and depolarization vertically resolved profiles at 532 nm. The error bars are obtained computing the standard error (value ± 1 σe; Eq. 1). The spatial resolution is constant and set at 60 m. Synoptic maps were obtained from the Modern-Era Retrospective analysis for Research and Applications (MERRA; Global Modeling and Assimilation Office (GMAO), 2015). They represent the columnar dust flux averaged by season from 2004 to 2020.
The seasonal MK test with Sen's slope applied to monthly AOD averages at 440 nm showed a drop of 37 % over 17 years (−0.0054 yr−1; CI 95 % −0.0060 −0.0038). The decrease in AOD is smaller than the drop in PM because AOD is a columnar value that includes the aerosol layers of the upper troposphere, usually advected from distant sources. For the Ångström exponent (AE), the drop in 17 years is 13 % (−0.011 yr−1; CI 95 % −0.017 −0.0075; see Fig. 2). The drop in the Ångström exponent confirms again that the reductions in emission policy were effective, since lower values of AE are related to larger aerosol particles, which in turn are linked to natural emissions such as dust, ash, and marine salt.
Lidar observations are fewer in number compared to those of AOD, AE, and PM because the instrument is much more complex. In this analysis, we apply the seasonal MK test to two parts of the yearly averaged backscatter profiles by season at 532 nm: the lower part of the backscatter, from the ground to the top of the boundary layer (0–3 km), and the free troposphere (3 to 8 km), from 2004 to 2020 (see Fig. 3).
In the boundary layer (0–3 km), there is no significant trend at the 95 % level, while in the free troposphere (3–8 km) the average integrated backscatter coefficient increases at a rate of sr−1 yr−1 (CI 95 % sr−1 yr−1– sr−1 yr−1). For this tiny increase, we can then speculate that advected aerosol layers from distant sources, for example, dust outbreaks and biomass burning, have increased in the last 15 years. This speculation is also supported by Evan et al. (2016). The same trend is not reflected in the boundary layer. This means that the reduction, seen from the sun photometer and PM sensors, occurs in the first hundreds of meters where the fields of view for the laser and telescope of the lidar either do not overlap or only partially overlap, making the measurements unavailable.
3.2 Seasonal climatological analysis on long-term lidar observations
Lidar instruments have higher data collection and processing demands compared to in situ sensors for measuring PM and sun photometers. Active remote sensing optical devices require more power, calibration, and maintenance to operate correctly, which can lead to data gaps. Additionally, lidar measurements are highly sensitive to atmospheric conditions, such as cloud cover, which can affect their ability to detect aerosols on cloudy days. As a result, lidar observations may be less homogeneous, and some months/years may have more data than others. Consequently, it is very difficult to assess long-term trends with an inhomogeneous database. However, it is possible to quantitatively assess the seasonal variability of the vertically resolved optical properties, which is crucial, particularly from a climatological standpoint. To achieve this result, we considered four seasons: December–January–February (DJF), March–April–May (MAM), June–July–August (JJA), and September–October–November (SON). We obtained four averaged profiles, each representing the atmospheric aerosol load for each season. Profiles are obtained by taking the median average of the level 2 backscattering atmospheric profile. We used the median instead of the mean to eliminate the effects of outliers, for example, occasional aerosol plumes caused by land clearing activities by local landowners. From 2004 to 2020, there are 2630 lidar quality-assured aerosol backscatter profiles, both at 532 and 1064 nm. Due to cloud coverage and adverse meteorological conditions, median backscatters are obtained for the fall and winter seasons, averaging a lower number of profiles compared to spring and summer, as shown in Table 4.
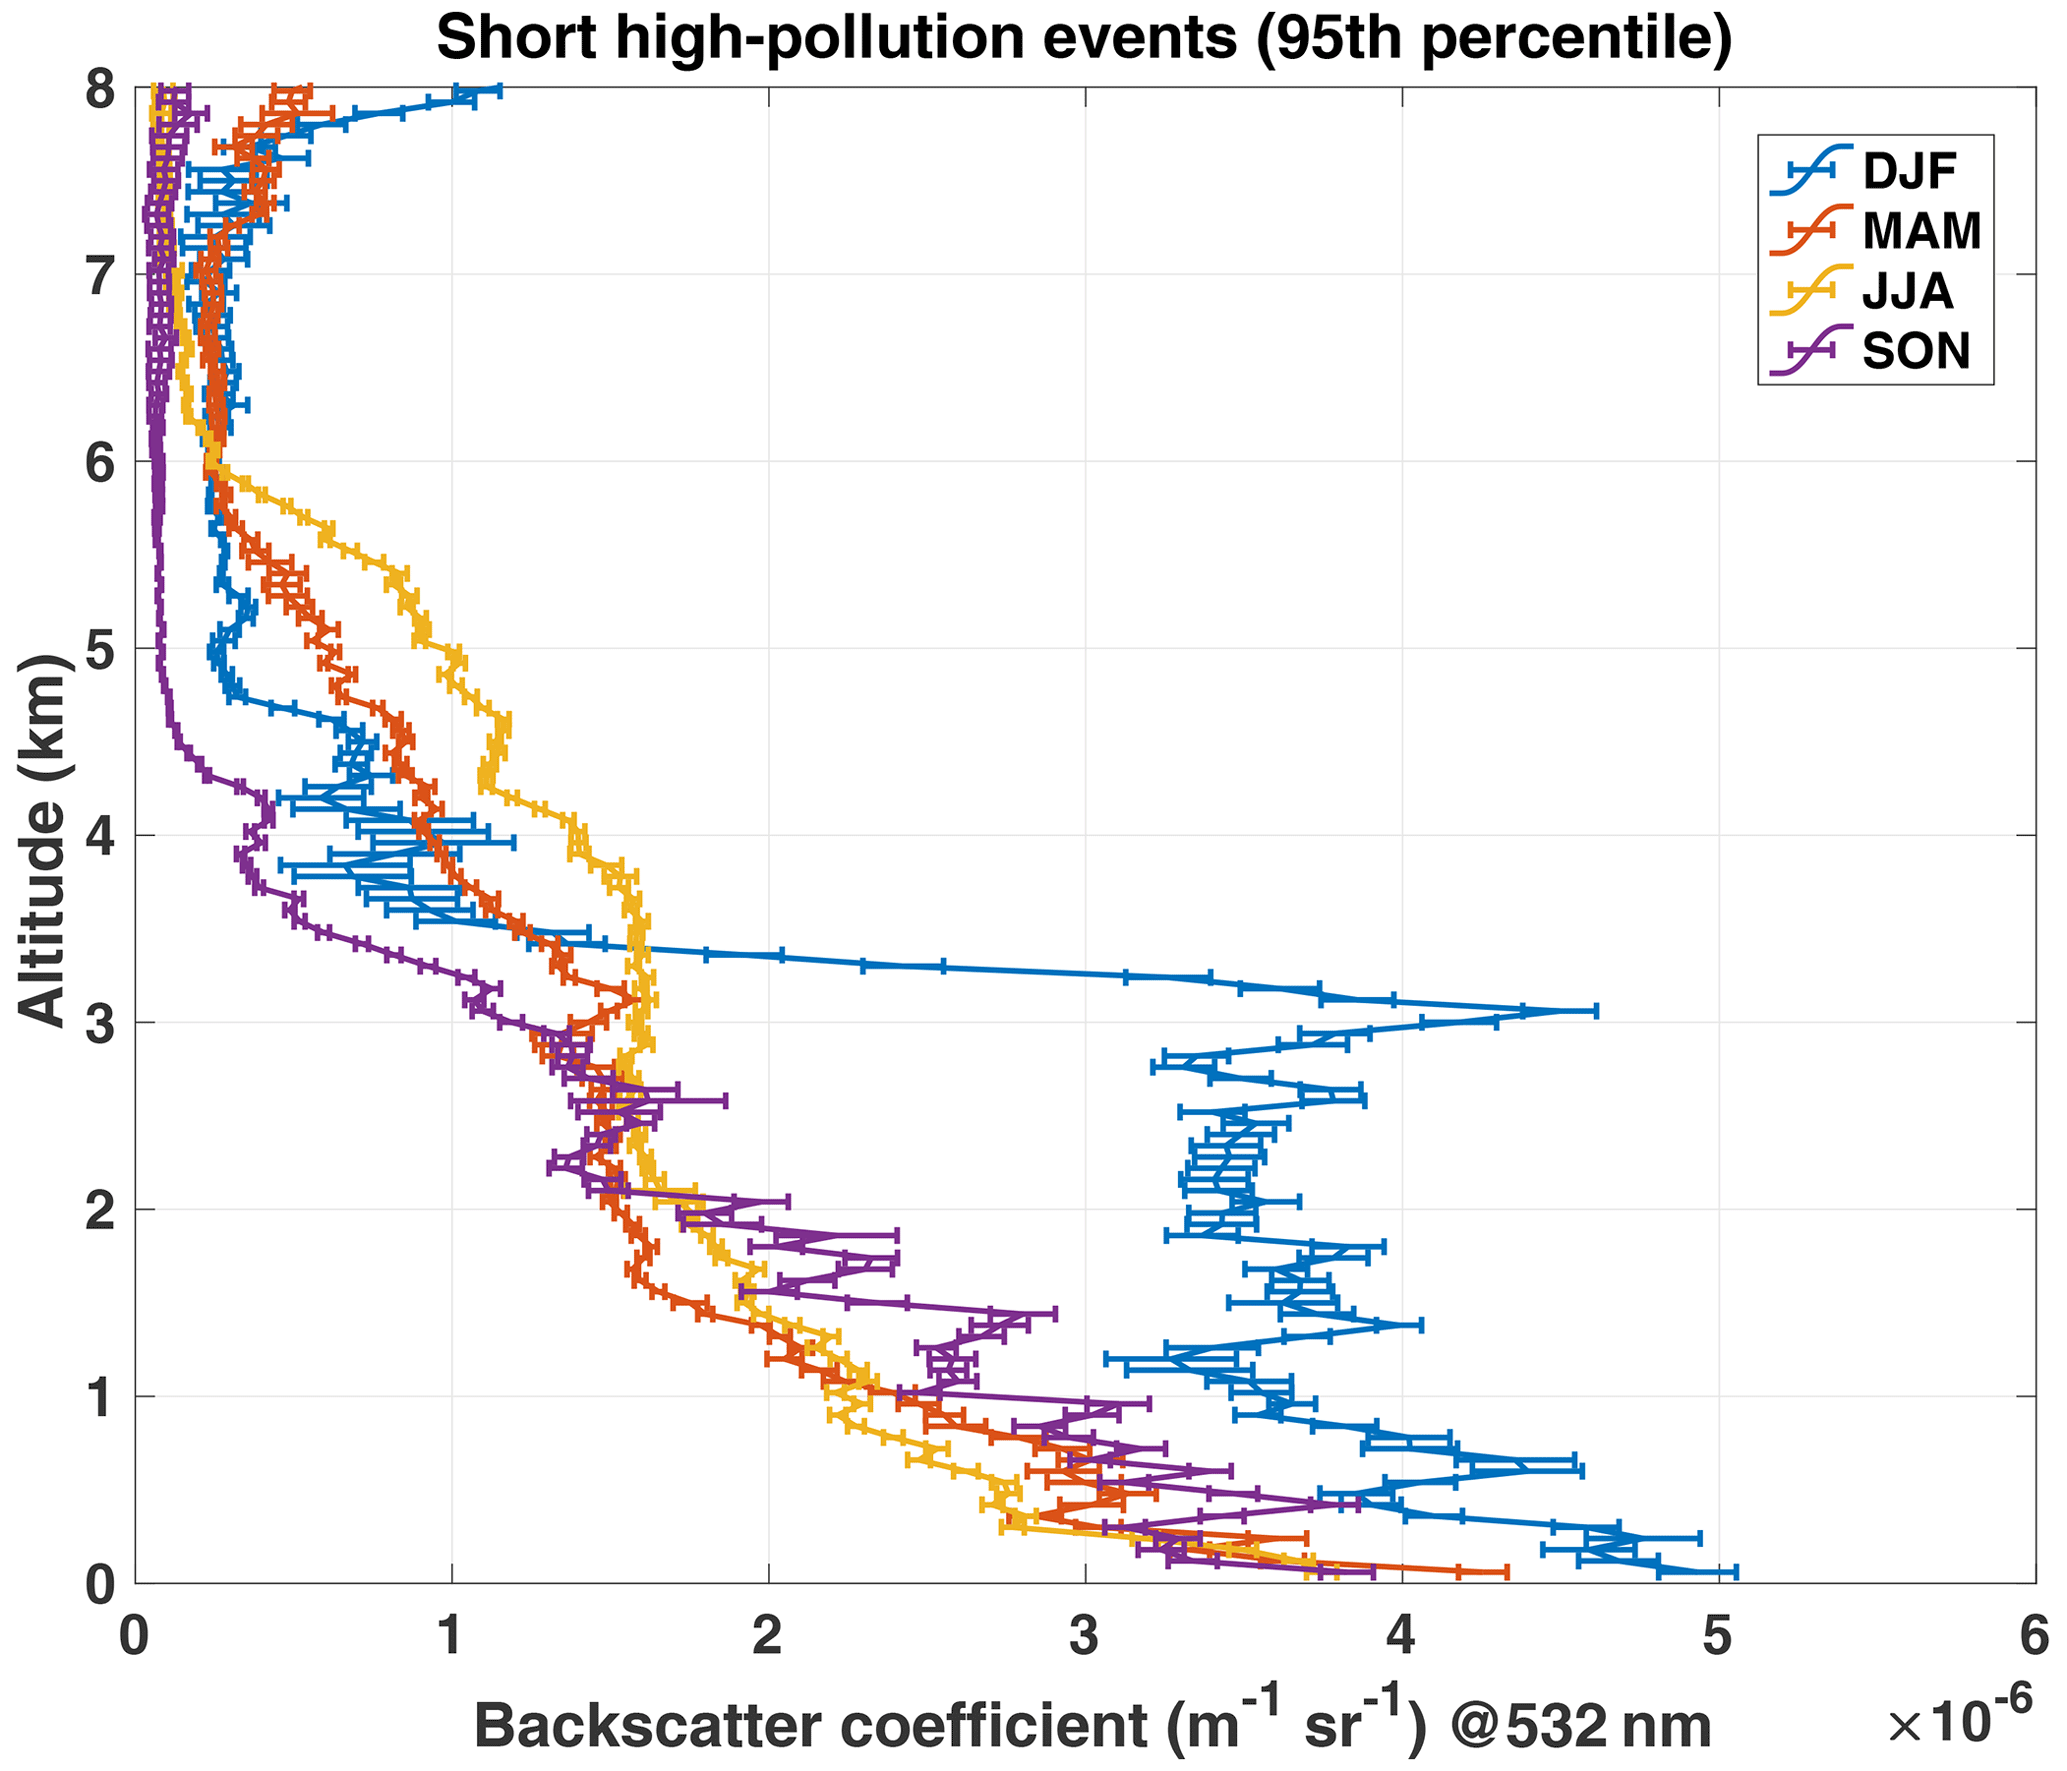
Figure 7Vertically resolved 95th percentile backscattering profiles for DJF, MAM, JJA, and SON. Error bars are obtained by computing the standard error (value ± 1 σe; Eq. 1). The spatial resolution is constant and fixed at 60 m.
The median average profiles are shown in Fig. 4 with relative precision. At first glance, the summer aerosol layer, after a sharp decay in the first km, reaches an altitude of 5 km, while the other backscatter profiles during spring, fall, and winter exhibit a more pronounced exponential decay. During winter, the constant sharp drop of up to 1.7 km suggests aerosol of local origin, while the remaining profiles indicate a higher boundary layer height or upper air aerosol transport (max during summer months).
To better characterize the behavior of the backscatter profile, we fit the vertically resolved profiles of Fig. 4 with an exponential function:
where H is the scale factor indicated in our case at which altitude the backscattering drops by 63 % (). The fitted profiles are depicted in Fig. 4. The mean square error (MSE) is very small for DJF, the plot showing an almost perfect fit and a scale height H=0.61 km. JJA is not represented because the curve cannot be fitted by an exponential function.
The Iberian Peninsula is also prone to dust outbreaks, especially during certain periods of the year (Sicard et al., 2011, 2012). To assess dust outbreaks, we analyzed the median-averaged depolarization ratio profiles, since dust particles strongly depolarize the lidar signal. For this reason, in Fig. 5, the seasonal backscattering coefficient is paired with the seasonal vertically resolved volume depolarization profile at 532 nm (fewer profiles available because the depolarization channel has been implemented later), still obtained from the EARLINET/ACTRIS Barcelona station.
It is important to emphasize that backscatter measurements retrieve optical properties of aerosols, while volume depolarization is related to aerosol microphysical properties. In fact, a peak in the volume depolarization channel indicates the altitude at which the most depolarizing aerosols are found, which is not necessarily related to their concentration.
Table 5In situ PM concentration (µg m−3) sensor measurements seasonal averaged.
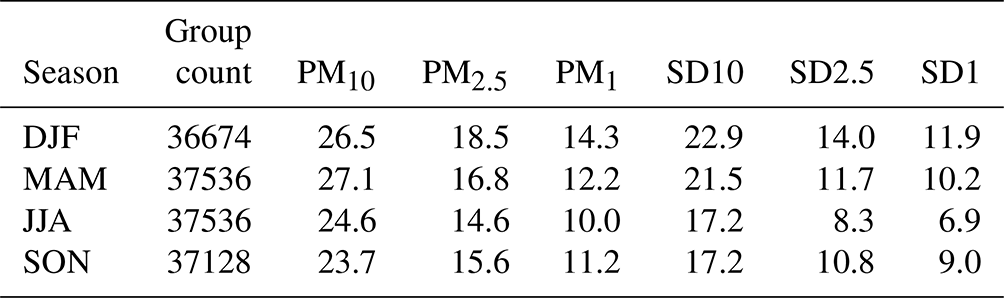
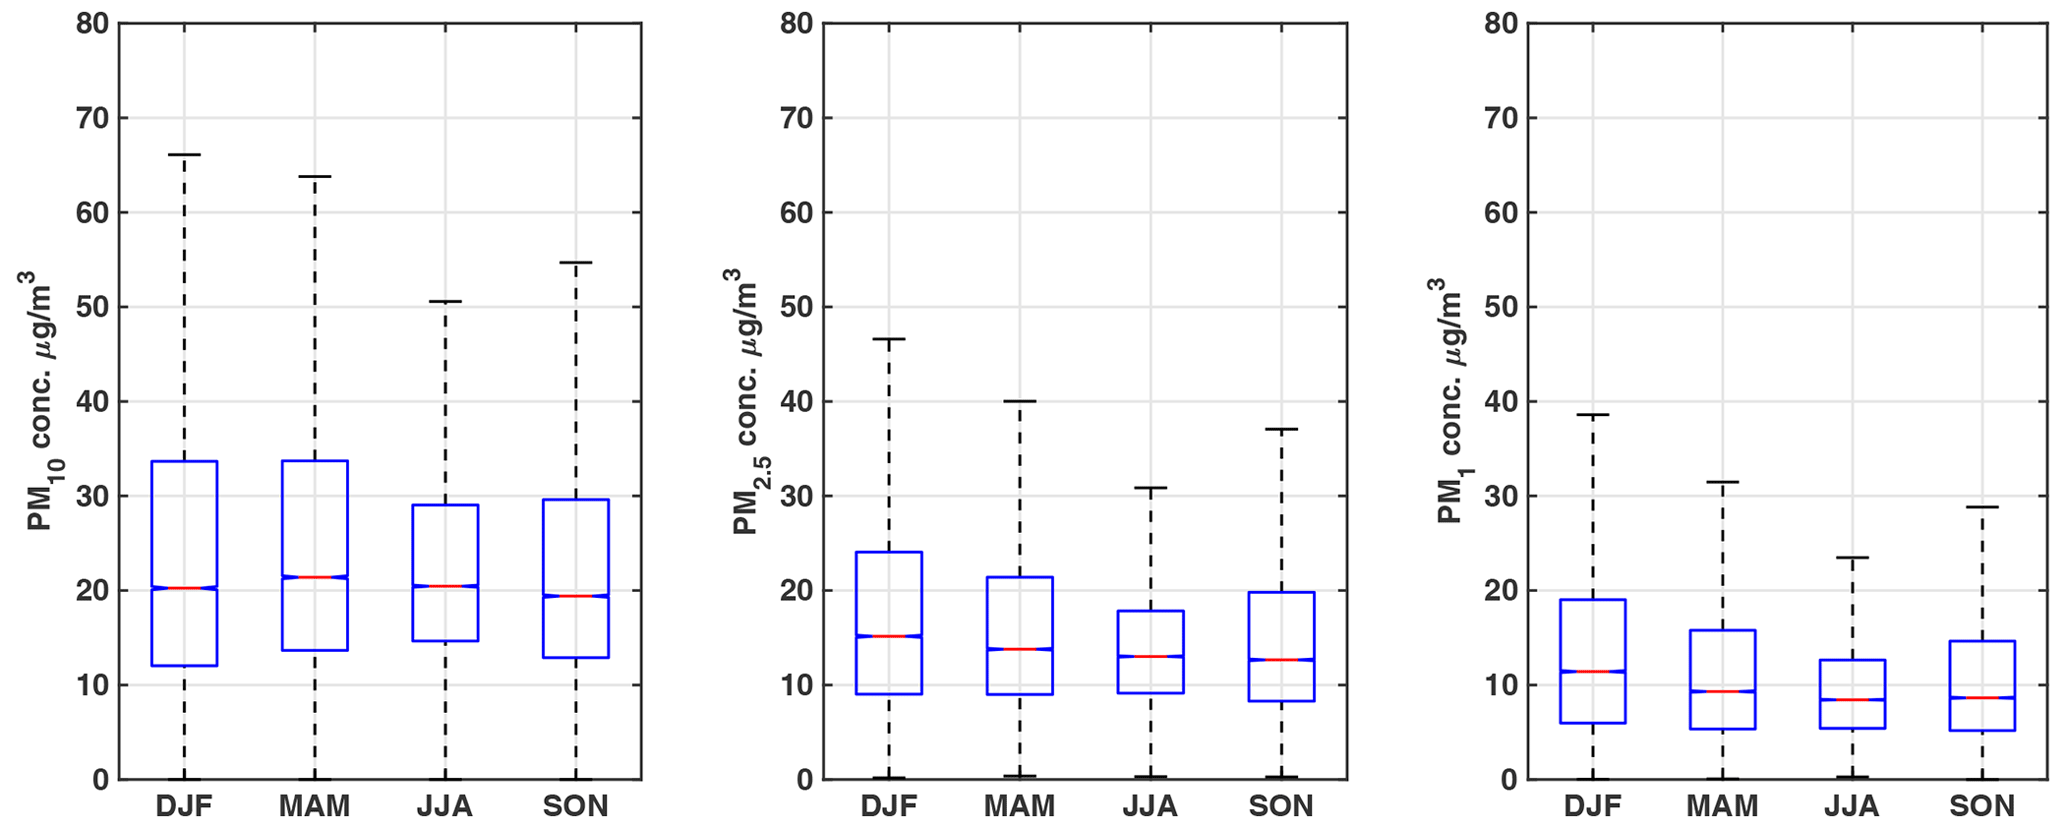
Figure 8PM10, PM2.5, and PM1 seasonal in situ concentrations. The bottom and top of each box are the 25th and 75th percentiles of the sample, respectively. The red line at the center of each box represents the median of the sample. Whiskers are lines that extend above and under each box. Observations beyond the whisker length are marked as outliers (in red). Seasonal variability is more pronounced during summer for fine particles, with higher concentrations during winter. Coarse aerosols show a lower seasonal variability.
In Fig. 5, the vertically resolved volume depolarization profiles (in red) show significant variability that strongly depends on the season. During winter (Fig. 5a), there is a sharp volume depolarization peak at around 1 km, while during summer (Fig. 5c), the curve is mostly flat from the ground up to 2.5 km, where the depolarization reaches a maximum. During spring and fall (Figs. 5b, d), the peak is not as sharp as in winter and reaches an altitude of up to 1.5–2 km before starting to decay exponentially. The analysis showed that dust outbreaks are possible during all seasons, but there are fundamental differences.
During winter (DJF), long-range transport of aerosol layers is mostly floating at the top of the boundary layer, without long-range transport in the upper air at higher altitudes. It is also unlikely that dust will be found within the boundary layer. For this reason, during winter, the aerosols in the boundary layer are mainly local in origin and are not influenced by long-range transport. During summer (JJA), the depolarization curve is almost flat, indicating that dust aerosol layers can also be found within the boundary layer. The depolarization peak is found at an altitude of 2.5 km, followed by a sharper drop. The backscatter coefficient (blue) shows the aerosols present up to an altitude of 5 km. We speculate that long-range biomass-burning aerosol layers are advected toward the region. In fact, biomass burning is mainly present during the summer months, as shown by Ancellet et al. (2016). This type of aerosol does not exhibit significant volume depolarization, so it remains undetected by depolarization but can be detected through backscatter. During the fall, the volume depolarization curve peaks around 1.3 km. The curve is not as sharp as in winter, indicating a possible intrusion of Saharan dust into the boundary layer. During spring, although still probable, the volume depolarization values are 40 % lower. Through our detailed analysis, we discerned different seasonal patterns. Specifically, our findings underscore that May exhibits characteristics more similar to those of the summer months (not shown). In terms of aerosol transport dynamics related to biomass burning (BB), data patterns in May align more closely with those observed in the summer months (JJA). This stands in contrast to the earlier spring months, March and April, which displayed markedly different characteristics. Therefore, as highlighted above, the behavior observed in May is more congruent with the summer months, reinforcing the idea that May's atmospheric conditions might be transitioning earlier into summer-like patterns.
Figure 5e, f, g, and h show the seasonal columnar averaged dust flux from 2004 to 2020 obtained from the NASA Geospatial Interactive Online Visualization ANd aNalysis Infrastructure, GIOVANNI (https://giovanni.gsfc.nasa.gov/last access: 6 October 2023; Global Modeling and Assimilation Office (GMAO), 2015). As we can observe, the dust flux over Barcelona is stronger during summer (JJA), while it is weaker during winter (DJF). Lidar observations also confirm the results found by Marinou et al. (2017) using NASA Cloud-Aerosol Lidar and Infrared Pathfinder Satellite Observations (CALIPSO), where, even if the seasons are offset by a month, show that for Barcelona, latitude dust can be found up to 5 km in summer and 1 km in winter.
In summary, long-range dust outbreaks are likely to occur throughout the year. Volume depolarization values are lower in spring, indicating aged dust or mixing with other aerosol species, such as biomass burning or pollen (Sicard et al., 2021). During winter, the dust aerosol layer floats mostly at the top of the boundary layer, whereas in other seasons it can also be found inside. Most of the dust can be found at 2.5 km during summer (up to 5 km), 1 km during winter, and 1 to 1.5 km during spring and fall. Several studies corroborated this speculation, and a reanalysis of seasonal maps (DJF, MAM, JJA, SON) of dust loading across Europe by the Barcelona Supercomputing Center (BSC) Dream model can be found in Basart et al. (2012).
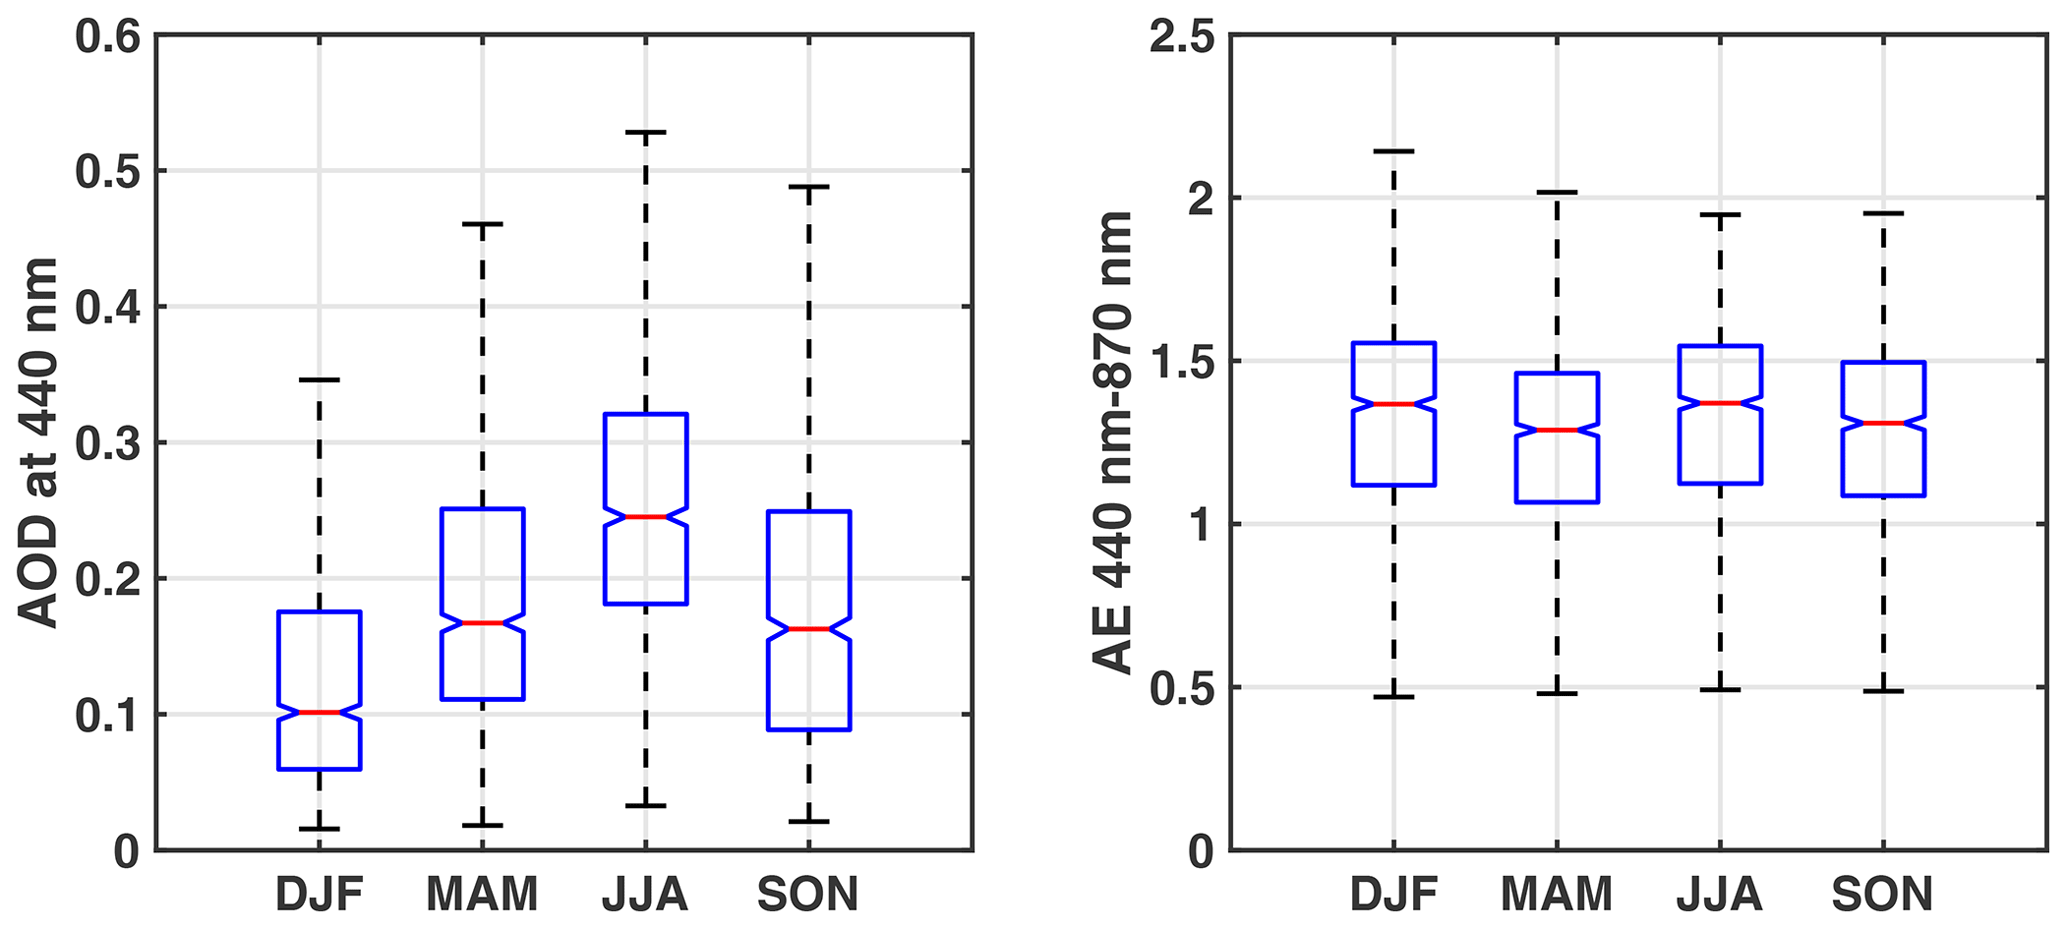
Figure 9AERONET AOD and Ångström exponent seasonal box plot. The bottom and top of each box are the 25th and 75th percentiles of the sample, respectively. The distance between the bottoms and tops of each box is the interquartile range. The red line in the center of each box represents the median of the sample. Whiskers are lines that extend above and below each box and correspond to the 95.4 percentile.
Table 6AERONET seasonal mean values and SD for AOD and Ångström coefficient.
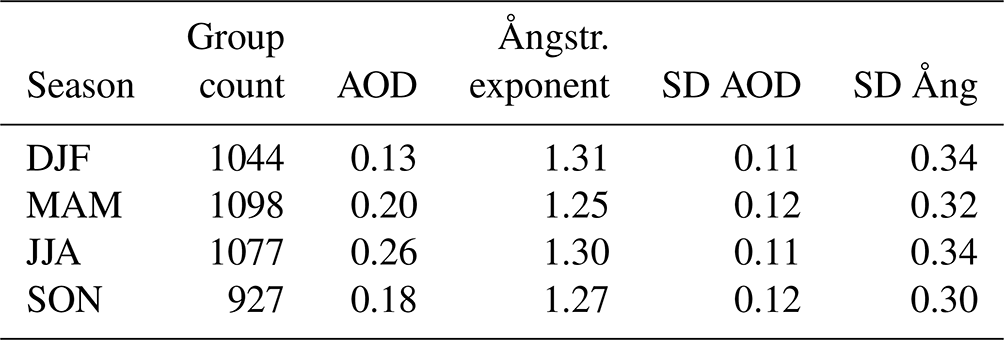
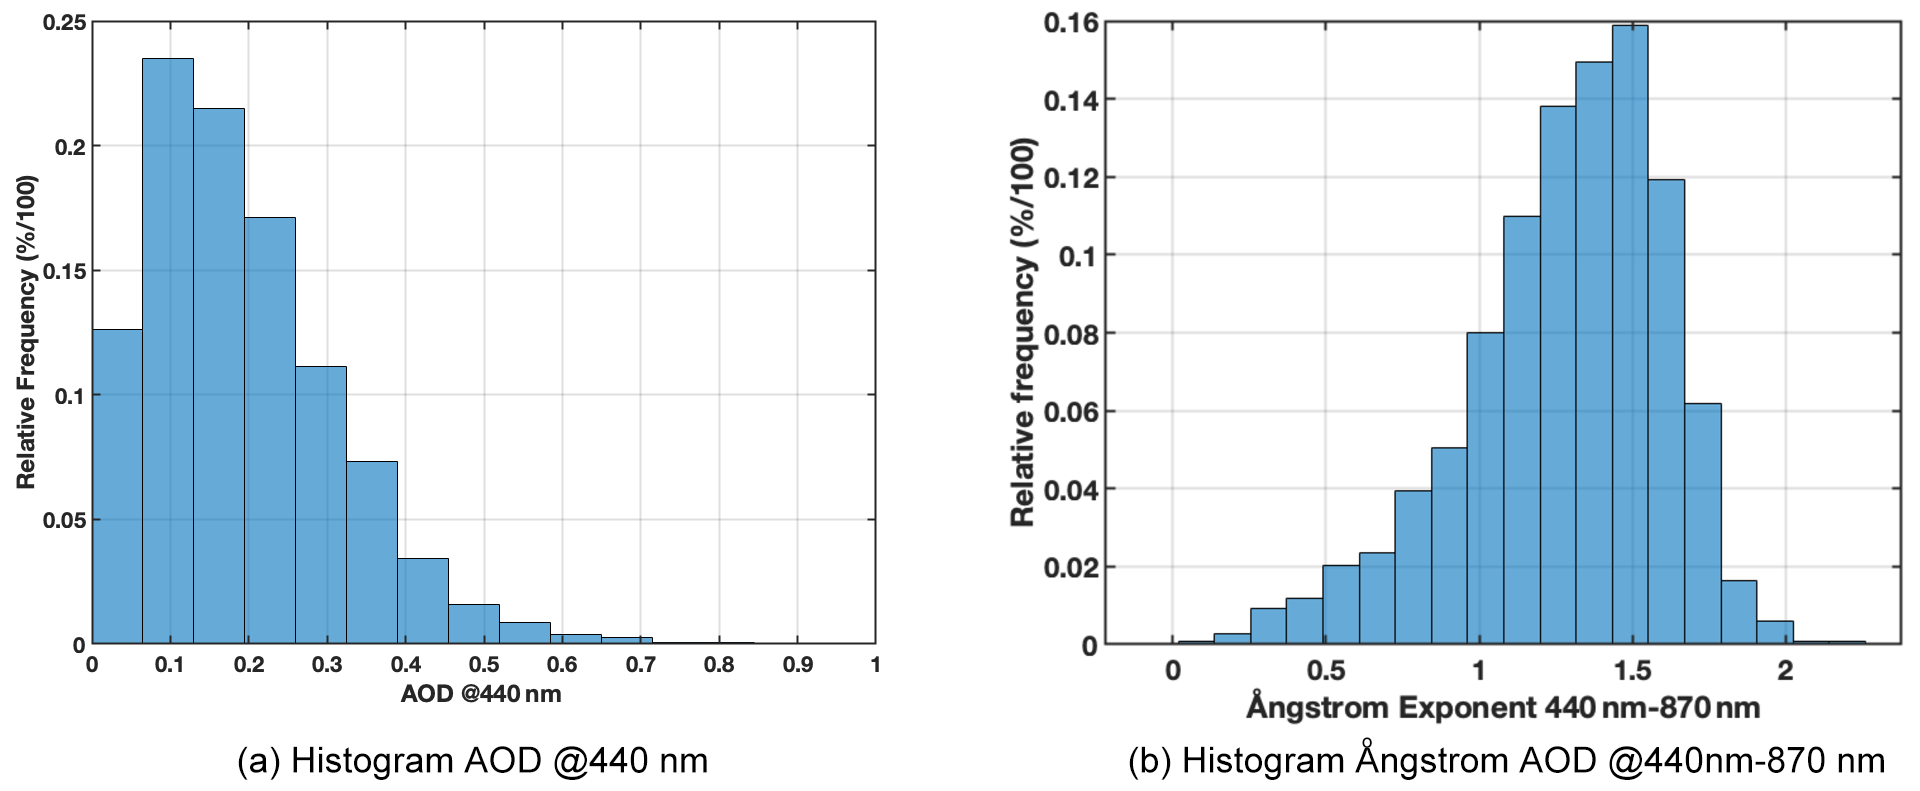
Figure 10Relative frequency histogram of AOD (440 nm) and AE (440–870 nm) from the UPC Barcelona AERONET station.
3.2.1 Intense short-duration pollution events
In this section we focus on short episodes with high pollutant levels, proposing a methodology to filter and detect this kind of events. The median value of the seasonal profiles is computed to filter out intense short-lived episodes that are not climatologically significant. Conversely, here we focus on the 95th percentile, instead of the median (50th), repeating the same analysis as in Sect. 3.2. Figure 7 shows a very different backscatter profile from Fig. 4, especially for the cold season. The main characteristic of the winter profile is that it has an almost constant high aerosol concentration up to 3 km. We analyzed individual events and found that the peaks can be attributed to Saharan dust outbreaks that occurred in February, starting from 2016. It seems that in recent years the meteorological circulation has changed, bringing dust into Spain (Salvador et al., 2022) in winter. We also observed that these dust incursions have become not only more frequent but also more intense (Salvador et al., 2022). Several factors could be responsible for this change, including changes in global wind patterns, changing desertification rates in the Saharan regions, and broader climatic changes that influence air currents. Understanding these patterns is crucial not only for environmental and climatic studies but also for public health, as higher levels of aerosols can affect air quality and respiratory health. The high-intensity aerosol loading events were confirmed as dust outbreaks by the Barcelona Supercomputing Center (BSC) Dream model reanalysis (Nickovic et al., 2001; Di Tomaso et al., 2022), while for the most intense episode, which occurred on 3–4 February 2020, the Spanish Ministry of Environment (MITECO) sent a warning some days earlier.
3.2.2 Fine and coarse mode
The vertically resolved color ratio accuracy is too low at 2.8 km, reaching errors of 100 %. Seasonal signals can then be exploited up to that altitude. Between 1 and 2.8 km, the curves are well spread. CR profiles obtained through median averages indicate that the fine aerosol mode outweighs the coarse mode (resulting in fewer dust outbreaks). During DJF, a value greater than 0.5 can be observed at approximately 1 km, indicating the presence of a potential aerosol layer floating above the boundary layer, as previously observed from volume depolarization profiles. JJA and SON exhibit higher values compared to DJF and MAM, supporting the findings of the volume depolarization profiles for that altitude range.
To perform a more in-depth analysis, we analyzed the seasonal averages of the recovery of the Ångström exponent (microphysical variable) and AOD (optical variable) from the AERONET sun photometer (columnar variables) as well as the concentrations of PM10, PM2.5 and PM1 measured by in situ sensors located in conjunction with the lidar and the sun photometer. The seasonal mean and standard deviation values obtained from the PM concentration measurements are summarized in Table 5, while Fig. 8 shows all statistical values. PM10 concentrations shown in Fig. 8 do not show any significant seasonal trend, as the mean values remain relatively constant throughout the year. However, for PM2.5, as illustrated in Fig. 8, the concentrations drop by almost 20 % during fall compared to winter. This trend is even more pronounced for PM1 (Fig. 8), with a difference of 30 % between summer and winter concentrations. Lower concentrations during summer and fall are associated with higher mixing layer height and convection. Both PM2.5 and PM1 concentrations exhibit greater variability during summer, as shown in Fig. 8. Conversely, mean PM10 concentrations remain relatively stable throughout the year, indicating that heavier particles, such as marine salt, maintain constant levels at the surface. This characteristic is unique to coastal metropolitan cities, compared to continental regions such as the Po Valley, where PM10 concentrations vary significantly with seasons (Landi et al., 2021).
Figure 10a displays the relative frequency distributions of AOD at the 440 nm wavelength. The results show that approximately 57 % of the AOD values are below 0.2 and approximately 75 % are below 0.3, while only 5 % are above 0.4. Figure 9 shows the statistical parameters of the seasonal AOD for winter, spring, summer, and fall. The highest average value is observed during summer, while the lowest value is observed during winter (Table 6). The highest variability in the data is observed during spring, which may be due to the influence of pollen (Sicard et al., 2021).
Figure 10 shows a relative frequency histogram of AE (440–870 nm), which exhibits an asymmetrical shape with a left tail that extends far.
Most of the values, which represent approximately 55 % of the cases, were between 1.2 and 1.6, consistent with the results of other urban/industrial areas. The presence of low AE values, less than 0.7, in approximately 8 % of the data indicates that desert dust transport events in Catalunya region are not uncommon. Intermediate values of AE are probably due to mixed cases, where a thin layer of desert dust is present at altitudes above the boundary layer and contributes to the effects of extinction, combined with those caused by suspended particle loading in the lower troposphere.
The statistical parameters of AE are shown in Fig. 9 for the whole period. There is no high variability throughout the seasons. Figure 9 confirms that long-range-transported Saharan dust has the same chance of occurring during all seasons, with AE almost constant throughout the seasons.
The present article discusses the impact of aerosols on human health, the environment, and climate in Barcelona, one of the largest metropolitan areas in the Mediterranean region. Aerosols are short-lived tiny particles suspended in the atmosphere and can come from both natural sources, such as volcano eruptions and dust outbreaks, and anthropogenic activities, such as burning fossil fuels. These particles can be carried by the wind from far away and can be found in high concentrations in certain areas. Breathing in high concentrations of aerosols can be harmful to human health, especially in vulnerable groups such as children and the elderly. It can cause respiratory problems, heart disease, and stroke. In contrast, the aerosols also modulate both the short-wave incoming solar radiation and the outgoing long-wave Earth radiation. Additionally, aerosols influence cloud formation and lifetime and impact precipitation. The latest Intergovernmental Panel on Climate Change (IPCC) report highlighted the need for aerosol research to reduce current uncertainty. For this reason, in this study, we quantitatively evaluated changes in the optical and microphysical properties of aerosols in Barcelona during the last 17 years through the seasonal Mann–Kendall test that analyzes long-term temporal trends in the concentrations of retrieved AOD; the Ångström exponent; and PM10, PM2.5, and PM1 concentrations. The results highlight a sharp drop in PM concentration, AOD, and Ångström exponent from 2004 to 2020. These findings confirm that the emission reduction policies, implemented since 2004, have been effective in improving air quality. From a climatological point of view, we also quantitatively assessed how the seasons influence the variability of the vertically resolved optical and microphysical properties of aerosols by lidar measurements obtained from the permanent station of the University Politècnica de Catalunya of the ACTRIS research infrastructure. We obtained four averaged profiles over 17 years of measurements, each representing the vertically resolved atmospheric aerosol backscatter profiles of each season.
The summer aerosol backscatter profile, averaged during June, July, and August, shows an exponential decay in the first kilometer but also a long tail up to 5 km. This means that aerosol loading during this season can be found up to that altitude. Conversely, the winter backscatter profile, which is obtained averaging the lidar observations in December, January, and February, shows a sharp exponential decay, with aerosols absent above 2.5 km. Both the spring aerosol backscatter profile, obtained averaging the lidar observations in March, April, and May, and the fall profile (averaged on September, October, and November) still show an exponential decay but with a longer tail with detected aerosol presence up to 3 km in both cases. Spring and fall, and especially winter, aerosol backscatter profiles can be modeled by an exponential curve with a relative scale height H. In winter, for example, we have a scale height of H=0.61 km. This implies that 63 % of the aerosol loading is capped below H. We further examined intense, short-duration, high-concentration aerosol events and observed an increase in both the number of episodes and the intensity of dust outbreaks during winter, particularly in February, in the northeast of Spain. This corroborates the findings of Salvador et al. (2022).
Analyzing the lidar seasonal averaged volume depolarization profiles, which show higher values for non-spherical aerosols such as Saharan dust, and the color ratio, defined as the ratio between the backscatter coefficient at 1064 nm and the backscatter coefficient at 532 nm wavelengths, higher for larger aerosol particles, we found that in winter dust outbreaks are likely to float over the boundary layer at an altitude of 1 km, while for the other seasons, dust can also descend into the boundary layer, being the profiles smoother. During the summer, most of the dust is capped at 2.5 km. This altitude probably corresponds to the height of the center of the Saharan dust layers. In summary, dust outbreaks occur throughout the season, but in winter dust floats over the boundary layer, whereas in the other seasons it can be embedded into it.
It is also important to emphasize the differences between ground-based in situ measurements (PM concentrations) and columnar (AOD and AE) and vertically resolved lidar observation; i.e., lidar data show a net increase above 3 km over the analyzed period in contrast to the yearly drop at surface of PM concentrations. Seasonal analysis also shows differences in aerosols at different altitudes that are not detectable by analyzing only the concentration of PM on the surface. This study then provides evidence that lidar observations are crucial to accurately evaluate aerosol dynamics. The ground-based observations do not capture the full picture.
This is the first study of this kind for the Iberian Peninsula, and future research will evaluate whether the results found are confirmed in coastal and continental metropolitan regions of the Mediterranean, a climatic hotspot.
We used MATLAB embedded functions. However, code is available upon request.
PM data are available upon request. All the other data are publicly available at NASA AERONET and ACTRIS/EARLINET sites.
SL and TCL designed the study; SL, MS, and AC performed the analysis; SL edited the first draft; FR edited and commented on the first draft; FA provided data for lidar; AA, CR, and XQ provided data for PM; and all of the authors assisted in interpreting the results and writing the paper.
At least one of the (co-)authors is a member of the editorial board of Atmospheric Chemistry and Physics. The peer-review was guided by an independent editor, and the authors also have no other competing interests to declare.
Publisher’s note: Copernicus Publications remains neutral with regard to jurisdictional claims made in the text, published maps, institutional affiliations, or any other geographical representation in this paper. While Copernicus Publications makes every effort to include appropriate place names, the final responsibility lies with the authors.
This work has been made possible through the efforts of many people, the list of whom would be too long to mention, and the funding of many grants over the years, in particular European projects of different framework programs. We also acknowledge the MERRA mission scientists and associated NASA personnel for the production of the data used in this research effort.
This research has been supported by the European Union through NextgenerationEU funds and by the following projects along the years: FP5 EARLINET project (grant no. ID EVR1-CT-1999-40003), FP6 EARLINET-ASOS (ID: 25991), FP7 ACTRIS (ID: 262254), H2020 ACTRIS-2 (ID: 654109), ACTRIS-PPP (ID: 739530), ACTRIS IMP (ID: 871115) and ATMO-ACCESS (ID: 101008004), projects of the Spanish National Research programs (grant nos. TIC 431/93, AMB96-1144-C02-01, REN2000-1907-CE, REN2000-1754-C02-02/CLI, REN2003-09753-C02-C02/CLI, REN2003-09753-C02-C CGL2008-01330-E/CLI 02/CLI, REN2002-12784-E, CGL2005-5131-E, CGL2006-27108-E/CLI, CGL2006-26149-E/CLI, CGL2007-28871-/CLI, CTM2006-27154-E/TECNO, TEC2006-07850/TCM, TEC2009-09106, TEC2012-34575, TEC2015-63832-P and PID2019-103886RB-I00), the project of the Catalan Regional Government IMMPACTE, and the ESA project (grant no. 21487/08/NL/HE).
This paper was edited by Stelios Kazadzis and reviewed by three anonymous referees.
Abshire, J. B., Riris, H., Allan, G. R., Weaver, C. J., Mao, J., Sun, X., Hasselbrack, W. E., Kawa, S. R., and Biraud, S.: Pulsed airborne lidar measurements of atmospheric CO2 column absorption, Tellus B, 62, 770–783, https://doi.org/10.1111/j.1600-0889.2010.00502.x, 2010. a
Ackermann, J.: The extinction-to-backscatter ratio of tropospheric aerosol: A numerical study, J. Atmos. Ocean. Technol., 15, 1043–1050, 1998. a
Adler, C., Wester, P., Bhatt, I., Huggel, C., Insarov, G., Morecroft, M., Muccione, V., and Prakash, A.: Cross-Chapter Paper 5: Mountains, 2273–2318, Cambridge University Press, Cambridge, UK and New York, USA, https://www.ipcc.ch/report/ar6/wg2/chapter/ccp5/ (last access: 10 October 2023), 2022. a
Alados-Arboledas, L., Müller, D., Guerrero-Rascado, J., Navas-Guzmán, F., Pérez-Ramírez, D., and Olmo, F.: Optical and microphysical properties of fresh biomass burning aerosol retrieved by Raman lidar, and star-and sun-photometry, Geophys. Res. Lett., 38, 1, https://doi.org/10.1029/2010GL045999, 2011. a
Ali, E., Cramer, W., Carnicer, J., Georgopoulou, E., Hilmi, N. J. M., Le Cozannet, G., and Lionello, P.: Cross-Chapter Paper 4: Mediterranean Region, in: Climate Change 2022: Impacts, Adaptation and Vulnerability. Contribution of Working Group II to the Sixth Assessment Report of the Intergovernmental Panel on Climate Change, edited by: Pörtner, H.-O., Roberts, D. C., Tignor, M., Poloczanska, E. S., Mintenbeck, K., Alegría, A., Craig, M., Langsdorf, S., Löschke, S., Möller, V., Okem, A., and Rama, B., Cambridge University Press, Cambridge, UK and New York, NY, USA, 2233–2272, 2022. a
Amiridis, V., Balis, D. S., Giannakaki, E., Stohl, A., Kazadzis, S., Koukouli, M. E., and Zanis, P.: Optical characteristics of biomass burning aerosols over Southeastern Europe determined from UV-Raman lidar measurements, Atmos. Chem. Phys., 9, 2431–2440, https://doi.org/10.5194/acp-9-2431-2009, 2009. a
Ancellet, G., Pelon, J., Totems, J., Chazette, P., Bazureau, A., Sicard, M., Di Iorio, T., Dulac, F., and Mallet, M.: Long-range transport and mixing of aerosol sources during the 2013 North American biomass burning episode: analysis of multiple lidar observations in the western Mediterranean basin, Atmos. Chem. Phys., 16, 4725–4742, https://doi.org/10.5194/acp-16-4725-2016, 2016. a
Ansmann, A., Riebesell, M., and Weitkamp, C.: Measurement of atmospheric aerosol extinction profiles with a Raman lidar, Opt. Lett., 15, 746–748, 1990. a, b, c
Ansmann, A., Bösenberg, J., Chaikovsky, A., Comerón, A., Eckhardt, S., Eixmann, R., Freudenthaler, V., Ginoux, P., Komguem, L., Linné, H., Lopez Máquez, M. A., Matthias, V., Mattis, I., Mitev, V., Muller, D., Music, S., Nickovic, S., Pelon, J., Sauvage, L., Sobolewsky, P., Srivastava, M. K., Stohl, A., Torres, O., Vaughan, G., Wandinge, U., and Wiegner, M.: Long-range transport of Saharan dust to northern Europe: The 11–16 October 2001 outbreak observed with EARLINET, J. Geophys. Res.-Atmos., 108, https://doi.org/10.1029/2003JD003757, 2003. a
Ansmann, A., Tesche, M., Groß, S., Freudenthaler, V., Seifert, P., Hiebsch, A., Schmidt, J., Wandinger, U., Mattis, I., Müller, D., and Wiegner, M.: The 16 April 2010 major volcanic ash plume over central Europe: EARLINET lidar and AERONET photometer observations at Leipzig and Munich, Germany, Geophys. Res. Lett., 37, 13, https://doi.org/10.1029/2010GL043809, 2010. a
Basart, S., Pérez, C., Nickovic, S., Cuevas, E., and Baldasano, J. M.: Development and evaluation of the BSC-DREAM8b dust regional model over Northern Africa, the Mediterranean and the Middle East, Tellus B, 64, 18539 p., https://doi.org/10.3402/tellusb.v64i0.18539, 2012. a
Beer, A.: Bestimmung der Absorption des rothen Lichts in farbigen Flüssigkeiten, Ann. Phys., 86, 78–88, 1852. a
Bilal, M., Nichol, J. E., Nazeer, M., Shi, Y., Wang, L., Kumar, K. R., Ho, H. C., Mazhar, U., Bleiweiss, M. P., Qiu, Z., Khedher, K. M., and Lolli, S.: Characteristics of fine particulate matter (PM2.5) over urban, suburban, and rural areas of Hong Kong, Atmosphere, 10, 496, https://doi.org/10.3390/atmos10090496, 2019. a
Bösenberg, J. and Matthias, V.: EARLINET: A European Aerosol Research Lidar Network to establish an aerosol climatology, https://pure.mpg.de/rest/items/item_995285/component/file_3192559/content (last access: 10 October 2023), 2003. a, b, c
Browell, E., Ismail, S., and Grant, W.: Differential absorption lidar (DIAL) measurements from air and space, Appl. Phys. B, 67, 399–410, 1998. a
Burton, S. P., Ferrare, R. A., Hostetler, C. A., Hair, J. W., Rogers, R. R., Obland, M. D., Butler, C. F., Cook, A. L., Harper, D. B., and Froyd, K. D.: Aerosol classification using airborne High Spectral Resolution Lidar measurements – methodology and examples, Atmos. Meas. Tech., 5, 73–98, https://doi.org/10.5194/amt-5-73-2012, 2012. a
Cairo, F., Di Donfrancesco, G., Adriani, A., Pulvirenti, L., and Fierli, F.: Comparison of various linear depolarization parameters measured by lidar, Appl. Opt., 38, 4425–4432, 1999. a, b
Campbell, J. R., Lolli, S., Lewis, J. R., Gu, Y., and Welton, E. J.: Daytime cirrus cloud top-of-the-atmosphere radiative forcing properties at a midlatitude site and their global consequences, J. Appl.d Meteorol. Climatol., 55, 1667–1679, 2016. a
Campbell, J. R., Peterson, D. A., Marquis, J. W., Fochesatto, G. J., Vaughan, M. A., Stewart, S. A., Tackett, J. L., Lolli, S., Lewis, J. R., Oyola, M. I., and Welton, E. J.: Unusually Deep Wintertime Cirrus Clouds Observed over the Alaskan Subarctic, B. Am. Meteorol. Soc., 99, 27–32, https://doi.org/10.1175/BAMS-D-17-0084.1, 2018. a
Carnuth, W., Kempfer, U., and Trickl, T.: Highlights of the tropospheric lidar studies at IFU within the TOR project, Tellus B, 54, 163–185, 2002. a
Charron, A., Harrison, R. M., Moorcroft, S., and Booker, J.: Quantitative interpretation of divergence between PM10 and PM2.5 mass measurement by TEOM and gravimetric (Partisol) instruments, Atmos. Environ., 38, 415–423, 2004. a, b
Ciofini, M., Lapucci, A., and Lolli, S.: Diffractive optical components for high power laser beam sampling, J. Optics A, 5, 186–191, https://doi.org/10.1088/1464-4258/5/3/308, 2003. a
Cohen, J. B. and Wang, C.: Estimating global black carbon emissions using a top-down Kalman Filter approach, J. Geophys. Res.-Atmos., 119, 307–323, 2014. a
Cramer, W., Guiot, J., Fader, M., Garrabou, J., Gattuso, J.-P., Iglesias, A., Lange, M. A., Lionello, P., Llasat, M. C., Paz, S., Peñuelas, J., Snoussi, M., Toreti, A., Tsimplis, M. N., and Xoplaki, E.: Climate change and interconnected risks to sustainable development in the Mediterranean, Nat. Clim. Change, 8, 972–980, 2018. a
Crosier, J., Allan, J., Coe, H., Bower, K., Formenti, P., and Williams, P.: Chemical composition of summertime aerosol in the Po Valley (Italy), northern Adriatic and Black Sea, Quarterly Journal of the Royal Meteorological Society: A journal of the atmospheric sciences, Appl. Meteorol. Phys. Oceanogr., 133, 61–75, 2007. a
D'Amico, G., Amodeo, A., Baars, H., Binietoglou, I., Freudenthaler, V., Mattis, I., Wandinger, U., and Pappalardo, G.: EARLINET Single Calculus Chain – overview on methodology and strategy, Atmos. Meas. Tech., 8, 4891–4916, https://doi.org/10.5194/amt-8-4891-2015, 2015. a, b, c, d
D'Amico, G., Amodeo, A., Mattis, I., Freudenthaler, V., and Pappalardo, G.: EARLINET Single Calculus Chain – technical – Part 1: Pre-processing of raw lidar data, Atmos. Meas. Tech., 9, 491–507, https://doi.org/10.5194/amt-9-491-2016, 2016. a, b, c
Di Tomaso, E., Escribano, J., Basart, S., Ginoux, P., Macchia, F., Barnaba, F., Benincasa, F., Bretonnière, P.-A., Buñuel, A., Castrillo, M., Cuevas, E., Formenti, P., Gonçalves, M., Jorba, O., Klose, M., Mona, L., Montané Pinto, G., Mytilinaios, M., Obiso, V., Olid, M., Schutgens, N., Votsis, A., Werner, E., and Pérez García-Pando, C.: The MONARCH high-resolution reanalysis of desert dust aerosol over Northern Africa, the Middle East and Europe (2007–2016), Earth Syst. Sci. Data, 14, 2785–2816, https://doi.org/10.5194/essd-14-2785-2022, 2022. a
Dubovik, O., Holben, B. N., Eck, T. F., Smirnov, A., Kaufman, Y. J., King, M. D., Tanré, D., and Slutsker, I.: Variability of absorption and optical properties of key aerosol types observed in worldwide locations, J. Atmos. Sci., 59, 590–608, 2002. a, b, c
Eck, T. F. and Holben, B. N.: Wavelength dependence of the optical depth of biomass burning, urban, and desert dust aerosols, J. Geophys. Res.-Atmos., 104, 31333–31349, 1999. a, b, c, d
Ehret, G., Bousquet, P., Pierangelo, C., Alpers, M., Millet, B., Abshire, J. B., Bovensmann, H., Burrows, J. P., Chevallier, F., Ciais, P., Crevoisier, C., Fix, A., Flamant, P., Frankenberg, C., Fabien Gibert , Birgit Heim , Martin Heimann, Sander Houweling, Hans W. Hubberten , Patrick Jöckel ID , Kathy Law , Alexander Löw, Julia Marshall, Anna Agusti-Panareda ID , Sebastien Payan , Catherine Prigent , Patrick Rairoux, Torsten Sachs , Marko Scholze and Martin Wirth: MERLIN: A French-German space lidar mission dedicated to atmospheric methane, Remote Sens., 9, 1052, https://doi.org/10.3390/rs9101052, 2017. a
Evan, A. T., Flamant, C., Gaetani, M., and Guichard, F.: The past, present and future of African dust, Nature, 531, 493–495, 2016. a
Fan, H., Zhao, C., Yang, Y., and Yang, X.: Spatio-temporal variations of the PM2. 5/PM10 ratios and its application to air pollution type classification in China, Front. Environ. Sci., 9, 692440, https://doi.org/10.3389/fenvs.2021.692440, 2021. a
Fernald, F. G.: Analysis of atmospheric lidar observations: some comments, Appl. Opt., 23, 652–653, 1984. a
Ferrare, R., Turner, D., Clayton, M., Schmid, B., Redemann, J., Covert, D., Elleman, R., Ogren, J., Andrews, E., Goldsmith, J. E., and Jonsson, H.: Evaluation of daytime measurements of aerosols and water vapor made by an operational Raman lidar over the Southern Great Plains, J. Geophys. Res.-Atmos., 111, D05S08, https://doi.org/10.1029/2005JD005836, 2006. a
Freudenthaler, V., Esselborn, M., Wiegner, M., Heese, B., Tesche, M., Ansmann, A., Müller, D., Althausen, D., Wirth, M., Fix, A., Ehret, G., Knippertz, P., Toledano, C., Gasteiger, J., Garhammer, M., and Seefeldner, M.: Depolarization ratio profiling at several wavelengths in pure Saharan dust during SAMUM 2006, Tellus B, 61, 165–179, 2009. a, b, c
Giles, D. M., Sinyuk, A., Sorokin, M. G., Schafer, J. S., Smirnov, A., Slutsker, I., Eck, T. F., Holben, B. N., Lewis, J. R., Campbell, J. R., Welton, E. J., Korkin, S. V., and Lyapustin, A. I.: Advancements in the Aerosol Robotic Network (AERONET) Version 3 database – automated near-real-time quality control algorithm with improved cloud screening for Sun photometer aerosol optical depth (AOD) measurements, Atmos. Meas. Tech., 12, 169–209, https://doi.org/10.5194/amt-12-169-2019, 2019. a, b, c, d
Global Modeling and Assimilation Office (GMAO): MERRA-2 inst6_3d_ana_Np: 3d,6-Hourly,Instantaneous,Pressure-Level,Analysis,Analyzed Meteorological Fields V5.12.4, Greenbelt, MD, USA, Goddard Earth Sciences Data and Information Services Center (GES DISC), https://doi.org/10.5067/FH9A0MLJPC7N, 2015. a, b
Gross, S., Freudenthaler, V., Wiegner, M., Gasteiger, J., Geiss, A., and Schnell, F.: Dual-wavelength linear depolarization ratio of volcanic aerosols: Lidar measurements of the Eyjafjallajökull plume over Maisach, Germany, Atmos. Environ., 48, 85–96, 2012. a
Grund, C. J. and Eloranta, E. W.: University of Wisconsin high spectral resolution lidar, Opt. Eng., 30, 6–12, 1991. a
Guerrero-Rascado, J., Ruiz, B., and Alados-Arboledas, L.: Multi-spectral Lidar characterization of the vertical structure of Saharan dust aerosol over southern Spain, Atmos. Environ., 42, 2668–2681, 2008. a
Haarig, M., Ansmann, A., Baars, H., Jimenez, C., Veselovskii, I., Engelmann, R., and Althausen, D.: Depolarization and lidar ratios at 355, 532, and 1064 nm and microphysical properties of aged tropospheric and stratospheric Canadian wildfire smoke, Atmos. Chem. Phys., 18, 11847–11861, https://doi.org/10.5194/acp-18-11847-2018, 2018. a, b, c
Hess, M., Koepke, P., and Schult, I.: Optical properties of aerosols and clouds: The software package OPAC, B. Am. Meteorol. Soc., 79, 831–844, 1998. a, b
Hirsch, R. M., Slack, J. R., and Smith, R. A.: Techniques of trend analysis for monthly water quality data, Water Resour. Res., 18, 107–121, 1982. a
Holben, B. N., Eck, T. F., Slutsker, I. A., Tanre, D., Buis, J., Setzer, A., Vermote, E., Reagan, J. A., Kaufman, Y., Nakajima, T., Lavenu, F., Jankowiak, I., and Smirnov, A.: AERONET – A federated instrument network and data archive for aerosol characterization, Remote Sens. Environ., 66, 1–16, 1998. a, b, c, d
Huang, T., Yang, Y., O’Connor, E. J., Lolli, S., Haywood, J., Osborne, M., Cheng, J. C.-H., Guo, J., and Yim, S. H.-L.: Influence of a weak typhoon on the vertical distribution of air pollution in Hong Kong: A perspective from a Doppler LiDAR network, Environ. Pollut., 276, 116534, https://doi.org/10.1016/j.envpol.2021.116534, 2021. a
Klett, J. D.: Stable analytical inversion solution for processing lidar returns, Appl. Opt., 20, 211–220, 1981. a
Landi, T. C., Bonasoni, P., Brunetti, M., Campbell, J. R., Marquis, J. W., Di Girolamo, P., and Lolli, S.: Aerosol Direct Radiative Effects under Cloud-Free Conditions over Highly-Polluted Areas in Europe and Mediterranean: A Ten-Years Analysis (2007–2016), Remote Sens., 13, 2933, https://doi.org/10.3390/rs13152933, 2021. a, b, c
Lautenbacher, C.: The global earth observation system of systems (GEOSS), in: 2005 IEEE International Symposium on Mass Storage Systems and Technology, 47–50, IEEE, https://doi.org/10.1109/LGDI.2005.1612463, 2005. a
Levy, R. C., Remer, L. A., Kleidman, R. G., Mattoo, S., Ichoku, C., Kahn, R., and Eck, T. F.: Global evaluation of the Collection 5 MODIS dark-target aerosol products over land, Atmos. Chem. Phys., 10, 10399–10420, https://doi.org/10.5194/acp-10-10399-2010, 2010. a
Lewis, S. C., King, A. D., Perkins-Kirkpatrick, S. E., and Mitchell, D. M.: Regional hotspots of temperature extremes under 1.5 C and 2 C of global mean warming, Weather and Climate Extremes, 26, 100233, https://doi.org/10.1016/j.wace.2019.100233, 2019. a
Liu, B., Ma, Y., Gong, W., and Zhang, M.: Observations of aerosol color ratio and depolarization ratio over Wuhan, Atmos. Pollut. Res., 8, 1113–1122, 2017. a
Lolli, S.: Machine Learning Techniques for Vertical Lidar-Based Detection, Characterization, and Classification of Aerosols and Clouds: A Comprehensive Survey, Remote Sens., 15, 4318, https://doi.org/10.3390/rs15174318, 2023. a
Lolli, S., Welton, E., and Sauvage, L.: EZ LIDAR™ measurement results in the frame of Indian Monsoon TIGER-Z NASA campaign, in: Proc. of SPIE Vol, Vol. 7111, 71 110I–1, 2008. a
Lolli, S., Sauvage, L., Loaec, S., and Lardier, M.: EZ Lidar: A new compact autonomous eye-safe scanning aerosol Lidar for extinction measurements and PBL height detection. Validation of the performances against other instruments and intercomparison campaigns, Óptica Pura y Aplicada, 44, 33–41, 2011. a
Lolli, S., Delaval, A., Loth, C., Garnier, A., and Flamant, P. H.: 0.355-micrometer direct detection wind lidar under testing during a field campaign in consideration of ESA's ADM-Aeolus mission, Atmos. Meas. Tech., 6, 3349–3358, https://doi.org/10.5194/amt-6-3349-2013, 2013. a
Lolli, S., Campbell, J. R., Lewis, J. R., Gu, Y., Marquis, J. W., Chew, B. N., Liew, S.-C., Salinas, S. V., and Welton, E. J.: Daytime Top-of-the-Atmosphere Cirrus Cloud Radiative Forcing Properties at Singapore, J. Appl. Meteorol. Climatol., 56, 1249–1257, 2017. a
Lolli, S., Khor, W. Y., Matjafri, M. Z., and Lim, H. S.: Monsoon season quantitative assessment of biomass burning clear-sky aerosol radiative effect at surface by ground-based lidar observations in Pulau Pinang, Malaysia in 2014, Remote Sens., 11, 2660, https://doi.org/10.3390/rs11222660, 2019. a
Mamouri, R. E. and Ansmann, A.: Fine and coarse dust separation with polarization lidar, Atmos. Meas. Tech., 7, 3717–3735, https://doi.org/10.5194/amt-7-3717-2014, 2014. a
Mamouri, R.-E., Ansmann, A., Nisantzi, A., Kokkalis, P., Schwarz, A., and Hadjimitsis, D.: Low Arabian dust extinction-to-backscatter ratio, Geophys. Res. Lett., 40, 4762–4766, 2013. a
Marenco, F., Santacesaria, V., Bais, A. F., Balis, D., di Sarra, A., Papayannis, A., and Zerefos, C.: Optical properties of tropospheric aerosols determined by lidar and spectrophotometric measurements (Photochemical Activity and Solar Ultraviolet Radiation campaign), Appl. Opt., 36, 6875–6886, 1997. a
Marinou, E., Amiridis, V., Binietoglou, I., Tsikerdekis, A., Solomos, S., Proestakis, E., Konsta, D., Papagiannopoulos, N., Tsekeri, A., Vlastou, G., Zanis, P., Balis, D., Wandinger, U., and Ansmann, A.: Three-dimensional evolution of Saharan dust transport towards Europe based on a 9-year EARLINET-optimized CALIPSO dataset, Atmos. Chem. Phys., 17, 5893–5919, https://doi.org/10.5194/acp-17-5893-2017, 2017. a
Mattis, I., Siefert, P., Müller, D., Tesche, M., Hiebsch, A., Kanitz, T., Schmidt, J., Finger, F., Wandinger, U., and Ansmann, A.: Volcanic aerosol layers observed with multiwavelength Raman lidar over central Europe in 2008–2009, J. Geophys. Res.-Atmos., 115, D00L04, https://doi.org/10.1029/2009JD013472, 2010. a
Mazzola, M., Lanconelli, C., Lupi, A., Busetto, M., Vitale, V., and Tomasi, C.: Columnar aerosol optical properties in the Po Valley, Italy, from MFRSR data, J. Geophys. Res.-Atmos., 115, D17206, https://doi.org/10.1029/2009JD013310, 2010. a, b
Mona, L., Amodeo, A., Pandolfi, M., and Pappalardo, G.: Saharan dust intrusions in the Mediterranean area: Three years of Raman lidar measurements, J. Geophys. Res.-Atmos., 111, D16203, https://doi.org/10.1029/2005JD006569, 2006. a
Mueller, D., Uibel, S., Takemura, M., Klingelhoefer, D., and Groneberg, D. A.: Ships, ports and particulate air pollution-an analysis of recent studies, J. Occup. Med. Toxicol., 6, 1–6, 2011. a
Müller, D., Mattis, I., Wandinger, U., Ansmann, A., Althausen, D., and Stohl, A.: Raman lidar observations of aged Siberian and Canadian forest fire smoke in the free troposphere over Germany in 2003: Microphysical particle characterization, J. Geophys. Res.-Atmos., 110, D17201, https://doi.org/10.1029/2004JD005756, 2005. a
Navas-Guzmán, F., Müller, D., Bravo-Aranda, J., Guerrero-Rascado, J., Granados-Muñoz, M., Pérez-Ramírez, D., Olmo, F., and Alados-Arboledas, L.: Eruption of the Eyjafjallajökull Volcano in spring 2010: Multiwavelength Raman lidar measurements of sulphate particles in the lower troposphere, J. Geophys. Res.-Atmos., 118, 1804–1813, 2013. a
Nicholls, R. J., Wong, P. P., Burkett, V., Woodroffe, C. D., and Hay, J.: Climate change and coastal vulnerability assessment: scenarios for integrated assessment, Springer, Sustain Sci., 3, 89–102, https://doi.org/10.1007/s11625-008-0050-4, 2008. a
Nickovic, S., Kallos, G., Papadopoulos, A., and Kakaliagou, O.: A model for prediction of desert dust cycle in the atmosphere, J. Geophys. Res.-Atmos., 106, 18113–18129, 2001. a
Nisantzi, A., Mamouri, R. E., Ansmann, A., and Hadjimitsis, D.: Injection of mineral dust into the free troposphere during fire events observed with polarization lidar at Limassol, Cyprus, Atmos. Chem. Phys., 14, 12155–12165, https://doi.org/10.5194/acp-14-12155-2014, 2014. a
Nisantzi, A., Mamouri, R. E., Ansmann, A., Schuster, G. L., and Hadjimitsis, D. G.: Middle East versus Saharan dust extinction-to-backscatter ratios, Atmos. Chem. Phys., 15, 7071–7084, https://doi.org/10.5194/acp-15-7071-2015, 2015. a
Papayannis, A., Amiridis, V., Mona, L., Tsaknakis, G., Balis, D., Bösenberg, J., Chaikovski, A., De Tomasi, F., Grigorov, I., Mattis, I., et al.: Systematic lidar observations of Saharan dust over Europe in the frame of EARLINET (2000–2002), J. Geophys. Res.-Atmos., 113, D10204, https://doi.org/10.1029/2007JD009028, 2008. a
Papayannis, A., Mamouri, R., Amiridis, V., Giannakaki, E., Veselovskii, I., Kokkalis, P., Tsaknakis, G., Balis, D., Kristiansen, N., Stohl, A., et al.: Optical properties and vertical extension of aged ash layers over the Eastern Mediterranean as observed by Raman lidars during the Eyjafjallajökull eruption in May 2010, Atmos. Environ., 48, 56–65, 2012. a
Pappalardo, G., Amodeo, A., Mona, L., Pandolfi, M., Pergola, N., and Cuomo, V.: Raman lidar observations of aerosol emitted during the 2002 Etna eruption, Geophys. Res. Lett., 31, L05120, https://doi.org/10.1029/2003GL019073, 2004. a
Pappalardo, G., Wandinger, U., Mona, L., Hiebsch, A., Mattis, I., Amodeo, A., Ansmann, A., Seifert, P., Linné, H., Apituley, A., et al.: EARLINET correlative measurements for CALIPSO: First intercomparison results, J. Geophys. Res.-Atmos., 115, D00H19, https://doi.org/10.1029/2009JD012147, 2010. a
Pappalardo, G., Mona, L., D'Amico, G., Wandinger, U., Adam, M., Amodeo, A., Ansmann, A., Apituley, A., Alados Arboledas, L., Balis, D., Boselli, A., Bravo-Aranda, J. A., Chaikovsky, A., Comeron, A., Cuesta, J., De Tomasi, F., Freudenthaler, V., Gausa, M., Giannakaki, E., Giehl, H., Giunta, A., Grigorov, I., Groß, S., Haeffelin, M., Hiebsch, A., Iarlori, M., Lange, D., Linné, H., Madonna, F., Mattis, I., Mamouri, R.-E., McAuliffe, M. A. P., Mitev, V., Molero, F., Navas-Guzman, F., Nicolae, D., Papayannis, A., Perrone, M. R., Pietras, C., Pietruczuk, A., Pisani, G., Preißler, J., Pujadas, M., Rizi, V., Ruth, A. A., Schmidt, J., Schnell, F., Seifert, P., Serikov, I., Sicard, M., Simeonov, V., Spinelli, N., Stebel, K., Tesche, M., Trickl, T., Wang, X., Wagner, F., Wiegner, M., and Wilson, K. M.: Four-dimensional distribution of the 2010 Eyjafjallajökull volcanic cloud over Europe observed by EARLINET, Atmos. Chem. Phys., 13, 4429–4450, https://doi.org/10.5194/acp-13-4429-2013, 2013. a
Pappalardo, G., Amodeo, A., Apituley, A., Comeron, A., Freudenthaler, V., Linné, H., Ansmann, A., Bösenberg, J., D'Amico, G., Mattis, I., Mona, L., Wandinger, U., Amiridis, V., Alados-Arboledas, L., Nicolae, D., and Wiegner, M.: EARLINET: towards an advanced sustainable European aerosol lidar network, Atmos. Meas. Tech., 7, 2389–2409, https://doi.org/10.5194/amt-7-2389-2014, 2014. a, b, c
Pope III, C. A. and Dockery, D. W.: Health effects of fine particulate air pollution: lines that connect, J. Air Waste Manage. Assoc., 56, 709–742, 2006. a
Qin, K., Lu, L., Liu, J., He, Q., Shi, J., Deng, W., Wang, S., and Cohen, J. B.: Model-free daily inversion of NOx emissions using TROPOMI (MCMFE-NOx) and its uncertainty: Declining regulated emissions and growth of new sources, Remote Sens. Environ., 295, 113720, https://doi.org/10.1016/j.rse.2023.113720, 2023. a
Reche, C., Perez, N., Alastuey, A., Cots, N., Pérez, E., and Querol, X.: 2011–2020 trends of urban and regional ammonia in and around Barcelona, NE Spain, Chemosphere, 304, 135347, https://doi.org/10.1016/j.chemosphere.2022.135347, 2022. a, b
Reichardt, J., Wandinger, U., Klein, V., Mattis, I., Hilber, B., and Begbie, R.: RAMSES: German Meteorological Service autonomous Raman lidar for water vapor, temperature, aerosol, and cloud measurements, Appl. Opt., 51, 8111–8131, 2012. a
Rodríguez-Gómez, A., Sicard, M., Granados-Muñoz, M.-J., Ben Chahed, E., Muñoz-Porcar, C., Barragán, R., Comerón, A., Rocadenbosch, F., and Vidal, E.: An architecture providing depolarization ratio capability for a multi-wavelength raman lidar: Implementation and first measurements, Sensors, 17, 2957, https://doi.org/10.3390/s17122957, 2017. a, b, c, d
Rodríguez-Gómez, A., Muñoz-Porcar, C., Zenteno-Hernández, J.-A., Comerón, A., Dios, F., Sicard, M., Gil-Díaz, C., Oliveira, D. C. F., and Mandal, C.: Use of pure rotational Raman channels for lidar measurement of aerosol extinction coefficient: the EARLINET/ACTRIS Barcelona station experience, in: Remote Sensing of Clouds and the Atmosphere XXVII, Vol. 12265, 60–70, SPIE, 2022. a, b, c
Salvador, P., Pey, J., Pérez, N., Querol, X., and Artíñano, B.: Increasing atmospheric dust transport towards the western Mediterranean over 1948–2020, Clim. Atmos. Sci., 5, 34, https://doi.org/10.1038/s41612-022-00256-4, 2022. a, b, c
Sicard, M., Rocadenbosch, F., Reba, M. N. M., Comerón, A., Tomás, S., García-Vízcaino, D., Batet, O., Barrios, R., Kumar, D., and Baldasano, J. M.: Seasonal variability of aerosol optical properties observed by means of a Raman lidar at an EARLINET site over Northeastern Spain, Atmos. Chem. Phys., 11, 175–190, https://doi.org/10.5194/acp-11-175-2011, 2011. a
Sicard, M., Guerrero-Rascado, J. L., Navas-Guzmán, F., Preißler, J., Molero, F., Tomás, S., Bravo-Aranda, J. A., Comerón, A., Rocadenbosch, F., Wagner, F., Pujadas, M., and Alados-Arboledas, L.: Monitoring of the Eyjafjallajökull volcanic aerosol plume over the Iberian Peninsula by means of four EARLINET lidar stations, Atmos. Chem. Phys., 12, 3115–3130, https://doi.org/10.5194/acp-12-3115-2012, 2012. a, b
Sicard, M., Jorba, O., Ho, J. J., Izquierdo, R., De Linares, C., Alarcón, M., Comerón, A., and Belmonte, J.: Measurement report: Characterization of the vertical distribution of airborne Pinus pollen in the atmosphere with lidar-derived profiles – a modeling case study in the region of Barcelona, NE Spain, Atmos. Chem. Phys., 21, 17807–17832, https://doi.org/10.5194/acp-21-17807-2021, 2021. a, b, c
Smirnov, A., Holben, B. N., Kaufman, Y. J., Dubovik, O., Eck, T. F., Slutsker, I., Pietras, C., and Halthore, R. N.: Optical properties of atmospheric aerosol in maritime environments, J. Atmos. Sci., 59, 501–523, 2002. a, b, c
Stocker, T.: Climate change 2013: the physical science basis: Working Group I contribution to the Fifth assessment report of the Intergovernmental Panel on Climate Change, Cambridge University Press, 1535 pp., 2014. a
Tosca, M. G., Campbell, J., Garay, M., Lolli, S., Seidel, F. C., Marquis, J., and Kalashnikova, O.: Attributing Accelerated Summertime Warming in the Southeast United States to Recent Reductions in Aerosol Burden: Indications from Vertically-Resolved Observations, Remote Sens., 9, 674, https://doi.org/10.3390/rs9070674, 2017. a
Vaughan, M.: Algorithm for retrieving lidar ratios at 1064 nm from space-based lidar backscatter data, in: Laser radar technology for remote sensing, Vol. 5240, 104–115, SPIE, 2004. a
Von Storch, H. and Zwiers, F. W.: Statistical analysis in climate research, Cambridge university press, https://doi.org/10.1017/CBO9780511612336, 2002. a
Wang, S., Wang, X., Cohen, J. B., and Qin, K.: Inferring polluted Asian absorbing aerosol properties using decadal scale AERONET measurements and a MIE model, Geophys. Res. Lett., 48, e2021GL094300, https://doi.org/10.1029/2021GL094300, 2021. a
Wang, X., Boselli, A., D’Avino, L., Pisani, G., Spinelli, N., Amodeo, A., Chaikovsky, A., Wiegner, M., Nickovic, S., Papayannis, A., et al.: Volcanic dust characterization by EARLINET during Etna's eruptions in 2001–2002, Atmos. Environ., 42, 893–905, 2008. a
Whiteman, D. N.: Examination of the traditional Raman lidar technique. I. Evaluating the temperature-dependent lidar equations, Appl. Opt., 42, 2571–2592, 2003. a
Wiegner, M., Gasteiger, J., Groß, S., Schnell, F., Freudenthaler, V., and Forkel, R.: Characterization of the Eyjafjallajökull ash-plume: Potential of lidar remote sensing, Phys. Chem. Earth A/B/C, 45, 79–86, 2012. a
Xue, J., Zong, L., Yang, Y., Bi, X., Zhang, Y., and Zhao, M.: Diurnal and interannual variations of canopy urban heat island (CUHI) effects over a mountain–valley city with a semi-arid climate, Urban Clim., 48, 101425, https://doi.org/10.1016/j.uclim.2023.101425, 2023. a
Yang, Y., Fan, S., Wang, L., Gao, Z., Zhang, Y., Zou, H., Miao, S., Li, Y., Huang, M., Yim, S. H. L., Lolli, S.: Diurnal evolution of the wintertime boundary layer in urban Beijing, China: Insights from Doppler Lidar and a 325-m meteorological tower, Remote Sens., 12, 3935, https://doi.org/10.3390/rs12233935, 2020. a
Yue, S., Pilon, P., and Cavadias, G.: Power of the Mann–Kendall and Spearman's rho tests for detecting monotonic trends in hydrological series, J. Hydrol., 259, 254–271, 2002. a
Zenteno-Hernández, J. A., Comerón, A., Rodríguez-Gómez, A., Muñoz-Porcar, C., D’Amico, G., and Sicard, M.: A comparative analysis of aerosol optical coefficients and their associated errors retrieved from pure-rotational and vibro-rotational raman lidar signals, Sensors, 21, 1277, https://doi.org/10.3390/s21041277, 2021. a, b, c, d