the Creative Commons Attribution 4.0 License.
the Creative Commons Attribution 4.0 License.
 | 09 Oct 2023
Short- and long-term stratospheric impact of smoke from the 2019–2020 Australian wildfires
Johan Friberg
Bengt G. Martinsson
Moa K. Sporre
At the end of December 2019 and beginning of 2020, massive firestorms in Australia formed pyrocumulonimbus clouds (pyroCbs) that acted like enormous smokestacks, pumping smoke to the upper troposphere and stratosphere. We study the smoke with data from four satellite-based sensors: the aerosol observation platforms CALIOP (Cloud-Aerosol Lidar with Orthogonal Polarization), OMPS-LP (Ozone Mapping and Profiler Suite Limb Profiler), and OMPS-NM (Ozone Mapping and Profiler Suite Nadir Mapper) and water vapor retrievals from MLS (Microwave Limb Sounder). Smoke was lofted to the upper troposphere and stratosphere during two events and spread almost exclusively within the extratropics. Smoke from the first event, starting 29 December, was injected directly into the stratosphere by pyroCbs, causing a rapid initial increase in AOD (aerosol optical depth). CALIOP identifies a rapid decline in this stratospheric smoke (half-life: 10 d), not captured in previous studies of the Australian fires, indicating photochemical processing of organic aerosol. This decay rate is in line with model predictions of mid-tropospheric organic aerosol loss by photolytic removal and is in agreement with our estimates of decay rates after the North American fires in August 2017. PyroCbs from the second event, 4 January, injected small amounts of smoke directly into the stratosphere. Large amounts of smoke were injected to the upper troposphere, from where it ascended into the stratosphere during several weeks, forming a second peak in the aerosol load. Hence, we find that pyroCbs can impact the stratospheric aerosol load both via direct injection to the stratosphere and through injection of smoke to the upper troposphere from where the smoke ascends into the stratosphere. The stratospheric AOD from the second-event fires decreased more slowly than the AOD from the first event, likely due to a combination of photolytic loss starting already in the troposphere and continued supply of smoke from the upper troposphere offsetting the loss rate. Together these injections yielded a major increase in the aerosol load for almost 1 year.
- Article
(6978 KB) - Full-text XML
-
Supplement
(38084 KB) - BibTeX
- EndNote


The stratospheric aerosol scatters and absorbs solar radiation, cooling Earth's surface. Submicron particles can remain suspended for months or years in the stratosphere owing to their low settling rates, lack of precipitation in the stratosphere, and stratospheric transport patterns (Kremser et al., 2016). They follow the airstream and are removed from the stratosphere mainly in the mid-latitudes and polar regions.
The Brewer–Dobson (BD) circulation moves air from the tropics to the extratropics, where it descends into the lowermost stratosphere (LMS) and eventually to the upper troposphere. Residence times are years in its deep branch and months in its shallow branch and LMS. These three layers hold each of the global stratospheric aerosol load in periods of stratospheric background conditions (Andersson et al., 2015; Friberg et al., 2018). Variability in the stratospheric aerosol load is driven mainly by volcanic injections of particle-forming SO2 (Kremser et al., 2016; Solomon et al., 2011), but wildfires have been shown to contribute substantially in recent years (Peterson et al., 2021).
Wildfires can form so-called pyrocumulonimbus clouds (pyroCbs) that act as giant smokestacks, injecting smoke to high altitudes. This phenomenon was revealed already more than 20 years ago, as some stratospheric aerosol layers could not be connected to volcanism (Fromm et al., 2000; Fromm and Servranckx, 2003). There have been many observations of stratospheric wildfire smoke since then, but its impact on the stratospheric aerosol load and climate has been considered low compared to volcanism (Kremser et al., 2016; Thomason et al., 2018; Vernier et al., 2011). However, recently two massive events have turned the attention to wildfire smoke.
Massive fires in western North America in August 2017 formed pyroCbs that had a remarkable impact on the stratospheric aerosol load and were the largest occurrence in the satellite records (Khaykin et al., 2018; Peterson et al., 2018). Dense smoke layers rose to more than 23 km altitude due to radiation heating of the BC-rich (black carbon) aerosol (Yu et al., 2019). The smoke properties were investigated (Das et al., 2021; Haarig et al., 2018; Martinsson et al., 2022), and its impact on the stratospheric aerosol load just after the fires was estimated to be similar to recent volcanic eruptions (Peterson et al., 2018).
A similar event was observed during the gigantic fires in eastern Australia in 2019–2020 (Kablick et al., 2020; Khaykin et al., 2020). The austral spring and summer of 2019–2020 were exceptionally hot and dry, and the fire season started earlier than normally. It was unprecedented both in the number and size of fires, and more than 20 % of the Australian temperate forest was lost (Abram et al., 2021; Boer et al., 2020). Smoke spread over most of eastern Australia. A total of 20 pyroCbs injected smoke to the stratosphere during two events, 29–31 December and 4 January (Peterson et al., 2021). Light absorption of the BC-containing aerosol resulted in three vortex-like structures in the stratosphere (Kablick et al., 2020; Khaykin et al., 2020; Lestrelin et al., 2021; Peterson et al., 2021). Smoke layers were seen deep into the stratosphere in the beginning of January, and one of them rose to more than 35 km altitude by radiation heating (Khaykin et al., 2020).
Most smoke encounters in the stratosphere have been explained through upward transport by pyrocumulonimbus clouds, but studies in recent years suggest that further transport mechanisms cause cross-tropopause transport of smoke. The North American wildfires in August 2017 showed that self-lofting by radiative heating of the dense smoke layers caused smoke to rise from the tropopause into the LMS (e.g., Khaykin et al., 2018; Peterson et al., 2018). Ohneiser et al. (2021) suggested self-lofting of smoke from the mid-troposphere as a cause of extensive aerosol layers in the Arctic stratosphere at the end of 2019 and beginning of 2020. Whether those aerosol layers consisted of sulfate or sulfate-covered smoke particles is under debate (Boone et al., 2022; Knepp et al., 2022). Most recently, Ohneiser et al. (2023) computed heating and lofting rates for light-absorbing smoke layers throughout the troposphere and the lower stratosphere. Their studies indicate that smoke layers can rise from the upper troposphere (UT) to the stratosphere via radiation heating. Also, convection downwind fires and isentropic cross-tropopause transport have been suggested as causes of the large amount of stratospheric smoke after the Australian fires covered in our work (Hirsch and Koren, 2021; Magaritz-Ronen and Raveh-Rubin, 2021).
Recent findings show that 80 %–90 % of the stratospheric smoke AOD (aerosol optical depth) after the 2017 North American fires was lost in the first few months after injection, indicating photochemical processing of organics in the smoke (Martinsson et al., 2022), whereas the remaining aerosol stayed in the stratosphere for a year (Martinsson et al., 2022). We present, for the first time, evidence that this phenomenon occurred also in the Australian wildfire smoke layers. Furthermore, we find that part of the smoke lingered in the troposphere for more than 1 week while gradually entering the stratosphere.
2.1 Aerosol data
The smoke was observed using lidar data from the NASA satellite-borne CALIOP (Cloud-Aerosol Lidar with Orthogonal Polarization) instrument. We used the latest version of the rawest product available (v4.10, level 1B). Backscattering coefficients were computed by correcting for light attenuation by air molecules (including ozone absorption) and for particles in the stratosphere. The molecular part was estimated using modeling data of the ozone and air densities provided in the CALIOP files compiled by the NASA Langley Research Center (Friberg et al., 2018). The wildfire smoke is optically dense and strongly attenuated the lidar signals. The particle light attenuation was computed from the lidar signals themselves in an iterative approach explained in Martinsson et al. (2022). This procedure retrieves also the extinction-to-backscattering ratio, the so-called lidar ratio, used to compute aerosol extinction coefficients from the CALIOP lidar backscattering data. CALIOP has a polarization filter, separating backscattered light into parallel and perpendicular polarization. The ratio of the two forms the volume depolarization ratios used for ice cloud screening of the entire dataset. The volume depolarization ratio describes the properties of the complete volume of air, i.e., the aerosol particles together with the air. To study the temporal evolution of the smoke particles, we also compiled the particle depolarization ratios for individual smoke layers (Martinsson et al., 2022), which describe the properties of the particles themselves.
Ice clouds were removed in the lowest 3 km of the stratosphere. CALIOP data were averaged to 8 km horizontal resolution, and volume depolarization ratios above 0.20 were classified as clouds. The process is described in more detail in Martinsson et al. (2022).
Further aerosol data were compiled from the limb-scatter-observing instrument OMPS-LP (Ozone Mapping and Profiler Suite Limb Profiler). We used level 2.0 version 5.10 light extinction data (Suomi-NPP OMPS LP L2 AER Daily Product, version 2.0, Taha et al., 2021) of two wavelengths (745 and 997 nm). The OMPS-LP wavelength (510 nm), most similar to the CALIOP wavelength (532 nm), and used in Martinsson et al. (2022), is unfortunately not reliable in the Southern Hemisphere (Taha et al., 2021). Data were filtered to minimize influence of ice-clouds and polar stratospheric clouds, and flags were used to prevent influence from erroneous data. A detailed description on this approach can be found in Martinsson et al. (2022).
Stratospheric AODs were computed by integration of the aerosol extinction coefficients from the tropopause to 35 km altitude, as well as in selected layers of the stratosphere, where the LMS was defined as the layer between the tropopause and the 380 K isentrope. Tropopause heights from the MERRA-2 (Modern-Era Retrospective analysis for Research and Applications) reanalysis were retrieved from the CALIOP and OMPS-LP files provided by NASA.
The UV aerosol index (UVAI) level 3 data (v2.1) from OMPS-NM (Ozone Mapping and Profiler Suite Nadir Mapper) were used to track horizontal smoke transport. The data product is compiled from observations at 379 and 340 nm (Torres, 2019). It indicates presence of UV-absorbing aerosol particles and increases with altitude, making it well suited for tracking BC-containing wildfire smoke in the UT and stratosphere. Data were screened based on NASA recommendations on data usage (https://ozoneaq.gsfc.nasa.gov/docs/NMTO3-L3_Product_Descriptions.pdf, last access: 6 October 2022). Horizontal UVAI distributions were combined with vertical information from CALIOP to identify smoke transport to the upper troposphere and stratosphere from different fire events.
2.2 Identifying smoke from different events
Smoke from the different fire events was identified based on daily maps over the UVAI, stratospheric wind directions, and altitude distributions from CALIOP curtains. We tracked the motion day to day of the central parts of the fire events (p. 1 in the Supplement), and used the information to classify the individual smoke layers described above. OMPS-NM shows two separate major events of increased ultra-violet (UV) aerosol index from the 2019–2020 Australian wildfires, first observed on 29 December and 4 January as described in Peterson et al. (2021). Some days the two events overlapped horizontally. In such case additional information on altitude from CALIOP was used, because the smoke from the two main events on any given day differed markedly in altitude (Supplement). We will elaborate more on this in the Results section.
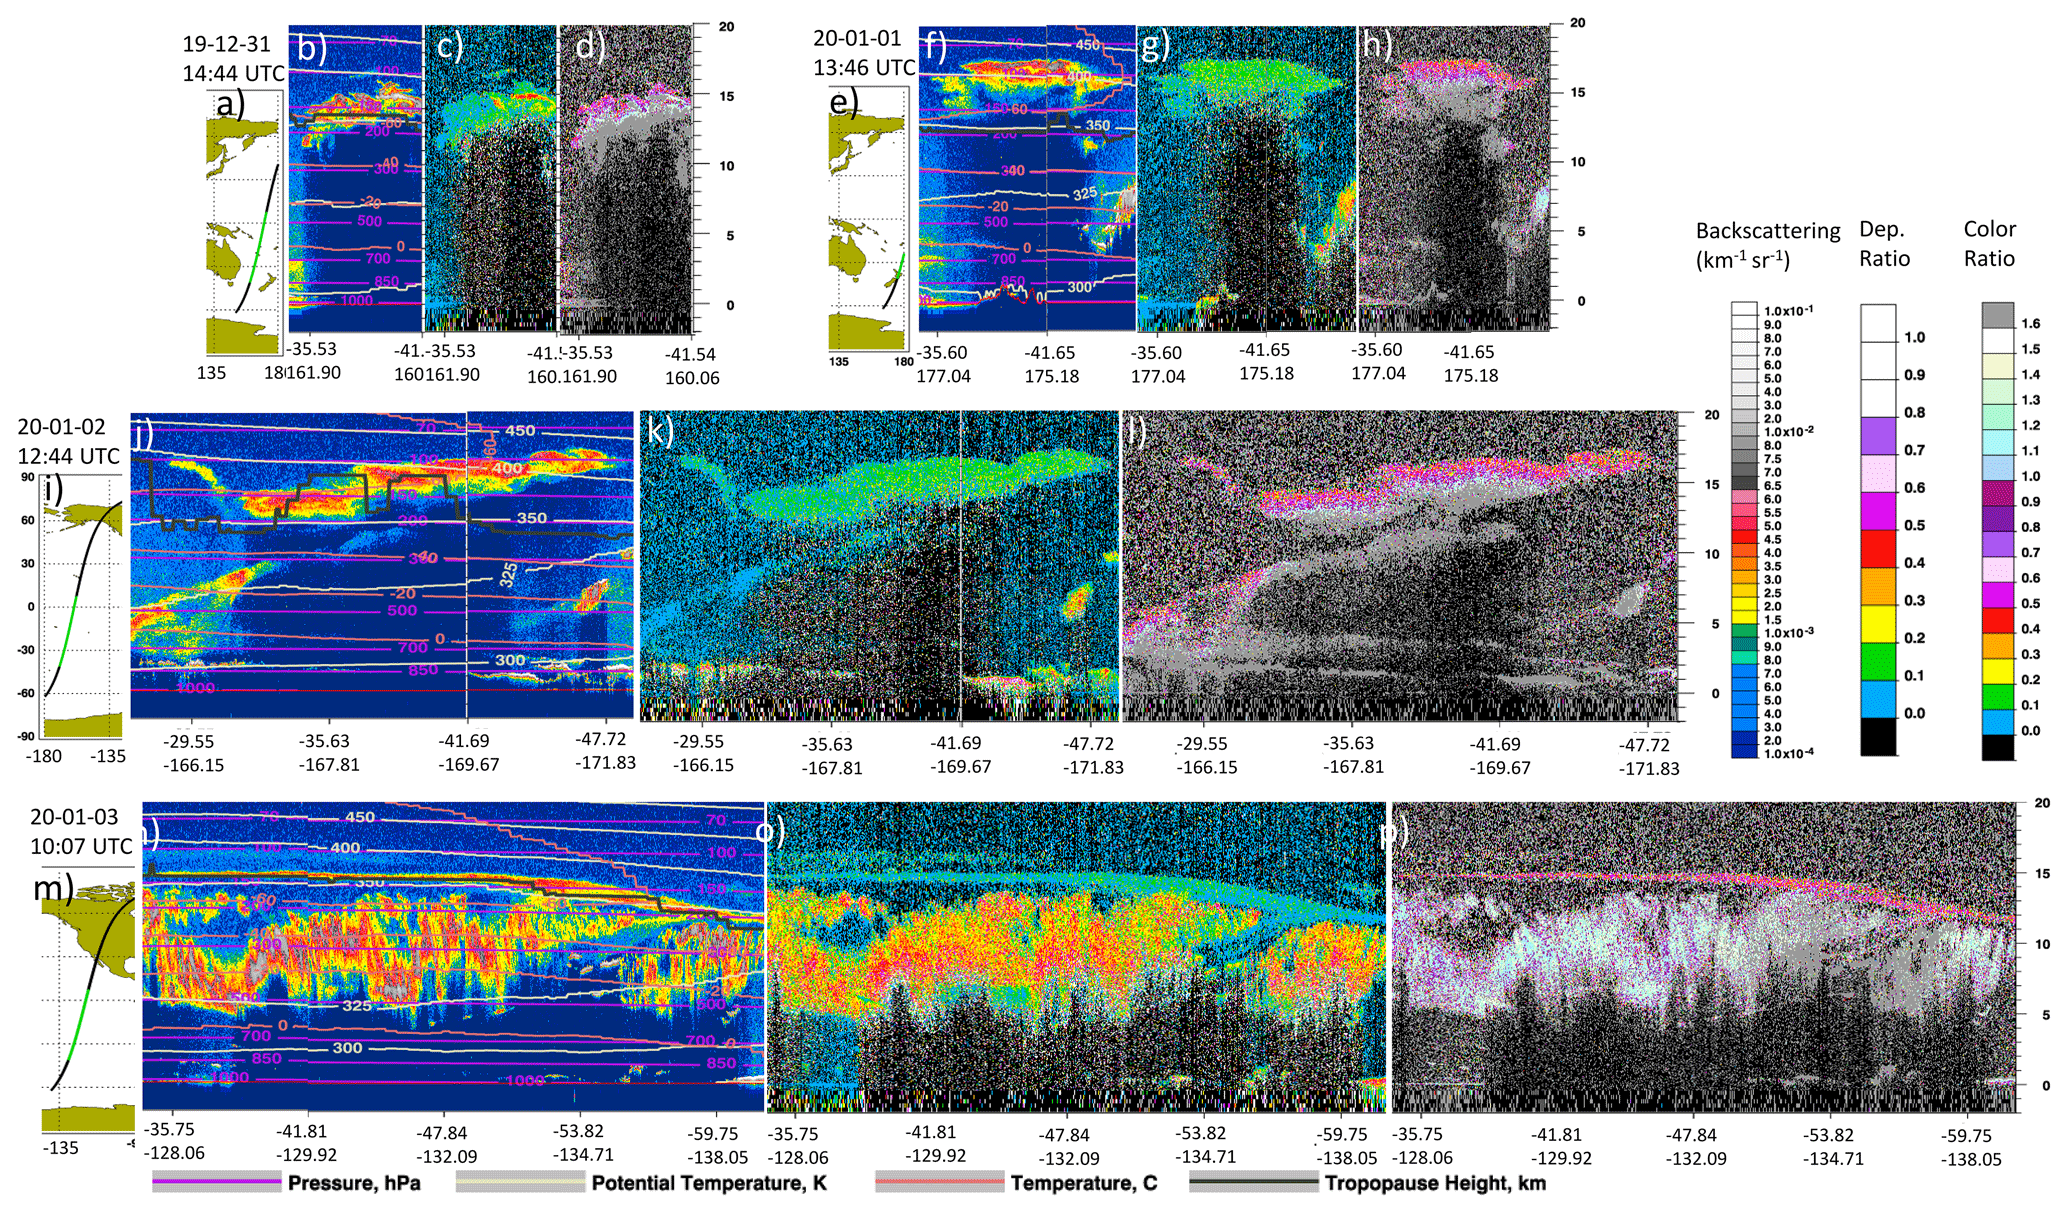
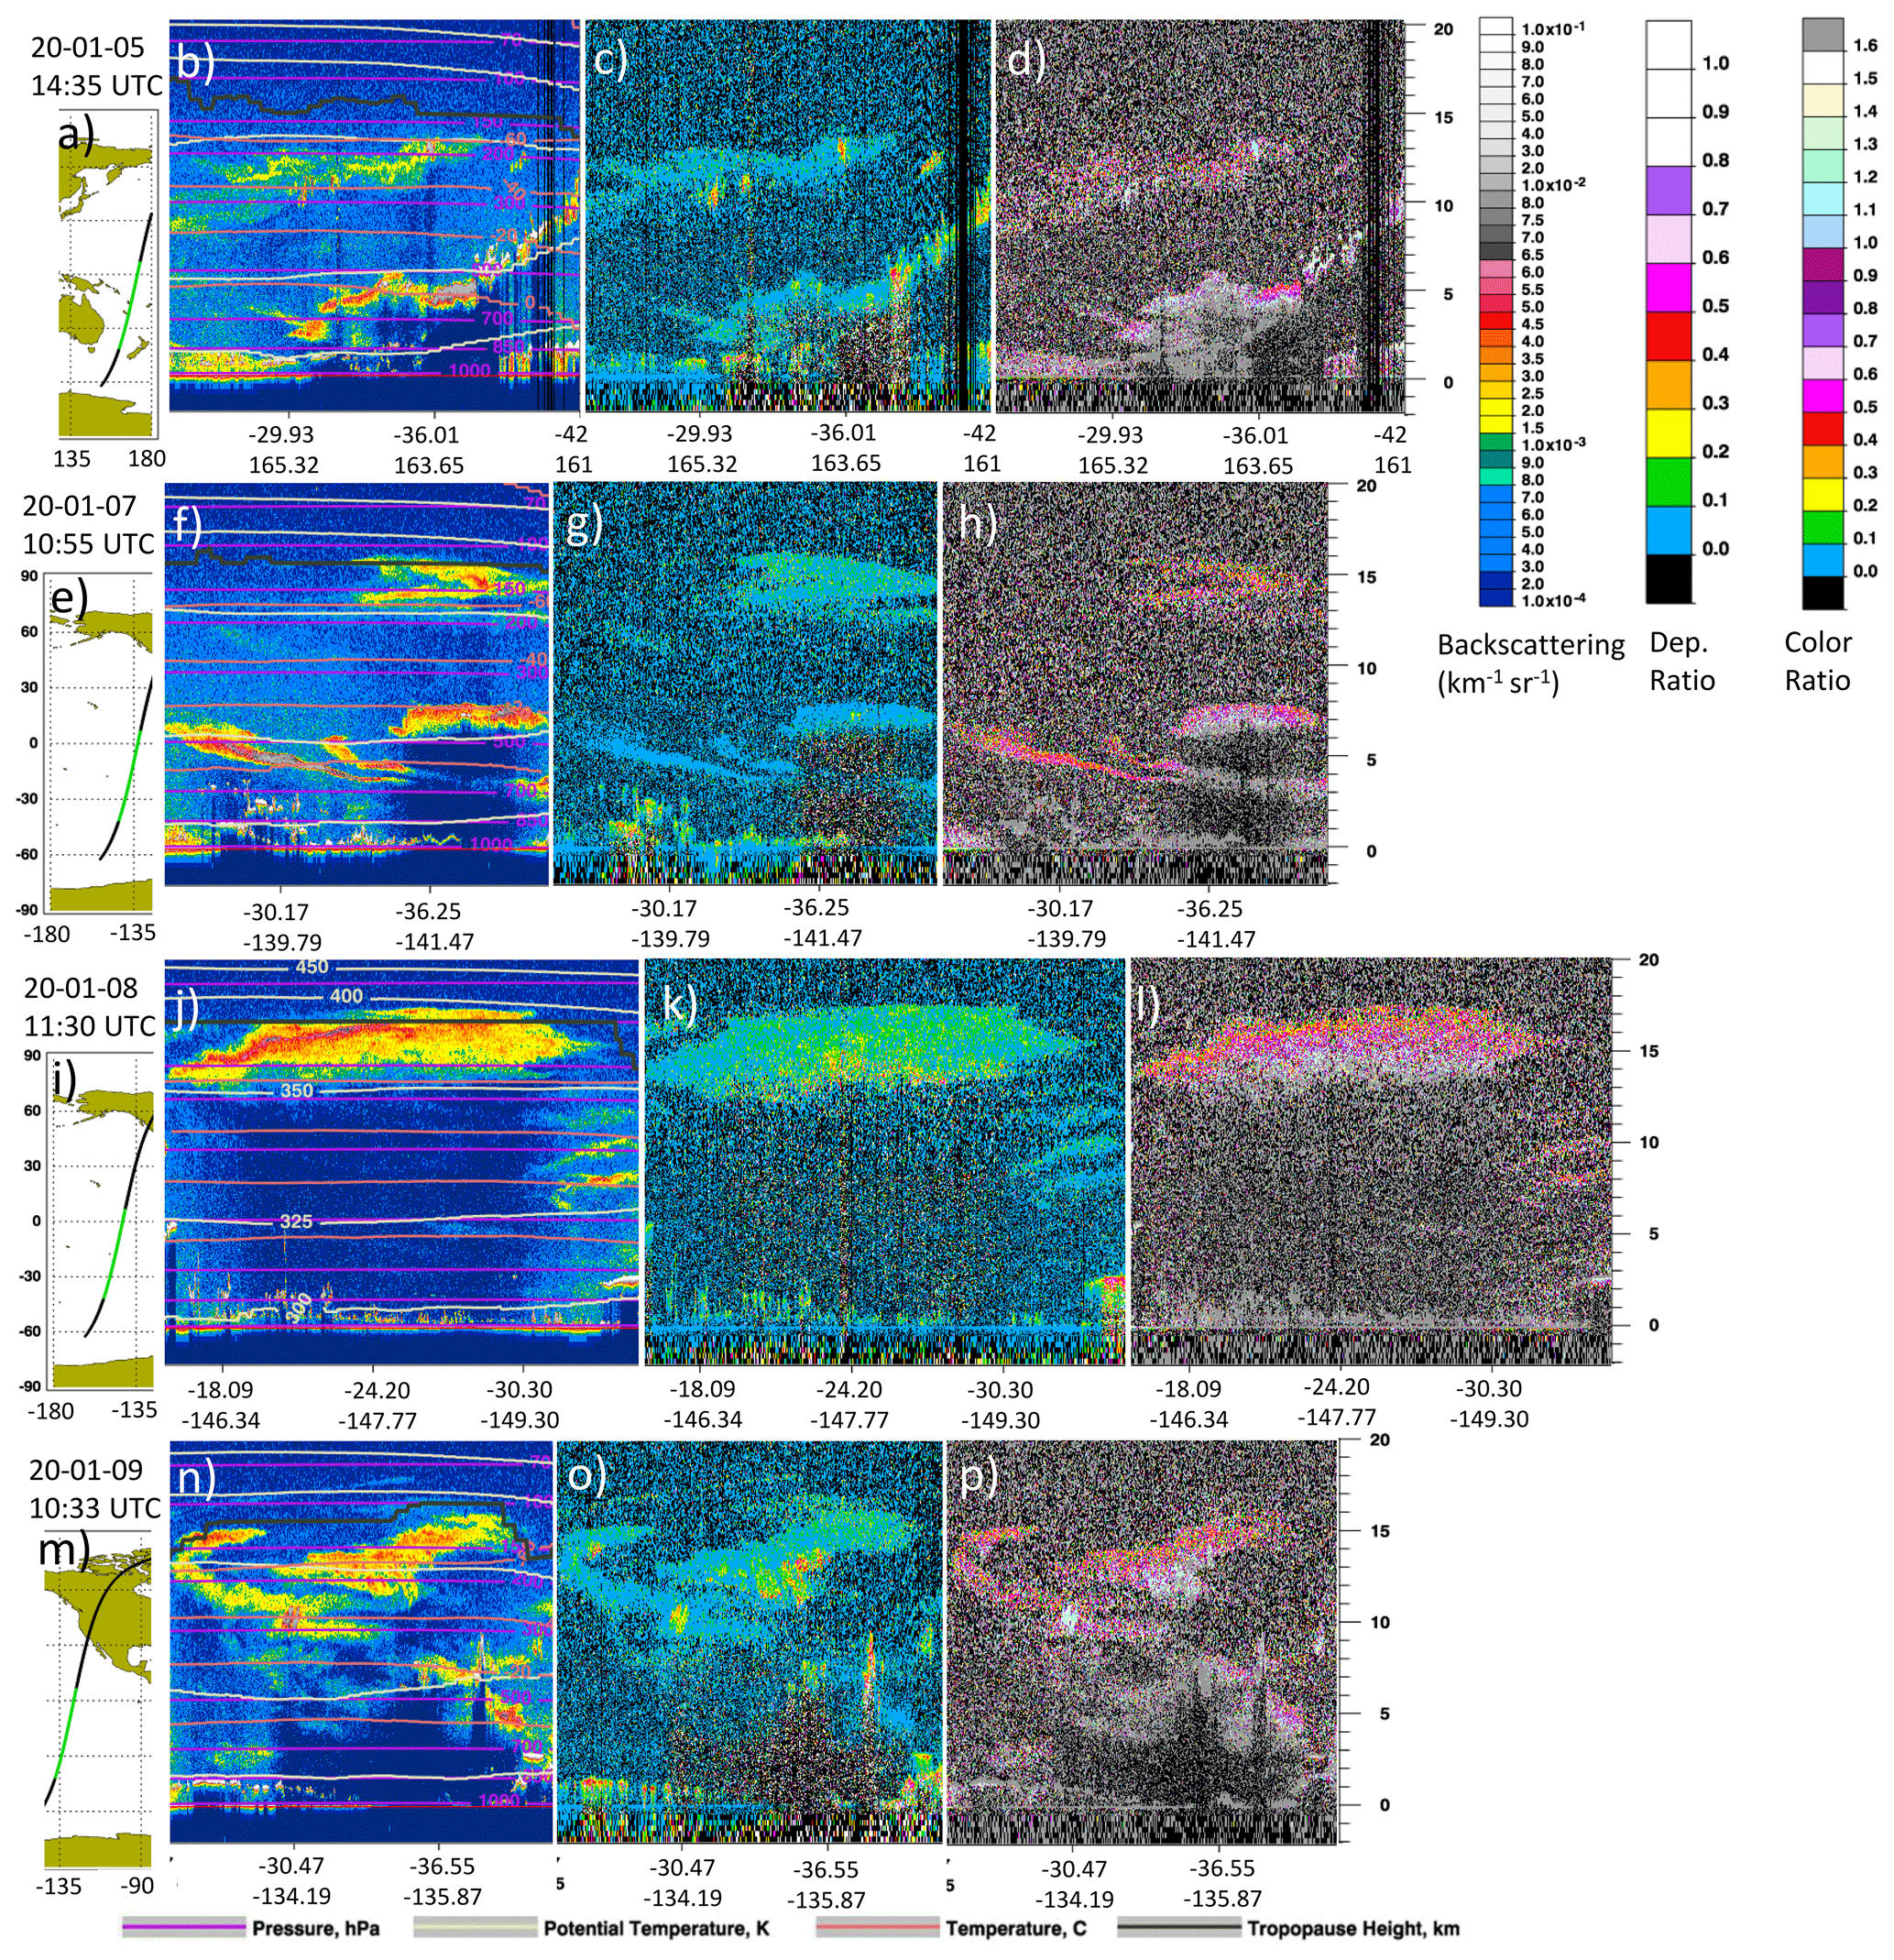
Figure 1CALIOP curtains from early overpasses of the region affected by the first fire event that started on 29 December 2019. Left panels show attenuated backscattering, mid-panels show the volume depolarization ratios, and right panels show the attenuated color ratios. Strong attenuation of the lidar beam is indicated by the dark-blue colors below smoke layer, as well as by the higher color ratios at the bottom of the smoke layers. The following meteorological parameters are marked with lines: pressure levels (purple), potential temperatures (white), temperatures (orange), and tropopause heights (grey). See the Supplement for further curtain plots. Please note that the date format used in Figs. 1 and 2 is year month day (yy-mm-dd).
The depolarization ratios for smoke from the second fire were clearly lower than those for smoke from the first fire, as seen in Figs. 1 and 2, as well as in the Supplement (Figs. S2–S49. This difference remains for more than 1 month, i.e., smoke layers from the second fire continues to have lower depolarization ratios than smoke from the first fire. This particle optical property verifies that we have classified the smoke successfully.
CALIOP provides vertical distributions of aerosol and clouds. Besides the attenuated backscattering provided as curtain plots, information on particle morphology (depolarization ratio, where zero corresponds to spherical particles) and particle size (color ratio, i.e., ratio in attenuated backscattering of wavelength 1064 to 532 nm). Figures 1 and 2 show these three CALIOP features over the regions with increased UVAI from the first days after the first and second fire event, respectively. Non-cloud features can be identified by strong backscattering signal in connection with depolarization ratios less than approximately 0.2 and color ratios well below 1. For an example see the observation on 3 January 2020 at 10:07 UTC (Fig. 1n–p), where a thin smoke layer in the tropopause region resides over deep cloud layers. In optically thick smoke layers, there is a shift in color ratio from a low value at the top to significantly higher values lower down in the smoke layer. These increased values deep into the layers are artifacts caused by stronger attenuation for the shorter wavelength. The signal from the layers closest to the satellite (at the layer top) is less affected by attenuation, whereas deeper into the layer the shortwave signal (532 nm) becomes attenuated more than the longwave one (1064 nm) (Martinsson et al., 2022).
2.3 Water vapor observations
Satellite observations of water vapor from the Microwave Limb Sounder (MLS) aboard the Aura satellite was used together with aerosol data. We use the level 2 nighttime data version 5.0-1.0a data of individual smoke layers. Data are provided at 12 levels per decade change as pressures of 1000–1 hPa. Low-altitude data were excluded to reduce impact of the strong gradient in the H2O mixing ratio across the tropopause. The highest peak pressure was 73 hPa (average of 38 hPa), which is lower than reported in our recent study (Martinsson et al., 2022) due to the higher altitude of the tropopause caused by the lower latitudes in the present study.
MLS data were used in comparison with CALIOP data. A shift down of CALIPSO orbit in September 2018 to the CloudSat level caused a variable horizontal distance between CALIOP aerosol and MLS H2O observations. Measurements with horizontal distances less than 330 km (average 180 km) were used, which led to periodical loss of data. The data were screened using recommendations by the MLS team (Livesey et al., 2022).
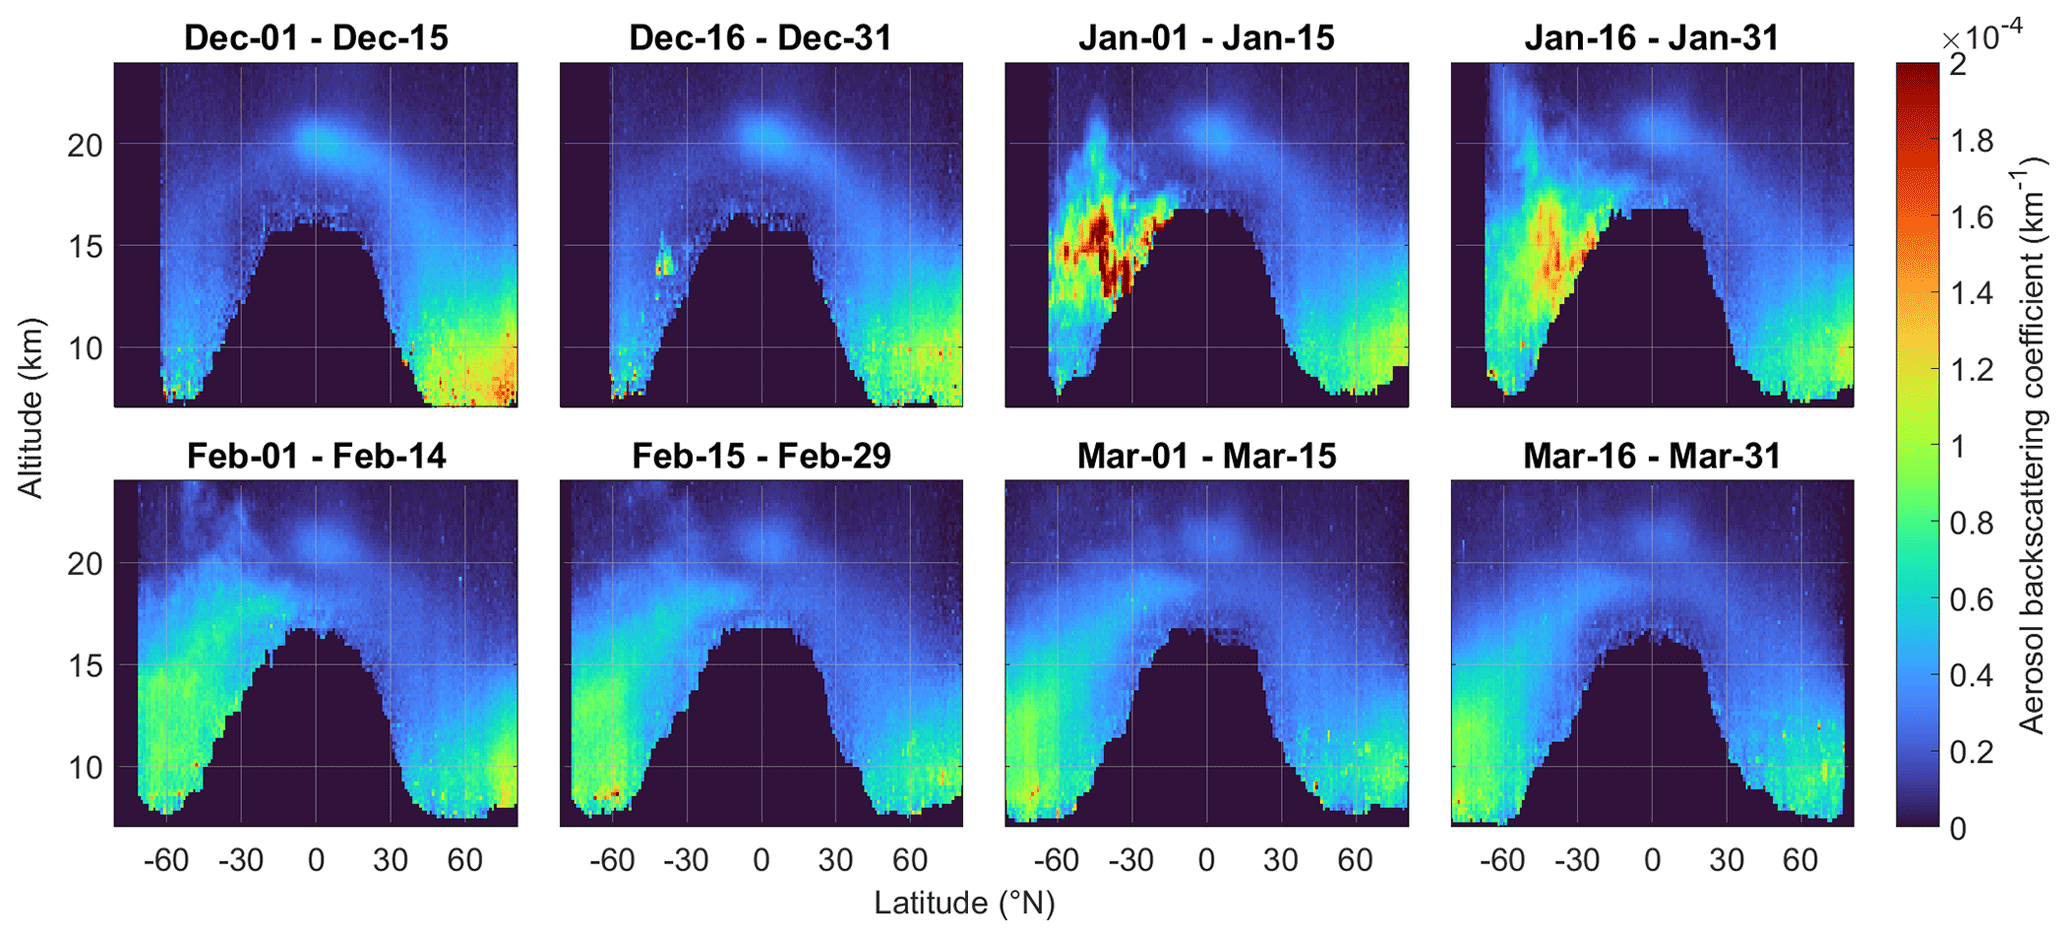
Figure 3Latitudinal and vertical distribution of smoke in December 2019–March 2020. CALIOP zonal mean aerosol backscattering coefficients during the first 3 months after, as well as 1 month before, the first stratospheric injection. This parameter can be viewed as an optical version of aerosol concentration.
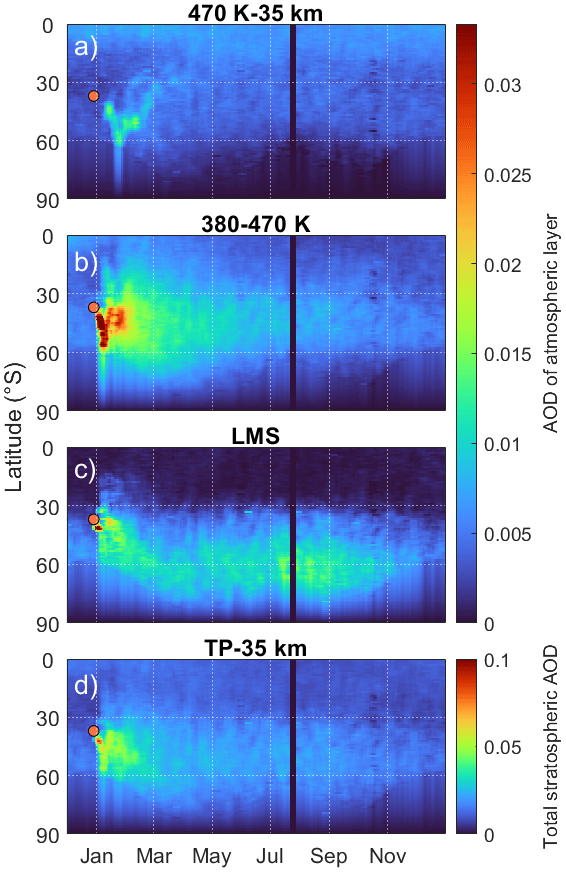
Figure 4Latitude and time distribution of the stratospheric aerosol load. Aerosol optical depth (AOD) in three stratospheric layers and in all layers combined. The (a) upper layer and (b) mid-layer are the deep and shallow branches of Brewer–Dobson circulation, and the (c) lowest layer is the lowermost stratosphere. The orange dot shows the approximate latitude and the time of the first fire.
3.1 Smoke distribution in the stratosphere
The CALIOP satellite instrument observed a dense smoke layer at 11–16 km altitude located around the tropopause over the Tasman Sea (Fig. 1a–d), causing a clear increase in the aerosol load in the LMS and shallow BD branch already on New Year's Eve (Fig. 4). Large amounts of smoke were observed in the following days. Strong smoke signals were seen spread within the stratosphere of the southern mid-latitudes in the beginning of January (Figs. 3c and 4b–d) and continued to be strong during the rest of the month.
The aerosol load was low in the southern extratropical stratosphere before the smoke injection by the Australian fires (Fig. 3a). Volcanic perturbations were present at 20 km altitude in the tropics and in the northern extratropics. These stem from eruptions in June and August 2019 by the volcanic eruptions of Ulawun and Raikoke (Kloss et al., 2021), which had a low impact on the southern extratropics. In fact, the stratospheric aerosol load was lower in the southern extratropics than anywhere else.
The smoke spread latitudinally, almost exclusively to the south (Fig. 3). Figure 4 illustrates the AOD in three stratospheric layers. Most of the smoke stayed below the 470 K isentrope (the two lowest layers, Fig. 4b–c), but a minor part of the smoke rose by radiation heating to the layer with the deep BD branch (Fig. 4a), where it continued to rise. A clear AOD increase was evident in the southern mid-latitudes and high latitudes persisting throughout 2020.
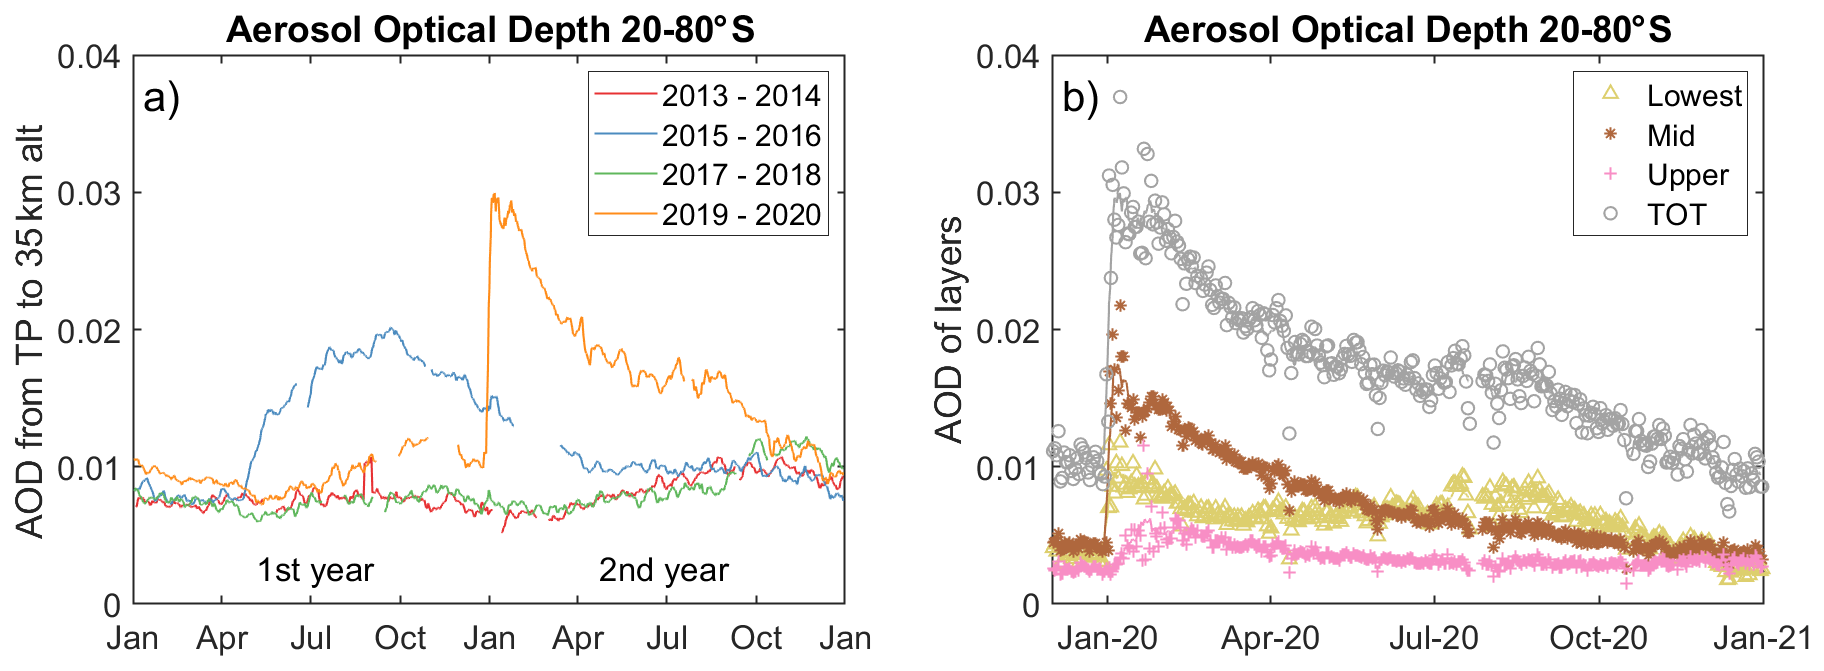
Figure 5Wildfire impact on the stratospheric aerosol load in the southern extratropics. (a) The aerosol optical depth (AOD) from CALIOP in 2013–2020 divided into 2-year steps, illustrating the impact of the Australian wildfires in 2019–2020, together with that from the Calbuco eruption in 2015–2016, and background levels from 2013–2014 and 2017–2018. (b) The stratospheric AOD from CALIOP during December 2019–July 2020 separated into the three layers used in Fig. 4. Lines mark 8 d smoothed AOD data, and symbols are daily means of the LMS (yellow), the shallow (brown) and upper (pink) BD branches, and the total (TOT) stratospheric AOD (grey).
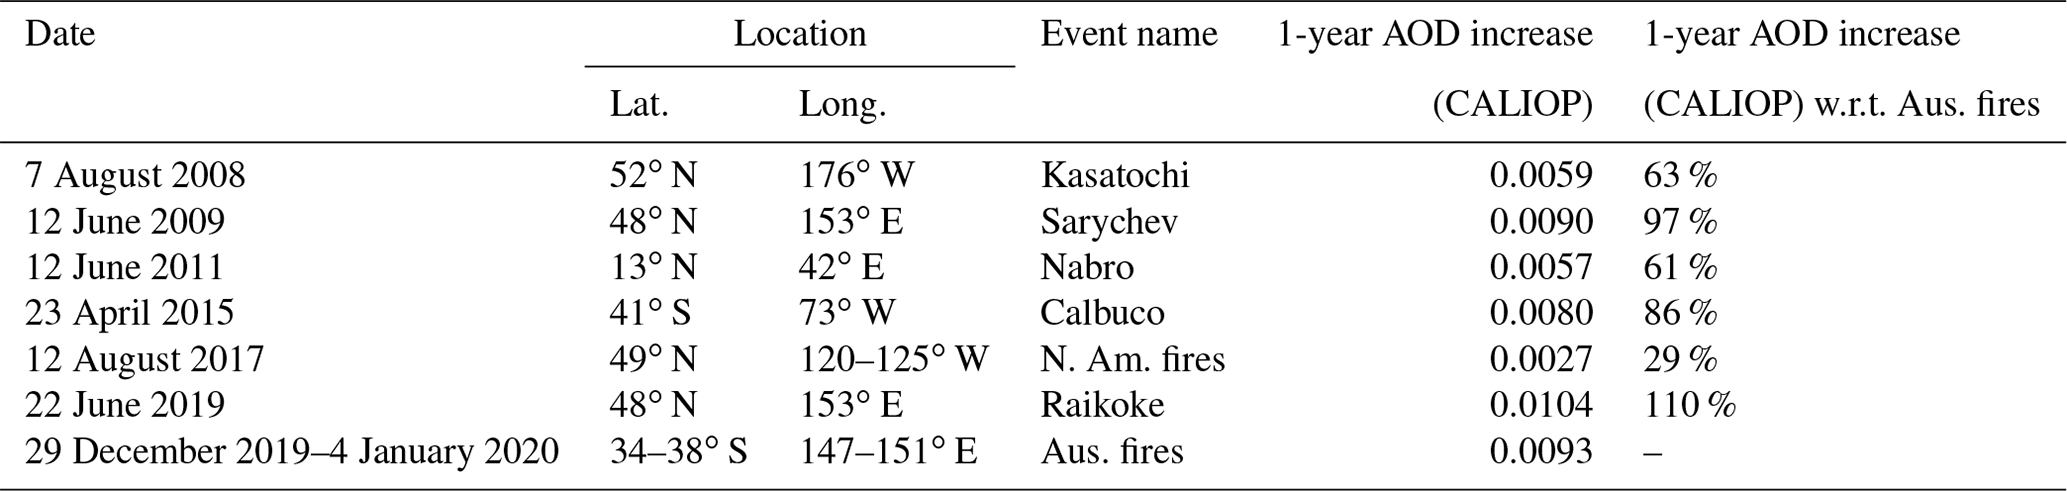
Table 1Wildfire and volcanic impact on aerosol optical depths and radiative forcing. The 1-year AOD increase in the extratropics (20–80∘ N/S) after the largest volcanic eruptions and wildfires since 2006 compared to the Australian wildfires.
3.2 Wildfire smoke compared to volcanism
We find that the injected wildfire smoke increased the stratospheric aerosol load by volcanic proportions (Fig. 5a). The fires induced an AOD increase of more than 3 times higher in its first year than the North American fires in 2017 did and slightly higher than the Calbuco eruption in 2015 (Table 1). That eruption yielded the largest volcanic impact in the Southern Hemisphere since the Mount Pinatubo eruption in 1991 (Friberg et al., 2018; Martinsson et al., 2022; Rieger et al., 2015; Thomason et al., 2018). The impact of the Australian fires was only matched in size by the large eruptions of Sarychev (2009) and Raikoke (2019), which both occurred in the Northern Hemisphere (Table 1).
Stratospheric background aerosol consists mainly of sulfurous and carbonaceous compounds (Martinsson et al., 2019). Volcanic aerosol contains large amounts of sulfurous, carbonaceous and crustal components (Andersson et al., 2013; Friberg et al., 2014; Martinsson et al., 2009), whereas smoke mainly consists of organic compounds and BC (Garofalo et al., 2019). The smoke had a rather different impact on the stratospheric aerosol load than the volcanic particles from the Calbuco eruption (Fig. 5a). The rise in AOD for several months after the volcanic injection stems from prolonged particle formation from volcanic SO2 and particle growth. Conversely, wildfire smoke particles are mixtures of primary BC particles and organics that form within hours or days, explaining the initial rapid rise in the AOD after the fires. In the CALIOP data, a second peak in AOD arose a few weeks after the first. We will elaborate more on this unexpected feature in the following sections.
The AOD evolution showed similar patterns in the two lower layers (Fig. 5b). The first peak in AOD is seen early both in the mid-layer and lowest layer similar to our observations of smoke from the North American fires (Martinsson et al., 2022). The upper layer shows a slow rise in AOD, due to the time required for smoke to rise from the mid-layer. This rise was also observed by the limb-scattering instrument OMPS-LP (Khaykin et al., 2020). However, that AOD increase constitutes only a small portion of the total stratospheric AOD from the fires (Fig. 5b).
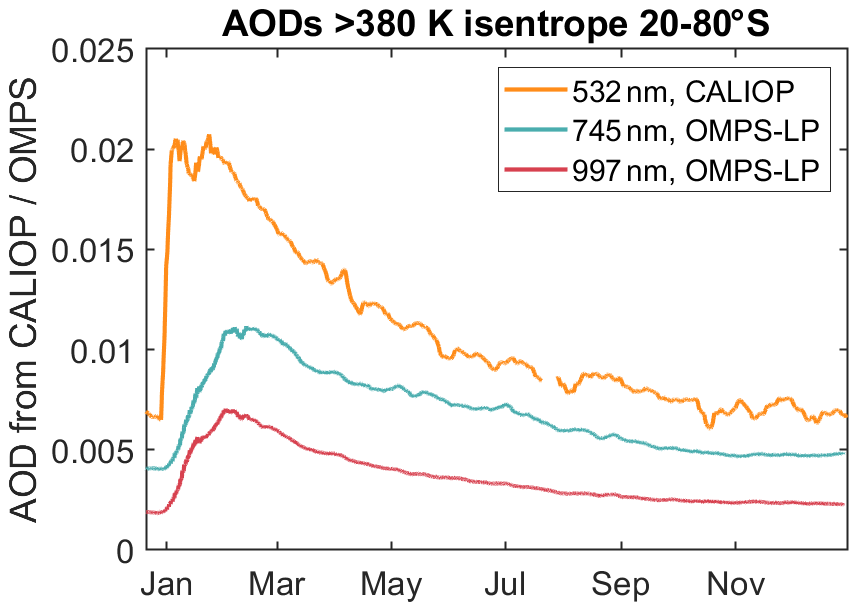
Figure 6Wildfire impact on stratospheric AODs at three wavelengths in the southern extratropics from CALIOP and OMPS-LP. The stratospheric column above the 380 K isentrope at 20–80∘ S.
The rapid rise in AOD after the fires is not seen in the OMPS-LP data (Fig. 6). CALIOP data reveal that the smoke had twice the peak increase over the background in AOD as the eruption of Calbuco did. Studies based on OMPS-LP data (Khaykin et al., 2020) report almost indistinguishable peak impact on the AOD from these two events. The OMPS-LP AODs after the fires increased much more slowly than for CALIOP and did not capture the first peak in the AOD in Fig. 5a. This discrepancy is explained by differences in observation systems. OMPS-LP suffers from event termination already at low light extinction, which inhibits quantification of dense aerosol layers such as fresh wildfire smoke (Fromm et al., 2014; Lurton et al., 2018; Martinsson et al., 2022). The line of sight is orders of magnitude longer for the limb viewer OMPS-LP than for the nadir viewer CALIOP, causing the difficulty of observing dense aerosol layers (Martinsson et al., 2022). Hence, CALIOP suffers less from light attenuation, and the data can be corrected for light attenuation from the smoke particles, enabling us to compute the AOD of also the densest smoke layers (Martinsson et al., 2022). After 1–2 months the limb viewer problem with event termination is reduced, making a comparison of the different instruments feasible. The evolution in stratospheric AOD for the two instruments are compared in Fig. 6, illustrating the slower rise for OMPS-LP. As pointed out in the Methods section, the OMPS-LP wavelength closest to CALIOP is not useful in the Southern Hemisphere (Taha et al., 2021). The light at longer wavelengths (OMPS-LP) is scattered less than at shorter wavelengths (CALIOP), resulting in lower AODs for OMPS-LP. Similarly slow rise in the AOD from OMPS-LP was shown for smoke from the 2017 North American fires (Martinsson et al., 2022). Our present study shows another example of when space-borne lidar is required for quantification of the stratospheric AOD when dense aerosol layers are present.
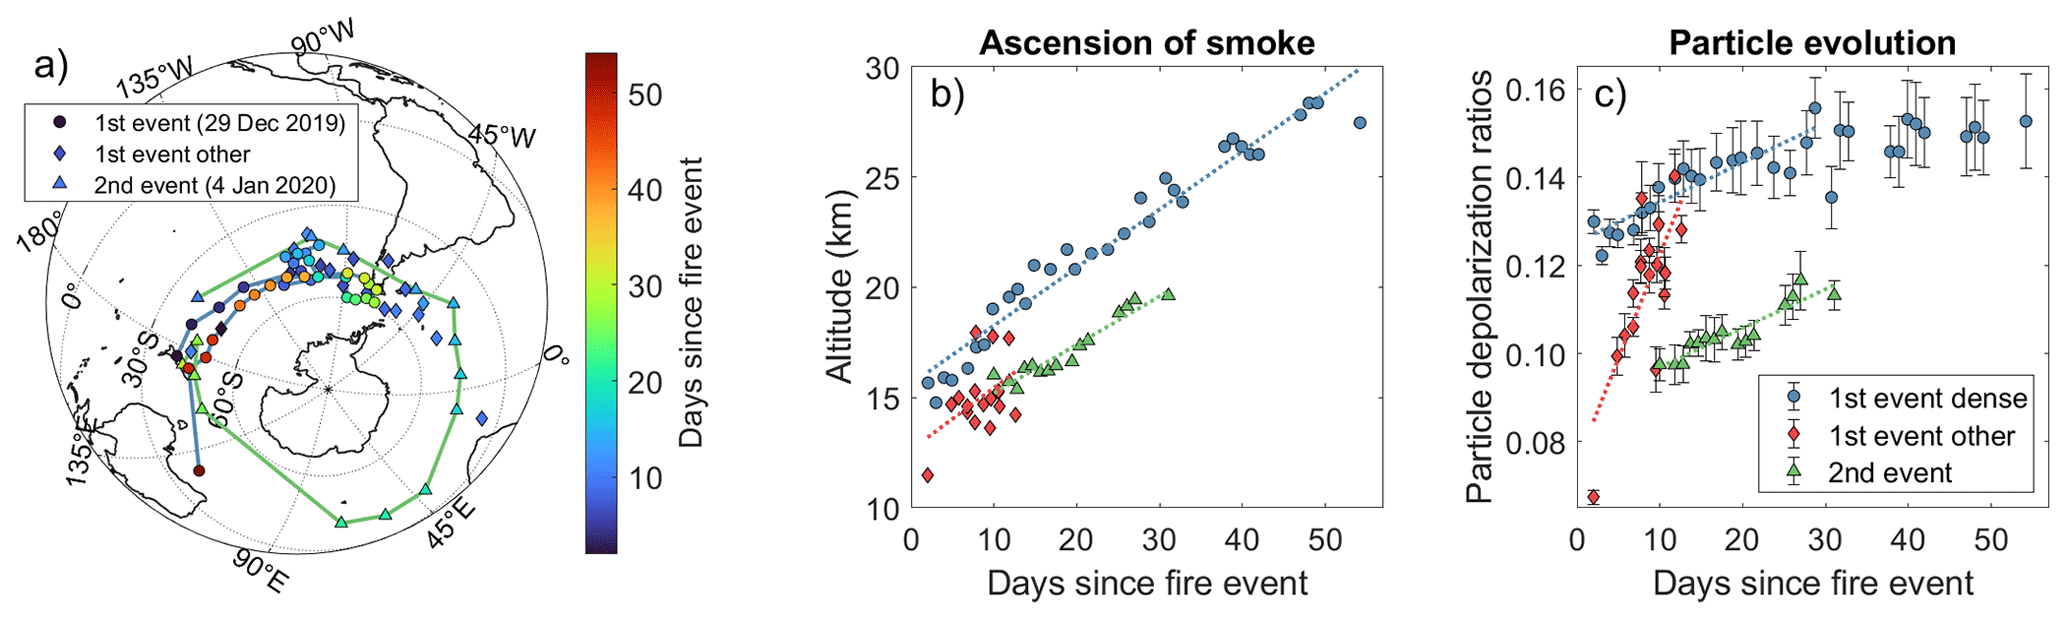
Figure 7The smoke transport and smoke particle evolution in the stratosphere. (a) Geographical transport of the smoke from the two injection events. (b) Ascension of the smoke layers and (c) temporal evolution of the particle depolarization ratios for the two injection events. All data taken on individual smoke layers in the stratosphere. Circles mark data taken in the dense, isolated smoke layer from the first-event fires, diamonds are other data from the first fire, and triangles mark smoke data from the second-event fires.
3.3 Stratospheric smoke from two events
We find that smoke was transported to the stratosphere from two fire events, by tracking smoke back to fires in eastern Australia, combining CALIOP with OMPS-NM (Fig. S1). The first-event pyroCbs started on 29 December (Peterson et al., 2021), and the first CALIOP observations were 2 d later, on New Year's Eve. Those injections positioned smoke directly around the tropopause, i.e., partly in the stratosphere (Fig. 1a–d). One large, dense smoke layer was transported east from the fire region and was stuck for weeks over the southeastern Pacific (Figs. 7a and S1), where it formed a vortex, isolating it from mixing with surrounding air (Kablick et al., 2020; Khaykin et al., 2020). The isolation made it easier to track this smoke. We find that the large, dense smoke layer rose by a mean velocity of 260 m d−1 for the first 50 d after the pyroCb injections (Fig. 7b), similar to previously reported figures (Khaykin et al., 2020).
We also identified several other smoke layers from the first event located at lower-stratospheric altitude and not connected to the large, dense smoke layer (Fig. S1). Horizontally, these were transported more rapidly and could not be tracked during as many days due to mixing with the surrounding air.
The second fire event occurred on 4 January, but smoke from this event showed only little immediate stratospheric influence (Figs. 2, S8–S16). Also Peterson et al. (2021) reported much larger stratospheric impact from the first fire, based on studies of the fires' immediate impact (2021). Ten days after the pyroCb formations we start to see more stratospheric influence (Fig. 7). CALIOP images reveal the addition of large, dense smoke layers to the upper troposphere after 4 January (Fig. 2). We studied the temporal evolution of the smoke layers' position relative to the tropopause (Fig. 11). The smoke layers are clearly located below the tropopause in the first days after the second fire with minor overshooting parts (e.g., Fig. 2f and j). Over time, more and more smoke appears in the stratosphere. Hence, the smoke was transported gradually across the tropopause in the weeks following the fire injections to the upper troposphere. We kept following this smoke in the stratosphere for 20 d. Interestingly, it rose at approximately the same rate as the large, isolated smoke layer from the first event, 250 m d−1 (Fig. 7b).
3.4 Transformation of smoke
By studying individual smoke layers, we find evidence of morphological transformation of the smoke particles during the first month after pyroCb injections. The CALIOP instrument is depolarization sensitive. Non-spherical particles depolarize the scattered light, increasing the depolarized signal retrieved by the sensor. We find a steady increase in the particle depolarization ratio in stratospheric smoke from both the first and second event (Fig. 7c). The trend lasts more than 30 d in the isolated layer from the first event, after which the particle depolarization ratio becomes stable at a value of 0.15. A similar trend was observed in the weeks following the August 2017 fires in western North America (Martinsson et al., 2022), whereas the opposite trend was observed when comparing fresh smoke with aged smoke well mixed with the background aerosol (Baars et al., 2019). The depolarization ratio of the aerosol from the second event deviates clearly from that of the first event by being much lower. We will discuss this difference further in a section below.
3.5 Separating data from the two events
To study the individual stratospheric impact of the two events, we need to separate data into two groups. Peterson et al. (2021) reported that pyroCbs reached the stratosphere mainly during the first-event fires and to a lesser extent during the second event. Figure 1 shows that smoke from the first event reached the stratosphere shortly after the fires, whereas large amounts of smoke from the second event reached the upper troposphere (Fig. 2). We do not see evidence of large direct smoke injection to the stratosphere from the second-event fires in the CALIOP data, neither in the nighttime nor in the daytime data. Hence, most of the immediate stratospheric impact stems from the first event.
Smoke from the first event rose markedly in the stratosphere before smoke from the second event entered the stratosphere (Figs. 7b and 8a–c). Also their depolarization ratios differed markedly (Fig. 7c and Supplement). Clear differences between the first and second injection events are evident in the time–altitude distributions (Fig. 8) of the extinction coefficients, scattering ratios, and depolarization ratios, remaining over the course of more than 2 months. These parameters all show rising smoke in the weeks after the first event with particle depolarization ratios that increase over time (Fig. 8c). In mid-January, smoke with lower depolarization ratios started to ascend into the stratosphere (Fig. 7c), connecting the smoke below the minimum in Fig. 8c to the second event that ascended later into the stratosphere. The minimum in Fig. 8, occurring in between the smoke occurrences from the two injection events, illustrates the impact from a rapid stratospheric injection from mainly the first fire event and slow transport of smoke to the stratosphere from the second event. We use this minimum to separate smoke data from the two fires (dashed lines in Fig. 8) to form the AOD of the two events and investigate their individual impact on the stratospheric AOD.
3.6 Evolution of the smoke
The smoke AOD from the first event decreased rapidly over the first weeks, followed by a slow decrease until spring (Fig. 9a). A similarly rapid decline in smoke AOD and increasing particle depolarization ratio was seen for stratospheric smoke in our earlier study on the western North American wildfires in August 2017 (Martinsson et al., 2022). We have considered transport out of the stratosphere, sedimentation, cloud formation, and hygroscopic growth/shrinkage as explanations for the decline and found that the loss of material from the particles by photolysis is a plausible explanation for the decline (Martinsson et al., 2022). The long residence time due to the practically absent wet deposition in the stratosphere makes the effects of photolysis simpler to study compared with the troposphere. The importance of photolysis as a removal mechanism of organic aerosol is also supported by studies of photolysis in numerous laboratory experiments (Molina et al., 2004; Sareen et al., 2013) and by modeling (Hodzic et al., 2015; Zawadowicz et al., 2020).
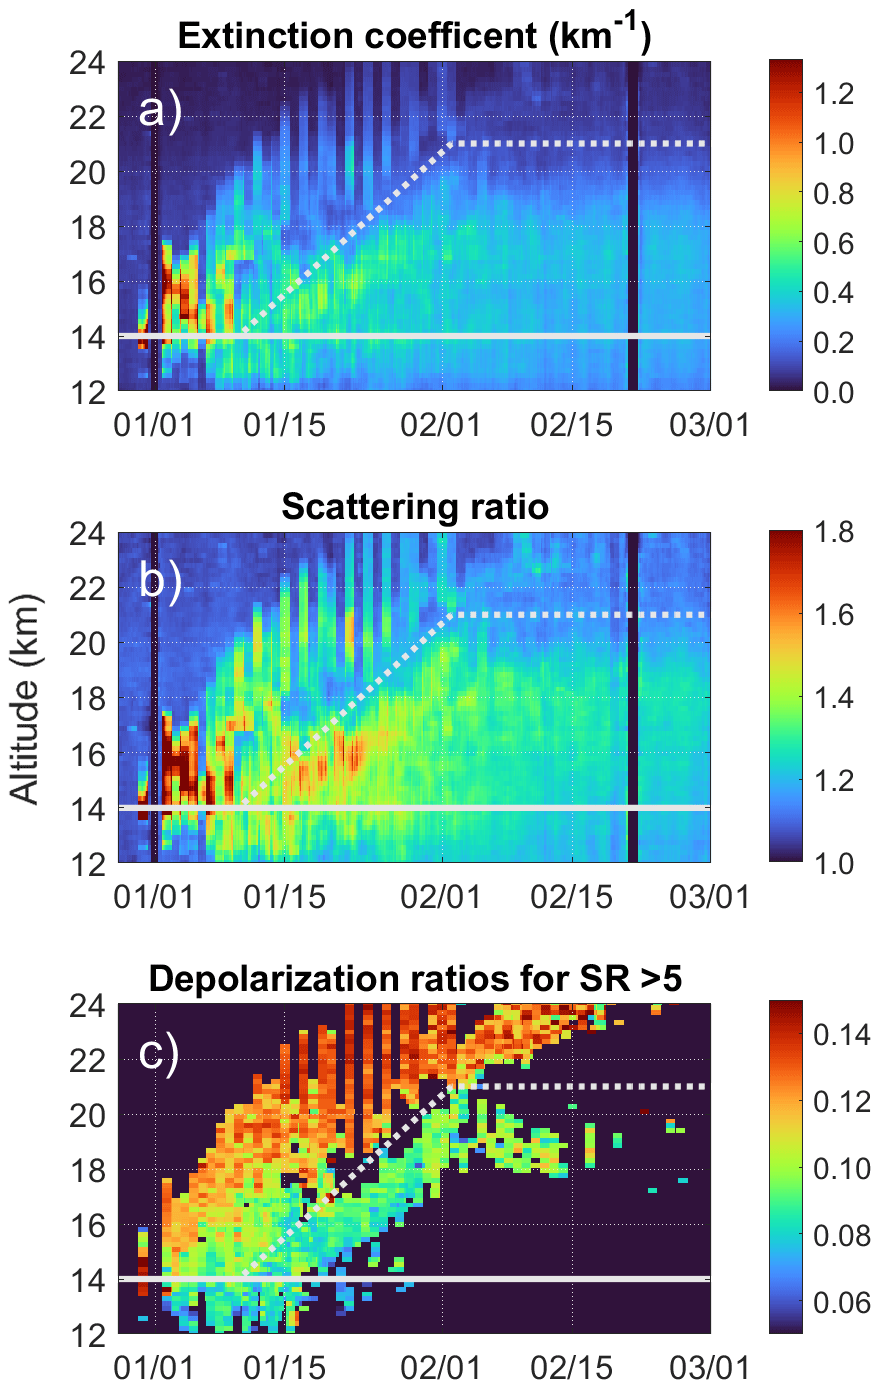
Figure 8Separation of the smoke from the two events of the fires. Stratospheric zonal mean (20–80∘ S) (a) extinction coefficients, (b), scattering ratios (SRs), and (c) depolarization ratios where SR values are higher than 5. The dashed and full lines represent the separation line of smoke for the two fire events and the minimum altitude used to compute the AODs for the two fire events. Please note that the date format used in Figs. 8, 10, and 11 is month day (mm/dd).
The trend of decreasing stratospheric AOD after the first fire event together with increasing particle depolarization ratio over time suggests that photolytic loss depletes organic aerosol in the smoke. Thus, the BC fraction in the smoke will increase over time and may eventually constitute most of the smoke particles mass. We therefore interpret the morphological transformation (depolarization ratio) and AOD decrease after the first event as decay of organic aerosol in the stratosphere.
The particle depolarization ratio is much lower for smoke from the second event than from the first (Figs. 1, 2, 7c, and 8c). This difference may be found in the history of these smoke layers. Depolarization ratios for tropospheric smoke is lower than stratospheric (Haarig et al., 2018). The low depolarization ratios for smoke from the second event indicate (chemical) processing of the smoke in the troposphere. The presence of water in the smoke particles can cause a collapse of the BC agglomerates to a more spherical shape (Fan et al., 2016), which should result in lowering of the depolarization ratios. This explains the low depolarization ratios for smoke from the second-event fires, where smoke particles were exposed to the more humid tropospheric conditions for 10 d or more before entering the stratosphere. Different aging processes in the troposphere and stratosphere could thus be the cause of differing particle depolarization ratios of smoke from the two events, although differences in fire conditions cannot be ruled out (Haarig et al., 2018; Zhang et al., 2008).
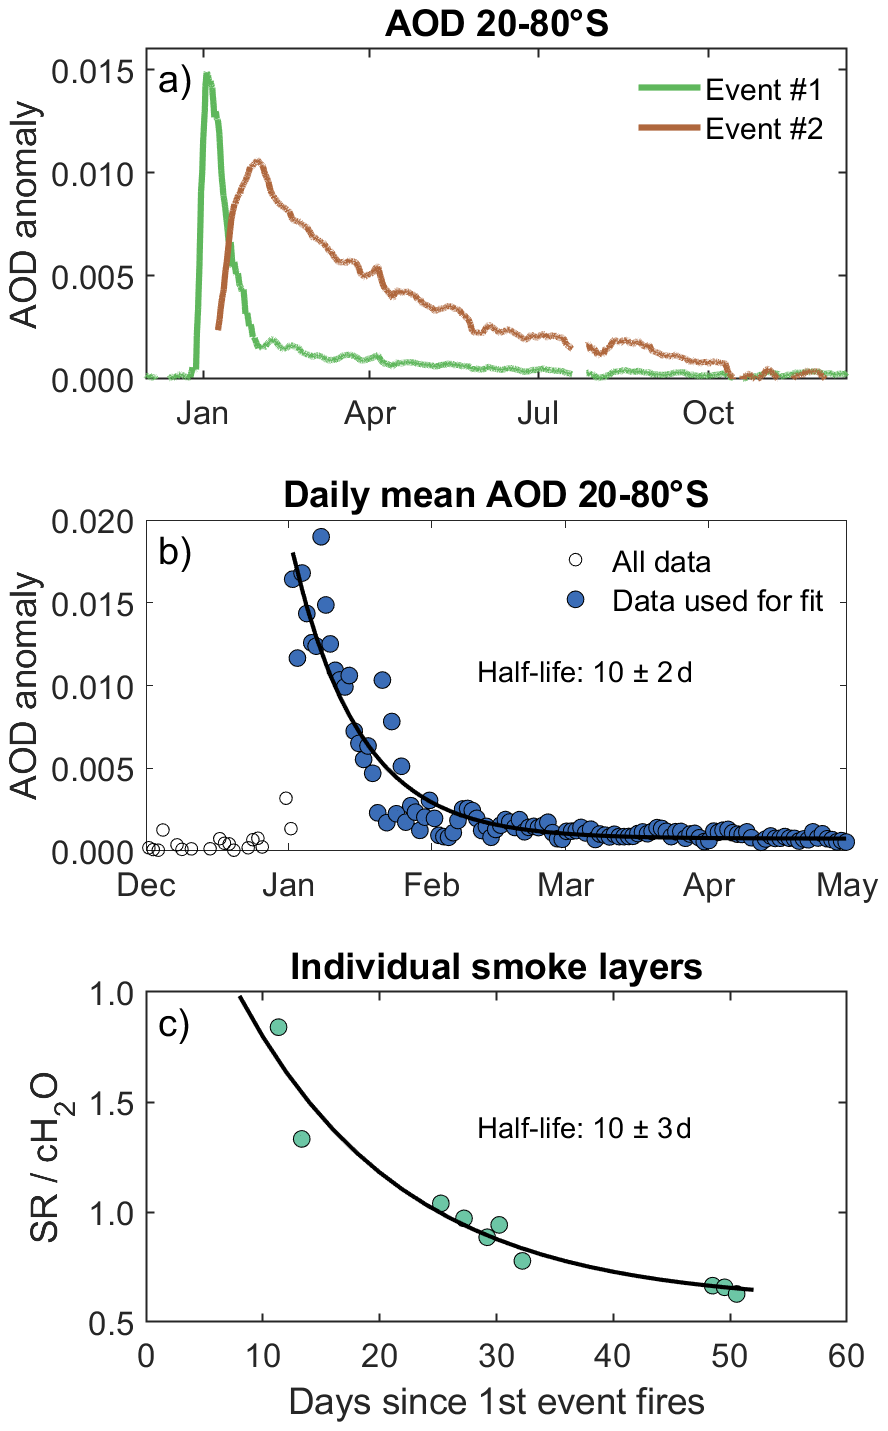
Figure 9Smoke decay in the stratosphere. (a) An 8 d running mean of the background-subtracted stratospheric zonal mean AOD at 20–80∘ S above 14 km altitude for the first and second events, respectively. (b) Daily means of background-subtracted AODs for the first event only and (c) smoke data from individual smoke layers from the dense, isolated smoke from the first event (scattering ratios, SRs, from CALIOP) normalized with water vapor concentrations (cH2O, from MLS). The exponential fits correspond to a smoke half-life of (b) 10±2 and (c) 10±3 d.
3.7 Decay rate of smoke
We present two estimates on the depletion rate of organics for smoke from the first event. Our first estimate is computed directly from the zonal mean smoke AOD (Fig. 9b), suggesting a smoke half-life of 10±2 d.
Our second estimate on the decay rate of the smoke from the first event is based on the CALIOP observations of individual smoke layers marked as circles in Fig. 7a. We normalized the smoke signal with the local water vapor concentrations to investigate the evolution of the smoke layer composition. Water data were derived from the satellite-borne microwave limb sounder (MLS). MLS and CALIOP ran in different orbits during the smoke observations, limiting the amount of collocated data to 10 occasions for comparison, which were spread out in three groups over the first 50 d. We used an exponential fit and computed a corresponding half-life of 10±3 d (Fig. 9c).
The two estimates of the decay rate (10±2 and 10±3 d) presented here are identical to the half-life observed for the stratospheric smoke after the 2017 North American fires (10±3 d; Martinsson et al., 2022).
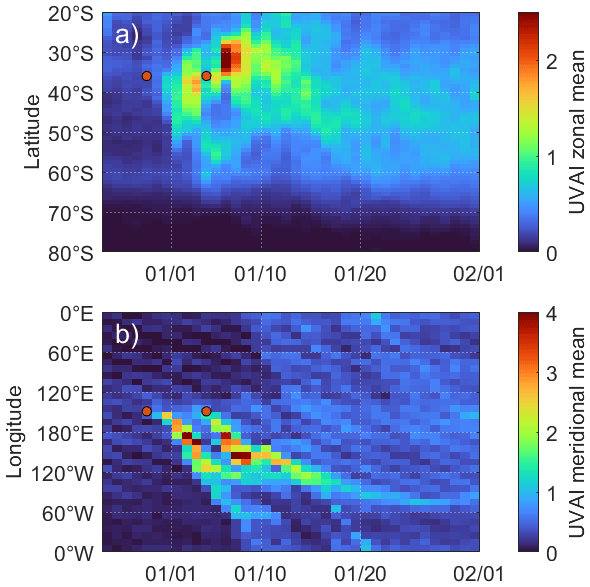
Figure 10Evolution of the UV aerosol index (UVAI) during the first weeks after the fire events for (a) zonal means and (b) meridional means. The locations and dates of the events are marked by orange dots. The lower UVAI range in (a) stems from the method of area weighting data.
3.8 Smoke transport into the stratosphere
Stratospheric smoke from the first event is shown on New Year's Eve (Fig. 1), 2 d after the first pyroCb formations from the event. Peterson et al. (2021) coupled this transport to pyroCbs. Hirsch and Koren (2021) argued that smoke injections to the stratosphere may have occurred in the first week of January via cross-tropopause transport by convective clouds south of the fire region (38∘ S), where the tropopause height is lower. From the first event we do not see evidence of extensive cross-tropopause transport beyond the initial pyroCb-caused smoke injections in the CALIOP data (Fig. 8 and Supplement). Furthermore, the temporal evolution in the UVAI (Fig. 10a) indicates that most of the smoke remained north of 40∘ S in the days following each fire event, when most of the UVAI was generated.
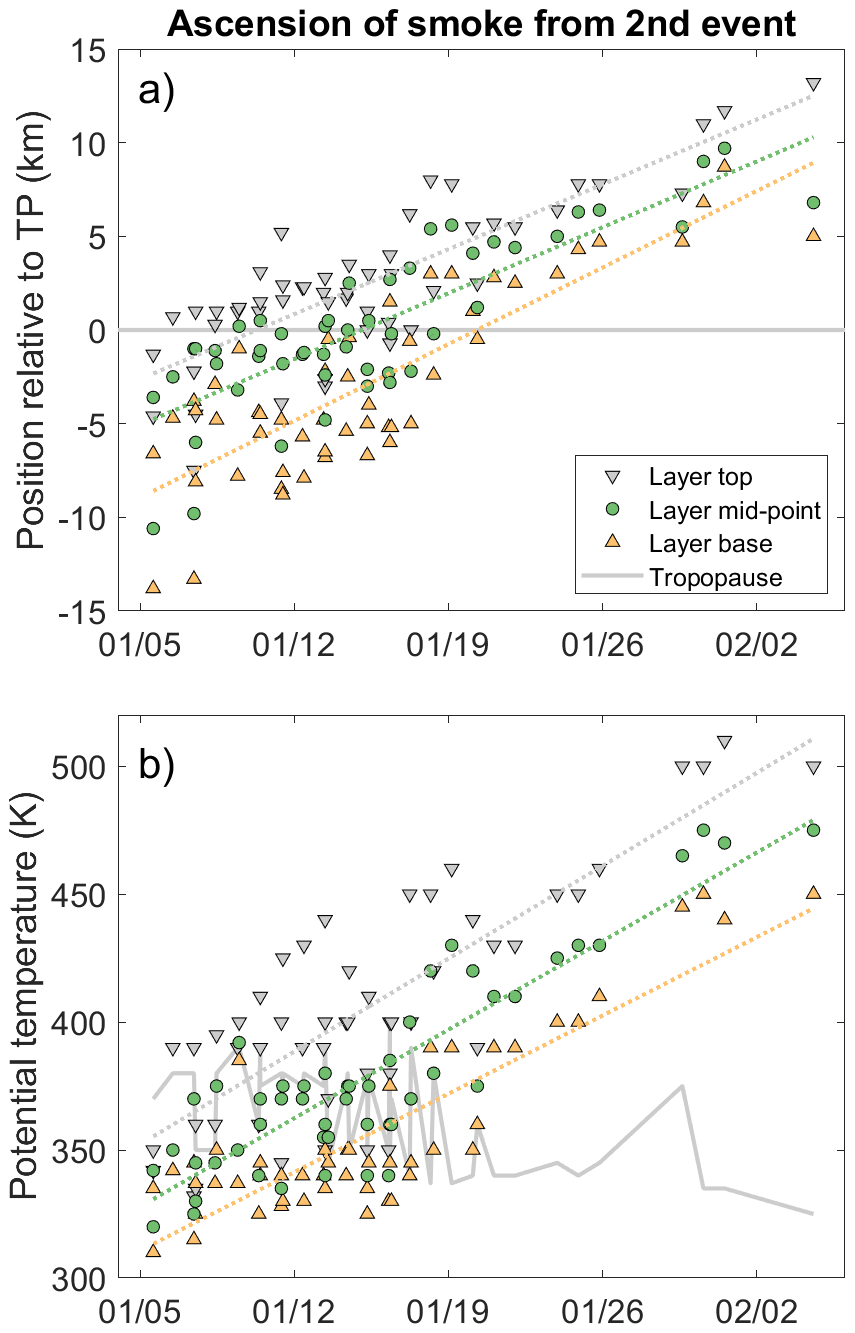
Figure 11Ascension of second event smoke layers for (a) smoke layer position relative to the tropopause (TP) and (b) smoke layer potential temperature. Circles mark the layer mid-points, downward- and upward-pointing triangles mark the layer tops and bases, and the grey solid line marks the tropopause. Data were retrieved from CALIOP nighttime curtain plots (see Supplement for further details), where layers with layer tops below 8 km were included in the graph. Dashed lines show regression lines for layer tops (grey), mid-points (green), and bases (yellow).
Magaritz-Ronen and Raveh-Rubin (2021) suggested that cyclones and isentropic cross-tropopause transport caused smoke transport to the stratosphere over the South Pacific Ocean in the first few days of January. This is to some extent in agreement with the UVAI (Fig. 10), which increased on 2–3 January at 140–180∘ W, 35–40∘ S, indicating upwards transport of smoke. However, the depolarization ratios during the first week of January do not indicate cloud formation connected to the smoke layers. Furthermore, CALIOP observations show that large amounts of smoke were present in the stratosphere several days before the suggested cyclonic transport, indicating that pyroCbs were the primary cause of the direct smoke transport to the stratosphere.
The second-event fires (4 January) positioned dense smoke layers in the mid-troposphere and upper troposphere (Fig. 2). Figure 11 illustrates CALIOP observations of an individual smoke layer's vertical position relative to the tropopause, including layer tops, mid-points, and bases. These three parameters all show a gradual transport of smoke from the troposphere to the stratosphere, occurring over the course of 1–2 weeks. Such transport could be caused either by self-lofting by radiation heating, by isentropic cross-tropopause transport, or by a combination of the two phenomena. We investigated potential self-lofting of smoke from the second event by studying the potential temperature of the smoke layers at their top, mid-point, and base (Fig. 11). The increasing potential temperature over time indicates that they were subject to self-lofting by radiation heating, thus following the rising trend in the stratosphere, as demonstrated in Fig. 7b, also in the upper troposphere. The continued addition of smoke, transported from the upper troposphere, most likely resulted in the second peak in the AOD (Fig. 5). Hence, we explain the bimodality in AOD as the combined effect of rapid decay of pyroCb-injected smoke, mostly from the first event, and slower self-lofting of tropospheric smoke from the second event.
3.9 Long-term impact of smoke
The second AOD peak does not show as rapid of a decay as the first one (Fig. 9a), likely due to depletion of organics during its long residence in the troposphere before the smoke from the second event entered the stratosphere. The AOD evolution (Fig. 9a) suggests cross-tropopause transport over the course of several weeks.
Our study indicates that smoke from the second event had a larger long-term impact on the stratosphere compared with the first event. It constituted 80 %–90 % of the smoke signal 6 months after injection to the stratosphere (Fig. 9a). Peterson et al. (2021) reported the opposite, namely that the first event injected 2–8 times more smoke than the second event did. Their study focused entirely on injections by pyroCbs. Our study indicates that additional processes, acting on smoke layers deposited in the upper troposphere by pyroCbs, were more important for the long-term stratospheric aerosol load than the direct smoke injection by pyroCbs. This is in part supported by Peterson et al. (2021), who reported more blowups and a larger area burnt for the second event. Smoke from the second event was likely already depleted by photolysis before entering the stratosphere and therefore more resistant to depletion by photochemical processing. Hence, the smoke from the second-event fires led to a more long-term impact on the stratospheric AOD and more climate cooling.
The Australian wildfires in December 2019–January 2020 caused the largest increase in stratospheric aerosol load in the southern extratropics since the large volcanic eruption of Mount Pinatubo in 1991. The long-term stratospheric AOD increase was more than 3 times that of the North American fires in August 2017, and since Mount Pinatubo it has only been matched by the Sarychev (2009) and Raikoke (2019) eruptions.
The AOD showed a bimodal peak in the first weeks, likely caused by the combined effect of multiple additions of smoke to the stratosphere together with photolytic loss of organics in the smoke. Smoke was added to the stratosphere from two events. The first event of the fires (starting 29 December) formed pyroCbs that injected smoke directly into the stratosphere. PyroCbs from the second event (4 January) injected less smoke to the stratosphere but added large amounts of smoke to the upper troposphere. The stratospheric aerosol load increased rapidly, forming the first peak 1.5 weeks after the first pyroCb injections of smoke. The AOD then dropped rapidly, likely due to aerosol depletion by photolytic loss. Upper-tropospheric smoke from the second event was transported to the stratosphere gradually during the course of 1–2 weeks, beginning more than a week after the fire, causing a second peak in the AOD.
We find evidence of photochemical depletion of organics in the smoke, similar to our recent findings after the 2017 North American fires. The half-life of smoke injected directly to the stratosphere was estimated from the zonal mean AOD (10±2 d) as well as from compositional observations (10±3 d). These estimates are almost identical to our previous estimate of the smoke half-life from the North American fires in 2017 (10±3 d, Martinsson et al., 2022). This indicates that organic depletion is a commonly occurring phenomenon in wildfire smoke. Further, the rapid decay rate implies that photolytic loss is very important regarding the removal of organic aerosol in the atmosphere. The rapid depletion of smoke from the first event leads to a small long-term impact on the stratospheric aerosol load.
Smoke from the second event constituted most of the long-term impact on the stratospheric aerosol load. This was also the stronger of the two events according to the UVAI. Stratospheric smoke AOD from the second-event fires decreased slowly, and its morphology indicates chemical processing in the troposphere before entering the stratosphere. Particle properties (lower particle depolarization ratios) for this smoke, compared with smoke from the first-event fires, suggest that the BC agglomerates collapsed to a more spherical state before entering the stratosphere. The particle residues remained in the stratosphere for up to a year.
The smoke injections from the Australian fires were larger than reported in previous work and caused the largest increase in the Southern Hemisphere stratospheric aerosol load since the Mount Pinatubo eruption. We argue that wildfire smoke has become an important part of the stratospheric aerosol, with climate impact comparable to moderately sized volcanic eruptions. Wildfires are in part natural and in part caused by humans. Future fires are projected to become more intense and frequent due to climate change. Hence, the climate impact of stratospheric wildfire smoke must not be neglected in future climate projections.
CALIOP v4.10 and 4.11 lidar data are open-access products (https://search.earthdata.nasa.gov/search?fp=CALIPSO, Hostetler et al., 2006). OMPS-LP aerosol extinction coefficients (Taha et al., 2020) were accessed via https://doi.org/10.5067/CX2B9NW6FI27. The OMPS-NM v2.1 UV aerosol index (Torres, 2019) was obtained from https://doi.org/10.5067/40L92G8144IV and https://disc.gsfc.nasa.gov/datasets/OMPS_NPP_LP_L2_AER_DAILY_2/summary. H2O data from MLS were obtained from https://doi.org/10.5067/Aura/MLS/DATA2508 (Lambert et al., 2020).
The supplement related to this article is available online at: https://doi.org/10.5194/acp-23-12557-2023-supplement.
JF designed the study, performed most of the data analysis, and wrote most of the paper. BGM undertook data analysis on individual smoke layers and wrote part of the Methods section. MKS produced the Supplement. All authors contributed to discussions and commented on the manuscript.
The contact author has declared that none of the authors has any competing interests.
Publisher’s note: Copernicus Publications remains neutral with regard to jurisdictional claims in published maps and institutional affiliations.
This research has been supported by the Svenska Forskningsrådet Formas (grant nos. 2018-00973 and 2020-00997) and the Swedish National Space Agency (grant no. 2022-00157).
This paper was edited by Matthias Tesche and reviewed by Michael Fromm and one anonymous referee.
Abram, N. J., Henley, B. J., Gupta, A. sen, Lippmann, T. J. R., Clarke, H., Dowdy, A. J., Sharples, J. J., Nolan, R. H., Zhang, T., Wooster, M. J., Wurtzel, J. B., Meissner, K. J., Pitman, A. J., Ukkola, A. M., Murphy, B. P., Tapper, N. J., and Boer, M. M.: Connections of climate change and variability to large and extreme forest fires in southeast Australia, Comm. Earth Environ., 2, 8, https://doi.org/10.1038/s43247-020-00065-8, 2021.
Andersson, S. M., Martinsson, B. G., Friberg, J., Brenninkmeijer, C. A. M., Rauthe-Schöch, A., Hermann, M., van Velthoven, P. F. J., and Zahn, A.: Composition and evolution of volcanic aerosol from eruptions of Kasatochi, Sarychev and Eyjafjallajökull in 2008–2010 based on CARIBIC observations, Atmos. Chem. Phys., 13, 1781–1796, https://doi.org/10.5194/acp-13-1781-2013, 2013.
Andersson, S. M., Martinsson, B. G., Vernier, J. P., Friberg, J., Brenninkmeijer, C. A. M., Hermann, M., van Velthoven, P. F. J., and Zahn, A.: Significant radiative impact of volcanic aerosol in the lowermost stratosphere, Nat. Commun., 6, 1–8, https://doi.org/10.1038/ncomms8692, 2015.
Baars, H., Ansmann, A., Ohneiser, K., Haarig, M., Engelmann, R., Althausen, D., Hanssen, I., Gausa, M., Pietruczuk, A., Szkop, A., Stachlewska, I. S., Wang, D., Reichardt, J., Skupin, A., Mattis, I., Trickl, T., Vogelmann, H., Navas-Guzmán, F., Haefele, A., Acheson, K., Ruth, A. A., Tatarov, B., Müller, D., Hu, Q., Podvin, T., Goloub, P., Veselovskii, I., Pietras, C., Haeffelin, M., Fréville, P., Sicard, M., Comerón, A., Fernández García, A. J., Molero Menéndez, F., Córdoba-Jabonero, C., Guerrero-Rascado, J. L., Alados-Arboledas, L., Bortoli, D., Costa, M. J., Dionisi, D., Liberti, G. L., Wang, X., Sannino, A., Papagiannopoulos, N., Boselli, A., Mona, L., D'Amico, G., Romano, S., Perrone, M. R., Belegante, L., Nicolae, D., Grigorov, I., Gialitaki, A., Amiridis, V., Soupiona, O., Papayannis, A., Mamouri, R.-E., Nisantzi, A., Heese, B., Hofer, J., Schechner, Y. Y., Wandinger, U., and Pappalardo, G.: The unprecedented 2017–2018 stratospheric smoke event: decay phase and aerosol properties observed with the EARLINET, Atmos. Chem. Phys., 19, 15183–15198, https://doi.org/10.5194/acp-19-15183-2019, 2019.
Boer, M. M., Resco de Dios, V., and Bradstock, R. A.: Unprecedented burn area of Australian mega forest fires, Nat. Clim. Change, 10, 171–172, https://doi.org/10.1038/s41558-020-0716-1, 2020.
Boone, C. D., Bernath, P. F., Labelle, K., and Crouse, J.: Stratospheric Aerosol Composition Observed by the Atmospheric Chemistry Experiment Following the 2019 Raikoke Eruption, J. Geophys. Res.-Atmos., 127, e2022JD036600, https://doi.org/10.1029/2022JD036600, 2022.
Das, S., Colarco, P. R., Oman, L. D., Taha, G., and Torres, O.: The long-term transport and radiative impacts of the 2017 British Columbia pyrocumulonimbus smoke aerosols in the stratosphere, Atmos. Chem. Phys., 21, 12069–12090, https://doi.org/10.5194/acp-21-12069-2021, 2021.
Fan, M., Chen, L., Li, S., Zou, M., Su, L., and Tao, J.: The effects of morphology and water coating on the optical properties of soot aggregates, Aerosol Air Qual. Res., 16, 1315–1326, https://doi.org/10.4209/aaqr.2015.04.0250, 2016.
Friberg, J., Martinsson, B. G., Andersson, S. M., Brenninkmeijer, C. A. M., Hermann, M., van Velthoven, P. F. J., and Zahn, A.: Sources of increase in lowermost stratospheric sulphurous and carbonaceous aerosol background concentrations during 1999-2008 derived from CARIBIC flights, Tellus B, 66, 23428, https://doi.org/10.3402/tellusb.v66.23428, 2014.
Friberg, J., Martinsson, B. G., Andersson, S. M., and Sandvik, O. S.: Volcanic impact on the climate – the stratospheric aerosol load in the period 2006–2015, Atmos. Chem. Phys., 18, 11149–11169, https://doi.org/10.5194/acp-18-11149-2018, 2018.
Fromm, M., Alfred, J., Hoppel, K., Hornstein, J., Bevilacqua, R., Shettle, E., Servranckx, R., Li, Z., and Stocks, B.: Observations of Boreal forest fire smoke in the stratosphere by POAM III, SAGE II, and lidar in 1998, Geophys. Res. Lett., 27, 1407–1410, https://doi.org/10.1029/1999GL011200, 2000.
Fromm, M. D. and Servranckx, R.: Transport of forest fire smoke above the tropopause by supercell convection, Geophys. Res. Lett., 30, 1542, https://doi.org/10.1029/2002GL016820, 2003.
Fromm, M., Kablick, G., Nedoluha, G., Carboni, E., Grainger, R., Campbell, J., and Lewis, J.: Correcting the record of volcanic stratospheric aerosol impact: Nabro and Sarychev Peak, J. Geophys. Res., 119, 10343–10364, https://doi.org/10.1002/2014JD021507, 2014.
Garofalo, L. A., Pothier, M. A., Levin, E. J. T., Campos, T., Kreidenweis, S. M., and Farmer, D. K.: Emission and Evolution of Submicron Organic Aerosol in Smoke from Wildfires in the Western United States, ACS Earth Space Chem., 3, 1237-−1247, https://doi.org/10.1021/acsearthspacechem.9b00125, 2019.
Haarig, M., Ansmann, A., Baars, H., Jimenez, C., Veselovskii, I., Engelmann, R., and Althausen, D.: Depolarization and lidar ratios at 355, 532, and 1064 nm and microphysical properties of aged tropospheric and stratospheric Canadian wildfire smoke, Atmos. Chem. Phys., 18, 11847–11861, https://doi.org/10.5194/acp-18-11847-2018, 2018.
Hirsch, E. and Koren, I.: Record-breaking aerosol levels explained by smoke injection into the stratosphere, Science, 371, 1269–1274, https://doi.org/10.1126/science.abe1415, 2021.
Hodzic, A., Madronich, S., Kasibhatla, P. S., Tyndall, G., Aumont, B., Jimenez, J. L., Lee-Taylor, J., and Orlando, J.: Organic photolysis reactions in tropospheric aerosols: effect on secondary organic aerosol formation and lifetime, Atmos. Chem. Phys., 15, 9253–9269, https://doi.org/10.5194/acp-15-9253-2015, 2015.
Hostetler, C. A., Liu, Z., Reagan, J., Vaughan, M., Winker, D., Osborn, M., Hunt, W. H., Powell, K. A., and Trepte, C.: CALIOP algorithm theoretical basis document part 1: Calibration and level 1 data products, [data set], https://www-calipso.larc.nasa.gov/resources/pdfs/PC-SCI-201v1.0.pdf (last access: October 2022), 2006.
Kablick, G. P., Allen, D. R., Fromm, M. D., and Nedoluha, G. E.: Australian PyroCb Smoke Generates Synoptic-Scale Stratospheric Anticyclones, Geophys. Res. Lett., 47, e2020GL08810, https://doi.org/10.1029/2020GL088101, 2020.
Khaykin, S., Legras, B., Bucci, S., Sellitto, P., Isaksen, L., Tencé, F., Bekki, S., Bourassa, A., Rieger, L., Zawada, D., Jumelet, J., and Godin-Beekmann, S.: The 2019/20 Australian wildfires generated a persistent smoke-charged vortex rising up to 35 km altitud, Commun. Earth Environ., 1, 22, https://doi.org/10.1038/s43247-020-00022-5, 2020.
Khaykin, S. M., Godin-Beekmann, S., Hauchecorne, A., Pelon, J., Ravetta, F., and Keckhut, P.: Stratospheric Smoke With Unprecedentedly High Backscatter Observed by Lidars Above Southern France, Geophys. Res. Lett., 45, 1639–1646, https://doi.org/10.1002/2017GL076763, 2018.
Kloss, C., Berthet, G., Sellitto, P., Ploeger, F., Taha, G., Tidiga, M., Eremenko, M., Bossolasco, A., Jégou, F., Renard, J.-B., and Legras, B.: Stratospheric aerosol layer perturbation caused by the 2019 Raikoke and Ulawun eruptions and their radiative forcing, Atmos. Chem. Phys., 21, 535–560, https://doi.org/10.5194/acp-21-535-2021, 2021.
Knepp, T. N., Thomason, L., Kovilakam, M., Tackett, J., Kar, J., Damadeo, R., and Flittner, D.: Identification of smoke and sulfuric acid aerosol in SAGE III/ISS extinction spectra, Atmos. Meas. Tech., 15, 5235–5260, https://doi.org/10.5194/amt-15-5235-2022, 2022.
Kremser, S., Thomason, L. W., von Hobe, M., Hermann, M., Deshler, T., Timmreck, C., Toohey, M., Stenke, A., Schwarz, J. P., Weigel, R., Fueglistaler, S., Prata, F. J., Vernier, J. P., Schlager, H., Barnes, J. E., Antuña-Marrero, J. C., Fairlie, D., Palm, M., Mahieu, E., and Meland, B.: Stratospheric aerosol – Observations, processes, and impact on climate, Rev. Geophys., 54, 278–335, https://doi.org/10.1002/2015RG000511, 2016.
Lambert, A., Read, W., and Livesey, N.: MLS/Aura Level 2 Water Vapor (H2O) Mixing Ratio V005, Greenbelt, MD, USA, Goddard Earth Sciences Data and Information Services Center (GESDISC), [data set], https://doi.org/10.5067/Aura/MLS/DATA2508, 2020.
Lestrelin, H., Legras, B., Podglajen, A., and Salihoglu, M.: Smoke-charged vortices in the stratosphere generated by wildfires and their behaviour in both hemispheres: comparing Australia 2020 to Canada 2017, Atmos. Chem. Phys., 21, 7113–7134, https://doi.org/10.5194/acp-21-7113-2021, 2021.
Livesey, N. J., Read, W. G., Wagner, P. A., Froidevaux, L., Santee, M. L., Schwartz, M. J., Lambert, A., Manney, G. L., Valle, L. F. M., Pumphrey, H. C., Fuller, R. A., Jarnot, R. F., Knosp, B. W., and Lay, R. R.: EOS MLS Version 5.0x Level 2 and 3 data quality and description document, Tech. Rep., Jet Propulsion Laboratory D734 105336 Rev. A, https://mls.jpl.nasa.gov/publications (last access: May 2021), 2020.
Lurton, T., Jégou, F., Berthet, G., Renard, J.-B., Clarisse, L., Schmidt, A., Brogniez, C., and Roberts, T. J.: Model simulations of the chemical and aerosol microphysical evolution of the Sarychev Peak 2009 eruption cloud compared to in situ and satellite observations, Atmos. Chem. Phys., 18, 3223–3247, https://doi.org/10.5194/acp-18-3223-2018, 2018.
Magaritz-Ronen, L. and Raveh-Rubin, S.: Wildfire Smoke Highlights Troposphere-to-Stratosphere Pathway, Geophys. Res. Lett., 48, e2021GL095848, https://doi.org/10.1029/2021GL095848, 2021.
Martinsson, B. G., Brenninkmeijer, C. A. M., Cam, S. A., Hermann, M., Heue, K. P., van Velthoven, P. F. J., and Zahn, A.: Influence of the 2008 Kasatochi volcanic eruption on sulfurous and carbonaceous aerosol constituents in the lower stratosphere, Geophys. Res. Lett., 36, 1–5, https://doi.org/10.1029/2009GL038735, 2009.
Martinsson, B. G., Friberg, J., Sandvik, O. S., Hermann, M., van Velthoven, P. F. J., and Zahn, A.: Formation and composition of the UTLS aerosol. Npj Climate and Atmospheric Science. https://doi.org/10.1038/s41612-019-0097-1, 2019.
Martinsson, B. G., Friberg, J., Sandvik, O. S., and Sporre, M. K.: Five-satellite-sensor study of the rapid decline of wildfire smoke in the stratosphere, Atmos. Chem. Phys., 22, 3967–3984, https://doi.org/10.5194/acp-22-3967-2022, 2022.
Molina, M. J., Ivanov, A. V., Trakhtenberg, S., and Molina, L. T.: Atmospheric evolution of organic aerosol, Geophys. Res. Lett., 31, L22104, https://doi.org/10.1029/2004GL020910, 2004.
Ohneiser, K., Ansmann, A., Chudnovsky, A., Engelmann, R., Ritter, C., Veselovskii, I., Baars, H., Gebauer, H., Griesche, H., Radenz, M., Hofer, J., Althausen, D., Dahlke, S., and Maturilli, M.: The unexpected smoke layer in the High Arctic winter stratosphere during MOSAiC 2019–2020, Atmos. Chem. Phys., 21, 15783–15808, https://doi.org/10.5194/acp-21-15783-2021, 2021.
Ohneiser, K., Ansmann, A., Witthuhn, J., Deneke, H., Chudnovsky, A., Walter, G., and Senf, F.: Self-lofting of wildfire smoke in the troposphere and stratosphere: simulations and space lidar observations, Atmos. Chem. Phys., 23, 2901–2925, https://doi.org/10.5194/acp-23-2901-2023, 2023.
Peterson, D. A., Campbell, J. R., Hyer, E. J., Fromm, M. D., Kablick, G. P., Cossuth, J. H., and DeLand, M. T.: Wildfire-driven thunderstorms cause a volcano-like stratospheric injection of smoke, Npj Clim. Atmos., 1, 30, Sci., https://doi.org/10.1038/s41612-018-0039-3, 2018.
Peterson, D. A., Fromm, M. D., McRae, R. H. D., Campbell, J. R., Hyer, E. J., Taha, G., Camacho, C. P., Kablick, G. P., Schmidt, C. C., and DeLand, M. T.: Australia's Black Summer pyrocumulonimbus super outbreak reveals potential for increasingly extreme stratospheric smoke events, Npj Clim. Atmos. Sci., 4, 38 https://doi.org/10.1038/s41612-021-00192-9, 2021.
Rieger, L. A., Bourassa, A. E., and Degenstein, D. A.: Merging the OSIRIS and SAGE II stratospheric aerosol records, J. Geophys. Res., 120, 8890–8904, https://doi.org/10.1002/2015JD023133, 2015.
Sareen, N., Moussa, S. G., and McNeill, V. F.: Photochemical aging of light-absorbing secondary organic aerosol material, J. Phys. Chem. A., 117, 2987–2996 https://doi.org/10.1021/jp309413j, 2013.
Solomon, S., Daniel, J. S., Neely, R. R., Vernier, J.-P., Dutton, E. G., and Thomason, L. W.: The Persistently Variable “Background” Stratospheric Aerosol Layer and Global Climate Change, Science, 333, 866–870, https://doi.org/10.1126/science.1206027, 2011.
Taha, G.: OMPS-NPP L2 LP Aerosol Extinction Vertical Profile swath daily 3slit V2, Greenbelt, MD, USA, Goddard Earth Sciences Data and Information Services Center (GES DISC), [data set], https://doi.org/10.5067/CX2B9NW6FI27, 2020.
Taha, G., Loughman, R., Zhu, T., Thomason, L., Kar, J., Rieger, L., and Bourassa, A.: OMPS LP Version 2.0 multi-wavelength aerosol extinction coefficient retrieval algorithm, Atmos. Meas. Tech., 14, 1015–1036, https://doi.org/10.5194/amt-14-1015-2021, 2021.
Thomason, L. W., Ernest, N., Millán, L., Rieger, L., Bourassa, A., Vernier, J.-P., Manney, G., Luo, B., Arfeuille, F., and Peter, T.: A global space-based stratospheric aerosol climatology: 1979–2016, Earth Syst. Sci. Data, 10, 469–492, https://doi.org/10.5194/essd-10-469-2018, 2018.
Torres, O.: OMPS-NPP L2 NM Aerosol Index swath orbital V2, Greenbelt, MD, USA, Goddard Earth Sciences Data and Information Services Center (GES DISC), [data set], https://doi.org/10.5067/40L92G8144IV, 2019.
Vernier, J. P., Thomason, L. W., Pommereau, J. P., Bourassa, A., Pelon, J., Garnier, A., Hauchecorne, A., Blanot, L., Trepte, C., Degenstein, D., and Vargas, F.: Major influence of tropical volcanic eruptions on the stratospheric aerosol layer during the last decade, Geophys. Res. Lett., 38, 1–8, https://doi.org/10.1029/2011GL047563, 2011.
Yu, P., Toon, O. B., Bardeen, C. G., Zhu, Y., Rosenlof, K. H., Portmann, R. W., Thornberry, T. D., Gao, R. S., Davis, S. M., Wolf, E. T., de Gouw, J., Peterson, D. A., Fromm, M. D., and Robock, A.: Black carbon lofts wildfire smoke high into the stratosphere to form a persistent plume, Science, 365, 587–590, https://doi.org/10.1126/science.aax1748, 2019.
Zawadowicz, M. A., Lee, B. H., Shrivastava, M., Zelenyuk, A., Zaveri, R. A., Flynn, C., Thornton, J. A., and Shilling, J. E.: Photolysis Controls Atmospheric Budgets of Biogenic Secondary Organic Aerosol, Environ. Sci. Technol., 54, 3861-−3870, https://doi.org/10.1021/acs.est.9b07051, 2020.
Zhang, R., Khalizov, A. F., Pagels, J., Zhang, D., Xue, H., and McMurry, P. H.: Variability in morphology, hygroscopicity, and optical properties of soot aerosols during atmospheric processing, P. Natl. Acad. Sci. USA, 105, , 10291–10296 https://doi.org/10.1073/pnas.0804860105, 2008.