the Creative Commons Attribution 4.0 License.
the Creative Commons Attribution 4.0 License.
 | 23 Jan 2023
Measurement report: Intensive biomass burning emissions and rapid nitrate formation drive severe haze formation in the Sichuan Basin, China – insights from aerosol mass spectrometry
Zhier Bao
Xinyi Zhang
Qing Li
Jiawei Zhou
Guangming Shi
Li Zhou
Fumo Yang
Shaodong Xie
Dan Zhang
Chongzhi Zhai
Zhenliang Li
Chao Peng
Haze pollution is a severe environmental problem, caused by elevation of fine particles (aerodynamic diameter <2.5 µm, PM2.5), which is related to secondary aerosol formation, unfavourable synoptic conditions and regional transport, etc. The regional haze formation in basin areas, along with intensive emission of precursors, high relative humidity and poor dispersion conditions, is still limitedly understood. In this study, a field campaign was conducted to investigate the factors resulting in haze formation in the Sichuan Basin (SCB) during winter in 2021. The fine aerosol chemical composition was characterised using a time-of-flight aerosol chemical speciation monitor (ToF-ACSM), which also provided detailed information on the sources for organic aerosols (OAs). The average concentration of non-refractory fine particles (NR-PM2.5) was 98.5±38.7 µg m−3, and organics aerosols, nitrate, sulfate, ammonium and chloride took up 40.3 %, 28.8 %, 10.6 %, 15.3 % and 5.1 % of PM2.5. Three factors, including a hydrocarbon-like OA (HOA), a biomass burning OA (BBOA) and an oxygenated OA (OOA), were identified by applying the positive matrix factorisation (PMF) analysis, and they constituted 24.2 %, 24.2 % and 51.6 % of OA on average, respectively. Nitrate formation was promoted by gas-phase and aqueous-phase oxidation, while sulfate was mainly formed through aqueous-phase process. OOA showed strong dependence on Ox, demonstrating the contribution of photooxidation to OOA formation. OOA concentration increased as aerosol liquid water content (ALWC) increased within 200 µg m−3 and kept relatively constant when ALWC >200 µg m−3, suggesting the insignificant effect of aqueous-phase reactions on OOA formation. Among the three haze episodes identified during the whole campaign, the driving factors were different: the first haze episode (H1) was driven by nitrate formation through photochemical and aqueous-phase reactions, and the second haze episode (H2) was mainly driven by the intense emission of primary organic aerosols from biomass burning and vehicle exhaust, while the third haze episode (H3) was mainly driven by reactions involving nitrate formation and biomass burning emission. HOA and BBOA were scavenged, while OOA, nitrate and sulfate formation was enhanced by aqueous-phase reactions during fog periods, which resulted in the increase of O:C from pre-fog to post-fog periods. This study revealed the factors driving severe haze formation in the SCB and implied the benefit of controlling nitrate as well as intense biomass burning and vehicle exhaust emission for the mitigation of heavy aerosol pollution in this region.
- Article
(3644 KB) - Full-text XML
-
Supplement
(1780 KB) - BibTeX
- EndNote


Although a series of emission reduction strategies have been implemented to mitigate severe haze pollution for over a decade in China, fine particle (particulate matter with aerodynamic diameter less than 2.5 µm, PM2.5) pollution events still occurred, especially during autumn and winter (Ding et al., 2019; Zhao et al., 2020; Yan et al., 2020). Haze formation was affected by the intense emission of primary particles, rapid formation of secondary aerosols, stagnant meteorological conditions and topography. The interplay among these factors usually makes haze formation complex (Bao et al., 2019; Guo et al., 2014; Zheng et al., 2015), which resulted in difficulties in making air pollution mitigation strategies.
Many studies showed that the rapid increase of secondary aerosols (including secondary inorganic and organic aerosols, i.e. SIAs and SOAs) played an important role in haze formation (Huang et al., 2014; Wu et al., 2022). Nitrate, sulfate and ammonium, mainly formed through photochemical oxidation and aqueous-phase reactions in the atmosphere, were the major components of SIA. Previous studies demonstrated that the substantial formation of nitrate and sulfate exacerbated severe haze development (Wang et al., 2020; Liu et al., 2020). For example, Zheng et al. (2016) investigated the factors driving haze formation in Beijing in 2013, and the results showed that the enhanced production of sulfate and nitrate led to their increased contribution to PM2.5 as the pollution level increased, while the contribution of organic matter (OM) decreased. The emission of SO2 has been reduced dramatically over the past 10 years in China; however, NOx did not show a significant reduction (Zhou et al., 2021; Liu et al., 2019). Thus, the haze formation has been found to be mainly driven by the reactions generating nitrate in recent years (Fu et al., 2020; Li et al., 2018; Zhai et al., 2021).
Compared to SIA, the formation process of SOA was more complicated (Chen et al., 2017). For instance, SOA could be formed through the gas-phase photooxidation of volatile organic compounds (VOCs), which was affected by temperature, relative humidity (RH) and total organic aerosol mass loadings (Clark et al., 2016; Hinks et al., 2018; Donahue et al., 2006). SOA could also be formed through the oxidation of water-soluble VOCs or organic products of gas-phase photochemistry, which was observed in the field and laboratory studies (T. Liu et al., 2018; Chen et al., 2015). In addition, the ageing of primary organic aerosols (POAs) by oxidants in the atmosphere also contributed to SOA (Wang et al., 2021; Gilardoni et al., 2016). For instance, the organic aerosols emitted from biomass burning were oxidised through the photochemical oxidation process driven by OH radicals, which might take place in both gas and aqueous phases (Paglione et al., 2020). The variations of regional and seasonal emissions might also affect the formation of SOA (Dai et al., 2019; Sun et al., 2016b). Thus, it is of vital importance to consider various factors when investigating SOA formation.
Similar to city clusters such as Beijing, Shanghai and Guangzhou in the North China Plain (NCP), Yangtze River Delta (YRD) and Pearl River Delta (PRD), the Chengdu–Chongqing city cluster, located in the Sichuan Basin (SCB) in Southwest China, is also suffering severe haze pollution (Tao et al., 2017; Tan et al., 2019). Many efforts have been made to investigate the temporal variation, chemical composition and formation mechanism of PM2.5 during the evolution of haze episodes in the NCP, YRD and PRD (Peng et al., 2021; Sun et al., 2016a; Zhang et al., 2015; Yan et al., 2020), whereas only a few studies focused on the factors resulting in haze formation in the SCB (Zhang et al., 2019; Song et al., 2019). These studies mainly focused on the formation of inorganic species in PM2.5, and the results showed that the rapid formation of SIA under high-RH conditions promoted the increase of PM2.5. However, further studies on the characteristics of OA, including the temporal evolution, sources and formation pathways, are still lacking.
The area of SCB is ∼260 000 km2, and its population is ∼110 million, making it an important developing region in Southwest China. The basin is a subtropical expanse of low hills and plains and is completely encircled by high mountains and plateaus, which is unfavourable for either horizontal transport or vertical diffusion. The atmosphere in the SCB was characterised by persistently high relative humidity and low wind speed all year round. The haze evolution in the SCB might be different from that in other regions due to its unique topography, meteorological conditions and emission sources, which remain unclear. Therefore, comprehensive studies are needed to reveal the key factors contributing to haze formation in the basin (Wang et al., 2018).
The time-of-flight aerosol chemical speciation monitor (ToF-ACSM) is a robust and highly sensitive instrument that provides real-time characterisation and composition of non-refractory PM1 PM2.5 (NR-PM1 PM2.5) depending on the type of the aerodynamic lens used (Liu et al., 2007; Xu et al., 2017a). Compared to the Aerodyne aerosol spectrometer (AMS), the ToF-ACSM is more compact and cheaper. However, the ToF-ACSM does not feature particle sizing. Compared to the quadrupole-ACSM (Q-ACSM), the ToF-ACSM has better mass resolution and detection limits (Fröhlich et al., 2013). Although the ToF-ACSM has not been widely deployed in field observations as the AMS/Q-ACSM has been in a number of different sites over China, it has successfully characterised the variation of PM1 PM2.5 and the sources of organic aerosols in the cities within the NCP, YRD and PRD (Ge et al., 2022; Sun et al., 2020; Guo et al., 2020). Despite this, few studies applied a Q/ToF-ACSM or AMS in the SCB. The responses of aerosol chemistry to meteorology and emissions therein remain poorly understood. To the authors' best knowledge, this is the first time that the ToF-ACSM has been deployed in the field observations within the SCB.
The present study aims to uncover the factors driving severe haze formation during winter in the SCB. The characteristics of NR-PM2.5, including mass concentration, chemical composition, and temporal and diurnal variation, were described in detail. The OA sources resolved through positive matrix factorisation (PMF) analysis and elemental composition were investigated to elucidate the possible ageing process of OA. The formation mechanism for SIA and SOA was also studied based on the dependencies of nitrate, sulfate and OOA with odd oxygen (Ox= O3+ NO2) and aerosol liquid water content. In addition, the evolution process of chemical composition and elemental composition was summarised during different haze and fog episodes to investigate the main factors exacerbating haze pollution. The data and results fill the knowledge gap on the factors affecting haze formation in the SCB and provide a scientific basis for future air pollutant mitigation strategies in this unique basin.
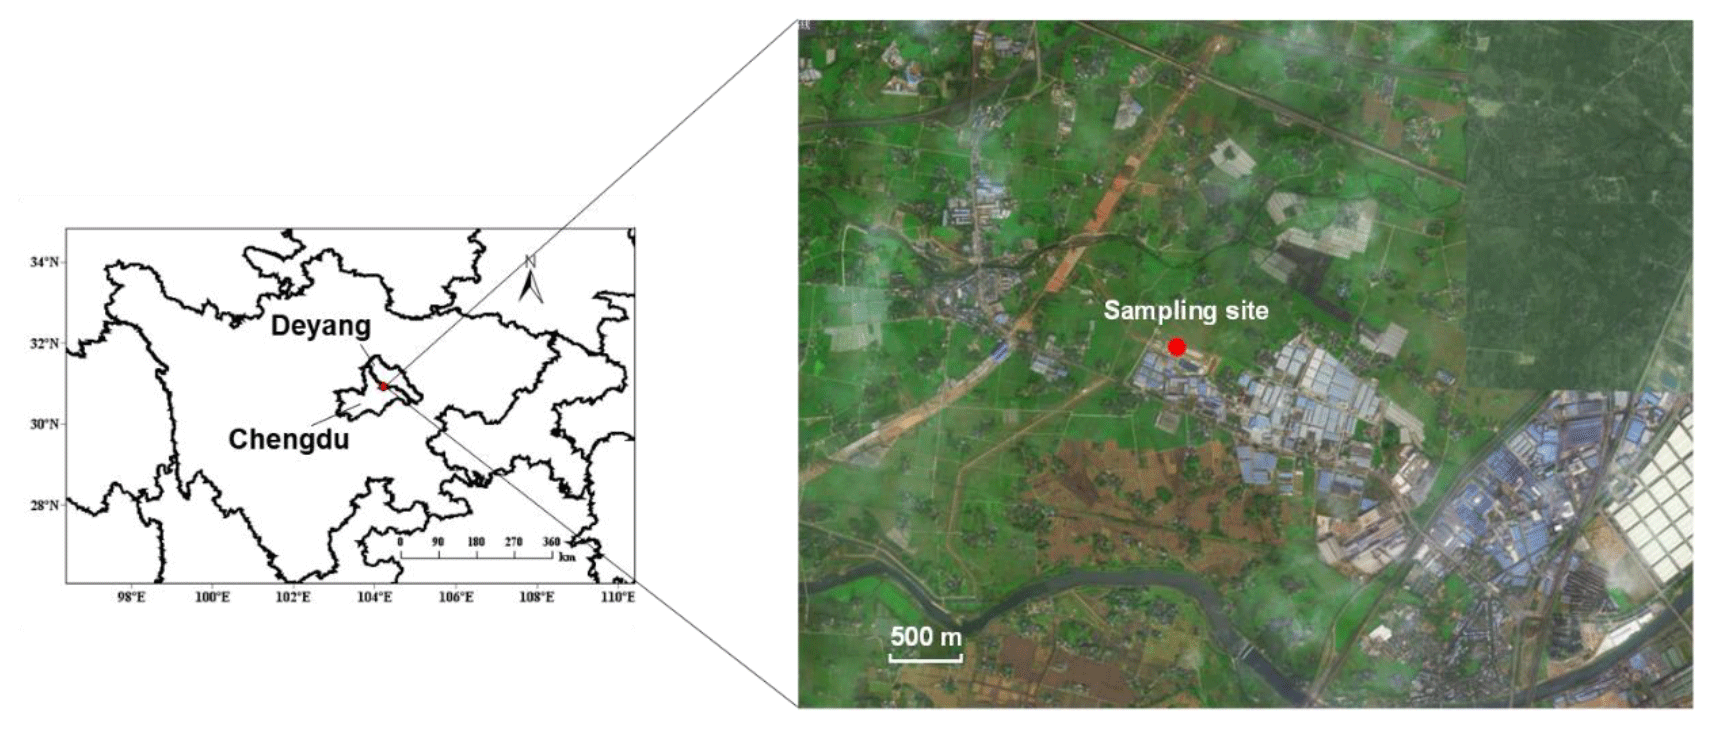
Figure 1Location of the observation site (from Baidu Maps, © Baidu – GS(2021)6026, 2022).
2.1 Sampling site
The field study was carried out from 18 December 2021 to 22 January 2022 at a site (30∘55′59′′ N, 104∘12′25′′ E) in Deyang, and the site was near the northern border of Chengdu, the capital of Sichuan Province, China (as shown in Fig. 1). The site was located in a typical suburban region surrounded by several food, aluminium alloy and building material factories. There was a main road ∼200 m south of the site. The north and west of the site were croplands and villages. Thus, the site was affected by traffic emissions, biomass burning and industrial pollutants. The study at this site helps to understand the characteristics of regional haze pollution and the influence of regional transport between urban and suburban areas on haze formation.
2.2 Instrumentation
During the campaign, the mass loadings of non-refractory organics, nitrate, sulfate, ammonium and chloride in PM2.5 were obtained online by a ToF-ACSM. The gaseous species, including NO, NO2, O3, SO2, CO and CO2, were continuously measured by Thermo gas analysers (model 43i, 49i, 42i, 48i and 410i). Meteorological parameters, including temperature (T), relative humidity (RH), solar radiation (SR), wind speed (WS) and wind direction (WD), were obtained by an automatic weather station (Luff WS501-UMB).
For the NR-PM2.5 measurement, ambient air was pumped into the sampling line via a vacuum pump, and the flow rate was maintained at 3 L min−1 with a mass flow controller. Before being sampled by the ToF-ACSM, the ambient air went through a PM2.5 cyclone (URG-2000-30ED, USA) to remove coarse particles, then it was dried by a Nafion dryer. The relative humidity of the air samples dried by the Nafion dryer usually ranged from ∼35 % to 46 % and could reach ∼56 % during fog events. The sampling line was assembled using in. stainless steel tubes coated with the sponge to prevent water condensation.
The working principle of the ToF-ACSM has been described in detail in previous studies (Ng et al., 2011b; Fröhlich et al., 2013). Briefly, a 100 µm critical orifice and an aerodynamic lens were settled in the front inlet system to focus the ambient particles into a concentrated and narrow beam with a flow rate of ∼0.084 L min−1. It should be mentioned that a PM2.5 lens was used during the whole campaign, which allowed the PM2.5 composition to be chemically characterised (Xu et al., 2017a).
The particle beam was transmitted through a vacuum chamber in which the gas-phase species were separated from the particle beam. At the end of the vacuum chamber, the particles were thermally vaporised at ∼600∘C by impacting on a resistively heated porous tungsten surface. There the non-refractory constituents in the particles flash-vaporise and are subsequently ionised by a 70 eV electron impact. Finally, the ions were extracted by a set of ion optics and detected by the time-of-flight mass spectrometer.
The ToF-ACSM was operated with a time resolution of 10 min, and it scanned from 10 to 219. The ionisation efficiency (IE) calibration was performed before and after the campaign according to the proposal of a previous study (Fröhlich et al., 2013). Briefly, the size-selected (350 nm) NH4NO3 particles, which were generated by an aerosol generator, were simultaneously sampled by the ToF-ACSM and a condensation particle counter (CPC 3775, TSI). Then, the IE can be determined by comparing the response of ToF-ACSM to the mass of ammonium nitrate. The relative ionisation efficiencies (RIEs) of sulfate and ammonium were also determined by sampling (NH4)2SO4 particles.
2.3 Data processing
2.3.1 ToF-ACSM data analysis
ToF-ACSM data analysis software (Tofware v2.5.13) written in Igor (Wavemetrics, Lake Oswego, OR, USA) was used to analyse the mass concentration and chemical composition. The IE value was 239 ions pg−1, and the RIEs for sulfate and ammonium were 1.05 and 3.6, respectively. For organics, nitrate and chloride, commonly used RIE values, i.e. 1.4, 1.1 and 1.3, were applied. The algorithm proposed by Middlebrook et al. (2012) to determine the collection efficiency (CE) of the ToF-ACSM was applied to quantify the aerosol species, as the acidity, chemical composition and phase state changed the particle bounce effects at the vaporiser (Matthew et al., 2008).
The triangle plots of f44 (ratio of 44 to total signal in the component mass spectrum) versus f43 (ratio of 43 to total signal in the component mass spectrum) and f44 versus f60 (ratio of 60 to total signal in the component mass spectrum) were applied to characterise the evolution of OA (Ng et al., 2010). The and were determined by the parameterisation proposed by Canagaratna et al. (2015).
2.3.2 PMF analysis
The mass spectrum data matrix of OA was analysed by the PMF Evaluation Tool (PET, v2.08D) (Paatero and Tapper, 1994; Ulbrich et al., 2009) in order to resolve distinct OA factors that might be representative of specific sources. The PMF-ACSM data processing was followed according to the procedures proposed previously (Ulbrich et al., 2009; Zhang et al., 2011). Due to the weak signal intensities, the ions with over 120 were not included in the analysis. Any ions with signal-to-noise () <0.2 were removed from the analysis, and the ions whose was 0.2–2 were down-weighted by increasing their errors calculations by a factor of 2 (Sun et al., 2011). Different PMF solutions were resolved by varying the factor number from 2 to 7. The solutions were evaluated by comparing the mass spectral profiles of the output secondary aerosol factors as a function of the rotational parameter (fpeak). Finally, a three-factor solution with fpeak = 0 was selected as our best solution. The comparison of the results for three to five-factor solutions is described in detail in Fig. S4 and Table S2 in the Supplement.
2.3.3 Identification of haze episodes
The haze episodes were defined by the daily PM2.5 mass concentration exceeding the Grade II National Ambient Air Quality Standard (AAQS) of 75 µg m−3 for 2 successive days (Wang et al., 2014). In the present study, we made some slight modifications to this definition following the procedure of Zheng et al. (2016). Briefly, the periods during which the 24 h moving average concentration of PM2.5 exceeds 75 µg m−3 for 2 successive days are regarded as episode candidates. If the hourly PM2.5 concentration during the first hour of an episode candidate is 50–75 µg m−3, then the episode has the shape of a “slow start”; if it is 0–50 µg m−3, then the episode has the shape of a “rapid start”. Similarly, the shape at the end of an episode candidate can also be identified. Haze episodes with a slow start typically arise from the gradual accumulation of pollutants emitted both locally and regionally under unfavourable meteorological conditions, while haze episodes with a rapid start are most likely related to regional transport (Zheng et al., 2015). Haze episodes having a “slow end” usually resulted from the gradual scavenging of pollutants.
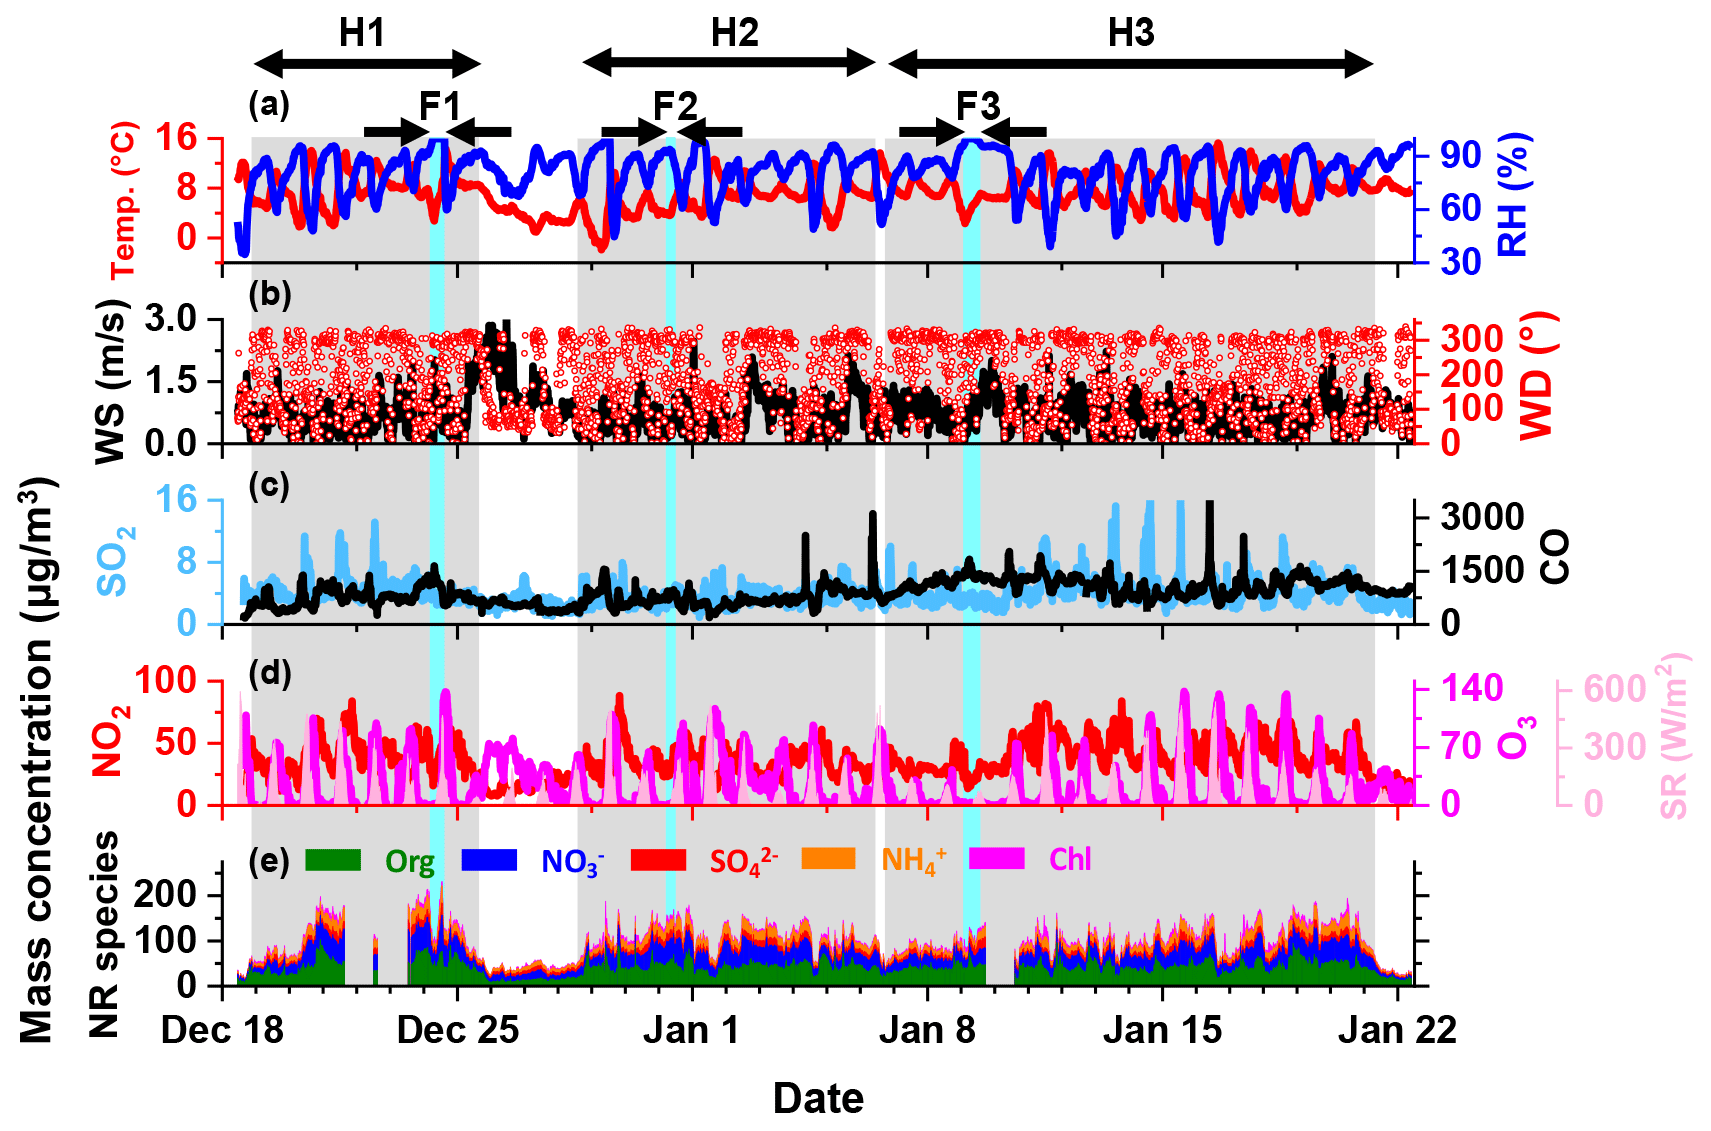
Figure 2Time series of (a) relative humidity (RH) and temperature (T); (b) wind direction and wind speed; (c, d) CO, NO2, SO2 and O3 mass concentrations and solar radiation; and (e) mass concentration of organics, nitrate, sulfate, ammonium and chloride in NR-PM2.5. The grey-shaded areas represent the intervals of H1, H2 and H3, respectively. The light-blue-shaded areas represent the intervals of F1, F2 and F3, respectively.
According to the definition mentioned above, three haze episodes (denoted as H1, H2 and H3, respectively, in Fig. 2), all with the types of slow start and slow end, were identified over the whole campaign. In addition, a fog event occurred during each haze episode (denoted as F1, F2 and F3, respectively). Lacking the information of visibility and aerosol size distribution up to several tens of micrometres, we were not able to precisely diagnose the accumulation and dissipation stages of a fog event. Instead, we selected the hours with RH near 100 % as the duration of a fog event, which was the same as the condition described in previous studies (Izhar et al., 2020; Guo et al., 2015).
2.4 Air parcel trajectory analysis
The 2 d back trajectories arriving at the receptor site were calculated every hour over the whole campaign using the National Oceanic and Atmospheric Administration (NOAA) HYSPLIT model version 4 (Draxler and Hess, 1998). Input to the model is in the form of 1∘ latitude–longitude gridded meteorological parameters from the Global Data Assimilation System meteorological dataset. We chose an arrival height of 500 m above ground level (a.g.l.) for target analysis in the HYSPLIT model to diminish the effects of surface friction (Polissar et al., 2001). Finally, 839 backward trajectories in total were obtained. Then, these trajectories were grouped into four clusters, i.e. cluster 1 from the north, cluster 2 from the southwest, cluster 3 from the northeast and cluster 4 from the east. The trajectories of each cluster accounted for 12.6 %, 6.2 %, 58.4 % and 22.8 % of total air parcel trajectories during the whole campaign, respectively.
3.1 Overview of meteorology and PM2.5 chemical composition
The temporal variation of meteorological parameters, concentrations of gaseous pollutants and chemical compositions of PM2.5 over the whole campaign is illustrated in Fig. 2. The missing data were due to an acquisition software malfunction of the instrument. During the campaign, the temperature ranged from −1.9 to 16.3∘C, with a mean value of 7.3±2.8∘C, and the RH ranged from 35 % to 100 %, with an average of 81±12.4 %. The wind from the southwest prevailed with an average speed of 0.7±0.5 m s−1 during the entire campaign. This indicated that the atmosphere was in a stagnant state with relatively low temperature and high RH.
The mass concentration of NR-PM2.5 during the campaign ranged from 23 to 230 µg m−3, with an average of 98.5±38.7 µg m−3. This was comparable to the average PM2.5 concentrations during wintertime in other cities in the SCB (Table S1). The OA concentration varied from several micrograms per cubic metre to 103 µg m−3, with an average of 39.2±3.9 µg m−3, constituting the majority of PM2.5. OA contributed ∼20 %–69 % to PM2.5, with an average of 40.3±7.6 %. The average concentrations of nitrate, sulfate, ammonium and chloride were 29±14 (ranging from ∼4 to 80 µg m−3), 10±4.2 (ranging from ∼2 to 28 µg m−3), 15.1±6.4 (ranging from ∼3 to 38 µg m−3) and 5.2±4.1 µg m−3 (ranging from ∼1 to 50 µg m−3), taking up 28.8±5.5 %, 10.6±2.8 %, 15.3±2.2 % and 5.1±3.1 % of PM2.5, respectively. The dominance of organic species was similar to previous observations in urban Chengdu during the winter of 2014 and 2015 (Kong et al., 2020; Wang et al., 2018). However, the nitrate concentration was higher than that of sulfate, which was contrary to that reported previously. A recent observation in urban Chengdu also found a higher fraction of nitrate in PM2.5 compared to sulfate, probably due to the remarkable decrease in SO2 emission in the past 10 years (Huang et al., 2021; Fu et al., 2017).
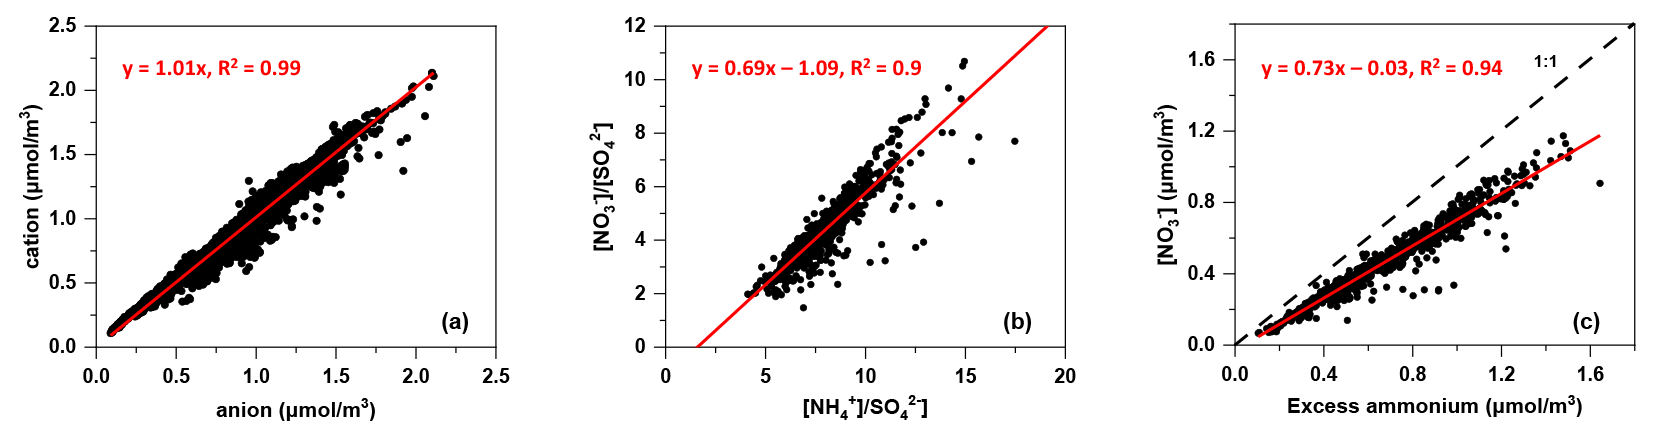
Figure 3Scatter plots of (a) molar concentrations of cations vs. anions, (b) molar ratios of nitrate to sulfate vs. ammonium to sulfate and (c) molar concentrations of nitrate vs. excess ammonium.
3.2 Characteristics of inorganic aerosol
The correlation between the molar equivalent concentrations of measured ammonium and the sum of molar equivalent concentrations of nitrate, sulfate and chloride is illustrated in Fig. 3. The slope of the regression line for ammonium against the sum of nitrate, sulfate and chloride with a value of 1.01 indicated that the anions in PM2.5 were well neutralised by cation (ammonium). This result illustrated that nitrate, sulfate and chloride were mainly in the form of NH4NO3, (NH4)2SO4 and NH4Cl, which were commonly considered secondarily formed (Ianniello et al., 2011; Ge et al., 2017).
As SO competed with NO for NH during their formation, the relationship between nitrate-to-sulfate molar ratio ([NO] [SO]) and ammonium-to-sulfate molar ratio ([NH] [SO]) was indicative of the pathway of nitrate formation (He et al., 2012). If [NO] [SO] linearly correlated with [NH] [SO] under ammonium-rich conditions ([NO] [SO] ≥1.5), homogeneous formation of nitrate was expected:
while for ammonium-poor conditions ([NO] [SO] <1.5), the high concentration of nitrate was attributed to its formation through hydrolysis of N2O5 on the pre-existing aerosols (Pathak et al., 2009):
To better elucidate the factors affecting nitrate formation, we divided the observation period into daytime (06:00–18:00, local time) and night-time (18:00–06:00 next day, local time) hours. Figure S1 showed that the [NO] [SO] during daytime was larger than 1.5, indicating ammonium-rich conditions. [NO] [SO] was significantly correlated with [NH] [SO] during daytime with the following regression function:
The intercept of the regression line on the [NH] [SO] axis was 1.56, which was close to 1.5, as suggested by Pathak et al. (2009), implying that the nitrate formation was mainly driven by the homogeneous pathway (Sun et al., 2011). Indeed, the nitrate concentration and nitrogen oxidation ratio (NOR = n(NO [n(NO2)+ n(NO)]) increased as the Ox concentration increased (as shown in Fig. 4) and exhibited a strong ratio dependency, which further demonstrated the homogeneous daytime formation of nitrate.
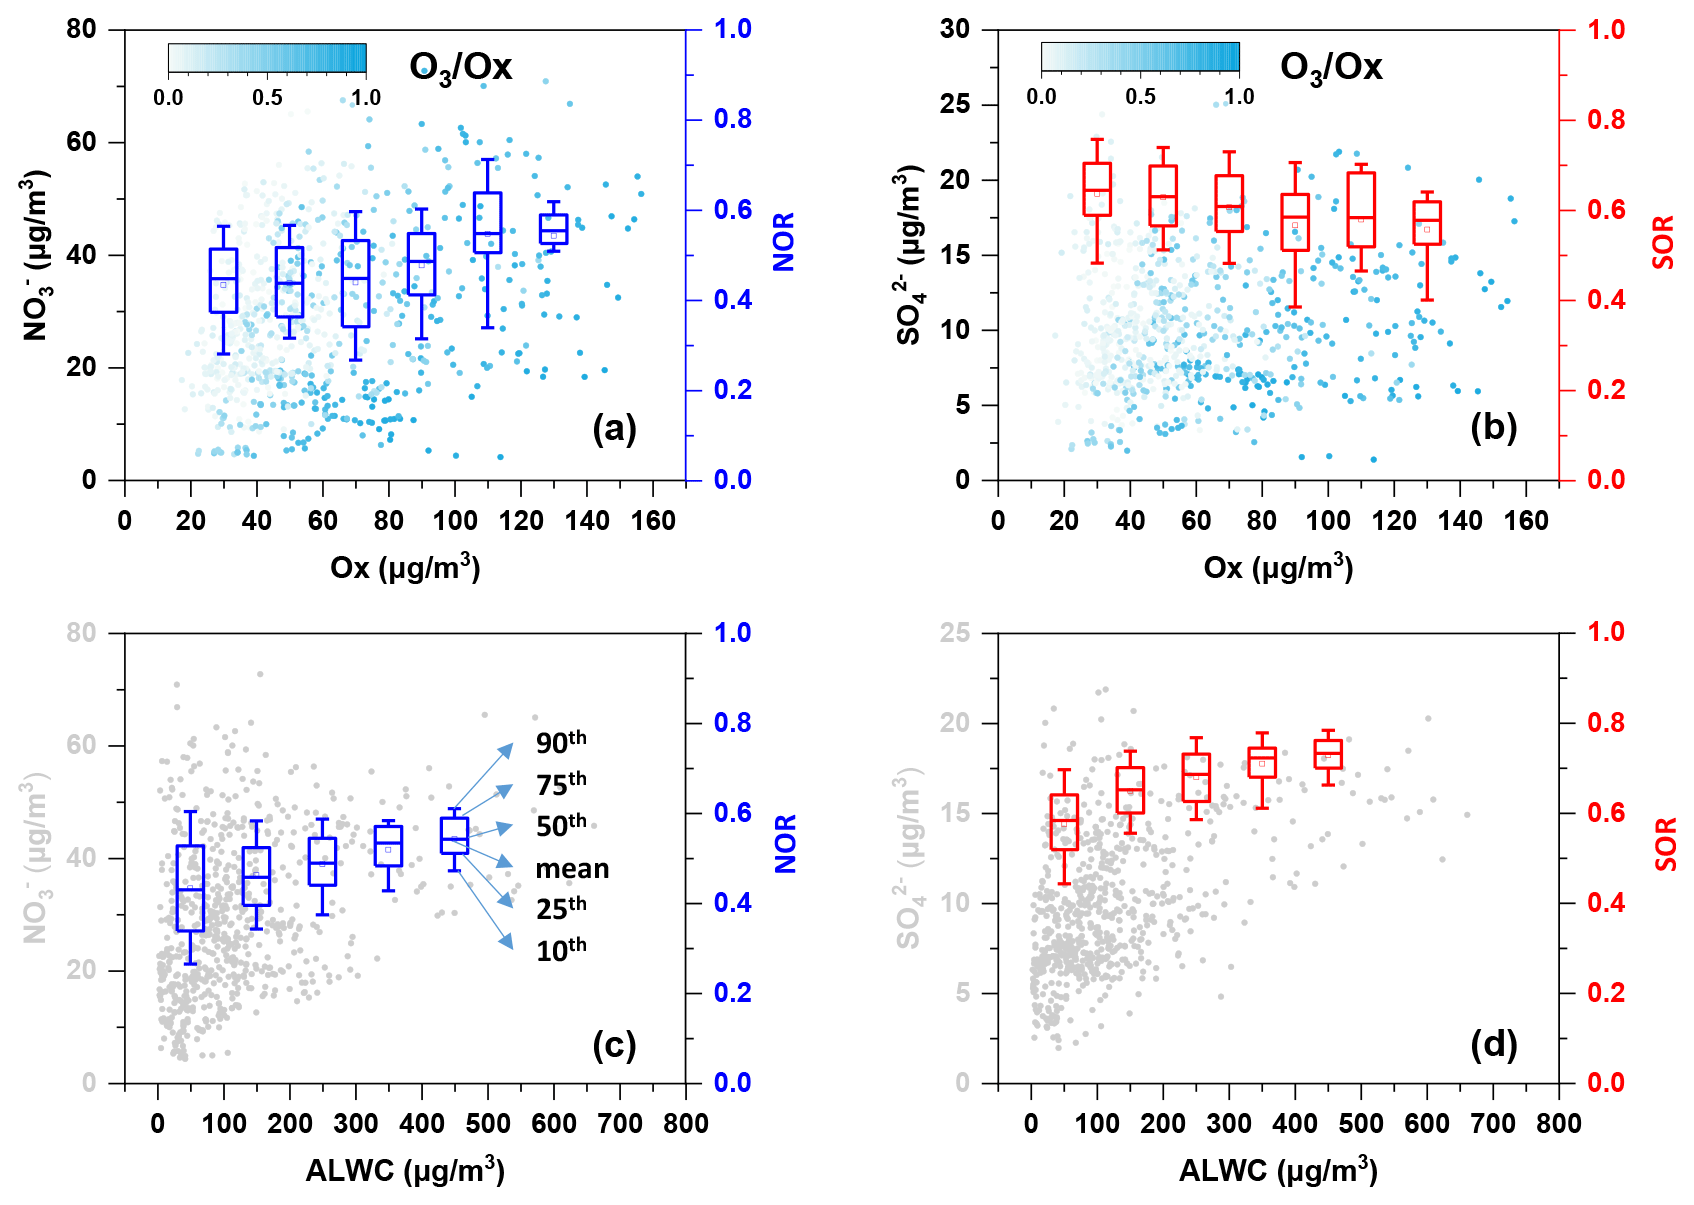
Figure 4Variation of (a, c) nitrate and NOR and (b, d) sulfate and SOR as Ox/ALWC increases. The data of NOR and SOR were grouped into different bins according to a 20 µg m−3 increment of Ox in (a) and (b) and a 100 µg m−3 increment of ALWC in (c) and (d). The colour scale represents ratios in (a) and (b). The mean (square), 50th (horizontal line inside the box), 25th and 75th percentiles (lower and upper box), and 10th and 90th percentiles (lower and upper whiskers) of the box chart are marked in (c). The concentration of ALWC was simulated using the ISORROPIA-II model.
The emission of NOx and SO2 has been reduced, while NH3 has increased in the past almost 10 years, which has resulted in the ammonium-rich conditions in the atmosphere (Fu et al., 2017; M. Liu et al., 2018). Despite this, a recent study showed that the nocturnal nitrate formation was not sensitive to NH3 and even increased slightly as NH3 decreased, which was likely due to the aerosol acidity effects on the partitioning of nitrate (Wen et al., 2018). Thus, the linear correlation of [NO] [SO] vs. [NH] [SO] might not be applicable for identifying the nitrate formation process during night-time. The average O3 concentration was 13.7 µg m−3, and the average RH was 83.3 % during night-time, which favoured the occurrence of aqueous-phase reactions. Higher nitrate concentration was observed with increasing aerosol liquid water content (ALWC) during night-time (as illustrated in Fig. S2), and so was NOR. This phenomenon further implies that the heterogeneous hydrolysis of N2O5 might dominate the formation of nocturnal nitrate. The results were consistent with the study of Tian et al. (2019), which showed that heterogeneous hydrolysis of N2O5 dominated nitrate formation during night-time, while photochemical reactions also played an important role in nitrate formation during daytime in two megacities in the Sichuan Basin.
Figure S2a showed that the average sulfate concentration increased slightly when Ox>60 µg m−3 during daytime hours, suggesting the contribution of the photochemical process to sulfate formation. However, the overall sulfur oxidation ratio (SOR = n(SO [n(SO2) + n(SO)]) decreased with increasing Ox (Fig. 4b), suggesting the photooxidation was not efficient for converting SO2 to sulfate. By contrast, SOR showed an increasing trend as ALWC increased, demonstrating the efficient conversion of SO2 to sulfate through aqueous-phase reactions. A previous study showed that the aqueous oxidation of SO2 by NO2 is key to efficient sulfate formation on fine aerosols with high relative humidity and NH3 neutralisation (Wang et al., 2016). As mentioned above, the atmospheric aerosols were well neutralised, and RH was high, which favoured the occurrence of the following reaction:
3.3 Characteristics of organic aerosol
3.3.1 Source appointment of OA
PMF analysis was performed to explore the OA sources measured during the whole campaign. A three-factor solution was chosen as the best PMF analysis results based on the mass spectra profile, variation of , diurnal variation and correlation with external tracers. The resolved factors included a hydrocarbon-like OA (HOA), a biomass burning OA (BBOA) and an oxygenated OA (OOA). The mass spectra profiles of these three factors were shown in Fig. 5, and the temporal profile of each factor and its external tracer were also shown.
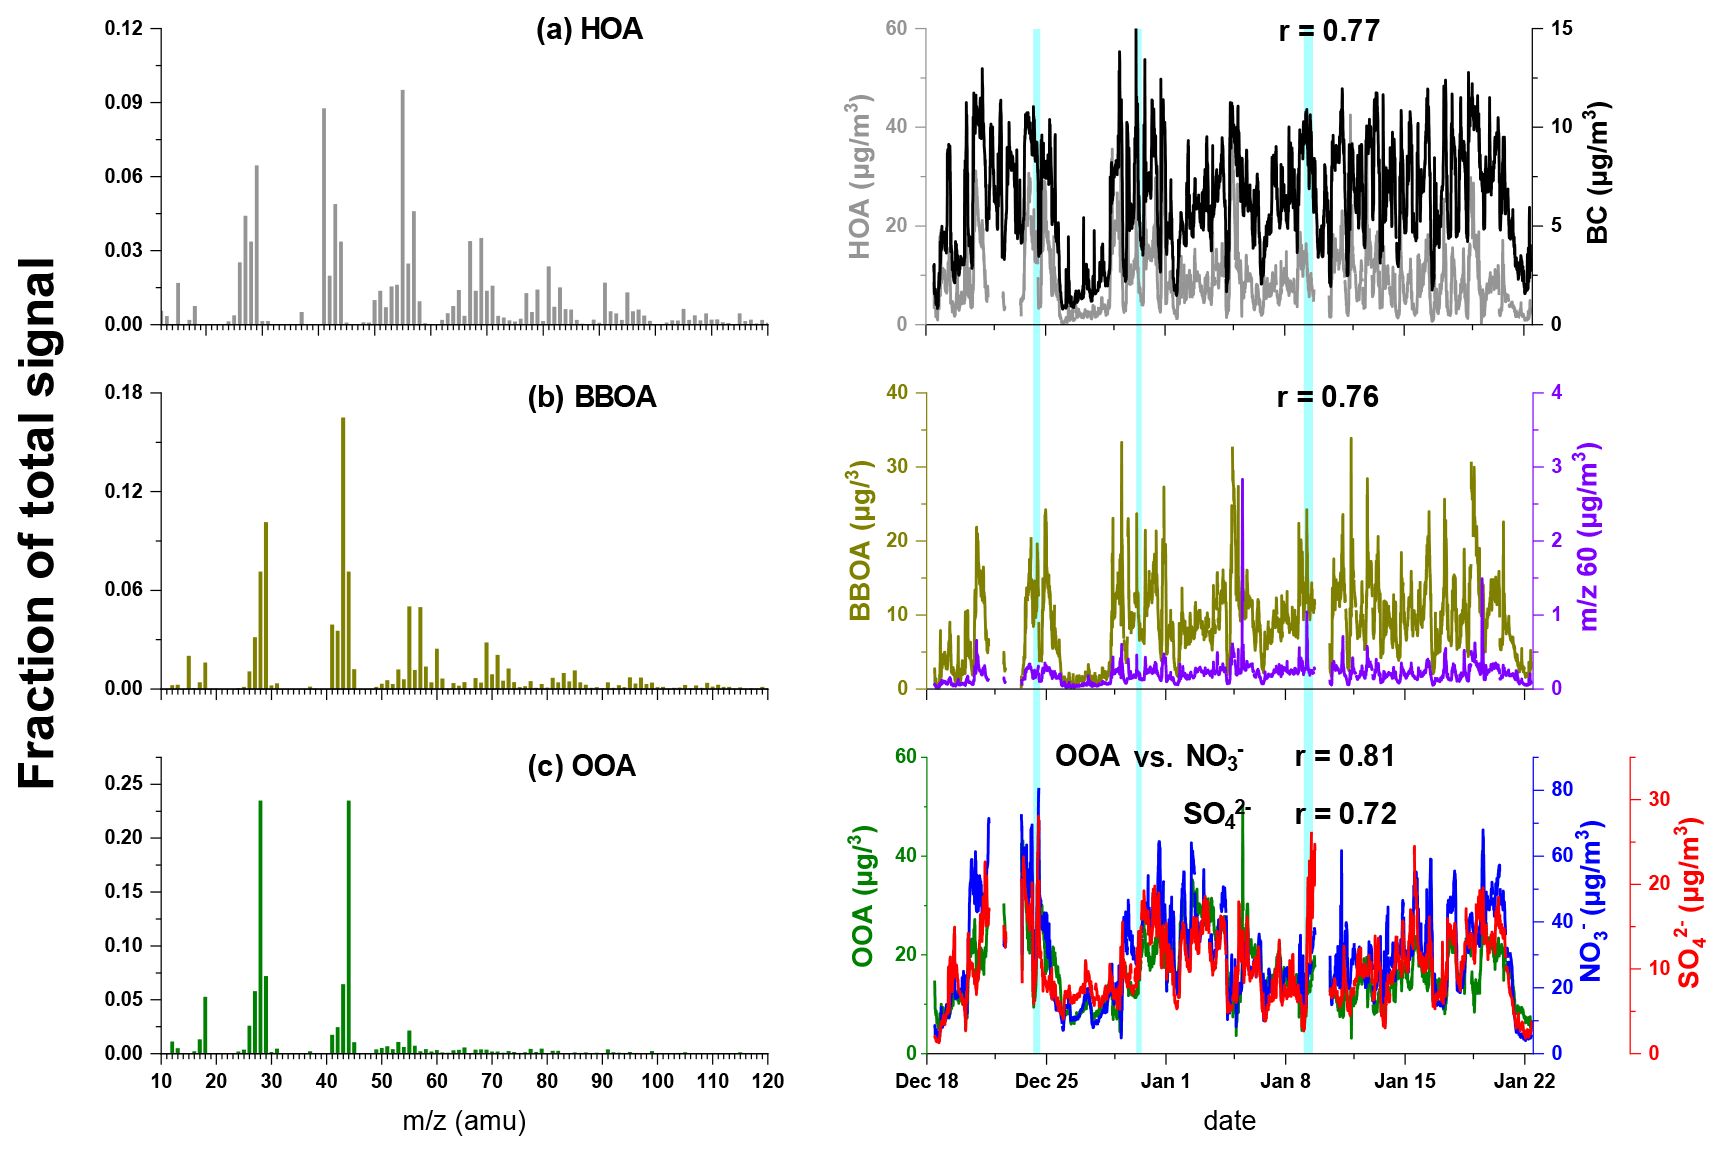
Figure 5Mass spectrum of (a) HOA, (b) BBOA, and (c) OOA resolved by PMF. The time series of each OA source and corresponding tracers are depicted in the right column. The light-blue-shaded areas represent the intervals of foggy periods.
The mass spectrum of HOA was dominated by the ions of 29, 41, 55, 57, 69 and 71. HOA was well correlated with BC (r=0.77), which was largely emitted by vehicles. The diurnal cycles of HOA showed two peaks during typical rush hours, demonstrating the contribution of traffic emissions to HOA (Lanz et al., 2007; Zhang et al., 2005). The average concentration of HOA was 8.9±6.5 µg m−3 and constituted 24.2±10.4 % of OA over the whole campaign. The increased fraction of HOA as a function of total OA (Fig. 6) demonstrated the contribution of motor vehicle emissions to haze formation.
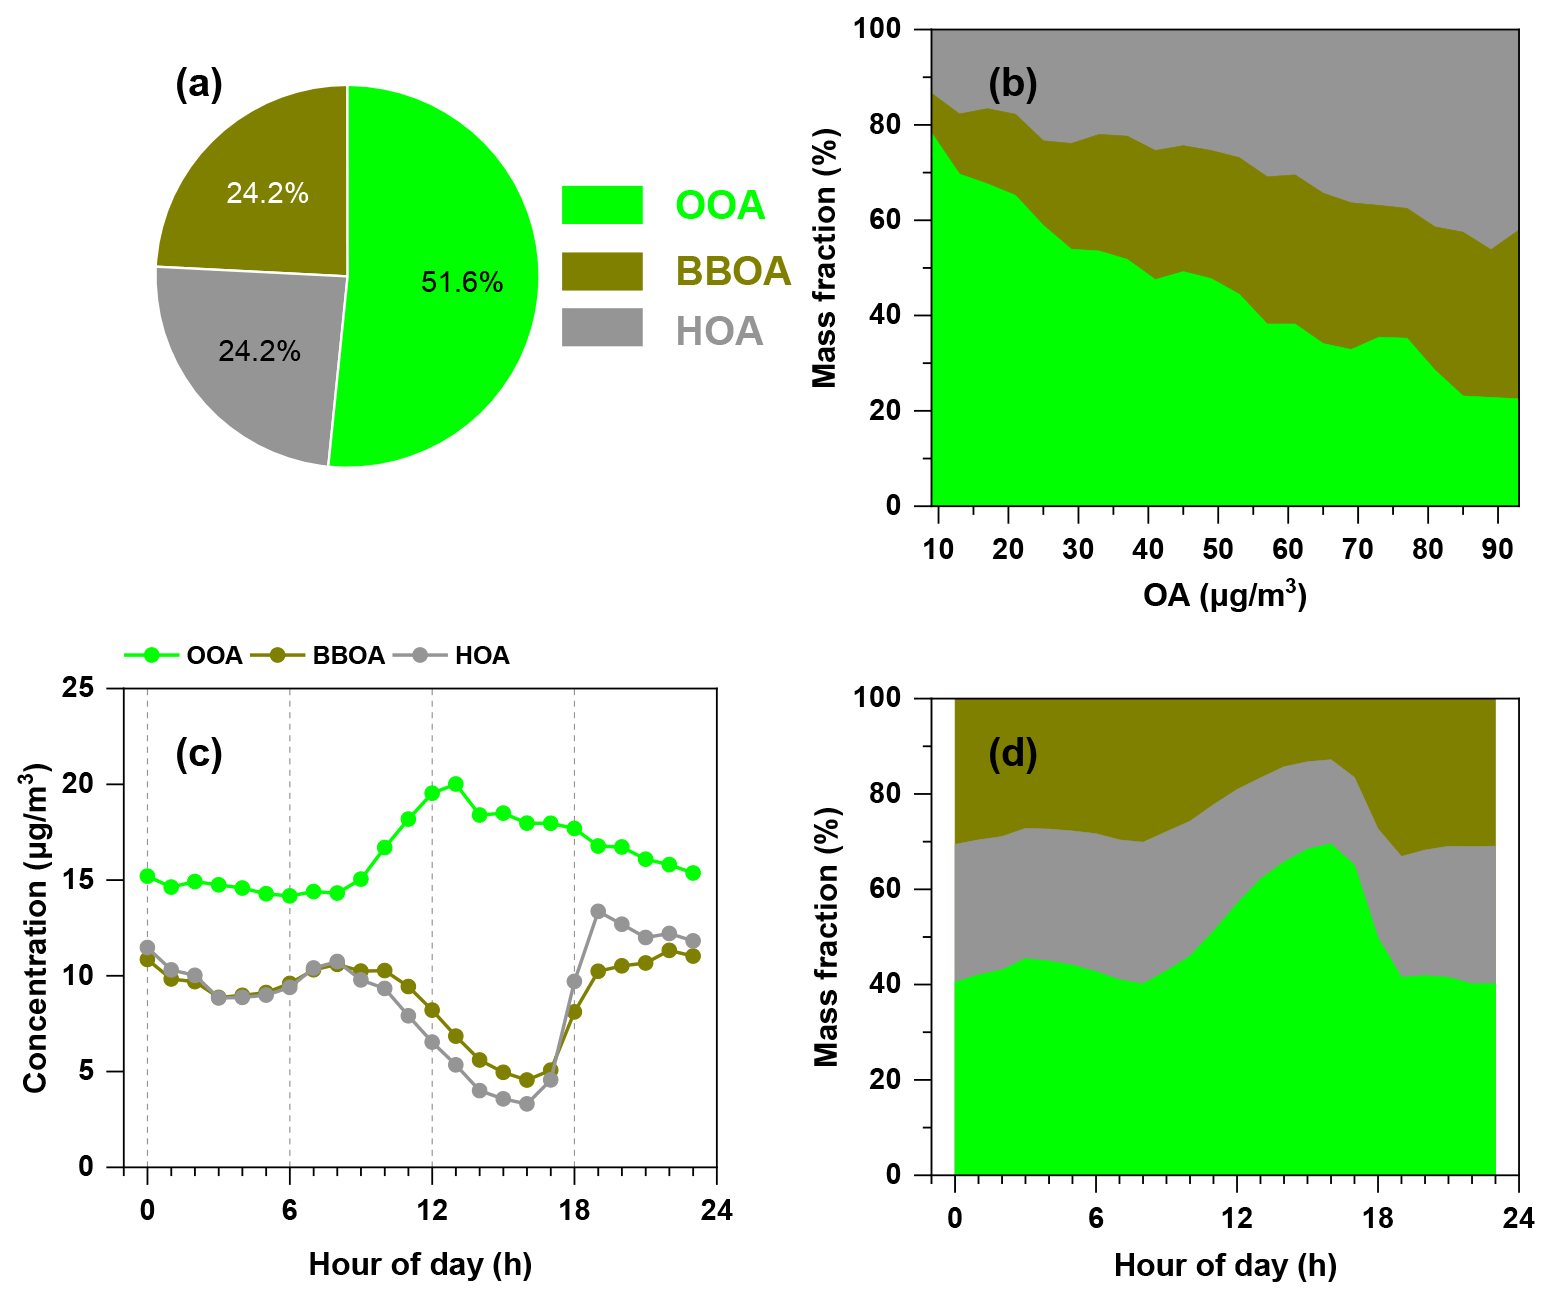
Figure 6Average mass fraction of different OOA, BBOA and HOA (a) in OA and (b) as a function of OA mass concentration. The diurnal variation of different OA factors and their mass contributions are shown in (c) and (d).
BBOA was characterised by the pronounced peaks at 60 (mainly C2H4O and 73 (C3H5O), which were generally regarded as biomass burning markers from levoglucosan compounds (Mohr et al., 2012; Weimer et al., 2008; Alfarra et al., 2007). BBOA was well correlated with 60 and 73 (r=0.76 and 0.94, respectively) and accounted for 88 % of 60 and 70 % for 73, which were higher than in other sources. A good correlation was also found between BBOA and chloride (r=0.64), which was also suggested to be one of the tracers of biomass burning. The diurnal variation of BBOA showed a similar trend of chloride (Fig. S3a), with two peaks during 08:00–10:00 and at 19:00, which was due to residential cooking and heating using biomass. The concentration of BBOA ranged from ∼1 to 34 µg m−3, with an average of 8.9±5.4 µg m−3. BBOA took up 24.2±8.6 % with a maximum of 46 % of OA, and its fraction also increased with increasing total OA concentration, indicating the contributions of biomass burning activities during haze episodes.
OOA was featured by the dominant signal intensities at 28 (mainly CO+) and 44 (CO). OOA accounted for 69 % of 44, which was higher than those in other sources. The time series of OOA correlated well with those of nitrate and sulfate (r=0.81 and 0.72, respectively), suggesting the commonly regional and aged properties of OOA. The concentration of OOA accumulated gradually from 08:00 to 13:00 and then decreased till night-time. The diurnal cycle of OOA was similar to solar radiation (as shown in Fig. S3d), suggesting OOA formation was associated with photochemical reactions. The average OOA concentration showed increasing trends as Ox concentration increased during both daytime and night-time (Fig. S5), indicating the probable formation pathways of OOA from its precursors (Kuang et al., 2020; Zhan et al., 2021). Note that the accumulation of NO2 leads to the decrease of ratio at night; thus, Ox might not be an appropriate indicator of photochemical oxidation (Xu et al., 2017b; Herndon et al., 2008). The OOA formation might be attributed to other processes during night-time. For example, previous studies showed that high NOx concentration facilitated the formation of nitrate radicals (NO3), and the NO3 oxidation of biogenic volatile organic compounds (BVOCs) was important for night-time secondary organic aerosol formation (Boyd et al., 2017; Rollins et al., 2012). Except that the average OOA concentration showed an increasing trend when ALWC <200 µg m−3 during night-time, OOA concentration did not change significantly with increasing ALWC during both daytime and night-time, suggesting the aqueous-phase reactions were not a significant pathway toward OOA formation.
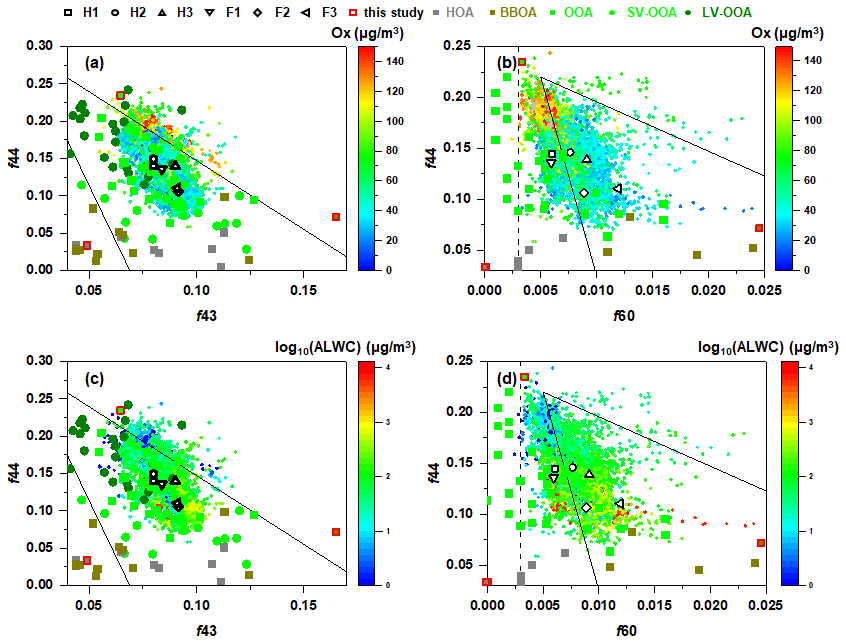
Figure 7Triangle plots of (a, c) f44 (ratio of 44 to total signal in the component mass spectrum) vs. f43 (ratio of 43 to total signal in the component mass spectrum) and (b, d) f44 vs. f60 (ratio of 60 to total signal in the component mass spectrum) during the whole campaign. The colour scale in (a) and (b) represents Ox concentration, and that in (c) and (d) represents log10(ALWC). The solid lines in (a) and (c) are derived from the results reported by Ng et al. (2010). The dashed line representing the background value of secondary aged OA and the solid guidelines in (b) and (d) are derived from Cubison et al. (2011). The f44 vs. f43 and f44 vs. f60 for different OA sources reported in previous studies are also shown (Kim et al., 2019; Ng et al., 2011a; Wang et al., 2016; Zhao et al., 2019; Paglione et al., 2020).
3.3.2 Elemental composition of OA
The f44 vs. f43 and f44 vs. f60 plots during the entire campaign are illustrated in Fig. 7. The triangle plot of f44 vs. f43 has been widely used to characterise OA evolution in the atmosphere because 's 44 and 43 are usually from different functional groups, and the ratio changes as a function of atmospheric ageing. The f43 ranged from ∼0.06 to 0.12, with an average of 0.08±0.009, and the range of f44 was ∼0.07–0.24, with an average of 0.15±0.03, suggesting the existence of both fresh and aged aerosols in the atmosphere. Most of the data were within the triangle space characterised by a series of field observations and experimental data (Ng et al., 2011a). However, those points with higher f44 were outside the upper boundary of the triangle region, suggesting the corresponding aerosols were more oxidised. It could be observed that the points with higher f44 (>0.16) corresponded to relatively higher Ox concentration and lower ALWC, while those with lower f44 corresponded to relatively lower Ox concentration and higher ALWC, suggesting that the formation of more oxidised OOA was mainly attributed to photochemical reactions, and the formation of less oxidised OOA was probably attributed to aqueous-phase reactions (Zhao et al., 2019; Kim et al., 2019).
The triangle plot of f44 vs. f60 was widely used as a metric to access the evolution of atmospheric BBOA (Cubison et al., 2011). A value of 0.003 for f60 was recommended as an appropriate value to represent the atmospheric background free of biomass burning influence (Aiken et al., 2009; Docherty et al., 2008). The f60 ranged from 0.0028 to 0.055, with an average of 0.008±0.003 during the campaign. Except for several points, the f60 was ubiquitously higher than 0.003, and most points fell in the triangular region, suggesting the contribution of biomass burning to OA. The f44 and f60 of BBOA resolved by PMF in the present study were also in the triangular region and comparable with previous studies (Paglione et al., 2020; Zhao et al., 2019; Kim et al., 2019). Figure S6 showed that f44 increased while f60 decreased with increasing Ox, indicating the likely oxidation of levoglucosan and/or levoglucosan-like substances. Cubison et al. (2011) suggested that the increasing f44 was not only attributed to the oxidation of levoglucosan-like species, but the oxidation of bulk OA also played a role because the levoglucosan-like species only contributed a small fraction of the OA mass (Aiken et al., 2009). Their contribution to the total signal 44 before or after ageing was also small. Compared to the effects of Ox, the increasing ALWC did not seem to push f60 to the left upper region. Most of the data points which corresponded to high ALWC were within the region of aged BBOA in the f44 vs. f60 space as defined previously by Paglione et al. (2020), indicating the probable aqueous-phase oxidation of BBOA. Although the aqueous OOA (aq-OOA) could not be resolved in the present study, we deduced that the aqueous-phase reactions occurred and contributed to the formation of OOA, because (1) the ambient RH was typically above 65 %, which favoured the presence of wet aerosol particles, and (2) the range of estimated from the improved ambient (IA) method varied from 0.46 to 0.85 when the ambient RH >80 %, covering the range of the OOA obtained from the photooxidation of organic precursors in the aqueous phase and ambient aq-OOA observed in many other cities (Duan et al., 2021; Mandariya et al., 2019; Sun et al., 2010; Xu et al., 2017b; Gilardoni et al., 2016).

Figure 8The van Krevelen– diagram with data during (a) the whole campaign, (b) H1 and F1, (c) H2 and F2, and (d) H3 and F3. The triangle lines with different slopes show distinct formation processes (Heald et al., 2010).
The evolution of OA during the whole campaign was characterised by the van Krevelen (VK) diagram in Fig. 8. The slope obtained from the linear regression of H:C versus O:C plotted in the VK– space could be used to infer the composition of OA and the chemical process in OA formation (Docherty et al., 2018). The slope of 0 in the VK– plot was related to the replacement of a hydrogen atom with an OH moiety, while the slopes of −0.5 and −1 indicated the formation of carboxylic groups with/without fragmentation, and a slope of −2 was equivalent to the replacement of an aliphatic carbon with a carbonyl group (Heald et al., 2010; Ng et al., 2011a). The slope of the linear fitting line for all the data points was −0.14, suggesting the probable formation of carboxylic acid moieties and hydroxyl groups. The slopes of the linear fitting lines for each fog episode were similar and close to zero, which was consistent with the hydroxyl group formation possibly taking place in aerosol water through dark chemistry (Sun et al., 2010; Yu et al., 2014; Zhao et al., 2014).

Figure 9Simulation results of 48 h backward air parcels cluster-mean trajectories during the campaign. The lines in black, blue, red and purple represent the mean trajectories of cluster 1 to cluster 4, respectively. The pie charts show the average mass contribution of different chemical compositions to PM2.5 for each cluster. The lower panel shows the height profile (above ground level, AGL) for different air parcels clusters along their transport paths.
3.4 Regional transport
Air parcels from the north (cluster 1) were transported at relatively high heights before arriving at the observation site (as illustrated in Fig. 9) and corresponded to the lowest average PM2.5 concentration (66±30 µg m−3). The air parcels of cluster 2 had the longest transport distance and highest transport height. Although they took up the least proportion of total air parcels, they had the highest average PM2.5 concentration (119±30 µg m−3) during the whole campaign, suggesting that pollutants accumulated high in the air. Air parcels from the east (cluster 3) with the shortest transport distance and relatively low transport height had an average PM2.5 concentration of 113±34 µg m−3. This indicated that the pollutants might be brought to the observation site along with the transport of air parcels originating from adjacent areas. The air parcels from the northeast of Sichuan Province (cluster 4) had the lowest transport height; however, the corresponding PM2.5 concentration was lower than that of cluster 3.
Compared to cluster 1 and cluster 4, a higher contribution of nitrate to PM2.5 was observed for cluster 2 and cluster 3, which was mainly related to the intense emission from industry and vehicles. However, the contribution of BBOA was higher for cluster 3 and cluster 4 compared to other clusters, suggesting intense biomass burning along their transport paths.
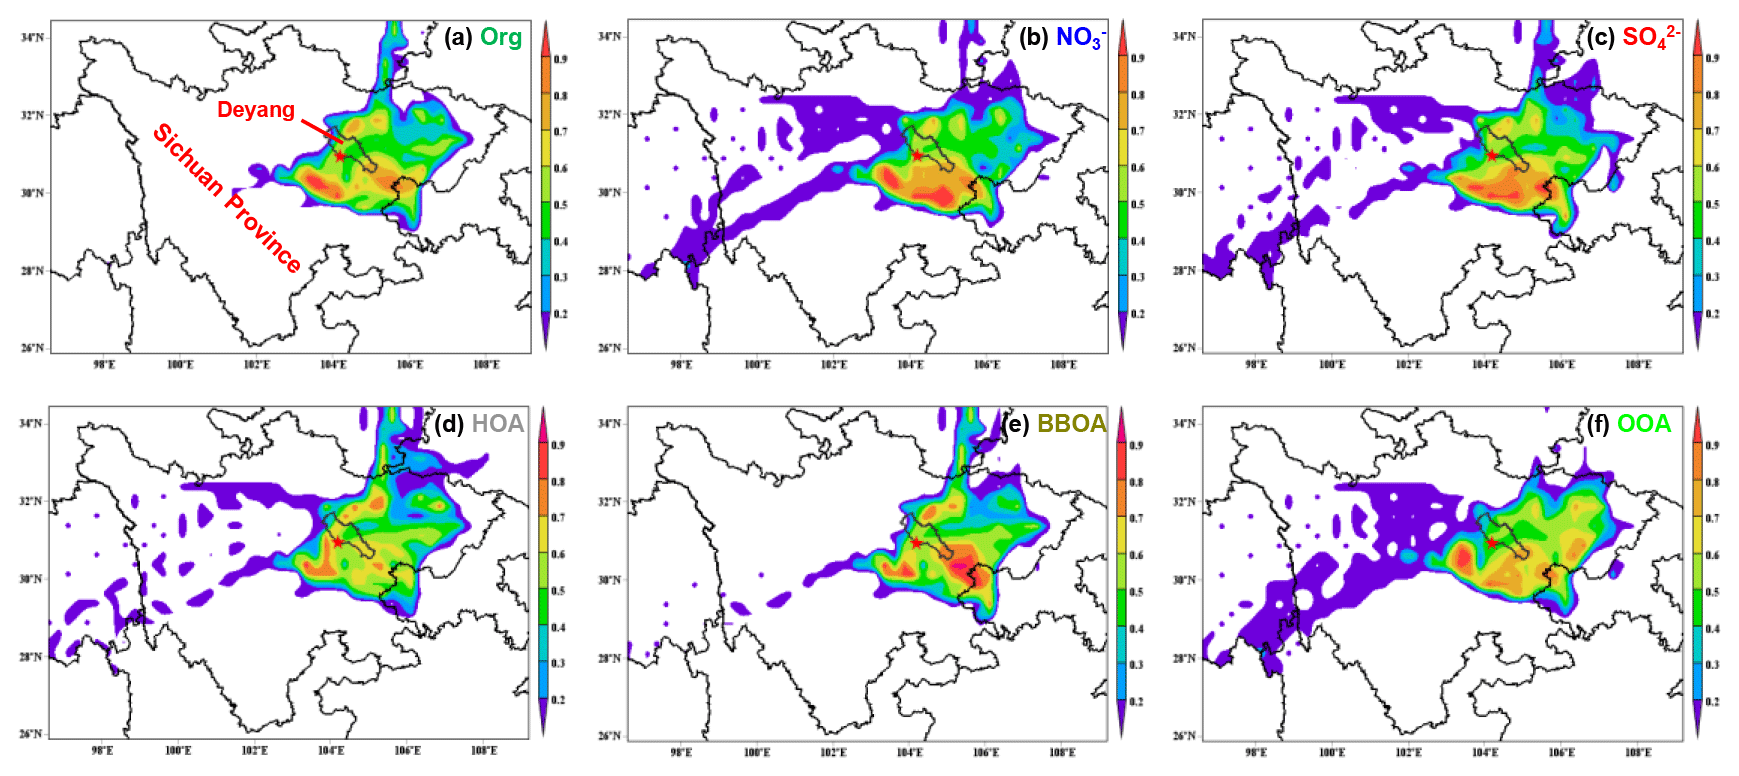
Figure 10Simulation results of PSCF for (a) organics, (b) nitrate, (c) sulfate, (d) HOA, (e) BBOA and (f) OOA during the whole campaign. The 50th percentiles of the concentrations for each composition (organics: 39.5 µg m−3, nitrate: 27.8 µg m−3, sulfate: 9.5 µg m−3, HOA: 7.6 µg m−3, BBOA: 8.7 µg m−3, OOA: 15.2 µg m−3) were used as thresholds in the PSCF analysis. The areas of Deyang and Sichuan Province are marked in (a).
To better understand the potential pollutant sources during the campaign, the potential source contribution function (PSCF) was applied to analyse the possible regions that might contribute to haze formation. The spatial distribution of weighted PSCF (WPSCF) for different chemical compositions was illustrated in Fig. 10. The WPSCF values for organics over the southwest and southeast were >0.7, indicating these locations were likely source areas of organics. For nitrate and sulfate, the areas southwest and south of the sampling site were potential source regions. The major source regions for HOA were the areas of south and northeast Deyang. The regions contributing to BBOA were the areas of east Sichuan Province, which was consistent with a higher proportion of BBOA in PM2.5 in the air parcels stemming from these locations. For OOA, the WPSCF values over the southwest and southeast of Deyang and northeast Sichuan Province were >0.7, suggesting the contribution of these regions.
3.5 Case studies for haze pollution
3.5.1 Factors driving the evolution of haze episodes
As mentioned above, three haze episodes were identified over the whole campaign. The synoptic conditions and aerosol chemical composition for each haze episode are summarised in Table S3. The average temperature during H2 was lower than that during H1 and H3, while the average solar radiation was higher. The mean RH and wind speed were almost the same during each haze episode. The average concentrations of aerosol chemical composition and their contributions to PM2.5 were different in each haze episode, indicating that the factors causing haze formation might be different during the campaign.

Figure 11(a) Average mass fractions of different chemical compositions in PM2.5, (b) mass concentration and (c) relative contribution of inorganic/organic species as a function of PM2.5 concentration during each haze episode. The right side of (a) depicts the contribution of OOA, BBOA and HOA to OA.
The average PM2.5 concentrations measured by ToF-ACSM during H1, H2 and H3 were 113±46, 109±46 and 104±30 µg m−3, respectively. The average mass fractions of OA, nitrate, sulfate, ammonium and chloride were similar during H1 and H3 (as shown in Fig. 11a). During H2, the mass fractions of sulfate and ammonium were slightly higher than those in H1 and H3, while the mass fractions of OA and chloride were lower. In OA, the fraction of primary organic aerosols (POA = HOA + BBOA) during H3 was higher than that during H1 and H2. The fraction of BBOA showed an increasing trend from H1 to H3, demonstrating the contribution of biomass burning to haze formation. Despite the importance of BBOA to winter haze formation in the SCB, the control of biomass burning did not receive much attention, and more efforts are needed for atmospheric aerosol mitigation in the future.
Figure 11b showed that the concentrations of OA, nitrate, sulfate, ammonium, and chloride all increased as the ambient air quality worsened (implying by the increasing PM2.5 concentration) during each haze episode. During H1, the fraction of nitrate in PM2.5 increased, while the proportions of sulfate, OOA and HOA in PM2.5 decreased as the PM2.5 concentration increased, indicating that the evolution of this haze episode was mainly driven by the reactions involving nitrate formation. The average NO formation rate as a function of PM2.5 concentration during H1 is depicted in Fig. S7. The NO formation rate increased fast as PM2.5 concentration increased from 50 to 110 µg m−3, which also showed the rapid formation of nitrate contributed to haze formation. In contrast, the average nitrate formation rates were below zero when the PM2.5 concentration was <130 µg m−3 during H2 and H3, suggesting nitrate formation did not play an important role in the early stage of H2 and H3. Although the nitrate formation rate decreased when PM2.5 concentration was >110 µg m−3 during H1, it remained positive, suggesting the nitrate concentration increased gradually.
For H2, the fraction of nitrate and ammonium in PM2.5 did not show apparent changes, and the fractions of sulfate and OOA decreased, while the fractions of BBOA and HOA increased as the air quality worsened, demonstrating that the emission of primary organic aerosols from biomass burning and vehicle exhaust was the major factor which drove the haze formation. During H3, the fractions of nitrate and BBOA in PM2.5 increased, while OOA decreased, and HOA, sulfate, ammonium and chloride did not change significantly as the PM2.5 concentration increased, showing that the evolution of this haze episode was mainly driven by the reactions involving nitrate formation and biomass burning. The fire maps (as illustrated in Fig. S8) showed that more fire spots during H2 and H3 were observed around Deyang compared to non-haze episodes, suggesting the biomass burning activities were more intensive during these haze episodes.
The average estimated O:C and H:C during H1 and H2 were similar and slightly higher/lower than that during H3, thus resulting in a higher carbon oxidation state () during H1 and H2. The lower average during H3 might be due to the higher proportion of HOA and BBOA, which did not undergo long-term ageing and stayed relatively fresh in the atmosphere.
3.5.2 Evolution of chemical composition during fog periods
The fog periods usually started at night or early in the morning and dissipated in the afternoon. The individual meteorological parameter differed among each fog period (as summarised in Table S3). The average temperature was the highest during F1 (6.2±2.3∘C), and the lowest was observed during F2 (1.5±3.2∘C). The maximum solar radiation during F1 and F2 (470 and 500 W m−2) was similar and much higher than that during F3 (75 W m−2). The synoptic conditions with low temperature and calm wind favoured the formation of radiation fog in each fog period.
The chemical composition of PM2.5 was also different during each fog period. The average concentrations of organics, nitrate and ammonium were almost the same during F2 and F3 and significantly lower than those during F1. However, the average chloride concentration during F2 was twice that of F1 and F3, suggesting the possibility of stronger biomass burning emissions during F2. OOA constituted the major part of OA during F1, while HOA and BBOA were more important than OOA during F2 and F3. The domination of secondary species in PM2.5 during F1 was probably due to aqueous-phase reactions, while the primary emission tended to be stronger during F2 and F3.
Since the aerosols were dried by a Nafion dryer, the aerosols that ToF-ACSM measured were the interstitial particles in droplets or those excluded from fog droplets. In order to better characterise the evolution of chemical composition in each fog period, the intervals for 3 h before and after the fog period, when ambient RH was lower than 95 %, were regarded as pre-fog and post-fog periods, respectively (Kim et al., 2019). Note that the post-fog period was not assigned for F3 because the ToF-ACSM data were not available due to a failure of acquisition software.
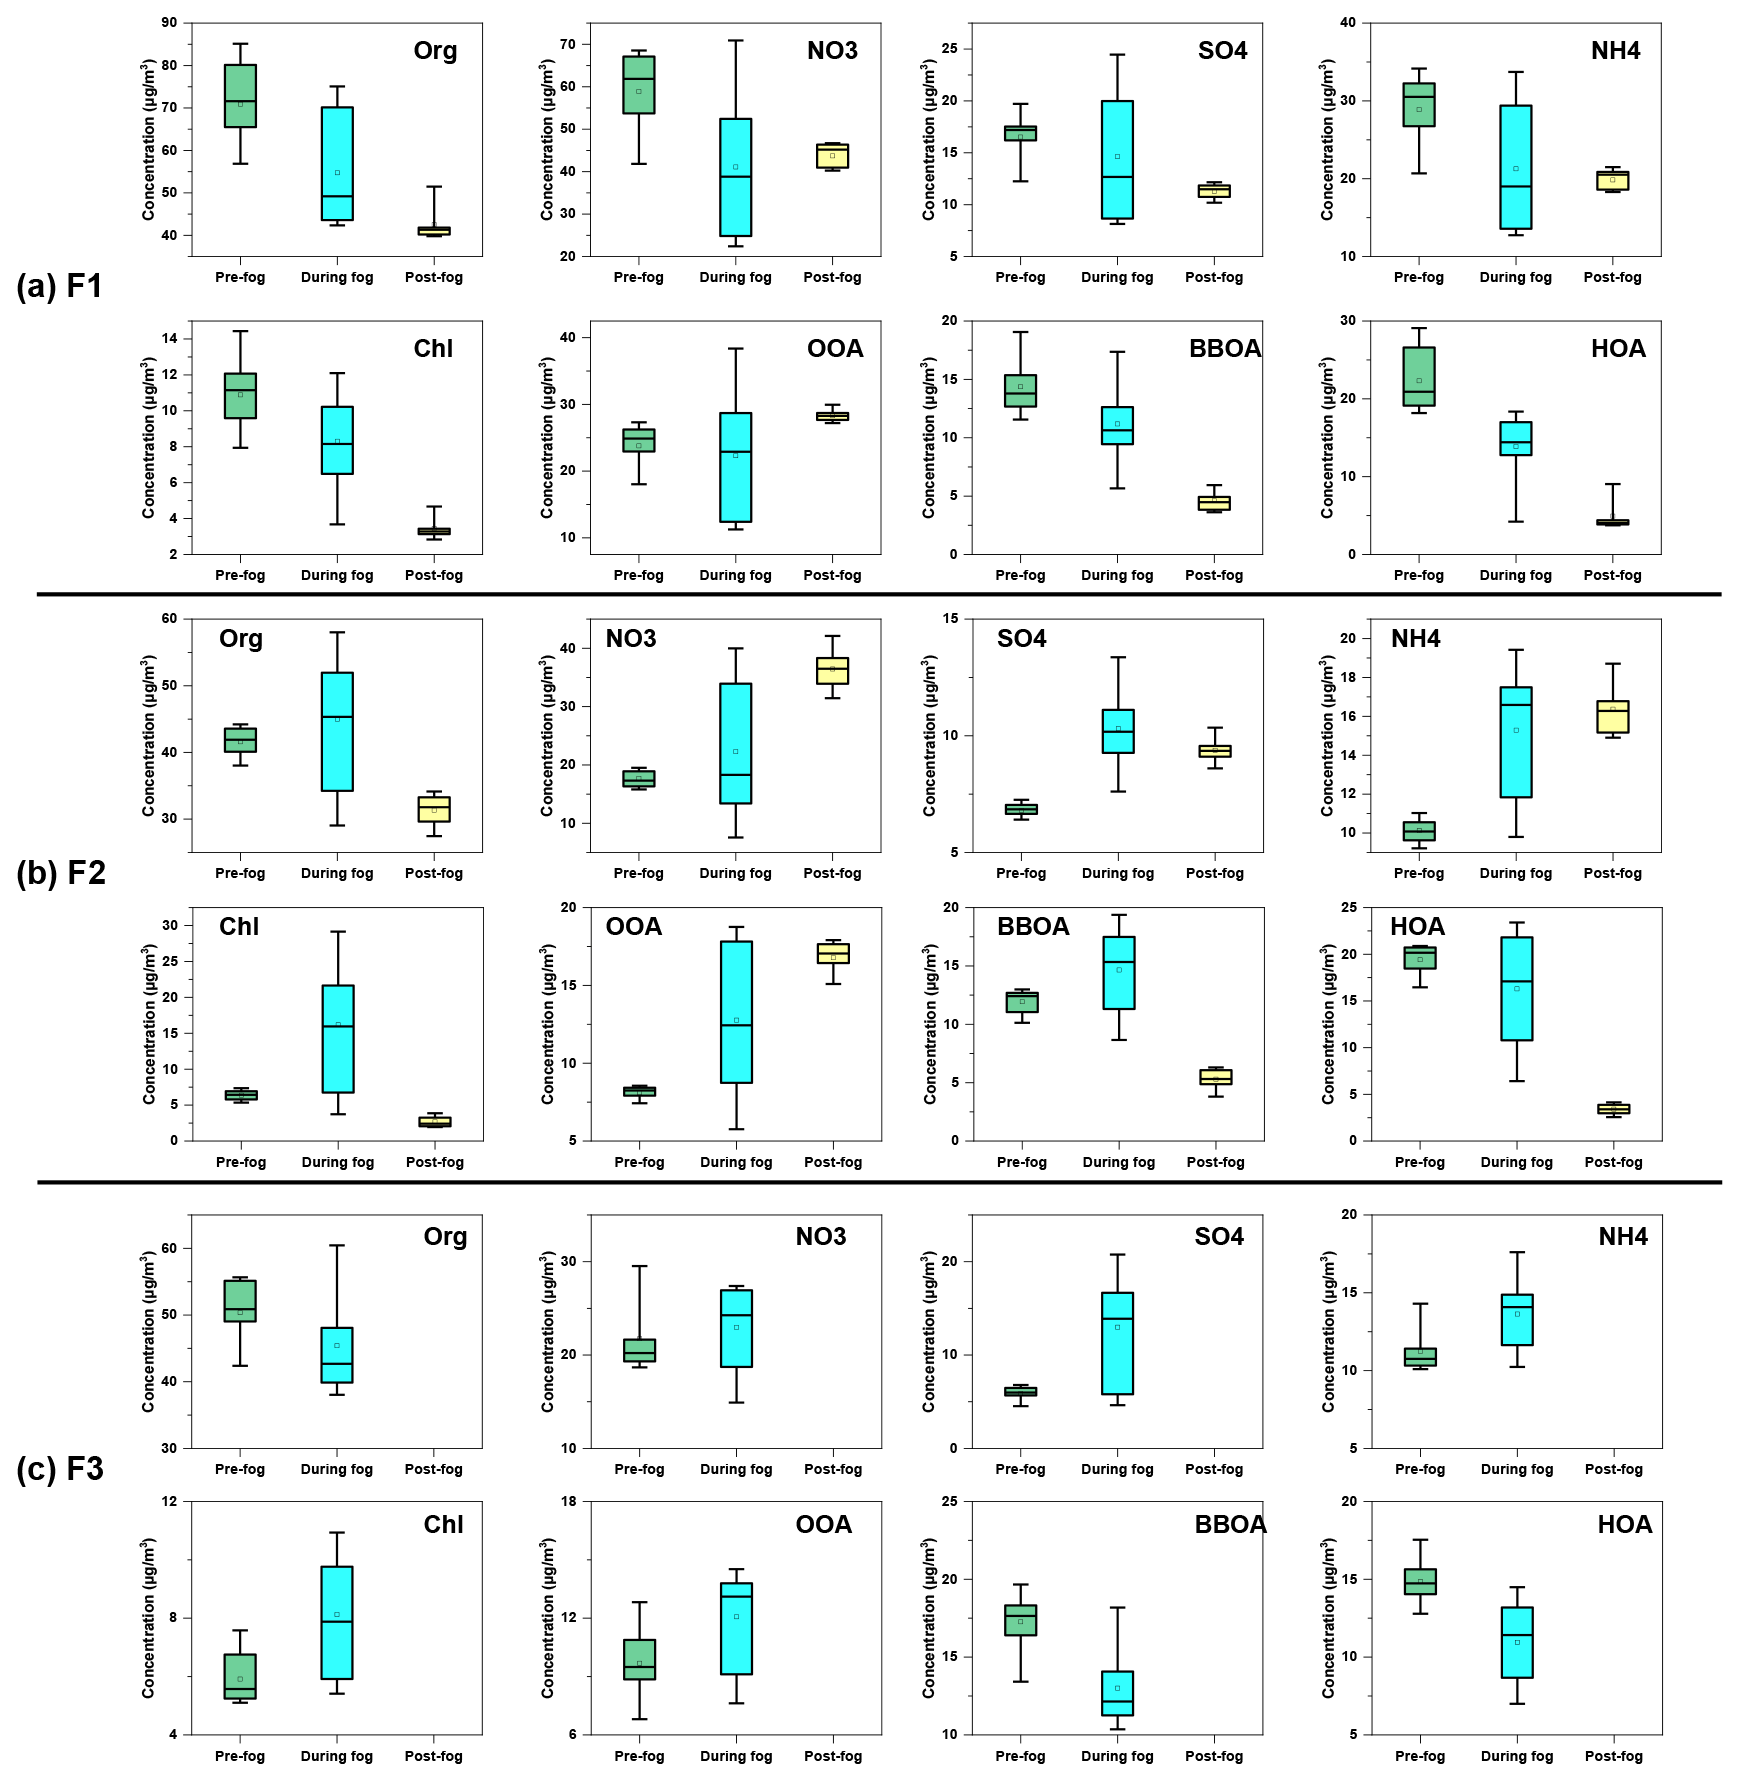
Figure 12Variation of organics, nitrate, sulfate, ammonium, chloride, OOA, BBOA and HOA concentration during the evolution of (a) F1, (b) F2 and (c) F3.
The average concentrations of different chemical compositions during the evolution of fog episodes (pre-fog, during fog, and post-fog periods) were illustrated in Fig. 12. Compared to the pre-fog period of F1, all species in the interstitial aerosols decreased during the foggy period, likely due to the scavenging by fog droplets. Note that the OOA and sulfate decreased less than other species, probably due to the OOA and sulfate formation through aqueous-phase reactions against the scavenging effect of fog droplets. Except for OOA and nitrate, all species kept decreasing during post-fog periods, which might be attributed to the increase of the planetary boundary layer (PBL) height. The increase of OOA and nitrate was probably associated with the enhancement of photochemical reaction after the dissipation of fog.
All species (except for HOA) increased during the foggy period from the pre-fog period during F2, which was different from the case during F1. Although hydrophilic species (e.g. nitrate, sulfate and OOA) tended to be scavenged by fog droplets, it seemed that the formation of OOA, nitrate, sulfate and ammonium was significantly faster than wet removal, thus resulting in an increase during the foggy period. BBOA and HOA were commonly considered as hydrophobic species, and they were excluded from fog droplets. Previous studies showed that BBOA and HOA concentrations decreased during the foggy period compared to the pre-fog period (Collett et al., 2008; Kim et al., 2019), despite their insoluble nature. The increase of BBOA in the present study was likely attributed to the intense emission from biomass burning during the foggy period, which overwhelmed the scavenging effects of fog droplets. The enhanced partitioning of biomass burning VOCs under high-RH conditions might also contribute to the increase of BBOA. For example, a recent study showed that the large quantities of phenols from biomass burning emission readily partition into the atmospheric aqueous phase (Xiao et al., 2022). During the post-fog period, BBOA and HOA decreased significantly, possibly due to weaker emission and the efficient removal of fog droplets through nucleation and/or coagulation. The dynamics of PBL might also play a role because the temperature kept increasing, and higher PBL was expected during the post-fog period. With stronger solar radiation, OOA, nitrate and ammonium continued growing during the post-fog period from the foggy period through photochemical reactions. However, sulfate slightly decreased, which might be due to the insufficient formation through photochemical reactions, and decreased as the PBL height increased. Similar to F2, all the secondary species increased during the foggy period from the pre-fog period during F3. However, BBOA and HOA were reduced significantly by the scavenging of fog droplets and/or by the conversion to OOA through aqueous-phase reactions.
The average elemental O:C showed an increasing trend from pre-fog periods to post-fog/foggy periods, while H:C did not change significantly for different fog events, suggesting the OA became more oxidised. As shown in Fig. S9, the mass fractions of OOA increased, while the contribution of BBOA and HOA decreased from pre-fog periods to post-fog/foggy periods for the three fog events. Except for the scavenging of fog droplets, BBOA and HOA could also be oxidised to OOA through aqueous-phase reactions (Wang et al., 2021), thus resulting in the decrease contribution of BBOA and HOA. As a consequence, the O:C increased in line with the increased contribution of OOA. Previous studies reported that the aqueous-phase reactions enhanced OOA formation during fog/high-RH periods (Chakraborty et al., 2016; Kuang et al., 2020; Chakraborty et al., 2015). It appeared that the OOA formation balances out the scavenging of fog droplets during the foggy period for the three fog events, despite the hydrophilic OOA being preferentially scavenged by fog droplets. Thus, the OOA concentration marginally decreased or even increased during foggy periods.
Haze pollution has long been a severe environmental problem in the SCB. The formation process of haze pollution in the SCB might be different from the NCP, YRD and PRD due to the unique topography, meteorological conditions and emission sources, which are still unclear. Based on the measurement data of a ToF-ACSM, and combined with the PMF and PSCF analysis, the temporal variation, formation process and sources of PM2.5 were characterised to elucidate further the factors contributing to haze formation. It was found that the concentrations of OA and nitrate increased dramatically as PM2.5 concentration increased, and the stagnant synoptic condition favoured the accumulation of these pollutants. For different haze events, the driving factors could be classified into three types: one was the reactions involving nitrate formation, another one was the intense biomass burning and vehicle exhaust emissions, and the last one was the combination of the reactions involving nitrate formation and biomass burning. Nitrate formation was primarily affected by photooxidation during daytime, while the nocturnal nitrate formation was dominated by aqueous-phase reactions. OOA constituted a major part of OA, and it was mainly generated through photooxidation, while aqueous-phase reactions did not significantly promote its formation.
Due to the limitation of the present study, the parameters which are indicative of the pathways of nitrate formation are not characterised. The major precursors contributing to a large amount of OOA are not clear yet. In addition, further investigation is needed to gain a better understanding of the gas/particles emitted by biomass burning or other primary emissions and how they will affect the haze formation processes, which may help to implement appropriate POA emission control to reduce the occurrence of haze. Nonetheless, the results of this study implied that controlling primary emissions (such as biomass burning and vehicle exhaust) and precursors of secondary aerosols (e.g. NOx, SO2 and VOCs) during severe haze periods will benefit the improvement of air quality in the SCB.
The data generated and analysed in this study are available from https://doi.org/10.5281/zenodo.6965551 (Bao et al., 2022).
The supplement related to this article is available online at: https://doi.org/10.5194/acp-23-1147-2023-supplement.
FY and SX designed this study. XZ and QL contributed to data collection during the field campaign. JZ, DZ and CZ performed field experiments. ZL and CP performed the data analysis. ZB wrote the manuscript. GS, LZ and YC contributed to the scientific discussion and paper correction.
The contact author has declared that none of the authors has any competing interests.
Publisher's note: Copernicus Publications remains neutral with regard to jurisdictional claims in published maps and institutional affiliations.
The authors are grateful for the assistance of Meng Xiangxinyue, Ren Jie, Xiao Yao and all the other colleagues, who collaborated in the preparation of the campaign, the PMF analysis and the instrument calibrations in the field.
This research has been supported by the National Key Research and Development Program of China (grant no. 2018YFC0214001) and the National Natural Science Foundation of China (grant no. 42075109).
This paper was edited by Alex Lee and reviewed by two anonymous referees.
Aiken, A. C., Salcedo, D., Cubison, M. J., Huffman, J. A., DeCarlo, P. F., Ulbrich, I. M., Docherty, K. S., Sueper, D., Kimmel, J. R., Worsnop, D. R., Trimborn, A., Northway, M., Stone, E. A., Schauer, J. J., Volkamer, R. M., Fortner, E., de Foy, B., Wang, J., Laskin, A., Shutthanandan, V., Zheng, J., Zhang, R., Gaffney, J., Marley, N. A., Paredes-Miranda, G., Arnott, W. P., Molina, L. T., Sosa, G., and Jimenez, J. L.: Mexico City aerosol analysis during MILAGRO using high resolution aerosol mass spectrometry at the urban supersite (T0) – Part 1: Fine particle composition and organic source apportionment, Atmos. Chem. Phys., 9, 6633–6653, https://doi.org/10.5194/acp-9-6633-2009, 2009.
Alfarra, M. R., Prevot, A. S. H., Szidat, S., Sandradewi, J., Weimer, S., Lanz, V. A., Schreiber, D., Mohr, M., and Baltensperger, U.: Identification of the Mass Spectral Signature of Organic Aerosols from Wood Burning Emissions, Environ. Sci. Technol., 41, 5770–5777, https://doi.org/10.1021/es062289b, 2007.
Bao, Z., Chen, L., Li, K., Han, L., Wu, X., Gao, X., Azzi, M., and Cen, K.: Meteorological and chemical impacts on PM2.5 during a haze episode in a heavily polluted basin city of eastern China, Environ. Pollut., 250, 520–529, https://doi.org/10.1016/j.envpol.2019.04.045, 2019.
Bao, Z., Zhang, X., Li, Q., Zhou, J., Shi, G., Zhou, L., Yang, F., Xie, S., Zhang, D., Zhai, C., Li, Z., Peng, C., and Chen, Y.: Chemical composition of PM2.5 for Deyang campaign, Zenodo [data set], https://doi.org/10.5281/zenodo.6965551, 2022.
Boyd, C. M., Nah, T., Xu, L., Berkemeier, T., and Ng, N. L.: Secondary Organic Aerosol (SOA) from Nitrate Radical Oxidation of Monoterpenes: Effects of Temperature, Dilution, and Humidity on Aerosol Formation, Mixing, and Evaporation, Environ. Sci. Technol., 51, 7831–7841, https://doi.org/10.1021/acs.est.7b01460, 2017.
Canagaratna, M. R., Jimenez, J. L., Kroll, J. H., Chen, Q., Kessler, S. H., Massoli, P., Hildebrandt Ruiz, L., Fortner, E., Williams, L. R., Wilson, K. R., Surratt, J. D., Donahue, N. M., Jayne, J. T., and Worsnop, D. R.: Elemental ratio measurements of organic compounds using aerosol mass spectrometry: characterization, improved calibration, and implications, Atmos. Chem. Phys., 15, 253–272, https://doi.org/10.5194/acp-15-253-2015, 2015.
Chakraborty, A., Bhattu, D., Gupta, T., Tripathi, S. N., and Canagaratna, M. R.: Real-time measurements of ambient aerosols in a polluted Indian city: Sources, characteristics, and processing of organic aerosols during foggy and nonfoggy periods, J. Geophys. Res.-Atmos., 120, 9006–9019, https://doi.org/10.1002/2015JD023419, 2015.
Chakraborty, A., Gupta, T., and Tripathi, S. N.: Combined effects of organic aerosol loading and fog processing on organic aerosols oxidation, composition, and evolution, Sci. Total Environ., 573, 690–698, https://doi.org/10.1016/j.scitotenv.2016.08.156, 2016.
Chen, Q., Heald, C. L., Jimenez, J. L., Canagaratna, M. R., Zhang, Q., He, L. Y., Huang, X. F., Campuzano Jost, P., Palm, B. B., Poulain, L., Kuwata, M., Martin, S. T., Abbatt, J. P. D., Lee, A. K. Y., and Liggio, J.: Elemental composition of organic aerosol: The gap between ambient and laboratory measurements, Geophys. Res. Lett., 42, 4182–4189, https://doi.org/10.1002/2015GL063693, 2015.
Chen, Q., Fu, T., Hu, J., Ying, Q., and Zhang, L.: Modelling secondary organic aerosols in China, Natl. Sci. Rev., 4, 806–809, 2017.
Clark, C. H., Kacarab, M., Nakao, S., Asa-Awuku, A., Sato, K., and Cocker, D. R.: Temperature Effects on Secondary Organic Aerosol (SOA) from the Dark Ozonolysis and Photo-Oxidation of Isoprene, Environ. Sci. Technol., 50, 5564–5571, https://doi.org/10.1021/acs.est.5b05524, 2016.
Collett, J. L., Herckes, P., Youngster, S., and Lee, T.: Processing of atmospheric organic matter by California radiation fogs, Atmos. Res., 87, 232–241, https://doi.org/10.1016/j.atmosres.2007.11.005, 2008.
Cubison, M. J., Ortega, A. M., Hayes, P. L., Farmer, D. K., Day, D., Lechner, M. J., Brune, W. H., Apel, E., Diskin, G. S., Fisher, J. A., Fuelberg, H. E., Hecobian, A., Knapp, D. J., Mikoviny, T., Riemer, D., Sachse, G. W., Sessions, W., Weber, R. J., Weinheimer, A. J., Wisthaler, A., and Jimenez, J. L.: Effects of aging on organic aerosol from open biomass burning smoke in aircraft and laboratory studies, Atmos. Chem. Phys., 11, 12049–12064, https://doi.org/10.5194/acp-11-12049-2011, 2011.
Dai, Q., Schulze, B. C., Bi, X., Bui, A. A. T., Guo, F., Wallace, H. W., Sanchez, N. P., Flynn, J. H., Lefer, B. L., Feng, Y., and Griffin, R. J.: Seasonal differences in formation processes of oxidized organic aerosol near Houston, TX, Atmos. Chem. Phys., 19, 9641–9661, https://doi.org/10.5194/acp-19-9641-2019, 2019.
Ding, A., Huang, X., Nie, W., Chi, X., Xu, Z., Zheng, L., Xu, Z., Xie, Y., Qi, X., Shen, Y., Sun, P., Wang, J., Wang, L., Sun, J., Yang, X.-Q., Qin, W., Zhang, X., Cheng, W., Liu, W., Pan, L., and Fu, C.: Significant reduction of PM2.5 in eastern China due to regional-scale emission control: evidence from SORPES in 2011–2018, Atmos. Chem. Phys., 19, 11791–11801, https://doi.org/10.5194/acp-19-11791-2019, 2019.
Docherty, K. S., Stone, E. A., Ulbrich, I. M., DeCarlo, P. F., Snyder, D. C., Schauer, J. J., Peltier, R. E., Weber, R. J., Murphy, S. M., Seinfeld, J. H., Grover, B. D., Eatough, D. J., and Jimenez, J. L.: Apportionment of Primary and Secondary Organic Aerosols in Southern California during the 2005 Study of Organic Aerosols in Riverside (SOAR-1), Environ. Sci. Technol., 42, 7655–7662, https://doi.org/10.1021/es8008166, 2008.
Docherty, K. S., Corse, E. W., Jaoui, M., Offenberg, J. H., Kleindienst, T. E., Krug, J. D., Riedel, T. P., and Lewandowski, M.: Trends in the oxidation and relative volatility of chamber-generated secondary organic aerosol, Aerosol Sci. Tech., 52, 992–1004, https://doi.org/10.1080/02786826.2018.1500014, 2018.
Donahue, N. M., Robinson, A. L., Stanier, C. O., and Pandis, S. N.: Coupled Partitioning, Dilution, and Chemical Aging of Semivolatile Organics, Environ. Sci. Technol., 40, 2635–2643, https://doi.org/10.1021/es052297c, 2006.
Draxler, R. R. and Hess, G. D.: An overview of the HYSPLIT_4 modeling system for trajectories, dispersion, and deposition, Aust. Meteor. Mag., 47, 295–308, 1998.
Duan, J., Huang, R., Gu, Y., Lin, C., Zhong, H., Wang, Y., Yuan, W., Ni, H., Yang, L., Chen, Y., Worsnop, D. R., and O'Dowd, C.: The formation and evolution of secondary organic aerosol during summer in Xi'an: Aqueous phase processing in fog-rain days, Sci. Total Environ., 756, 144077, https://doi.org/10.1016/j.scitotenv.2020.144077, 2021.
Fröhlich, R., Cubison, M. J., Slowik, J. G., Bukowiecki, N., Prévôt, A. S. H., Baltensperger, U., Schneider, J., Kimmel, J. R., Gonin, M., Rohner, U., Worsnop, D. R., and Jayne, J. T.: The ToF-ACSM: a portable aerosol chemical speciation monitor with TOFMS detection, Atmos. Meas. Tech., 6, 3225–3241, https://doi.org/10.5194/amt-6-3225-2013, 2013.
Fu, X., Wang, S., Xing, J., Zhang, X., Wang, T., and Hao, J.: Increasing Ammonia Concentrations Reduce the Effectiveness of Particle Pollution Control Achieved via SO2 and NOx Emissions Reduction in East China, Environ. Sci. Technol. Lett., 4, 221–227, https://doi.org/10.1021/acs.estlett.7b00143, 2017.
Fu, X., Wang, T., Gao, J., Wang, P., Liu, Y., Wang, S., Zhao, B., and Xue, L.: Persistent Heavy Winter Nitrate Pollution Driven by Increased Photochemical Oxidants in Northern China, Environ. Sci. Technol., 54, 3881–3889, https://doi.org/10.1021/acs.est.9b07248, 2020.
Ge, D., Nie, W., Sun, P., Liu, Y., Wang, T., Wang, J., Wang, J., Wang, L., Zhu, C., Wang, R., Liu, T., Chi, X., and Ding, A.: Characterization of particulate organic nitrates in the Yangtze River Delta, East China, using the time-of-flight aerosol chemical speciation monitor, Atmos. Environ., 272, 118927, https://doi.org/10.1016/j.atmosenv.2021.118927, 2022.
Ge, X., Li, L., Chen, Y., Chen, H., Wu, D., Wang, J., Xie, X., Ge, S., Ye, Z., Xu, J., and Chen, M.: Aerosol characteristics and sources in Yangzhou, China resolved by offline aerosol mass spectrometry and other techniques, Environ. Pollut., 225, 74–85, https://doi.org/10.1016/j.envpol.2017.03.044, 2017.
Gilardoni, S., Massoli, P., Paglione, M., Giulianelli, L., Carbone, C., Rinaldi, M., Decesari, S., Sandrini, S., Costabile, F., Gobbi, G. P., Pietrogrande, M. C., Visentin, M., Scotto, F., Fuzzi, S., and Facchini, M. C.: Direct observation of aqueous secondary organic aerosol from biomass-burning emissions, P. Natl. Acad. Sci. USA, 113, 10013–10018, https://doi.org/10.1073/pnas.1602212113, 2016.
Guo, J., Zhou, S., Cai, M., Zhao, J., Song, W., Zhao, W., Hu, W., Sun, Y., He, Y., Yang, C., Xu, X., Zhang, Z., Cheng, P., Fan, Q., Hang, J., Fan, S., Wang, X., and Wang, X.: Characterization of submicron particles by time-of-flight aerosol chemical speciation monitor (ToF-ACSM) during wintertime: aerosol composition, sources, and chemical processes in Guangzhou, China, Atmos. Chem. Phys., 20, 7595–7615, https://doi.org/10.5194/acp-20-7595-2020, 2020.
Guo, L., Guo, X., Fang, C., and Zhu, S.: Observation analysis on characteristics of formation, evolution and transition of a long-lasting severe fog and haze episode in North China, Sci. China Earth Sci., 58, 329–344, https://doi.org/10.1007/s11430-014-4924-2, 2015.
Guo, S., Hu, M., Zamora, M. L., Peng, J., Shang, D., Zheng, J., Du, Z., Wu, Z., Shao, M., Zeng, L., Molina, M. J., and Zhang, R.: Elucidating severe urban haze formation in China, P. Natl. Acad. Sci. USA, 111, 17373–17378, https://doi.org/10.1073/pnas.1419604111, 2014.
He, K., Zhao, Q., Ma, Y., Duan, F., Yang, F., Shi, Z., and Chen, G.: Spatial and seasonal variability of PM2.5 acidity at two Chinese megacities: insights into the formation of secondary inorganic aerosols, Atmos. Chem. Phys., 12, 1377–1395, https://doi.org/10.5194/acp-12-1377-2012, 2012.
Heald, C. L., Kroll, J. H., Jimenez, J. L., Docherty, K. S., DeCarlo, P. F., Aiken, A. C., Chen, Q., Martin, S. T., Farmer, D. K., and Artaxo, P.: A simplified description of the evolution of organic aerosol composition in the atmosphere, Geophys. Res. Lett., 37, L08803, https://doi.org/10.1029/2010GL042737, 2010.
Herndon, S. C., Onasch, T. B., Wood, E. C., Kroll, J. H., Canagaratna, M. R., Jayne, J. T., Zavala, M. A., Knighton, W. B., Mazzoleni, C., Dubey, M. K., Ulbrich, I. M., Jimenez, J. L., Seila, R., de Gouw, J. A., de Foy, B., Fast, J., Molina, L. T., Kolb, C. E., and Worsnop, D. R.: Correlation of secondary organic aerosol with odd oxygen in Mexico City, Geophys. Res. Lett., 35, L15804, https://doi.org/10.1029/2008GL034058, 2008.
Hinks, M. L., Montoya-Aguilera, J., Ellison, L., Lin, P., Laskin, A., Laskin, J., Shiraiwa, M., Dabdub, D., and Nizkorodov, S. A.: Effect of relative humidity on the composition of secondary organic aerosol from the oxidation of toluene, Atmos. Chem. Phys., 18, 1643–1652, https://doi.org/10.5194/acp-18-1643-2018, 2018.
Huang, R., Zhang, Y., Bozzetti, C., Ho, K., Cao, J., Han, Y., Daellenbach, K. R., Slowik, J. G., Platt, S. M., Canonaco, F., Zotter, P., Wolf, R., Pieber, S. M., Bruns, E. A., Crippa, M., Ciarelli, G., Piazzalunga, A., Schwikowski, M., Abbaszade, G., Schnelle-Kreis, J., Zimmermann, R., An, Z., Szidat, S., Baltensperger, U., Haddad, I. E., and Prévôt, A. S. H.: High secondary aerosol contribution to particulate pollution during haze events in China, Nature, 514, 218–222, https://doi.org/10.1038/nature13774, 2014.
Huang, X., Zhang, J., Zhang, W., Tang, G., and Wang, Y.: Atmospheric ammonia and its effect on PM2.5 pollution in urban Chengdu, Sichuan Basin, China, Environ. Pollut., 291, 118195, https://doi.org/10.1016/j.envpol.2021.118195, 2021.
Ianniello, A., Spataro, F., Esposito, G., Allegrini, I., Hu, M., and Zhu, T.: Chemical characteristics of inorganic ammonium salts in PM2.5 in the atmosphere of Beijing (China), Atmos. Chem. Phys., 11, 10803–10822, https://doi.org/10.5194/acp-11-10803-2011, 2011.
Izhar, S., Gupta, T., and Panday, A. K.: Scavenging efficiency of water soluble inorganic and organic aerosols by fog droplets in the Indo Gangetic Plain, Atmos. Res., 235, 104767, https://doi.org/10.1016/j.atmosres.2019.104767, 2020.
Kim, H., Collier, S., Ge, X., Xu, J., Sun, Y., Jiang, W., Wang, Y., Herckes, P., and Zhang, Q.: Chemical processing of water-soluble species and formation of secondary organic aerosol in fogs, Atmos. Environ., 200, 158–166, https://doi.org/10.1016/j.atmosenv.2018.11.062, 2019.
Kong, L., Tan, Q., Feng, M., Qu, Y., An, J., Liu, X., Cheng, N., Deng, Y., Zhai, R., and Wang, Z.: Investigating the characteristics and source analyses of PM2.5 seasonal variations in Chengdu, Southwest China, Chemosphere, 243, 125267, https://doi.org/10.1016/j.chemosphere.2019.125267, 2020.
Kuang, Y., He, Y., Xu, W., Yuan, B., Zhang, G., Ma, Z., Wu, C., Wang, C., Wang, S., Zhang, S., Tao, J., Ma, N., Su, H., Cheng, Y., Shao, M., and Sun, Y.: Photochemical Aqueous-Phase Reactions Induce Rapid Daytime Formation of Oxygenated Organic Aerosol on the North China Plain, Environ. Sci. Technol., 54, 3849–3860, https://doi.org/10.1021/acs.est.9b06836, 2020.
Lanz, V. A., Alfarra, M. R., Baltensperger, U., Buchmann, B., Hueglin, C., and Prévôt, A. S. H.: Source apportionment of submicron organic aerosols at an urban site by factor analytical modelling of aerosol mass spectra, Atmos. Chem. Phys., 7, 1503–1522, https://doi.org/10.5194/acp-7-1503-2007, 2007.
Li, H., Zhang, Q., Zheng, B., Chen, C., Wu, N., Guo, H., Zhang, Y., Zheng, Y., Li, X., and He, K.: Nitrate-driven urban haze pollution during summertime over the North China Plain, Atmos. Chem. Phys., 18, 5293–5306, https://doi.org/10.5194/acp-18-5293-2018, 2018.
Liu, M., Huang, X., Song, Y., Xu, T., Wang, S., Wu, Z., Hu, M., Zhang, L., Zhang, Q., Pan, Y., Liu, X., and Zhu, T.: Rapid SO2 emission reductions significantly increase tropospheric ammonia concentrations over the North China Plain, Atmos. Chem. Phys., 18, 17933–17943, https://doi.org/10.5194/acp-18-17933-2018, 2018.
Liu, M., Huang, X., Song, Y., Tang, J., Cao, J., Zhang, X., Zhang, Q., Wang, S., Xu, T., Kang, L., Cai, X., Zhang, H., Yang, F., Wang, H., Yu, J. Z., Lau, A. K. H., He, L., Huang, X., Duan, L., Ding, A., Xue, L., Gao, J., Liu, B., and Zhu, T.: Ammonia emission control in China would mitigate haze pollution and nitrogen deposition, but worsen acid rain, P. Natl. Acad. Sci. USA, 116, 7760–7765, https://doi.org/10.1073/pnas.1814880116, 2019.
Liu, P., Ye, C., Xue, C., Zhang, C., Mu, Y., and Sun, X.: Formation mechanisms of atmospheric nitrate and sulfate during the winter haze pollution periods in Beijing: gas-phase, heterogeneous and aqueous-phase chemistry, Atmos. Chem. Phys., 20, 4153–4165, https://doi.org/10.5194/acp-20-4153-2020, 2020.
Liu, P. S. K., Deng, R., Smith, K. A., Williams, L. R., Jayne, J. T., Canagaratna, M. R., Moore, K., Onasch, T. B., Worsnop, D. R., and Deshler, T.: Transmission Efficiency of an Aerodynamic Focusing Lens System: Comparison of Model Calculations and Laboratory Measurements for the Aerodyne Aerosol Mass Spectrometer, Aerosol Sci. Technol., 41, 721–733, https://doi.org/10.1080/02786820701422278, 2007.
Liu, T., Huang, D. D., Li, Z., Liu, Q., Chan, M., and Chan, C. K.: Comparison of secondary organic aerosol formation from toluene on initially wet and dry ammonium sulfate particles at moderate relative humidity, Atmos. Chem. Phys., 18, 5677–5689, https://doi.org/10.5194/acp-18-5677-2018, 2018.
Mandariya, A. K., Gupta, T., and Tripathi, S. N.: Effect of aqueous-phase processing on the formation and evolution of organic aerosol (OA) under different stages of fog life cycles, Atmos. Environ., 206, 60–71, https://doi.org/10.1016/j.atmosenv.2019.02.047, 2019.
Matthew, B. M., Middlebrook, A. M., and Onasch, T. B.: Collection Efficiencies in an Aerodyne Aerosol Mass Spectrometer as a Function of Particle Phase for Laboratory Generated Aerosols, Aerosol Sci. Technol., 42, 884–898, https://doi.org/10.1080/02786820802356797, 2008.
Middlebrook, A. M., Bahreini, R., Jimenez, J. L., and Canagaratna, M. R.: Evaluation of Composition-Dependent Collection Efficiencies for the Aerodyne Aerosol Mass Spectrometer using Field Data, Aerosol Sci. Technol., 46, 258–271, https://doi.org/10.1080/02786826.2011.620041, 2012.
Mohr, C., DeCarlo, P. F., Heringa, M. F., Chirico, R., Slowik, J. G., Richter, R., Reche, C., Alastuey, A., Querol, X., Seco, R., Peñuelas, J., Jiménez, J. L., Crippa, M., Zimmermann, R., Baltensperger, U., and Prévôt, A. S. H.: Identification and quantification of organic aerosol from cooking and other sources in Barcelona using aerosol mass spectrometer data, Atmos. Chem. Phys., 12, 1649–1665, https://doi.org/10.5194/acp-12-1649-2012, 2012.
Ng, N. L., Canagaratna, M. R., Zhang, Q., Jimenez, J. L., Tian, J., Ulbrich, I. M., Kroll, J. H., Docherty, K. S., Chhabra, P. S., Bahreini, R., Murphy, S. M., Seinfeld, J. H., Hildebrandt, L., Donahue, N. M., DeCarlo, P. F., Lanz, V. A., Prévôt, A. S. H., Dinar, E., Rudich, Y., and Worsnop, D. R.: Organic aerosol components observed in Northern Hemispheric datasets from Aerosol Mass Spectrometry, Atmos. Chem. Phys., 10, 4625–4641, https://doi.org/10.5194/acp-10-4625-2010, 2010.
Ng, N. L., Canagaratna, M. R., Jimenez, J. L., Chhabra, P. S., Seinfeld, J. H., and Worsnop, D. R.: Changes in organic aerosol composition with aging inferred from aerosol mass spectra, Atmos. Chem. Phys., 11, 6465–6474, https://doi.org/10.5194/acp-11-6465-2011, 2011a.
Ng, N. L., Herndon, S. C., Trimborn, A., Canagaratna, M. R., Croteau, P. L., Onasch, T. B., Sueper, D., Worsnop, D. R., Zhang, Q., Sun, Y. L., and Jayne, J. T.: An Aerosol Chemical Speciation Monitor (ACSM) for Routine Monitoring of the Composition and Mass Concentrations of Ambient Aerosol, Aerosol Sci. Technol., 45, 780–794, https://doi.org/10.1080/02786826.2011.560211, 2011b.
Paatero, P. and Tapper, U.: Positive matrix factorization: A non-negative factor model with optimal utilization of error estimates of data values, Environmetrics, 5, 111–126, 1994.
Paglione, M., Gilardoni, S., Rinaldi, M., Decesari, S., Zanca, N., Sandrini, S., Giulianelli, L., Bacco, D., Ferrari, S., Poluzzi, V., Scotto, F., Trentini, A., Poulain, L., Herrmann, H., Wiedensohler, A., Canonaco, F., Prévôt, A. S. H., Massoli, P., Carbone, C., Facchini, M. C., and Fuzzi, S.: The impact of biomass burning and aqueous-phase processing on air quality: a multi-year source apportionment study in the Po Valley, Italy, Atmos. Chem. Phys., 20, 1233–1254, https://doi.org/10.5194/acp-20-1233-2020, 2020.
Pathak, R. K., Wu, W. S., and Wang, T.: Summertime PM2.5 ionic species in four major cities of China: nitrate formation in an ammonia-deficient atmosphere, Atmos. Chem. Phys., 9, 1711–1722, https://doi.org/10.5194/acp-9-1711-2009, 2009.
Peng, J., Hu, M., Shang, D., Wu, Z., Du, Z., Tan, T., Wang, Y., Zhang, F., and Zhang, R.: Explosive Secondary Aerosol Formation during Severe Haze in the North China Plain, Environ. Sci. Technol., 55, 2189–2207, https://doi.org/10.1021/acs.est.0c07204, 2021.
Polissar, A. V., Hopke, P. K., and Harris, J. M.: Source Regions for Atmospheric Aerosol Measured at Barrow, Alaska, Environ. Sci. Technol., 35, 4214–4226, https://doi.org/10.1021/es0107529, 2001.
Rollins, A. W., Browne, E. C., Min, K., Pusede, S. E., Wooldridge, P. J., Gentner, D. R., Goldstein, A. H., Liu, S., Day, D. A., and Russell, L. M.: Evidence for NOx control over nighttime SOA formation, Science, 337, 1210–1212, 2012.
Song, M., Liu, X., Tan, Q., Feng, M., Qu, Y., An, J., and Zhang, Y.: Characteristics and formation mechanism of persistent extreme haze pollution events in Chengdu, southwestern China, Environ. Pollut., 251, 1–12, https://doi.org/10.1016/j.envpol.2019.04.081, 2019.
Sun, Y., Chen, C., Zhang, Y., Xu, W., Zhou, L., Cheng, X., Zheng, H., Ji, D., Li, J., Tang, X., Fu, P., and Wang, Z.: Rapid formation and evolution of an extreme haze episode in Northern China during winter 2015, Sci. Rep.-UK, 6, 27151, https://doi.org/10.1038/srep27151, 2016a.
Sun, Y., Jiang, Q., Xu, Y., Ma, Y., Zhang, Y., Liu, X., Li, W., Wang, F., Li, J., Wang, P., and Li, Z.: Aerosol characterization over the North China Plain: Haze life cycle and biomass burning impacts in summer, J. Geophys. Res.-Atmos., 121, 2508–2521, https://doi.org/10.1002/2015JD024261, 2016b.
Sun, Y., He, Y., Kuang, Y., Xu, W., Song, S., Ma, N., Tao, J., Cheng, P., Wu, C., Su, H., Cheng, Y., Xie, C., Chen, C., Lei, L., Qiu, Y., Fu, P., Croteau, P., and Worsnop, D. R.: Chemical Differences Between PM1 and PM2.5 in Highly Polluted Environment and Implications in Air Pollution Studies, Geophys. Res. Lett., 47, e2019GL086288, https://doi.org/10.1029/2019GL086288, 2020.
Sun, Y. L., Zhang, Q., Anastasio, C., and Sun, J.: Insights into secondary organic aerosol formed via aqueous-phase reactions of phenolic compounds based on high resolution mass spectrometry, Atmos. Chem. Phys., 10, 4809–4822, https://doi.org/10.5194/acp-10-4809-2010, 2010.
Sun, Y.-L., Zhang, Q., Schwab, J. J., Demerjian, K. L., Chen, W.-N., Bae, M.-S., Hung, H.-M., Hogrefe, O., Frank, B., Rattigan, O. V., and Lin, Y.-C.: Characterization of the sources and processes of organic and inorganic aerosols in New York city with a high-resolution time-of-flight aerosol mass apectrometer, Atmos. Chem. Phys., 11, 1581–1602, https://doi.org/10.5194/acp-11-1581-2011, 2011.
Tan, Z., Lu, K., Jiang, M., Su, R., Wang, H., Lou, S., Fu, Q., Zhai, C., Tan, Q., Yue, D., Chen, D., Wang, Z., Xie, S., Zeng, L., and Zhang, Y.: Daytime atmospheric oxidation capacity in four Chinese megacities during the photochemically polluted season: a case study based on box model simulation, Atmos. Chem. Phys., 19, 3493–3513, https://doi.org/10.5194/acp-19-3493-2019, 2019.
Tao, J., Zhang, L., Cao, J., and Zhang, R.: A review of current knowledge concerning PM2.5 chemical composition, aerosol optical properties and their relationships across China, Atmos. Chem. Phys., 17, 9485–9518, https://doi.org/10.5194/acp-17-9485-2017, 2017.
Tian, M., Liu, Y., Yang, F., Zhang, L., Peng, C., Chen, Y., Shi, G., Wang, H., Luo, B., Jiang, C., Li, B., Takeda, N., and Koizumi, K.: Increasing importance of nitrate formation for heavy aerosol pollution in two megacities in Sichuan Basin, southwest China, Environ. Pollut., 250, 898–905, https://doi.org/10.1016/j.envpol.2019.04.098, 2019.
Ulbrich, I. M., Canagaratna, M. R., Zhang, Q., Worsnop, D. R., and Jimenez, J. L.: Interpretation of organic components from Positive Matrix Factorization of aerosol mass spectrometric data, Atmos. Chem. Phys., 9, 2891–2918, https://doi.org/10.5194/acp-9-2891-2009, 2009.
Wang, G., Zhang, R., Gomez, M. E., Yang, L., Levy Zamora, M., Hu, M., Lin, Y., Peng, J., Guo, S., Meng, J., Li, J., Cheng, C., Hu, T., Ren, Y., Wang, Y., Gao, J., Cao, J., An, Z., Zhou, W., Li, G., Wang, J., Tian, P., Marrero-Ortiz, W., Secrest, J., Du, Z., Zheng, J., Shang, D., Zeng, L., Shao, M., Wang, W., Huang, Y., Wang, Y., Zhu, Y., Li, Y., Hu, J., Pan, B., Cai, L., Cheng, Y., Ji, Y., Zhang, F., Rosenfeld, D., Liss, P. S., Duce, R. A., Kolb, C. E., and Molina, M. J.: Persistent sulfate formation from London Fog to Chinese haze, P. Natl. Acad. Sci. USA, 113, 13630–13635, https://doi.org/10.1073/pnas.1616540113, 2016.
Wang, H., Tian, M., Chen, Y., Shi, G., Liu, Y., Yang, F., Zhang, L., Deng, L., Yu, J., Peng, C., and Cao, X.: Seasonal characteristics, formation mechanisms and source origins of PM2.5 in two megacities in Sichuan Basin, China, Atmos. Chem. Phys., 18, 865–881, https://doi.org/10.5194/acp-18-865-2018, 2018.
Wang, J., Ge, X., Chen, Y., Shen, Y., Zhang, Q., Sun, Y., Xu, J., Ge, S., Yu, H., and Chen, M.: Highly time-resolved urban aerosol characteristics during springtime in Yangtze River Delta, China: insights from soot particle aerosol mass spectrometry, Atmos. Chem. Phys., 16, 9109–9127, https://doi.org/10.5194/acp-16-9109-2016, 2016.
Wang, J., Li, J., Ye, J., Zhao, J., Wu, Y., Hu, J., Liu, D., Nie, D., Shen, F., Huang, X., Huang, D. D., Ji, D., Sun, X., Xu, W., Guo, J., Song, S., Qin, Y., Liu, P., Turner, J. R., Lee, H. C., Hwang, S., Liao, H., Martin, S. T., Zhang, Q., Chen, M., Sun, Y., Ge, X., and Jacob, D. J.: Fast sulfate formation from oxidation of SO2 by NO2 and HONO observed in Beijing haze, Nat. Commun., 11, 1–7, https://doi.org/10.1038/s41467-020-16683-x, 2020.
Wang, J., Ye, J., Zhang, Q., Zhao, J., Wu, Y., Li, J., Liu, D., Li, W., Zhang, Y., Wu, C., Xie, C., Qin, Y., Lei, Y., Huang, X., Guo, J., Liu, P., Fu, P., Li, Y., Lee, H. C., Choi, H., Zhang, J., Liao, H., Chen, M., Sun, Y., Ge, X., Martin, S. T., and Jacob, D. J.: Aqueous production of secondary organic aerosol from fossil-fuel emissions in winter Beijing haze, P. Natl. Acad. Sci. USA, 118, e2022179118, https://doi.org/10.1073/pnas.2022179118, 2021.
Wang, Y., Yao, L., Wang, L., Liu, Z., Ji, D., Tang, G., Zhang, J., Sun, Y., Hu, B., and Xin, J.: Mechanism for the formation of the January 2013 heavy haze pollution episode over central and eastern China, Sci. China Earth Sci., 57, 14–25, https://doi.org/10.1007/s11430-013-4773-4, 2014.
Weimer, S., Alfarra, M. R., Schreiber, D., Mohr, M., Prévôt, A. S. H., and Baltensperger, U.: Organic aerosol mass spectral signatures from wood-burning emissions: Influence of burning conditions and wood type, J. Geophys. Res., 113, D10304, https://doi.org/10.1029/2007JD009309, 2008.
Wen, L., Xue, L., Wang, X., Xu, C., Chen, T., Yang, L., Wang, T., Zhang, Q., and Wang, W.: Summertime fine particulate nitrate pollution in the North China Plain: increasing trends, formation mechanisms and implications for control policy, Atmos. Chem. Phys., 18, 11261–11275, https://doi.org/10.5194/acp-18-11261-2018, 2018.
Wu, L., Zhang, X., Sun, J., Wang, Y., Zhong, J., and Meng, Z.: Intensified wintertime secondary inorganic aerosol formation during heavy haze pollution episodes (HPEs) in Beijing, China, J. Environ. Sci.-China, 114, 503–513, https://doi.org/10.1016/j.jes.2022.01.008, 2022.
Xiao, Y., Hu, M., Li, X., Zong, T., Xu, N., Hu, S., Zeng, L., Chen, S., Song, Y., Guo, S., and Wu, Z.: Aqueous secondary organic aerosol formation attributed to phenols from biomass burning, Sci. Total Environ., 847, 157582, https://doi.org/10.1016/j.scitotenv.2022.157582, 2022.
Xu, W., Croteau, P., Williams, L., Canagaratna, M., Onasch, T., Cross, E., Zhang, X., Robinson, W., Worsnop, D., and Jayne, J.: Laboratory characterization of an aerosol chemical speciation monitor with PM2.5 measurement capability, Aerosol Sci. Tech., 51, 69–83, 2017a.
Xu, W., Han, T., Du, W., Wang, Q., Chen, C., Zhao, J., Zhang, Y., Li, J., Fu, P., Wang, Z., Worsnop, D. R., and Sun, Y.: Effects of Aqueous-Phase and Photochemical Processing on Secondary Organic Aerosol Formation and Evolution in Beijing, China, Environ. Sci. Technol., 51, 762–770, https://doi.org/10.1021/acs.est.6b04498, 2017b.
Yan, F., Chen, W., Jia, S., Zhong, B., Yang, L., Mao, J., Chang, M., Shao, M., Yuan, B., Situ, S., Wang, X., Chen, D., and Wang, X.: Stabilization for the secondary species contribution to PM2.5 in the Pearl River Delta (PRD) over the past decade, China: A meta-analysis, Atmos. Environ., 242, 117817, https://doi.org/10.1016/j.atmosenv.2020.117817, 2020.
Yu, L., Smith, J., Laskin, A., Anastasio, C., Laskin, J., and Zhang, Q.: Chemical characterization of SOA formed from aqueous-phase reactions of phenols with the triplet excited state of carbonyl and hydroxyl radical, Atmos. Chem. Phys., 14, 13801–13816, https://doi.org/10.5194/acp-14-13801-2014, 2014.
Zhai, S., Jacob, D. J., Wang, X., Liu, Z., Wen, T., Shah, V., Li, K., Moch, J. M., Bates, K. H., Song, S., Shen, L., Zhang, Y., Luo, G., Yu, F., Sun, Y., Wang, L., Qi, M., Tao, J., Gui, K., Xu, H., Zhang, Q., Zhao, T., Wang, Y., Lee, H. C., Choi, H., and Liao, H.: Control of particulate nitrate air pollution in China, Nat. Geosci., 14, 389–395, https://doi.org/10.1038/s41561-021-00726-z, 2021.
Zhan, B., Zhong, H., Chen, H., Chen, Y., Li, X., Wang, L., Wang, X., Mu, Y., Huang, R., George, C., and Chen, J.: The roles of aqueous-phase chemistry and photochemical oxidation in oxygenated organic aerosols formation, Atmos. Environ., 266, 118738, https://doi.org/10.1016/j.atmosenv.2021.118738, 2021.
Zhang, L., Guo, X., Zhao, T., Gong, S., Xu, X., Li, Y., Luo, L., Gui, K., Wang, H., Zheng, Y., and Yin, X.: A modelling study of the terrain effects on haze pollution in the Sichuan Basin, Atmos. Environ., 196, 77–85, https://doi.org/10.1016/j.atmosenv.2018.10.007, 2019.
Zhang, Q., Worsnop, D. R., Canagaratna, M. R., and Jimenez, J. L.: Hydrocarbon-like and oxygenated organic aerosols in Pittsburgh: insights into sources and processes of organic aerosols, Atmos. Chem. Phys., 5, 3289–3311, https://doi.org/10.5194/acp-5-3289-2005, 2005.
Zhang, Q., Jimenez, J. L., Canagaratna, M. R., Ulbrich, I. M., Ng, N. L., Worsnop, D. R., and Sun, Y.: Understanding atmospheric organic aerosols via factor analysis of aerosol mass spectrometry: a review, Anal. Bioanal. Chem., 401, 3045–3067, https://doi.org/10.1007/s00216-011-5355-y, 2011.
Zhang, Y. W., Zhang, X. Y., Zhang, Y. M., Shen, X. J., Sun, J. Y., Ma, Q. L., Yu, X. M., Zhu, J. L., Zhang, L., and Che, H. C.: Significant concentration changes of chemical components of PM1 in the Yangtze River Delta area of China and the implications for the formation mechanism of heavy haze–fog pollution, Sci. Total Environ., 538, 7–15, https://doi.org/10.1016/j.scitotenv.2015.06.104, 2015.
Zhao, D., Liu, G., Xin, J., Quan, J., Wang, Y., Wang, X., Dai, L., Gao, W., Tang, G., Hu, B., Ma, Y., Wu, X., Wang, L., Liu, Z., and Wu, F.: Haze pollution under a high atmospheric oxidization capacity in summer in Beijing: insights into formation mechanism of atmospheric physicochemical processes, Atmos. Chem. Phys., 20, 4575–4592, https://doi.org/10.5194/acp-20-4575-2020, 2020.
Zhao, J., Qiu, Y., Zhou, W., Xu, W., Wang, J., Zhang, Y., Li, L., Xie, C., Wang, Q., Du, W., Worsnop, D. R., Canagaratna, M. R., Zhou, L., Ge, X., Fu, P., Li, J., Wang, Z., Donahue, N. M., and Sun, Y.: Organic Aerosol Processing During Winter Severe Haze Episodes in Beijing, J. Geophys. Res.-Atmos., 124, 10248–10263, https://doi.org/10.1029/2019JD030832, 2019.
Zhao, R., Mungall, E. L., Lee, A. K. Y., Aljawhary, D., and Abbatt, J. P. D.: Aqueous-phase photooxidation of levoglucosan – a mechanistic study using aerosol time-of-flight chemical ionization mass spectrometry (Aerosol ToF-CIMS), Atmos. Chem. Phys., 14, 9695–9706, https://doi.org/10.5194/acp-14-9695-2014, 2014.
Zheng, G., Duan, F., Ma, Y., Zhang, Q., Huang, T., Kimoto, T., Cheng, Y., Su, H., and He, K.: Episode-Based Evolution Pattern Analysis of Haze Pollution: Method Development and Results from Beijing, China, Environ. Sci. Technol., 50, 4632–4641, https://doi.org/10.1021/acs.est.5b05593, 2016.
Zheng, G. J., Duan, F. K., Su, H., Ma, Y. L., Cheng, Y., Zheng, B., Zhang, Q., Huang, T., Kimoto, T., Chang, D., Pöschl, U., Cheng, Y. F., and He, K. B.: Exploring the severe winter haze in Beijing: the impact of synoptic weather, regional transport and heterogeneous reactions, Atmos. Chem. Phys., 15, 2969–2983, https://doi.org/10.5194/acp-15-2969-2015, 2015.
Zhou, W., Chen, C., Lei, L., Fu, P., and Sun, Y.: Temporal variations and spatial distributions of gaseous and particulate air pollutants and their health risks during 2015–2019 in China, Environ. Pollut., 272, 116031, https://doi.org/10.1016/j.envpol.2020.116031, 2021.