the Creative Commons Attribution 4.0 License.
the Creative Commons Attribution 4.0 License.
 | 23 Jan 2023
Temporal and spatial variations in atmospheric unintentional PCB emissions in Chinese mainland from 1960 to 2019
Ye Li
Ye Huang
Yunshan Zhang
Wei Du
Shanshan Zhang
Tianhao He
Yan Li
Yan Chen
Fangfang Ding
Lin Huang
Haibin Xia
Wenjun Meng
Min Liu
Shu Tao
Polychlorinated biphenyls (PCBs) are nowadays mainly unintentionally produced, since their use and manufacture has been banned. PCBs, especially those dioxin-like compounds, have been proven harmful to ecosystems and human health. Detailed information about the spatiotemporally distribution of unintentionally produced PCBs (UP-PCBs) is crucial for understanding the environmental fate and associated health risks. However, research estimating UP-PCBs emission in China is limited. In this study, a source-specific and year-varying emission factor (EF) dataset was used to compile provincial emissions of 12 dioxin-like UP-PCBs congeners for 66 sources in the Chinese mainland from 1960 to 2019. In addition to that, emissions for 2019 were allocated into grids. The results indicated that historical national UP-PCBs emission represented an increasing trend until around 1995 and then showed an overall decreasing trend from 1995 to 2019. Cement production was the largest UP-PCBs emission source in the Chinese mainland. Geographically, East and North China contributed the largest UP-PCBs emission across the Chinese mainland. High emission densities occurred mainly in the densely populated and well-developed regions such as Yangtze River Delta Urban Agglomeration and Pearl River Delta. Furthermore, highly positive correlations of emission densities with population and GDP densities were identified.
- Article
(4666 KB) - Full-text XML
-
Supplement
(1059 KB) - BibTeX
- EndNote


Polychlorinated biphenyls (PCBs) are a group of typical persistent organic pollutants (POPs) that have been intentionally produced for dielectric and heat exchange fluids in electronic products and unintentionally produced through a series of combustion and industrial processes (Jepson and Law, 2016; Lu et al., 2021; Zhang et al., 2013; Zhao et al., 2020). Due to characteristics of hydrophobicity and persistence, PCBs can undergo long-distance transportation and result in ubiquitous contamination of the biosphere (Desforges et al., 2018). PCBs show a toxic threat to humans and animals by impairing the reproduction system and disrupting the endocrine and immune systems (Desforges et al., 2018; Wirgin et al., 2011). Moreover, PCBs represent biomagnification by accumulating through the food web and thus pose a risk of adverse effects to wildlife (Desforges et al., 2018; McLeod et al., 2015; Ranjbar Jafarabadi et al., 2019). In 2001, PCBs were listed as 1 of 12 initial POPs at that Stockholm Convention, and more than 90 signatory countries committed to phasing out or eliminating large stocks or other sources of these compounds (UNEP, 2001). In 2005, WHO evaluated the toxic equivalence factors of dioxins and dioxin-like compounds, and 12 PCB congeners were identified with potentially significant adverse impacts on human health and the environment. Globally, PCBs were mainly used commercially between the 1930s and 1970s. It has been estimated that ∼ 1.3 million metric tons (tonnes, t) were produced during this period, mostly occurring in the United States (∼ 48 %), Russia (∼ 13 %), Germany (∼ 12 %), France (∼ 10 %), the United Kingdom (∼ 5 %) and Japan (∼ 4.4 %) (Breivik et al., 2002a, 2007). In China, ∼ 1000 t of PCBs were produced between 1965 and 1974, which accounted for ∼ 0.8 % of the total global PCBs production (Lu et al., 2021; Xing et al., 2005). Subsequently, the use and manufacture of PCBs were banned in Japan (1972) (Kim and Masunaga, 2005), China (1974) (Zhang et al., 2013), the United States (1979) (Marek et al., 2013), the United Kingdom (1981) (Jurgens et al., 2015), and the European Union (1987) (Jepson et al., 2016). As a result, the concentration levels of PCBs started to slowly decline in the environment around the world. However, the unintentionally produced PCBs (UP-PCBs) are still emitted after the bans and may have become the major sources of PCBs in the current environment (Cui et al., 2013; Desforges et al., 2018; Zhao et al., 2020), posing continuous threats to ecosystems.
Accurate estimation of PCB emissions is essential for comprehensive understanding of their behaviors in the environment and the adverse effects on human health and ecosystems. Emission inventory with detailed sources and spatial–temporal information can support policymaking in mitigating PCB pollution with cost-effective control strategies (Quaß et al., 2004) and provide key input data for environmental modeling of PCBs (Gluge et al., 2016; ter Schure et al., 2004). The first global intentionally produced PCBs (IP-PCBs) emission inventory was introduced by Breivik et al. (2002a, b). The emission of 22 PCB congeners was estimated for 70 years in 114 individual countries with a resolution of (Breivik et al., 2007). On the national scale, Yang et al. (2010) and Cui et al. (2013) estimated the emissions of UP-PCBs in China. In their study, cement production represented the largest source of UP-PCBs emissions in China by applying emission factors (EFs) of 7.4 and 5.1 g t−1 based on data in Japan (Yamamoto et al., 2011), while much lower values of 133–375 µg t−1 for cement kilns with fabric filter in China were reported (Liu et al., 2013), indicating that large uncertainties might still exist in emission estimation for cement production. EFs for 12 dioxin-like UP-PCBs were summarized in a toolkit for identification and quantification of releases of dioxins, furans, and other unintentional POPs under Article 5 of the Stockholm Convention on Persistent Organic Pollutants (UNEP, 2013), but they were last updated in 2013, and recently reported EFs were not included. EFs are always with large variations and vary with time and regions, due to differences in fuel quality, facility, abatement measures, and other factors (Meng et al., 2017; Shen et al., 2013). Thus, homemade EFs were preferred (best estimate) over those reported in the toolkit in this study in order to accurately estimate emissions (Huang et al., 2014; Meng et al., 2017). Declining trends of EFs were always reported (Huang et al., 2022; Meng et al., 2017; Shen et al., 2011; Wang et al., 2012), mainly because of adoption of advanced combustion, production, or abatement technologies. A technology split method, which assumes that the change in EFs for a given source was due to technology transformation within the source (Bond et al., 2004), was applied to model time-varying EFs. However, fixed EFs were applied in most of the studies estimating PCBs emissions, resulting in underestimation of past emissions or overestimation of current emissions (Huang et al., 2014, 2022). Overall, current research has been limited by incomplete coverage of emission sources, unreliable determination of EFs, and no available data for recent years (Breivik et al., 2006), resulting in large uncertainties of the current popular models (Chatzikosma and Voudrias, 2007; Glüge et al., 2016; Lei et al., 2021). Therefore, an elaborate UP-PCBs emission inventory is urgently needed.
In this study, an EF database of 12 dioxin-like UP-PCBs for various sources was compiled based on a thorough literature review (Tables S1 and S2 in the Supplement). Time-varying EFs for key sources were acquired using the technology split method developed by Bond et al. (2004) and widely adopted in development of emission inventories (Meng et al., 2017; Shen et al., 2013; Wang et al., 2014a). Provincial atmospheric emissions of 12 dioxin-like UP-PCBs (Table S3) for 66 sources (Table S1) from 1960 to 2019 in the Chinese mainland were compiled. Furthermore, a high spatial resolution () inventory for 2019 was developed based on PKU-FUEL (inventory.pku.edu.cn) (Wang et al., 2013). In addition, the uncertainties of emission estimations were quantified by the Monte Carlo simulation, and characteristics of geospatial and temporal variations in total, per capita emissions and emission intensities were investigated.
2.1 Emission sources and activity data
Various combustion and industrial processes could release PCBs. Emission factors for the burning of coal, oil, biomass, and waste were reported in previous studies (Lee et al., 2005; Liu et al., 2013; UNEP, 2013) and those sources were included in this study. However, there were no data available for the burning of gas; thus, these sources were excluded. Fuel consumption data were from PKU-FUEL (Wang et al., 2013), which has county-level energy consumption data for China and was updated to cover the period of 1960–2019. Besides, PCBs would also be emitted during the production of cement, coke, vinyl chloride monomer, iron and steel, and other metals, as well as cremation of corpses. Activity data for these sources were directly acquired from the China Statistical Yearbook (NBSC, 2020). In total, 66 sources were considered in compiling the inventory and reclassified into nine categories for further analysis (Table S1).
2.2 Emission factors
A thorough literature review was undertaken to update the EFs database by taking the recently published EFs into account. The technology split method was applied to acquire dynamic EFs. In detail, coke production was classified into beehive coke and mechanical coke (NBSC, 2020); electric arc furnace, oxygen blown converter, and open hearth furnace were considered for raw steel production (WSA, 2021); precalciner kiln and other kiln were taken into account for cement production (Huang et al., 2014). Regarding applying of abatement facilities, only the controlled and the uncontrolled were considered due to a lack of in-depth data. This simplification has been proven to be effective in estimating emissions of dioxins (Huang et al., 2022). The choice of EFs for each source were listed in Table S1. The composition profiles (Table S2) of 12 dioxin-like UP-PCBs for various sources were obtained to further calculate the emissions of each congener.
2.3 Emission estimation and spatial allocation
A bottom-up procedure was applied to compile the inventory. Provincial emissions of each PCB congener for each source were calculated as products of the source strength and corresponding EFs. Provincial emissions of 2019 were further allocated into grids using various surrogates. For fuel combustion sources (including agricultural waste burning and wildfire), gridded fuel consumption data from PKU-FUEL (Wang et al., 2013) were used to disaggregate emissions. In PKU-FUEL, county level fuel consumption data were acquired and were further disaggregated into grids using GDP, rural population, urban population or total population depending on fuel categories. For fuel consumed in power plants and production of lime, coke, as well as aluminum, the geolocations of the sources were obtained to allocate emissions. For agricultural waste burning and wildfire, emissions were firstly allocated into grids based on dry matter burned from GFED4 (van der Werf et al., 2017) and were further disaggregated into using vegetation density (Friedl et al., 2002). For cremation of corpse, which was a PCBs source included in this study, gridded population density (Oak Ridge National Laboratory, 2020) was applied to allocate emissions. For other sources that were not included in PKUE-FUEL, gridded industrial coal consumption from PKU-FUEL was used as surrogate.
2.4 Uncertainty analysis
Monte Carlo simulations were run 100 000 times considering variations both in source strength and EFs to assess the uncertainties of emission inventory. Variations of 5 %, 10 %, 20 %, and 30 % were set to the power and heating sector, industrial sector, residential sector, and open biomass burning, respectively, with uniform distribution assumed (Huang et al., 2014, 2022; Shen et al., 2013, 2017). Although lognormal distribution was often assumed for EFs (Shen et al., 2013; Wang et al., 2014b), it could not directly be applied in Monte Carlo simulation in estimating emissions; otherwise, the median value would underestimate emissions (Bond et al., 2004). On the basis of Cox's method (Zhou and Gao, 1997), the standard deviation (SD) of best estimate (BE) for EF (actually the arithmetic mean instead of geometric mean) could be calculated using the geometric standard deviation (σ is SD of log-transformed EFs) by:
where N is sample size. Best estimates and uncertainty ranges of emissions then could be represented by medians and interquartile ranges derived from the Monte Carlo simulations.
3.1 National and provincial emissions from various sources in 2019
The annual total atmospheric emissions of UP-PCBs in the Chinese mainland were estimated to be around 249.0 (interquartile range: 150.9–706.2) g WHO-TEQ or 1.0 (0.6–1.8) t. Total annual emissions for specific provinces and their source profiles are shown in Fig. 1. Hebei, Jiangsu, Shandong, Guangdong, Heilongjiang, Henan, Hubei, Hunan, and Anhui ranked at the top, which accounted for more than 50 % of total emissions (124.6 g WHO-TEQ). Our estimation of 1.1 (0.7–2.0) t in 2010 was lower than the 1.5 t reported by Cui et al. (2013) due to a much higher EF applied for cement production in their study, but higher than their updated estimation of 0.7 t with lower EF applied for cement production (Cui et al., 2015), owing to wider coverage of emission sources in this study. Liu et al. (2013) estimated emissions of 3.5 and 0.6 kg for cement and iron and steel production in 2009, respectively, which were much lower than the 53.3 (24.6–116.2) and 5.2 (2.9–9.7) kg, respectively, acquired in this study. In their study, EFs were all for plants with good abatement measures, and it might not be appropriate to use as a best estimate for the national average. Besides, they used the geomean instead of the arithmetic mean, which would have resulted in further underestimation of emissions (Bond et al., 2004).

Figure 1Total (pie chart) and provincial (columns) emissions for the Chinese mainland in 2019.
Among various sources, cement production (22.6 %) was the largest UP-PCBs emission source in the Chinese mainland in 2019, followed by the industry boilers sector (17.7 %) and iron and steel production (16.5 %) (Fig. 1). Due to variations in development status, industrial structure, energy structure, and land use/cover, the source profiles showed distinct characters among different regions (Table S4) across China (Fig. 2). For example, cement production and the industry boilers sector contributed most UP-PCBs emissions in southwest China because of widespread distribution of cement plants in this area (Li et al., 2021; NBSC, 2020; Song et al., 2019). In addition, North China accounted for more than 33 % of total iron and steel production in the Chinese mainland (NBSC, 2020). The contributions of iron and steel production to total emission of this region could reach 34.6 %, which is much higher than that in other regions. Open biomass burning was the largest contributor (44.9 %) of UP-PCBs in northeast China due to high forest coverage and cultivation activities (Chen et al., 2019; Song and Deng, 2017) associated with a high rate of wildfires and a large number of crop residues burned outside (Yin et al., 2019; Zhao and Liu, 2019). This region accounted for around 15 % of wildfires (affected forest area) and 20 % of crop production in 2019, respectively, in the Chinese mainland (NBSC, 2020). Waste burning contributed most to UP-PCBs emissions in South China because of its abundance of e-waste sites (Chen et al., 2014; Wang et al., 2017). Non-ferrous metals were the highest contributor of UP-PCBs emissions in northwest China due to extensive distribution of non-ferrous metals plants and relatively small emissions from other sources (e.g., the residential sector and waste burning due to low population density) (Huang et al., 2022).

Figure 2Spatial distribution of emission densities across the Chinese mainland (the resolution is ) and the sum of emissions from various emission sources in different regions in 2019.
3.2 Composition profiles of 12 dioxin-like UP-PCBs congeners
Figure 3 shows composition profiles of 12 dioxin-like UP-PCBs emissions in the Chinese mainland. PCB 118, PCB 105, and PCB 77 were the three largest contributors in terms of mass (Fig. 3a), which accounted for 42.1 %, 30.4 %, and 12.2 % of total emissions, respectively, whereas PCB 126, the most toxic UP-PCBs compound, only contributed 0.2 % of total emissions. The other dioxin-like UP-PCBs, including PCB 81, PCB 114, PCB 123, PCB 156, PCB 157, PCB 167, PCB 169, and PCB 189, accounted for 15.2 % of total emissions. For PCB 118, PCB 105, and PCB 77, open biomass (>59 %) and waste burning (>19 %) were two major sources (Fig. S1 in the Supplement). Cement production, the industry boilers sector, and iron and steel production contributed significantly to emission of PCB 126. Open biomass burning, waste burning, and the residential sector were the top three emission sources for the rest of the dioxin-like UP-PCBs. In terms of TEQ (Fig. 3b), PCB 126 made the greatest contribution of 79.6 %. Despite that PCB 169 only accounted for 0.04 % of the total emission in mass, it contributed 4.4 % in terms of TEQ due to its high toxicities. On the contrary, PCB 77, PCB 105, and PCB 118 accounted for 12.2 %, 30.4 %, and 42.1 % of total emission in mass, respectively, but decreased to 5.0 %, 3.7 %, and 5.2 % in terms of TEQ due to their relatively low toxicities compared with PCB 126 and PCB 169. In general, PCB 126, PCB 169, PCB 77, PCB 105, and PCB 118 should be the priority concern with regard to protecting human health.
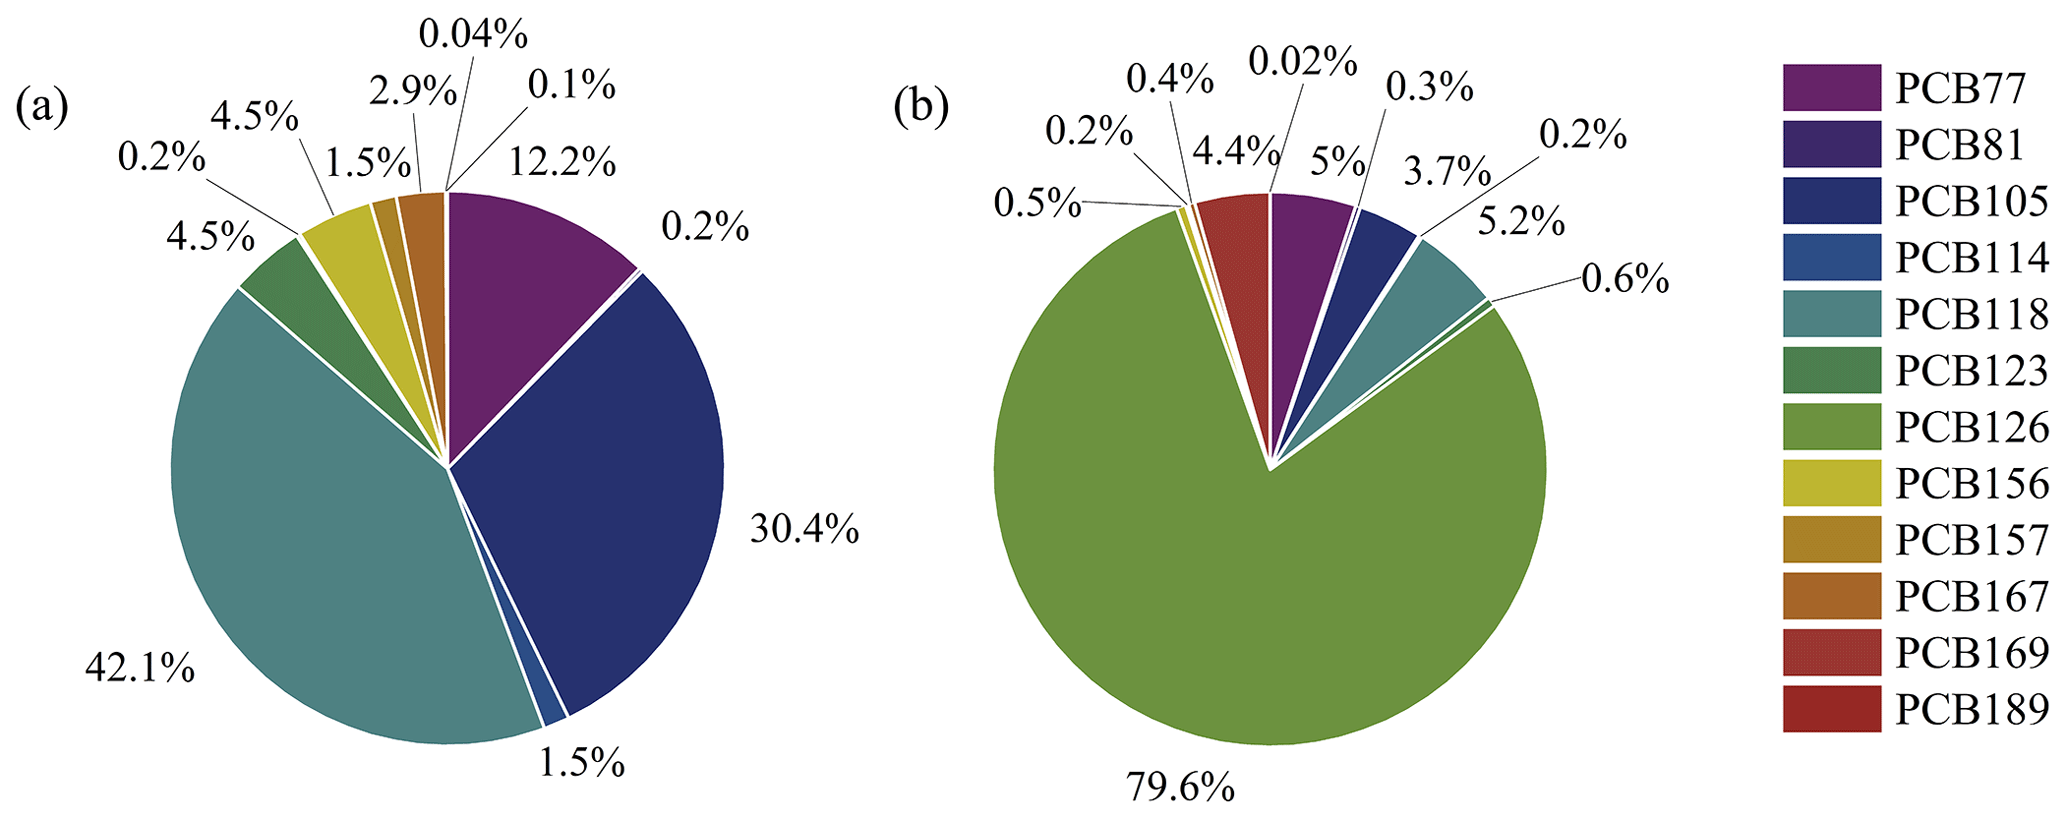
Figure 3Emission profiles for 12 dioxin-like UP-PCBs in the Chinese mainland in 2019. Pie charts for PCBs congeners in terms of mass (a) and TEQ (b), respectively.
TEQ/u, defined as g WHO-TEQ per unit of mass of UP-PCBs emissions from a given source, was calculated to determine the toxicities of emission sources. According to Table S5, iron and steel production was the most toxic UP-PCBs emission source with the TEQ/u value of g WHO-TEQ g−1, followed by the non-ferrous metals sector ( g WHO-TEQ g−1), others sector ( g WHO-TEQ g−1), cement production ( g WHO-TEQ g−1), and industry boilers ( g WHO-TEQ g−1), indicating that these sources released large amounts of highly toxic UP-PCB congeners. This suggests that these sources represented a potentially higher priority to be reduced compared with other sources with regard to protecting human health. However, the financial costs of reducing emissions might vary a lot among sources and regions (Wang et al., 2021), resulting in difficulty in determining sources that should be controlled on a priority basis.
3.3 Uneven distribution of emission densities and per capita emissions
Geographic distribution of UP-PCBs emission densities is shown in Fig. 2. The distribution coincides with the Huanyong Line, the famous empirical line that divides China into the densely populated region and sparsely populated region (Cheng et al., 2022). High emission densities were mainly occurred in the densely populated and well-developed regions such as Yangtze River Delta Urban Agglomeration, Pearl River Delta, North China Plain, and Sichuan Basin. The distribution was similar to other human- activity-related pollutants like black carbon, ammonia, PAHs, PM2.5, and PCDD/F (Huang et al., 2014, 2022; Meng et al., 2017; Shen et al., 2013; Wang et al., 2014a, b). The geographic distribution of per capita UP-PCBs emission differed from that of emission densities (Fig. S2), which showed a decreasing trend from north to south. In some sparsely populated regions of northeast and northwest China, such as Karamay (Xinjiang), Tsitsihar (Heilongjiang), and Golmud (Qinghai), the per capita emissions were seriously high due to significant emissions from heavy industry with relatively low population density (NBSC, 2020).
The average emission density and per capita emission of the Chinese mainland were 0.03 ng WHO-TEQ m−2 and 0.18 µg WHO-TEQ/person, respectively. Shanghai, Tianjin, and Jiangsu represented the highest emission density with values of 0.31, 0.17 and 0.15 ng WHO-TEQ m−2, respectively (Fig. S3). According to Fig. 1, iron and steel production was the largest contributor in these regions. The per capita emissions in these regions were below the national average mainly because population density was much higher than the national average (NBSC, 2020). On the contrary, Tibet, Qinghai, and Xinjiang showed the lowest emission density due to less developed industry and sparse population distribution. Tibet, Qinghai, and Xinjiang accounted for 38 % of the area but only contributed to 2 % of the population and 2 % of the GDP of China in 2019 (NBSC, 2020). The relationships of emission densities with population densities as well as GDP densities are shown in Fig. S4a and b. The emission densities were highly positively correlated with the population (R2=0.92) and GDP (R2=0.88) densities. This indicates that population might be a more important driver than GDP for UP-PCBs emissions, which might be explained by the fact that the proxy used for spatial allocation of some key sources (e.g., burning non-organized small-scale waste, municipal waste, residential solid fuel use) were population, not GDP (Wang et al., 2013).

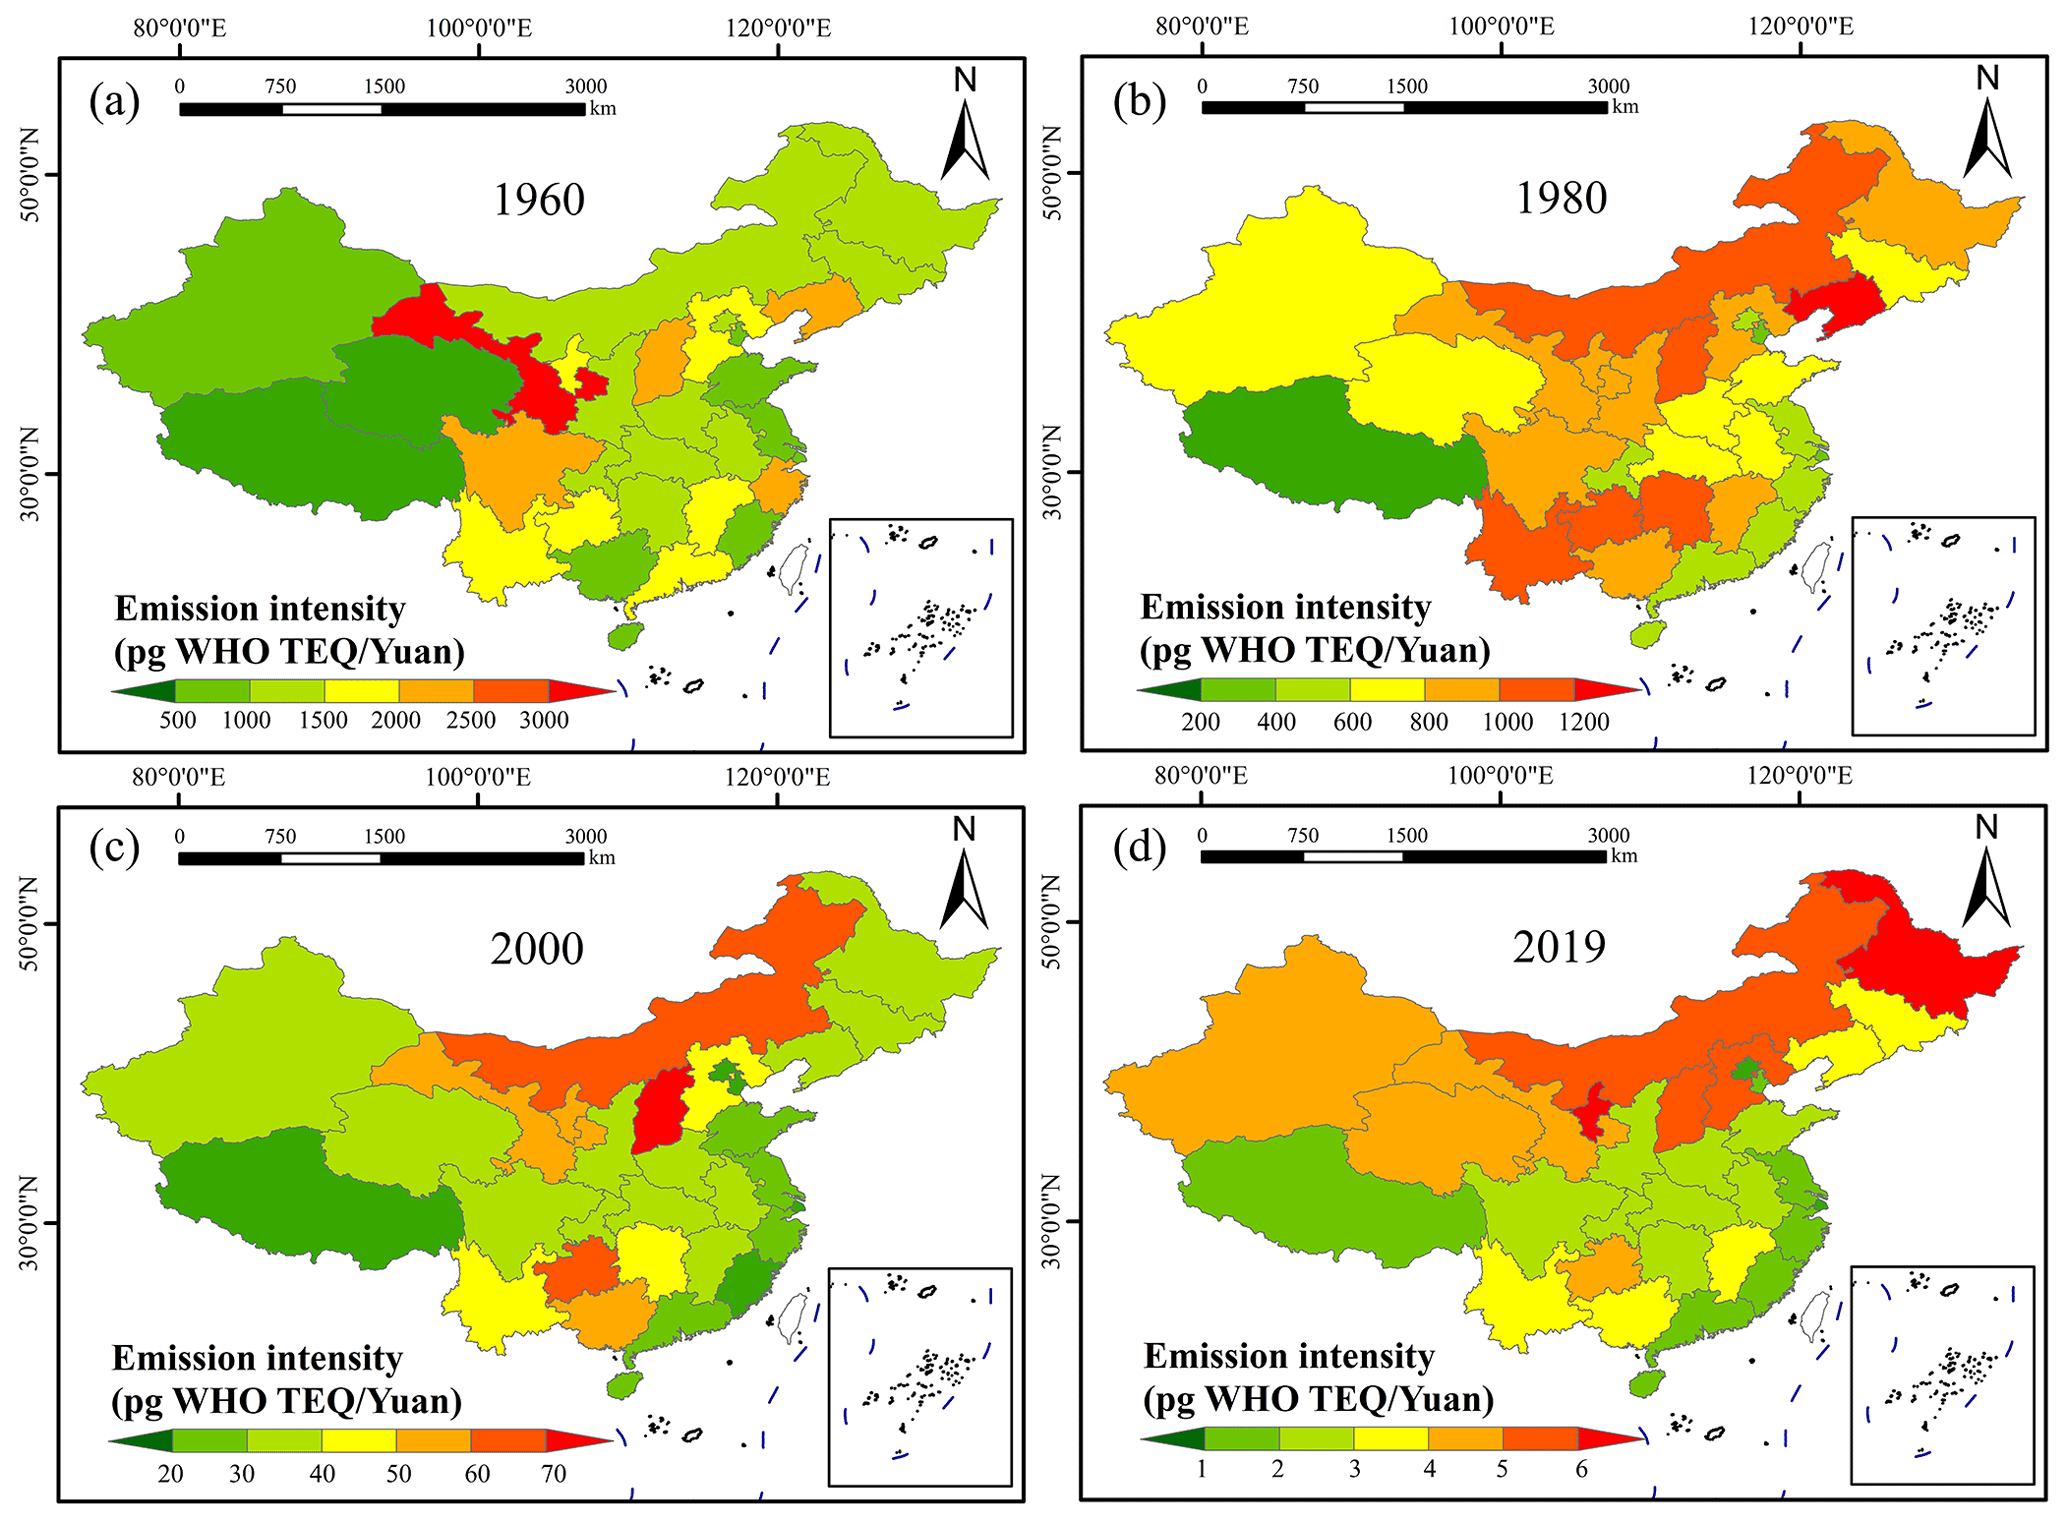
Figure 5Emission intensities of UP-PCBs (pg WHO TEQ/yuan) across the Chinese mainland in the years 1960 (a), 1980 (b), 2000 (c), and 2019 (d).
The above results suggest that the urbanization degree (or development degree) has highly impacted the distribution of UP-PCBs emissions. To better evaluate the emission disparities among regions with different levels of development, the Chinese mainland was classified into city, town, and rural areas based on the population density threshold method introduced by Wang et al. (2013). Figure S5 shows emission densities and per capita emissions for city, town, and rural areas from nine source categories. Despite that per capita emissions followed the order of city < town < rural areas, emission densities were completely the opposite, indicating higher exposure risks of UP-PCBs for people living in cities than in towns, and in towns than in rural areas. Regarding source profiles, the major difference was that contribution of open biomass burning was significant in rural areas but negligible in cities and towns.
3.4 Historical trends of emissions from various sectors and regions
Historical trends of UP-PCBs emissions from various source categories and regions are shown in Fig. 4. The national UP-PCBs emissions represented an increasing trend before 1995. This was mainly driven by the increasing emissions from cement production during this period with cement production having increased 29 times (NBSC, 2020). Then, the national UP-PCBs emissions showed an overall decreasing trend from 1995 to 2019. In this period, cement production only increased four times, while the EFs decreased by 94.2 %. In the meantime, industrial consumption of coal, and production of iron and steel, increased by factors of 1.5, 7.6, and 8.6, respectively. However, their EFs decreased by 56.6 %, 74.8 % and 45.5 %, respectively. Besides, UP-PCBs emissions from waste burning, the non-ferrous metal sector, residential sector, and power and heating sector kept increasing before 1990 but have been decreasing ever since. This trend was similar to that of pollutants like black carbon, PM2.5, PAHs, and PCDD/Fs (Huang et al., 2014, 2022; Shen et al., 2013; Wang et al., 2012), mainly because of widely applying abatement facilities (Shen et al., 2021). The variation in the residential sector mainly resulted from energy structures transition (Tao et al., 2018). It should be pointed out that the historical emissions might be associated with large uncertainties due to a lack of both, EF data in the early years and in-depth information about the technology split, as EFs for a given source could vary multiple orders of magnitude (UNEP, 2013).
Figure 4a shows temporal trends of emissions from different regions in the Chinese mainland. Cement production was the major contributor across the Chinese mainland from 1960 to 2019, followed by waste burning and the industry boilers sector. In general, cement production emissions increased from 1960 to around 1995, except for in northwest and northeast China. From 1995 to 2019, the contribution of the iron and steel sector increased a lot in North China as production of iron and steel increased by about 13 times. In the same period, the emission contribution from the industry boilers sector substantially increased in eastern, central, southwest and northeast China (Fig. S6). Waste burning showed an overall decreasing trend from 1960 to 2019 at the national scale owing to continuously decreasing EF required by the increasingly more strict emission standard (Cheng et al., 2020). In northeast China, open biomass burning significantly increased from 2014 to 2019, which might be explained by the increasing temperature which resulted in more and more intensive wildfires (Diffenbaugh et al., 2021; Running, 2006).
3.5 Spatial–temporal characteristics of emission intensity
Emission intensity (EI), defined as anthropogenic emissions per unit of GDP, was calculated. EIs had great disparities in space and varied over time (Fig. 5). In 1960, high EIs (> 2000 pg WHO TEQ/yuan) were mainly found in central China, including Gansu, Shanxi, and Sichuan. Besides, Liaoning and Zhejiang were also listed in the provinces with high EIs. For these provinces, except Zhejiang, cement production was the largest source, and their relative contributions to national cement production were 1.3–3.2 times those for the national GDP, while high EIs of Zhejiang was likely caused by intensified municipal waste burning (NBSC, 2020). In 2019, provinces with relatively high EIs (> 5 pg WHO TEQ/yuan) were mainly located in northern China, including Heilongjiang, Ningxia, Inner Mongolia, Shanxi, and Hebei. High EIs for these provinces were owing to relatively larger iron, steel or cement production or larger coal consumption per unit of GDP. The overall EI for the Chinese mainland decreased from 1480 pg WHO TEQ/yuan in 1960 to 2.5 pg WHO TEQ/yuan in 2019 (Fig. S7). Continuous decreasing trends of EI for all regions could also be observed (Fig. S7). These trends might be explained by the increasing contribution of the GDP from tertiary industries (NBSC, 2020), which are associated with relatively low emissions. Besides, the increasing adoption rate of abatement measures driven by the more and more strict emission standards (Huang et al., 2014) might have also contributed to these decreasing trends. Furthermore, the relationship between EIs and per capita GDP was investigated (Fig. S8). EIs showed a decreasing trend with the increase of per capita GDP. The decreasing rate was much faster when the per capita GDP was less than about 20 000 yuan/person (Fig. S8a). If only looking at the recent data, R2 could reach 0.72 (Fig. S8b). This suggested that the per capita GDP might use a predictor for EIs.
Information about historical trends and spatial distribution of UP-PCBs in China remains scarce. In this study, a source-specific and yearly varying EF dataset was used to develop the emission inventory for 12 dioxin-like UP-PCBs congeners in the Chinese mainland from 1960 to 2019 with 66 sources covered. A gridded inventory for 2019 was further compiled. This study showed that total emissions of UP-PCBs in the Chinese mainland were around 249 g WHO-TEQ in 2019. Cement production, the industry boilers sector, and iron and steel production were three major sources. Historically, national UP-PCBs emission showed an increasing trend from 1960 to 1995, subsequently decreasing from 1995 to 2019. Geographically, North and East China were the largest contributors of UP-PCBs emission across the Chinese mainland. For specific congeners, PCBs 118, 105, and 77 were major UP-PCBs in terms of mass, while PCBs 126, 77, and 169 were major UP-PCBs in terms of g WHO-TEQ. These UP-PCBs congeners above should be prioritized with regard to protecting human health and mitigating adverse effects on the ecosystem. The TEQ/u of each source was calculated to determine the toxicities of emission sources. Iron and steel production, the non-ferrous metals sector, cement production, and industry boilers had the highest TEQ/u and might be controlled as a priority. The emission densities were highly correlated with population densities and GDP densities, indicating that urbanization degree highly impacted the distribution of UP-PCBs emissions.
Large uncertainties still exist in the current emission inventory due to insufficient EF data (e.g. source emission profile) and lack of in-depth source information (e.g. geolocation of point source). Despite that the technology split method was applied in this study, only “controlled” or “not controlled” were included in this study considering the availability of relevant data, resulting in uncertainties of modeled trends of EFs with time. Future research might focus on acquiring detailed homemade EFs and developing more accurate methods to allocate emissions across space and time, to estimate emissions more realistically, and to reduce temporal and spatial biases.
Code and data used in this article are available by contacting the corresponding author.
The supplement related to this article is available online at: https://doi.org/10.5194/acp-23-1091-2023-supplement.
The study was completed with contributions from all authors. YH, ML, and YL designed the research; YH, YL, YZ, and SZ conducted the experiments; WD, TH, YL, YC, FD, LH, HX, and WM analyzed the experimental results; YL and YH wrote the paper; ML and ST supervised the research.
The contact author has declared that none of the authors has any competing interests.
Publisher’s note: Copernicus Publications remains neutral with regard to jurisdictional claims in published maps and institutional affiliations.
This research has been supported by the National Natural Science Foundation of China (grant nos. 41730646, 42230505, 41907313, 42277388, and 42206148), the National Key Research and Development Program of China (grant no. 2020YFC1806700), the Science and Technology Commission of Shanghai Municipality (grant no. 19ZR1415100), the China Postdoctoral Science Foundation (grant no. 2020M671047), and the National Social Science Fund of China (grant no. 20BRK022).
This paper was edited by Qiang Zhang and reviewed by two anonymous referees.
Bond, T. C., Streest, D. G., Yarber, K. F., Nelson, S. M., Woo, J., and Klimont, Z.: A technology-based global inventory of black and organic carbon emissions from combustion, J. Geophys. Res., 109, D14203, https://doi.org/10.1029/2003JD003697, 2004.
Breivik, K., Sweetman, A., Pacyna, J. M., and Jones, K. C.: Towards a global historical emission inventory for selected PCB congeners – a mass balance approach 2, Emissions, Sci. Total. Environ., 290, 199–224, https://doi.org/10.1016/S0048-9697(01)01076-2, 2002a.
Breivik, K., Sweetman, A., Pacyna, J. M., and Jones, K. C.: Towards a global historical emission inventory for selected PCB congeners – a mass balance approach 1, Global production and consumption, Sci. Total. Environ., 290, 181–198, https://doi.org/10.1016/S0048-9697(01)01075-0, 2002b.
Breivik, K., Vestreng, V., Rozovskaya, O., and Pacyna, J. M.: Atmospheric emissions of some POPs in Europe: a discussion of existing inventories and data needs, Environ. Sci. Policy, 9, 663–674, https://doi.org/10.1016/j.envsci.2006.09.001, 2006.
Breivik, K., Sweetman, A., Pacyna, J. M., and Jones, K. C.: Towards a global historical emission inventory for selected PCB congeners – a mass balance approach 3, An update, Sci. Total. Environ., 377, 296–307, https://doi.org/10.1016/j.scitotenv.2007.02.026, 2007.
Chatzikosma, D. G. and Voudrias, E. A.: Simulation of polychlorinated biphenyls transport in the vadose zone, Environ. Geol., 53, 211–220, https://doi.org/10.1007/s00254-006-0635-0, 2007.
Chen, S. J., Tian, M., Zheng, J., Zhu, Z. C., Luo, Y., Luo, X. J., and Mai, B. X.: Elevated levels of polychlorinated biphenyls in plants, air, and soils at an E-waste site in Southern China and enantioselective biotransformation of chiral PCBs in plants, Environ. Sci. Technol., 48, 3847–3855, https://doi.org/10.1021/es405632v, 2014.
Chen, W., Chi, G., and Li, J.: The spatial association of ecosystem services with land use and land cover change at the county level in China, 1995–2015, Sci. Total. Environ., 669, 459–470, https://10.1016/j.scitotenv.2019.03.139, 2019.
Cheng, K., Hao, W., Wang, Y., Yi, P., Zhang, J., and Ji, W.: Understanding the emission pattern and source contribution of hazardous air pollutants from open burning of municipal solid waste in China, Environ. Pollut., 263, 114417, https://10.1016/j.envpol.2020.114417, 2020.
Cheng, Z., Wang, J., and Ge, Y.: Mapping monthly population distribution and variation at 1 km resolution across China, Int. J. Geogr. Inf. Sci., 36, 1166–1184, https://doi.org/10.1080/13658816.2020.1854767, 2022.
Cui, S., Qi, H., Liu, L. Y., Song, W. W., Ma, W. L., Jia, H. L., Ding, Y. S., and Li, Y. F.: Emission of unintentionally produced polychlorinated biphenyls (UP-PCBs) in China: Has this become the major source of PCBs in Chinese air? Atmos. Environ., 67, 73–79, https://doi.org/10.1016/j.atmosenv.2012.10.028, 2013.
Cui, S., Fu, Q., Ma, W. L., Song, W. W., Liu, L. Y., and Li, Y. F.: A preliminary compilation and evaluation of a comprehensive emission inventory for polychlorinated biphenyls in China, Sci. Total. Environ., 533, 247–255, https://doi.org/10.1016/j.scitotenv.2015.06.144, 2015.
Desforges, J. P., Hall, A., McConnell, B., Rosing-Asvid, A., Barber, J. L., Levin, M., Ross, P. S., Samarra, F., Vikingson, G., Sonne, C., and Dietz, R.: Predicting global killer whale population collapse from PCB pollution, Science, 361, 1373–1376, https://doi.org/10.1126/science.aat1953, 2018.
Diffenbaugh, N. S., Konings, A. G., and Field, C. B.: Atmospheric variability contributes to increasing wildfire weather but not as much as global warming, P. Natl. Acad. Sci. USA, 118, e2117876118, https://doi.org/10.1073/pnas.2117876118, 2021.
Friedl, M. A., McIver, D. K., Hodges, J. C. F., Zhang, X. Y., Muchoney, D., Strahler, A. H., Woodcock, C. E., Gopal, S., Schneider, A., Cooper, A., Baccini, A., Gao, F., and Schaaf, C.: Global land cover mapping from MODIS: algorithms and early results, Remote Sens. Environ., 83, 287–302, https://doi.org/10.1016/S0034-4257(02)00078-0, 2002.
Glüge, J., Bogdal, C., Scheringer, M., and Hungerbuhler, K.: What determines PCB concentrations in soils in rural and urban areas? Insights from a multi-media fate model for Switzerland as a case study, Sci. Total. Environ., 550, 1152–1162, https://doi.org/10.1016/j.scitotenv.2016.01.097, 2016.
Huang, Y., Shen, H., Chen, H., Wang, R., Zhang, Y., Su, S., Chen, Y., Lin, N., Zhuo, S., Zhong, Q., Wang, X., Liu, J., Li, B., Liu, W., and Tao, S.: Quantification of global primary emissions of PM2.5, PM10, and TSP from combustion and industrial process sources, Environ. Sci. Technol., 48, 13834–13843, https://doi.org/10.1021/es503696k, 2014.
Huang, Y., Chen, Y., Li, Y., Zhou, L., Zhang, S., Wang, J., Du, W., Yang, J., Chen, L., Meng, W., Tao, S., and Liu, M.: Atmospheric emissions of PCDDs and PCDFs in China from 1960 to 2014, J. Hazard. Mater., 424, 127320, https://doi.org/10.1016/j.jhazmat.2021.127320, 2022.
Jepson, P. D. and Law, R. J.: Persistent pollutants, persistent threats, Science, 352, 1388–1389, https://10.1126/science.aaf9075, 2016.
Jepson, P. D., Deaville, R., Barber, J. L., Aguilar, A., Borrell, A., Murphy, S., Barry, J., Brownlow, A., Barnett, J., Berrow, S., Cunningham, A. A., Davison, N. J., Ten Doeschate, M., Esteban, R., Ferreira, M., Foote, A. D., Genov, T., Gimenez, J., Loveridge, J., Llavona, A., Martin, V., Maxwell, D. L., Papachlimitzou, A., Penrose, R., Perkins, M. W., Smith, B., de Stephanis, R., Tregenza, N., Verborgh, P., Fernandez, A., and Law, R. J.: PCB pollution continues to impact populations of orcas and other dolphins in European waters, Sci. Rep., 6, 18573, https://10.1038/srep18573, 2016.
Jurgens, M. D., Chaemfa, C., Hughes, D., Johnson, A. C., and Jones, K. C.: PCB and organochlorine pesticide burden in eels in the lower Thames River (UK), Chemosphere, 118, 103–111, https://doi.org/10.1016/j.chemosphere.2014.06.088, 2015.
Kim, K. S. and Masunaga, S.: Behavior and source characteristic of PCBS in urban ambient air of Yokohama, Japan, Environ. Pollut., 138, 290–298, https://doi.org/10.1016/j.envpol.2005.03.011, 2005.
Lee, R. G. M., Coleman, P., Jones, J. L., Jone, K. C., and Lohmann, R.: Emission Factors and Importance of PCDD/Fs, PCBs, PCNs, PAHs and PM10 from the domestic burning of coal and wood in the UK, Environ. Sci. Technol., 39, 1436–1477, https://doi.org/10.1021/es048745i, 2005.
Lei, R., Xu, Z., Xing, Y., Liu, W., Wu, X., Jia, T., Sun, S., and He, Y.: Global status of dioxin emission and China's role in reducing the emission, J. Hazard. Mater., 418, 126265, https://doi.org/10.1016/j.jhazmat.2021.126265, 2021.
Li, X., Chen, J., Tang, L., Wu, T., Fu, C., Li, Z., Sun, G., Zhao, H., Zhang, L., Li, Q., and Feng, X.: Mercury isotope signatures of a pre-calciner cement plant in Southwest China, J. Hazard. Mater., 401, 123384, https://doi.org/10.1016/j.jhazmat.2020.123384, 2021.
Liu, G., Zheng, M., Cai, M., Nie, Z., Zhang, B., Liu, W., Du, B., Dong, S., Hu, J., and Xiao, K.: Atmospheric emission of polychlorinated biphenyls from multiple industrial thermal processes, Chemosphere 90, 2453–2460, https://doi.org/10.1016/j.chemosphere.2012.11.008, 2013.
Lu, Q., Liang, Y., Fang, W., Guan, K. L., Huang, C., Qi, X., Liang, Z., Zeng, Y., Luo, X., He, Z., Mai, B., and Wang, S.: Spatial Distribution, Bioconversion and Ecological Risk of PCBs and PBDEs in the Surface Sediment of Contaminated Urban Rivers: A Nationwide Study in China, Environ. Sci. Technol., 55, 9579–9590, https://doi.org/10.1021/acs.est.1c01095, 2021.
Marek, R. F., Thorne, P. S., Wang, K., Dewall, J., and Hornbuckle, K. C.: PCBs and OH-PCBs in serum from children and mothers in urban and rural U.S. communities, Environ. Sci. Technol., 47, 3353–3361, https://doi.org/10.1021/es304455k, 2013.
McLeod, A. M., Paterson, G., Drouillard, K. G., and Haffner, G. D.: PCB Food Web Dynamics Quantify Nutrient and Energy Flow in Aquatic Ecosystems, Environ. Sci. Technol., 49, 12832–12839, https://doi.org/10.1021/acs.est.5b03978, 2015.
Meng, W., Zhong, Q., Yun, X., Zhu, X., Huang, T., Shen, H., Chen, Y., Chen, H., Zhou, F., Liu, J., Wang, X., Zeng, E. Y., and Tao, S.: Improvement of a Global High-Resolution Ammonia Emission Inventory for Combustion and Industrial Sources with New Data from the Residential and Transportation Sectors, Environ. Sci. Technol., 51, 2821–2829, https://doi.org/10.1021/acs.est.6b03694, 2017.
National Bureau of Statistics of China (NBSC), China Statistical Yearbook, China Statistics Press, Beijing, China Statistical Publishing House, ISBN: 978-7-5037-9625-8, 2020.
Oak Ridge National Laboratory, LandScan Global 2019, https://doi.org/10.48690/1524214, 2020.
Quaß, U., Fermann, M., and Bröker, G.: The European Dioxin Air Emission Inventory Project – Final Results, Chemosphere, 54, 1319–1327, https://doi.org/10.1016/S0045-6535(03)00251-0, 2004.
Ranjbar Jafarabadi, A., Riyahi Bakhtiari, A., Mitra, S., Maisano, M., Cappello, T., and Jadot, C.: First polychlorinated biphenyls (PCBs) monitoring in seawater, surface sediments and marine fish communities of the Persian Gulf: Distribution, levels, congener profile and health risk assessment, Environ. Pollut., 253, 78–88, https://10.1016/j.envpol.2019.07.023, 2019.
Running, S. W.: Is Global Warming Causing More, Larger Wildfires?, Science, 313, 927–928, https://10.1126/science.113037, 2006.
Shen, H., Tao, S., Wang, R., Wang, B., Shen, G., Li, W., Su, S., Huang, Y., Wang, X., Liu, W., Li, B., and Sun, K.: Global time trends in PAH emissions from motor vehicles, Atmos. Environ., 45, 2067–2073, https://doi.org/10.1016/j.atmosenv.2011.01.054, 2011.
Shen, H., Huang, Y., Wang, R., Zhu, D., Li, W., Shen, G., Wang, B., Zhang, Y., Chen, Y., Lu, Y., Chen, H., Li, T., Sun, K., Li, B., Liu, W., Liu, J., and Tao, S.: Global atmospheric emissions of polycyclic aromatic hydrocarbons from 1960 to 2008 and future predictions, Environ. Sci. Technol., 47, 6415–6424, https://doi.org/10.1021/es400857z, 2013.
Shen, H., Tao, S., Chen, Y., Ciais, P., Güneralp, B., Ru, M., Zhong, Q., Yun, X., Zhu, X., Huang, T., Tao, W., Chen, Y., Li, B., Wang, X., Liu, W., Liu, J., and Zhao, S.: Urbanization-induced population migration has reduced ambient PM2.5 concentrations in China. Sci. Adv., 3, e1700300, https://10.1126/sciadv.1700300, 2017.
Shen, H., Luo, Z., Xiong, R., Liu, X., Zhang, L., Li, Y., Du, W., Chen, Y., Cheng, H., Shen, G., and Tao, S.: A critical review of pollutant emission factors from fuel combustion in home stoves, Environ. Int., 157, 106841, https://doi.org/10.1016/j.envint.2021.106841, 2021.
Song, D., Lin, L., and Wu, Y.: Emergy analysis of a typical New Suspension Preheaters cement plant in China, J. Clean. Prod., 222, 407–413, https://doi.org/10.1016/j.jclepro.2019.03.041, 2019.
Song, W. and Deng, X.: Land-use/land-cover change and ecosystem service provision in China, Sci. Total. Environ., 576, 705–719, https://doi.org/10.1016/j.scitotenv.2016.07.078, 2017.
Tao, S., Ru, M. Y., Du, W., Zhu, X., Zhong, Q. R., Li, B. G., Shen, G. F., Pan, X. L., Meng, W. J., Chen, Y. L., Shen, H. Z., Lin, N., Su, S., Zhuo, S. J., Huang, T. B., Xu, Y., Yun, X., Liu, J. F., Wang, X. L., Liu, W. X., Cheng, H. F., and Zhu, D. Q.: Quantifying the rural residential energy transition in China from 1992 to 2012 through a representative national survey, Nat. Energy, 3, 567–573, https://doi.org/10.1038/s41560-018-0158-4, 2018.
ter Schure, A. F. H., Larsson, P., Agrell, C., and Boon, J. P.: Atmospheric Transport of Polybrominated Diphenyl Ethers and Polychlorinated Biphenyls to the Baltic sea, Environ. Sci. Technol., 38, 1282–1287, https://doi.org/10.1021/es0348086, 2004.
UNEP (United nations Environment Programme): The Stockholm Convention on Persistent Organic Pollutants, http://chm.pops.int/Home/tabid/2121/Default.aspx (last access: 6 January 2023), 2001.
UNEP (United nations Environment Programme): Toolkit for Identification and Quantification of Releases of Dioxins, Furans and Other Unintentional POPs, http://toolkit.pops.int/Publish/Downloads/UNEP-POPS-TOOLKIT-2012-En.pdf (last access: 6 January 2023), 2013.
van der Werf, G., Randerson, J., Giglio, L., van Leeuwen, T., Chen, Y., Rogers, B., Mu, M., van Marle, M., Morton, D., Collatze, G., and Yokelson, R.: Global fire emissions estimates during 1997–2016, Earth Syst. Sci. Data, 9, 697–720, https://doi.org/10.5194/essd-9-697-2017, 2017.
Wang, A., Hu, S., and Lin, B.: Emission abatement cost in China with consideration of technological heterogeneity, Appl. Energ., 290, 116748, https://doi.org/10.1016/j.apenergy.2021.116748, 2021.
Wang, R., Tao, S., Shen, H., Wang, X., Li, B., Shen, G., Wang, B., Li, W., Liu, X., Huang, Y., Zhang, Y., Lu, Y., and Ouyang, H.: Global emission of black carbon from motor vehicles from 1960 to 2006, Environ. Sci. Technol., 46, 1278–1284, https://doi.org/10.1021/es2032218, 2012.
Wang, R., Tao, S., Ciais, P., Shen, H. Z., Huang, Y., Chen, H., Shen, G. F., Wang, B., Li, W., Zhang, Y. Y., Lu, Y., Zhu, D., Chen, Y. C., Liu, X. P., Wang, W. T., Wang, X. L., Liu, W. X., Li, B. G., and Piao, S. L.: High-resolution mapping of combustion processes and implications for CO2 emissions, Atmos. Chem. Phys., 13, 5189–5203, https://doi.org/10.5194/acp-13-5189-2013, 2013.
Wang, R., Tao, S., Balkanski, Y., Ciais, P., Boucher, O., Liu, J., Piao, S., Shen, H., Vuolo, M. R., Valari, M., Chen, H., Chen, Y., Cozic, A., Huang, Y., Li, B., Li, W., Shen, G., Wang, B., and Zhang, Y.: Exposure to ambient black carbon derived from a unique inventory and high-resolution model, P. Natl. Acad. Sci. USA, 111, 2459–2463, https://doi.org/10.1073/pnas.1318763111, 2014a.
Wang, R., Tao, S., Shen, H., Huang, Y., Chen, H., Balkanski, Y., Boucher, O., Ciais, P., Shen, G., Li, W., Zhang, Y., Chen, Y., Lin, N., Su, S., Li, B., Liu, J., and Liu, W.: Trend in global black carbon emissions from 1960 to 2007, Environ. Sci. Technol., 48, 6780–6787, https://doi.org/10.1021/es5021422, 2014b.
Wang, Y., Wu, X., Hou, M., Zhao, H., Chen, R., Luo, C., and Zhang, G.: Factors influencing the atmospheric concentrations of PCBs at an abandoned e-waste recycling site in South China, Sci. Total. Environ., 578, 34–39, https://doi.org/10.1016/j.scitotenv.2016.08.131, 2017.
Wirgin, I., Roy, N. K., Loftus, M., Christopher Chambers, R., Franks, D. G., and Hahn, M. E.: Mechanistic Basis of Resistance to PCBs in Atlantic Tomcod from the Hudson River, Science, 331, 1322–1325, https://doi.org/10.1126/science.1197296, 2011.
WSA (World Steel Association): Steel Statistical Yearbooks, https://worldsteel.org/steel-topics/statistics/steel-statistical-yearbook/ (last access: 6 January 2023), 2021.
Xing, Y., Lu, Y., Dawson, R.W., Shi, Y., Zhang, H., Wang, T., Liu, W., and Ren, H.: A spatial temporal assessment of pollution from PCBs in China, Chemosphere, 60, 731–739, https://doi.org/10.1016/j.chemosphere.2005.05.001, 2005.
Yamamoto, M., Kokeguchi, K., G., Y., Yamaguchi, N., Ohtsuka, K., and Sakai, S.: Air emission factors and emission inventory of HCB, PCB and pentachlorobenzene, Organohalogen Compounds, 73, 388–391, 2011.
Yang, S. W., Huang, J., and Yu, G.: Inventory study of unintentional produced hexachlorobenzene and polychlorinated biphenyls release to the air (in Chinese), Environ. Pollut. Cont., 32, 82e91, https://www.cnki.net/kcms/doi/10.15985/j.cnki.1001-3865.2010.07.002.html (last access: 6 January 2023), 2010.
Yin, S., Wang, X., Zhang, X., Zhang, Z., Xiao, Y., Tani, H., and Sun, Z.: Exploring the effects of crop residue burning on local haze pollution in Northeast China using ground and satellite data, Atmos. Environ., 199, 189–201, https://doi.org/10.1016/j.atmosenv.2018.11.033, 2019.
Zhang, H., Luo, Y., Teng, Y., and Wan, H.: PCB contamination in soils of the Pearl River Delta, South China: levels, sources, and potential risks, Environ. Sci. Pollut. Res. Int., 20, 5150–5159, https://doi.org/10.1007/s11356-013-1488-1, 2013.
Zhao, F. and Liu, Y.: Atmospheric Circulation Patterns Associated With Wildfires in the Monsoon Regions of China, Geophys. Res. Lett., 46, 4873–4882, https://doi.org/10.1029/2019GL081932, 2019.
Zhao, S., Jones, K. C., Li, J., Sweetman, A. J., Liu, X., Xu, Y., Wang, Y., Lin, T., Mao, S., Li, K., Tang, J., and Zhang, G.: Evidence for Major Contributions of Unintentionally Produced PCBs in the Air of China: Implications for the National Source Inventory, Environ. Sci. Technol., 54, 2163–2171, https://doi.org/10.1021/acs.est.9b06051, 2020.
Zhou, X. and Gao, S.: Confidence intervals for the log-normal mean, Stat. Med., 16, 783–790, https://doi.org/10.1002/(SICI)1097-0258(19970415)16:7<783::AID-SIM488>3.0.CO;2-2, 1997.