the Creative Commons Attribution 4.0 License.
the Creative Commons Attribution 4.0 License.
 | 26 Sep 2023
An emerging aerosol climatology via remote sensing over Metro Manila, the Philippines
Genevieve Rose Lorenzo
Avelino F. Arellano
Maria Obiminda Cambaliza
Christopher Castro
Melliza Templonuevo Cruz
Larry Di Girolamo
Glenn Franco Gacal
Miguel Ricardo A. Hilario
Nofel Lagrosas
Hans Jarett Ong
James Bernard Simpas
Sherdon Niño Uy
Aerosol particles in Southeast Asia are challenging to characterize due to their complex life cycle within the diverse topography and weather of the region. An emerging aerosol climatology was established based on AErosol RObotic NETwork (AERONET) data (December 2009 to October 2018) for clear-sky days in Metro Manila, the Philippines. Aerosol optical depth (AOD) values were highest from August to October, partly from fine urban aerosol particles, including soot, coinciding with the burning season in insular Southeast Asia when smoke is often transported to Metro Manila during the southwest monsoon. Clustering of AERONET volume size distributions (VSDs) resulted in five aerosol particle sources based on the position and magnitude of their peaks in the VSD and the contributions of specific particle species to AOD per cluster based on MERRA-2. The clustering showed that the majority of aerosol particles above Metro Manila were from a clean marine source (58 %), which could be related to AOD values there being relatively low compared to other cities in the region. The following are the other particle sources over Metro Manila: fine polluted sources (20 %), mixed-dust sources (12 %), urban and industrial sources (5 %), and cloud processing sources (5 %). Furthermore, MERRA-2 AOD data over Southeast Asia were analyzed using empirical orthogonal functions. Along with AOD fractional compositional contributions and wind regimes, four dominant aerosol particle air masses emerged: two sulfate air masses from East Asia, an organic carbon source from Indonesia, and a sulfate source from the Philippines. Knowing the local and regional aerosol particle air masses that impact Metro Manila is useful in identifying the sources while gaining insight into how aerosol particles are affected by long-range transport and their impact on regional weather.
- Article
(6769 KB) - Full-text XML
-
Supplement
(1231 KB) - BibTeX
- EndNote


Although Southeast Asia is one of the most rapidly developing regions in the world, with a growing number of extensive research being conducted in the area (Reid et al., 2023), there are still knowledge gaps remaining related to aerosol particles in the area (Tsay et al., 2013; Lee et al., 2018; Chen et al., 2020; Amnuaylojaroen, 2023). The region represents a complex geographic, meteorological, and hydrological environment, making it challenging to understand aerosol particle characteristics, especially interactions between aerosol particles with their environment (Reid et al., 2013). The island of Luzon in the Philippines in particular is heavily populated and is characterized by high levels of anthropogenic emissions superimposed onto natural emissions from the surrounding waters (AzadiAghdam et al., 2019) and long-range transport of emissions from areas such as Indonesia and East Asia (Braun et al., 2020; Hilario et al., 2020a, b, 2021a). Aerosol particle lifecycle in the region is impacted by Philippine weather that is marked by two distinct monsoons, typhoons, the Intertropical Convergence Zone, and impacts from El Niño–Southern Oscillation and Madden–Julian oscillation (Cruz et al., 2013; Xian et al., 2013; Reid et al., 2012, 2015; Hilario et al., 2021b). Studying this area is informative owing to the wide dynamic range of aerosol particle and weather conditions present, all of which are interconnected. The overlapping of a large fraction of cirrus clouds with lower clouds in the area (Hong and Di Girolamo, 2020) makes spaceborne remote sensing of aerosol particles very challenging (Reid et al., 2013; Lin et al., 2014). These reasons motivated the conducting of the NASA Cloud, Aerosol, and Monsoon Processes Philippines Experiment (CAMP2Ex) airborne measurement campaign in 2019 to understand the interaction between tropical meteorology and aerosol particles (Di Girolamo et al., 2015; Reid et al., 2023). However, those short-term measurements cannot provide an adequate assessment of aerosol behavior across all seasons and over many years.
The NASA AErosol RObotic NETwork (AERONET) (Holben et al., 1998) is pivotal in providing broad temporal coverage of aerosol characteristics in specific locations with a column-based perspective from the ground up. Aerosol climatology studies in different regions have proved beneficial to understand temporal characteristics of aerosol particle concentrations and properties, in addition to identifying potential source regions and interactions with clouds and rainfall (Stevens and Feingold, 2009; Li et al., 2011; Tao et al., 2012; Crosbie et al., 2014; Kumar et al., 2015; Alizadeh-Choobari and Gharaylou, 2017; Mora et al., 2017; Aldhaif et al., 2021). To our knowledge, there has not been a remote-sensing-based aerosol climatology study for the Metro Manila region of Luzon, which has approximately 16 cities, a population of 12.88 million, and a high population density of 20 800 km−2 (PSA, 2016; Alas et al., 2018).
Most of the past studies involving long-term remotely sensed aerosol particle data in Southeast Asia (Cohen, 2014; Nakata et al., 2018; Nguyen et al., 2019b) had no specific focus on the Philippines. The Philippines is considered part of the Maritime Continent (MC), the island nation sub-region of Southeast Asia. The other sub-region of Southeast Asia, peninsular Southeast Asia (PSEA), comprises those nations within the continental Asian land mass. These two regions have separate aerosol sources and climates, where MC is dependent on the Intertropical Convergence Zone (ITCZ) and PSEA is dependent on both the ITCZ and monsoon systems (Dong and Fu, 2015). Only the southern part of the Philippines is climatologically part of the MC (Ramage, 1971), however, and the northwestern Philippines, where Metro Manila is located, is affected by the monsoons and tropical cyclones aside from the ITCZ (Chang et al., 2005; Yumul et al., 2010; Bagtasa, 2017). These unique meteorological influences and extensive local aerosol particle sources warrant a unique aerosol climatology over Metro Manila, an example of a polluted source in a tropical marine environment, and its effects on cloud formation in the area. Aerosol effects on clouds in the marine environment are associated with the largest uncertainties in climate change research (Hendrickson et al., 2021; Wall et al., 2022), and the Philippines was ranked as the fifth country globally in terms of being the most at risk to climate change and extreme weather from 1997 to 2018 (Eckstein et al., 2018). There have been several surface measurements of aerosol particles made in Metro Manila over the past 20 years (Oanh et al., 2006; Bautista VII et al., 2014; Cruz et al., 2019), but columnar ground-based measurements there are just beginning to be established (Dorado et al., 2001; Ong et al., 2016; Cruz et al., 2023). The AERONET sun photometer is one of the first long-term column-based aerosol instruments in Metro Manila and the Philippines (Ong et al., 2016).
The goal of this study is to use multi-year AERONET data in Manila Observatory along with other complementary datasets (MERRA-2, PERSIANN, MISR, HYSPLIT, and NAAPS) to address the following questions: (1) what are the monthly characteristics of aerosol particles over Metro Manila, the Philippines; (2) what are the possible sources and factors influencing the observed characteristics; (3) what relationships are evident between aerosol particles and cloud characteristics; and (4) what are the regional and local aerosol particle air masses that influence Metro Manila?
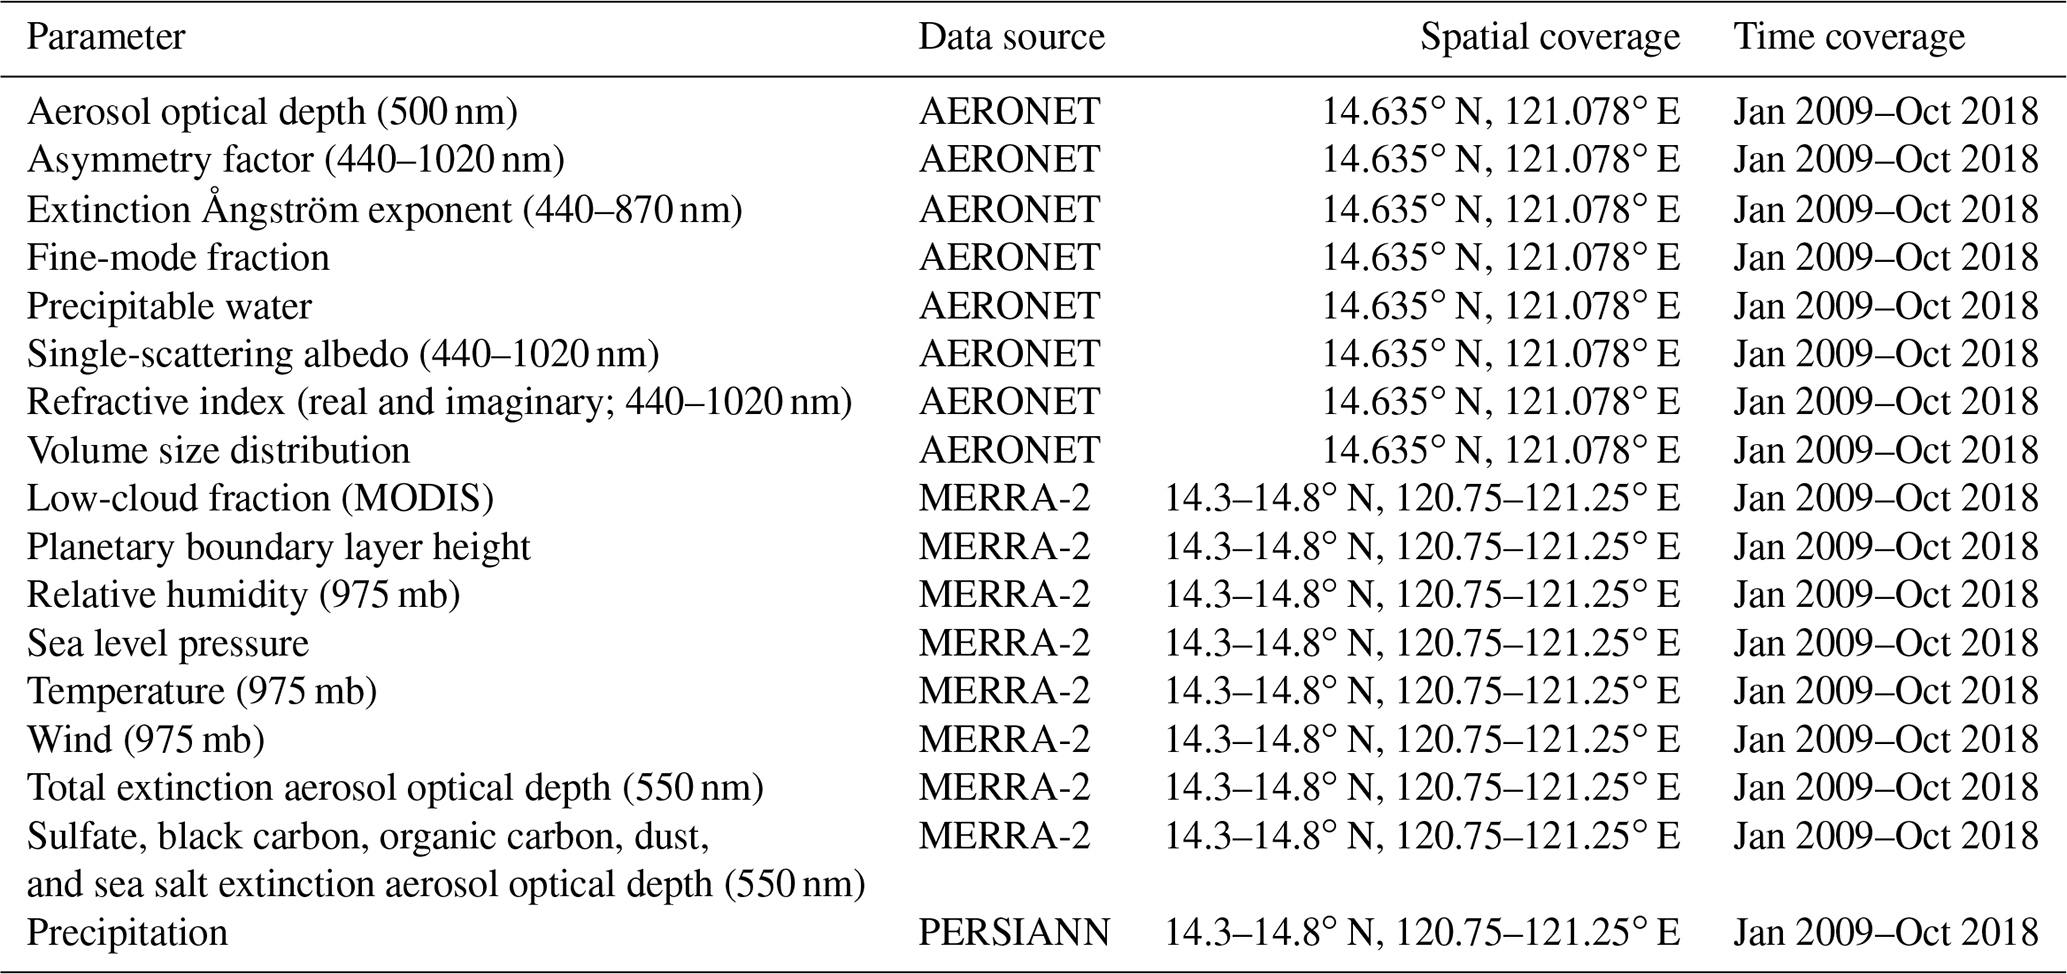
This work relies on analysis of several datasets summarized in Table 1 and the following subsections. The common time range used for all datasets is between January 2009 and October 2018.
Table 1Summary of datasets over Metro Manila used in this work covering the period from January 2009 to October 2018.
2.1 Datasets
2.1.1 AERONET
The central dataset used is that of sun photometer measurements (Aerosol Robotic Network, 2020a) and derived (inversion) parameters (Aerosol Robotic Network, 2020b) from the AERONET (Holben et al., 1998) site at Manila Observatory in Quezon City, the Philippines (14.64∘ N, 121.08∘ E, ∼ 70 m a.s.l.). Direct sunlight extinction measurements were made at nominal wavelengths of 340, 380, 440, 500, 675, 870, 940, and 1020 nm, from which aerosol optical depth (AOD) was calculated (except for 940 nm, which is for water vapor) (Eck et al., 2013). AOD is a commonly used proxy for aerosol particle loading in the air column from the ground up (Holben et al., 2001); higher AOD translates to more aerosol particle extinction in the column above a location. The extinction Ångström exponent (EAE) and the fine-mode fraction (FMF) are also AERONET direct-sun products that are retrieved after the application of a spectral deconvolution algorithm (O'Neill et al., 2003). For the inversion products, it is through radiative retrievals that the volume size distribution (VSD) and complex refractive index (RI) are gathered and from which single-scattering albedo (SSA) and asymmetry factor (AF) are calculated. The AERONET observations were made during clear-sky conditions, which has been shown (Hong and Di Girolamo, 2022) to be able to represent all sky conditions.
For the inversions, four wavelengths (440, 670, 870, and 1020 nm) of the radiometer spectral channels were chosen for diffuse radiance measurements and to avoid gas absorption (Dubovik et al., 1998). Version 3 direct-sun and inversion algorithms (AERONET, 2019; Giles et al., 2019) were used with the almucantar sky scan scenario to derive the following parameters with level 2.0 (automatically cloud-cleared and quality-controlled datasets with pre- and post-field calibrations) data quality: column AOD (500 nm), fine-mode fraction (500 nm), extinction Ångström exponent (440–870 nm), precipitable water (940 nm), single-scattering albedo (440, 670, 870, and 1020 nm), asymmetry factor (440, 670, 870, and 1020 nm), refractive index (440, 670, 870, and 1020 nm), and VSD. The version 3 products are able to keep fine-mode aerosol particle data (haze and smoke) and remove optically thin cirrus clouds in order to retain more aerosol particle measurements in the database (Giles et al., 2019). Cloud screening in the version 3 product improves remote sensing measurements in Southeast Asia in general, where cirrus clouds are pervasive (Reid et al., 2013). At most, a total of 29 037 direct-sun and 1419 inversion AERONET daytime data points were available between January 2009 and October 2018.
2.1.2 MERRA-2
Modern Era-Retrospective Analysis for Research and Applications, version 2 (MERRA-2: 0.5∘ × 0.625∘ approximate resolution), meteorological and aerosol particle composition reanalysis data (Bosilovich, 2016; Gelaro et al., 2017; Randles et al., 2017) were acquired for the area around Manila Observatory (14.25–14.75∘ N, 120.9375–121.5625∘ E). The aerosol reanalysis data include data assimilation of AOD from the Moderate Resolution Imaging Spectroradiometer (MODIS: Terra, 2000 to present, and Aqua, 2002 to present), Advanced Very High Resolution Radiometer (AVHRR, 1979–2002), and Multiangle Imaging SpectroRadiometer (MISR, 2000–2014) (Buchard et al., 2017; Rizza et al., 2019). The following products were used: M2I3NPASM assimilated meteorological fields (3-hourly) for 975 mb level winds, temperature, relative humidity, and sea level pressure (Global Modeling and Assimilation Office, 2015a); M2T1NXFLX surface flux diagnostics (1-hourly from 00:30 UTC time-averaged) 2D for planetary boundary layer height (Global Modeling and Assimilation Office, 2015b); M2T1NXCSP COSP satellite simulator (1-hourly from 00:30 UTC time-averaged) for MODIS mean low-cloud fraction (cloud top pressure > 680 hPa) (Global Modeling and Assimilation Office, 2015c); and M2T1NXAER aerosol diagnostics (1-hourly from 00:30 UTC time-averaged) for total AOD and speciated AOD (sulfate, black carbon (BC), organic carbon (OC), dust, and sea salt) (Global Modeling and Assimilation Office, 2015d).
MERRA-2 meteorological and aerosol particle composition monthly mean reanalysis data (Bosilovich, 2016; Gelaro et al., 2017; Randles et al., 2017) were also acquired for a larger region (30∘ × 30∘), i.e., the Southeast Asia region (0–30∘ N, 105–135∘ E), for the period from January 2009 to December 2018. This is within the spatial domain of the CAMP2Ex airborne measurement campaign, which, as mentioned earlier, targets the interaction between tropical meteorology and aerosol particles. The following datasets (0.5∘ latitude and 0.625∘ longitude resolution) were used: MERRA-2 tavgM_2d_aer_Nx: aerosol assimilation (M2TMNXAER) for total 500 nm AOD and speciated 500 nm AOD (sulfate, BC, OC, dust, and sea salt) (Global Modeling and Assimilation Office, 2015e) and MERRA-2 instM_3d_ana_Np: analyzed meteorological fields (M2IMNPANA) for 1000 and 725 hPa level U and V winds (Global Modeling and Assimilation Office, 2015f). The total MERRA-2 AOD (reanalysis) for the region (mean over 30∘ × 30∘region) was used along with MISR AOD (remote sensing) data (mean over 30∘ × 30∘region) to assess the influence of long-range sources on the aerosol column over Manila Observatory. The monthly meteorological and aerosol particle composition data for the region will be used for empirical orthogonal functions, which will be described later.
2.1.3 PERSIANN
Hourly precipitation data were obtained from the Precipitation Estimation from the Remotely Sensed Information using the artificial neural networks (PERSIANN) database of the Center for Hydrometeorology and Remote Sensing (CHRS) at the University of California, Irvine (UCI) (Nguyen et al., 2019a). Hourly data were accumulated for running 3 d totals, which were compared to AERONET data. The data were averaged between the four grids that included the area of interest, ensuring a similar spatial domain (14.5–15.0∘ N, 120.75–121.25∘ E) to the MERRA-2 dataset.
2.1.4 MISR
Monthly 500 nm AOD data (level 3 global aerosol: 0.5∘ × 0.5∘ spatial resolution in the region 0.25–30.25∘ N and 104.75–134.75∘ E) from January 2009 to December 2018 (EarthData, 2018) are used from the Multi-angle Imaging SpectroRadiometer (MISR) (Diner et al., 2007; Garay et al., 2018) as regional (Southeast Asia) baseline remote sensing data to support the Manila Observatory AERONET data. The regional (30∘ × 30∘) MISR data were used to confirm regional sources of aerosols that may be influencing the AOD over Metro Manila. Level 3 MISR products are global maps of parameters available in level 2 (measurements derived from the instrument data) products. MISR is ideal for remote sensing in the CAMP2Ex region because it has an overpass at 10:30 ECT (equatorial crossing time) (descending mode) (when cirrus is minimal) and its retrievals have been shown to not be impacted by small cumulus (Zhao et al., 2009), which are typical in the region. MISR has relatively more accurate AOD and agrees better with AERONET data compared to other satellite products due to its multi-angle measurements (Choi et al., 2019; Kuttippurath and Raj, 2021). The MISR sampling noise is relatively small due to the large domain and seasonal averages that are considered in this study. MISR is also the only passive sensor that speciates aerosol particle size and shape. All these factors led to the choice of using regional MISR data to associate long-range sources influencing AERONET data at Manila Observatory. Monthly mean AOD (bin 0) data were extracted for Southeast Asia (0.25–30.25∘ N, 104.75–134.75∘ E) within the CAMP2Ex region. Monthly mean AOD values were then calculated for each 0.5∘ grid point and then for the 30∘ × 30∘ region, where the standard error in the monthly mean for the region is less than 0.002. MISR monthly mean time series of size, shape, and absorption speciated 550 nm AOD and Ångström exponent in the CAMP2Ex domain (6.5–22.5∘ N, 116.5–128.5∘ E; March 2000 to December 2020) are also used to support the findings from the AERONET data.
2.1.5 NAAPS
Archived maps of total and speciated optical depths and surface concentrations of sulfate, dust, and smoke for Southeast Asia are used from the Navy Aerosol Analysis and Prediction System (NAAPS: 1∘ × 1∘ spatial resolution) (Lynch et al., 2016), and which are publicly available at https://www.nrlmry.navy.mil/aerosol/ (last access: 4 June 2021). This reanalysis product relies on the Navy Global Environmental Model (NAVGEM) for meteorological fields (Hogan et al., 2014). Hourly maps were downloaded for aerosol particle events of interest based on AERONET data. These maps help associate possible regional emission sources to extreme aerosol loading events in Manila Observatory. Previous studies have used NAAPS data for an overview of aerosol sources in specific regions of interest (Ross et al., 2018; Foth et al., 2019; Markowicz et al., 2021; Harenda et al., 2022; Mims III, 2022). More recent studies show the need to improve aerosol representation in NAAPS (Edwards et al., 2022), so we will use NAAPS qualitatively, together with MERRA-2 compositional AOD data and back trajectories, for an overview of aerosol sources that may contribute to extreme events with high AOD from AERONET.
2.1.6 HYSPLIT
Back trajectories from the National Oceanic and Atmospheric Administration's (NOAA) Hybrid Single-Particle Lagrangian Integrated Trajectory (HYSPLIT) model (Stein et al., 2015; Rolph et al., 2017) were used to provide support for the AERONET monthly aerosol characteristics and the chosen case studies. Both 3 and 7 d back trajectories with 6 h resolution were generated based on the NCEP/NCAR reanalysis meteorological dataset with a resolution of 1∘ and a vertical wind setting of “model vertical velocity”. The 3 d data were used to map the density of trajectories (The MathWorks Inc., 2022) reaching Manila Observatory in each month from 2008 to 2019. The 7 d data were used in the analysis of the case studies. Trajectories were computed for an end point with an altitude of 500 m above ground level at Manila Observatory. This altitude represents the mixed layer based on related surface air quality studies (Crosbie et al., 2014; Mora et al., 2017; Schlosser et al., 2017; Aldhaif et al., 2020), including a previous study for the same area (Stahl et al., 2020).
2.1.7 NASA Worldview
Archived maps of cloud fraction (Aqua MODIS and Terra MODIS) over Metro Manila and Southeast Asia were downloaded from NASA Worldview (https://worldview.earthdata.nasa.gov, last access: 17 January 2023) for events of interest based on AERONET data.
2.2 Clustering
Available AERONET VSD data (0.050 to 15.000 µm particle radius in 22 logarithmically equidistant discrete points, 1419 data points) were clustered (The MathWorks Inc., 2020) via k-means clustering (Lloyd, 1982). The algorithm used was k-means (Arthur and Vassilvitskii, 2007). The ideal number of clusters was chosen based on highest relative (> 0.5) average silhouette value and the presence of a cluster with a second peak in the larger accumulation mode of the VSD. The clusters were analyzed based on their associated meteorological conditions and aerosol particle characteristics and were classified into air mass types (Table 2) based on estimates from previous studies (Dubovik et al., 2002; Pace et al., 2006; Kaskaoutis et al., 2007, 2009; Sorooshian et al., 2013; Kumar et al., 2014, 2015; Sharma et al., 2014; Che et al., 2015; Deep et al., 2021). The first four mentioned air mass types in Table 2 are the most general, and four more classifications based on aerosol particle sources are included. The urban and industrial air mass type here refers to local combustion and long-range-transported biomass burning (Kaskaoutis et al., 2009). While these classifications are not rigid definitions of air masses, they help in understanding the sources that contribute to aerosols in Metro Manila and in identifying cases where certain sources are more influential than others.
Table 2Summary of threshold values of aerosol optical depth (AOD), Ångström exponent (AE), fine-mode fraction (FMF), and single-scattering albedo (SSA) used to identify air mass types.
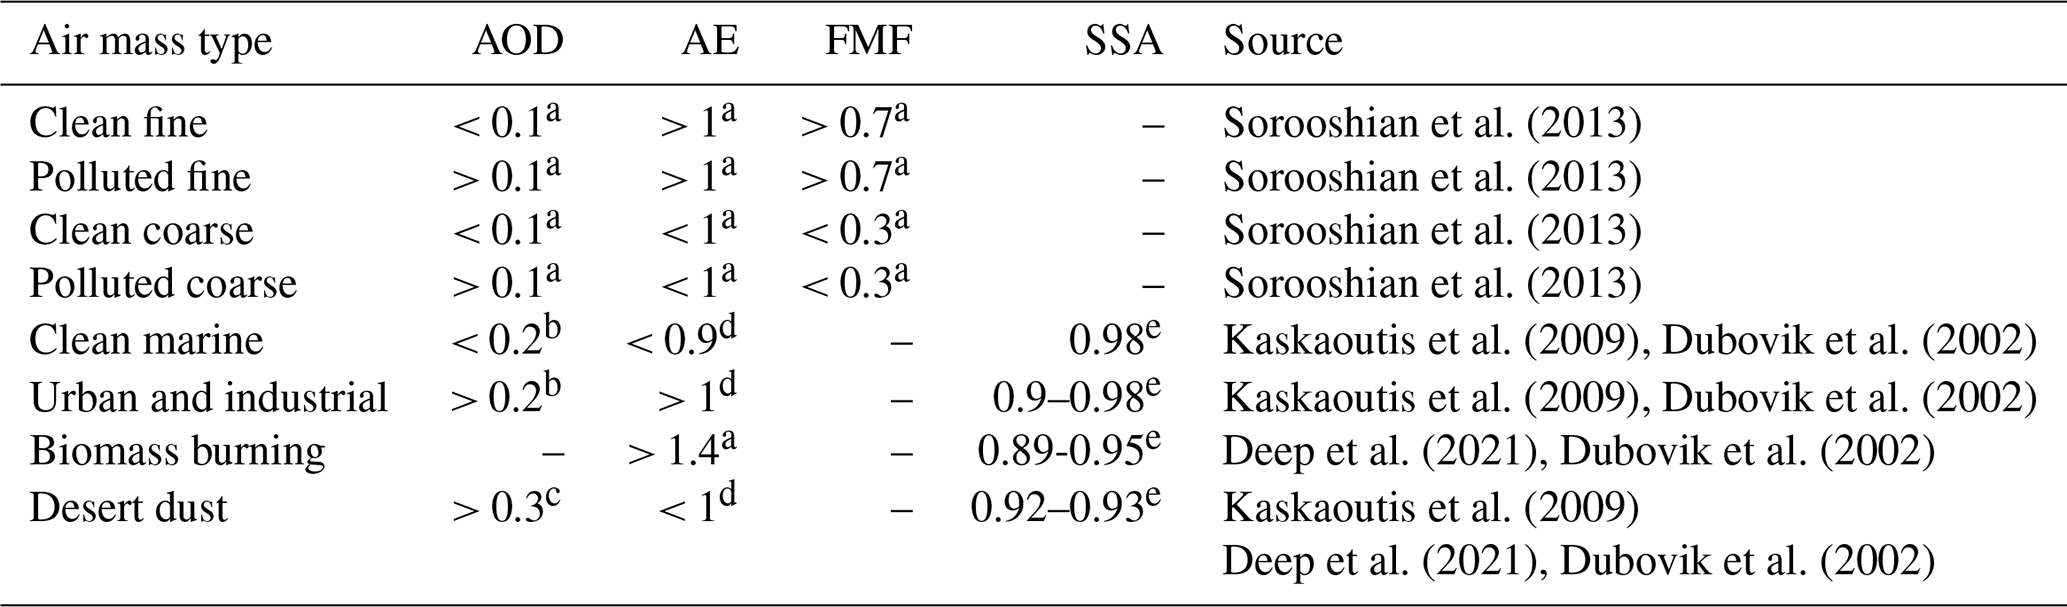
a From MODIS. b AOD at 500 nm. c AOD at 400 nm. d AE at 380 to 870 nm. e SSA at 440 nm.
2.3 Extreme event analysis
Aerosol particle events based on the three clusters with the highest VSD concentrations were identified to characterize different types of sources and processes impacting aerosol particle columnar properties above Metro Manila. The three events are described below.
2.3.1 Smoke long-range transport
Events related to transported biomass burning and smoke were chosen from the AERONET VSD data that were clustered as urban and industrial (with a dominant submicrometer peak) (Eck et al., 1999) over Metro Manila. Cases with the highest black carbon contribution to total AOD from the MERRA-2 dataset were considered. Maps from NAAPS of high smoke contributions to AOD and surface smoke contributions in the direction of HYSPLIT back trajectories were used to provide support for the likely source and transport pathway for the smoke cases.
2.3.2 Dust long-range transport
A dust transport case over Metro Manila was identified from the AERONET VSD dust cluster (with an enhanced coarse peak in the AERONET VSD compared to the submicrometer fraction) (Eck et al., 1999), the highest dust contribution to AOD from the MERRA-2 dataset, and high dust contributions to AOD from NAAPS. Surface dust concentrations from NAAPS along the HYSPLIT back trajectories improved the plausibility of dust for this case.
2.3.3 Cloud processing
Cloud processing events were identified based on bimodal submicrometer VSDs (Eck et al., 2012) and a relatively large sulfate contribution to AOD over Metro Manila from the MERRA-2 dataset, since this species is predominantly produced via cloud processing (Barth et al., 2000; Faloona, 2009). The presence of clouds was verified qualitatively with MODIS (Aqua and Terra) imagery from NASA Worldview in the path of air parcels reaching Metro Manila based on HYSPLIT back trajectories.
2.4 Empirical orthogonal functions
Regional analysis of aerosol particles in Southeast Asia and Asia in general show the prevalence of biomass burning in the region, as well as the larger influence of anthropogenic emissions in East Asia (Nakata et al., 2018). These large prevalent sources may overshadow other relevant but weaker sources in the region, such as local sources. Due to the complex nature of aerosol particles, analysis techniques such as principal component analysis and clustering along with recent improvements in gridded datasets help detect spatial and temporal patterns that would otherwise be difficult to make with noise interference and even weak signals (Li et al., 2013; Sullivan et al., 2017; Plymale et al., 2021). Understanding the dominant air masses around Southeast Asia will help in distinguishing local and transported particles that influence the aerosol climatology in Metro Manila.
To contextualize the analysis of aerosol particle masses in Metro Manila, major regional sources of aerosol particles in Southeast Asia were identified based on the dominant principal components from empirical orthogonal (EOF) analysis of AOD. EOF analysis was done on the monthly AOD data (January 2009 to December 2018) from MERRA-2 for the Southeast Asia region for the months similar in scope to the AERONET data. EOF analysis needs a complete dataset with no data gaps, which is not available with pure satellite retrievals like MISR; the MERRA-2 reanalysis dataset alleviates this issue.
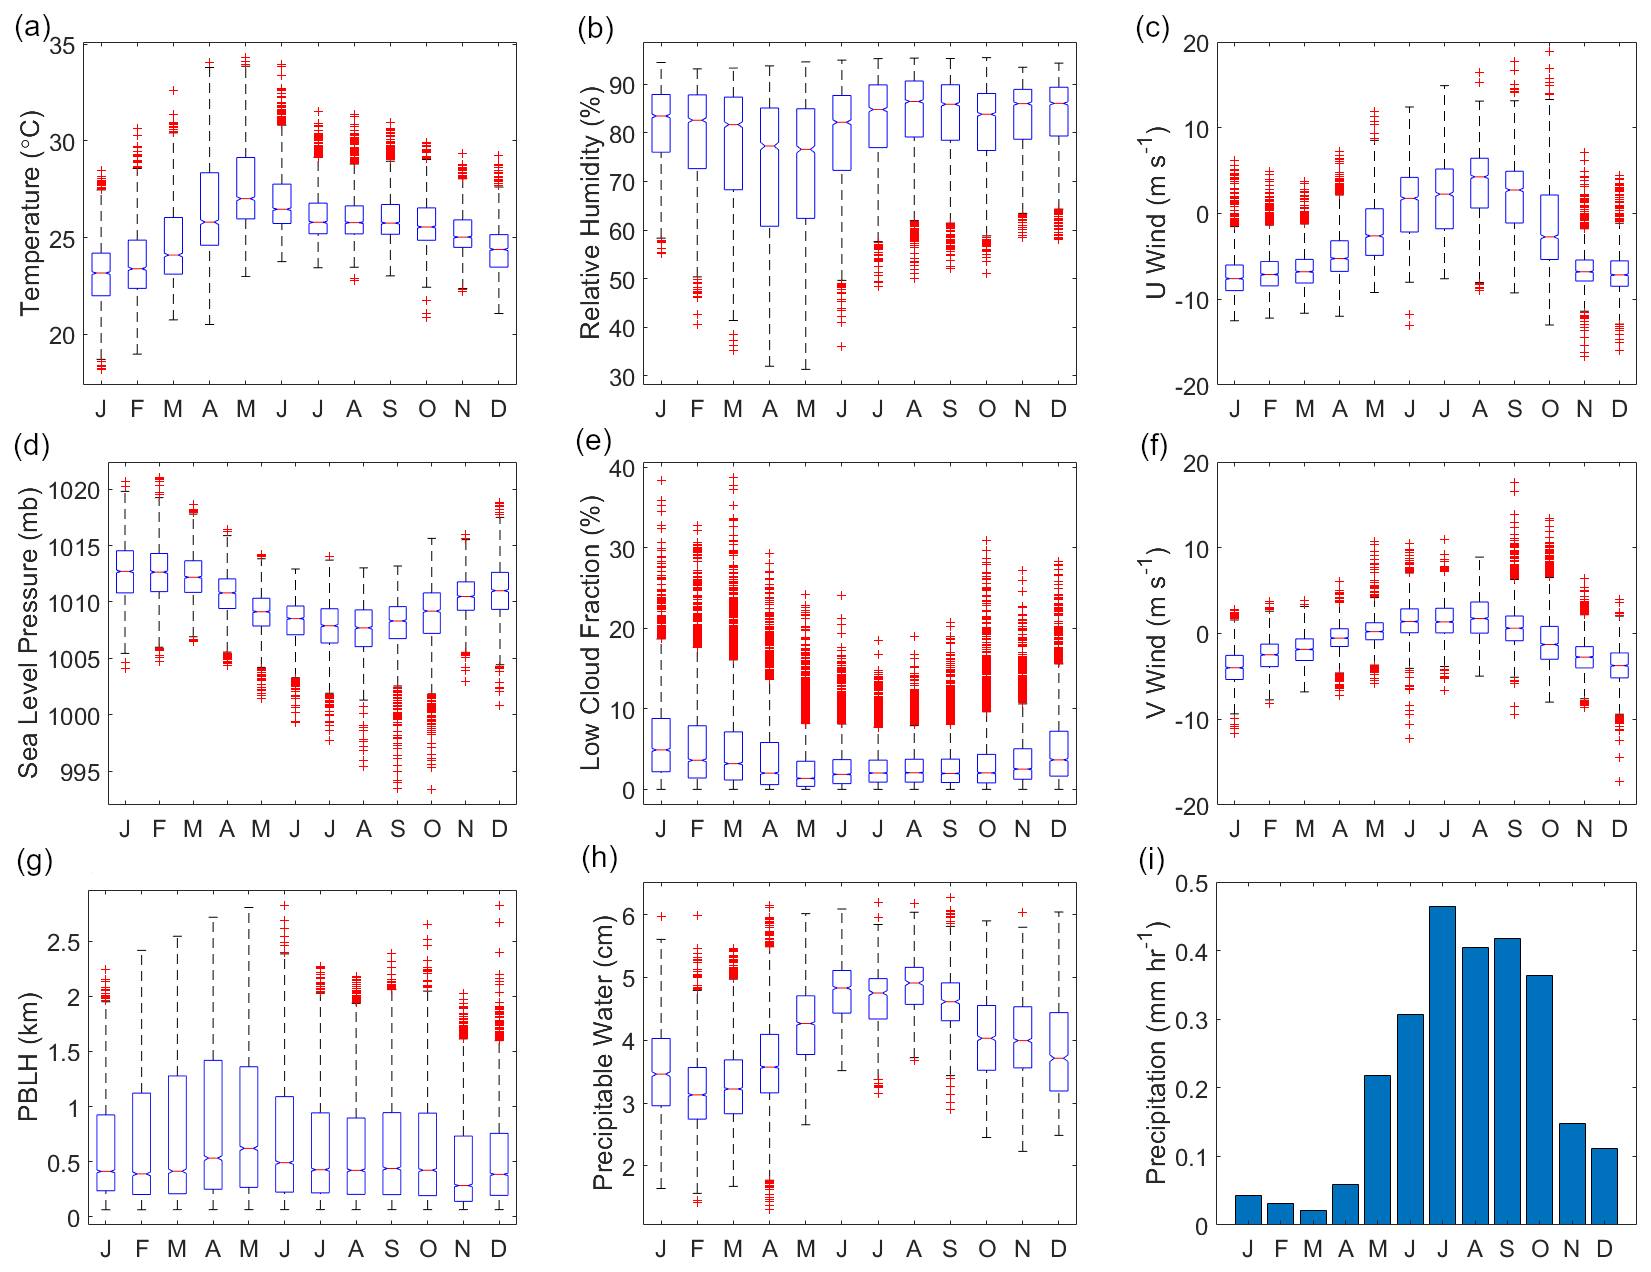
Figure 1Monthly characteristics of meteorological parameters for Metro Manila, the Philippines, based on data between January 2009 and October 2018. MERRA-2 parameters are as follows: (a) temperature at 975 mb, (b) relative humidity at 975 mb, (c, f) u and v wind at 975 mb, (d) sea level pressure, (g) planetary boundary layer height (PBLH), (e) low-cloud fraction (cloud top pressure > 680 hPa). AERONET parameters are as follows: (h) precipitable water with data being delineated per month (Jan: 2131; Feb: 4015; Mar: 5049; Apr: 5844; May: 3448; Jun: 1696; Jul: 652; Aug: 513; Sep: 753; Oct: 1700; Nov: 2084; Dec: 1449). PERSIANN is represented as a single parameter, i.e., (i) mean hourly precipitation per month.
The monthly MERRA-2 AOD maps (0–30∘ N, 105–135∘ E with 0.5∘ latitude resolution and 0.625∘ longitude resolution) (lat: 61 rows ×; long: 49 columns) for the Southeast Asia region (presented subsequently) were first deseasonalized. Following this, the AOD anomaly per grid per year (of the 120 months) was calculated by subtracting the monthly mean AOD from each value of a given month (Li et al., 2013). The anomalies per grid were weighted depending on their latitude by multiplying the anomalies by the square root of the cosine of their latitudes.
EOF, specifically singular value decomposition (SVD), analysis (Björnsson and Venegas, 1997) was then performed (The MathWorks Inc., 2020). To prepare the data for the analysis, they were transformed such that the final matrix was a 2D matrix (120×2989) with each row representing a year and each column representing a grid in the map. The matrix was analyzed for eigenvalues using SVD in MATLAB, which outputs the eigenvalue (S) and eigenvector (U: principal components; V: empirical orthogonal functions) matrices. The eigenvalues were arranged in descending order by default. Each principal component (PC) time series was standardized by dividing each PC value by the standard deviation per PC time series (120 months).
An eigenvalue spectrum was also plotted based on the variance explained by each eigenvalue and error bars that were calculated using the North test (North et al., 1982). Following this, the unweighted AOD anomalies were regressed onto the first three standardized PCs. Each grid therefore had a regression between 120 pairs (unweighted AOD anomalies vs. standardized PCs). From the linear regression equation, the regression coefficient per grid was calculated. Each grid on the Southeast Asia map was colored based on the calculated regression coefficient value.
2.5 Correlations
The first three standardized PCs of AOD anomalies were correlated to deseasonalized compositional AOD fractions (sulfate, BC, OC, dust, and sea salt) from MERRA-2. For each correlation, the t-test value was calculated, and the resulting t score was compared to a t-critical value for ∼ n=100 pairs (n is the number of pairs of data, in this case 120 months) for 0.90 confidence level, which is 1.660. Correlations that have t values exceeding +1.660 or less than −1.660 (two-tailed test) are significant (90 % confidence).
3.1 Meteorology and atmospheric circulation
Knowledge of monthly (2009 to 2018) behavior of weather in the study region helps interpretation of aerosol particle data. The climate of the Philippines is influenced by both the winter northeast monsoon (∼ November to April, Amihan) and the summer southwest monsoon (∼ May to October, Habagat) (Coronas, 1920; Flores and Balagot, 1969; Matsumoto et al., 2020). Median 3-hourly temperatures at 975 mb per month (MERRA-2, 975 mb) (Fig. 1a) ranged from 23.2 ∘C in January during the winter northeast monsoon to 27.0 ∘C in May during the transition from the summer season, as defined in (Bañares et al., 2021), to the southwest monsoon. May was also the month with the lowest median 3-hourly relative humidity (76.6 %) (MERRA-2, 975 mb) (Fig. 1b). The highest median level of relative humidity at 975 mb for a month was in August (86.5 %) during the summer southwest monsoon, which is also the time of the year (June to August) when rainfall peaks in the region where the sampling station (Manila Observatory) is located (Coronas, 1920; Cruz et al., 2013). The highest mean hourly precipitation (Fig. 1i) per month was from July (0.46 mm h−1) to September (0.42 mm h−1), while March exhibited the lowest mean hourly rainfall (0.02 mm h−1). Like relative humidity and precipitation, median precipitable water (from available AERONET data of 513 points in August, 4015 points in February, and 5049 points in March) (Fig. 1h) was highest in August (4.9 cm) and lowest in February and March (3.1 and 3.2 cm, respectively).
The lowest 3-hourly median pressures (MERRA-2) were observed (Fig. 1d) between July and September during the southwest monsoon season (∼ 985.2–985.8 mb). This is also the time when the most number of tropical cyclones pass the island of Luzon (Wu and Choy, 2016). The highest 3-hourly median pressure values (988.1–990.0 mb) were during the winter northeast monsoon.
Median winds (MERRA-2) were from the southerly or southwesterly direction from June to September (Fig. 1c and f), associated with the summer southwest monsoon. HYSPLIT back trajectories show the same wind pattern (Fig. 2f to i). The highest median 3-hourly wind speeds (MERRA-2) (Fig. 1c and f) during the southwest monsoon were recorded for August (u: 4.2 m s−1; v: 1.7 m s−1). Median winds begin to transition in October and November (to the northeast monsoon: Amihan) (Fig. 2j and k) coming from the east and northeast and maintained their trajectory until February (Fig. 2b), which is towards the end of the winter northeast monsoon. There were generally higher wind speeds and the highest median 3-hourly wind speeds of the year (MERRA-2) (Fig. 1c and d) in January (u: −7.6 m s−1; v: −4.0 m s−1). Median winds shifted toward a more easterly source from March to May (transition time before the Habagat monsoon) (Fig. 2c to e) accompanied by decreasing median 3-hourly wind speeds ( m s−1; m s−1 to m s−1; v=0.2 m s−1).
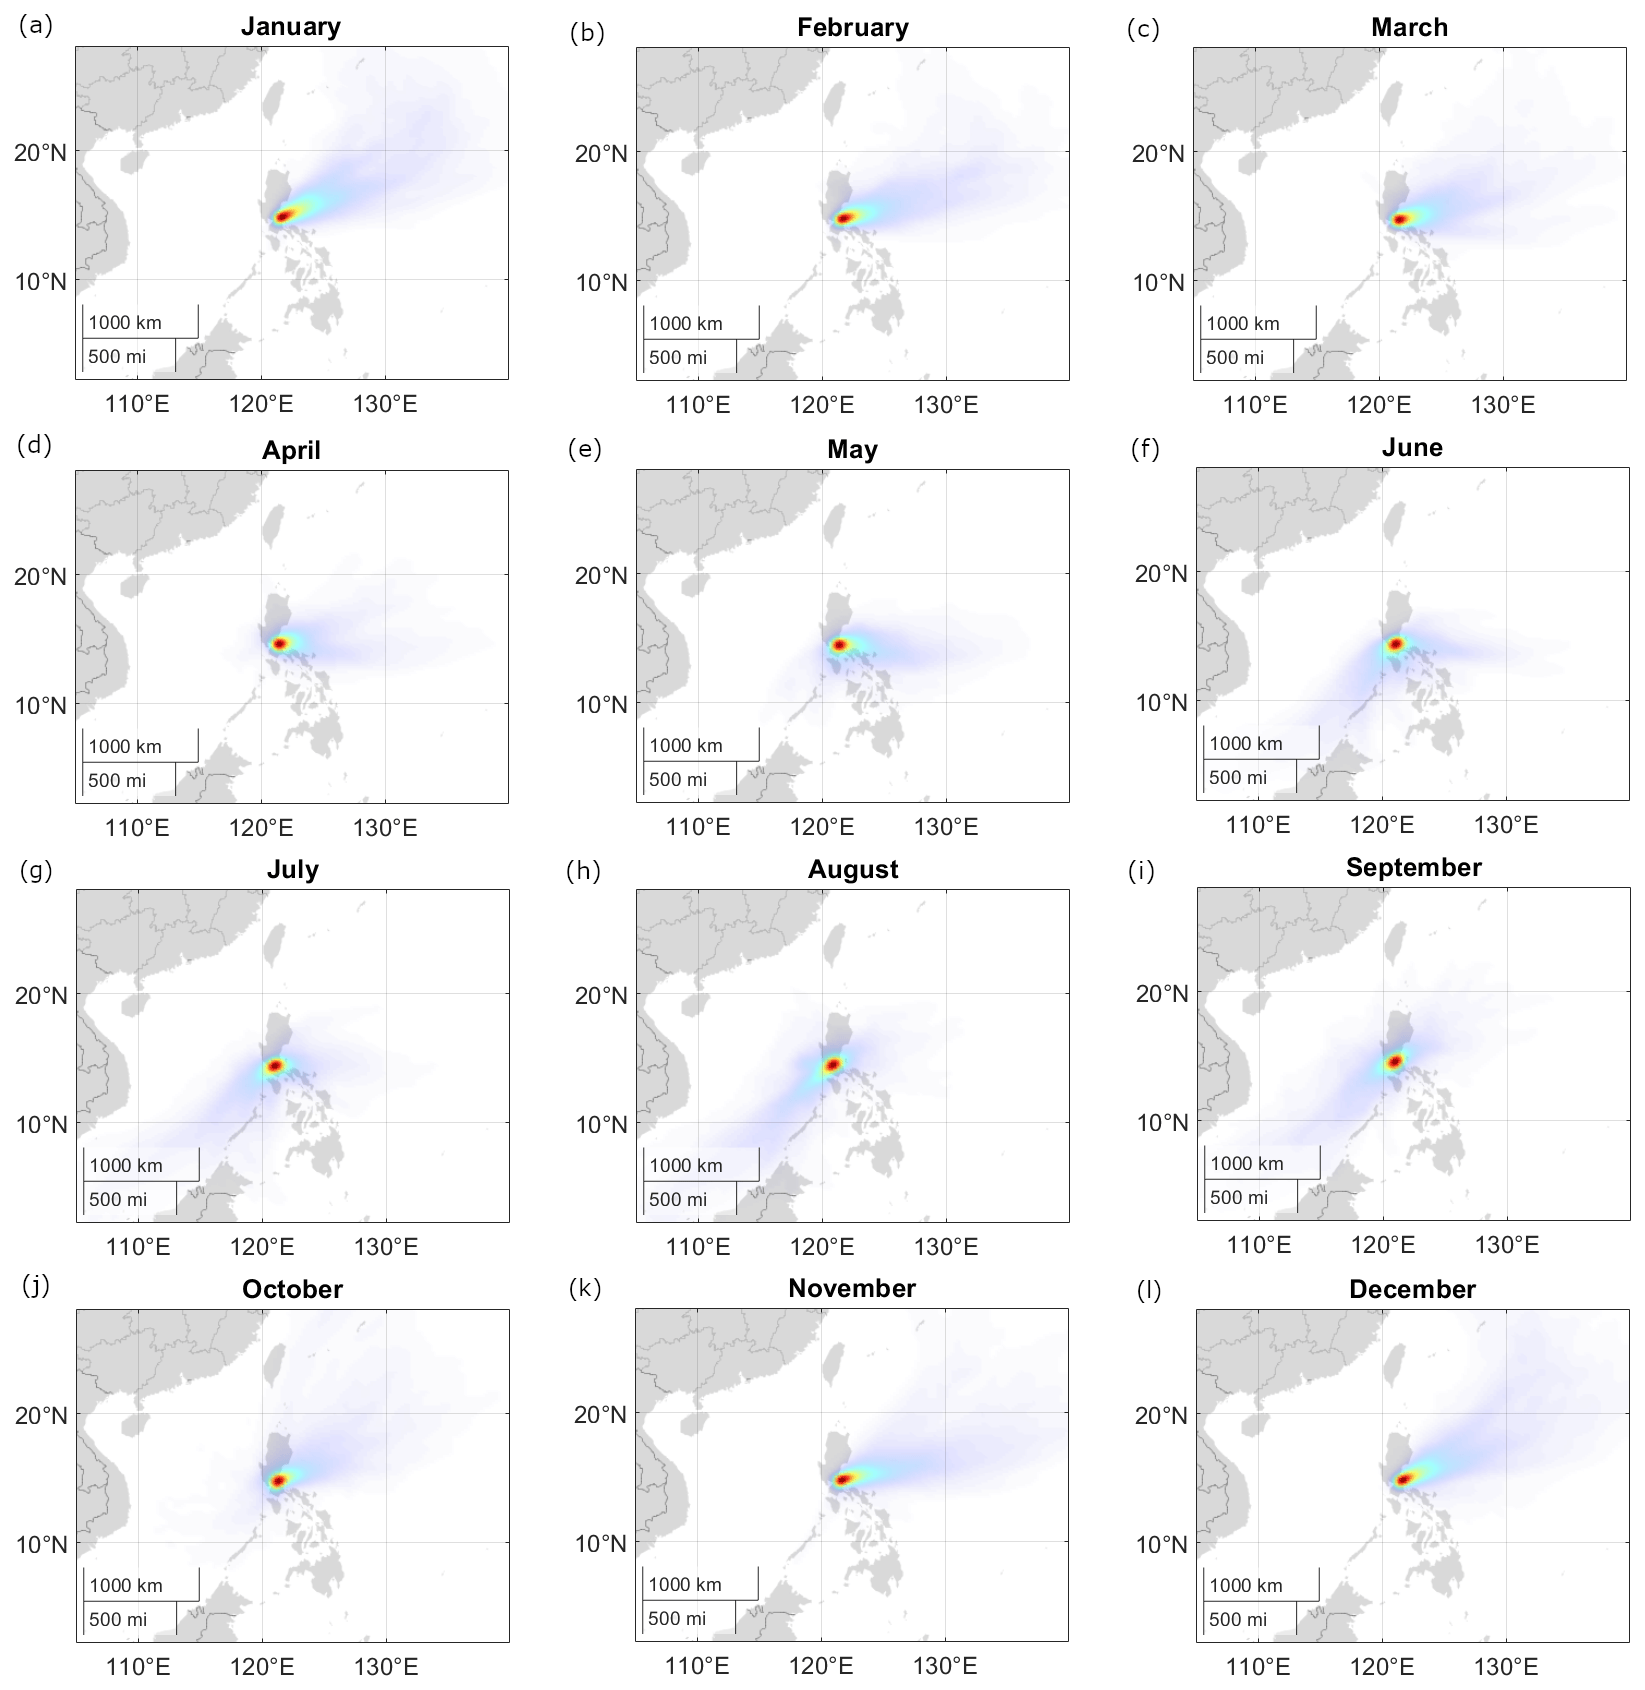
Figure 2Density plots of HYSPLIT trajectories reaching Manila Observatory per month from 2009 to 2018. Red denotes areas with the greatest number of back trajectories within a 100 km radius. The colors represent density value contributions to MATLAB-calculated (MathWorks Inc., 2022) cumulative probability distribution surfaces (100 km radius) from coordinates of 3 d back trajectories of the specific months.
The transition times between the monsoons (when the wind directions shift and wind speeds change) are also the times of the highest (May, Fig. 1g, 621.2 m) and lowest (November, Fig. 1g, 279.6 m) median planetary boundary layer heights (MERRA-2). The median planetary boundary layer height was highest during the period (May) of highest temperatures, lowest relative humidity, reduced air pressure, and lowest monthly median low-cloud fraction (MERRA-2) (Fig. 1e) (1.4 %). The lowest monthly median planetary boundary layer height was observed during the period (November) when temperatures were beginning to cool and air pressure was rising. The monthly maximum low-cloud fraction was lowest in July (18.5 %) during the summer southwest monsoon, while the monthly median and monthly maximum low-cloud fractions (MERRA-2) (Fig. 1e) were highest (38.3 % max, 4.9 % median) in January during the winter northeast monsoon.
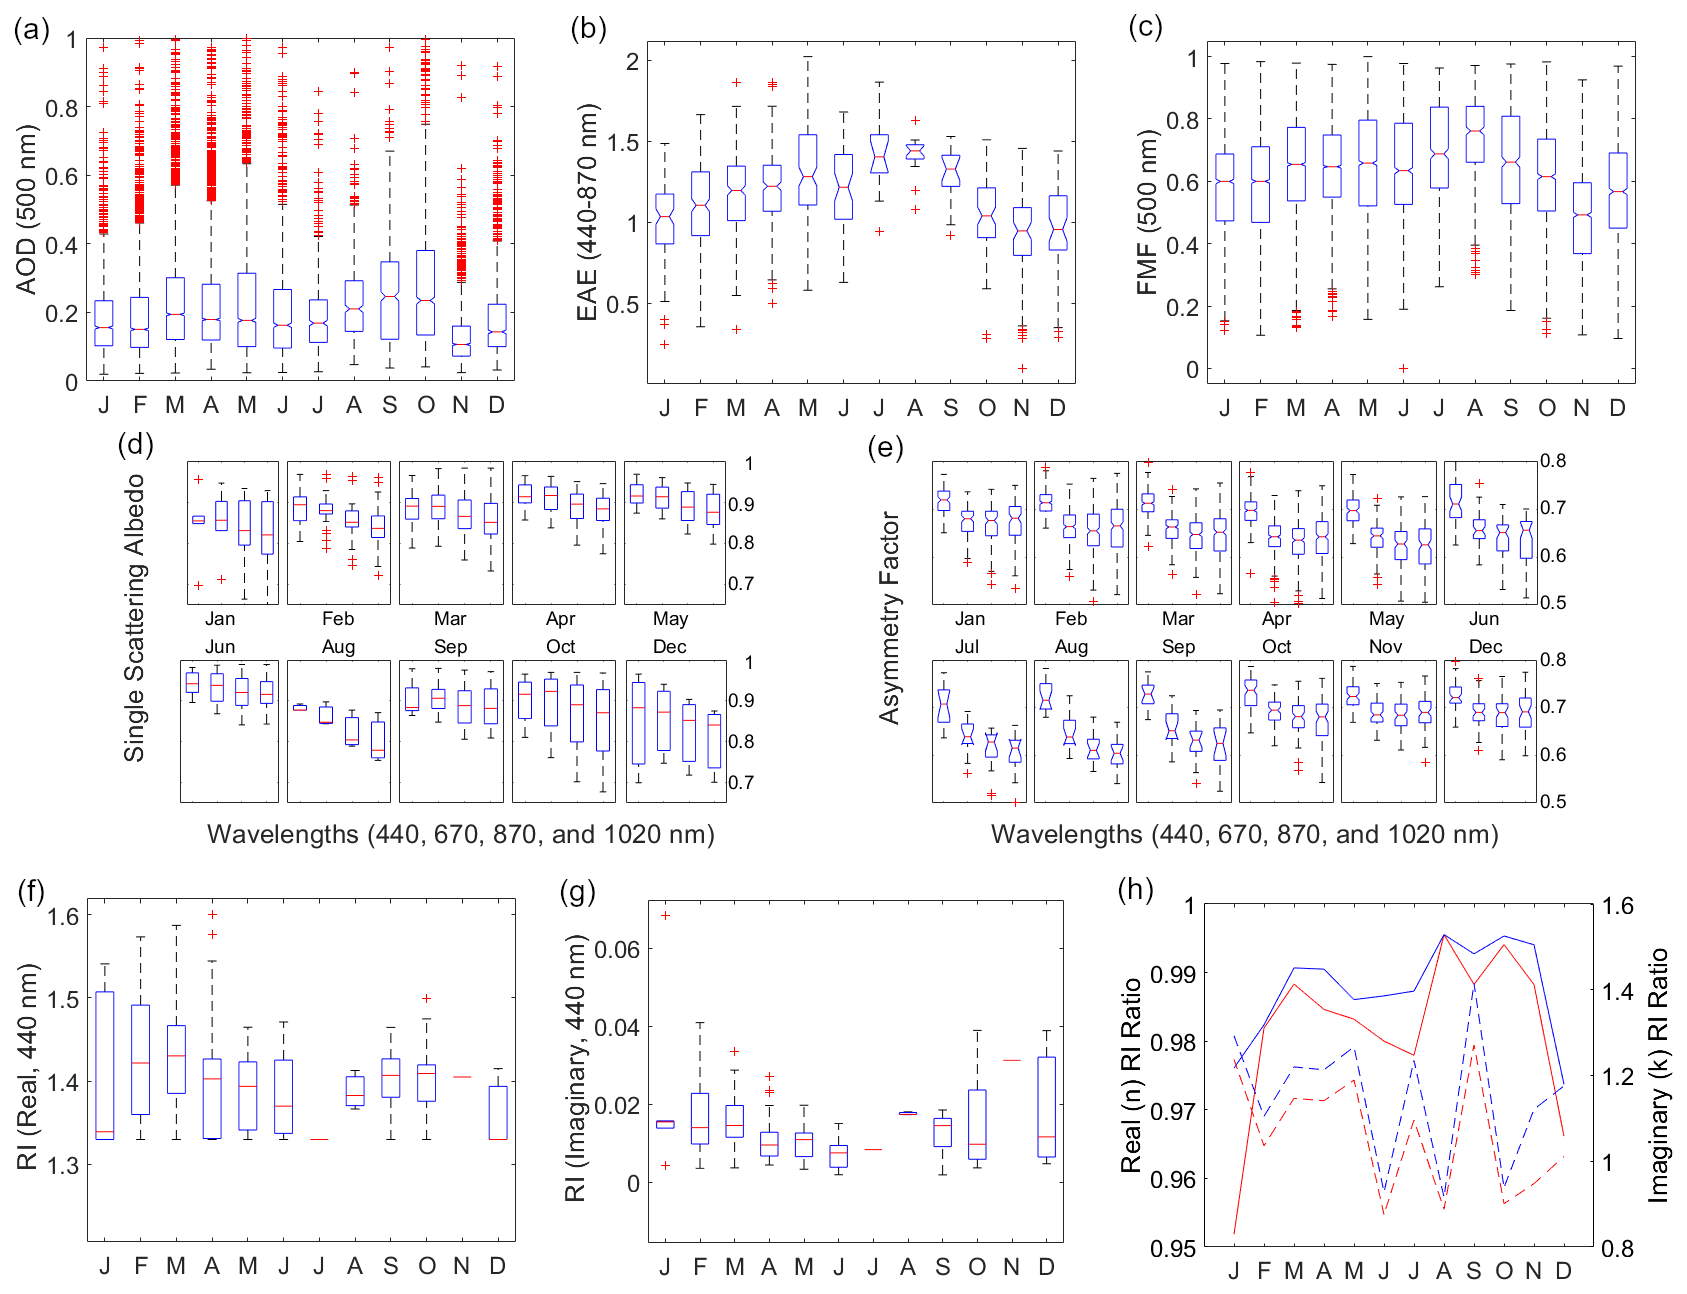
Figure 3Monthly characteristics of AERONET aerosol particle parameters: (a) aerosol optical depth (AOD at 500 nm with y axis until 1.0 only for the larger boxplot resolution) with monthly counts (Jan: 2107; Feb: 3931; Mar: 4923; Apr: 5755; May: 3389; Jun: 1653; Jul: 637; Aug: 483; Sep: 718; Oct: 1555; Nov: 2001; Dec: 1386); (b) extinction Ångström exponent (EAE at 440–870 nm) with monthly counts (Jan: 102; Feb: 248; Mar: 312; Apr: 309; May: 137; Jun: 53; Jul: 14; Aug: 18; Sep: 18; Oct: 79; Nov: 77; Dec: 52); (c) spectral deconvolution algorithm (SDA) retrievals of fine-mode fraction (FMF at 500 nm) with the same monthly counts as AOD; (d) single-scattering albedo (SSA) from 440 nm (leftmost boxplot) to 1020 nm (rightmost boxplot) with monthly counts (Jan: 6; Feb: 31; Mar: 62; Apr: 50; May: 29; Jun: 8; Aug: 3; Sep: 5; Oct: 17; Dec: 3); (e) asymmetry factor (AF) from 440 nm (leftmost boxplot) to 1020 nm (rightmost boxplot) with the same monthly counts as EAE; (f) real and (g) imaginary refractive index (RI) values (440 nm) with the same monthly counts as SSA; and (h) refractive index ratios (where the blue line is the ratio of RI at 440 and 670 nm, the red line is the ratio of RI at 440 nm and the average RI for the 675–1020 nm wavelengths, and the broken lines are the imaginary refractive index ratios) for Metro Manila, the Philippines, based on data between January 2009 and October 2018.
3.2 Aerosol particle characteristics
3.2.1 Aerosol optical depth
Monthly median AOD (AERONET, 500 nm) (Fig. 3a) over Manila Observatory was highest from August (0.21) to October (0.23) around the time of the summer monsoon when winds were coming from the southwest (Fig. 2h to i) (Holben et al., 2001). This is the same time of year when biomass burning activities occur in the Indonesian region southwest of Metro Manila (Glover and Jessup, 1998; Kiely et al., 2019; Cahyono et al., 2022). Studies have shown that AOD in the Philippines increases during the biomass burning season in Indonesia (Nguyen et al., 2019b; Caido et al., 2022). Regional AOD (550 nm) over the larger Southeast Asian domain from MISR and MERRA-2 (Fig. 4) had a similarly large peak around the same time beginning in September until October, which was second in magnitude only to a March peak influenced by biomass burning in peninsular Southeast Asia (PSEA) (Gautam et al., 2013; Hyer et al., 2013; Dong and Fu, 2015; Wang et al., 2015; Yang et al., 2022). This is consistent with the peak in speciated AOD due to fine (radii < 0.7 µm), spherical, and absorbing aerosols that were observed by MISR from March to April (Fig. S1 in the Supplement). This larger peak in March, attributed to PSEA (which is ∼ 2000 km west of the Philippines), was not as prevalent in the AERONET AOD data over Manila Observatory in Metro Manila due to the dominant easterly winds in the Philippines in March (Fig. 2c) and more localized sources.
There is a notable dip in the monthly median AERONET AOD over Manila Observatory from the peak in October to the lowest monthly median AOD (0.11) in November (Fig. 3a), which is just slightly above defined background levels (< 0.1) (Holben et al., 2001), when the wind speeds were picking up and were coming from the east to northeast directions (Fig. 2k) in the direction of the Philippine Sea and the western Pacific Ocean. This dip was also observed in the regional (30∘ × 30∘) AOD data (MISR and MERRA-2, Fig. 4). This is most probably due to the decrease in the AOD contribution from fine (radii < 0.7 µm) and spherical particles based on size-speciated MISR AOD (Fig. S1). Larger and non-spherical particle contributions to AOD increase in November in the Southeast Asia region. The MERRA-2 AOD is relatively high compared to the MISR AOD, which is probably due to assimilation of MODIS data into MERRA-2. Studies in Asia (Xiao et al., 2009; Qi et al., 2013; Choi et al., 2019) have observed relatively high MODIS AOD compared to MISR AOD.
There were 338 instances (∼ 1.2 % of the time based on the total number of 28 538 valid AERONET AOD data points) of AOD values exceeding 1, indicative of heavy aerosol particle loading (Huang et al., 2021). Because AOD is extrinsic (it depends on mass), AOD describes total aerosol particle loading, and we examine other aerosol particle parameters from AERONET to make more informed inferences about size and composition.
3.2.2 Extinction Ångström exponent and fine-mode fraction
The extinction Ångström exponent (EAE) relates the extinction of light at specific wavelengths and is indicative of aerosol particle size (Ångström, 1929). The EAE is usually greater for smaller particles (∼ 4 for very small particles that undergo Rayleigh scattering, > 2 for small particles, <1 for large particles like sea salt and dust, and 0 for particles as large as cloud drops) (Schuster et al., 2006; Bergstrom et al., 2007). The highest monthly median EAE (Fig. 3b) from 2009 to 2018 over Manila Observatory was observed from July (∼ 1.4) to September (∼ 1.3), during the southwest monsoon. This period is associated with the biomass burning southwest of the Philippines (Oanh et al., 2018; Stahl et al., 2021; Crosbie et al., 2022). The median (per month) EAE ranged from ∼ 0.9 in November to ∼ 1.4 in August, a range that is within the values from previous studies collected from mixed sites and urban and industrial areas with both fine and coarse particles (Eck et al., 2005; Giles et al., 2012). The high EAE over Manila Observatory from July to September is consistent with the regional (30∘ latitude × 30∘ longitude) MISR data that show increased AOD from fine, spherical, and absorptive particles (Fig. S1) in Southeast Asia during the same months. This suggests that the high EAE observed at Manila Observatory during these months is not necessarily from local sources.
EAE increases with AOD (Fig. S2), which means that the greater particle loading is contributed by smaller particles (Smirnov et al., 2002). Of the high-loading cases (AOD > 1) over Manila Observatory, the EAE values were mostly greater than 0.8, indicating fine-mode particles (Che et al., 2015). The EAE values in August were the highest compared to other months and also had the highest minimum value of any month (0.71) (Fig. S2) due to smaller particles (∼ EAE > 1 for fine particles, Table 2). The lowest EAE values (0.08) and thus the largest particles were observed in December, which again may be regional in nature with MISR EAE also being at its lowest during this time and increased AOD from larger and non-spherical particles (Fig. S1).
The fine-mode fraction (FMF) describes the prevalence of fine-mode particles in the column of air above the surface. The fine-mode fraction (Fig. 3c) from 2009 to 2018 was highest in August (monthly median of 0.75) and lowest in November (monthly median of 0.45). This is consistent with the EAE values discussed earlier, with a prevalence of smaller particles in August and larger particles in November. In August (Fig. 2h), the southwest monsoon is known to coincide with the transport of fine smoke particles to Luzon. In November (Fig. 2k), the prevalent winds may have already shifted to easterly (Matsumoto et al., 2020) implying more marine-related sources associated with coarser particles.
3.2.3 Single-scattering albedo
The single-scattering albedo (SSA) is the most important aerosol particle parameter determining whether aerosol particles will have a warming or cooling effect (Reid et al., 1998). SSA is the ratio of the scattering coefficient to the total extinction (scattering and absorption) coefficient (Bohren and Clothiaux, 2006) of aerosol particles. Higher SSAs are related to more reflective aerosol particles, while more absorbing aerosol particles will have lower SSA values; values range from 1 (reflective) to 0 (absorbing). Monthly median SSA values were largest in June (0.94 at 440 nm), suggesting the presence of more reflective aerosol particles, and smallest in August (0.88 at 440 nm and 0.78 at 1020 nm), suggesting more absorptive particles that are similar in range to the SSA of biomass burning particles (Table 2). August is when biomass burning is prevalent to the southwest of the Philippines and associated with soot particles that are absorptive.
The sensitivity of SSA to different wavelengths depends on the type of aerosol particles present. More specifically, aerosol particle size and refractive index (which is related to aerosol particle composition) both affect the SSA (Dubovik and King, 2000; Bergstrom et al., 2007; Moosmüller and Sorensen, 2018). For dust-type particles, SSA increases with wavelength because of lower dust absorption in the higher visible to infrared wavelengths (Dubovik et al., 2002), while for urban particles (including black carbon), which absorb light at longer wavelengths, SSA decreases with wavelength (Reid et al., 1998; Bergstrom et al., 2002). The presence of organic carbon may affect this spectral dependence; however, because organic particles absorb in the UV portion of the spectrum, this lowers SSA at wavelengths shorter than 440 nm (Kirchstetter et al., 2004). Monthly median SSA generally decreased with increasing wavelength for all months with available data (Fig. 3d), presumably due to the influence of more urban particles in contrast to dust. However, the monsoon transition months of April, September, and October (Fig. 3d) are noteworthy, as they had increased SSA from 440 to 670 nm, possibly from organics and black carbon due to transported smoke. The back trajectories for these months (Fig. 2d, i, and j) suggest sources from the northeast that are closer to Luzon during these months compared to other months. This indicates the possibility of more local sources. Increasing the certainty of sources associated with aerosol particles necessitates looking at other available aerosol particle parameters, which will be discussed below.
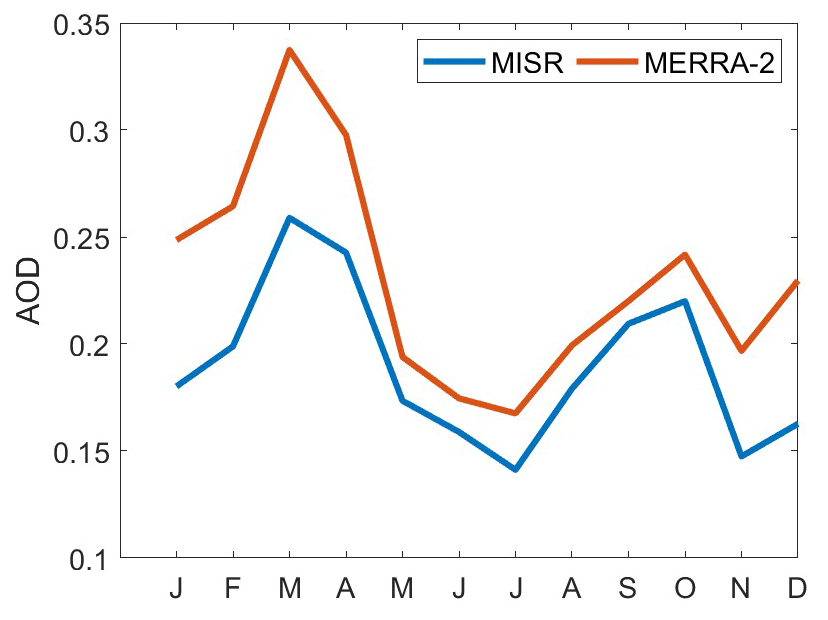
Figure 4Monthly mean AOD (550 nm) in Southeast Asia (30∘ × 30∘) from 2009 to 2018 from MISR (blue line) and MERRA-2 (red line).
3.2.4 Asymmetry factor
The asymmetry factor quantifies the direction of scattering of light due to aerosol particles, with values ranging from −1 (back scatter) to 0 (uniform scattering) to 1 (forward scatter). It is important in modeling climate forcing because it affects the vertical distribution of the radiation in the atmosphere (Kudo et al., 2016; Zhao et al., 2018). The asymmetry factor is dependent on particle size, shape, and composition, and a value of 0.7 is used in radiative models (Pandolfi et al., 2018).
Lower asymmetry factors are related to smaller particles (at constant AOD) (Bi et al., 2014). Measured values due to biomass burning are, for example, 0.54 (550 nm) in Brazil (Ross et al., 1998) and 0.45–0.53 (550 nm and including dust) over central India (Jose et al., 2016). There have been relatively high values observed for western, central, and eastern Europe (0.57–0.61 at 520–550 nm) (Pandolfi et al., 2018) and the US East Coast (0.7 at 550 nm) (Hartley and Hobbs, 2001). In Norway, the asymmetry factor for background summer conditions was 0.62 and was higher in the springtime at 0.81 (862 nm) during Arctic haze events (Herber et al., 2002). The highest values are associated with dust, such as those measured in the Sahara being 0.72–0.73 (500 nm) (Formenti et al., 2000). Over Metro Manila, the asymmetry factors from the AERONET data at the 675, 870, and 1020 nm were similar across months (Fig. 3e). The monthly median asymmetry factors at 440 nm ranged from 0.70 (April and May) to 0.74 (October), while for 670, 870, and 1020 nm the monthly median asymmetry factors were smaller and ranged from 0.62–0.69. These values were closely related to those observed over the US East Coast as mentioned earlier, perhaps due to the proximity of the location to the coast (10 km east of Manila Bay and 100 km west of the Philippine Sea) and its location in Manila, which is a large local source (mostly due to vehicles) (Cruz et al., 2019).
The monthly median asymmetry factor in Metro Manila was greatest towards the end of the year (October to December) for all of the wavelengths, suggesting larger particles when winds (Fig. 2j to l) come from the Philippine Sea in the northeast. It was in March and April that the monthly median asymmetry factor was minimal for 440 nm and was minimal in August for 670, 870, and 1020 nm. These were the times when aerosol particles were smallest. March to April represents the driest time of the year in Manila (Fig. 1b and h), perhaps preventing particle growth, and where the local sources may be dominant, even as back trajectories (Fig. 2c and d) extend all the way from the Philippine Sea to the east. This is corroborated by results from other studies showing that the asymmetry factor seems to be enhanced by relative humidity (Zhao et al., 2018). The unexpected low asymmetry factor values in August, however, are probably because of the source of the particles. August had the highest relative humidity and precipitable water (Fig. 1b and h) but is also when the back trajectories (Fig. 2h) were from the southwest, possibly affected by the Indonesian fires, which could have transported more non-hygroscopic fine particles.
Fine particles have been observed to exhibit decreasing asymmetry factors with increasing wavelength (Bergstrom et al., 2003). This trend is observed in all months for the monthly median asymmetry factors (Fig. 3e), suggesting the predominance of smaller aerosol particles. The greatest decrease in the asymmetry factor (all wavelengths) was in August, consistent with the lowest observed values of the year (670, 870, and 1020 nm). Transported biomass burning particles are the probable dominant particles during this time. They are usually composed of hygroscopic inorganics, non-hygroscopic soot, and relative non-hygroscopic organic fractions (Petters et al., 2009). Knowing the composition of biomass burning particles over the study region will help in the understanding of hygroscopicity and its impacts on radiation.
3.2.5 Refractive index
Refractive index is an intrinsic parameter as it does not depend on the mass or the size of particles, and thus can be used to infer aerosol particle composition (Schuster et al., 2016). For the case of the AERONET data, which include refractive index values that are insensitive to coarse particles (Sinyuk et al., 2020), the focus of the discussion will be for fine-mode particles and may be limited when coarse particles are involved. Refractive index measurements are complex since they include real and imaginary parts related to light scattering and absorption, respectively. All aerosol particles scatter light, but only certain types absorb light significantly. The most prominent particle absorbers in the atmosphere are soot carbon, brown carbon (organic carbon that absorbs light), and free iron from dust (hematite and goethite in the ultraviolet to mid-visible) (Schuster et al., 2016). For this study, we examine refractive index values at 440 nm wavelength. Pure sources of soot carbon have the highest real refractive index values (∼ 1.85) and the highest imaginary refractive index (∼ 0.71), which are both independent of wavelength (Koven and Fung, 2006; Van Beelen et al., 2014). Brown carbon and dust have relatively low real refractive index values at 440 nm (∼ 1.57 and ∼ 1.54) and imaginary refractive index values (∼ 0.063 and ∼ 0.008) that decrease with increasing wavelength (Xie et al., 2017).
In this study the range of the monthly median real refractive index values (440 nm) was from 1.33 (December and January) to 1.43 (March) (Fig. 3f). Water uptake by aerosol particles decreases the real refractive index values (Xie et al., 2017), and thus the lowered real refractive indices over Manila Observatory could be due to the presence of more water in the atmosphere in general and/or the increased presence of more hygroscopic particles. December and January are not necessarily the months that have the highest moisture content, but they are months when back trajectories reaching the column over Manila Observatory are from the Philippine Sea to the northeast, presumably transporting hygroscopic particles. As reported in previous sections, relatively large particles are observed around this time of the year, and thus sea salt can be an important contributor. The greatest change in the monthly median real refractive index with increasing wavelength was also observed in December (Fig. 3h), possibly due to the increased fractional contribution of constituents other than soot carbon (because the real refractive index of soot carbon is invariant with wavelength). The month of August (Fig. 3f) is also noteworthy as it has the smallest range of real refractive index values, possibly indicating a more homogenous aerosol particle source compared to other months. August is the month with the highest relative humidity (Fig. 1b) and highest precipitable water (Fig. 1h), and this is also the month when long-range biomass burning emissions are observed to be at their highest and real refractive index values would otherwise be expected to be at their highest.
Water content seems to play a significant role in the real refractive index values in Manila. March, when the monthly median real refractive index values are highest (Fig. 3f), is when precipitable water vapor (Fig. 1h) is among the lowest in the year. The months around March are also when maximum real refractive indices (1.57 in February, 1.59 in March, and 1.60 in April) were observed (Fig. 3f). March was when there was a relatively small change in real refractive index value, with wavelength perhaps being related to greater soot carbon fractions during this time, possibly due to the contribution of biomass burning from peninsular Southeast Asia (Shen et al., 2014). Looking more closely at the imaginary refractive index values will help elucidate this issue.
Monthly median imaginary refractive index values (440 nm) ranged from 0.007 in June to 0.015 in September and December (Fig. 3g). These are low compared to those of the pure soot carbon mentioned earlier because of the mixed nature of the sampling site with contributions from brown carbon and dust. The highest imaginary refractive index values in September and December suggest the greatest fractional contribution of soot because the highest imaginary refractive index values are associated with soot. These are also similar in magnitude to biomass burning particles in the Amazon (0.013) (Guyon et al., 2003). The key distinction between soot carbon and other major absorbers (brown carbon and dust) is that its imaginary refractive index is invariant with wavelength. Both brown carbon and dust exhibit a decrease in the imaginary refractive index with increasing wavelength (Xie et al., 2017). The ratios of imaginary refractive index values (440 nm to average of 670–1020 nm) (Fig. 3h) show a relative invariance with wavelength (ranging from 0.88 to 1.4), which indicates the dominance of soot as the major absorber in the region (Eck et al., 2003). While observed wavelength invariance points to high soot contributions, the size of the particles can help distinguish between brown carbon sources, which reside mainly in the fine mode, and dust sources, which yield more coarse particles (Schuster et al., 2016). September is during the southwest monsoon, which is when, as noted in earlier sections, fine particles were most prevalent. This is also the time when the imaginary refractive index varied most with wavelength (1.4 ratio of the imaginary refractive index at 440 nm and the imaginary refractive index average for 670 to 1020 nm in Fig. 3h), possibly with greater absolute contributions from brown carbon, even with the highest soot carbon fractional contributions. Brown carbon has been observed both from primary and aged aerosol particle emissions from biomass burning (Saleh et al., 2013). As noted earlier, December also had the highest imaginary refractive index values and relatively coarse particles, possibly due to larger dust absolute contributions even with the highest soot carbon fraction contributions. In contrast, the lowest monthly median imaginary refractive index values are in June, when fine-mode particles prevail suggest highest fractional contributions of brown carbon relative to other months (Fig. 3h).
3.2.6 Volume size distributions
The volume size distribution (VSD) is another way to be able to more deeply characterize aerosol particles, specifically related to their effect on climate, weather, and clouds (Haywood and Boucher, 2000; Feingold, 2003). In the Manila Observatory dataset, there was a bimodal VSD for the entire dataset (Fig. 5a). The fine-mode median values peaked in the accumulation mode at 0.148 µm particle radius, while the coarse-mode median values peaked at 3.857 µm (Fig. 5a and Table S1). The median coarse-mode amplitudes and volume concentrations were higher than the fine-mode amplitudes and volume concentrations for most of the year (DJF, MAM, and SON, Fig. 5b and Table S1), except during the southwest monsoon (JJA) when the fine-mode amplitude and volume concentration was higher. This is consistent with observations earlier of fine-mode prevalence during the southwest monsoon. Median VSD amplitudes (Fig. 5c) were greater in the afternoon, with higher peaks and volume concentrations for both the fine and coarse modes compared to the morning. There was a slightly larger coarse median amplitude and volume concentration compared to the accumulation mode median amplitude and volume concentration for both the morning and afternoon size distributions. While the VSDs confirm several observations based on the analysis of the aerosol particle parameters presented earlier, not much further information is gained, especially regarding chemical composition. Size distributions are a result of contributions from multiple sources, and thus being able to discriminate the sources based on their characteristic size distributions will help identify relevant sources.
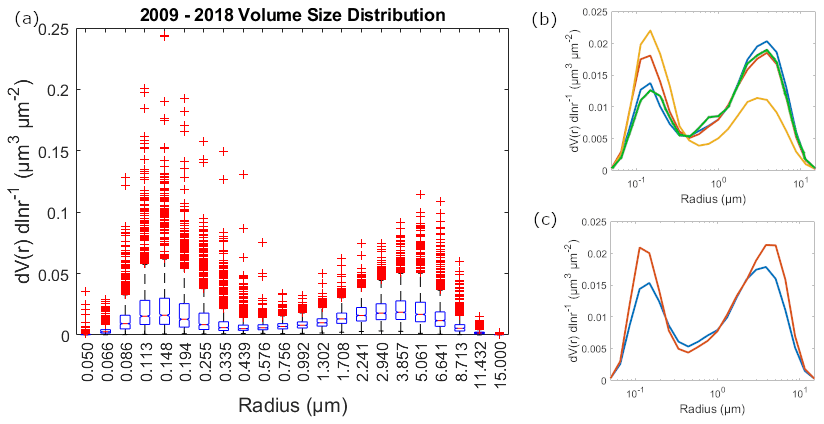
Figure 5(a) VSD results derived from AERONET measurements at Metro Manila between January 2009 and October 2018. Median VSDs over the study period based on (b) season (blue: DJF; red: MAM; orange: JJA; green: SON) and (c) time of day (blue: before 12:00 UTC+8; red: after 12:00 UTC+8).
3.3 Clusters
3.3.1 VSD cluster profiles
Five clusters were identified to best represent the VSD (Fig. 6a). The average of the VSDs in each cluster varied depending on the height of the peaks in the accumulation mode and the coarse mode. In Metro Manila, the accumulation mode is associated with aged aerosol particles and combustion (Cruz et al., 2019). The majority of the data (830 count out of 1419 total VSD profiles) were clustered together in a profile (cluster 1) that had relatively low average magnitudes of volume concentration for both the accumulation (0.01 µm3 µm−2) and coarse (0.02 µm3 µm−2) modes, with the volume concentration magnitude of the coarse mode peaking slightly higher than the volume concentration magnitude of the accumulation mode peak. The next most prevalent cluster profile (284 counts, cluster 2) had an average fine-mode peak for the volume concentration (0.04 µm3 µm−2) that was more than twice as much as the previous profile but with a similar coarse-mode peak for the volume concentration (0.02 µm3 µm−2). The average coarse-mode peak for the volume concentration (0.04 µm3 µm−2) was the highest (compared to the four other cluster profiles) for the third most prevalent cluster profile (166 counts, cluster 3); cluster 3 also had a volume concentration peak in the coarse mode that was slightly shifted to a higher radius (5.06 µm) compared to other clusters. The coarse mode dominated this VSD compared to other profiles (lower magnitude for the accumulation mode peak for the volume concentration, 0.02 µm3 µm−2). The two remaining cluster profiles exhibited high average magnitudes of volume concentration in both the accumulation and coarse modes. The fourth most prevalent cluster profile (74 counts, cluster 4) had the highest average absolute magnitude for the volume concentration in the accumulation mode (0.11 µm3 µm−2), while the fifth most prevalent cluster profile (65 counts, cluster 5) had a slightly smaller accumulation mode peak for the volume concentration (0.07 µm3 µm−2) that was shifted to a slightly higher radius (0.19 µm compared to 0.15 µm). Both clusters 4 and 5 had similar average coarse-mode peak volume concentration magnitudes (0.04 µm3 µm−2).
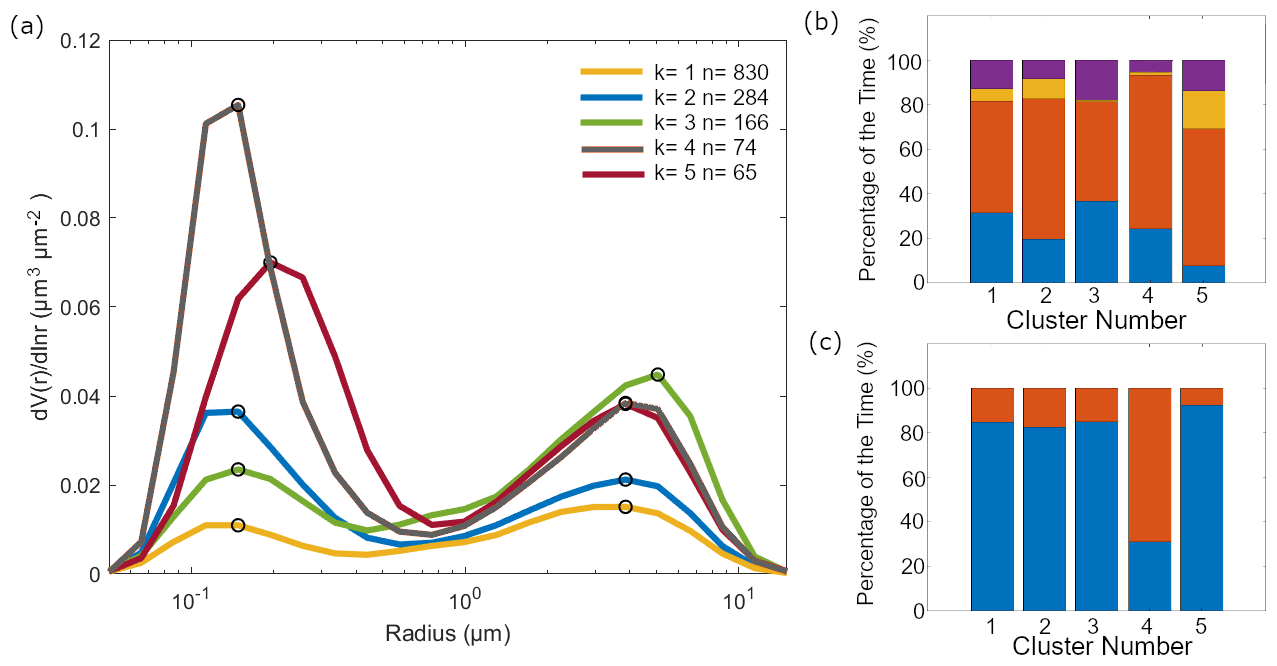
Figure 6(a) Cluster analysis of VSD data yielding five characteristic and averaged VSDs, with the number of points per cluster shown in the legend. The black circles on the curves show the peak locations in the submicrometer (< 1 µm) and coarse (≥ 1 µm) modes. The relative abundance of each cluster is shown for different (b) seasons (blue: DJF; red: MAM; orange: JJA; violet: SON) and (c) times of day (blue: before 12:00 UTC+8; red: after 12:00 UTC+8).
The clusters were distributed across seasons (Fig. 6b), with clusters 1 and 2 being the most evenly distributed among the clusters. Cluster 3, which had the highest coarse-mode peak, had the greatest contribution from September to November compared to other clusters. Cluster 4, which had the highest accumulated mode peak compared to other clusters, had the greatest contribution from March to May and for afternoon VSDs compared to other clusters (Fig. 6b and c). Relative contributions of VSDs from June to August were highest for cluster 5, which had the shifted accumulated mode peak.
Median total (AERONET) AOD values (Fig. 7b) were lowest (0.12) for cluster 1, though it had the second-highest sea salt fractional contributions (31 %) (Fig. 7a) to total AOD (MERRA-2) among all the clusters. Cluster 2 had relatively mid-range median total AOD values (0.27) that, along with clusters 4 and 5, were dominated by sulfate and organic carbon (46 % and 20 %). Cluster 3 had similar but slightly lower median total AOD (0.25) compared to cluster 2. Cluster 3 was distinct because it had the largest total (0.04) and fractional contribution (37 %) from sea salt among all clusters. Clusters 4 and 5 had the highest median total AOD values (0.47 and 0.56), with cluster 5 having the highest absolute and fractional sulfate contributions (0.14 and 64 %) among the clusters. Integrating the above results with their corresponding aerosol particle properties can help associate the clusters with air masses.
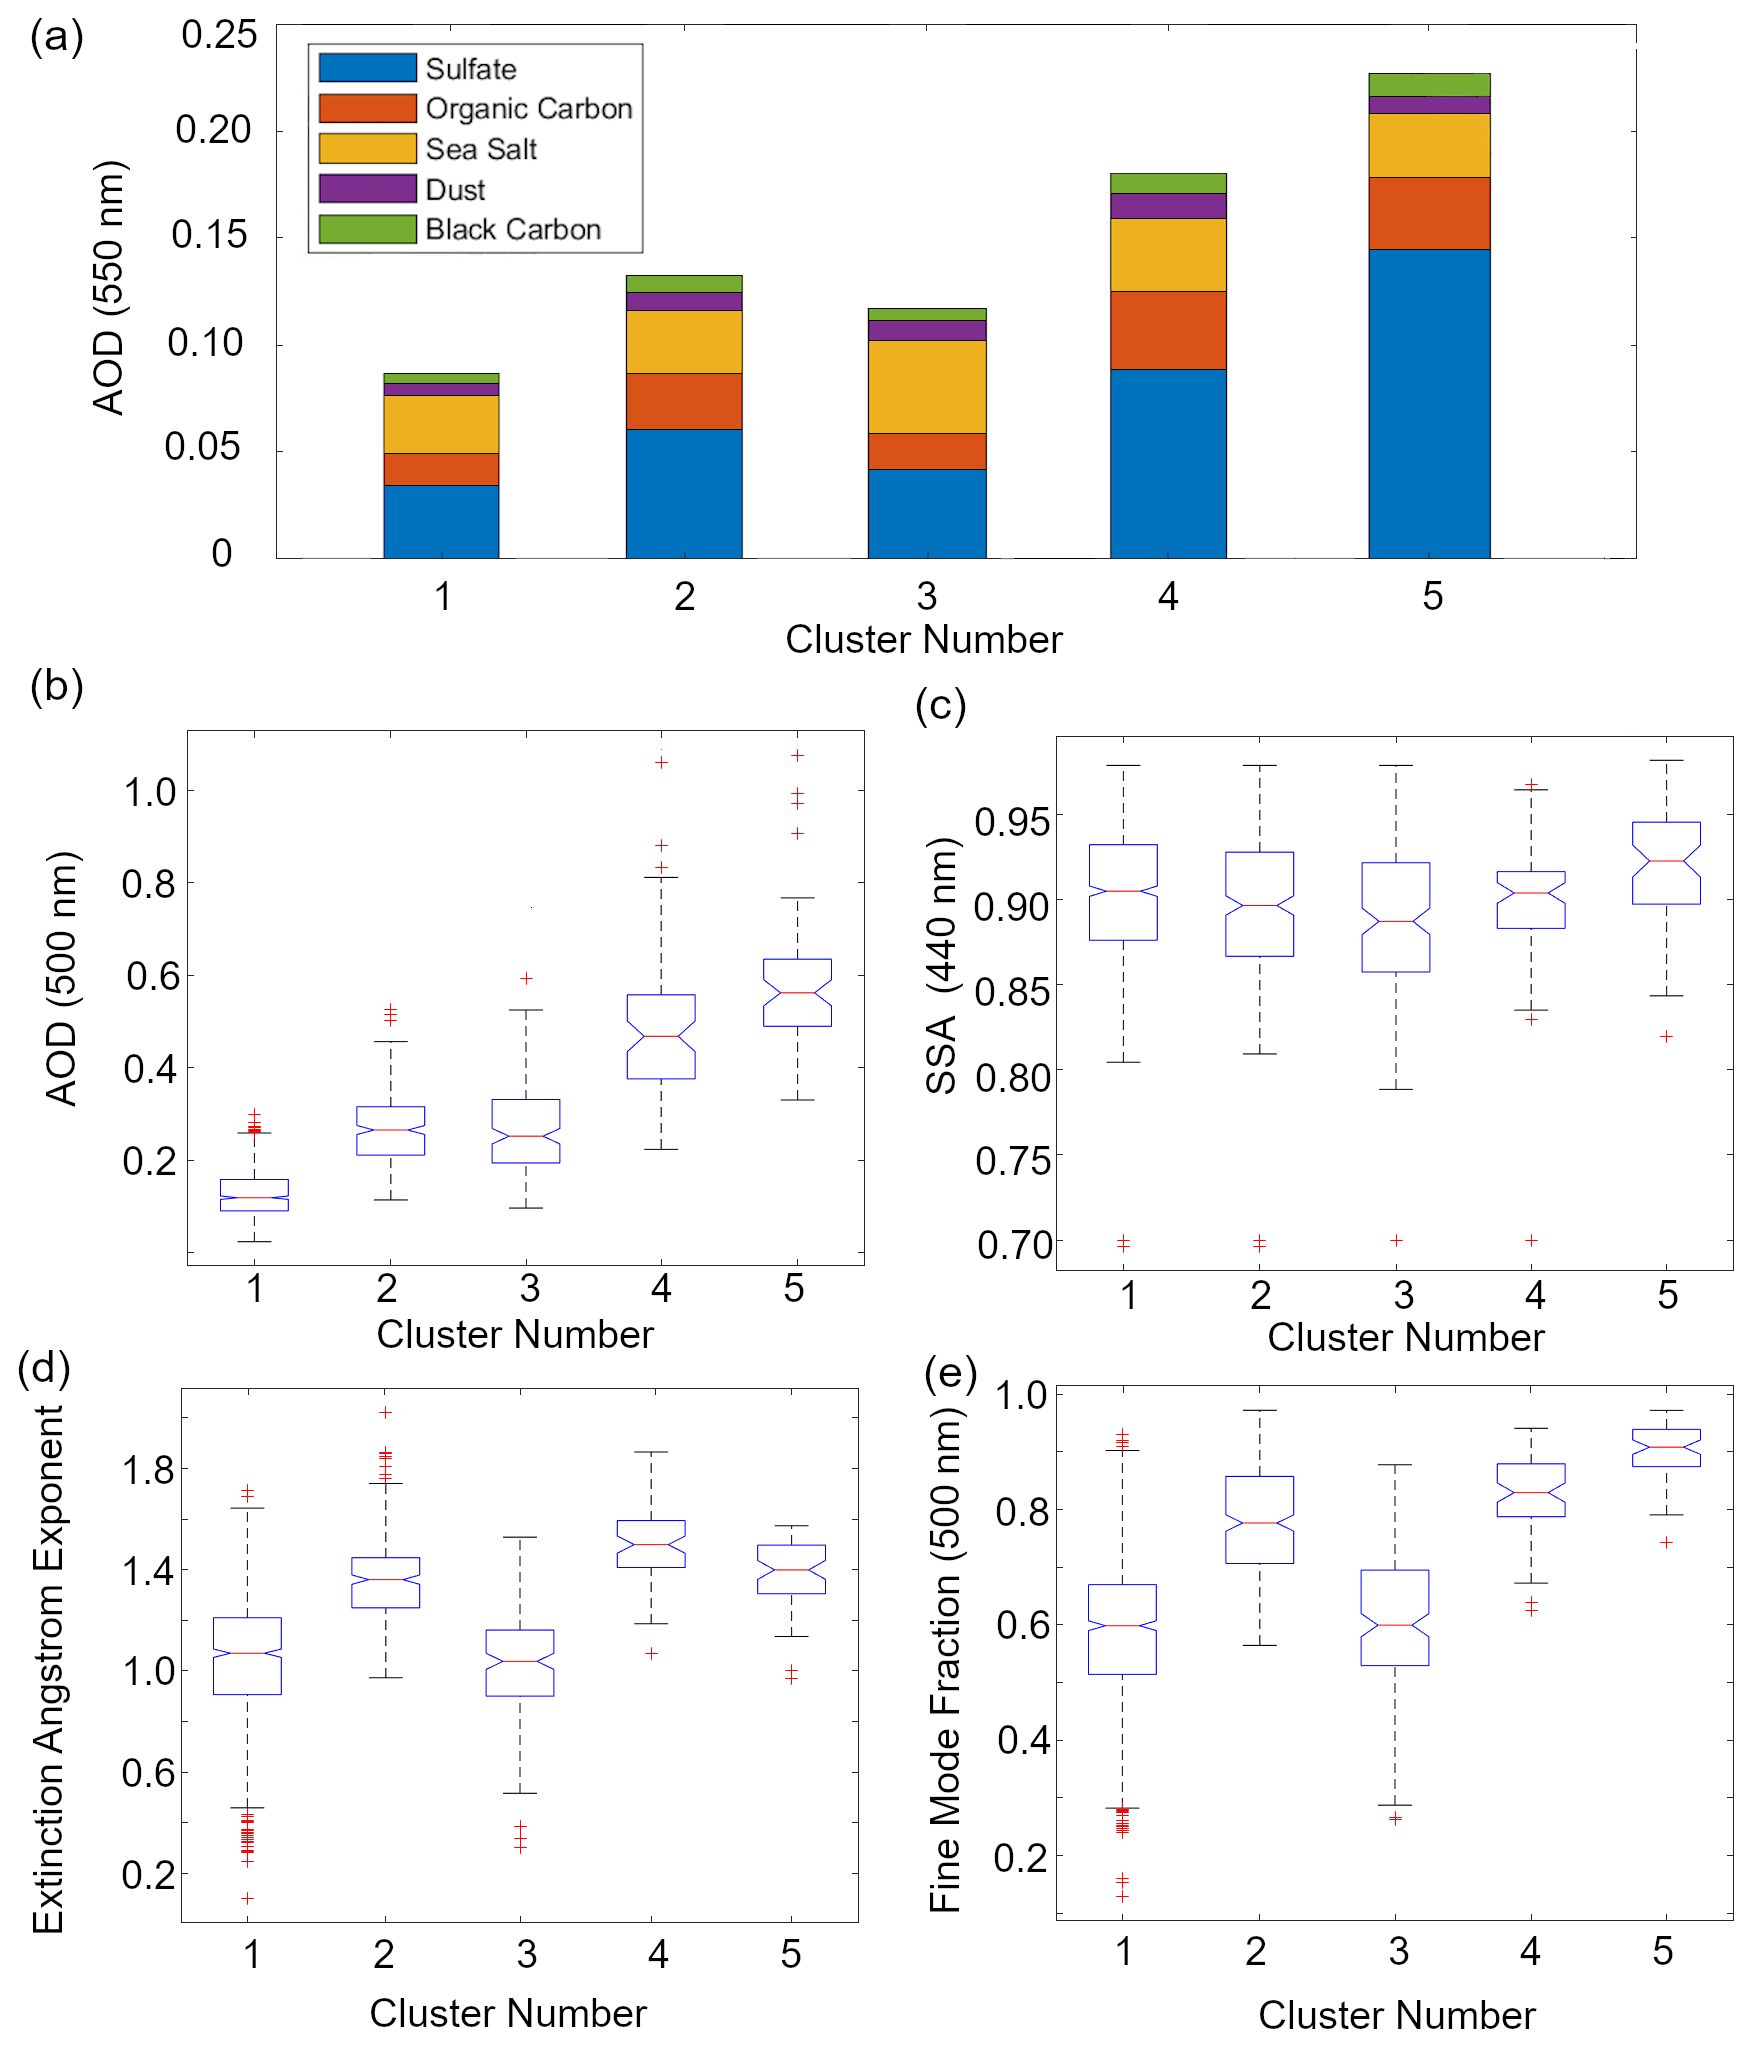
Figure 7(a) Average compositional contributions to aerosol optical depth (AOD at 550 nm) from MERRA-2 per identified cluster (counts per cluster from 1 to 5 are 830, 284, 166, 74, and 65, respectively). Boxplots of AERONET (b) total AOD (500 nm), (c) single-scattering albedo (SSA at 440 nm), (d) extinction Ångström exponent (EAE at 440–870 nm total), and (e) fine-mode fraction (FMF at 500 nm) per cluster.
3.3.2 Air mass types
Air masses have been classified in previous studies based on their AOD, EAE, FMF, and SSA values (e.g., Lee et al., 2010; Aldhaif et al., 2021). The criteria from different studies (Table 2) were applied per cluster. The median total AOD of cluster 1 (0.12) was less than 0.2 (Fig. 7b), which is the threshold for sea salt sources. Half of the data points in cluster 1 also fall below the threshold for clean environments (AOD < 0.1) (Sorooshian et al., 2013). Based on its median EAE (1.07, where EAE < 1 is coarse and EAE > 1 is fine) and FMF (0.60) values (Fig. 7d and e), cluster 1 is a mixture of fine and coarse particles. The fine cluster 1 is the only cluster with a median that meets that threshold value for clean marine sources (AOD < 0.2), and we know from Sect. 3.3.1 that its average VSD magnitude was greater for the coarse fraction and that its sea salt contribution to total AOD was second greatest among the clusters. Thus cluster 1 is most probably a background clean marine source since it is also predominant throughout the seasons (Fig. 6b). This makes sense given the proximity of the ocean to Metro Manila from both the east and west. The median SSA (0.90 at 440 nm) for cluster 1 (Fig. 7c), however, suggests the presence of absorbing particles, which is most probably due to high black carbon in the local source (Cruz et al., 2019) that is mixed in with this generally clean marine source.
Most of the data from the other clusters all fall in the polluted category (Table 2) based on their median total AODs (> 0.1) (Fig. 7b). Cluster 2 has a median FMF value of 0.78 (Fig. 7e), which suggests that most of the particles in this air mass are in the fine fraction. They are, however, not sufficiently dominant in the aerosol for them to be typical of urban and industrial sources. The average VSDs (Fig. 6a) of cluster 2 similarly suggest that their relative accumulation mode magnitude is higher than the coarse magnitude but not by much. Like cluster 1, cluster 2 is also more evenly distributed across the seasons (Fig. 6b). The median SSA for cluster 2 (0.90 at 440 nm) is also similar to the SSA of cluster 1 (Fig. 7c) where the local and background particles are mixed. Cluster 2 could be a fine polluted background source superimposed onto the dominant marine source. Metro Manila is a megacity with continuous and large numbers of sources that could be, due to its proximity to the ocean, interacting with the background.
Based on its median EAE value (1.04) (Fig. 7d), cluster 3 is mixed but mostly in the coarse fraction, consistent with its VSD profile (Fig. 6a), which has the highest coarse magnitude (FMF = 0.60) compared to the other clusters. The contribution of data from September to February is greatest in cluster 3 (Fig. 6b), consistent with expected coarser particles during this period when the winds are initially shifting from the southwest before becoming more northeasterly, as previously noted. Median SSA (0.89 at 440 nm) was lowest for cluster 3 (Fig. 7c); this and the relatively high coarse particle contribution suggests cluster 3 as a possible dust source based on past studies (Lee et al., 2010). This air mass can be a mixture of local sources and transported dust air masses. The large sea salt contribution (∼ 37 %) to total AOD in cluster 3 (Sect. 3.3.1) could be related to long-range transport.
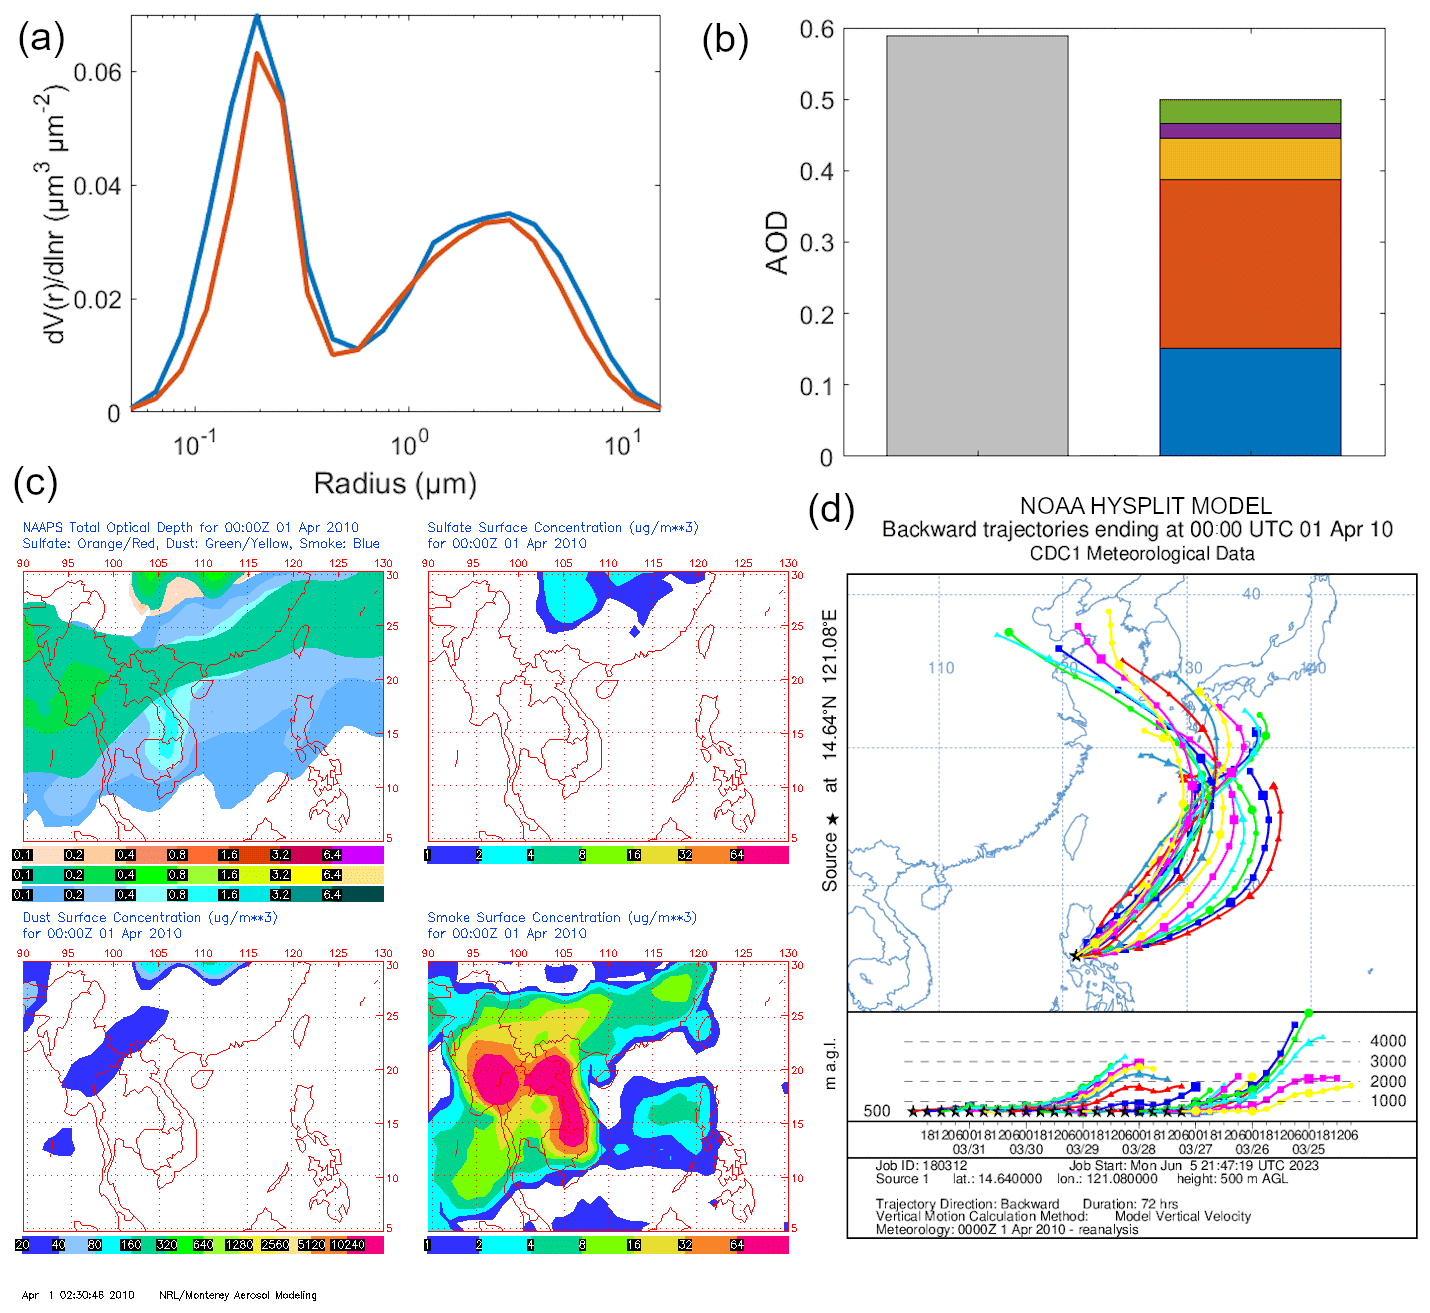
Figure 8Case study of long-range transport (smoke – East Asia) around 1 April 2010. (a) AERONET VSDs at (blue) 00:01 and (red) 00:26 UTC, (b) AOD from AERONET (gray: median AOD at 500 nm) and MERRA-2 hourly (green: black carbon; violet: dust; yellow: sea salt; orange: organic carbon; blue: sulfate) compositional contributions to AOD (550 nm) that are closest in time to 00:01 UTC, (c) NAAPS maps of total and compositional hourly AOD and sulfate, dust, and smoke surface concentrations at 00:00 UTC (orange and red: sulfate; green and yellow: dust; blue: smoke), and (d) HYSPLIT 7 d back trajectories arriving at Manila Observatory at 00:00 UTC.
Both clusters 4 and 5 have median total FMF (0.83 and 0.91) (Fig. 7e) values exceeding the mark (> 0.8, Table 2) for urban and industrial air masses. Combining this and results from the previous sections confirms that cluster 4 could be an urban and industrial source given that it had the highest median accumulated mode peak and organic carbon contribution (∼ 20 %) to total AOD among the clusters. The median SSA for cluster 4 (0.90 at 440 nm) was similar to the median SSA of clusters 1 and 2 (Fig. 7c), but the maximum SSA value for this cluster was lowest in general among all the clusters, suggesting cluster 4 has the net most absorptive effect. The cluster 4 air mass is probably from local sources and transported biomass burning emissions. The high median EAE (1.40, Fig. 7d) may be associated with aerosol particles due to biomass burning (Deep et al., 2021).
Cluster 5 had the highest median total AOD (0.56) and FMF (0.91) values (Fig. 7b and e). It also had the highest sulfate contribution (∼ 64 %) to total AOD (Fig. 7a), the highest median SSA (0.92 at 440 nm, thus most reflective particles among the clusters) (Fig. 7c), and a shifted accumulation mode peak (Fig. 6a). These characteristics suggest that cluster 5 is a possible cloud-processing air mass (Eck et al., 2012). The larger peak in the accumulation mode is possibly the cloud signature. Previous studies have attributed this larger mode to cloud processing due to the conversion of SO2 to sulfate (Hoppel et al., 1994). Cloud processing is a major source of sulfate (Barth et al., 2000).
The distribution of the air masses based on the abundance of the VSD profiles per cluster suggest prevalent clean marine (58 % of the total VSD counts) and background fine polluted (20 %) air masses over Metro Manila. The mixed dust (12 %), urban and industrial (5 %), and cloud processing (5 %) air masses contribute 22 % altogether. We can investigate more deeply and look at specific case studies that can better describe the air masses identified here.
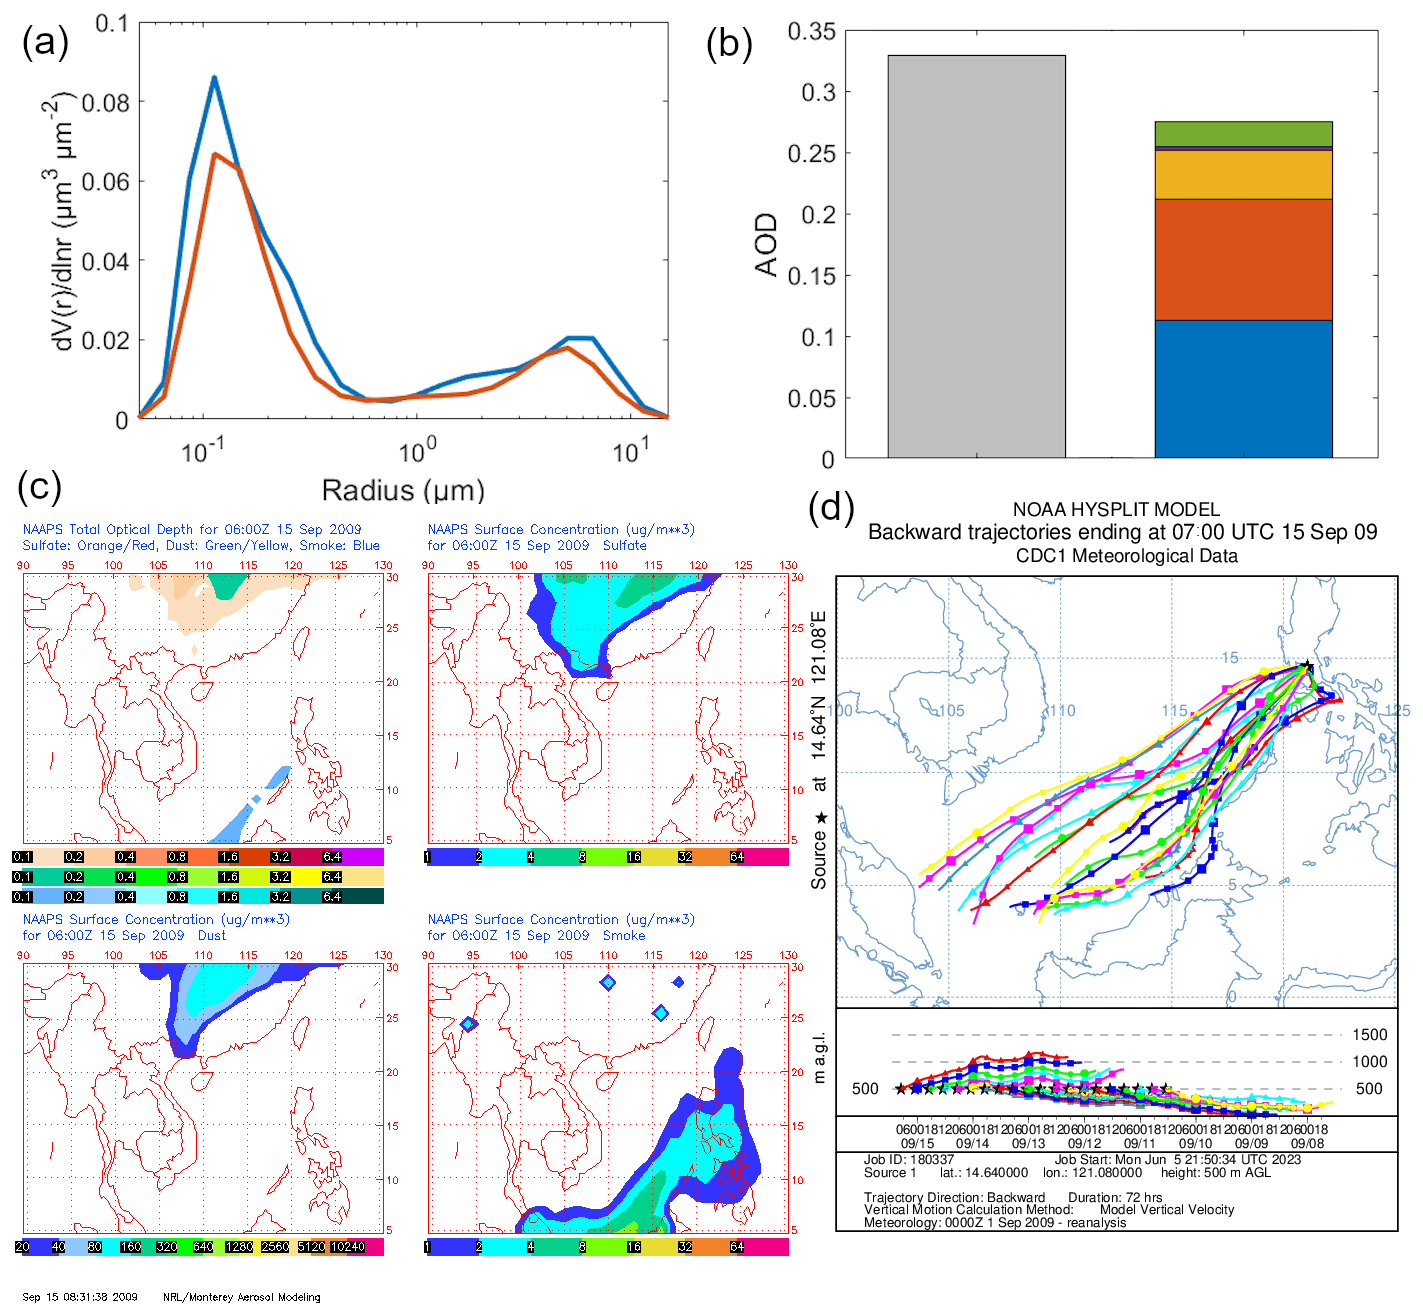
Figure 9Case study of long-range transport (smoke – Southeast Asia) around 15 September 2009. (a) AERONET VSDs at (blue) 07:27 and (red) 07:52 UTC, (b) AOD from AERONET (gray: median AOD at 500 nm) and MERRA-2 hourly (green: black carbon; violet: dust; yellow: sea salt; orange: organic carbon; blue: sulfate) compositional contributions to AOD (550 nm) closest in time to 07:27 UTC, (c) NAAPS maps of total and compositional hourly AOD and sulfate, dust, and smoke surface concentrations at 06:00 UTC (orange and red: sulfate; green and yellow: dust; blue: smoke), and (d) HYSPLIT 7 d back trajectories arriving at Manila Observatory at 07:00 UTC.
3.4 Case studies
Selected case studies are used to highlight periods with the highest AOD values and strongest clear-sky (no rain and heavy clouds) daytime aerosol particle sources within the sampling period. As such, the clusters that are associated with the selected case studies are the clusters (3–5) with higher VSD concentration magnitudes.
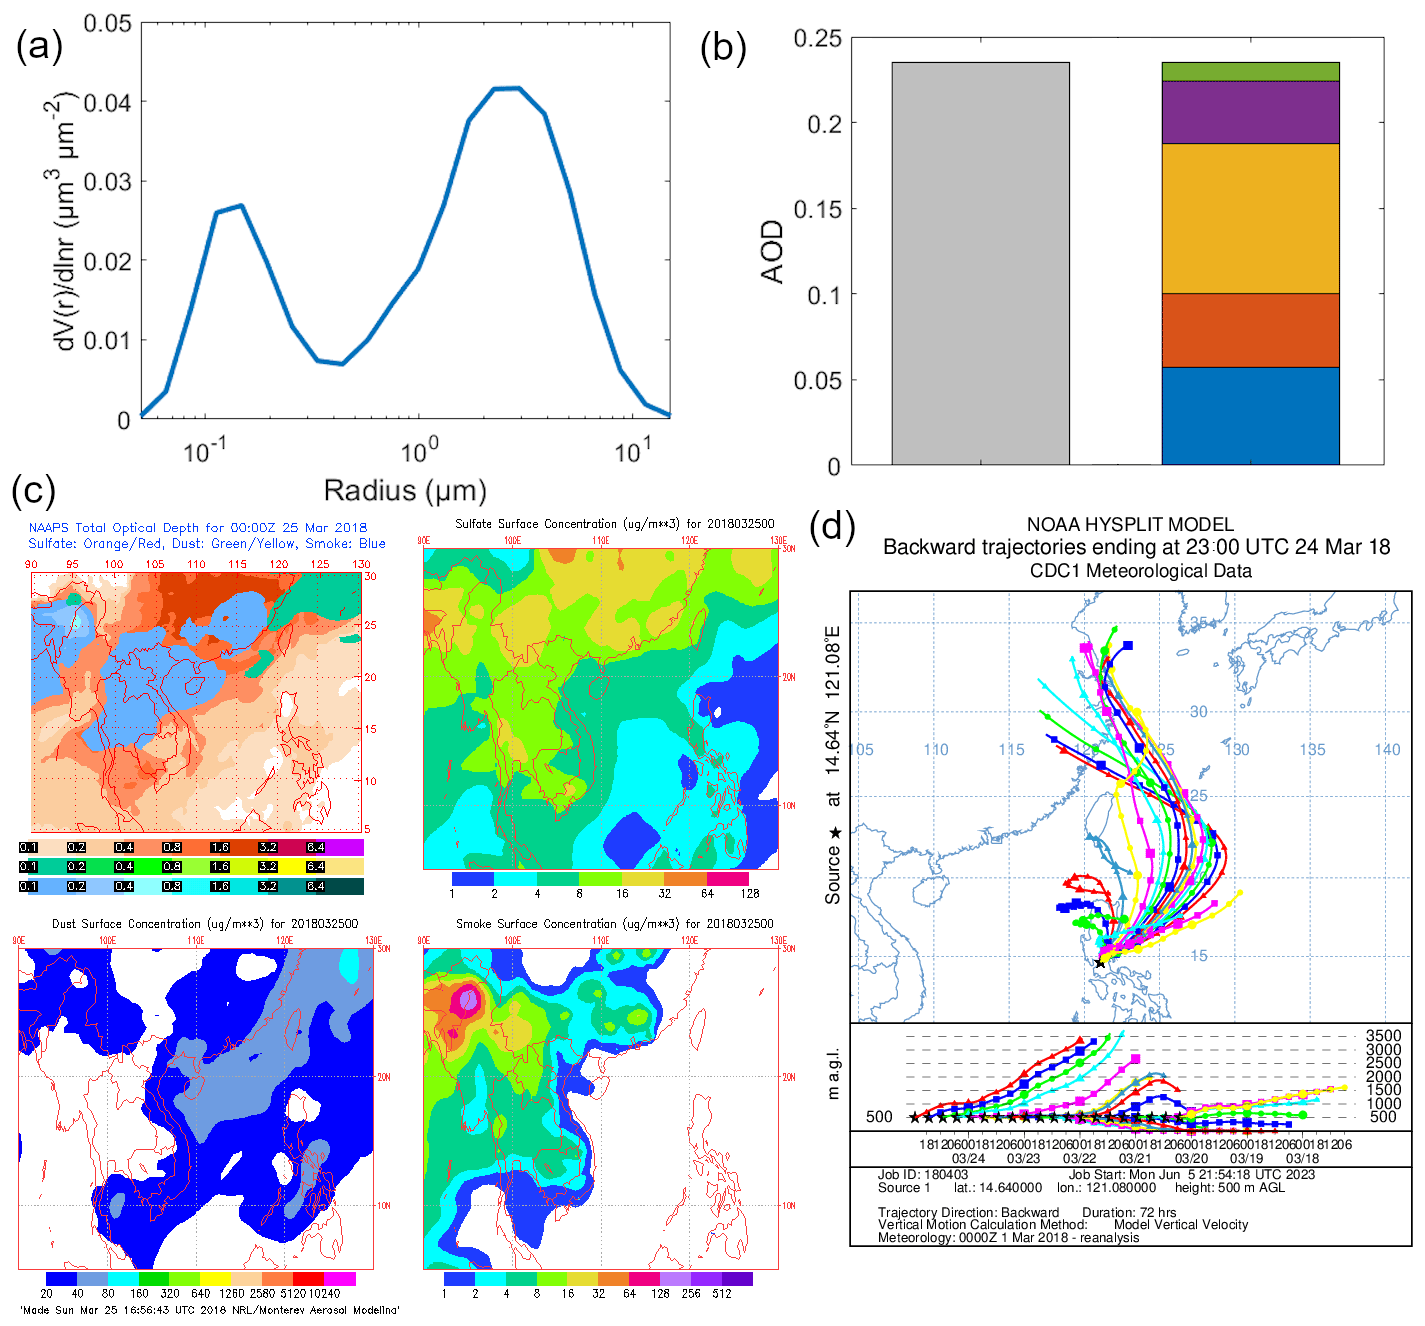
Figure 10Case study of long-range transport (dust) around 24–25 March 2018. (a) AERONET VSD at (blue) 23:23 UTC, (b) AOD from AERONET (gray: AOD at 500 nm) and MERRA-2 hourly (green: black carbon; violet: dust; yellow: sea salt; orange: organic carbon; blue: sulfate) compositional contributions to AOD (550 nm) closest in time to 23:23 UTC, (c) NAAPS maps of total and compositional hourly AOD and sulfate, dust, and smoke surface concentrations at 00:00 UTC on 25 March (orange and red: sulfate; green and yellow: dust; blue: smoke), and (d) HYSPLIT 7 d back trajectories arriving at Manila Observatory at 23:00 UTC.
3.4.1 Long-range transport of smoke
Both cases of long-range transport of smoke discussed below have similar VSDs (Figs. 8a and 9a) to the urban and industrial cluster VSD (cluster 4, Fig. 6a). Organic carbon was the dominant contributor to AOD (Figs. 8b and 9b) for both long-range transport cases. The first of two events occurred around 1 April 2020 with smoke presumed to come from East Asia. The VSD of this specific case (Fig. 8a) is most like the urban and industrial cluster (cluster 4 in 3.3.2, Fig. 6a) because of the high magnitude of its accumulated mode peak, its timing (April), and the enhanced organic carbon contribution to AOD in the area (Fig. 8b). Though the absolute black carbon contribution to AOD was highest here compared to the other case studies, and in general for the AERONET data, it was organic carbon that was more prevalent in terms of contribution to total AOD. Smoke is comprised of both soot carbon and organic carbon, among other constituents (Reid et al., 2005).
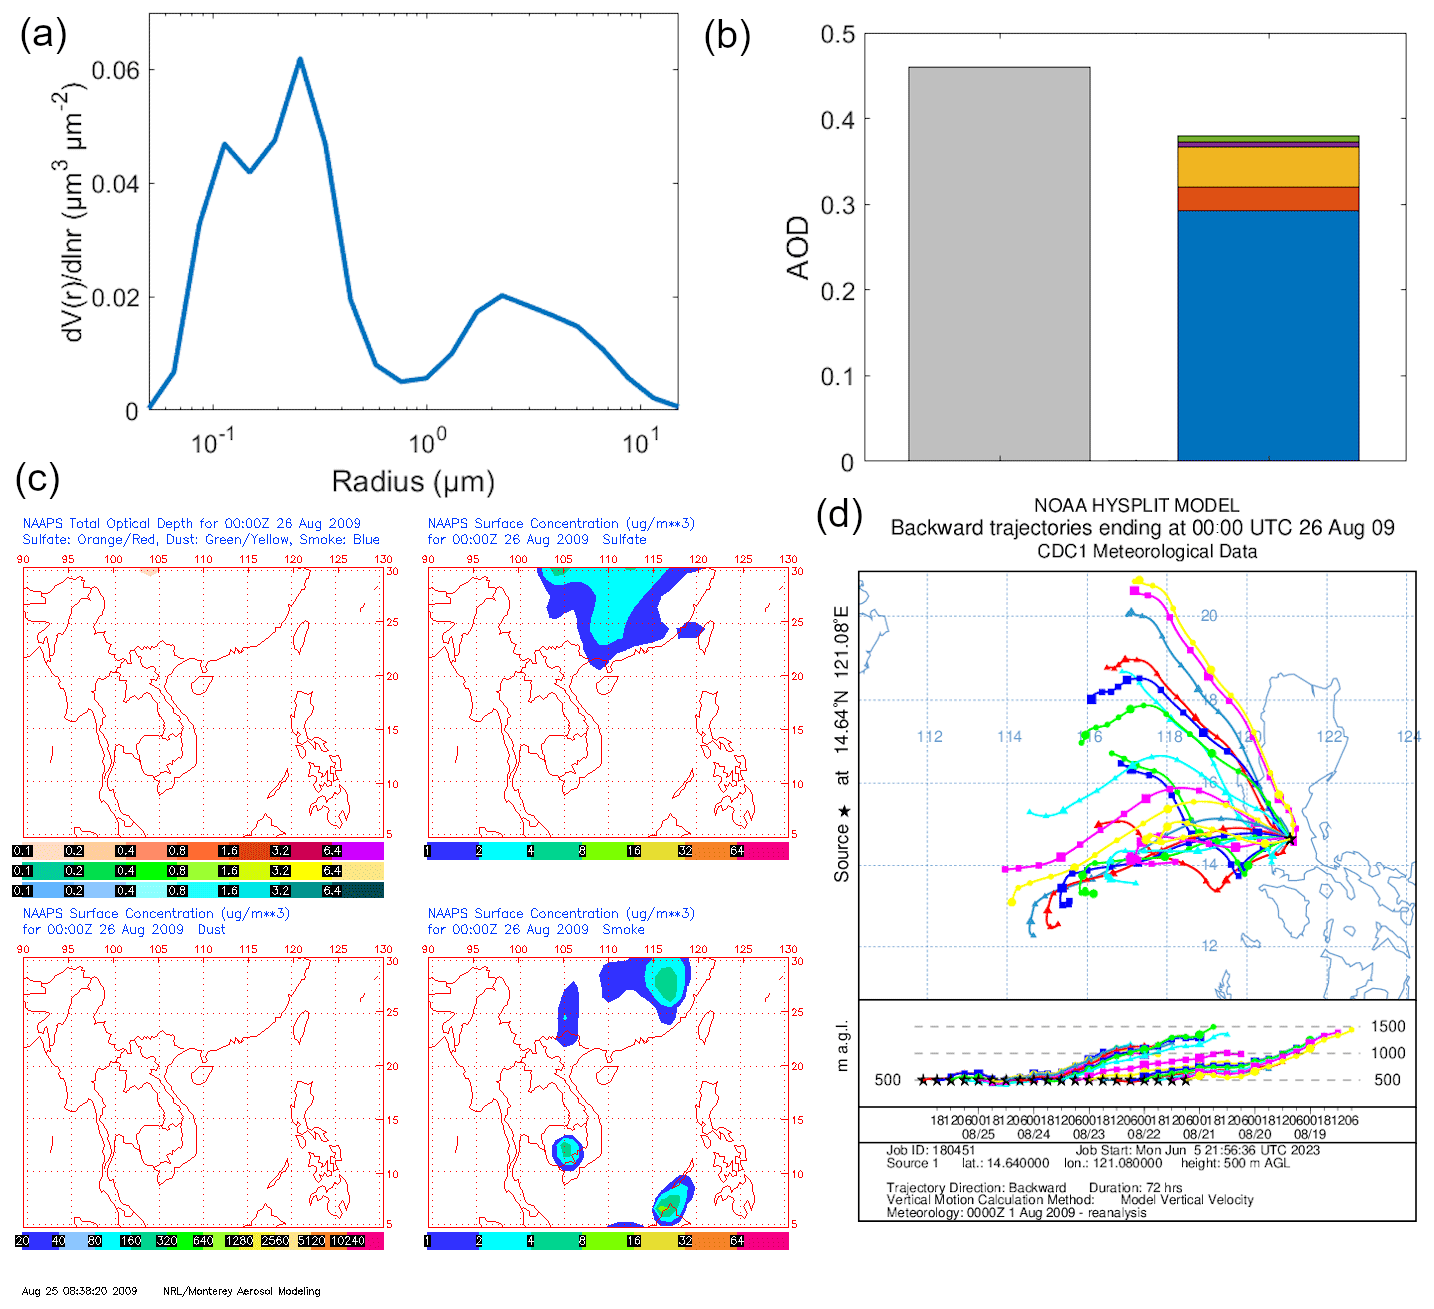
Figure 11Case study of cloud processing on 26 August 2009. (a) AERONET VSDs at 00:18 UTC, (b) AOD from AERONET (gray: median AOD at 500 nm) and MERRA-2 hourly (green: black carbon; violet: dust; yellow: sea salt; orange: organic carbon; blue: sulfate) compositional contributions to AOD (550 nm) closest in time to 00:18 UTC, (c) NAAPS maps of total and compositional hourly AOD and contributions and smoke surface concentrations at 00:00 UTC, and (d) HYSPLIT 7 d back trajectories arriving at Manila Observatory at 00:00 UTC.
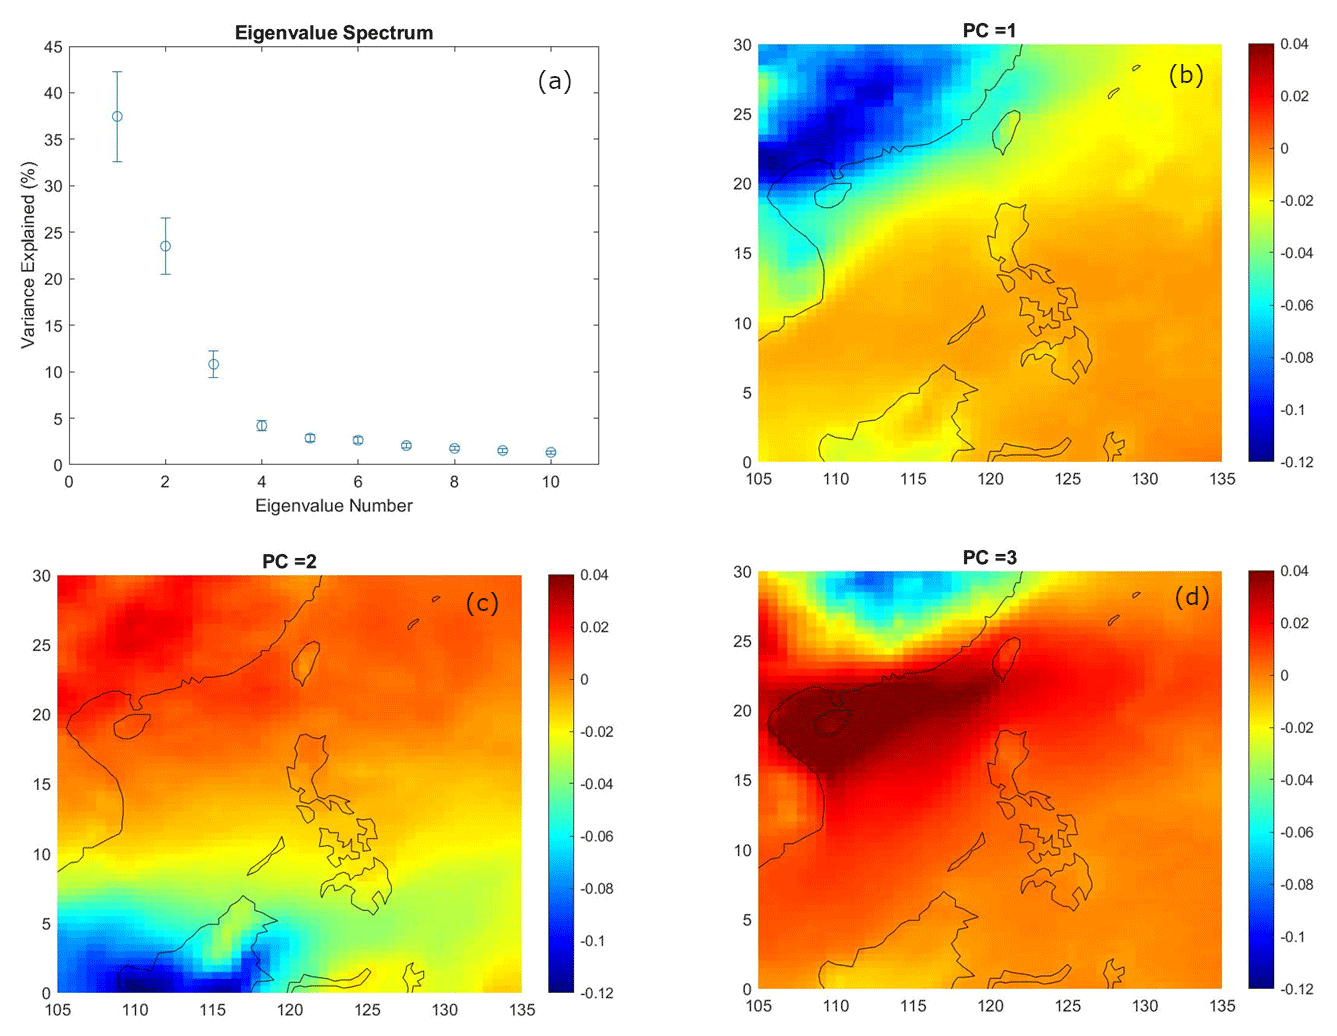
Figure 12Results of the singular value decomposition. (a) Eigenvalue spectrum of the first 10 eigenvalues. (b–d) Maps of the coefficients of regression AOD anomalies onto the first three principal components.
The smoke contribution to AOD from NAAPS (Fig. 8c) for the first smoke case was visible in the Philippines (0.2) and seemed to come from East Asia where the smoke contribution to AOD was greater (reaching 0.8) (especially in peninsular Southeast Asia). Smoke surface concentrations were also widespread (Fig. 8c), with the greatest concentrations that reached the western Philippines coming from East Asia despite being seemingly disconnected over the sea. There were observed biomass burning emissions in the peninsular Southeast Asia region (southern China, Burma, and Thailand) at this time (Shen et al., 2014). The direction of the air mass coming into Metro Manila was from the northeast, which curved from the west in the direction of East Asia based on HYSPLIT back trajectories (Fig. 8d).
The second smoke case was on 15 September 2009, with the source being Southeast Asia. The back trajectories of this case study (Fig. 9d) are from the southwest of the Philippines and in the direction of Malaysia and Indonesia. NAAPS maps likewise show elevated AOD, specifically smoke contribution to AOD (Fig. 9c), as well as enhanced smoke surface contributions in the area around Metro Manila for this second smoke case study. The observed AOD and smoke surface concentration increased specifically from the southwest of the Philippines in the same direction of the back trajectories. There were fires in the lowland (peat) forests of Borneo around this time (NASA, 2009). MERRA-2 AOD contributions for this case were greatest due to organic carbon and sulfate (Fig. 9b), and the absolute black carbon contributions were greatest compared to other cases. The VSD of this smoke case from Southeast Asia (Fig. 9a) resembled that from long-range transported smoke from East Asia (Fig. 8a) and the urban and industrial air mass (cluster 4, Fig. 6a). This case occurred in the afternoon, which was the prevalent time that the urban and industrial air mass was observed (Fig. 6c).
3.4.2 Long-range transport of dust
The VSD of this specific case on 24 March 2018 (Fig. 10a) was most similar to the mixed dust cluster (cluster 3), which had a mixed size distribution but a more dominant coarse contribution. This is consistent with the most dominant contribution to AOD in the area, which was sea salt and dust (Fig. 10b). The back trajectories were from East Asia around the same latitude as Taiwan (Fig. 10d). At that time, the area in question had increased AOD in general from sulfate and dust (Fig. 10c). The AOD values from both AERONET and MERRA-2 (Fig. 10b) are lower than 0.3 (the AOD threshold for dust in other studies, Table 2) because of the long distance from the source (thousands of kilometers). The dust and sulfate seemed to have been transported to Metro Manila from East Asia based on the NAAPS sulfate and dust surface concentrations (Fig. 10c).
3.4.3 Cloud processing
Sulfate dominated the AOD (Fig. 11b) for this case on 26 August 2009 in the area around Metro Manila. This along with its VSD exhibiting a second peak (Fig. 11a) in the accumulation mode make it very similar to the cloud processing cluster (cluster 5). Sulfate has been known to be enhanced through chemical productions in clouds and is used as a signature for cloud processing (Barth et al., 2000; Ervens et al., 2018). Aqueous production of sulfate is significant in areas with sources and clouds (Barth et al., 2000), and this case study has both. Aside from the high sulfate contribution to AOD, the cloud fraction (Aqua/MODIS, Terra/MODIS, Fig. S3) is very high (∼ 100 %) in the area of the back trajectories (Fig. 11d). Interestingly, there is no regional AOD elevation observed in the NAAPS maps (Fig. 11c) for this time. There are increased surface smoke and sulfate levels in East Asia as well as southwest of the Philippines, and though the back trajectories do show a northeastward direction, they do not reach far enough into mainland East Asia. It is possible that even while there are known regional sources of sulfate in Southeast Asia (Smith et al., 2011; Li et al., 2017), this case could be local to the Philippines. There is in fact a large power plant northwest of Metro Manila (Jamora et al., 2020).
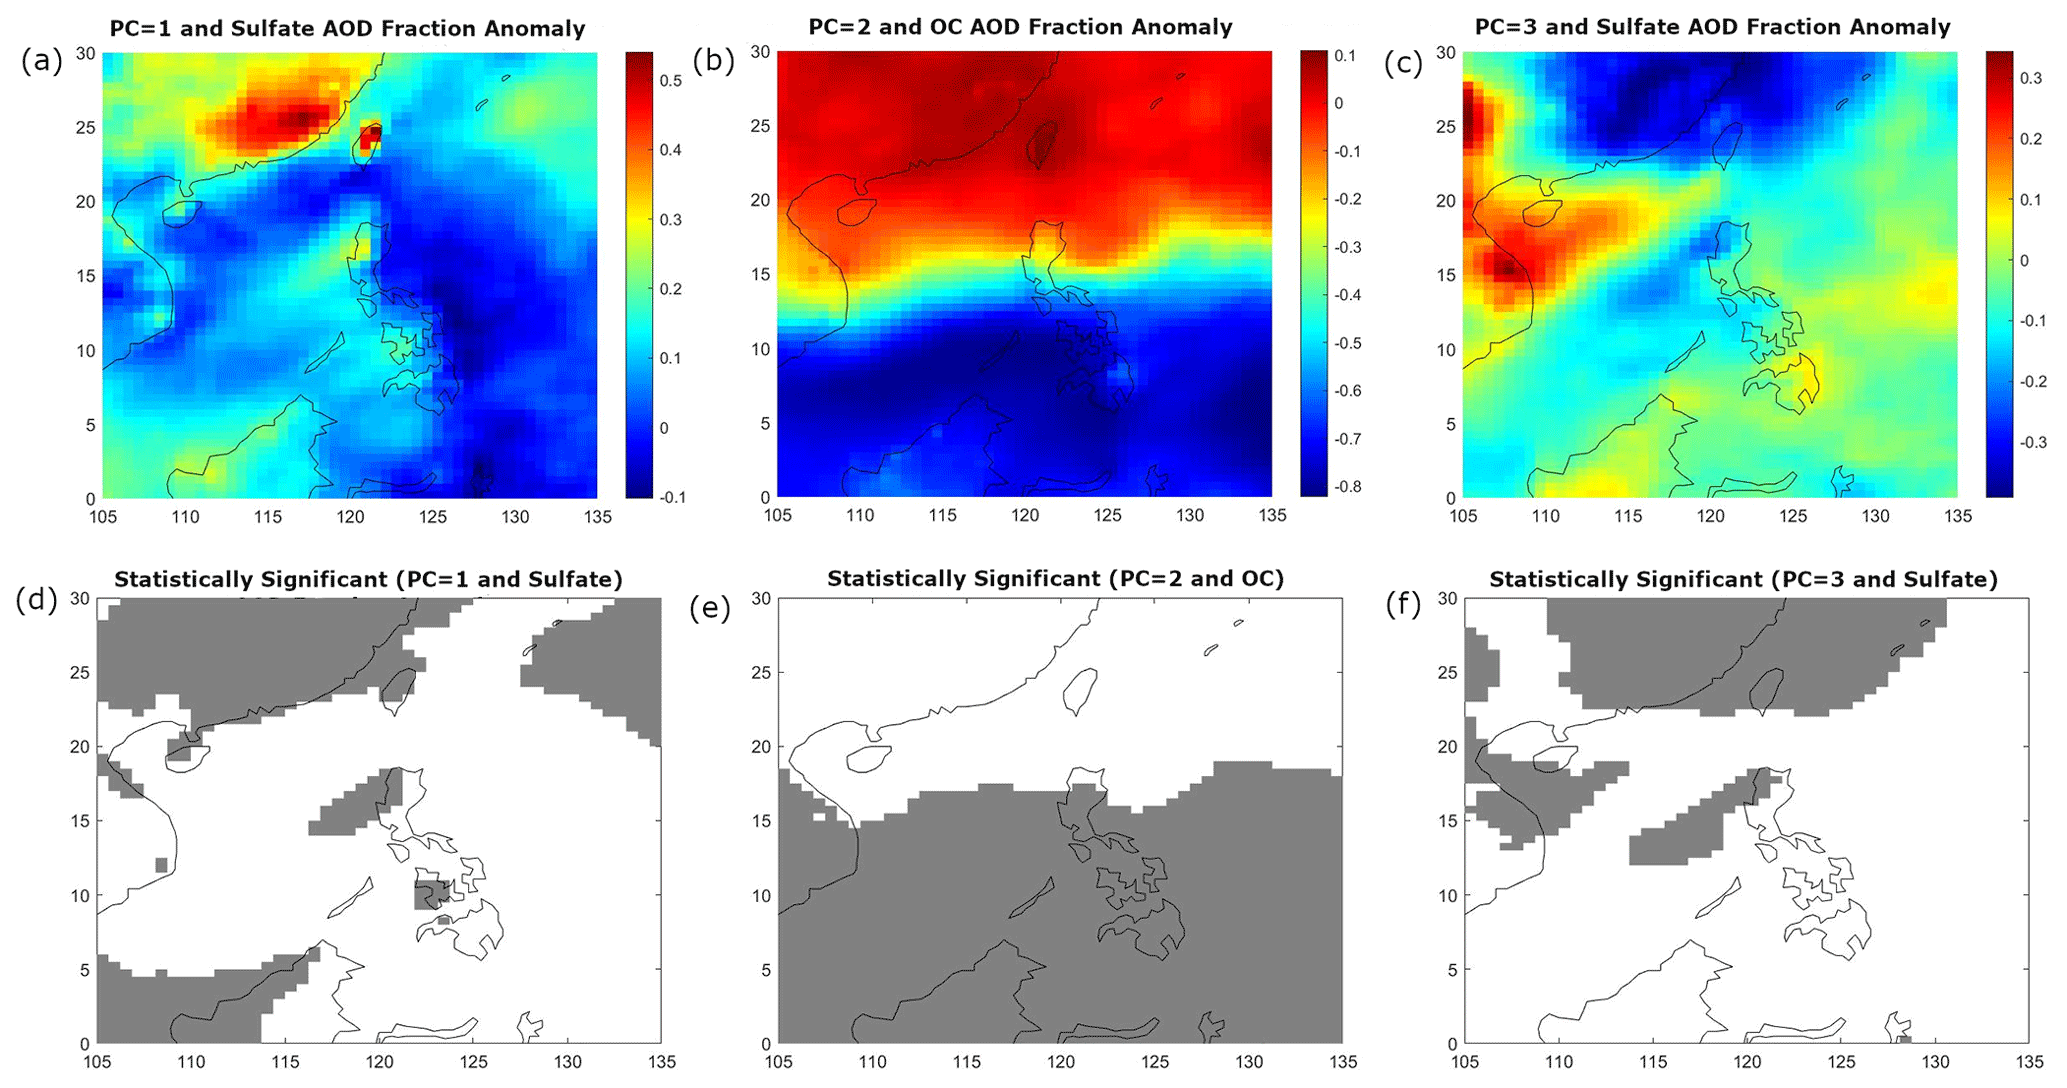
Figure 13Correlation coefficients of principal components with (a, c) sulfate AOD fraction and (b) organic carbon AOD fraction. Statistically significant (90 %, d–f) areas are shaded gray.
3.5 EOF analysis of AOD in Southeast Asia
The air masses in Metro Manila are influenced by regional sources that were identified through EOF analysis of AOD. Three principal components (PC, Fig. 12) explained most of the data variance (73.77 %) (Fig. 12a) and were all well separated from each other and are therefore most probably the major distinct aerosol particle sources in the region. They will be the focus of the subsequent discussion.
The first PC explains 37.46 % of the data variance (Fig. 12a) and, based on the map of the regression coefficients (Fig. 12b), separates mainland East Asia from the Philippines and Indonesia. East Asia is a globally recognized source of high AOD (Li et al., 2013), and its contribution to particles in Southeast Asia possibly corresponds to the first PC. The second PC explains 25.51 % of the data variance (Fig. 12a) and separates southern Southeast Asia from northern Southeast Asia at around 15∘ N (Fig. 12c). Southern Southeast Asia is a known regional source of aerosol particles due to biomass burning (Cohen et al., 2017) and could be associated with the second PC. The third PC explains 10.80 % of the data variance (Fig. 12a) and separates northern East Asia from the southern East Asia mainland and the rest of Southeast Asia (Fig. 12d).
To gain confidence in the association of the PCs with their sources, we present correlation maps between the first three PCs to the fractional contributions of sulfate and organic carbon to AOD for the entire dataset.
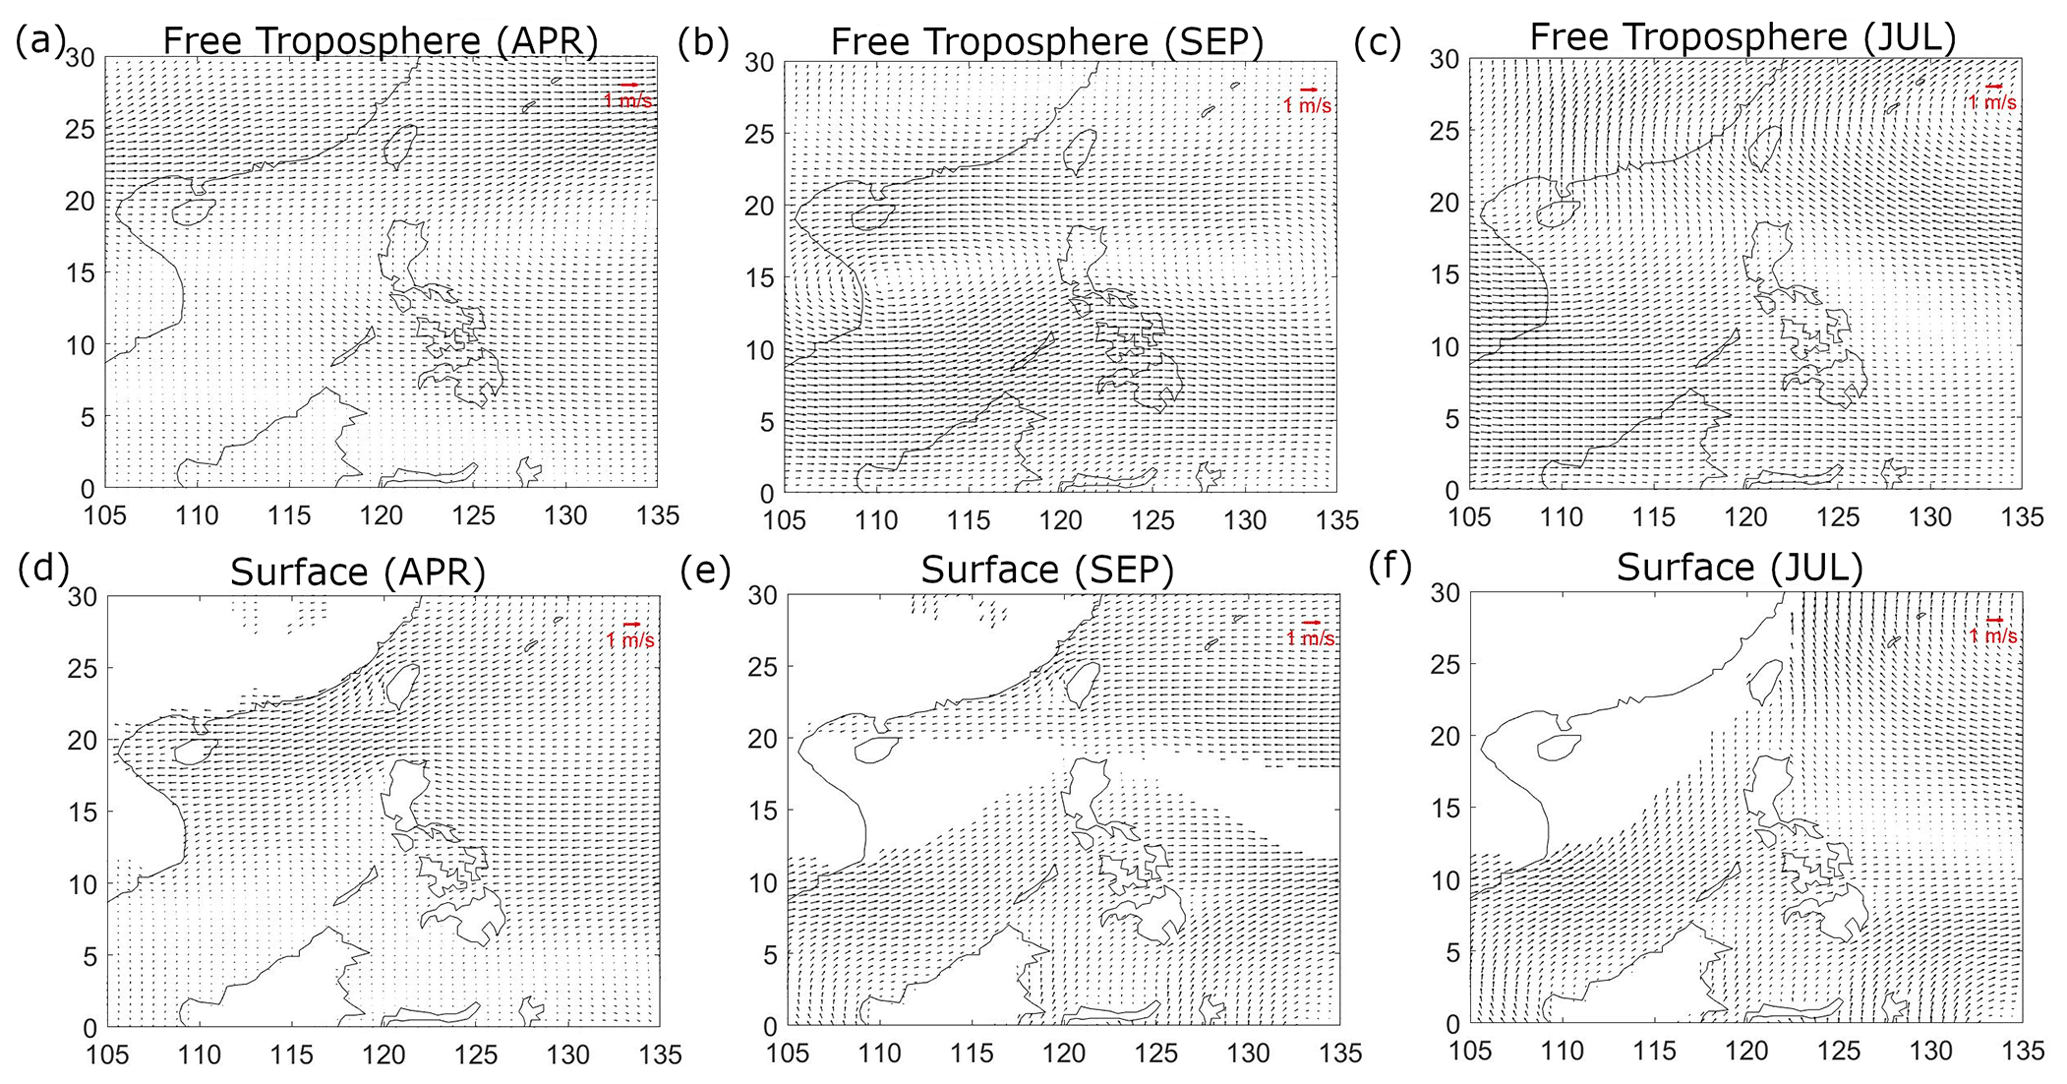
Figure 14Monthly averaged winds for (a, d) April, (b, e) September, and (c, f) July from MERRA-2 at approximately the free troposphere (725 hPa, a–c) and at the surface (1000 hPa, d–f).
The correlation maps of the first PC and the sulfate contribution to AOD (Fig. 13a and d) show high and statistically significant correlations (gray areas) in mainland East Asia and Taiwan, parts of the western Philippines, and Borneo, which are the probable sulfate sources. Clues from the mean monthly wind vector maps in April (Fig. 14a and d) and mean monthly AOD in either March or April (Fig. S4c or e) most resembling the features of regression map of the first PC (Fig. 12b) and the PC time series peaking in March (Fig. S5) together suggest that the first PC may be associated with air masses that are present around March or April. Emissions sources and meteorology that are dominant during the peak dates in the PC time series offer clues to the attribution of each PC. The Southeast Asia region and the Philippines are influenced by the monsoon systems (Coronas, 1920; Matsumoto et al., 2020), and February to March is the time when the winds are transitioning from the northeasterly to easterly direction. The first PC could be affected by the easterly winds, which are dominant around March when its PC values peaked. The higher-level winds (free troposphere) (Fig. 14a) in April are from the west in mainland East Asia and from the east in the Philippines, and it is possible that the different wind regimes are distinguishing the sulfate sources in East Asia, the Philippines, and beyond. Sulfate is a known product of industry in East Asia (Smith et al., 2011; Li et al., 2017), while western Luzon and the Western Visayas region have large power plants (Jamora et al., 2020).
The correlation maps of the second PC and the OC contribution to AOD (Fig. 13b and e) show high and statistically significant correlations from 0 to 15∘ N. The large magnitude of the correlation coefficient (gray areas in Fig. 13b) stand out in southern Southeast Asia and are the potential OC source. In this case, it is known that Indonesia is a major source of biomass burning during its fire season (Glover and Jessup, 1998), and thus the local significance established in the southern Southeast Asia is most likely due to the Indonesian biomass burning source. The burning season in Indonesia is from August to October, which is the same time when the AOD values peak in the area (Fig. S4h, i, and j) and the peak of the second PC in the time series (Fig. S5). Winds are usually from the southwest and west due to the southwest monsoon from September to October, when the second PC peaked, and thus the second PC may be related to the southwest monsoon. During the same time, the surface and free troposphere mean monthly winds (Fig. 14b and e) are from the southwest (in the general direction of Indonesia) towards the southern portion of Southeast Asia and thus corroborate the observation that the second PC may be highlighting the regional effect of the Indonesian forest fires. Of interest is the line of separation of the northern and southern Southeast Asia in the principal component that is within the area of the monsoon trough (Wang et al., 2007). This line is also evident in the surface and the free troposphere maps where the southwest winds from the area of Indonesia meet the easterlies in northern Southeast Asia (Fig. 14b and e) and which thus appears to be limiting the dispersion of the biomass burning emissions to southern Southeast Asia.
However, the third PC was also well correlated to the sulfate AOD fraction, and compared to the first PC correlation maps, there were distinctions between the northern and southern East Asia regions (Fig. 13c and f). The local Philippine source still came out in the correlation maps as a significant source. It was not clear from the PC time series (Fig. S5), which showed peaks in the third PC in February, how the dates were related to the PC profile. The free troposphere winds in July (Fig. 14c), as well as the AOD monthly mean map in July (Fig. 14c), however, showed more similarities to the third PC regression map. Both showed a delineation between northern East Asia and southern East Asia (including Hong Kong) features. Mean winds (Fig. 14c) in the free troposphere are from the west, due to the southwest monsoon, in the area around the Philippines, and they were from the northeast in northern Southeast Asia. The interface of the winds is within the approximate location of the monsoon trough in July (Wang et al., 2007), and it is thus possible that the monsoon trough is causing the separation of the sulfate sources. This could be investigated further. The monsoon trough has been noted to scavenge aerosol particles from southern Southeast Asia (Reid et al., 2013). It is evident from the analysis that meteorology affects the transport and processing of aerosol particles in the region that (along with local sources) contribute to the aerosol composition in Southeast Asia (Cruz et al., 2019; AzadiAghdam et al., 2019; Braun et al., 2020; Hilario et al., 2020b, 2022).
Metro Manila has both urban and industrial local sources known to contribute to the dominance of fine-mode particles in its air (Cruz et al., 2019). A total of 10 years of AERONET data in Manila Observatory suggest that aerosol particles over Metro Manila were mixed in size but with a prevalent fine-mode fraction (> 50 % FMF) throughout the year. Background clean marine aerosol particles (58 % of the time) and fine polluted aerosol particles (20 % of the time) were the most dominant clear-sky day sources impacting the atmospheric column over Metro Manila based on cluster analysis of volume size distributions. The proximity of Metro Manila to the sea, both in the east and west, along with local sources, with transportation being the most prominent, together contribute to the prevalence of the marine and fine particles. The prevalence of marine particles could explain the relatively small AOD values in Metro Manila compared to other Southeast Asian megacities (Reid et al., 2013).
Regional sources and meteorology also impact monthly aerosol optical depth trends in Metro Manila from EOF analysis. Biomass burning from Borneo and Sumatra emerged in the study as the second most prevalent regional anthropogenic aerosol particle source in Southeast Asia. Though the monsoon trough limits the dispersion of aerosol particles throughout the entirety of Southeast Asia, biomass burning emissions impact southern Southeast Asia, including Metro Manila, during the southwest monsoon (July to September). The monsoon winds facilitate the transport of fine particles during the peak burning season in Borneo and Sumatra (August–September). This is experienced in Metro Manila as higher than usual aerosol particle loadings around the same period (August to October). Climatologically, August was also when there were particles with the greatest fine-mode fractions that were relatively absorbing and non-hygroscopic, possibly due to increased organic and elemental carbon fractional contributions. Though not as strong a source as the Borneo and Sumatra case, the peninsular Southeast Asia burning season (March–April) also contributed to extreme aerosol particle concentrations over Metro Manila.
High aerosol particle loadings due to transported dust, probably from East Asia, were observed in Metro Manila during the transition period between the southwest and northeast monsoons and during the northeast monsoon (December to February). These extreme events are transient because the lowest median aerosol particle loadings of the year were observed during the northeast monsoon when annual wind speeds were highest. Particles were then observed to be larger in diameter, with the greatest coarse fraction contribution, relatively high absorptivity, and most hygroscopicity, compared to other months of the year. This is probably due to constituents other than soot, especially aged dust (Kim and Park, 2012; Geng et al., 2014) and sea salt, which the northeast winds appear to be bringing in from the general direction of Luzon and the Philippine Sea (western Pacific Ocean).
Cloud processing is one of the cases that was linked to very high aerosol particle loading over Metro Manila. This is associated with sulfate sources, which appear more localized in nature because of a power plant nearby. This sulfate source seems to be distinct from the industrial sulfate air mass from East Asia, which is the most dominant regional aerosol particle source in Southeast Asia (Li et al., 2013). Winds appear to limit the mixing of this notable East Asia air mass with local industrial sources in the region, including those from the Philippines and Indonesia.
The formation of cloud systems in Southeast Asia is complex due to intersecting large- and small-scale mechanisms. Additionally, the interaction of particles and clouds in Southeast Asia is not yet well understood. In Metro Manila, both topography and meteorology affect aerosol particle distribution (Cruz et al., 2023). This baseline study on the aerosol particle characteristics in Metro Manila and in regional Southeast Asia shows how meteorology impacts varied aerosol particle sources (e.g., sulfate, elemental carbon, and organic carbon) and their distribution in the region. This can help in mitigating aerosol particle sources in the region and in the deepening of the understanding of the relationship of aerosol particles, meteorology, and clouds.
The AERONET direct sun products can be downloaded at https://aeronet.gsfc.nasa.gov/cgi-bin/webtool_aod_v3?stage=3®ion=Asia&state=Philippines&site=Manila_Observatory&place_code=10&if_polarized=0 (Aerosol Robotic Network, 2020a) and the AERONET inversion products can be downloaded at https://aeronet.gsfc.nasa.gov/cgi-bin/webtool_inv_v3?stage=3®ion=Asia&state=Philippines&site=Manila_Observatory&place_code=10&if_polarized=0 (Aerosol Robotic Network, 2020b). The MERRA-2 data can be downloaded at https://doi.org/10.5067/QBZ6MG944HW0 for 3-hourly assimilated meteorological fields (Global Modeling and Assimilation Office, 2015a); https://doi.org/10.5067/7MCPBJ41Y0K6 for 1-hourly planetary boundary layer height (Global Modeling and Assimilation Office, 2015b); https://doi.org/10.5067/H0VVAD8F6MX5 for 1-hourly MODIS mean low-cloud (Global Modeling and Assimilation Office, 2015c); https://doi.org/10.5067/KLICLTZ8EM9D for 1-hourly total and speciated AOD (Global Modeling and Assimilation Office, 2015d); https://doi.org/10.5067/FH9A0MLJPC7N for monthly total and speciated AOD (Global Modeling and Assimilation Office, 2015e); and https://doi.org/10.5067/V92O8XZ30XBI for monthly 1000 and 725 hPa level U and V winds (Global Modeling and Assimilation Office, 2015f). The hourly precipitation data from PERSIANN can be downloaded at https://chrsdata.eng.uci.edu/ (Nguyen et al., 2019a). The monthly AOD data from MISR can be downloaded at https://search.earthdata.nasa.gov/search/granules?p=C108919889-LARC!C108919889-LARC&pg[1][v]=t&pg[1][m]=download&q=MIsr aerosol&qt=2009-01-01T00:00:00.000Z,2018-12-31T23:59:59.999Z&tl=1637172199!3!!&lat=-0.3515625&long=0.5625 (EarthData, 2018). The back trajectories were generated using https://www.ready.noaa.gov/hypub-bin/trajasrc.pl (NOAA Air Resources Laboratory, 2023; Stein et al., 2015; Rolph et al., 2017). The maps of NAAPS AOD can be downloaded at https://www.nrlmry.navy.mil/aerosol-bin/aerosol/display_directory_all_t.cgi?DIR=/web/aerosol/public_html/globaer/ops_01/seasia/ (Naval Research Laboratory, 2023). The maps of AQUA MODIS cloud fraction can be downloaded at https://worldview.earthdata.nasa.gov/?v=81.96916046398741,-7.786202652672809,164.2413616596497,31.54304140352593&l=Coastlines_15m,MODIS_Aqua_Cloud_Fraction_Night&lg=true&t=2019-08-24-T16:29:32Z (NASA, 2023a) and https://worldview.earthdata.nasa.gov/?v=81.96916046398741,-7.786202652672809,164.2413616596497,31.54304140352593&l=Coastlines_15m,MODIS_Aqua_Cloud_Fraction_Night&lg=true&t=2019-08-25-T16:29:32Z (NASA, 2023b). The maps of TERRA MODIS cloud fraction can be downloaded at https://worldview.earthdata.nasa.gov/?v=81.96916046398741,-7.786202652672809,164.2413616596497,31.54304140352593&l=Coastlines_15m,MODIS_Terra_Cloud_Fraction_Night&lg=true&t=2019-08-24-T16:29:32Z (NASA, 2023c) and https://worldview.earthdata.nasa.gov/?v=81.96916046398741,-7.786202652672809,164.2413616596497,31.54304140352593&l=Coastlines_15m,MODIS_Terra_Cloud_Fraction_Night&lg=true&t=2019-08-25-T16:29:32Z (NASA, 2023d). The density plots of back trajectories were generated using “geodensityplot” from the Mapping Toolbox in MATLAB (The MathWorks Inc., 2022). The “kmeans” function from the Statistics and Machine Learning Toolbox and the built-in “svd” function in MATLAB (The Mathworks, 2020) were used for the clustering and EOF analysis.
The supplement related to this article is available online at: https://doi.org/10.5194/acp-23-10579-2023-supplement.
GRL and AS designed the experiment. NL, SNU, GRL, GFG, HJO, JBS, and MTC, carried out various aspects of the data collection. GRL, AS, JBS, MOC, MRH, CC, and LDG conducted analysis and interpretation of the data. GRL prepared the manuscript draft with contributions from the coauthors. AFA, LDG, MRH, GRL, and AS reviewed and edited the manuscript. AS led the management and funding acquisition. All authors approved the final version of the manuscript.
At least one of the (co-)authors is a member of the editorial board of Atmospheric Chemistry and Physics. The peer-review process was guided by an independent editor, and the authors also have no other competing interests to declare.
Publisher's note: Copernicus Publications remains neutral with regard to jurisdictional claims in published maps and institutional affiliations.
We acknowledge the US Naval Research Laboratory for providing the AERONET instrument. We acknowledge the use of imagery from the NASA Worldview application (https://worldview.earthdata.nasa.gov, last access: 17 January 2023), part of the NASA Earth Observing System Data and Information System (EOSDIS). We gratefully acknowledge the NOAA Air Resources Laboratory (ARL) for the provision of the HYSPLIT transport and dispersion model and READY website (https://www.ready.noaa.gov, last access: 5 June 2023) used in this publication.
This research has been supported by the National Aeronautics and Space Administration (grant no. 80NSSC18K0148) in support of the NASA CAMP2Ex project and an ONR grant (grant no. N00014-21-1-2115).
This paper was edited by Kostas Tsigaridis and reviewed by two anonymous referees.
Aerosol Robotic Network (AERONET): Version 3 Direct Sun Algorithm, Site: Manila Observatory, Philippines [data set], https://aeronet.gsfc.nasa.gov/cgi-bin/webtool_aod_v3?stage=3®ion=Asia&state=Philippines&site=Manila_Observatory&place_code=10&if_polarized=0 (last access: 28 September 2020), 2020a.
Aerosol Robotic Network (AERONET): Version 3 Direct Sun and Inversion Algorithm, Site: Manila Observatory, Philippines [data set], https://aeronet.gsfc.nasa.gov/cgi-bin/webtool_inv_v3?stage=3®ion=Asia&state=Philippines&site=Manila_Observatory&place_code=10&if_polarized=0 (last access: 28 September 2020), 2020b.
Alas, H. D., Müller, T., Birmili, W., Kecorius, S., Cambaliza, M. O., Simpas, J. B. B., Cayetano, M., Weinhold, K., Vallar, E., and Galvez, M. C.: Spatial characterization of black carbon mass concentration in the atmosphere of a southeast asian megacity: an air quality case study for Metro Manila, Philippines, Aerosol Air Qual. Res., 18, 2301–2317, https://doi.org/10.4209/aaqr.2017.08.0281, 2018.
Aldhaif, A. M., Lopez, D. H., Dadashazar, H., and Sorooshian, A.: Sources, frequency, and chemical nature of dust events impacting the United States East Coast, Atmos. Environ., 231, 117456, https://doi.org/10.1016/j.atmosenv.2020.117456, 2020.
Aldhaif, A. M., Lopez, D. H., Dadashazar, H., Painemal, D., Peters, A. J., and Sorooshian, A.: An Aerosol Climatology and Implications for Clouds at a Remote Marine Site: Case Study Over Bermuda, J. Geophys. Res.-Atmos., 126, e2020JD034038, https://doi.org/10.1029/2020JD034038, 2021.
Alizadeh-Choobari, O., and Gharaylou, M.: Aerosol impacts on radiative and microphysical properties of clouds and precipitation formation, Atmos. Res., 185, 53–64, https://doi.org/10.1016/j.atmosres.2016.10.021, 2017.
Amnuaylojaroen, T.: Air Pollution Modeling in Southeast Asia – An Overview, Vegetation Fires and Pollution in Asia, 531–544, https://doi.org/10.1007/978-3-031-29916-2_31, 2023.
Ångström, A.: On the atmospheric transmission of sun radiation and on dust in the air, Geogr. Ann., 11, 156–166, 1929.
Arthur, D. and Vassilvitskii, S.: k-means: The advantages of careful seeding, Stanford, in: Proceedings of the eighteenth annual ACM-SIAM symposium on Discrete algorithms, Louisiana, USA, 7–9 January 2007, 1027-1035, 2007.
AzadiAghdam, M., Braun, R. A., Edwards, E.-L., Bañaga, P. A., Cruz, M. T., Betito, G., Cambaliza, M. O., Dadashazar, H., Lorenzo, G. R., and Ma, L.: On the nature of sea salt aerosol at a coastal megacity: Insights from Manila, Philippines in Southeast Asia, Atmos. Environ., 216, 116922, https://doi.org/10.1016/j.atmosenv.2019.116922, 2019.
Bagtasa, G.: Contribution of tropical cyclones to rainfall in the Philippines, J. Climate, 30, 3621–3633, https://doi.org/10.1175/JCLI-D-16-0150.1, 2017.
Bañares, E. N., Narisma, G. T. T., Simpas, J. B. B., Cruz, F. A. T., Lorenzo, G. R. H., Cambaliza, M. O. L., and Coronel, R. C.: Seasonal and diurnal variations of observed convective rain events in metro Manila, Philippines, Atmos. Res., 258, 105646, https://doi.org/10.1016/j.atmosres.2021.105646, 2021.
Barth, M., Rasch, P., Kiehl, J., Benkovitz, C., and Schwartz, S.: Sulfur chemistry in the National Center for Atmospheric Research Community Climate Model: Description, evaluation, features, and sensitivity to aqueous chemistry, J. Geophys. Res.-Atmos., 105, 1387–1415, https://doi.org/10.1029/1999JD900773, 2000.
Bautista VII, A. T., Pabroa, P. C. B., Santos, F. L., Racho, J. M. D., and Quirit, L. L.: Carbonaceous particulate matter characterization in an urban and a rural site in the Philippines, Atmos. Pollut. Res., 5, 245–252, https://doi.org/10.5094/APR.2014.030, 2014.
Bergstrom, R. W., Russell, P. B., and Hignett, P.: Wavelength dependence of the absorption of black carbon particles: Predictions and results from the TARFOX experiment and implications for the aerosol single scattering albedo, J. Atmos. Sci., 59, 567–577, https://doi.org/10.1175/1520-0469(2002)059<0567:WDOTAO>2.0.CO;2, 2002.
Bergstrom, R. W., Pilewskie, P., Schmid, B., and Russell, P. B.: Estimates of the spectral aerosol single scattering albedo and aerosol radiative effects during SAFARI 2000, J. Geophys. Res.-Atmos., 108, 8474, https://doi.org/10.1029/2002JD002435, 2003.
Bergstrom, R. W., Pilewskie, P., Russell, P. B., Redemann, J., Bond, T. C., Quinn, P. K., and Sierau, B.: Spectral absorption properties of atmospheric aerosols, Atmos. Chem. Phys., 7, 5937–5943, https://doi.org/10.5194/acp-7-5937-2007, 2007.
Bi, J., Huang, J., Hu, Z., Holben, B., and Guo, Z.: Investigating the aerosol optical and radiative characteristics of heavy haze episodes in Beijing during January of 2013, J. Geophys. Res.-Atmos., 119, 9884–9900, https://doi.org/10.1002/2014JD021757, 2014.
Björnsson, H. and Venegas, S.: A manual for EOF and SVD analyses of climatic data, CCGCR Report, 97, 112–134, 1997.
Bohren, C. F. and Clothiaux, E. E.: Fundamentals of atmospheric radiation: an introduction with 400 problems, John Wiley & Sons, ISBN 978-3-527-40503-9, 490 pp., 2006.
Bosilovich, M. G., Lucchesi, R., and Suarez, M., MERRA-2: File Specification, NASA GSFC, 73 pp., 2016.
Braun, R. A., Aghdam, M. A., Bañaga, P. A., Betito, G., Cambaliza, M. O., Cruz, M. T., Lorenzo, G. R., MacDonald, A. B., Simpas, J. B., Stahl, C., and Sorooshian, A.: Long-range aerosol transport and impacts on size-resolved aerosol composition in Metro Manila, Philippines, Atmos. Chem. Phys., 20, 2387–2405, https://doi.org/10.5194/acp-20-2387-2020, 2020.
Buchard, V., Randles, C., Da Silva, A., Darmenov, A., Colarco, P., Govindaraju, R., Ferrare, R., Hair, J., Beyersdorf, A., and Ziemba, L.: The MERRA-2 aerosol reanalysis, 1980 onward. Part II: Evaluation and case studies, J. Climate, 30, 6851–6872, https://doi.org/10.1175/JCLI-D-16-0613.1, 2017.
Cahyono, W. E., Setyawati, W., Hamdi, S., Cholianawati, N., Kombara, P. Y., and Sari, W. J.: Observations of aerosol optical properties during tropical forest fires in Indonesia, Materials Today: Proceedings, 63, S445–S450, https://doi.org/10.1016/j.matpr.2022.04.113, 2022.
Caido, N. G., Ong, P. M., Rempillo, O., Galvez, M. C., and Vallar, E.: Spatiotemporal analysis of MODIS aerosol optical depth data in the Philippines from 2010 to 2020, Atmosphere, 13, 939, https://doi.org/10.3390/atmos13060939, 2022.
Chang, C.-P., Wang, Z., McBride, J., and Liu, C.-H.: Annual cycle of Southeast Asia – Maritime Continent rainfall and the asymmetric monsoon transition, J. Climate, 18, 287–301, https://doi.org/10.1175/JCLI-3257.1, 2005.
Che, H., Xia, X., Zhu, J., Wang, H., Wang, Y., Sun, J., Zhang, X., and Shi, G.: Aerosol optical properties under the condition of heavy haze over an urban site of Beijing, China, Environ. Sci. Pollut. R., 22, 1043–1053, https://doi.org/10.1007/s11356-014-3415-5, 2015.
Chen, Q., McGowan, S., Gouramanis, C., Fong, L., Balasubramanian, R., and Taylor, D.: Rapidly rising transboundary atmospheric pollution from industrial and urban sources in Southeast Asia and its implications for regional sustainable development, Environ. Res. Lett., 15, 1040a1045, https://doi.org/10.1088/1748-9326/abb5ce, 2020.
Choi, M., Lim, H., Kim, J., Lee, S., Eck, T. F., Holben, B. N., Garay, M. J., Hyer, E. J., Saide, P. E., and Liu, H.: Validation, comparison, and integration of GOCI, AHI, MODIS, MISR, and VIIRS aerosol optical depth over East Asia during the 2016 KORUS-AQ campaign, Atmos. Meas. Tech., 12, 4619–4641, https://doi.org/10.5194/amt-12-4619-2019, 2019.
Cohen, J. B.: Quantifying the occurrence and magnitude of the Southeast Asian fire climatology, Environ. Res. Lett., 9, 114018, https://doi.org/10.1088/1748-9326/9/11/114018, 2014.
Cohen, J. B., Lecoeur, E., and Hui Loong Ng, D.: Decadal-scale relationship between measurements of aerosols, land-use change, and fire over Southeast Asia, Atmos. Chem. Phys., 17, 721–743, https://doi.org/10.5194/acp-17-721-2017, 2017.
Coronas, J.: The Climate and Weather of the Philippines, 1903–1918, by Rev. José Coronas. SJ, Chief, Meteorological Division, Weather Bureau, Manila Observatory, Manila, Bureau of Printing, 196 pp., 1920.
Crosbie, E., Sorooshian, A., Monfared, N. A., Shingler, T., and Esmaili, O.: A multi-year aerosol characterization for the greater Tehran area using satellite, surface, and modeling data, Atmosphere, 5, 178–197, https://doi.org/10.3390/atmos5020178, 2014.
Crosbie, E., Ziemba, L. D., Shook, M. A., Robinson, C. E., Winstead, E. L., Thornhill, K. L., Braun, R. A., MacDonald, A. B., Stahl, C., Sorooshian, A., van den Heever, S. C., DiGangi, J. P., Diskin, G. S., Woods, S., Bañaga, P., Brown, M. D., Gallo, F., Hilario, M. R. A., Jordan, C. E., Leung, G. R., Moore, R. H., Sanchez, K. J., Shingler, T. J., and Wiggins, E. B.: Measurement report: Closure analysis of aerosol–cloud composition in tropical maritime warm convection, Atmos. Chem. Phys., 22, 13269–13302, https://doi.org/10.5194/acp-22-13269-2022, 2022.
Cruz, F., Narisma, G. T., Villafuerte II, M. Q., Chua, K. C., and Olaguera, L. M.: A climatological analysis of the southwest monsoon rainfall in the Philippines, Atmos. Res., 122, 609–616, https://doi.org/10.1016/j.atmosres.2012.06.010, 2013.
Cruz, M. T., Bañaga, P. A., Betito, G., Braun, R. A., Stahl, C., Aghdam, M. A., Cambaliza, M. O., Dadashazar, H., Hilario, M. R., Lorenzo, G. R., Ma, L., MacDonald, A. B., Pabroa, P. C., Yee, J. R., Simpas, J. B., and Sorooshian, A.: Size-resolved composition and morphology of particulate matter during the southwest monsoon in Metro Manila, Philippines, Atmos. Chem. Phys., 19, 10675–10696, https://doi.org/10.5194/acp-19-10675-2019, 2019.
Cruz, M. T., Simpas, J. B., Sorooshian, A., Betito, G., Cambaliza, M. O. L., Collado, J. T., Eloranta, E. W., Holz, R., Topacio, X. G. V., and Del Socorro, J.: Impacts of regional wind circulations on aerosol pollution and planetary boundary layer structure in Metro Manila, Philippines, Atmos. Environ., 293, 119455, https://doi.org/10.1016/j.atmosenv.2022.119455, 2023.
Deep, A., Pandey, C. P., Nandan, H., Singh, N., Yadav, G., Joshi, P., Purohit, K., and Bhatt, S.: Aerosols optical depth and Ångström exponent over different regions in Garhwal Himalaya, India, Environ. Monit. Assess., 193, 324, https://doi.org/10.1007/s10661-021-09048-4, 2021.
Di Girolamo, L., Holz, R., Reid, J., Tanelli, S., van den Heever, S., Narsma, G., and Simpas, J.: Cloud and aerosol monsoonal processes-Philippines experiment (CAMP2Ex), NASA White Paper, A proposed joint US-Philippine airborne mission to study aerosol and land use impacts on monsoonal precipitation during late summer 2018, 2015.
Diner, D. J., Di Girolamo, L., and Nolin, A.: Preface to the MISR special issue, Remote Sens. Environ., 107, 1, https://doi.org/10.1016/j.rse.2006.11.001, 2007.
Dong, X. and Fu, J. S.: Understanding interannual variations of biomass burning from Peninsular Southeast Asia, part II: Variability and different influences in lower and higher atmosphere levels, Atmos. Environ., 115, 9–18, https://doi.org/10.1016/j.atmosenv.2015.05.052, 2015.
Dorado, S. V., Holdsworth, J. L., Lagrosas, N. C., Villarin, J. R., Narisma, G., Ellis, J., and Perez, R.: Characterization of urban atmosphere of Manila with lidar, filter sampling, and radiosonde, Lidar Remote Sensing for Industry and Environment Monitoring, https://doi.org/10.1117/12.417097, 591–598, 2001.
Dubovik, O. and King, M. D.: A flexible inversion algorithm for retrieval of aerosol optical properties from Sun and sky radiance measurements, J. Geophys. Res.-Atmos., 105, 20673–20696, https://doi.org/10.1029/2000JD900282, 2000.
Dubovik, O., Holben, B., Kaufman, Y., Yamasoe, M., Smirnov, A., Tanré, D., and Slutsker, I.: Single-scattering albedo of smoke retrieved from the sky radiance and solar transmittance measured from ground, J. Geophys. Res.-Atmos., 103, 31903–31923, https://doi.org/10.1029/98JD02276, 1998.
Dubovik, O., Holben, B., Eck, T. F., Smirnov, A., Kaufman, Y. J., King, M. D., Tanré, D., and Slutsker, I.: Variability of absorption and optical properties of key aerosol types observed in worldwide locations, J. Atmos. Sci., 59, 590–608, https://doi.org/10.1175/1520-0469(2002)059<0590:VOAAOP>2.0.CO;2, 2002.
EarthData: Multi-angle Imaging SpectroRadiometer (MISR) Jet Propulsion Laboratory: Level 3 Component Global Aerosol product in netCDF format covering a month V004, NASA [data set], https://search.earthdata.nasa.gov/search/granules?p=C108919889-LARC!C108919889-LARC&pg[1][v]=t&pg[1][m]=download&q=MIsr aerosol&qt=2009-01-01T00:00:00.000Z,2018-12-31T23:59:59.999Z&tl=1637172199!3!!&lat=-0.3515625&long=0.5625 (last access: 22 November 2021), 2018.
Eck, T., Holben, B., Reid, J., O'neill, N., Schafer, J., Dubovik, O., Smirnov, A., Yamasoe, M., and Artaxo, P.: High aerosol optical depth biomass burning events: A comparison of optical properties for different source regions, Geophys. Res. Lett., 30, 2035, https://doi.org/10.1029/2003GL017861, 2003.
Eck, T., Holben, B., Dubovik, O., Smirnov, A., Goloub, P., Chen, H., Chatenet, B., Gomes, L., Zhang, X. Y., and Tsay, S. C.: Columnar aerosol optical properties at AERONET sites in central eastern Asia and aerosol transport to the tropical mid-Pacific, J. Geophys. Res.-Atmos., 110, D06202, https://doi.org/10.1029/2004JD005274, 2005.
Eck, T., Holben, B., Reid, J., Mukelabai, M., Piketh, S., Torres, O., Jethva, H., Hyer, E., Ward, D., and Dubovik, O.: A seasonal trend of single scattering albedo in southern African biomass-burning particles: Implications for satellite products and estimates of emissions for the world's largest biomass-burning source, J. Geophys. Res.-Atmos., 118, 6414–6432, https://doi.org/10.1002/jgrd.50500, 2013.
Eck, T. F., Holben, B., Reid, J., Dubovik, O., Smirnov, A., O'neill, N., Slutsker, I., and Kinne, S.: Wavelength dependence of the optical depth of biomass burning, urban, and desert dust aerosols, J. Geophys. Res.-Atmos., 104, 31333–31349, https://doi.org/10.1029/1999JD900923, 1999.
Eck, T. F., Holben, B. N., Reid, J., Giles, D., Rivas, M., Singh, R. P., Tripathi, S., Bruegge, C., Platnick, S., and Arnold, G.: Fog-and cloud-induced aerosol modification observed by the Aerosol Robotic Network (AERONET), J. Geophys. Res.-Atmos., 117, D07206, https://doi.org/10.1029/2011JD016839, 2012.
Eckstein, D., Hutfils, M.-L., and Winges, M.: Global Climate Risk Index 2019 (Who Suffers Most From Extreme Weather Events? Weather-related Loss Events in 2017 and 1998 to 2017), Germanwatch e.V., Bonn, Germany, 36 pp., ISBN 978-3-943704-70-9, 2018.
Edwards, E.-L., Reid, J. S., Xian, P., Burton, S. P., Cook, A. L., Crosbie, E. C., Fenn, M. A., Ferrare, R. A., Freeman, S. W., Hair, J. W., Harper, D. B., Hostetler, C. A., Robinson, C. E., Scarino, A. J., Shook, M. A., Sokolowsky, G. A., van den Heever, S. C., Winstead, E. L., Woods, S., Ziemba, L. D., and Sorooshian, A.: Assessment of NAAPS-RA performance in Maritime Southeast Asia during CAMP2Ex, Atmos. Chem. Phys., 22, 12961–12983, https://doi.org/10.5194/acp-22-12961-2022, 2022.
Ervens, B., Sorooshian, A., Aldhaif, A. M., Shingler, T., Crosbie, E., Ziemba, L., Campuzano-Jost, P., Jimenez, J. L., and Wisthaler, A.: Is there an aerosol signature of chemical cloud processing?, Atmos. Chem. Phys., 18, 16099–16119, https://doi.org/10.5194/acp-18-16099-2018, 2018.
Faloona, I.: Sulfur processing in the marine atmospheric boundary layer: A review and critical assessment of modeling uncertainties, Atmos. Environ., 43, 2841–2854, https://doi.org/10.1016/j.atmosenv.2009.02.043, 2009.
Feingold, G.: Modeling of the first indirect effect: Analysis of measurement requirements, Geophys. Res. Lett., 30, 1997, https://doi.org/10.1029/2003GL017967, 2003.
Flores, J. and Balagot, V.: Climate of the Philippines, World survey of climatology, 8, 159–213, 1969.
Formenti, P., Andreae, M. O., and Lelieveld, J.: Measurements of aerosol optical depth above 3570 m asl in the North Atlantic free troposphere: results from ACE-2, Tellus B, 52, 678–693, 2000.
Foth, A., Kanitz, T., Engelmann, R., Baars, H., Radenz, M., Seifert, P., Barja, B., Fromm, M., Kalesse, H., and Ansmann, A.: Vertical aerosol distribution in the southern hemispheric midlatitudes as observed with lidar in Punta Arenas, Chile (53.2∘ S and 70.9∘ W), during ALPACA, Atmos. Chem. Phys., 19, 6217–6233, https://doi.org/10.5194/acp-19-6217-2019, 2019.
Garay, M. J., Bull, M. A., Nastan, A. M., Witek, M. L., Seidel, F. C., Diner, D. J., Kahn, R. A., Limbacher, J. A., and Kalashnikova, O. V.: Data Product Specification for the MISR Level 2 Aerosol Product, Jet Propulsion Laboratory, California Institute of Technology. JPL D-100649. https://asdc.larc.nasa.gov/documents/misr/DPS_AEROSOL_V023.20180125.pdf (last access: 15 September 2022), 2018.
Gautam, R., Hsu, N. C., Eck, T. F., Holben, B. N., Janjai, S., Jantarach, T., Tsay, S.-C., and Lau, W. K.: Characterization of aerosols over the Indochina peninsula from satellite-surface observations during biomass burning pre-monsoon season, Atmos. Environ., 78, 51–59, https://doi.org/10.1016/j.atmosenv.2012.05.038, 2013.
Gelaro, R., McCarty, W., Suárez, M. J., Todling, R., Molod, A., Takacs, L., Randles, C. A., Darmenov, A., Bosilovich, M. G., and Reichle, R.: The modern-era retrospective analysis for research and applications, version 2 (MERRA-2), J. Climate, 30, 5419–5454, https://doi.org/10.1175/JCLI-D-16-0758.1, 2017.
Geng, H., Hwang, H., Liu, X., Dong, S., and Ro, C.-U.: Investigation of aged aerosols in size-resolved Asian dust storm particles transported from Beijing, China, to Incheon, Korea, using low-Z particle EPMA, Atmos. Chem. Phys., 14, 3307–3323, https://doi.org/10.5194/acp-14-3307-2014, 2014.
Giles, D. M., Holben, B. N., Eck, T. F., Sinyuk, A., Smirnov, A., Slutsker, I., Dickerson, R., Thompson, A., and Schafer, J.: An analysis of AERONET aerosol absorption properties and classifications representative of aerosol source regions, J. Geophys. Res.-Atmos., 117, D17203, https://doi.org/10.1029/2012JD018127, 2012.
Giles, D. M., Sinyuk, A., Sorokin, M. G., Schafer, J. S., Smirnov, A., Slutsker, I., Eck, T. F., Holben, B. N., Lewis, J. R., Campbell, J. R., Welton, E. J., Korkin, S. V., and Lyapustin, A. I.: Advancements in the Aerosol Robotic Network (AERONET) Version 3 database – automated near-real-time quality control algorithm with improved cloud screening for Sun photometer aerosol optical depth (AOD) measurements, Atmos. Meas. Tech., 12, 169–209, https://doi.org/10.5194/amt-12-169-2019, 2019.
Global Modeling and Assimilation Office (GMAO): MERRA-2 inst3_3d_asm_Np: 3d,3-Hourly, Instantaneous, Pressure-Level, Assimilation, Assimilated Meteorological Fields V5.12.4, Greenbelt, MD, USA, Goddard Earth Sciences Data and Information Services Center (GES DISC) [data set], https://doi.org/10.5067/QBZ6MG944HW0, 2015a.
Global Modeling and Assimilation Office (GMAO): MERRA-2 tavg1_2d_flx_Nx: 2d,1-Hourly, Time-Averaged, Single-Level, Assimilation, Surface Flux Diagnostics V5.12.4, Greenbelt, MD, USA, Goddard Earth Sciences Data and Information Services Center (GES DISC) [data set], https://doi.org/10.5067/7MCPBJ41Y0K6, 2015b.
Global Modeling and Assimilation Office (GMAO): MERRA-2 tavg1_2d_csp_Nx: 2d,1-Hourly, Time-averaged, Single-Level, Assimilation, COSP Satellite Simulator V5.12.4, Greenbelt, MD, USA, Goddard Earth Sciences Data and Information Services Center (GES DISC) [data set], https://doi.org/10.5067/H0VVAD8F6MX5, 2015c.
Global Modeling and Assimilation Office (GMAO): MERRA-2 tavg1_2d_aer_Nx: 2d,1-Hourly,Time-averaged,Single-Level, Assimilation, Aerosol Diagnostics V5.12.4, Greenbelt, MD, USA, Goddard Earth Sciences Data and Information Services Center (GES DISC) [data set], https://doi.org/10.5067/KLICLTZ8EM9D, 2015d.
Global Modeling and Assimilation Office (GMAO): MERRA-2 tavg1_2d_aer_Nx: 2d,1-Hourly, Time-averaged, Single-Level, Assimilation, Aerosol Diagnostics V5.12.4, Greenbelt, MD, USA, Goddard Earth Sciences Data and Information Services Center (GES DISC) [data set], https://doi.org/10.5067/FH9A0MLJPC7N, 2015d.
Global Modeling and Assimilation Office (GMAO): MERRA-2 tavgM_2d_aer_Nx: 2d, Monthly mean,Time-averaged, Single-Level, Assimilation,Aerosol Diagnostics V5.12.4, Greenbelt, MD, USA, Goddard Earth Sciences Data and Information Services Center (GES DISC) [data set], https://doi.org/10.5067/V92O8XZ30XBI, 2015e.
Global Modeling and Assimilation Office (GMAO): MERRA-2 instM_3d_ana_Np: 3d,Monthly mean,Instantaneous,Pressure-Level,Analysis,Analyzed Meteorological Fields V5.12.4, Greenbelt, MD, USA, Goddard Earth Sciences Data and Information Services Center (GES DISC) [data set], https://doi.org/10.5067/KLICLTZ8EM9D, 2015f.
Glover, D., and Jessup, T.: The Indonesian fires and haze of 1997: the economic toll, Economy and Environment Program for SE Asia (EEPSEA) Singapore and the World Wildlife Fund (WWF) Indonesia, Jakarta, EEPSEA Research, Report rr1998051, 9 pp., 1998.
Guyon, P., Boucher, O., Graham, B., Beck, J., Mayol-Bracero, O. L., Roberts, G. C., Maenhaut, W., Artaxo, P., and Andreae, M. O.: Refractive index of aerosol particles over the Amazon tropical forest during LBA-EUSTACH 1999, J. Aerosol Sci., 34, 883–907, https://doi.org/10.1016/S0021-8502(03)00052-1, 2003.
Harenda, K. M., Markowicz, K. M., Poczta, P., Stachlewska, I. S., Bojanowski, J. S., Czernecki, B., McArthur, A., Schuetemeyer, D., and Chojnicki, B. H.: Estimation of the effects of aerosol optical properties on peatland production in Rzecin, Poland, Agr. Forest Meteorol., 316, 108861, https://doi.org/10.1016/j.agrformet.2022.108861, 2022.
Hartley, W. S. and Hobbs, P. V.: An aerosol model and aerosol-induced changes in the clear-sky albedo off the east coast of the United States, J. Geophys. Res.-Atmos., 106, 9733–9748, https://doi.org/10.1029/2001JD900025, 2001.
Haywood, J. and Boucher, O.: Estimates of the direct and indirect radiative forcing due to tropospheric aerosols: A review, Rev. Geophys., 38, 513–543, https://doi.org/10.1029/1999RG000078, 2000.
Hendrickson, B. N., Brooks, S. D., Thornton, D. C., Moore, R. H., Crosbie, E., Ziemba, L. D., Carlson, C. A., Baetge, N., Mirrielees, J. A., and Alsante, A. N.: Role of sea surface microlayer properties in cloud formation, Front. Mar. Sci., 7, 596225, https://doi.org/10.3389/fmars.2020.596225, 2021.
Herber, A., Thomason, L. W., Gernandt, H., Leiterer, U., Nagel, D., Schulz, K. H., Kaptur, J., Albrecht, T., and Notholt, J.: Continuous day and night aerosol optical depth observations in the Arctic between 1991 and 1999, J. Geophys. Res.-Atmos., 107, AAC6-1–AAC6-13, https://doi.org/10.1029/2001JD000536, 2002.
Hilario, M. R. A., Cruz, M. T., Bañaga, P. A., Betito, G., Braun, R. A., Stahl, C., Cambaliza, M. O., Lorenzo, G. R., MacDonald, A. B., AzadiAghdam, M., Pabroa, P. C., Yee, J. R., Simpas, J. B., and Sorooshian, A.: Characterizing weekly cycles of particulate matter in a coastal megacity: The importance of a seasonal, size-resolved, and chemically-speciated analysis, J. Geophys. Res.-Atmos., 125, e2020JD032614, https://doi.org/10.1029/2020JD032614, 2020a.
Hilario, M. R. A., Cruz, M. T., Cambaliza, M. O. L., Reid, J. S., Xian, P., Simpas, J. B., Lagrosas, N. D., Uy, S. N. Y., Cliff, S., and Zhao, Y.: Investigating size-segregated sources of elemental composition of particulate matter in the South China Sea during the 2011 Vasco cruise, Atmos. Chem. Phys., 20, 1255–1276, https://doi.org/10.5194/acp-20-1255-2020, 2020b.
Hilario, M. R. A., Crosbie, E., Shook, M., Reid, J. S., Cambaliza, M. O. L., Simpas, J. B. B., Ziemba, L., DiGangi, J. P., Diskin, G. S., Nguyen, P., Turk, F. J., Winstead, E., Robinson, C. E., Wang, J., Zhang, J., Wang, Y., Yoon, S., Flynn, J., Alvarez, S. L., Behrangi, A., and Sorooshian, A.: Measurement report: Long-range transport patterns into the tropical northwest Pacific during the CAMP2Ex aircraft campaign: chemical composition, size distributions, and the impact of convection, Atmos. Chem. Phys., 21, 3777–3802, https://doi.org/10.5194/acp-21-3777-2021, 2021a.
Hilario, M. R. A., Olaguera, L. M., Narisma, G. T., and Matsumoto, J.: Diurnal characteristics of summer precipitation over Luzon Island, Philippines, Asia-Pac. J. Atmos. Sci., 57, 573–585, https://doi.org/10.1007/s13143-020-00214-1, 2021b.
Hilario, M. R. A., Bañaga, P. A., Betito, G., Braun, R. A., Cambaliza, M. O., Cruz, M. T., Lorenzo, G. R., MacDonald, A. B., Pabroa, P. C., and Simpas, J. B.: Stubborn aerosol: why particulate mass concentrations do not drop during the wet season in Metro Manila, Philippines, Environ. Sci.-Atmos., 2, 1428–1437, https://doi.org/10.1039/D2EA00073C, 2022.
Hogan, T. F., Liu, M., Ridout, J. A., Peng, M. S., Whitcomb, T. R., Ruston, B. C., Reynolds, C. A., Eckermann, S. D., Moskaitis, J. R., and Baker, N. L.: The navy global environmental model, Oceanography, 27, 116–125, https://doi.org/10.5670/oceanog.2014.73, 2014.
Holben, B. N., Eck, T. F., Slutsker, I. a., Tanre, D., Buis, J., Setzer, A., Vermote, E., Reagan, J. A., Kaufman, Y., and Nakajima, T.: AERONET – A federated instrument network and data archive for aerosol characterization, Remote Sens. Environ., 66, 1–16, https://doi.org/10.1016/S0034-4257(98)00031-5, 1998.
Holben, B. N., Tanre, D., Smirnov, A., Eck, T., Slutsker, I., Abuhassan, N., Newcomb, W., Schafer, J., Chatenet, B., and Lavenu, F.: An emerging ground-based aerosol climatology: Aerosol optical depth from AERONET, J. Geophys. Res.-Atmos., 106, 12067–12097, https://doi.org/10.1029/2001JD900014, 2001.
Hong, Y. and Di Girolamo, L.: Cloud phase characteristics over Southeast Asia from A-Train satellite observations, Atmos. Chem. Phys., 20, 8267–8291, https://doi.org/10.5194/acp-20-8267-2020, 2020.
Hong, Y. and Di Girolamo, L.: An overview of aerosol properties in clear and cloudy sky based on CALIPSO observations, Earth Space Sci., 9, e2022EA002287, https://doi.org/10.1029/2022EA002287, 2022.
Hoppel, W., Frick, G., Fitzgerald, J., and Larson, R.: Marine boundary layer measurements of new particle formation and the effects nonprecipitating clouds have on aerosol size distribution, J. Geophys. Res.-Atmos., 99, 14443–14459, https://doi.org/10.1029/94JD00797, 1994.
Huang, C., Li, J., Sun, W., Chen, Q., Mao, Q.-J., and Yuan, Y.: Long-Term Variation Assessment of Aerosol Load and Dominant Types over Asia for Air Quality Studies Using Multi-Sources Aerosol Datasets, Remote Sens., 13, 3116, https://doi.org/10.3390/rs13163116, 2021.
Hyer, E. J., Reid, J. S., Prins, E. M., Hoffman, J. P., Schmidt, C. C., Miettinen, J. I., and Giglio, L.: Patterns of fire activity over Indonesia and Malaysia from polar and geostationary satellite observations, Atmos. Res., 122, 504–519, https://doi.org/10.1016/j.atmosres.2012.06.011, 2013.
Jamora, J. B., Gudia, S. E. L., Go, A. W., Giduquio, M. B., and Loretero, M. E.: Potential CO2 reduction and cost evaluation in use and transport of coal ash as cement replacement: A case in the Philippines, Waste Manage., 103, 137–145, https://doi.org/10.1016/j.wasman.2019.12.026, 2020.
Jose, S., Gharai, B., Niranjan, K., and Rao, P.: Investigation on seasonal variations of aerosol properties and its influence on radiative effect over an urban location in central India, Atmos. Environ., 133, 41–48, https://doi.org/10.1016/j.atmosenv.2016.03.029, 2016.
Kaskaoutis, D., Kosmopoulos, P., Kambezidis, H., and Nastos, P.: Aerosol climatology and discrimination of different types over Athens, Greece, based on MODIS data, Atmos. Environ., 41, 7315–7329, https://doi.org/10.1016/j.atmosenv.2007.05.017, 2007.
Kaskaoutis, D., Badarinath, K., Kumar Kharol, S., Rani Sharma, A., and Kambezidis, H.: Variations in the aerosol optical properties and types over the tropical urban site of Hyderabad, India, J. Geophys. Res.-Atmos., 114, D22204, https://doi.org/10.1029/2009JD012423, 2009.
Kiely, L., Spracklen, D. V., Wiedinmyer, C., Conibear, L., Reddington, C. L., Archer-Nicholls, S., Lowe, D., Arnold, S. R., Knote, C., Khan, M. F., Latif, M. T., Kuwata, M., Budisulistiorini, S. H., and Syaufina, L.: New estimate of particulate emissions from Indonesian peat fires in 2015, Atmos. Chem. Phys., 19, 11105–11121, https://doi.org/10.5194/acp-19-11105-2019, 2019.
Kim, J.-S. and Park, K.: Atmospheric aging of Asian dust particles during long range transport, Aerosol Sci. Tech., 46, 913–924, https://doi.org/10.1080/02786826.2012.680984, 2012.
Kirchstetter, T. W., Novakov, T., and Hobbs, P. V.: Evidence that the spectral dependence of light absorption by aerosols is affected by organic carbon, J. Geophys. Res.-Atmos., 109, D21208, https://doi.org/10.1029/2004JD004999, 2004.
Koven, C. D. and Fung, I.: Inferring dust composition from wavelength-dependent absorption in Aerosol Robotic Network (AERONET) data, J. Geophys. Res.-Atmos., 111, D14205, https://doi.org/10.1029/2005JD006678, 2006.
Kudo, R., Nishizawa, T., and Aoyagi, T.: Vertical profiles of aerosol optical properties and the solar heating rate estimated by combining sky radiometer and lidar measurements, Atmos. Meas. Tech., 9, 3223–3243, https://doi.org/10.5194/amt-9-3223-2016, 2016.
Kumar, K. R., Sivakumar, V., Reddy, R. R., Gopal, K. R., and Adesina, A. J.: Identification and classification of different aerosol types over a subtropical rural site in Mpumalanga, South Africa: seasonal variations as retrieved from the AERONET Sunphotometer, Aerosol Air Qual. Res., 14, 108–123, https://doi.org/10.4209/aaqr.2013.03.0079, 2014.
Kumar, K. R., Yin, Y., Sivakumar, V., Kang, N., Yu, X., Diao, Y., Adesina, A. J., and Reddy, R.: Aerosol climatology and discrimination of aerosol types retrieved from MODIS, MISR and OMI over Durban (29.88∘ S, 31.02∘ E), South Africa, Atmos. Environ., 117, 9–18, https://doi.org/10.1016/j.atmosenv.2015.06.058, 2015.
Kuttippurath, J. and Raj, S.: Two decades of aerosol observations by AATSR, MISR, MODIS and MERRA-2 over India and Indian Ocean, Remote Sens. Environ., 257, 112363, https://doi.org/10.1016/j.rse.2021.112363, 2021.
Lee, H.-H., Iraqui, O., Gu, Y., Yim, S. H.-L., Chulakadabba, A., Tonks, A. Y.-M., Yang, Z., and Wang, C.: Impacts of air pollutants from fire and non-fire emissions on the regional air quality in Southeast Asia, Atmos. Chem. Phys., 18, 6141–6156, https://doi.org/10.5194/acp-18-6141-2018, 2018.
Lee, J., Kim, J., Song, C., Kim, S., Chun, Y., Sohn, B., and Holben, B.: Characteristics of aerosol types from AERONET sunphotometer measurements, Atmos. Environ., 44, 3110–3117, https://doi.org/10.1016/j.atmosenv.2010.05.035, 2010.
Li, G., Bei, N., Cao, J., Huang, R., Wu, J., Feng, T., Wang, Y., Liu, S., Zhang, Q., Tie, X., and Molina, L. T.: A possible pathway for rapid growth of sulfate during haze days in China, Atmos. Chem. Phys., 17, 3301–3316, https://doi.org/10.5194/acp-17-3301-2017, 2017.
Li, J., Carlson, B. E., and Lacis, A. A.: Application of spectral analysis techniques in the intercomparison of aerosol data: 1. An EOF approach to analyze the spatial-temporal variability of aerosol optical depth using multiple remote sensing data sets, J. Geophys. Res.-Atmos., 118, 8640–8648, https://doi.org/10.1002/jgrd.50686, 2013.
Li, Z., Niu, F., Fan, J., Liu, Y., Rosenfeld, D., and Ding, Y.: Long-term impacts of aerosols on the vertical development of clouds and precipitation, Nat. Geosci., 4, 888–894, https://doi.org/10.1038/ngeo1313, 2011.
Lin, N.-H., Sayer, A. M., Wang, S.-H., Loftus, A. M., Hsiao, T.-C., Sheu, G.-R., Hsu, N. C., Tsay, S.-C., and Chantara, S.: Interactions between biomass-burning aerosols and clouds over Southeast Asia: Current status, challenges, and perspectives, Environ. Pollut., 195, 292–307, https://doi.org/10.1016/j.envpol.2014.06.036, 2014.
Lloyd, S.: Least squares quantization in PCM, IEEE T. Inform. Theory, 28, 129–137, https://doi.org/10.1109/TIT.1982.1056489, 1982.
Lynch, P., Reid, J. S., Westphal, D. L., Zhang, J., Hogan, T. F., Hyer, E. J., Curtis, C. A., Hegg, D. A., Shi, Y., Campbell, J. R., Rubin, J. I., Sessions, W. R., Turk, F. J., and Walker, A. L.: An 11-year global gridded aerosol optical thickness reanalysis (v1.0) for atmospheric and climate sciences, Geosci. Model Dev., 9, 1489–1522, https://doi.org/10.5194/gmd-9-1489-2016, 2016.
Markowicz, K., Zawadzka-Manko, O., Lisok, J., Chilinski, M., and Xian, P.: The impact of moderately absorbing aerosol on surface sensible, latent, and net radiative fluxes during the summer of 2015 in Central Europe, J. Aerosol Sci., 151, 105627, https://doi.org/10.1016/j.jaerosci.2020.105627, 2021.
Matsumoto, J., Olaguera, L. M. P., Nguyen-Le, D., Kubota, H., and Villafuerte, M. Q.: Climatological seasonal changes of wind and rainfall in the Philippines, Int. J. Climatol., 40, 4843–4857, https://doi.org/10.1002/joc.6492, 2020.
Mims III, F. M.: A 30-Year Climatology (1990–2020) of Aerosol Optical Depth and Total Column Water Vapor and Ozone over Texas, B. Am. Meteorol. Soc., 103, E101–E109, https://doi.org/10.1175/BAMS-D-21-0010.1, 2022.
Moosmüller, H. and Sorensen, C.: Small and large particle limits of single scattering albedo for homogeneous, spherical particles, J. Quant. Spectrosc. Ra., 204, 250–255, https://doi.org/10.1016/j.jqsrt.2017.09.029, 2018.
Mora, M., Braun, R. A., Shingler, T., and Sorooshian, A.: Analysis of remotely sensed and surface data of aerosols and meteorology for the Mexico Megalopolis Area between 2003 and 2015, J. Geophys. Res.-Atmos., 122, 8705–8723, https://doi.org/10.1002/2017JD026739, 2017.
Nakata, M., Mukai, S., and Yasumoto, M.: Seasonal and regional characteristics of aerosol pollution in east and southeast Asia, Front. Environ. Sci., 6, 29, https://doi.org/10.3389/fenvs.2018.00029, 2018.
NASA: Fires and Smoke in Borneo: Fires and Smoke in Borneo, https://earthobservatory.nasa.gov/images/40182/fires-and-smoke-in-borneo (last access: 12 February 2022), 2009.
NASA GSFC: AERONET Inversion Products (Version 3), https://aeronet.gsfc.nasa.gov/new_web/Documents/Inversion_products_for_V3.pdf (last access: 25 June 2021), 2019.
NASA: Worldview, AQUA MODIS cloud fraction, 24 August 2019, NASA [data set], https://worldview.earthdata.nasa.gov/?v=80.75069053975838,-7.786202652672809,165.45983158387872,31.54304140352593&l=Coastlines_15m,MODIS_Aqua_Cloud_Fraction_Night&lg=true&t=2019-08-24-T16:29:32Z (last access: 17 January 2023), 2023a.
NASA: Worldview, AQUA MODIS cloud fraction, 25 August 2019, NASA [data set], https://worldview.earthdata.nasa.gov/?v=80.75069053975838,-7.786202652672809,165.45983158387872,31.54304140352593&l=Coastlines_15m,MODIS_Aqua_Cloud_Fraction_Night&lg=true&t=2019-08-25-T16:29:32Z (last access: 17 January 2023), 2023b.
NASA: Worldview, TERRA MODIS cloud fraction, 24 August 2019, NASA [data set], https://worldview.earthdata.nasa.gov/?v=81.96916046398741,-7.786202652672809,164.2413616596497,31.54304140352593&l=Coastlines_15m,MODIS_Terra_Cloud_Fraction_Night&lg=true&t=2019-08-24-T16:29:32Z (last access: 17 January 2023), 2023c.
NASA: Worldview, TERRA MODIS cloud fraction, 25 August 2019, NASA [data set], https://worldview.earthdata.nasa.gov/?v=81.96916046398741,-7.786202652672809,164.2413616596497,31.54304140352593&l=Coastlines_15m,MODIS_Terra_Cloud_Fraction_Night&lg=true&t=2019-08-25-T16:29:32Z (last access: 17 January 2023), 2023d.
Naval Research Laboratory: Untitled Document [data set], https://www.nrlmry.navy.mil/aerosol-bin/aerosol/display_directory_all_t.cgi?DIR=/web/aerosol/public_html/globaer/ops_01/seasia/ (last access: 4 June 2021), 2023.
Nguyen, P., Shearer, E. J., Tran, H., Ombadi, M., Hayatbini, N., Palacios, T., Huynh, P., Braithwaite, D., Updegraff, G., and Hsu, K.: The CHRS Data Portal, an easily accessible public repository for PERSIANN global satellite precipitation data, Sci. Data, 6, 1–10, https://doi.org/10.1038/sdata.2018.296, 2019a.
Nguyen, T. T., Pham, H. V., Lasko, K., Bui, M. T., Laffly, D., Jourdan, A., and Bui, H. Q.: Spatiotemporal analysis of ground and satellite-based aerosol for air quality assessment in the Southeast Asia region, Environ. Pollut., 255, 113106, https://doi.org/10.1016/j.envpol.2019.113106, 2019b.
NOAA Air Resources Laboratory: Meteorology & Starting Location(s), NOAA [data set], https://www.ready.noaa.gov/hypub-bin/trajasrc.pl, last access: 5 June, 2023.
North, G. R., Bell, T. L., Cahalan, R. F., and Moeng, F. J.: Sampling errors in the estimation of empirical orthogonal functions, Mon. Weather Rev., 110, 699–706, https://doi.org/10.1175/1520-0493(1982)110<0699:SEITEO>2.0.CO;2, 1982.
O'Neill, N., Eck, T., Smirnov, A., Holben, B., and Thulasiraman, S.: Spectral discrimination of coarse and fine mode optical depth, J. Geophys. Res.-Atmos., 108, 4559, https://doi.org/10.1029/2002JD002975, 2003.
Oanh, N. K., Upadhyay, N., Zhuang, Y.-H., Hao, Z.-P., Murthy, D., Lestari, P., Villarin, J., Chengchua, K., Co, H., and Dung, N.: Particulate air pollution in six Asian cities: Spatial and temporal distributions, and associated sources, Atmos. Environ., 40, 3367–3380, https://doi.org/10.1016/j.atmosenv.2006.01.050, 2006.
Oanh, N. T. K., Permadi, D. A., Hopke, P. K., Smith, K. R., Dong, N. P., and Dang, A. N.: Annual emissions of air toxics emitted from crop residue open burning in Southeast Asia over the period of 2010–2015, Atmos. Environ., 187, 163–173, https://doi.org/10.1016/j.atmosenv.2018.05.061, 2018.
Ong, H. J. J., Lagrosas, N., Uy, S. N., Gacal, G. F. B., Dorado, S., Tobias Jr, V., and Holben, B.: Determination of Monthly Aerosol Types in Manila Observatory and Notre Dame of Marbel University from Aerosol Robotic Network (AERONET) measurements, AGU Fall Meeting Abstracts, A54E-03, 2016AGUFM.A54E..03O, 2016.
Pace, G., di Sarra, A., Meloni, D., Piacentino, S., and Chamard, P.: Aerosol optical properties at Lampedusa (Central Mediterranean). 1. Influence of transport and identification of different aerosol types, Atmos. Chem. Phys., 6, 697–713, https://doi.org/10.5194/acp-6-697-2006, 2006.
Pandolfi, M., Alados-Arboledas, L., Alastuey, A., Andrade, M., Angelov, C., Artiñano, B., Backman, J., Baltensperger, U., Bonasoni, P., Bukowiecki, N., Collaud Coen, M., Conil, S., Coz, E., Crenn, V., Dudoitis, V., Ealo, M., Eleftheriadis, K., Favez, O., Fetfatzis, P., Fiebig, M., Flentje, H., Ginot, P., Gysel, M., Henzing, B., Hoffer, A., Holubova Smejkalova, A., Kalapov, I., Kalivitis, N., Kouvarakis, G., Kristensson, A., Kulmala, M., Lihavainen, H., Lunder, C., Luoma, K., Lyamani, H., Marinoni, A., Mihalopoulos, N., Moerman, M., Nicolas, J., O'Dowd, C., Petäjä, T., Petit, J.-E., Pichon, J. M., Prokopciuk, N., Putaud, J.-P., Rodríguez, S., Sciare, J., Sellegri, K., Swietlicki, E., Titos, G., Tuch, T., Tunved, P., Ulevicius, V., Vaishya, A., Vana, M., Virkkula, A., Vratolis, S., Weingartner, E., Wiedensohler, A., and Laj, P.: A European aerosol phenomenology – 6: scattering properties of atmospheric aerosol particles from 28 ACTRIS sites, Atmos. Chem. Phys., 18, 7877–7911, https://doi.org/10.5194/acp-18-7877-2018, 2018.
Petters, M. D., Carrico, C. M., Kreidenweis, S. M., Prenni, A. J., DeMott, P. J., Collett Jr, J. L., and Moosmüller, H.: Cloud condensation nucleation activity of biomass burning aerosol, J. Geophys. Res.-Atmos., 114, D22205, https://doi.org/10.1029/2009JD012353, 2009.
Plymale, N. T., Szekely, J. E., and Rubinstein, A. H.: Statistical Cluster Analysis of Global Aerosol Optical Depth for Simplified Atmospheric Modeling, J. Appl. Meteorol. Clim., https://doi.org/10.1175/JAMC-D-21-0150.1, 2021.
PSA: Highlights of the Philippine Population 2015 Census of Population, Philippine Statistics Authority: Republic of the Philippines, http://psa.gov.ph/content/highlights-philippine-population-2015-census-population (last access: 12 February 2022), 2016.
Qi, Y., Ge, J., and Huang, J.: Spatial and temporal distribution of MODIS and MISR aerosol optical depth over northern China and comparison with AERONET, Chinese Sci. Bull., 58, 2497–2506, https://doi.org/10.1007/s11434-013-5678-5, 2013.
Ramage, C. S.: Monsoon meteorology, Academic Press, New York, 198 pp., ISBN 0125766505, 1971.
Randles, C., Da Silva, A., Buchard, V., Colarco, P., Darmenov, A., Govindaraju, R., Smirnov, A., Holben, B., Ferrare, R., and Hair, J.: The MERRA-2 aerosol reanalysis, 1980 onward. Part I: System description and data assimilation evaluation, J. Climate, 30, 6823–6850, https://doi.org/10.1175/JCLI-D-16-0609.1, 2017.
Reid, J. S., Koppmann, R., Eck, T. F., and Eleuterio, D. P.: A review of biomass burning emissions part II: intensive physical properties of biomass burning particles, Atmos. Chem. Phys., 5, 799–825, https://doi.org/10.5194/acp-5-799-2005, 2005.
Reid, J. S., Xian, P., Hyer, E. J., Flatau, M. K., Ramirez, E. M., Turk, F. J., Sampson, C. R., Zhang, C., Fukada, E. M., and Maloney, E. D.: Multi-scale meteorological conceptual analysis of observed active fire hotspot activity and smoke optical depth in the Maritime Continent, Atmos. Chem. Phys., 12, 2117–2147, https://doi.org/10.5194/acp-12-2117-2012, 2012.
Reid, J., Maring, H., Narisma, G., van den Heever, S., Di Girolamo, L., Ferrare, R., Holz, R., Lawson, P., Mace, G., and Simpas, J.: The coupling between tropical meteorology, aerosol lifecycle, convection, and radiation, during the Cloud, Aerosol and Monsoon Processes Philippines Experiment (CAMP 2 Ex), B. Am. Meteorol. Soc., 104, E1179–E1205, https://doi.org/10.1175/BAMS-D-21-0285.1, 2023.
Reid, J. S., Hobbs, P. V., Liousse, C., Martins, J. V., Weiss, R. E., and Eck, T. F.: Comparisons of techniques for measuring shortwave absorption and black carbon content of aerosols from biomass burning in Brazil, J. Geophys. Res.-Atmos., 103, 32031–32040, https://doi.org/10.1029/98JD00773, 1998.
Reid, J. S., Hyer, E. J., Johnson, R. S., Holben, B. N., Yokelson, R. J., Zhang, J., Campbell, J. R., Christopher, S. A., Di Girolamo, L., and Giglio, L.: Observing and understanding the Southeast Asian aerosol system by remote sensing: An initial review and analysis for the Seven Southeast Asian Studies (7SEAS) program, Atmos. Res., 122, 403–468, https://doi.org/10.1016/j.atmosres.2012.06.005, 2013.
Reid, J. S., Lagrosas, N. D., Jonsson, H. H., Reid, E. A., Sessions, W. R., Simpas, J. B., Uy, S. N., Boyd, T. J., Atwood, S. A., Blake, D. R., Campbell, J. R., Cliff, S. S., Holben, B. N., Holz, R. E., Hyer, E. J., Lynch, P., Meinardi, S., Posselt, D. J., Richardson, K. A., Salinas, S. V., Smirnov, A., Wang, Q., Yu, L., and Zhang, J.: Observations of the temporal variability in aerosol properties and their relationships to meteorology in the summer monsoonal South China Sea/East Sea: the scale-dependent role of monsoonal flows, the Madden–Julian Oscillation, tropical cyclones, squall lines and cold pools, Atmos. Chem. Phys., 15, 1745–1768, https://doi.org/10.5194/acp-15-1745-2015, 2015.
Rizza, U., Mancinelli, E., Morichetti, M., Passerini, G., and Virgili, S.: Aerosol optical depth of the main aerosol species over Italian cities based on the NASA/MERRA-2 model reanalysis, Atmosphere, 10, 709, https://doi.org/10.3390/atmos10110709, 2019.
Rolph, G., Stein, A., and Stunder, B.: Real-time environmental applications and display system: READY, Environ. Modell. Softw., 95, 210–228, https://doi.org/10.1016/j.envsoft.2017.06.025, 2017.
Ross, A. D., Holz, R. E., Quinn, G., Reid, J. S., Xian, P., Turk, F. J., and Posselt, D. J.: Exploring the first aerosol indirect effect over Southeast Asia using a 10-year collocated MODIS, CALIOP, and model dataset, Atmos. Chem. Phys., 18, 12747–12764, https://doi.org/10.5194/acp-18-12747-2018, 2018.
Ross, J. L., Hobbs, P. V., and Holben, B.: Radiative characteristics of regional hazes dominated by smoke from biomass burning in Brazil: Closure tests and direct radiative forcing, J. Geophys. Res.-Atmos., 103, 31925–31941, https://doi.org/10.1029/97JD03677, 1998.
Saleh, R., Hennigan, C. J., McMeeking, G. R., Chuang, W. K., Robinson, E. S., Coe, H., Donahue, N. M., and Robinson, A. L.: Absorptivity of brown carbon in fresh and photo-chemically aged biomass-burning emissions, Atmos. Chem. Phys., 13, 7683–7693, https://doi.org/10.5194/acp-13-7683-2013, 2013.
Schlosser, J. S., Braun, R. A., Bradley, T., Dadashazar, H., MacDonald, A. B., Aldhaif, A. A., Aghdam, M. A., Mardi, A. H., Xian, P., and Sorooshian, A.: Analysis of aerosol composition data for western United States wildfires between 2005 and 2015: Dust emissions, chloride depletion, and most enhanced aerosol constituents, J. Geophys. Res.-Atmos., 122, 8951–8966, https://doi.org/10.1002/2017JD026547, 2017.
Schuster, G. L., Dubovik, O., and Holben, B. N.: Angstrom exponent and bimodal aerosol size distributions, J. Geophys. Res.-Atmos., 111, D07207, https://doi.org/10.1029/2005JD006328, 2006.
Schuster, G. L., Dubovik, O., and Arola, A.: Remote sensing of soot carbon – Part 1: Distinguishing different absorbing aerosol species, Atmos. Chem. Phys., 16, 1565–1585, https://doi.org/10.5194/acp-16-1565-2016, 2016.
Sharma, M., Kaskaoutis, D. G., Singh, R. P., and Singh, S.: Seasonal variability of atmospheric aerosol parameters over Greater Noida using ground sunphotometer observations, Aerosol Air Qual. Res., 14, 608–622, https://doi.org/10.4209/aaqr.2013.06.0219, 2014.
Shen, Z., Liu, J., Horowitz, L. W., Henze, D. K., Fan, S., H., L. I., Mauzerall, D. L., Lin, J.-T., and Tao, S.: Analysis of transpacific transport of black carbon during HIPPO-3: implications for black carbon aging, Atmos. Chem. Phys., 14, 6315–6327, https://doi.org/10.5194/acp-14-6315-2014, 2014.
Sinyuk, A., Holben, B. N., Eck, T. F., Giles, D. M., Slutsker, I., Korkin, S., Schafer, J. S., Smirnov, A., Sorokin, M., and Lyapustin, A.: The AERONET Version 3 aerosol retrieval algorithm, associated uncertainties and comparisons to Version 2, Atmos. Meas. Tech., 13, 3375–3411, https://doi.org/10.5194/amt-13-3375-2020, 2020.
Smirnov, A., Holben, B. N., Dubovik, O., O'Neill, N. T., Eck, T. F., Westphal, D. L., Goroch, A. K., Pietras, C., and Slutsker, I.: Atmospheric aerosol optical properties in the Persian Gulf, J. Atmos. Sci., 59, 620–634, https://doi.org/10.1175/1520-0469(2002)059<0620:AAOPIT>2.0.CO;2, 2002.
Smith, S. J., van Aardenne, J., Klimont, Z., Andres, R. J., Volke, A., and Delgado Arias, S.: Anthropogenic sulfur dioxide emissions: 1850–2005, Atmos. Chem. Phys., 11, 1101–1116, https://doi.org/10.5194/acp-11-1101-2011, 2011.
Sorooshian, A., Wang, Z., Feingold, G., and L'Ecuyer, T. S.: A satellite perspective on cloud water to rain water conversion rates and relationships with environmental conditions, J. Geophys. Res.-Atmos., 118, 6643–6650, https://doi.org/10.1002/jgrd.50523, 2013.
Stahl, C., Cruz, M. T., Bañaga, P. A., Betito, G., Braun, R. A., Aghdam, M. A., Cambaliza, M. O., Lorenzo, G. R., MacDonald, A. B., Hilario, M. R. A., Pabroa, P. C., Yee, J. R., Simpas, J. B., and Sorooshian, A.: Sources and characteristics of size-resolved particulate organic acids and methanesulfonate in a coastal megacity: Manila, Philippines, Atmos. Chem. Phys., 20, 15907–15935, https://doi.org/10.5194/acp-20-15907-2020, 2020.
Stahl, C., Crosbie, E., Bañaga, P. A., Betito, G., Braun, R. A., Cainglet, Z. M., Cambaliza, M. O., Cruz, M. T., Dado, J. M., Hilario, M. R. A., Leung, G. F., MacDonald, A. B., Magnaye, A. M., Reid, J., Robinson, C., Shook, M. A., Simpas, J. B., Visaga, S. M., Winstead, E., Ziemba, L., and Sorooshian, A.: Total organic carbon and the contribution from speciated organics in cloud water: airborne data analysis from the CAMP2Ex field campaign, Atmos. Chem. Phys., 21, 14109–14129, https://doi.org/10.5194/acp-21-14109-2021, 2021.
Stein, A., Draxler, R. R., Rolph, G. D., Stunder, B. J., Cohen, M., and Ngan, F.: NOAA's HYSPLIT atmospheric transport and dispersion modeling system, B. Am. Meteorol. Soc., 96, 2059–2077, https://doi.org/10.1175/BAMS-D-14-00110.1, 2015.
Stevens, B. and Feingold, G.: Untangling aerosol effects on clouds and precipitation in a buffered system, Nature, 461, 607–613, https://doi.org/10.1038/nature08281, 2009.
Sullivan, R. C., Levy, R. C., da Silva, A. M., and Pryor, S. C.: Developing and diagnosing climate change indicators of regional aerosol optical properties, Sci. Rep., 7, 1–13, https://doi.org/10.1038/s41598-017-18402-x, 2017.
Tao, W. K., Chen, J. P., Li, Z., Wang, C., and Zhang, C.: Impact of aerosols on convective clouds and precipitation, Rev. Geophys., 50, RG2001, https://doi.org/10.1029/2011RG000369, 2012.
The MathWorks Inc.: MATLAB version: 9.10.0 (R2021a), The MathWorks Inc. [code], https://www.mathworks.com, 2020.
The MathWorks Inc.: MATLAB version: 9.14.0 (R2023a), The MathWorks Inc. [code], https://www.mathworks.com, 2022.
Tsay, S.-C., Hsu, N. C., Lau, W. K.-M., Li, C., Gabriel, P. M., Ji, Q., Holben, B. N., Welton, E. J., Nguyen, A. X., and Janjai, S.: From BASE-ASIA toward 7-SEAS: A satellite-surface perspective of boreal spring biomass-burning aerosols and clouds in Southeast Asia, Atmos. Environ., 78, 20–34, https://doi.org/10.1016/j.atmosenv.2012.12.013, 2013.
van Beelen, A. J., Roelofs, G. J. H., Hasekamp, O. P., Henzing, J. S., and Röckmann, T.: Estimation of aerosol water and chemical composition from AERONET Sun–sky radiometer measurements at Cabauw, the Netherlands, Atmos. Chem. Phys., 14, 5969–5987, https://doi.org/10.5194/acp-14-5969-2014, 2014.
Wall, C. J., Norris, J. R., Possner, A., McCoy, D. T., McCoy, I. L., and Lutsko, N. J.: Assessing effective radiative forcing from aerosol–cloud interactions over the global ocean, P. Natl. Acad. Sci. USA, 119, e2210481119, https://doi.org/10.1073/pnas.2210481119, 2022.
Wang, L., Lau, K.-H., Fung, C.-H., and Gan, J.-P.: The relative vorticity of ocean surface winds from the QuikSCAT satellite and its effects on the geneses of tropical cyclones in the South China Sea, Tellus A, 59, 562–569, https://doi.org/10.1111/j.1600-0870.2007.00249.x, 2007.
Wang, S.-H., Welton, E. J., Holben, B. N., Tsay, S.-C., Lin, N.-H., Giles, D., Stewart, S. A., Janjai, S., Nguyen, X. A., and Hsiao, T.-C.: Vertical distribution and columnar optical properties of springtime biomass-burning aerosols over Northern Indochina during 2014 7-SEAS campaign, Aerosol Air Qual. Res., 15, 2037–2050, https://doi.org/10.4209/aaqr.2015.05.0310, 2015.
Wu, M.-C. and Choy, C.-W.: An Observational Study of the Changes in the Intensity and Motion of Tropical Cyclones crossing Luzon, Tropical Cyclone Research and Review, 4, 95–109, https://doi.org/10.6057/2015TCRRh3.01, 2016.
Xian, P., Reid, J. S., Atwood, S. A., Johnson, R. S., Hyer, E. J., Westphal, D. L., and Sessions, W.: Smoke aerosol transport patterns over the Maritime Continent, Atmos. Res., 122, 469–485, https://doi.org/10.1016/j.atmosres.2012.05.006, 2013.
Xiao, N., Shi, T., Calder, C. A., Munroe, D. K., Berrett, C., Wolfinbarger, S., and Li, D.: Spatial characteristics of the difference between MISR and MODIS aerosol optical depth retrievals over mainland Southeast Asia, Remote Sens. Environ., 113, 1–9, https://doi.org/10.1016/j.rse.2008.07.011, 2009.
Xie, Y., Li, Z., Zhang, Y., Zhang, Y., Li, D., Li, K., Xu, H., Zhang, Y., Wang, Y., and Chen, X.: Estimation of atmospheric aerosol composition from ground-based remote sensing measurements of Sun-sky radiometer, J. Geophys. Res.-Atmos., 122, 498–518, https://doi.org/10.1002/2016JD025839, 2017.
Yang, S., Lau, W. K., Ji, Z., Dong, W., and Yang, S.: Impacts of radiative effect of pre-monsoon biomass burning aerosols on atmospheric circulation and rainfall over Southeast Asia and southern China, Clim. Dynam., 59, 417–432, https://doi.org/10.1007/s00382-021-06135-7, 2022.
Yumul Jr., G. P., Cruz, N. A., Dimalanta, C. B., Servando, N. T., and Hilario, F. D.: The 2007 dry spell in Luzon (Philippines): its cause, impact and corresponding response measures, Clim. Change, 100, 633–644, https://doi.org/10.1007/s10584-009-9677-0, 2010.
Zhao, G., Di Girolamo, L., Dey, S., Jones, A. L., and Bull, M.: Examination of direct cumulus contamination on MISR-retrieved aerosol optical depth and angstrom coefficient over ocean, Geophys. Res. Lett., 36, L13811, https://doi.org/10.1029/2009GL038549, 2009.
Zhao, G., Zhao, C., Kuang, Y., Bian, Y., Tao, J., Shen, C., and Yu, Y.: Calculating the aerosol asymmetry factor based on measurements from the humidified nephelometer system, Atmos. Chem. Phys., 18, 9049–9060, https://doi.org/10.5194/acp-18-9049-2018, 2018.