the Creative Commons Attribution 4.0 License.
the Creative Commons Attribution 4.0 License.
 | 20 Sep 2023
Evaluation of hygroscopic cloud seeding in warm-rain processes by a hybrid microphysics scheme using a Weather Research and Forecasting (WRF) model: a real case study
Kai-I Lin
Kao-Shen Chung
Sheng-Hsiang Wang
Li-Hsin Chen
Yu-Chieng Liou
Pay-Liam Lin
Wei-Yu Chang
Hsien-Jung Chiu
Yi-Hui Chang
To evaluate the hygroscopic cloud seeding in reality, this study develops a hybrid microphysics scheme using a Weather Research and Forecasting (WRF) model, WDM6-NCU (WDM6 modified by National Central University), which involves 43 bins of seeded cloud condensation nuclei (CCN) in the WDM6 bulk method scheme. This scheme can describe the size distribution of seeded CCN and explain the process of the CCN imbedding and cloud and raindrop formation in detail. Furthermore, based on the observational CCN size distribution applied in the modelling, a series of tests on cloud seeding were conducted during the seeding periods of 21–22 October 2020 with stratocumulus clouds. The model simulation results reveal that seeding in in-cloud regions with an appropriate CCN size distribution can yield greater rainfall and that spreading the seeding agents over an area of 40–60 km2 is the most efficient strategy to create a sufficient precipitation rate. With regard to the microphysical processes, the main process that causes the enhancement of precipitation is the strengthening of the accretion process of raindrops. In addition, hygroscopic particles larger than 0.4 µm primarily contribute to cloud-seeding effects. The study results could be used as references for model development and warm-cloud-seeding operations.
- Article
(16303 KB) - Full-text XML
- BibTeX
- EndNote


Global warming has made droughts much more frequent (Bo-Tao and Jin, 2021). In 2021, for the first time in a century, Taiwan experienced the most severe drought, which prompted the government to identify methods to address water scarcity problems with utmost urgency. Cloud seeding, a common method of weather modification, appears to be a possible means to creating more water resources. According to Lelieveld (1993), 80 % of cloud droplets are unable to reach the ground, which indicates inefficiency in the transformation of cloud droplets to raindrops. Thus, since the 20th century, cloud-seeding research has been expanding. However, no single cloud-seeding strategy can be applied worldwide because environmental conditions differ between countries. Two main strategies of cloud seeding are frequently adopted: ice-cloud seeding (Seto et al., 2011; Geresdi et al., 2017; Tessendorf et al., 2019; Wang et al., 2021) and warm-cloud seeding (Jung et al., 2015; Wang et al., 2019; Tonttila et al., 2021; Tessendorf et al., 2021).
During the dry season (i.e. October to April) in Taiwan, clouds tend to be warm and relatively thin, with a cloud base of approximately 500 m above mean sea level (Chen et al., 1995; Kueh and Lin, 2013). In addition, due to the prevailing north-easterly wind, weather systems persist for a long time, and large amounts of water vapour are supplied. Therefore, warm-cloud seeding is more appropriate for use in Taiwan. Hygroscopic cloud seeding is a type of warm-cloud seeding and has been used in Taiwan. In warm clouds, giant cloud condensation nuclei (GCCN: diameter > 1 µm) in turn increase the mean droplet diameter and increase the precipitation amount (Lehahn et al., 2011; Dadashazar et al., 2017; Feingold et al., 1999; Jensen and Lee, 2008; Jensen and Nugent, 2017). The seeding agents used in hygroscopic cloud seeding serve as efficient cloud condensation nuclei (CCN) or GCCN and play a crucial role in strengthening the condensation and collision–coalescence process, thereby widening the droplet size distribution (DSD) and increasing the precipitation efficiency (Jensen and Lee, 2008; Jung et al., 2015; Tessendorf et al., 2021). The process from the spreading of seeding agents to development of rainfall takes approximately 10–20 min (Silverman and Sukarnjanaset, 2000; Tonttila et al., 2021). However, despite the availability of clearly elaborated theories related to hygroscopic cloud seeding, scientific evidence on the seeding effects and the efficiency of the strategy is scarce.
The effects of cloud seeding have been mainly verified using a statistical approach, which is based on the comparison of multiple observational samples with seeding and nonseeding scenarios (Gagin and Neumann, 1981; Silverman and Sukarnjanaset, 2000). However, this method may involve high uncertainty due to the difficulties of conducting long-term, consistent, and randomized cloud-seeding experiments (Guo et al., 2015; Wang et al., 2019). Recently, due to advances in observation methods, a greater variety of instruments, such as cloud radars and cloud droplet probes, have been used to investigate cloud-seeding effects and obtain direct observational evidence. Until now, comprehensive evidence has not been fully investigated because determining whether the precipitation signal is due to cloud seeding or to meteorological variations is difficult (Kerr, 1982; Mather et al., 1997; Silverman, 2003; Flossmann et al., 2019; Tonttila et al., 2021).
Model simulation can be used to efficiently generate several realizations of each scenario and has the advantage of separating the cloud-seeding signal from its natural counterpart. Caro et al. (2002) concluded that hygroscopic particles with a radius between 0.5 and 6 µm are optimal for enhancing precipitation in warm clouds. Segal et al. (2004) reported that hygroscopic cloud seeding with particles with diameters of 1.5–2.5 µm lead to considerable increments of precipitation. Cloud seeding with giant CCN strengthens the autoconversion and the accretion process, leading to an enhancement of precipitation (Tonttila et al., 2021). However, most studies on warm-cloud-seeding simulation have performed simulations by using a one-dimensional cloud parcel model or by using ideal cases (Cooper et al., 1997; Caro et al., 2002; Segal et al., 2004; Chen et al., 2020; Tessendorf et al., 2021; Tonttila et al., 2021), which may not accurately reflect actual environmental conditions.
The present study evaluates the effects of cloud seeding on a realistic environment of northern Taiwan by using a Weather Research and Forecasting (WRF) model with a hybrid microphysics scheme to yield more accurate results of cloud seeding without incurring overly large computational costs. In addition, the effective strategies were mapped by conducting a series of cloud-seeding sensitivity tests. The remainder of the article is organized as follows. Section 2 describes the main characteristics of microphysics schemes, WDM6 and WDM6-NCU, and Sect. 3 presents the modelling settings and experiment design. Finally, Sects. 4 and 5 present the study results and a discussion.
This study uses the fully compressible and nonhydrostatic WRF model version 3.9.1 to simulate three-dimensional meteorological parameters. The WRF model employs a terrain-following coordinate (eta), which allows the grids to follow the complex terrain, and the third-order Runge–Kutta numerical method is used for solving the time split integration of the governing equation. In addition, the Arakawa C grid is used in the simulations, which leads to the arrangement of thermal parameters at the centre grids and that of wind speed variables at the staggered grids. With regard to CCN and cloud microphysics, the WDM6-NCU microphysics scheme, which is modified from WDM6 by NCU, is used to represent the properties of CCN, clouds, and rain.
2.1 WDM6
WDM6 (Lim and Hong, 2010) is a semi-double-moment bulk microphysics scheme, which predicts not only the mixing ratio of the hydrometeors such as cloud droplets and raindrops but also their number concentrations. The cloud–raindrop size distribution is given as follows:
where x represents the type of hydrometeor, including clouds and rain. λx, μx, and αx are the slope parameter and two dispersion parameters, respectively, and Nx and Dx represent the predicted value of the total number concentration and diameter of the certain hydrometeor category. Moreover, the dispersion parameters of rain μR and αR are set as 2 and 1, which provides the advantage of simulating a more reasonable raindrop shape and size distribution.
Moreover, to evaluate the effect of CCN, the relationship between the number of activated CCN (na) and the supersaturation (Sw) is used in WDM6 as follows (Twomey's relationship):
where n, Nc, and Smax are the total CCN number concentration, cloud droplet number concentration, and supersaturation required to activate the total particle count, respectively. In Eq. (2), k typically ranges from 0.3 to 1.0. In addition, the production rate for the cloud water mixing ratio by CCN activation (Pcact) can be expressed as
where ρw and ρa are the density of water and air, respectively. In Eq. (3), ract is the radius of the activated droplets, which is set at a fixed value (1.5 µm) in WDM6. Microphysics schemes are seldom able to describe CCN effects, and this advantage of the WDM6 scheme enables the simulation of cloud seeding in a more realistic environment with a specific CCN size.
2.2 WDM6-NCU
The effects of cloud seeding are highly dependent on the CCN size distribution (Caro et al., 2002; Segal et al., 2004). Therefore, in the improved WDM6-NCU microphysics scheme with the bin-resolving method, the seeded CCN are described using mass-doubling aerosol bins of 43 sizes, the radius ranging from 0.001 to 20 µm, to evaluate the effects of CCN. Figure 1 displays the schematic of the two methods used to describe aerosol size distribution. In addition, the size distribution of the seeded CCN is based on observation and is fitted into a trimodal lognormal function as follows:
where rn, ni, Ri, and σi are the radius of the particle, total number concentration, geometric mean radius, and geometric standard deviation for each mode (indicated by subscript i), respectively. The complete CCN size distribution can be used to accurately calculate the critical radius based on Köhler theory (Köhler, 1936), and the bins of CCN whose size extends the critical radius will be able to activate the corresponding liquid bins with a CCN radius that is 5 times larger, ranging from 2 to 32 700 µm (Lee and Baik, 2018; Kogan, 1991). The critical radius (rcr) is expressed as follows:
where A is the parameter related to temperature, B is the parameter whose value differs between chemicals, and Sw represents the supersaturation ratio. After the number concentration and mixing ratio of the liquid bins are calculated, they are used in the calculation of the mixing ratio and number concentration of clouds (radius ≤ 40 µm) and rain (radius > 40 µm), and the microphysics processes continue, as is the case in the original WDM6. The schematic of WDM6-NCU is shown in Fig. 2. This scheme can reveal the fact that large CCN become large cloud droplets in the bin part, and the activation process can contribute to the number concentration and mixing ratio of clouds and rain to couple the bin part to the bulk part. Figure 3 illustrates the cloud-seeding effects on droplet size as a model applying the bin and bulk methods for cloud seeding with the same number concentration (200 cm−3). The GCCN size distribution of the Chemical Systems Research Division (CSRD; shown in Sect. 3.2) was seeded with the bin method, and fixed-size CCN with 1.2 µm (the mean diameter of GCCN of the CSRD) were seeded with the bulk method. Results show that the mean-volume-drop diameter of clouds (Dc) and mean-volume-drop diameter of rain (Dr) are considerably larger than those obtained in seeding as modelled using the bulk method. This is because in contrast to the bulk method, the bin method accounts for the complete seeded-CCN size distribution but does not have a fixed CCN size. Thus, the WDM6-NCU accounts for CCN effects to yield more accurate results without incurring overly large computational costs.
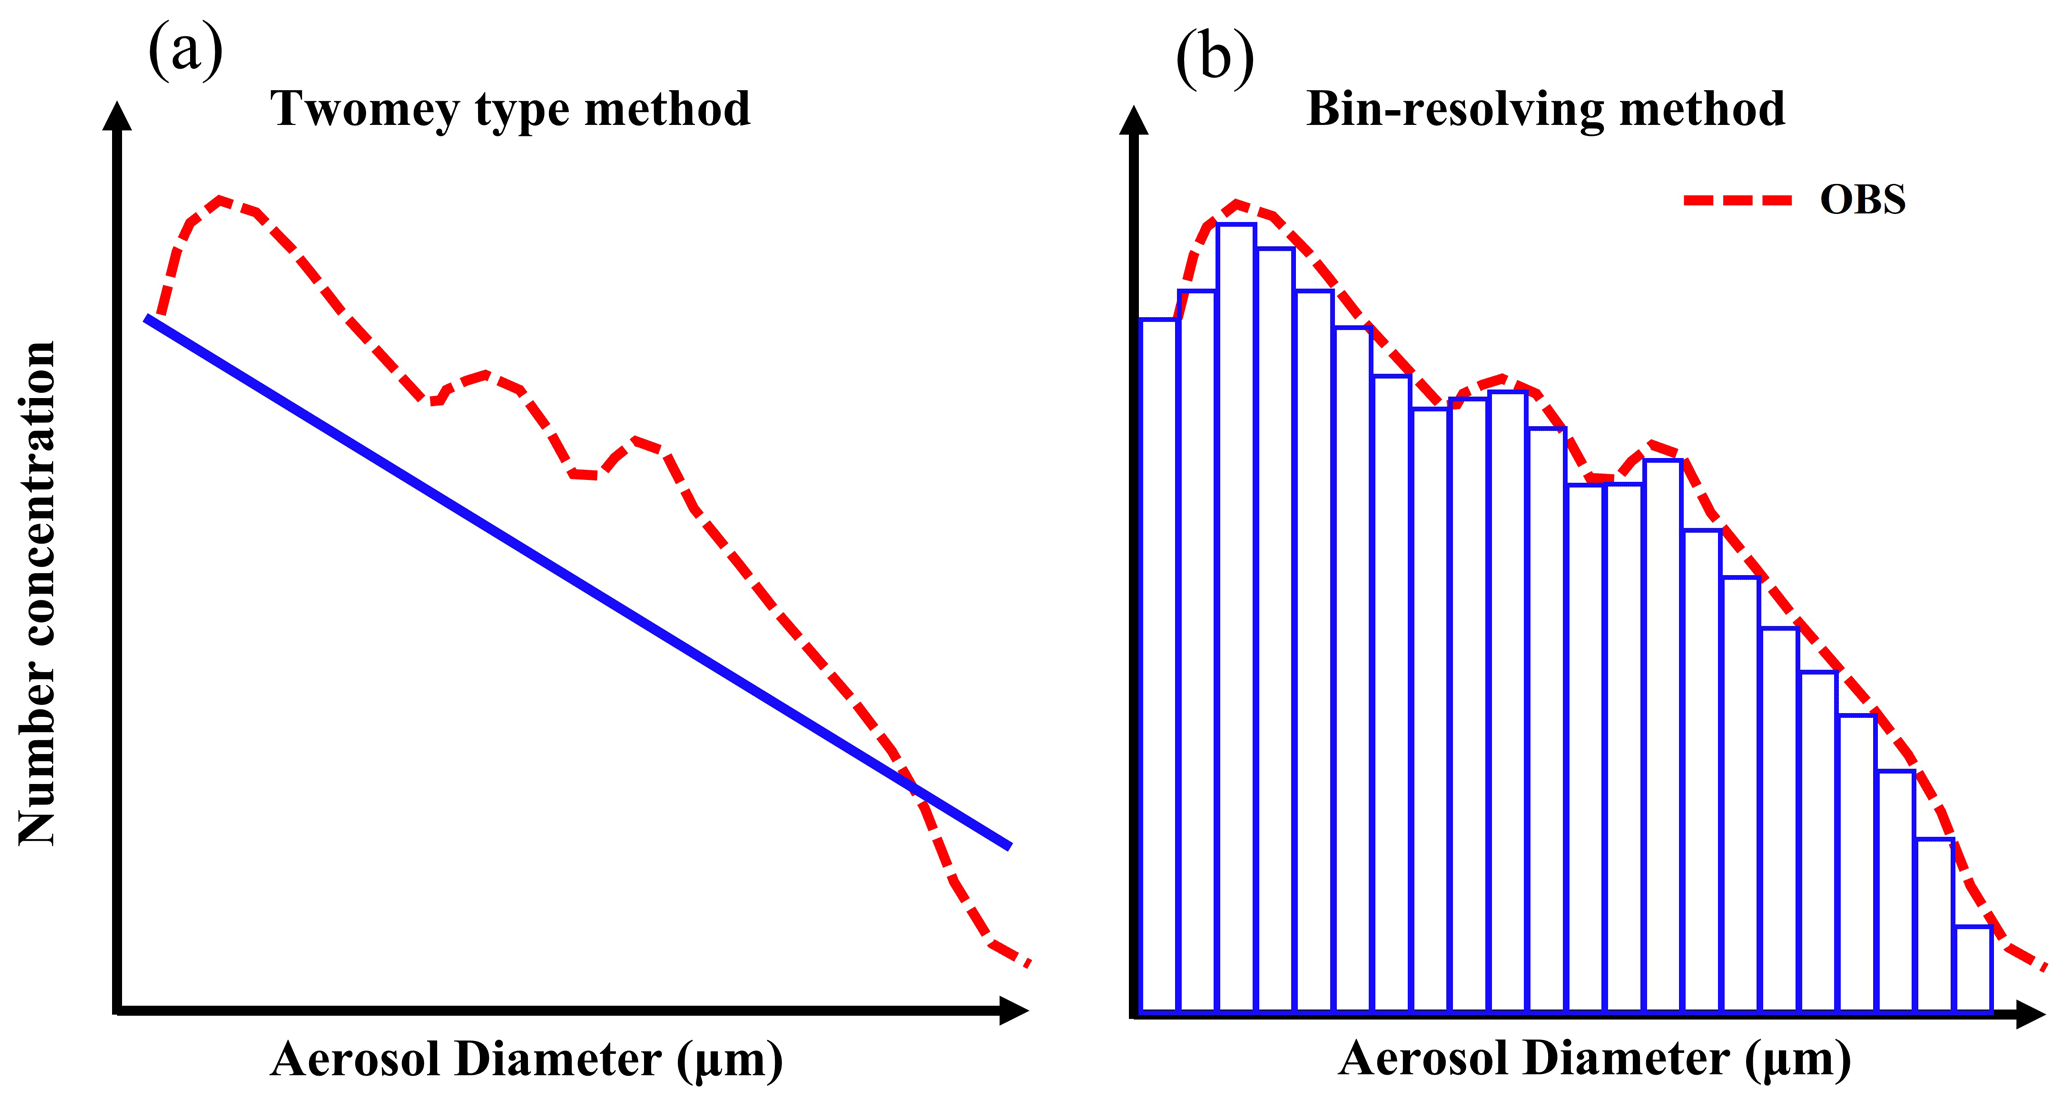
Figure 1The schematic illustrates two methods for determining aerosol size distribution: (a) the Twomey method is used in WDM6, and (b) the bin-resolving method is used in WDM6-NCU. The blue line and bars present two different methods with which the model simulation describes the CCN size distribution, and the dashed red line shows the observational CCN size distribution.
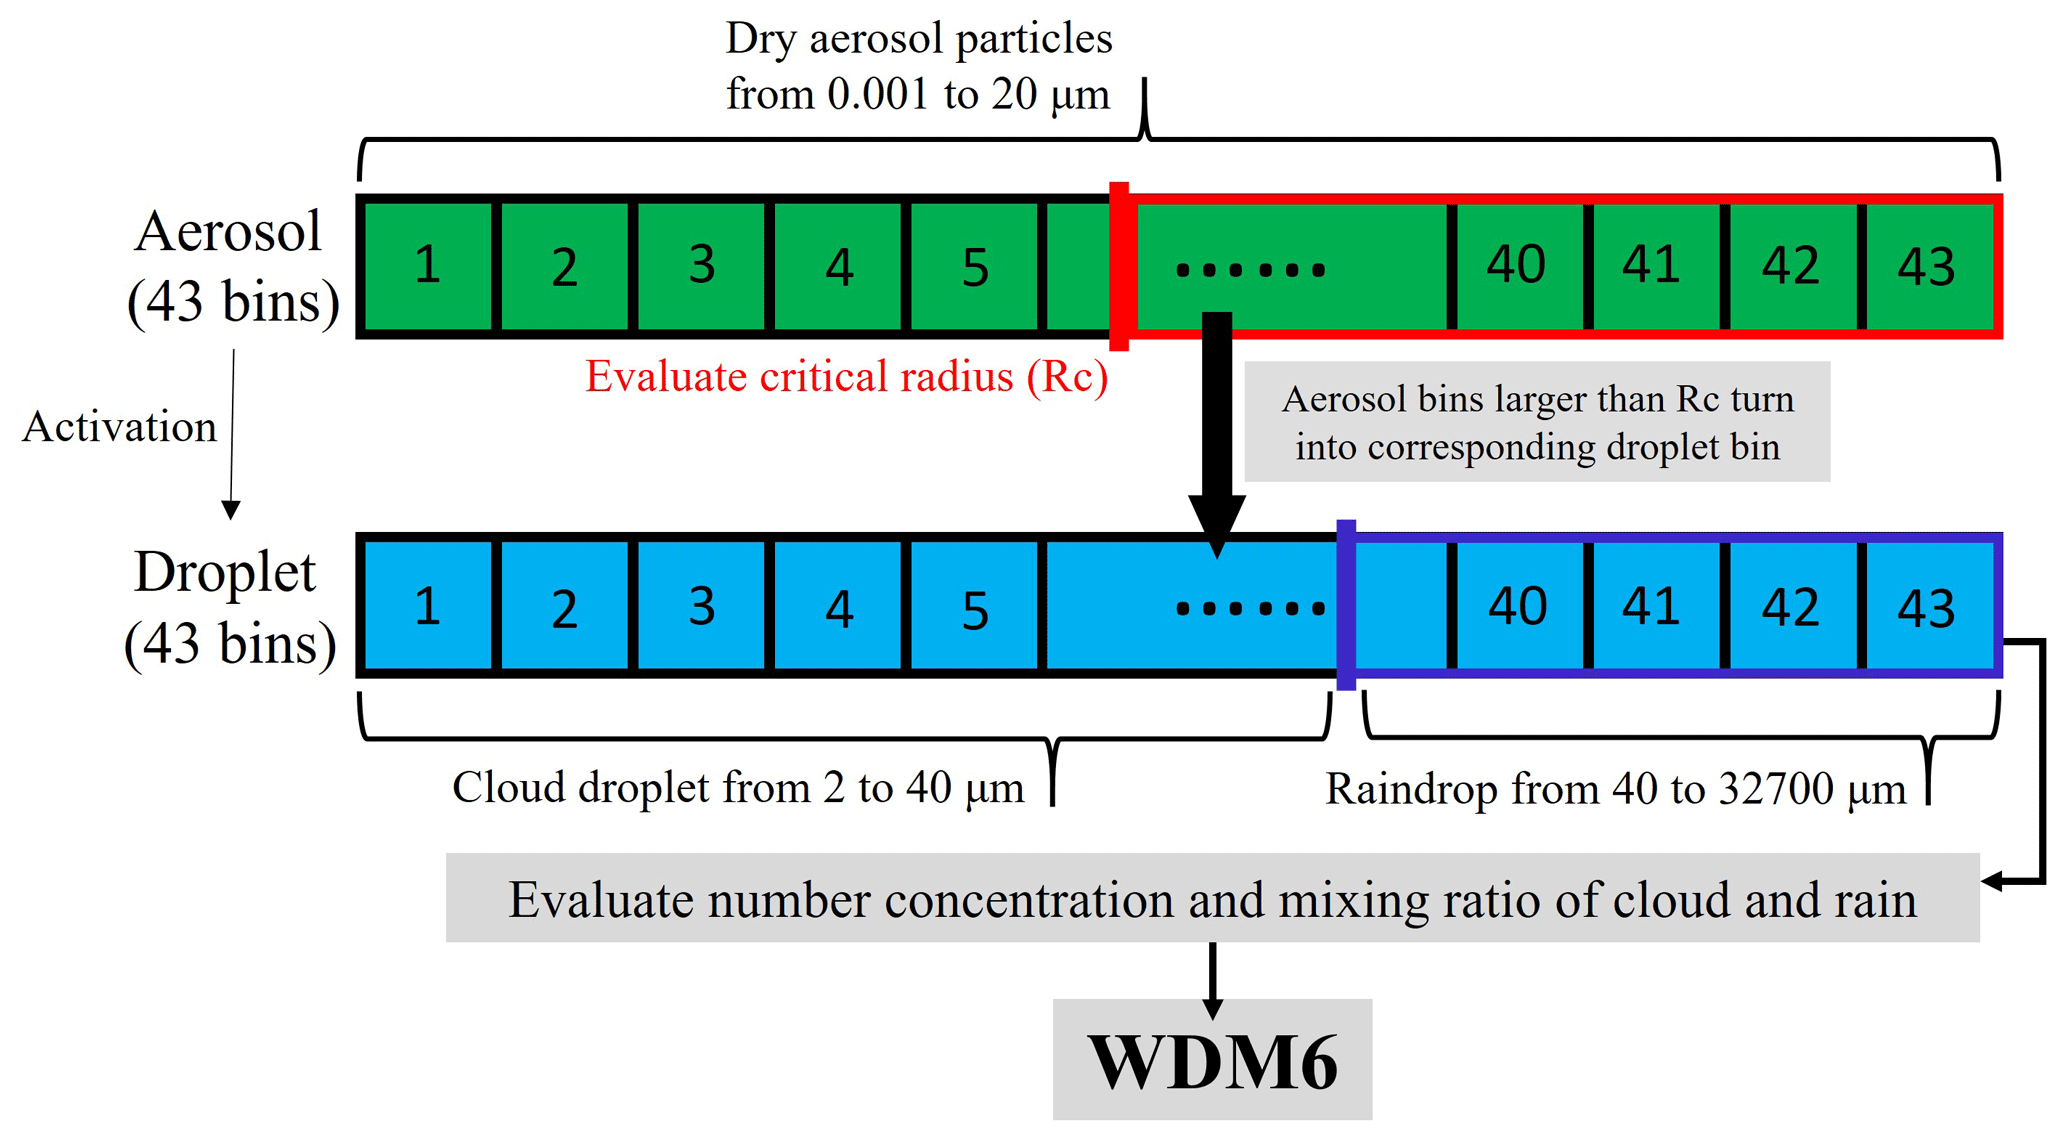
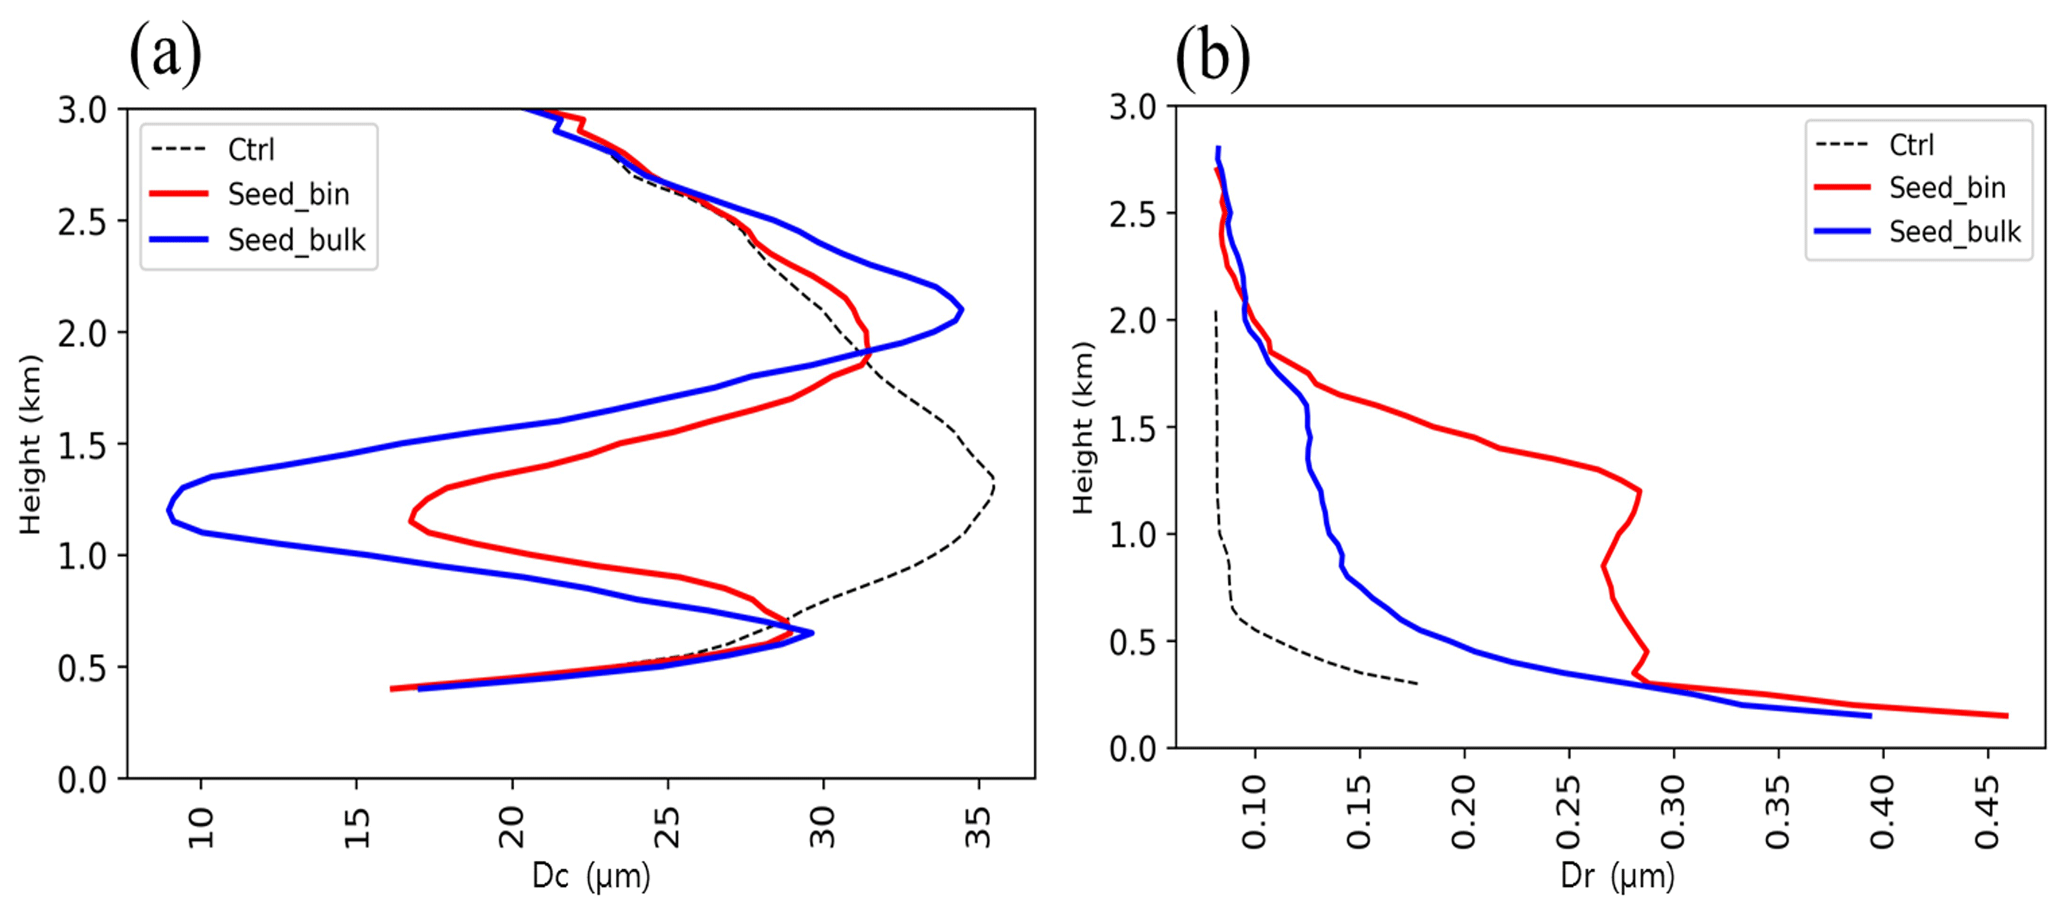
Figure 3Vertical profile of average (a) Dc and (b) Dr of the control run (Ctrl; without cloud seeding) and two seed runs in which seeding was done with the bin and bulk methods with the same number concentration (200 cm−3). The GCCN size distribution of the Chemical Systems Research Division (CSRD; shown in Sect. 3.2) was seeded with the bin method, and CCN with a fixed size of 1.2 µm (the mean diameter of GCCN of the CSRD) were seeded with the bulk method.
We implement hygroscopic cloud seeding with the stratocumulus clouds resulting from the stronger north-easterly winds as our target. In this study, the hygroscopic cloud-seeding effects are investigated for the case of 21–22 October 2020. From 21–22 October 2020, Typhoon Saudel was located in south-western Taiwan and accompanied the co-movement of the north-eastern monsoon, which caused the occurrence of stronger north-easterly winds and brought large amounts of water vapour to northern Taiwan. According to the weather map and a skew-T diagram, the environment was saturated below the mean sea level height of approximately 2000 m at 00:00 UTC on 22 October 2020.
3.1 Model configuration
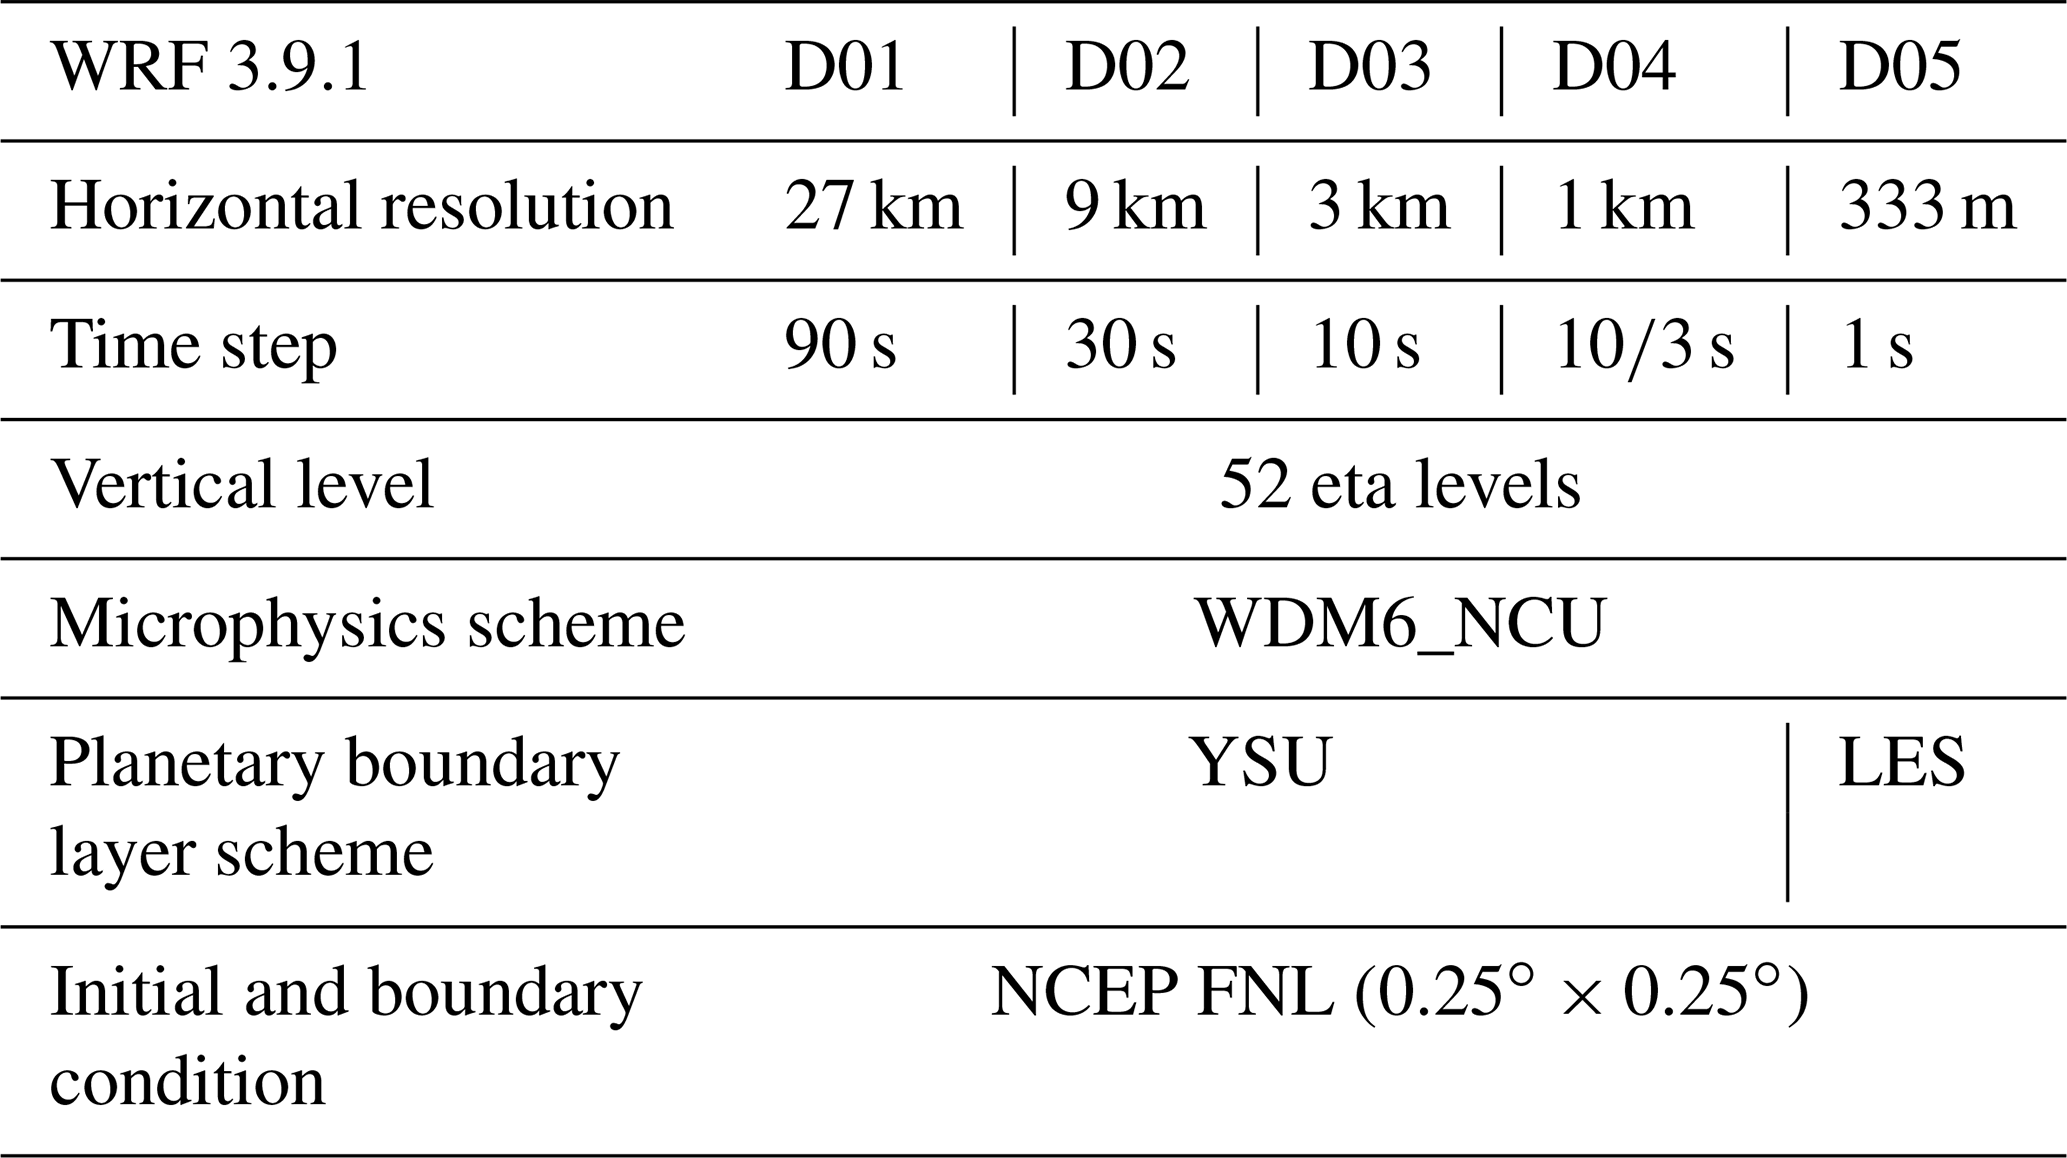
Five nested domains are constructed (Fig. 4a) with 52 vertical levels below 10 hPa and horizontal resolutions of 27, 9, 3, 1, and 0.333 km corresponding to 190 × 151, 301 × 250, 301 × 301, 271 × 406, and 202 × 202, respectively. Moreover, the initial and boundary conditions are generated from the National Centers for Environmental Prediction Final (NCEP FNL) operational global analysis and forecast data at a resolution of 0.25∘. For the first to fourth domains (D01–D04), the simulation is integrated from 21 October 2020 at 12:00 UTC to 22 October 2020 at 12:00 UTC with a time step of 90, 30, 10, and 3.333 s, respectively. However, for the fifth domain (D05), the simulation is conducted from 06:00 UTC on 22 October 2020 to 09:00 UTC on 22 October 2020, with a time step of 1 s.
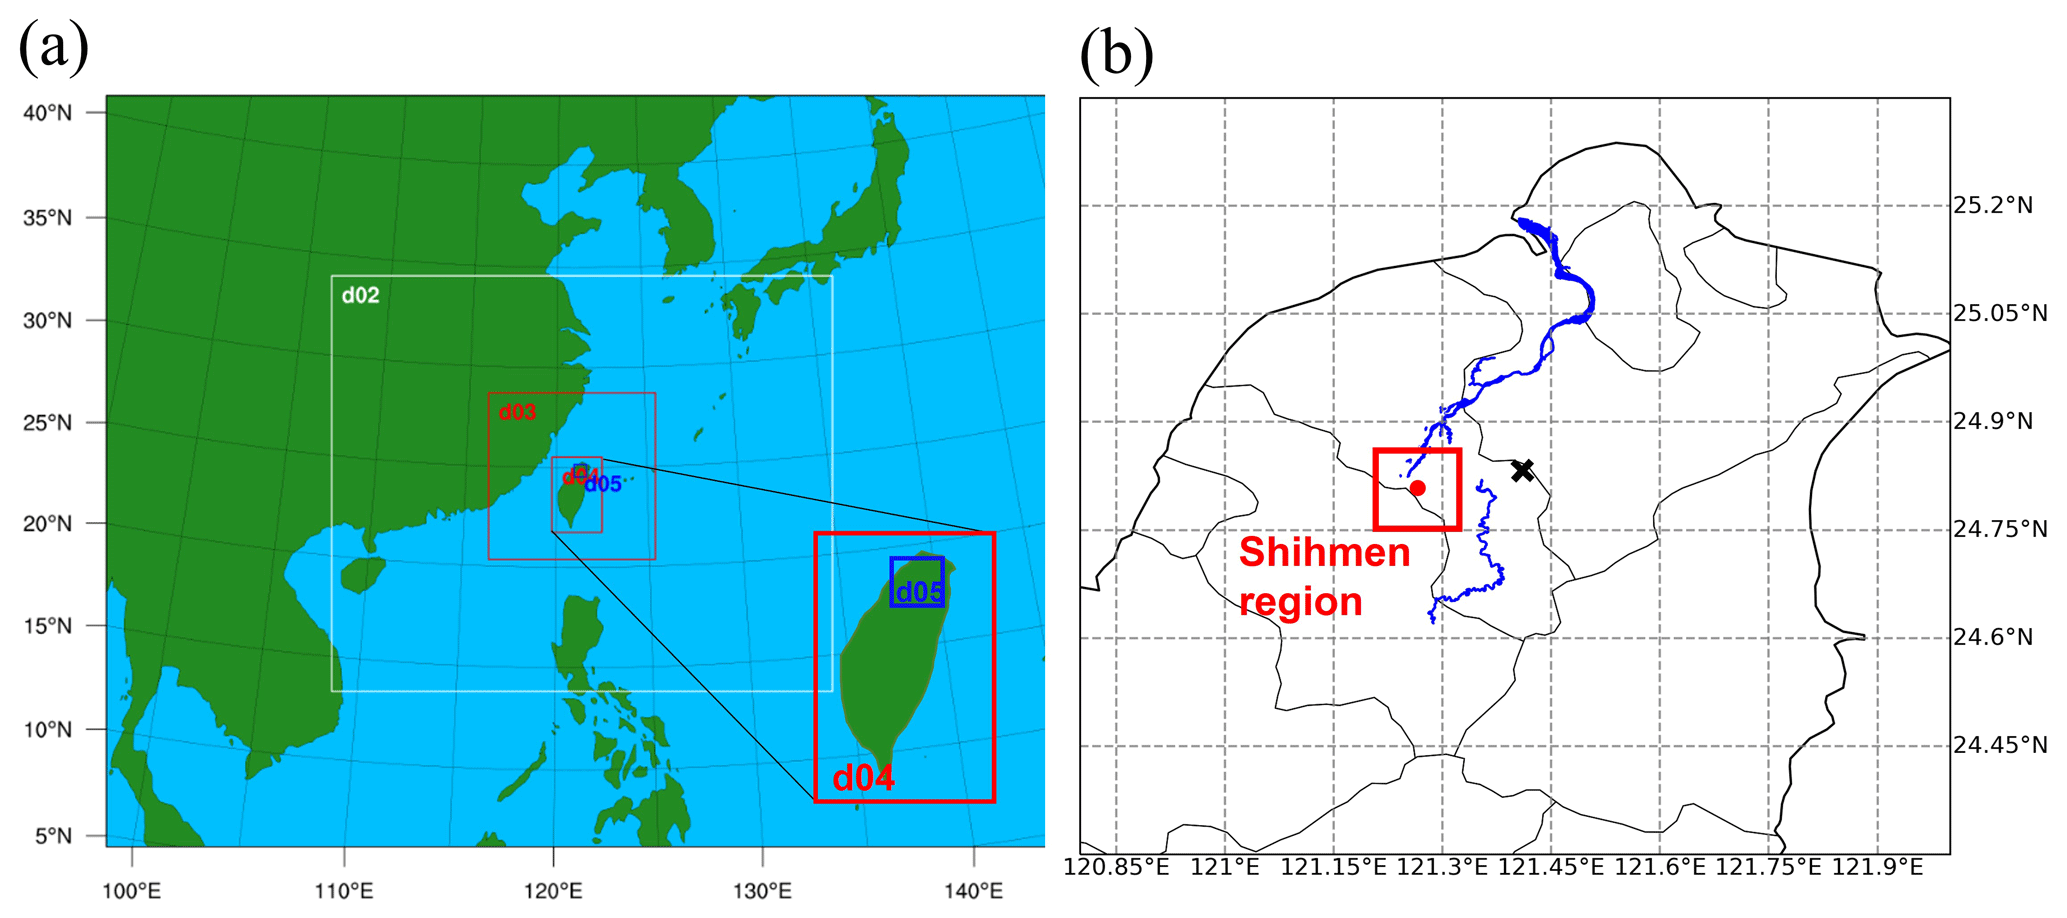
Figure 4(a) Setting of the nested domain and construction of five nested domains. (b) Location of the Shihmen region. The red rectangle in (b) represents the Shihmen region, and the rivers shown on the map are the Dahan River and Danshui River. The black X presents the location of the Dongyan Mountain site.
The physical parameterizations used in this study include the rapid radiative transfer model (RRTM) long-wave scheme (Mlawer et al., 1997), Dudhia short-wave scheme (Dudhia, 1989), Yonsei University (YSU) planet boundary scheme (Hong et al., 2006), Grell–Dévényi ensemble cumulus scheme (Grell and Dévényi, 2002), Monin–Obukhov land surface scheme (Monin and Obukhov, 1954), and WRF double-moment six-category scheme (Lim and Hong, 2010) modified with the WDM6-NCU microphysics scheme. The cumulus scheme is only used in D01 and D02. Regarding the planet boundary scheme, YSU is used in D01–D04, and large eddy simulation (LES) is used in D05. Table 1 presents a summary of the model configurations. According to Weigel et al. (2007) and Xue et al. (2014), simulations with a high-resolution LES (resolution < 800 m) can efficiently reproduce flow characteristics over a complex terrain. Thus, the simulation conducted in this study should more accurately reflect actual conditions.
3.2 Characterization of CCN size distribution
The size distribution of CCN considerably affects the cloud microphysics processes. Several studies have reported that cloud features and precipitation level are dependent on CCN size (Yin et al., 2000; Bruintjes et al., 2003; Segal et al., 2004; Rosenfeld et al., 2008, 2014; Guo et al., 2016; Lee et al., 2016). According to previous research, larger CCN (> 2 µm) are optimal for increasing precipitation, while a high concentration of small CCN can suppress rainfall or postpone the onset of precipitation. Therefore, it is crucial to treat CCN size distribution more realistically in the cloud-seeding experiment for both observation and model simulation. In this study, we conducted a chamber experiment to characterize CCN size distribution. The flare agent we used in the chamber was provided by the Chemical Systems Research Division (CSRD), National Chung-Shan Institute of Science and Technology, which has invested in the flare agent for cloud-seeding operations in Taiwan.
Based on an evaluation of 200 samples of CSRD flare seeding agents by using an aerosol spectrometer (Grimm 11-D), the size distribution can be evaluated and fitted as the sum of the three lognormal modes in the model simulation, as shown in Fig. 5, with the constraining parameters of each mode for the total number concentration (N), geometric mean diameter (D), and geometric standard deviation (σ) listed in the text box. In addition, the composition of the CSRD seeding agent is mainly sea salt, which is also characterized in WDM6-NCU. Thus, the simulation conducted in this study has the potential to accurately reflect actual CCN microphysics. In our practical operation, hygroscopic cloud seeding is conducted using drones that carry 10 CSRD flare seeding agents in 10 min (seeding rate: 2.03 × 104 cm−3 s−1), affording greater flexibility in seeding height. However, information for determining the most effective cloud-seeding operation is lacking. Therefore, in the following section, we use a modelling approach and conduct a series of simulations with several scenarios of 10 min cloud-seeding processes by using 10 CSRD flare seeding agents to evaluate the cloud-seeding effects for different seeding heights, seeding areas, and seeding concentrations.
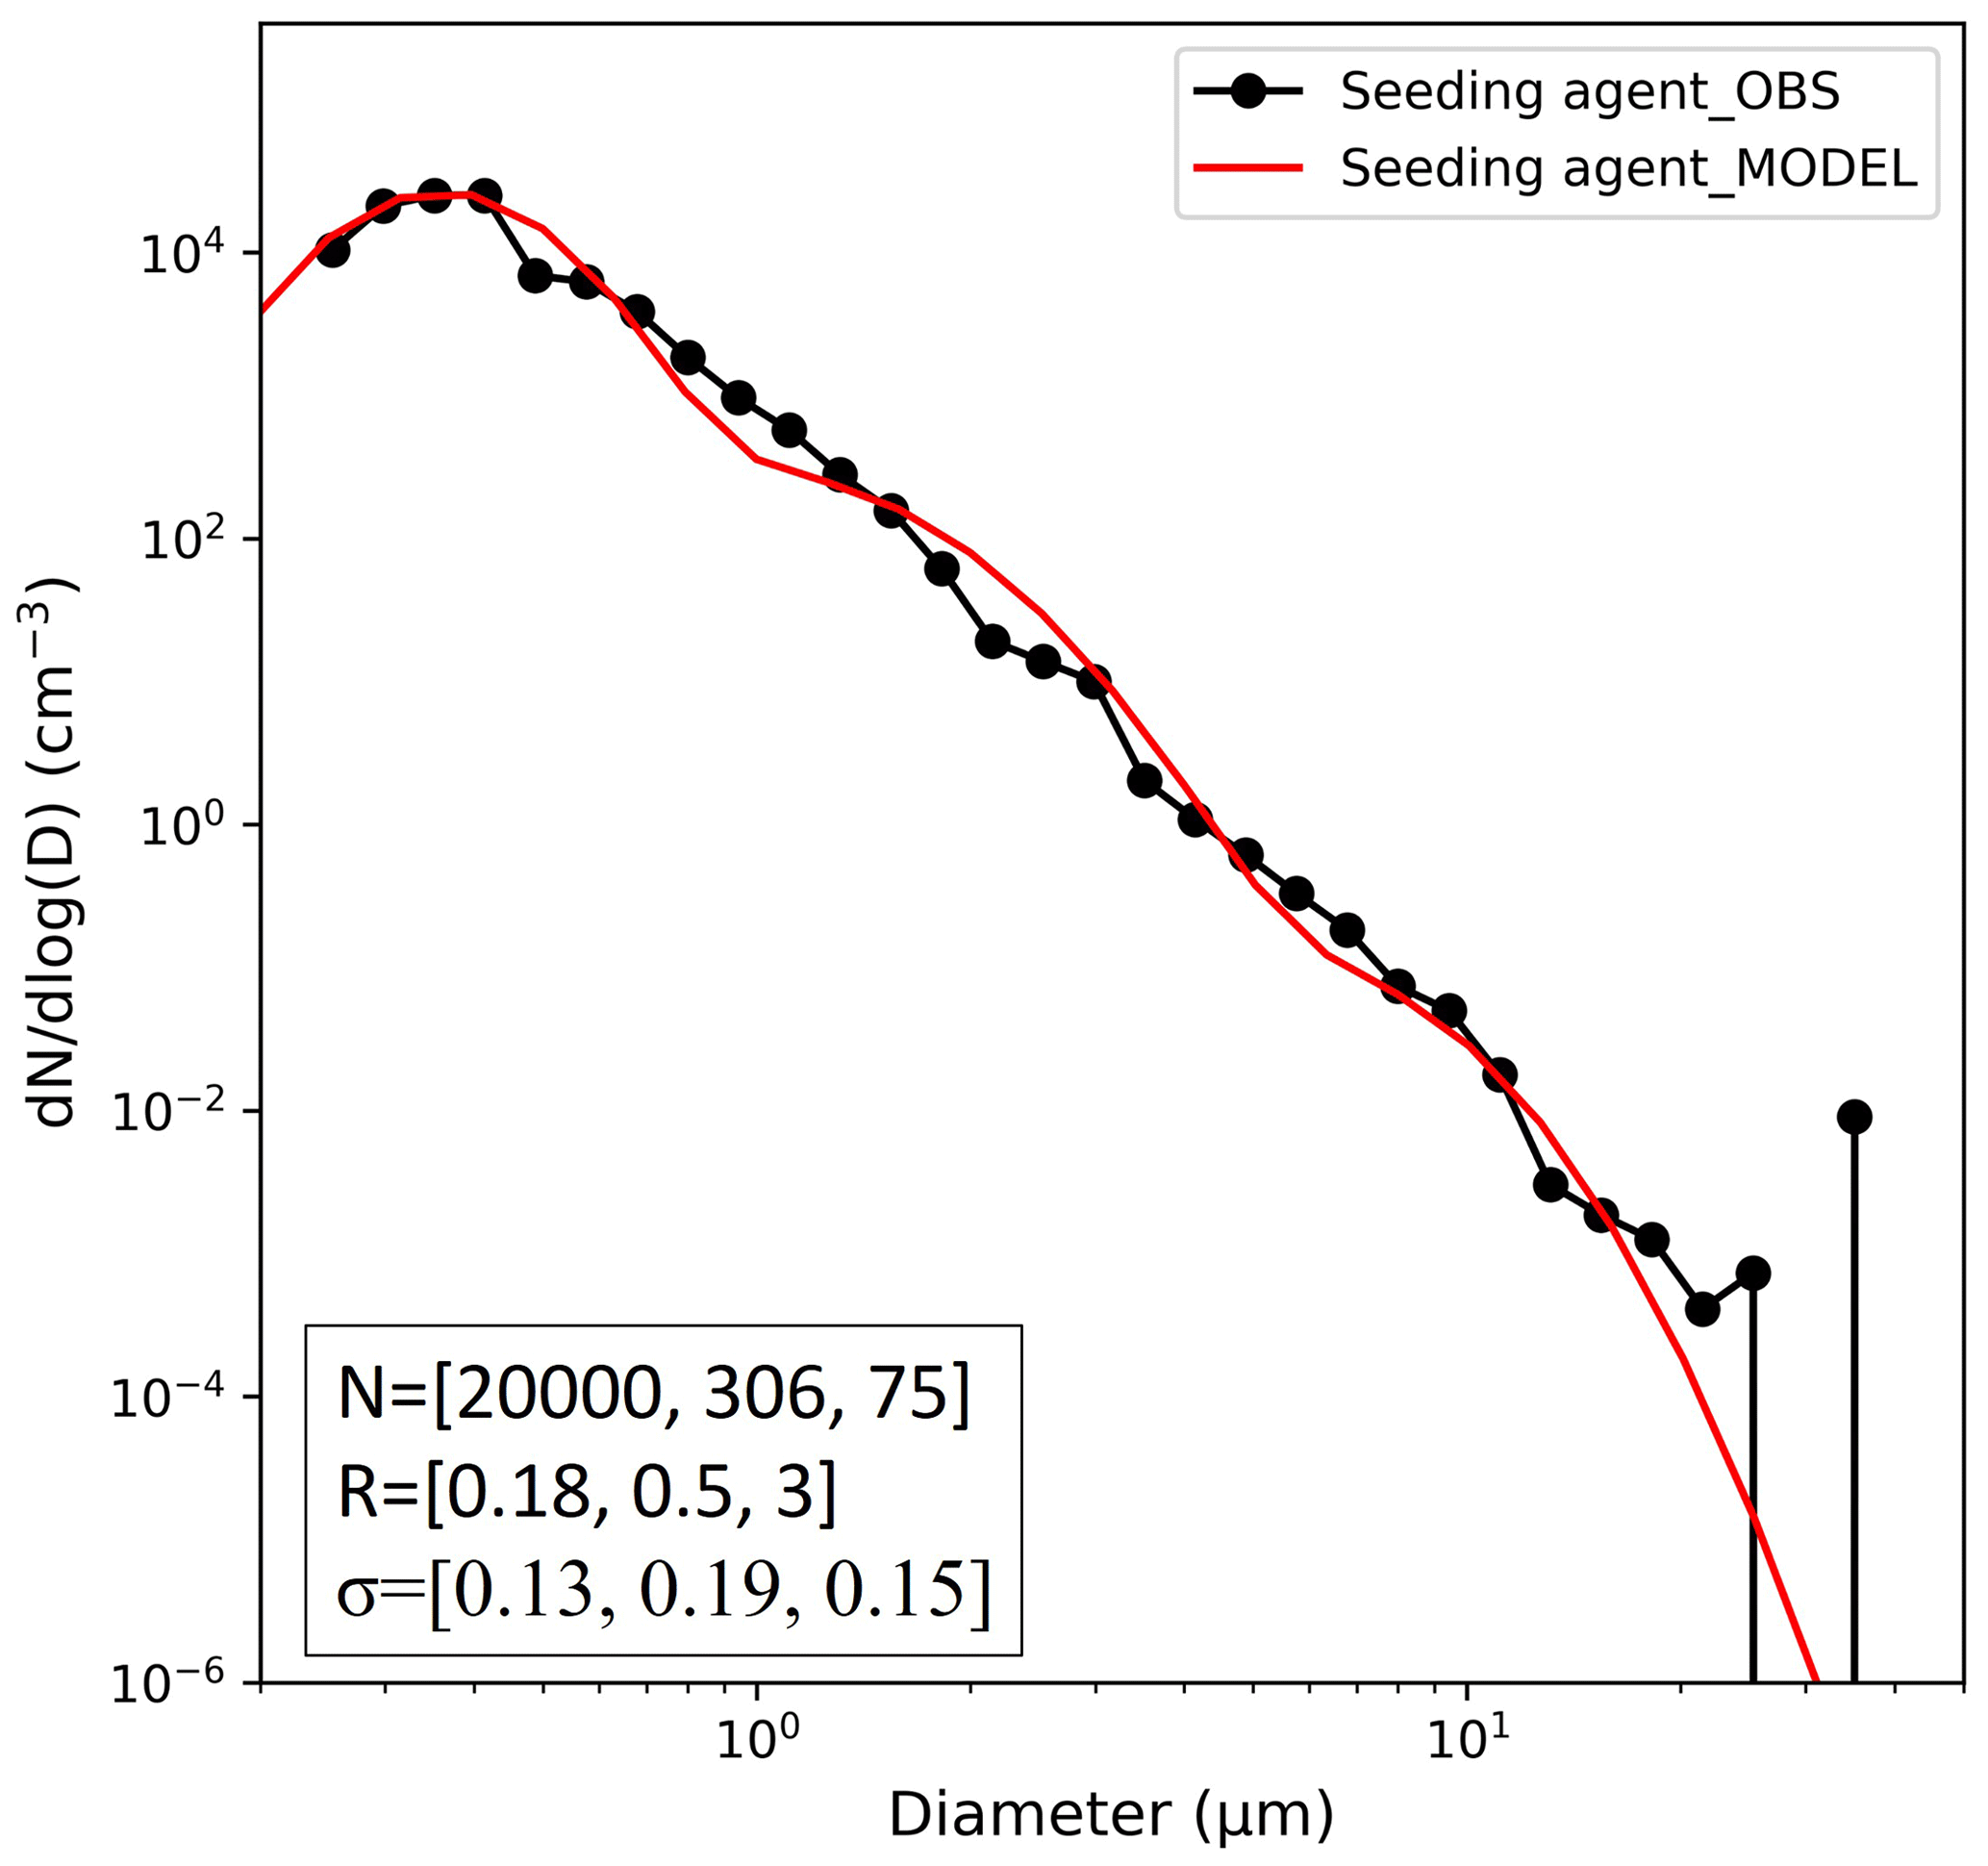
Figure 5CCN size distribution (red line) based on the observation result (black line), which is employed in the model simulation which follows the lognormal distribution with the constraining parameters of each mode for the total number concentration (N), geometric mean diameter (D), and geometric standard deviation (σ) listed in the text box.
3.3 Experimental design
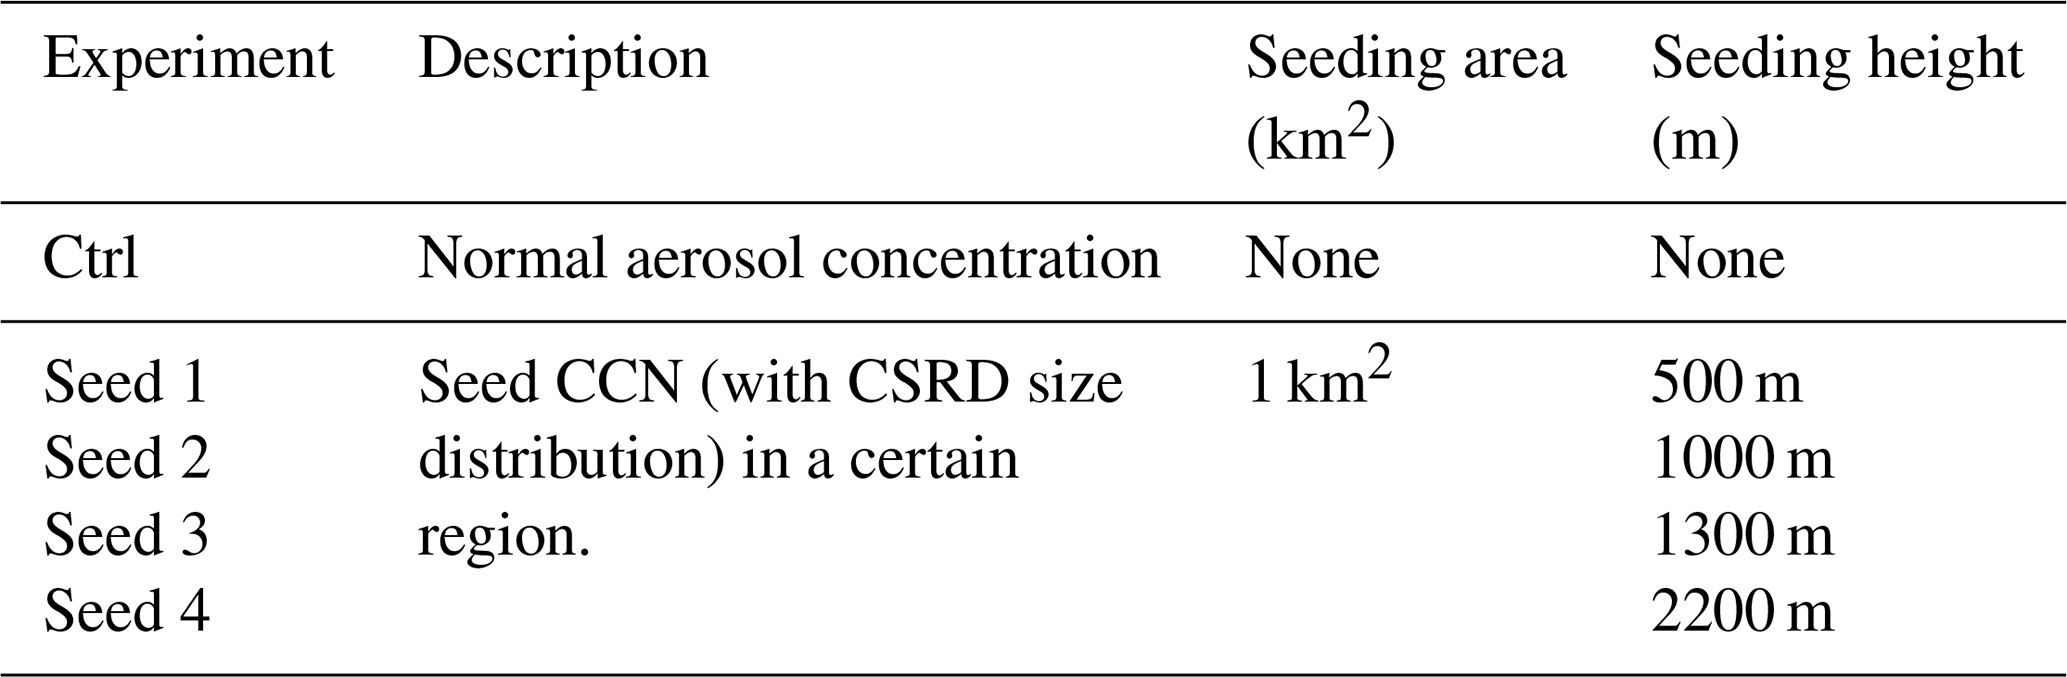
Two parallel sets of experiments, namely a control simulation without seeding (control run) and a set of experiments with the emission of seeding agents (seed run), with seeding starting on 22 October 2020 at 06:30 UTC in the Shihmen Reservoir (24.81∘ N, 121.26∘ E) and with the CSRD size distribution, were designed to analyse the effects of aerosol perturbation. In the seed run, we further examine the effects of cloud seeding at different heights and in different areas of the Shihmen region (Fig. 4b). In domain four (D04; 1 km horizontal resolution), five simulations are formulated, namely one control run (Ctrl) and four seed runs (Seed 1 to Seed 4), to investigate the effects of cloud seeding in one horizontal grid (1 km × 1 km) but at different seeding levels. In Seed 1, the cloud seeding is conducted at approximately 500 m above mean sea level, which is close to the cloud base according to sounding and model simulation data. Seeds 2 and 3 involve simulated seeding between 1000 and 2000 m, and Seed 4 involves seeding at approximately 2200 m. The model experiments in D04 are summarized in Table 2.
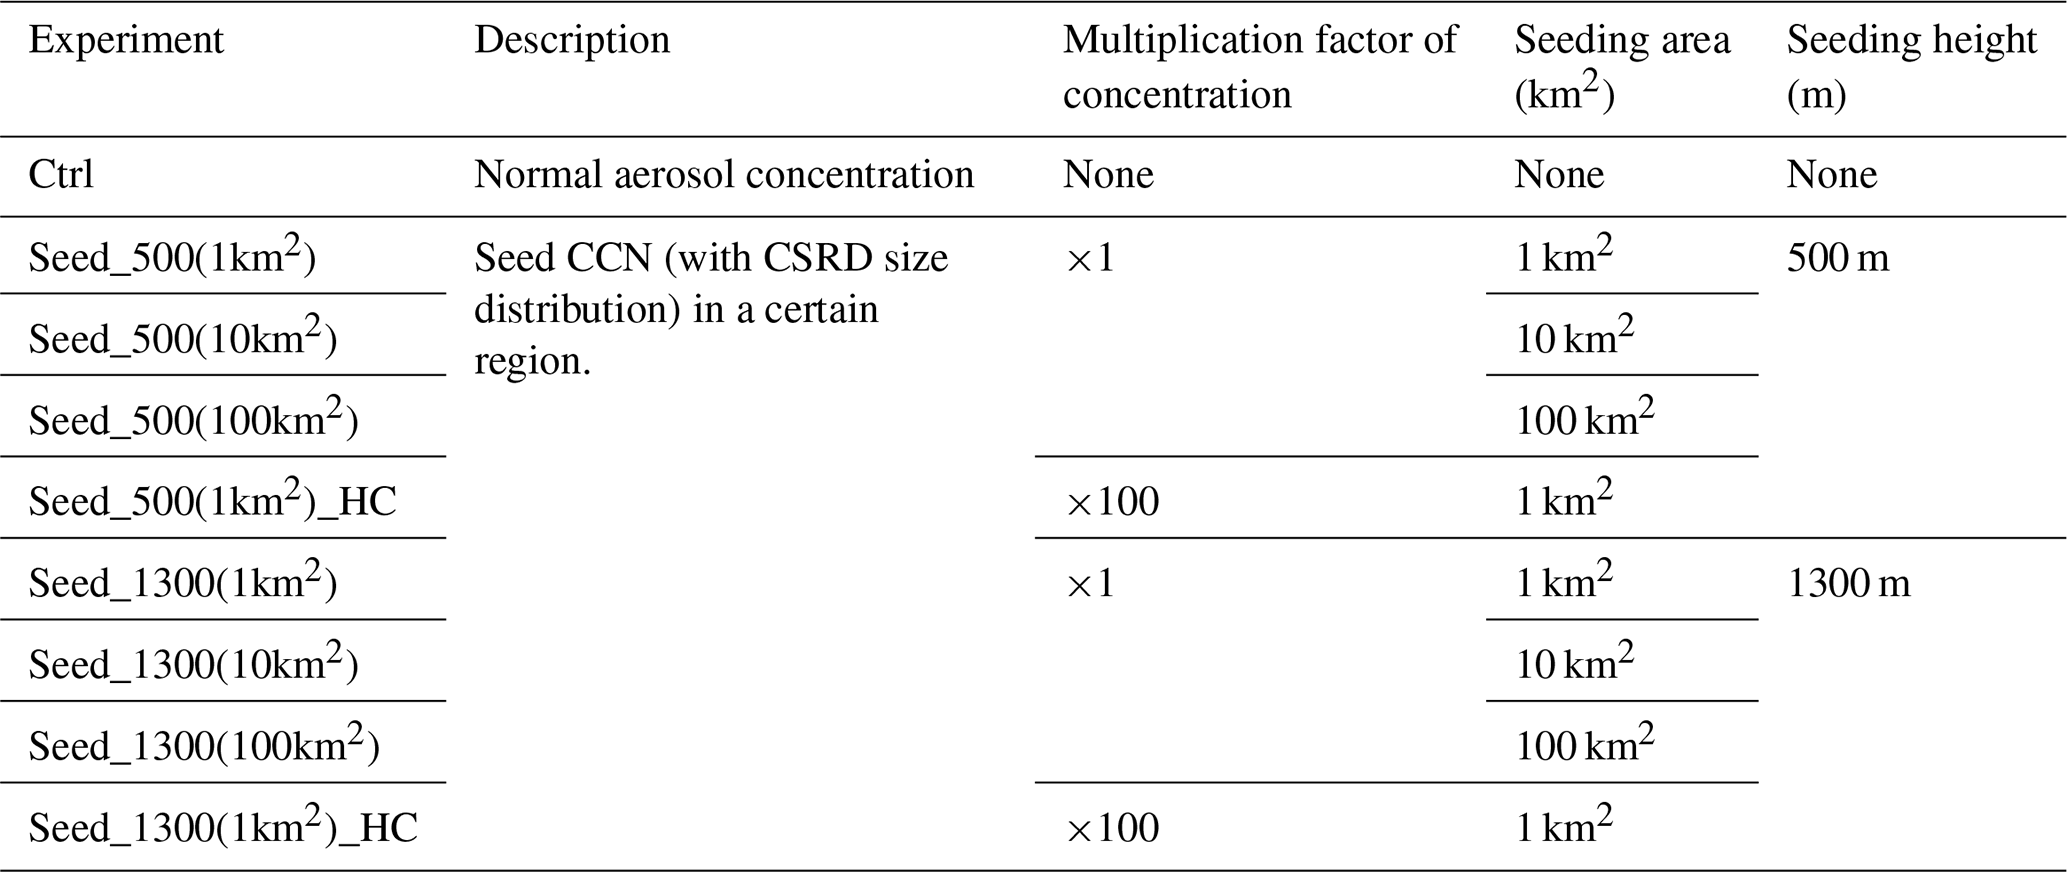
Several studies have investigated cloud-seeding effects through simulations at a finer grid resolution (Yin et al., 2000; Tonttila et al., 2021; Xue et al., 2014). To further examine and interpret the effects of cloud seeding and microphysical processes, domain five (D05) is developed at a horizontal resolution of 333 m. The seeding heights in D05 are based on the results of D04, and two seeding heights that yield the smallest and greatest increases in rainfall in D04 (500 and 1300 m) are selected. Six runs are developed to seed hygroscopic particles in different areas, namely 1, 10, and 100 km2, at the selected seeding levels. In addition, two more runs with 100 times the concentration of seeding agents in a 1 km2 area are performed for the seeding height at 500 and 1300 m, respectively. The model experiments in D05 are summarized in Table 3.
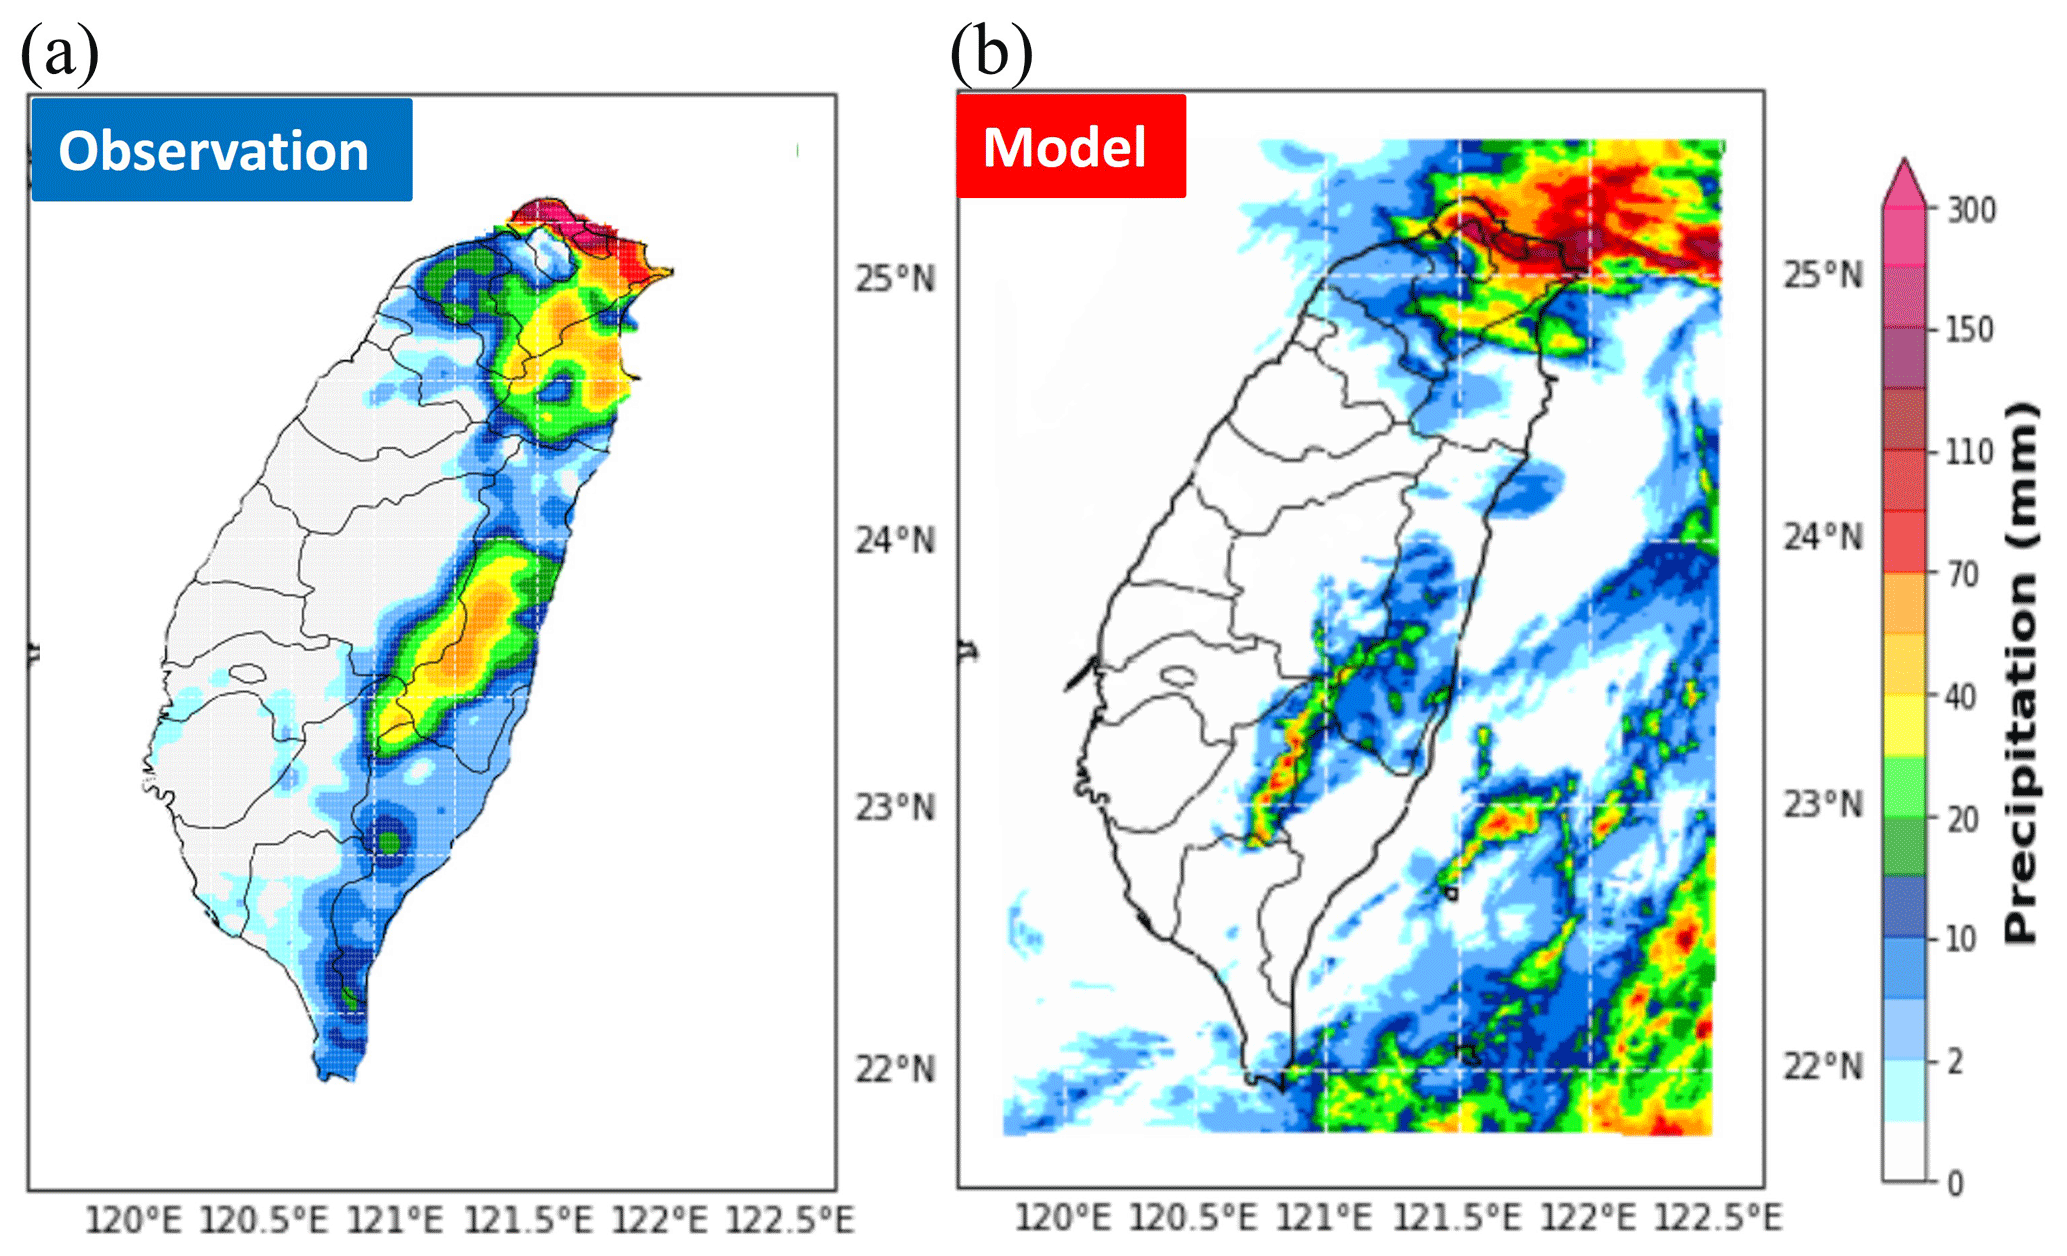
Figure 6Cumulative rainfall based on (a) rain gauge observation data and (b) model simulation (D04) from 21 October 2020 at 12:00 UTC to 22 October 2020 at 12:00 UTC. Observation data are interpolated to the same resolution as the model simulation.
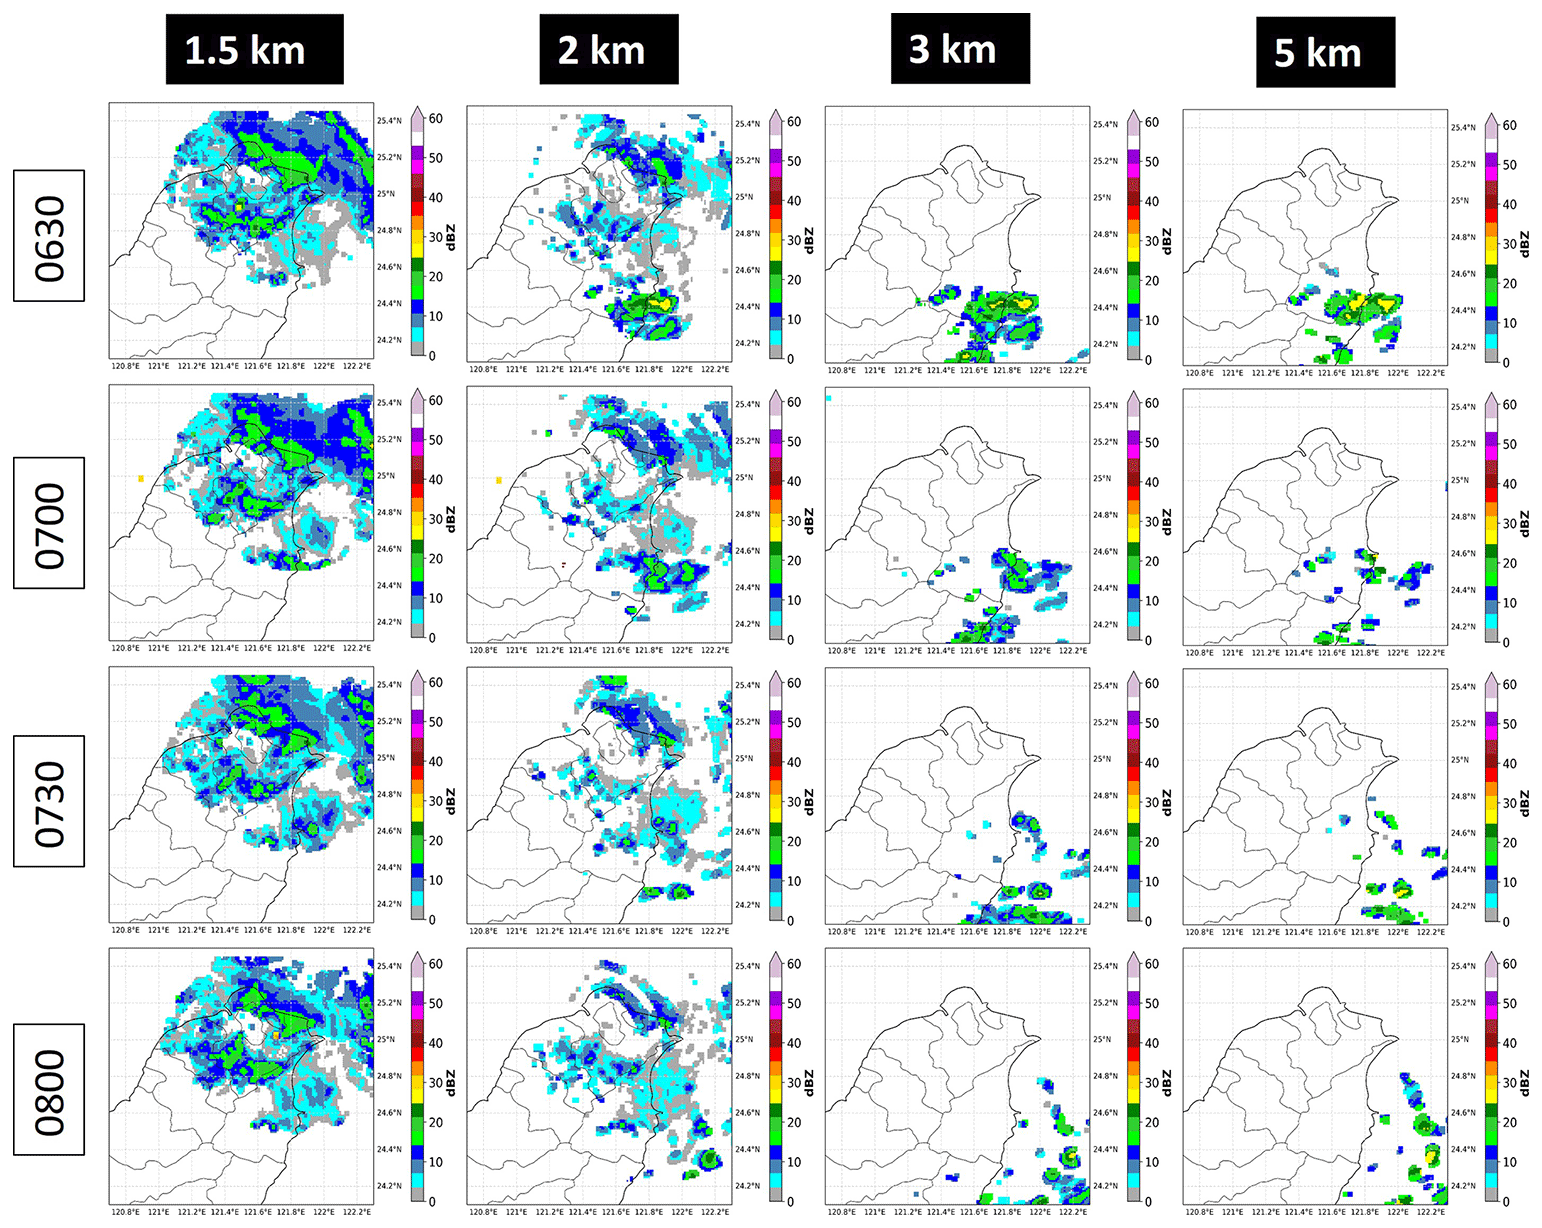
Figure 7RCWF (the S-band radar at Wufen Mountain) and RCSL (the C-band radar at Shulin) reflectivity at different altitudes (1.5, 2, 3, and 5 km) and different times (06:30, 07:00, 07:30, and 08:00 UTC).
4.1 Control run in D04 (Ctrl_D04)
Before the cloud-seeding simulation assessment, results from a control run are validated against the observations to ensure that the simulation agrees reasonably well with reality, and we take accumulated rainfall, radar reflectivity, water vapour mixing ratio, temperature, and pressure into consideration. The main features of cumulative rainfall (Fig. 6) are successfully captured by the model, particularly in northern Taiwan, our location of interest. Moreover, information on observational radar reflectivity is used to account for precipitation patterns at different heights (Fig. 7). The radar reflectivity results show that most of the reflectivity is below 5 km. This indicates that the rainfall system mainly involves warm-rain processes, and this feature is also captured by the model simulation (Fig. 9). Furthermore, the temperature, pressure, and water vapour mixing ratio are similar between the observational data at the Dongyan Mountain site, located near the Shihmen region, and the corresponding grid point data in the model simulation (Fig. 8). Thus, the simulation conducted in this study can be used for tests of cloud-seeding sensitivity of the WRF model with the new hybrid scheme. Figure 9 presents the meridional mean (0.1∘ latitude across the Shihmen region) of liquid water content (LWC) of the model simulation at 06:30 UTC on 22 October 2020. Figure 9 shows that clouds are located above approximately 500 m and below approximately 2000 m in the Shihmen region, with the highest LWC appearing near 1300 m, and all of the clouds are below the 5 ∘C line, which represents where the warm-rain processes dominate.
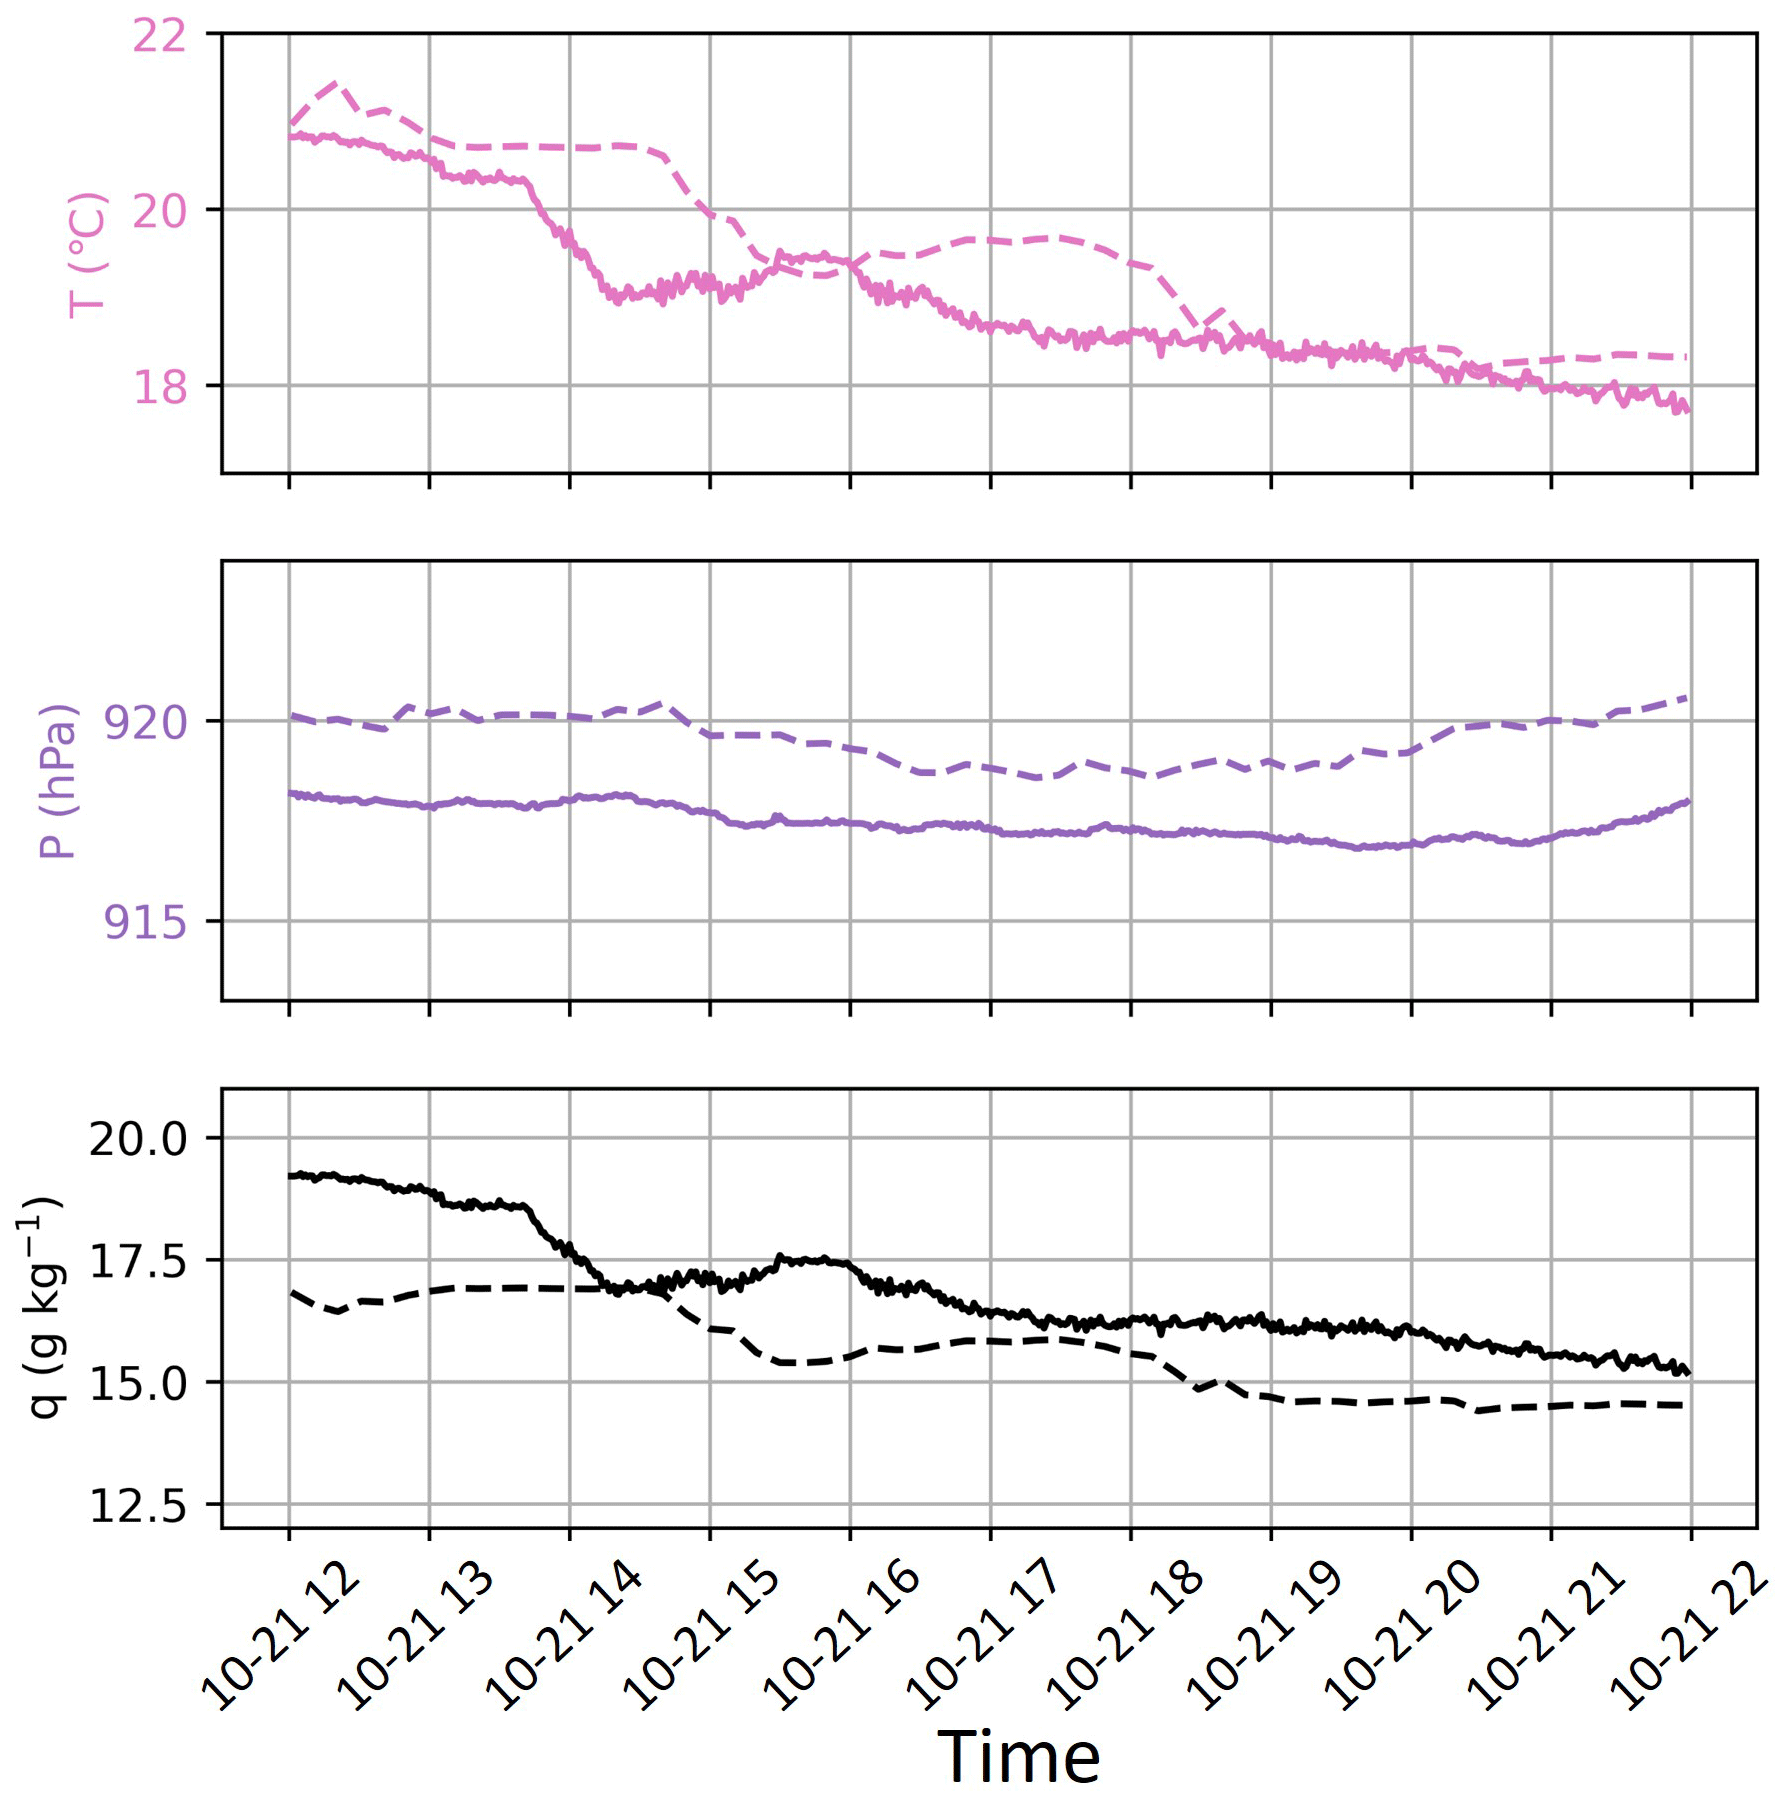
Figure 8Time series (UTC) of temperature, pressure, and water vapour mixing ratio based on observation (solid lines) and model simulation (dashed lines) at the Dongyan Mountain site before cloud seeding was conducted.
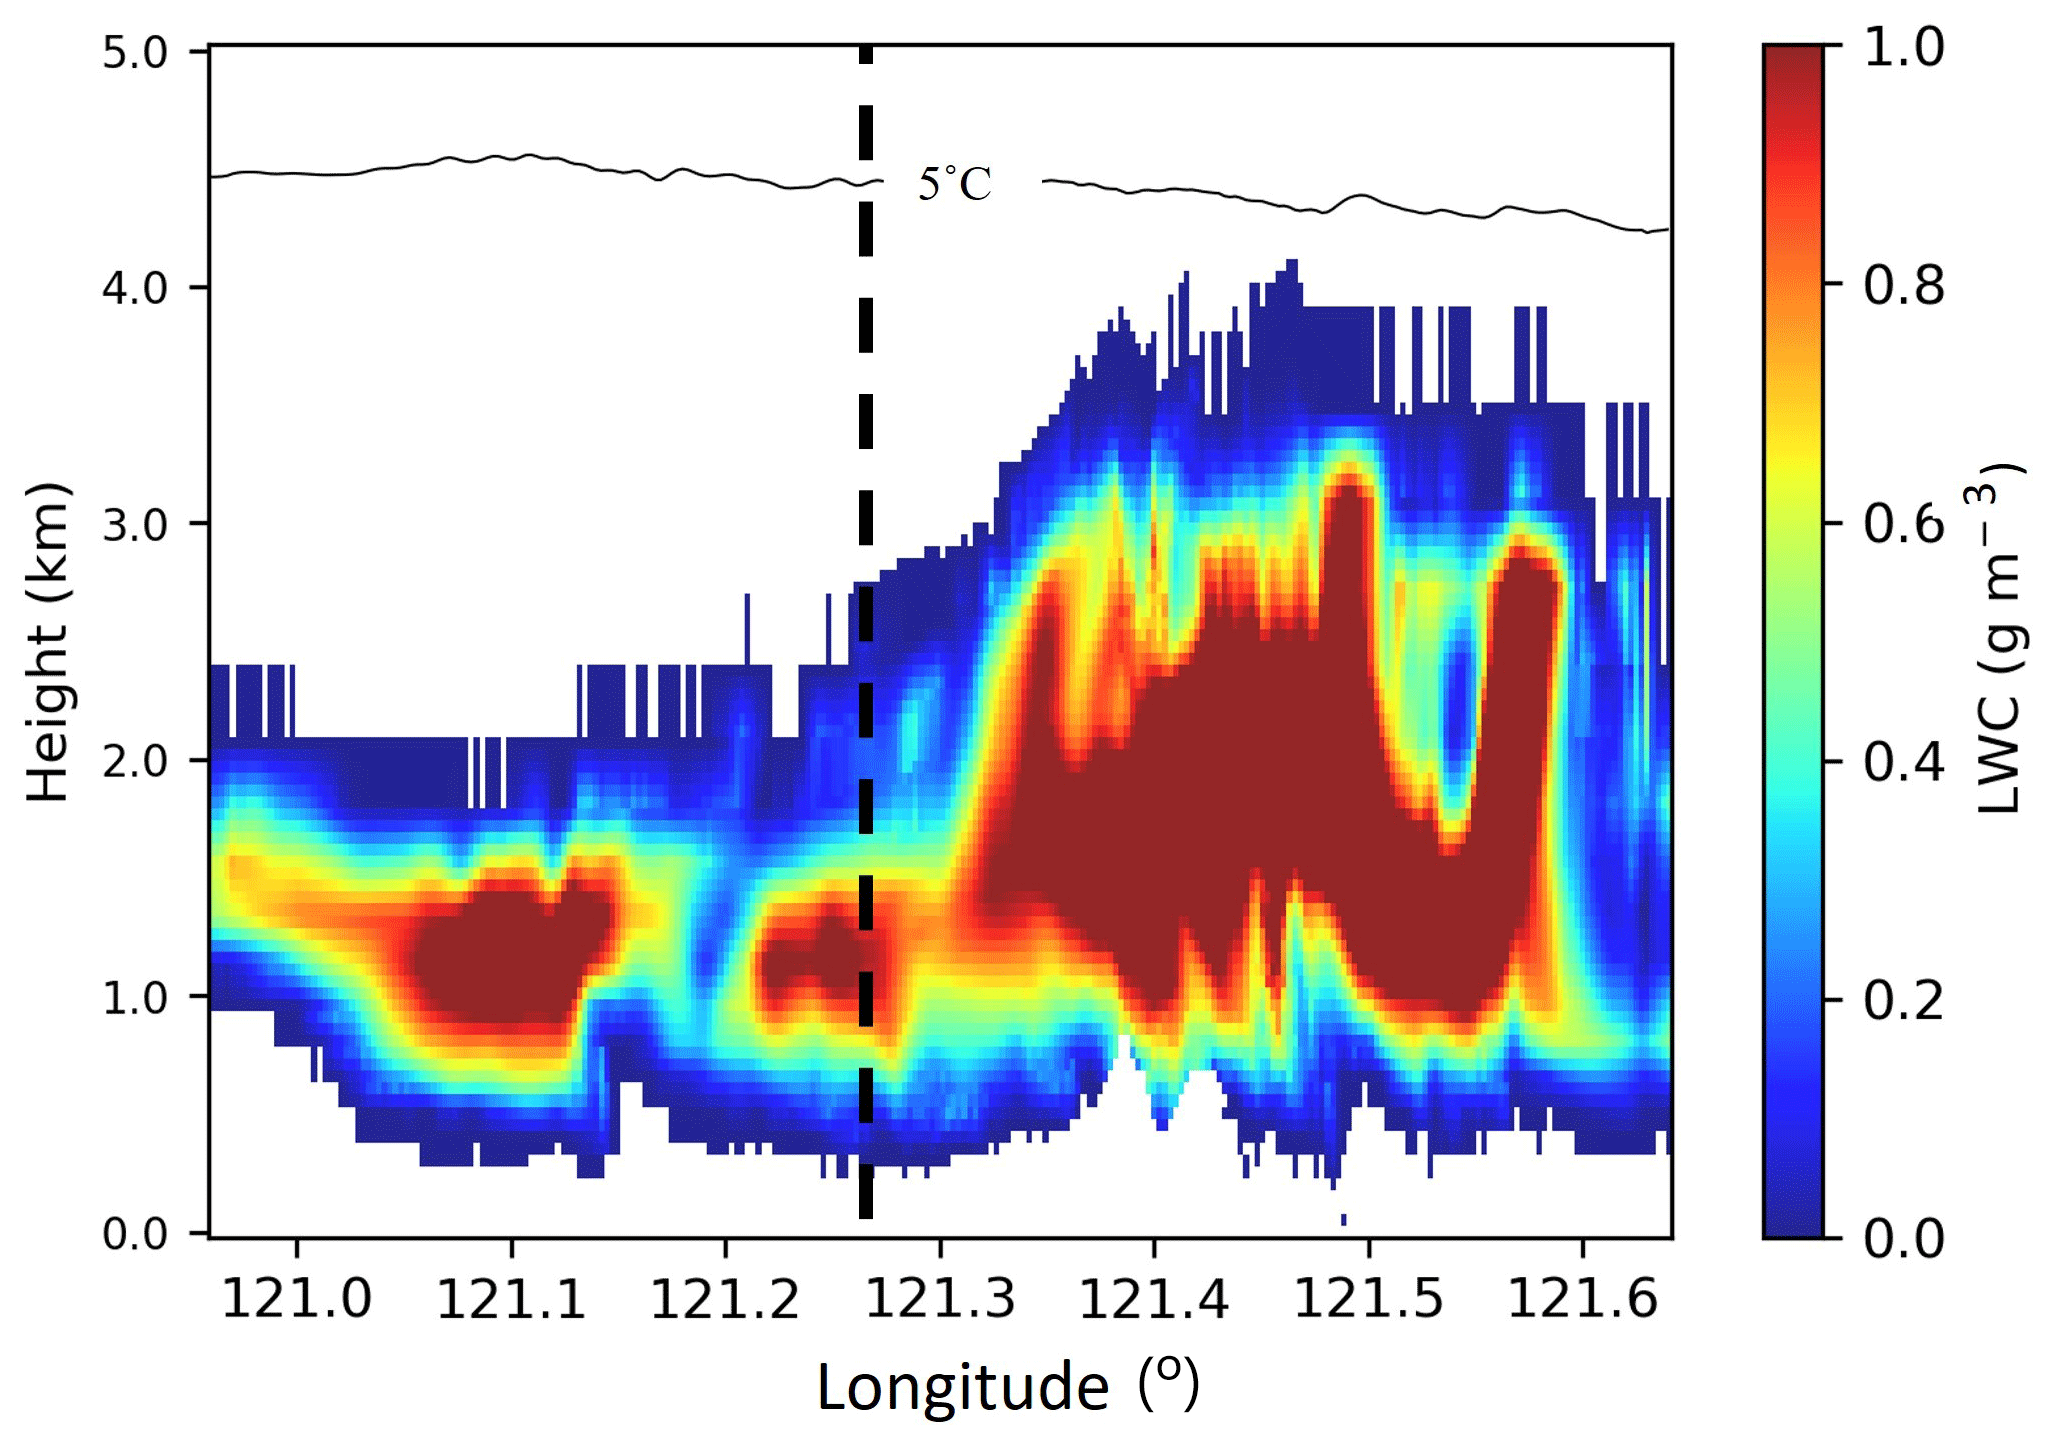
Figure 9Meridional mean (0.1∘ of latitude crosses the Shihmen region) of liquid water content (LWC) of model simulation at 06:30 UTC on 22 October 2020. The dashed black line indicates the longitude of the Shihmen region, and the black line shows the altitude of 5 ∘C.
4.2 Seeding effects on precipitation and cloud properties
To determine the effects of cloud seeding at different seeding heights, four seed runs (Seed 1 to Seed 4) in one horizontal grid (1 km × 1 km) at different seeding levels (∼ 500, 1000, 1300, and 2200 m above mean sea level) are executed in D04. An evaluation of the average rain rate of seed runs and the control run in the Shihmen region (Fig. 10) indicates that seeding above 1000 m but below 2000 m enhances surface rainfall in the Shihmen region, and Seed 3 resulted in the greatest enhancement of precipitation. The results also indicate that seeding at the in-cloud levels (Seed 2 and Seed 3) is more effective for precipitation than seeding at the cloud base (Seed 1) in northern Taiwan. Thus, in this study, seeding at 500 and 1300 m, corresponding to Seed 1 and Seed 3, are chosen as the runs that yielded lower and higher rainfall enhancement for the further simulation assessments and data analysis in domain five (D05).
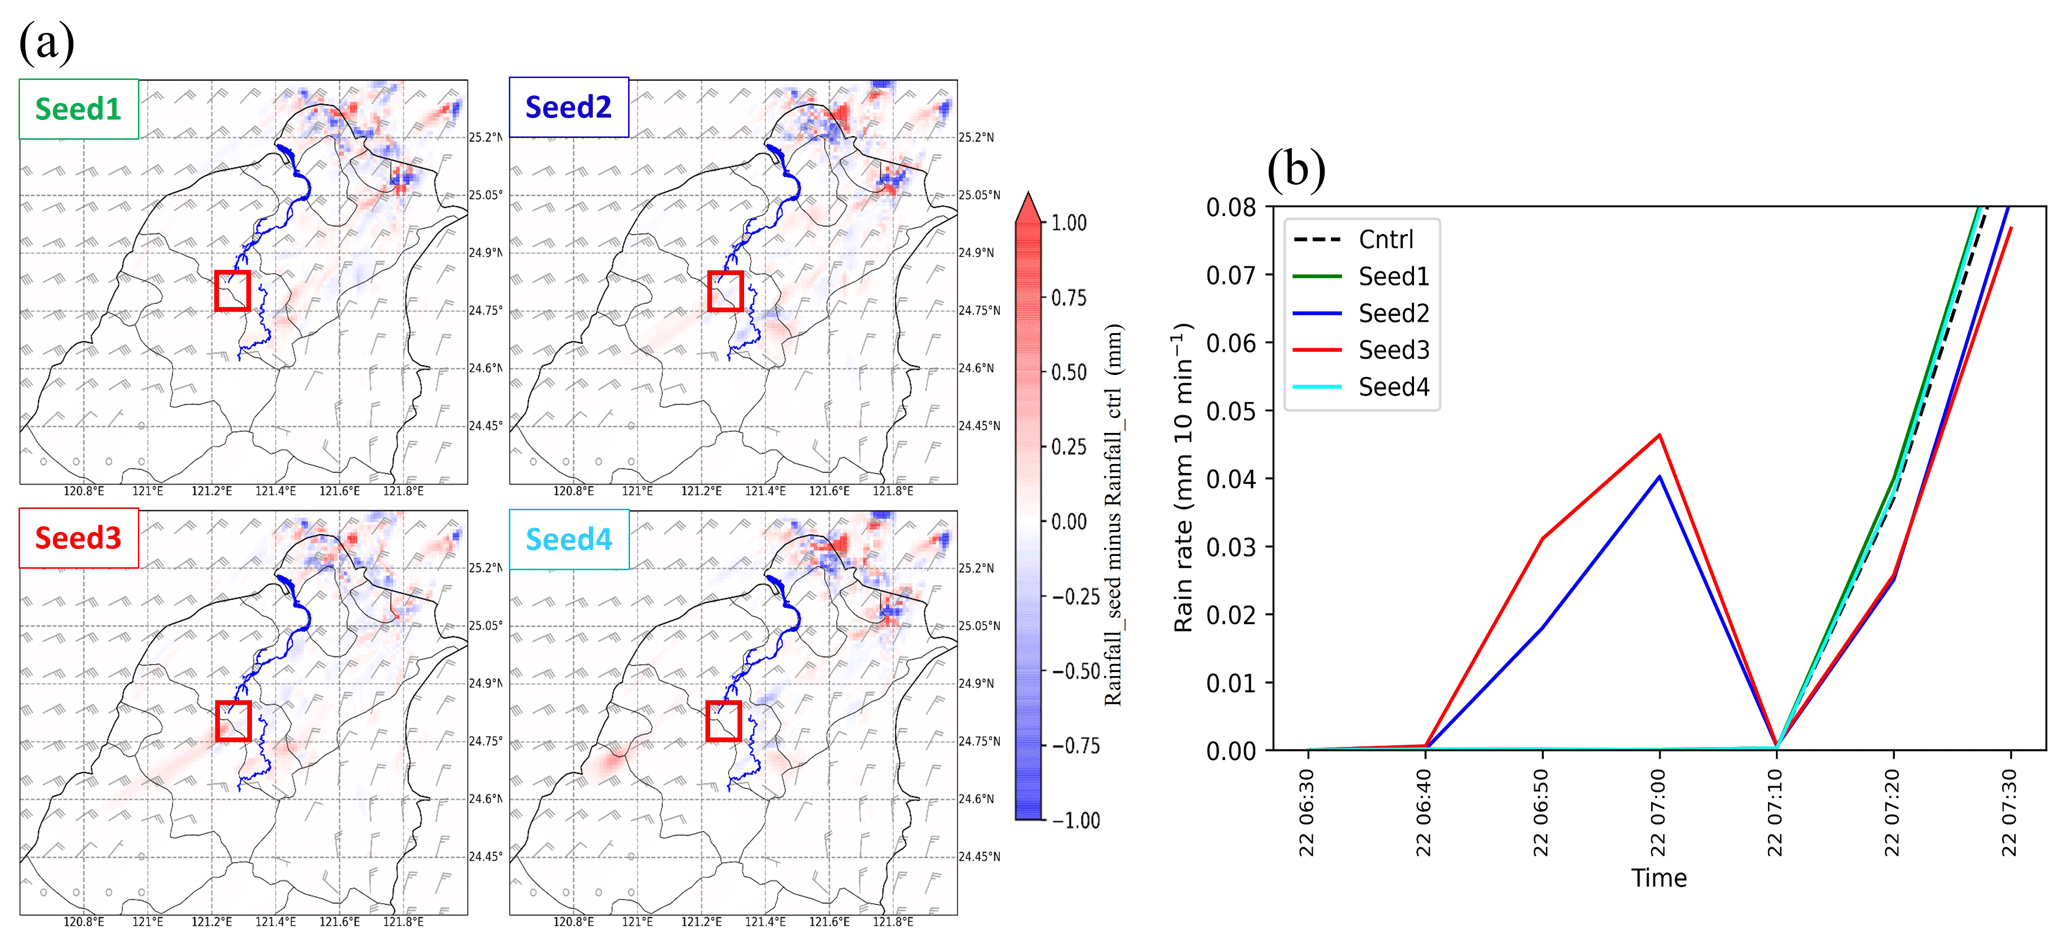
Figure 10(a) The 1 h rain rate variation after cloud seeding. (b) Time series (UTC) of averaged rain rate of the rainy grids in the Shihmen region for seed runs and the control run. The red rectangle in (a) represents the Shihmen region, and the rivers shown on the map are the Dahan River and Danshui River.
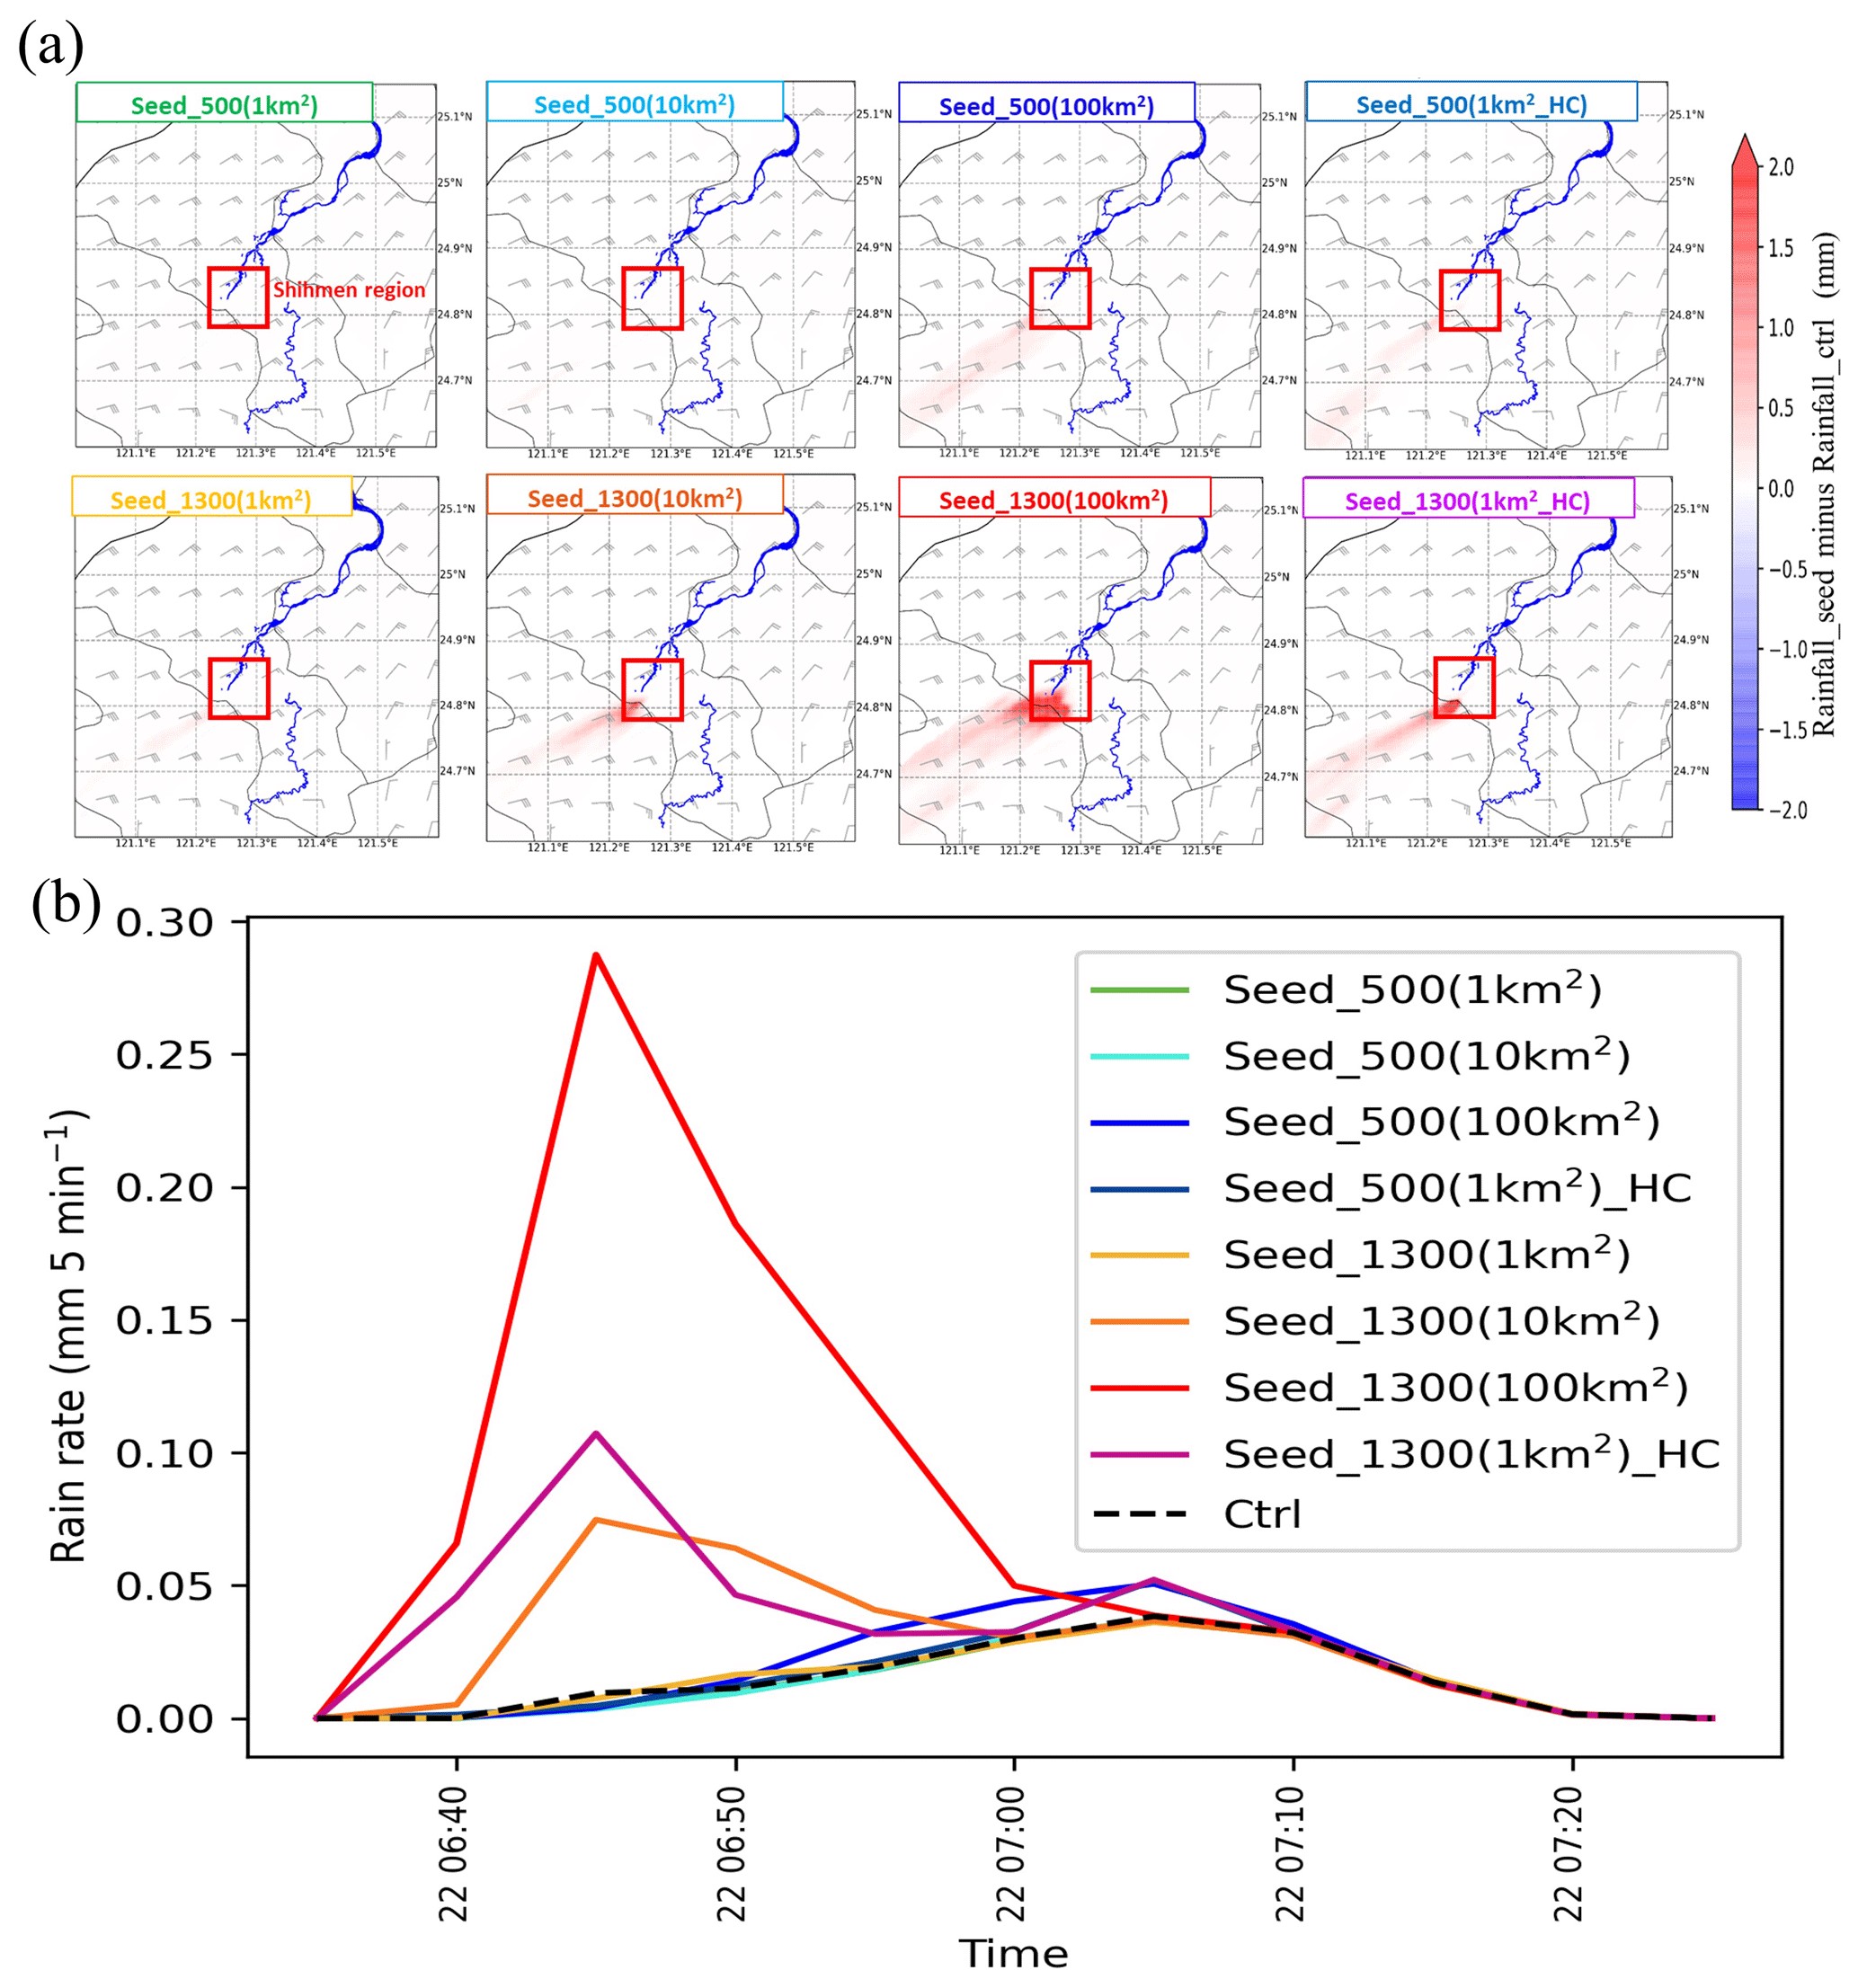
Figure 11(a) The 1 h rain rate variation after cloud seeding. (b) Time series (UTC) of averaged rain rate of the rainy grids in the Shihmen region for seed runs and the control run. The red rectangle in (a) represents the Shihmen region, and the rivers shown on the map are the Dahan River and Danshui River.
In D05, eight runs are executed at different seeding heights (500 and 1300 m), but for different seeding areas (1, 10, and 100 km2), and seeding concentrations. As shown in Fig. 11, seeding at 1300 m yields greater rainfall than seeding at 500 m, and this result is similar to that for domain four (D04). In addition, seeding at 1300 m, over a bigger seeding area, and at higher aerosol concentrations yielded greater rain rates by several folds in the Shihmen region (Fig. 11), particularly in seeding areas of 100 km2. However, this phenomenon is not obvious in scenarios of seeding at 500 m, suggesting in-cloud seeding is more beneficial compared to below-cloud seeding. If cloud seeding is conducted in the appropriate environments that afford, for example, bigger seeding areas or in areas with higher aerosol concentrations, precipitation is enhanced.
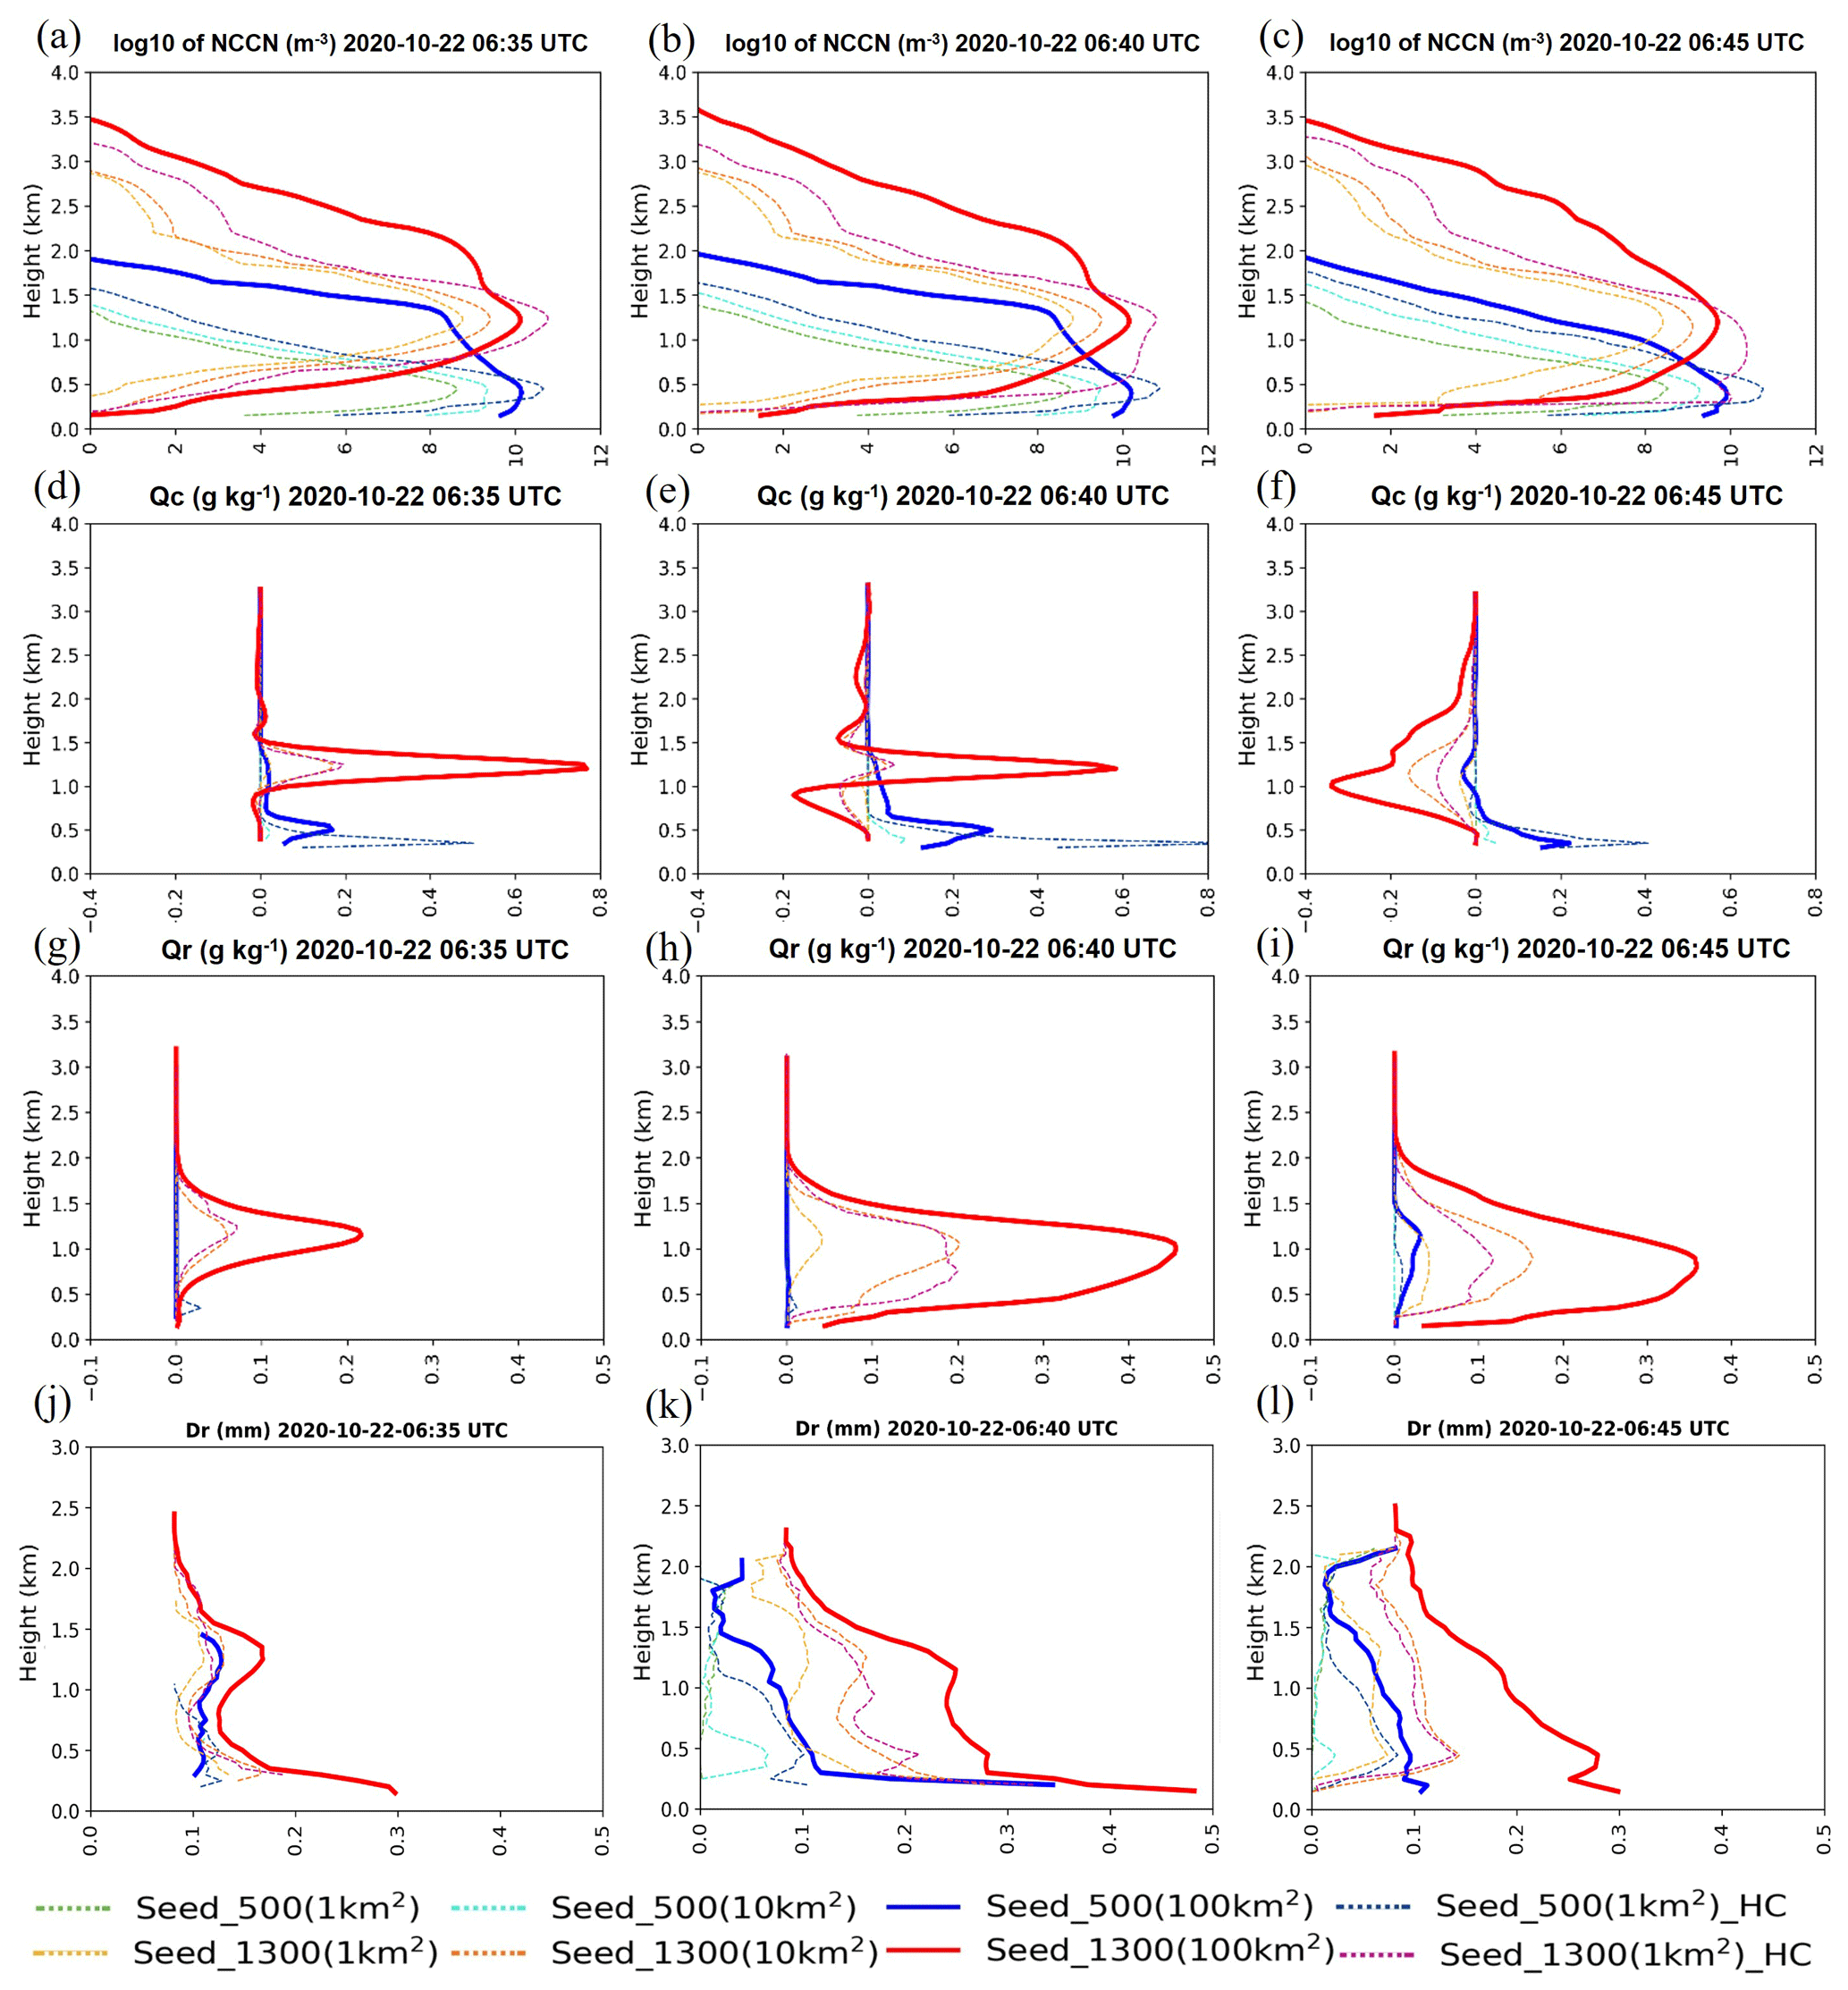
Figure 12Vertical profile of the averaged difference between the control run and seed runs of (a–c) log10 of CCN concentration, (d–f) mixing ratio of cloud (Qc), (g–i) mixing ratio of rain (Qr), and (j–l) Dr after cloud seeding (started at 06:30 UTC). Warm colours represent seeding at 1300 m, and cold colours represent seeding at 500 m.
In terms of microphysical properties of the simulation, a peak in seeded-CCN concentration is observed at their seeding height, 500 and 1300 m (Fig. 12a–c). In the scenario of seeding at 1300 m (Fig. 12a–c, warm colour), the seeded CCN are able to be transported to higher altitudes than the scenarios seeding at 500 m (Fig. 12a–c, cold colour). Figure 12d–f show that seeding at both 500 and 1300 m enhances the mixing ratio of clouds (Qc) in 10 min (from 06:30 to 06:40 UTC) after cloud seeding. However, Qc starts to decrease after 06:40 UTC (10 min after cloud seeding) in the seeding scenario at 1300 m, but this phenomenon is not apparent in the seeding scenario at 500 m. With regard to the mixing ratio of rain (Qr), Fig. 12g–i indicate that seeding at 1300 m considerably increases Qr after cloud seeding, but seeding at 500 m only weakly enhances Qr. This phenomenon also explains why Qc starts to decrease after 10 min of seeding at 1300 m, but this behaviour is not obvious in the seeding scenario at 500 m. In addition, by using the double-moment microphysics scheme, we calculate the Dr as
where Nr, Qr, ρw, and ρa are the number concentration of rain, mixing ratio of rain, density of water, and density of air, respectively. Figure 12j–l show that Dr increases more obviously in the scenarios of seeding at the in-cloud region (the warm colour lines). If larger raindrops develop, more liquid water may reach the ground, increasing surface rainfall. Finally, the model reveals a slight change in supersaturation ratio between the experiments (Fig. 13), indicating that although the seeding agents can compete for water vapour, only a little amount of water vapour is consumed, and therefore, the saturation state of the environment is not highly affected (approximate fluctuation of 0.5 %) by cloud seeding. According to Tonttila et al. (2021), the ideal simulation of hygroscopic cloud seeding indicates that water vapour competition does not cause great seeding effects on cloud supersaturation. In this study, when the supersaturation ratio is relatively high in the environment, similar results can be found by the complex simulation.
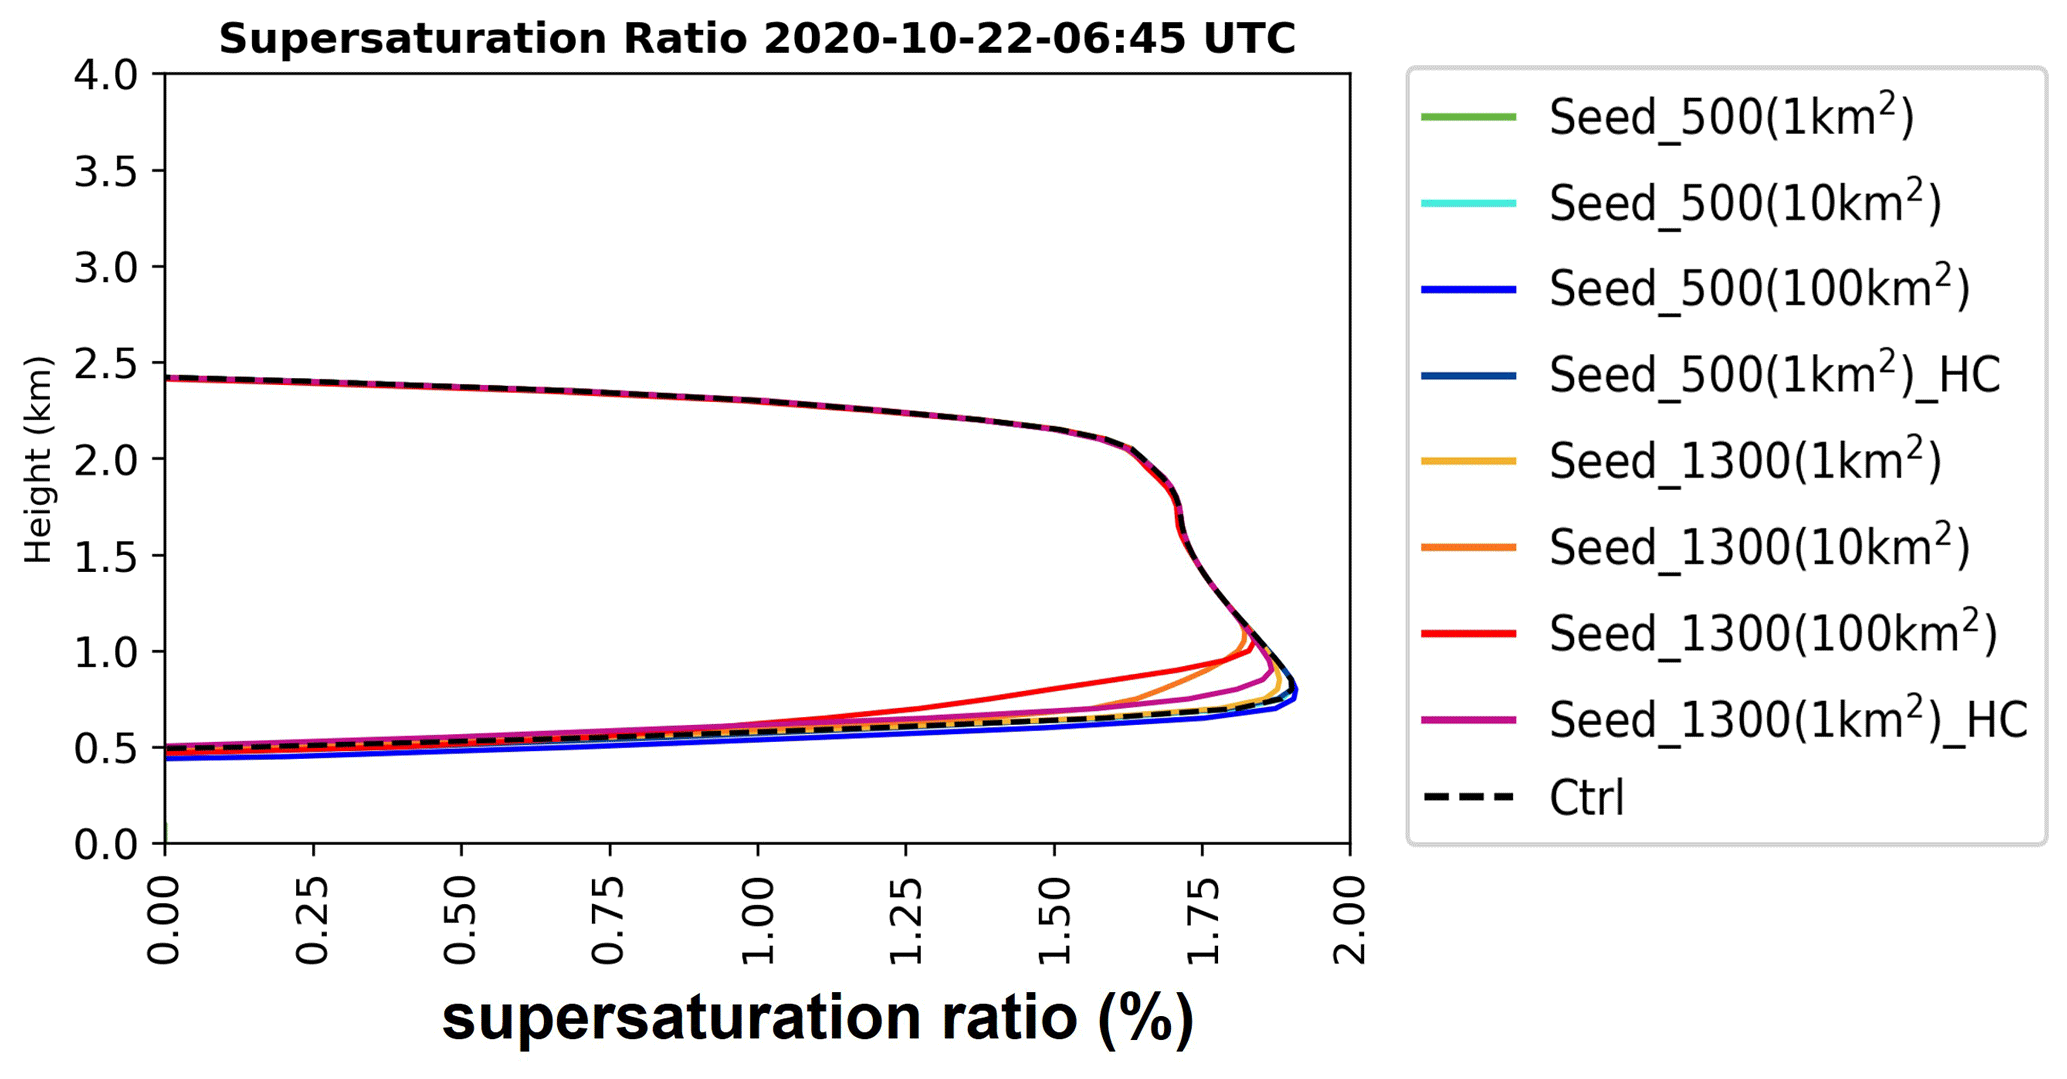
Figure 13Vertical profile of averaged supersaturation ratio in the Shihmen region 15 min after cloud seeding.
4.3 Seeding effects on microphysical processes
Five microphysical parameters are considered, namely cloud activation (Pcact), cloud condensation (Pcond), evaporation of rain (Prevp), autoconversion of rain (Praut), and accretion of rain (Pracw). We integrate the simulations at heights below 5 km to obtain the averaged difference between the control run and seed runs for each parameter. As shown in Fig. 14, 10 min after cloud seeding, the seeding effect is mainly observed in terms of Pcact, Praut, and Pracw. For Pcact, as depicted in Fig. 15a–c, the activation process is intense at the height at which the seeding agents are introduced; this mainly occurs 10 min after cloud seeding. Moreover, because the supersaturation ratio at 1300 m is higher than that at 500 m, seeding at 1300 m yields a stronger Pcact than seeding at 500 m. Regarding Praut, the seeding scenarios in 100 km2 areas at 500 and 1300 m exhibit obvious but opposite signals. As shown in Fig. 15d–f, the autoconversion process is clearly stronger in Seed_500(100 km2) but weaker in Seed_1300(100 km2) 15 min after cloud seeding. However, with regard to Pracw, the seeding scenarios at 1300 m (Fig. 15g–i, warm colour) yield a more intense accretion process than the scenarios at 500 m (Fig. 15g–i, cold colour).
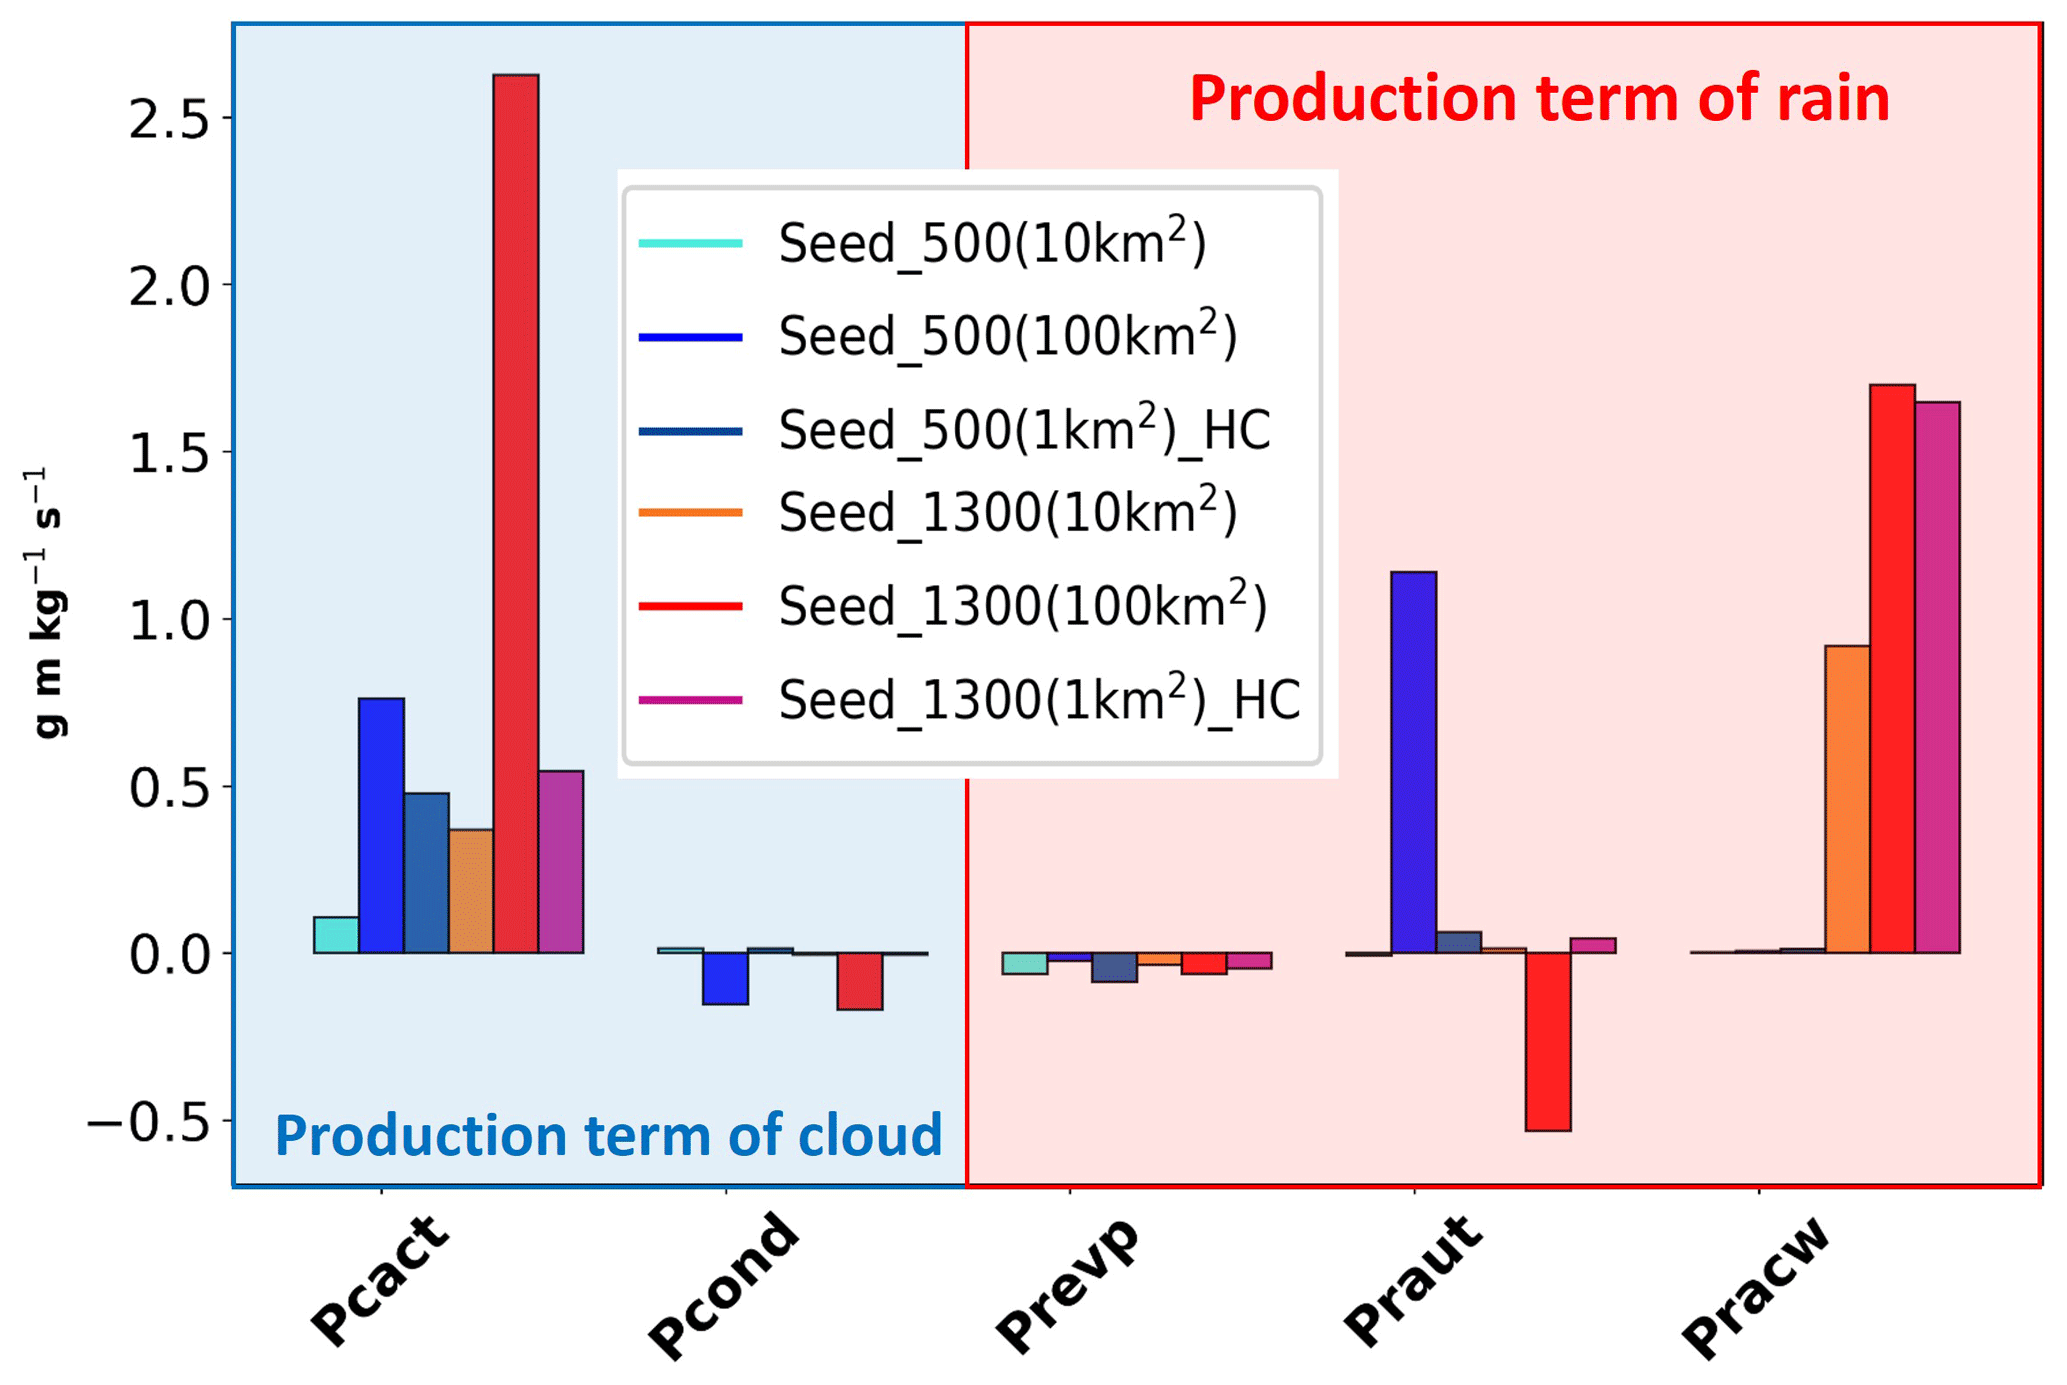
Figure 14Integration of simulation with height below 5 km for the averaged difference between the control run and seed runs of each parameter (Pcact, Pcond, Prevp, Praut, and Pracw). Blue and red shaded areas represent the production term of clouds and rain, respectively.
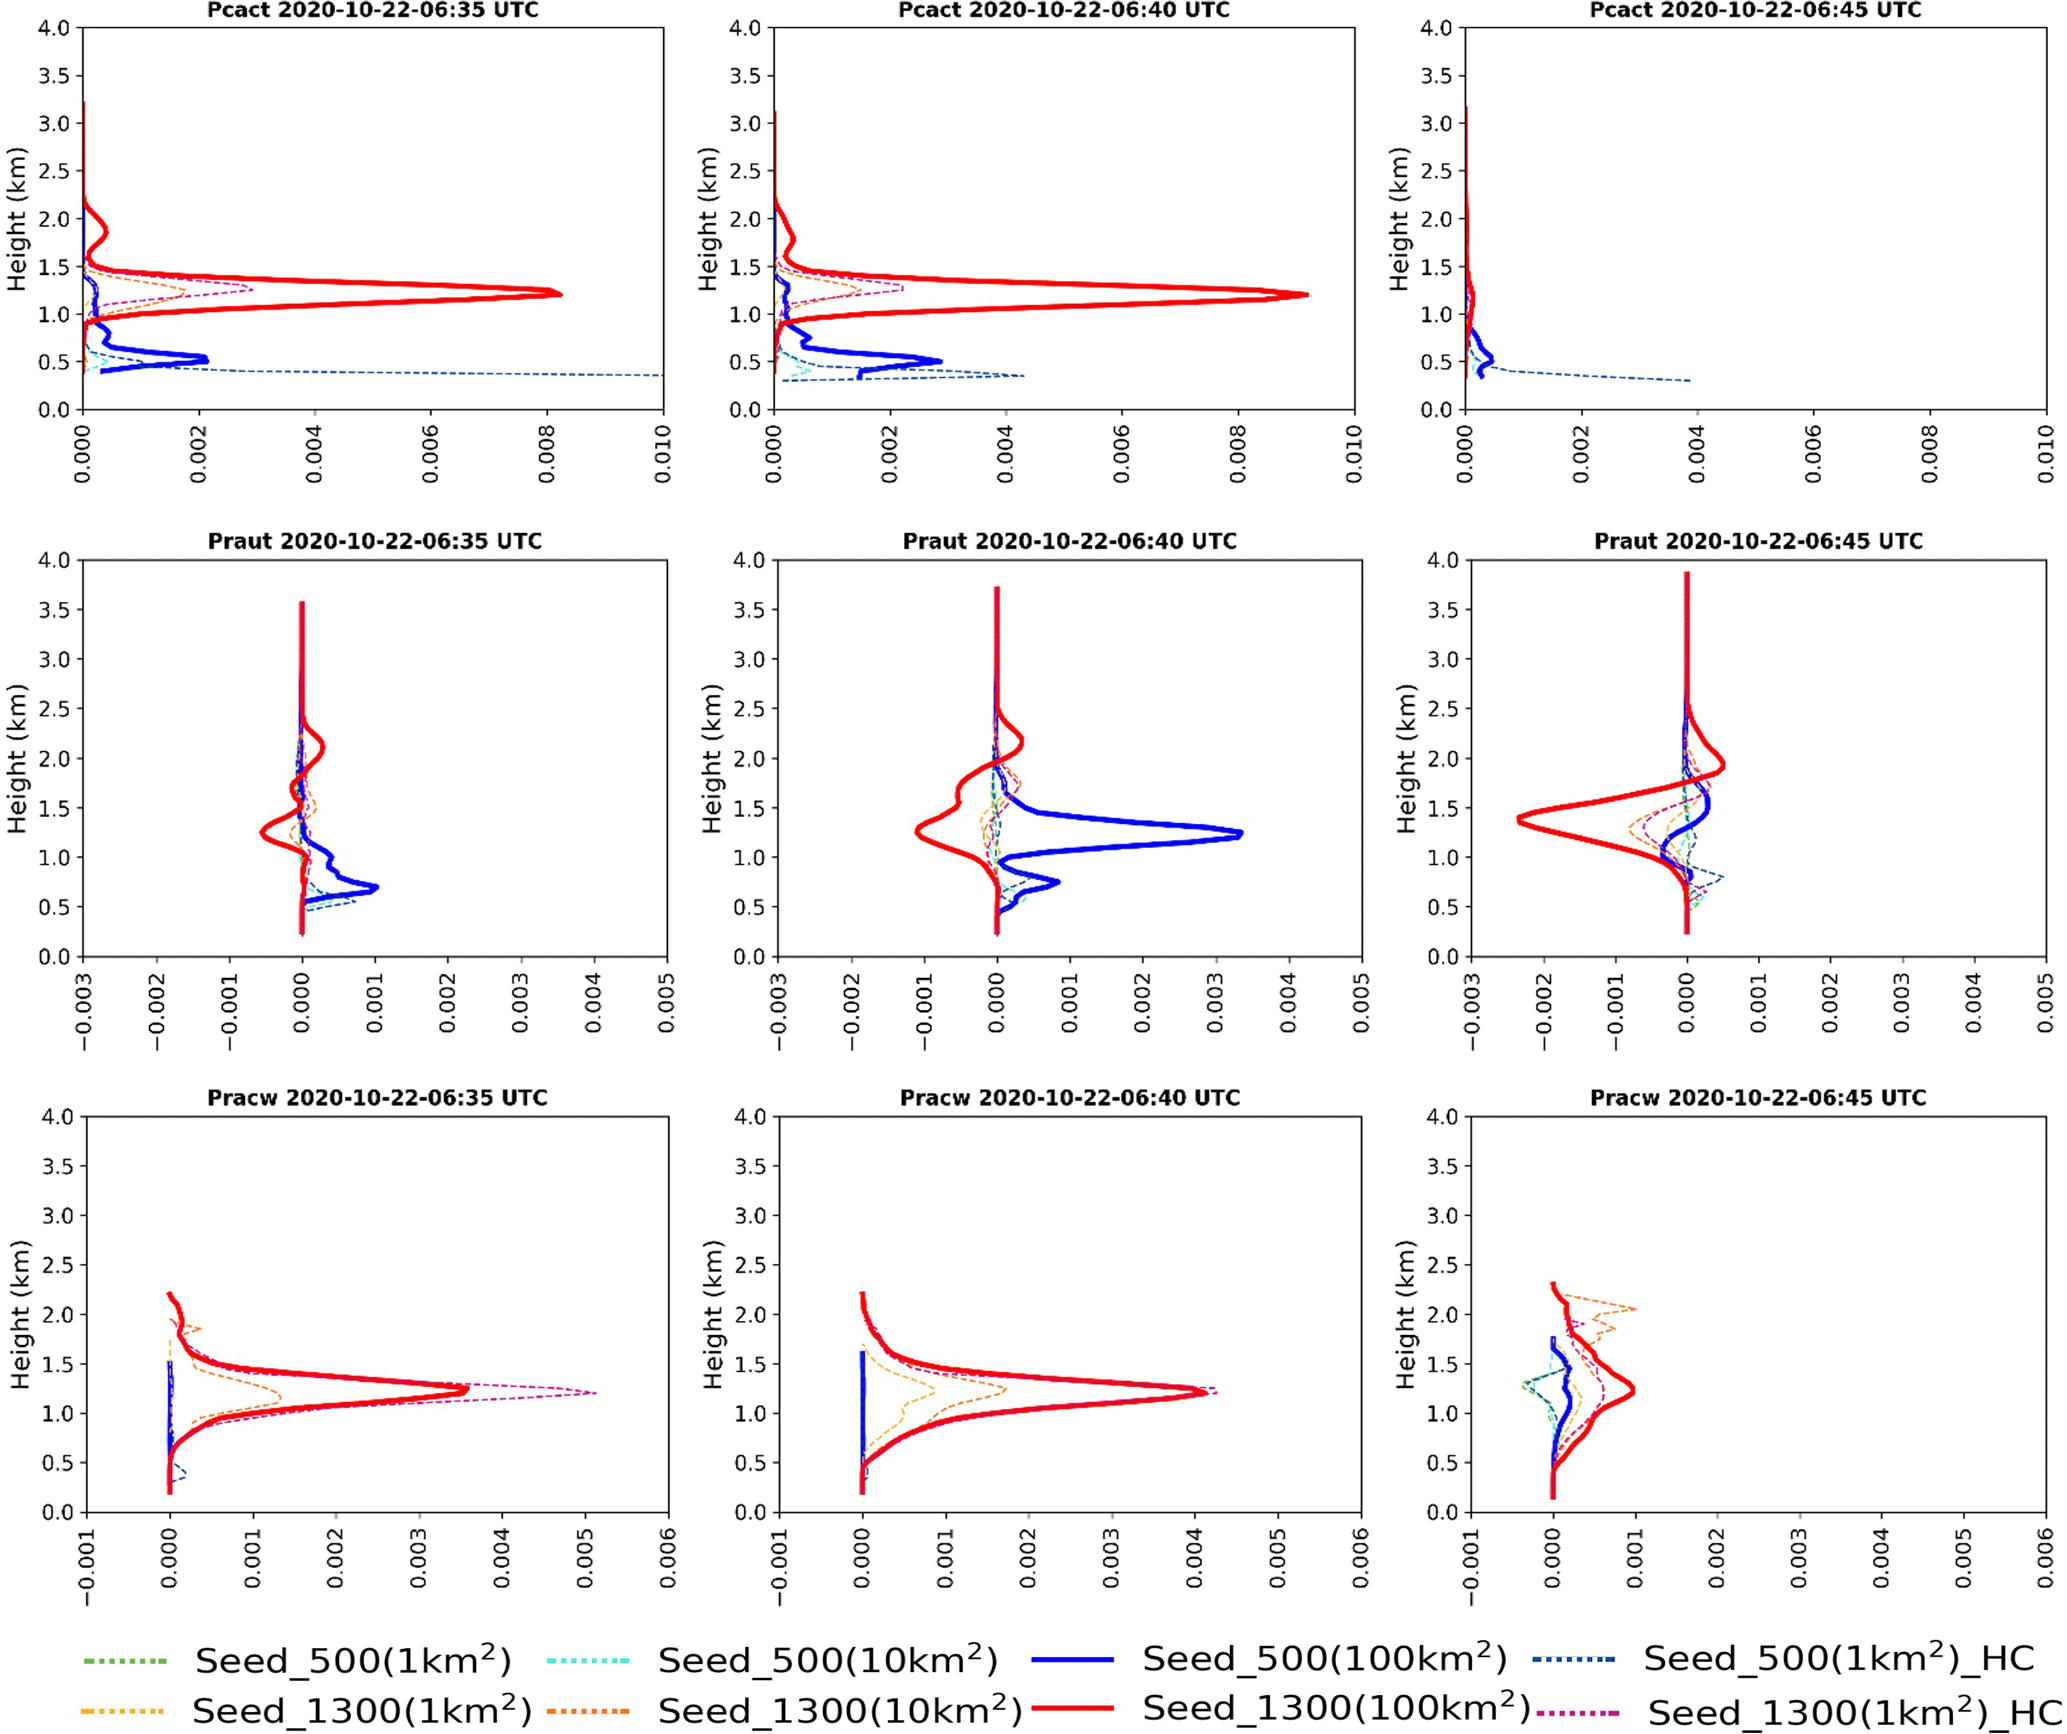
Figure 15Vertical profile of the averaged difference between the control run and seed runs of the (a–c) cloud activation process (Pcact), (d–f) autoconversion process of rain (Praut), and (g–i) accretion process of rain (Pracw) after cloud seeding (started at 06:30 UTC). Warm colours represent seeding at 1300 m, and cold colours represent seeding at 500 m.
Thus, in our model simulation, introducing seeding agents with a CSRD size distribution can enhance the activation process (Pcact), and seeding at 1300 m can promote the activation of more seeded CCN in clouds. In addition, because of the strengthening of the accretion process (Pracw), more precipitation can be developed in the seeding scenarios at 1300 m. Tonttila et al. (2021) also show that the enhanced accretion process is the main pathway for precipitation enhancement after cloud seeding. In the seeding scenarios at 500 m, rainfall is slightly enhanced, mainly due to the enhancement of the autoconversion process (Praut) when a seeding agent is introduced in an area of 100 km2; however, seeding in such a large domain can be impractical and ineffective. Therefore, cloud seeding at 1300 m (in-cloud area) seems to be the more suitable choice for increasing rainfall. Figure 16 presents more details of the effect of cloud seeding on the cloud microphysical properties by seeded-CCN size distribution and time in Seed_1300(100 km2). Figure 16 also indicates that the fraction of hygroscopic particles larger than 0.4 µm decreases over time. This phenomenon indicates that particles larger than 0.4 µm are the main factor contributing to cloud-seeding effects.
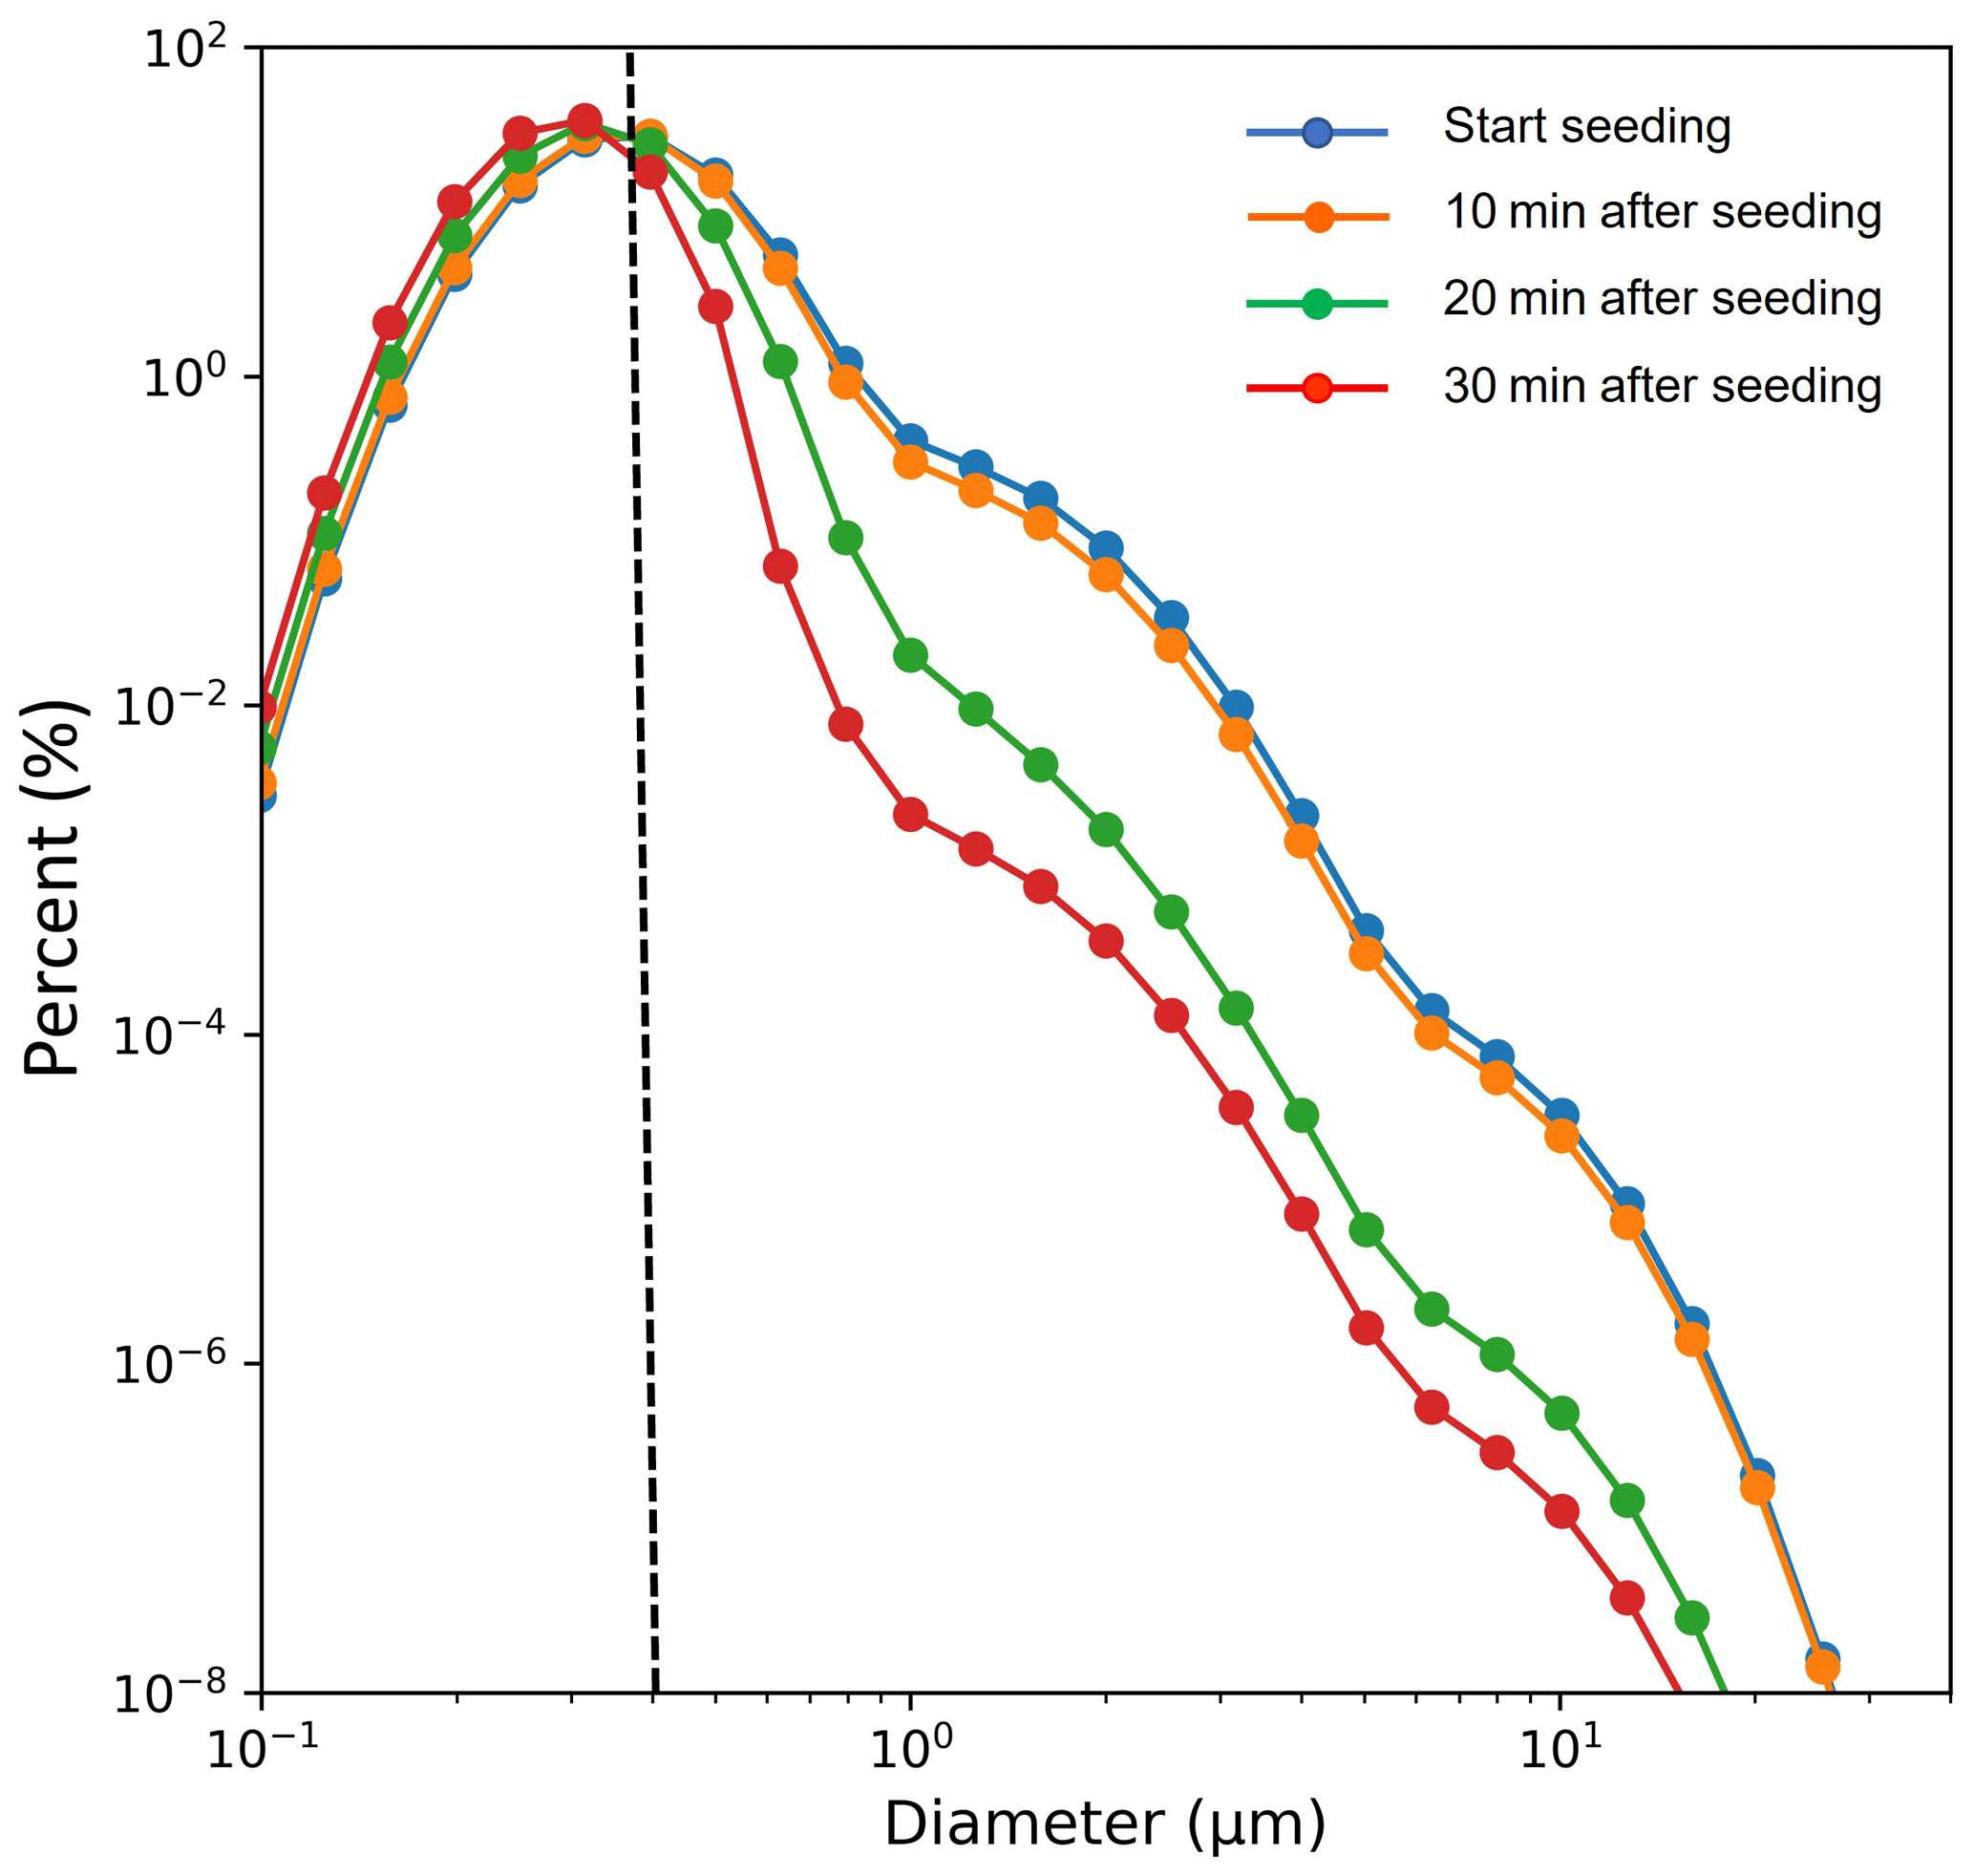
Figure 16Size distribution of seeded CCN at different times after cloud seeding. The dashed black line separates the particles larger and smaller than 0.4 µm.
For hygroscopic cloud-seeding practice, two crucial questions are often be asked: (1) which types of environmental conditions are appropriate for executing hygroscopic cloud seeding in the stratiform system and (2) what the optimal seeding area is. Based on the results of the study, seeding at in-cloud levels can enhance precipitation more than seeding at the cloud base because of an enhanced accretion process. Distributing the hygroscopic particles into larger areas in clouds is more effective in enhancing rainfall. More detailed discussions follow.
With regard to the first question, an altitude of 1300 m above mean sea level (the in-cloud region), which can increase rainfall the most in the simulation after cloud seeding, is used as a reference. In this case, the cloud base is at approximately 500 m, and the supersaturation ratio is in the range of 1.5 %–2 % near an altitude of 1300 m in the Shihmen region. However, after cloud seeding, the supersaturation ratio can be approximately 0.5 % through water vapour competition, while the LWC is approximately 0.6 g m−3. Therefore, our recommendation for the stratiform system is that hygroscopic particles should be introduced into the in-cloud region, where the supersaturation ratio is more than 0.5 %, and LWC is higher than 0.6 g m−3. The criteria of LWC is comparable to Silverman and Sukarnjanaset (2000), who indicate that LWC should be higher than 0.5 g m−3 to execute cloud seeding. With regard to the second question, to determine a practicable seeding area that yields increased precipitation, two more cloud-seeding runs over seeding areas of 36 and 64 km2 at an altitude of 1300 m are developed. Figure 17 displays the average rain enhancement rate in the Shihmen region in 20 min in scenarios with different seeding areas, and the results show that when the seeding area is smaller than 64 km2, the rain rate is obviously enhanced. However, for seeding areas larger than 64 km2, a slight increase in rain rate is observed because the Shihmen region no longer has plenty of cloud water to transform to precipitation (Fig. 17). Thus, we recommend spreading the seeding agents over an area of 40–60 km2 because it can be feasibly used to yield the greatest rainfall.
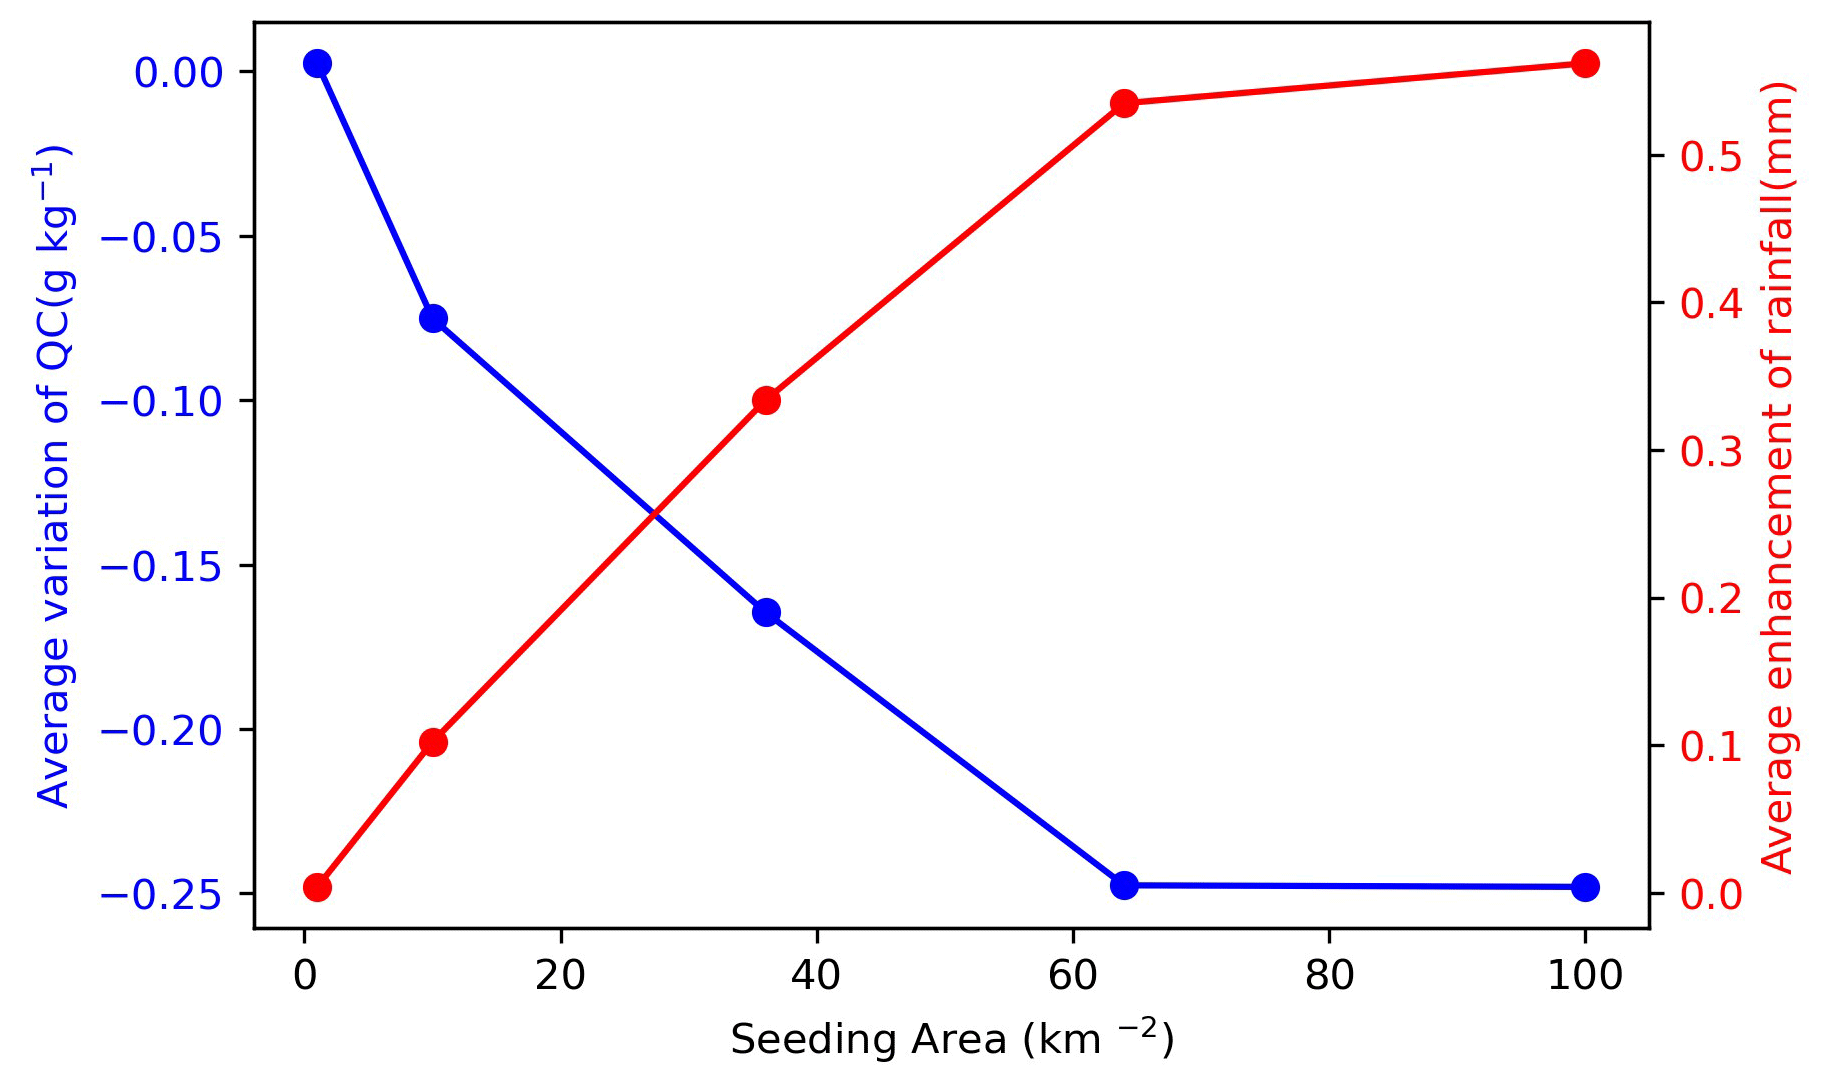
Figure 17Average enhancement of rain rate and average variation in cloud mixing ratio (Qc) in the Shihmen region in 20 min in different seeding areas, namely 1, 10, 36, 64, and 100 km2. The seeding areas of 36 and 64 km2 are two more runs conducted to determine a reasonable seeding area with the most effective increment of precipitation.
Furthermore, several comparable results to the previous studies are found. First of all, the precipitation signals are more intense in the runs with larger seeding domains or higher seeded-CCN concentrations, and this phenomenon agrees with the idealized simulation of Tonttila et al. (2021). Second, only a little water vapour faces competition from hygroscopic particles, and therefore the saturation state of the environment is not extremely affected by cloud seeding. This result agrees with Rosenfeld et al. (2010) and the idealized simulation of Tonttila et al. (2021). Third, the simulation of Yin et al. (2000) also shows that more rainfall enhancement is obtained in the seeding scenario above the cloud base. Regarding the size of seeding agents, most of the previous studies show that hygroscopic particles larger than 1 µm (GCCN) are optimal for enhancing precipitation in warm clouds (Caro et al., 2002; Segal et al., 2004). However, this study shows that the hygroscopic particles larger than 0.4 µm might also be able to contribute to enhancing precipitation in the cloud seeding. In the future, more case studies are needed to validate this result.
Regarding the WDM6-NCU scheme, there are still some areas that require improvement. First, in the bin part, to consider the effects of giant CCN, the maximum radius of aerosols is set as 20 µm, which is different from the 2 µm setting in Lee and Baik (2018) and 7.6 µm in Kogan (1991). However, in this research, there are almost no CCN larger than 2 µm (Fig. 5), and nearly no CCN are directly activated to raindrops. It might be more reasonable that an upper limit or a smaller growth rate for the CCN with a radius larger than 7.6 µm is defined in the WDM6-NCU. Second, for the connection between the bin and bulk parts, WDM6-NCU can extract a realistic activated CCN number concentration and mixing ratio from the bin part that can be applied to the bulk part. However, the information of droplet size distribution (DSD) might be different between the bin and bulk parts. In the future, an upper limit or a smaller growth rate for the CCN with a radius larger than 7.6 µm will be added to WDM6-NCU, and we should think about how to conserve more DSD information from the bin part in the bulk part.
In this study, the WRF model with the WDM6-NCU microphysics scheme, which can describe the seeded-CCN size distribution with 43 bins and precisely evaluate the activation of seeded CCN, is developed and used to simulate the case of 21–22 October 2020. A realistic dataset describing the size distribution of the flare agent is used in the model simulation. In D04, one control run and four seed runs (Seed 1 to Seed 4) are conducted in one horizontal grid (1 km × 1 km) at different seeding levels (∼ 500, 1000, 1300, and 2200 m above mean sea level). The results reveal that seeding above 1000 m but below 2000 m enhances cumulative rainfall in the Shihmen region for 1 h after cloud seeding, and seeding at 500 m (cloud base) and 1300 m (in-cloud region), corresponding to Seed 1 and Seed 3, is selected for the runs with the lower and upper bound for rainfall, respectively, for subsequent sensitivity assessments and analyses (D05: 333 m × 333 m horizontal resolution).
In D05, eight runs are developed to examine the effect of cloud seeding for different seeding heights (500 and 1300 m), seeding areas (1, 10, and 100 km2), and seeding concentrations. With regard to the sensitivity of precipitation, the model simulation reveals that more precipitation is observed in the seeding scenarios in the in-cloud region and that introducing hygroscopic particles into a bigger domain or with higher concentrations can efficiently enhance precipitation in the in-cloud-seeding simulations. Moreover, the seeding scenarios at different heights have different microphysical properties. First, seeding at 1300 m can transport seeded CCN to higher levels and lead to a thicker CCN vertical distribution than the seeding scenarios at 500 m. Second, seeding at both 500 and 1300 m can enhance the mixing ratio of clouds (Qc) within 10 min after cloud seeding; however, Qc decreases earlier in the seeding scenarios at 1300 m because more cloud droplets can turn into raindrops. Third, seeding at 1300 m produces a stronger increase in mixing ratio of rain (Qr) than seeding at 500 m within 30 min after cloud seeding. The Dr increases more obviously in the seeding scenario at 1300 m, which results in more liquid water reaching the ground, thereby enhancing surface rainfall. Moreover, the signals are always more intense in the runs with larger seeding domains or higher seeded-CCN concentrations. Furthermore, only a little water vapour faces competition from hygroscopic particles, and therefore the saturation state of the environment is not extremely affected by cloud seeding. The seeding effects on microphysical processes, primarily cloud activation (Pcact), autoconversion of rain (Praut), and accretion of rain (Pracw), are evaluated. The results reveal that CSRD seeding agents can enhance the activation process (Pcact), and seeding at 1300 m can activate the seeding of more CCN in clouds. In addition, because of the strengthening of the accretion process (Pracw), more precipitation is developed in seeding scenarios at 1300 m (in-cloud region). Although the seeding scenarios at 500 m and with an area of 100 km2 enhanced the rainfall, mainly due to the enhancement of the autoconversion process (Praut), the enhancement is not efficient. Finally, the size distribution of the CCN after cloud seeding illustrates that hygroscopic particles larger than 0.4 µm primarily play an important role in cloud-seeding effects.
Overall, this study develops a hybrid cloud-seeding microphysics scheme and selects a case with optimal model performance and typical weather conditions in northern Taiwan to conduct a series of cloud-seeding sensitivity tests. In addition, the study elucidates the microphysics processes that are involved, from the launching of cloud seeding to the development of rainfall in northern Taiwan. In the future, more cases can be applied, and statistical analysis can be conducted. Furthermore, observational verification of cloud-seeding effects should also be conducted.
The radar data were provided by the Central Weather Bureau (CWB), Taiwan. The meteorological observation data are also available from Data Bank for Atmospheric & Hydrologic Research at https://doi.org/10.29840/DBAR.DB_RD_WFSL/Dataset (Lin et al., 2023.). The meteorological observation data at the Dongyan Mountain site were provided by the Cloud and Aerosol Laboratory of the Department of Atmospheric Sciences, National Central University of Taiwan (data are not publicly available).
KIL wrote the first manuscript and performed the formal analysis, software coding, and visualization for this research article. KSC and SHW provided resources and methods and supervised and edited the paper. KIL, KSC, SHW, LHC, YCL, PLL, WYC, HJC, and YHC interpreted and discussed the data results. All authors contributed to the final paper.
The contact author has declared that none of the authors has any competing interests.
Publisher's note: Copernicus Publications remains neutral with regard to jurisdictional claims in published maps and institutional affiliations.
We appreciate the anonymous reviewers for their invaluable comments that improved the quality of the manuscript.
This research has been supported by the National Science and Technology Council (grant no. 111-2625-M-008-014).
This paper was edited by Zhanqing Li and reviewed by three anonymous referees.
Bo-Tao, Z. and Jin, Q.: Changes of weather and climate extremes in the IPCC AR6, Advances in Climate Change Research, 17, 713–718, 2021.
Bruintjes, R. T., Jia, L., Busek, P., Salazar, V., Breed, D., Jensen, T., Ross, K., and Piketh, S.: Similarities between the effects of hygroscopic seeding and anthropogenic pollution on clouds, WMO/TD, No. 1146, 117–120, 2003.
Caro, D., Wobrock, W., and Flossmann, A. I.: A numerical study on the impact of hygroscopic seeding on the development of cloud particle spectra, J. Appl. Meteorol., 41, 333–350, 2002.
Chen, G. T.-J., Liu, C.-M., Jou, B. J.-D., and Chen, J.-P.: An assessment study and planning on precipitation enhancement program in Taiwan, Technical Report 84-2M-10, Central Weather Bureau, Ministry of Transportation and Communications, R.O.C. (Taiwan), 1995 (in Chinese).
Chen, S., Xue, L., and Yau, M.-K.: Impact of aerosols and turbulence on cloud droplet growth: an in-cloud seeding case study using a parcel–DNS (direct numerical simulation) approach, Atmos. Chem. Phys., 20, 10111–10124, https://doi.org/10.5194/acp-20-10111-2020, 2020.
Cooper, W. A., Bruintjes, R. T., and Mather, G. K.: Calculations pertaining to hygroscopic seeding with flares, J. Appl. Meteorol., 36, 1449–1469, 1997.
Dadashazar, H., Wang, Z., Crosbie, E., Brunke, M., Zeng, X., Jonsson, H., Woods, R. K., Flagan, R. C., Seinfeld, J. H., and Sorooshian, A.: Relationships between giant sea salt particles and clouds inferred from aircraft physicochemical data, J. Geophys. Res.-Atmos., 122, 3421–3434, 2017.
Dudhia, J.: Numerical study of convection observed during the winter monsoon experiment using a mesoscale two-dimensional model, J. Atmos. Sci., 46, 3077–3107, 1989.
Feingold, G., Cotton, W. R., Kreidenweis, S. M., and Davis, J. T.: The impact of giant cloud condensation nuclei on drizzle formation in stratocumulus: Implications for cloud radiative properties, J. Atmos. Sci., 56, 4100–4117, 1999.
Flossmann, A. I., Manton, M., Abshaev, A., Bruintjes, R., Murakami, M., Prabhakaran, T., and Yao, Z.: Review of advances in precipitation enhancement research, B. Am. Meteorol. Soc., 100, 1465–1480, 2019.
Gagin, A. and Neumann, J.: The second Israeli randomized cloud seeding experiment: Evaluation of the results, J. Appl. Meteorol. Clim., 20, 1301–1311, 1981.
Geresdi, I., Xue, L., and Rasmussen, R.: Evaluation of Orographic Cloud Seeding Using a Bin Microphysics Scheme: Two-Dimensional Approach, J. Appl. Meteorol. Clim., 56, 1443–1462, https://doi.org/10.1175/jamc-d-16-0045.1, 2017.
Grell, G. A. and Dévényi, D.: A generalized approach to parameterizing convection combining ensemble and data assimilation techniques, Geophys, Res, Lett,, 29, 38-31–38-34, 2002.
Guo, J., Deng, M., Lee, S. S., Wang, F., Li, Z., Zhai, P., Liu, H., Lv, W., Yao, W., and Li, X.: Delaying precipitation and lightning by air pollution over the Pearl River Delta. Part I: Observational analyses, J. Geophys. Res.-Atmos., 121, 6472–6488, https://doi.org/10.1002/2015jd023257, 2016.
Guo, X., Fu, D., Li, X., Hu, Z., Lei, H., Xiao, H., and Hong, Y.: Advances in cloud physics and weather modification in China, Adv. Atmos. Sci., 32, 230–249, 2015.
Hong, S.-Y., Noh, Y., and Dudhia, J.: A new vertical diffusion package with an explicit treatment of entrainment processes, Mon. Weather Rev., 134, 2318–2341, 2006.
Jensen, J. B. and Lee, S.: Giant Sea-Salt Aerosols and Warm Rain Formation in Marine Stratocumulus, J. Atmos. Sci., 65, 3678–3694, https://doi.org/10.1175/2008jas2617.1, 2008.
Jensen, J. B. and Nugent, A. D.: Condensational growth of drops formed on giant sea-salt aerosol particles, J. Atmos. Sci., 74, 679–697, 2017.
Jung, E., Albrecht, B. A., Jonsson, H. H., Chen, Y.-C., Seinfeld, J. H., Sorooshian, A., Metcalf, A. R., Song, S., Fang, M., and Russell, L. M.: Precipitation effects of giant cloud condensation nuclei artificially introduced into stratocumulus clouds, Atmos. Chem. Phys., 15, 5645–5658, https://doi.org/10.5194/acp-15-5645-2015, 2015.
Kerr, R. A.: Cloud seeding: One success in 35 years, Science, 217, 519–521, 1982.
Kogan, Y. L.: The simulation of a convective cloud in a 3-D model with explicit microphysics. Part I: Model description and sensitivity experiments, J. Atmos. Sci., 48, 1160–1189, 1991.
Köhler, H.: The nucleus in and the growth of hygroscopic droplets, T. Faraday Soc., 32, 1152–1161, https://doi.org/10.1039/TF9363201152, 1936.
Kueh, M.-T. and Lin, P.-L.: Springtime cloud properties in the Taiwan Strait: synoptic controls and local processes, Theor. Appl. Climatol., 116, 463–480, https://doi.org/10.1007/s00704-013-0969-y, 2013.
Lee, H. and Baik, J.-J.: A Comparative Study of Bin and Bulk Cloud Microphysics Schemes in Simulating a Heavy Precipitation Case, Atmosphere, 9, 475, https://doi.org/10.3390/atmos9120475, 2018.
Lee, S. S., Guo, J., and Li, Z.: Delaying precipitation by air pollution over the Pearl River Delta: 2. Model simulations, J. Geophys. Res.-Atmos., 121, 11739–11760, 2016.
Lehahn, Y., Koren, I., Altaratz, O., and Kostinski, A. B.: Effect of coarse marine aerosols on stratocumulus clouds, Geophys. Res. Lett., 38, L20804, https://doi.org/10.1029/2011GL048504, 2011.
Lelieveld, J.: Multi-phase processes in the atmospheric sulfur cycle, in: Interactions of C, N, P and S biogeochemical cycles and global change, edited by: Wollast, R., Mackenzie, F. T., and Chou, L., Springer, 305–331, https://doi.org/10.1007/978-3-642-76064-8_13, 1993.
Lim, K.-S. S. and Hong, S.-Y.: Development of an effective double-moment cloud microphysics scheme with prognostic cloud condensation nuclei (CCN) for weather and climate models, Mon. Weather Rev., 138, 1587–1612, 2010.
Lin, K.-I., Chung, K.-S., Wang, S.-H., Chen, L.-H., Liou, Y.-C., Lin, P.-L., Chang, W.-Y., Chiu, H.-J., and Chang, Y.-H.: Raw Data of RCWF and RCSL, DBAR [data set], https://doi.org/10.29840/DBAR.DB_RD_WFSL/Dataset, 2023.
Mather, G., Terblanche, D., Steffens, F., and Fletcher, L.: Results of the South African cloud-seeding experiments using hygroscopic flares, J. Appl. Meteorol., 36, 1433–1447, 1997.
Mlawer, E. J., Taubman, S. J., Brown, P. D., Iacono, M. J., and Clough, S. A.: Radiative transfer for inhomogeneous atmospheres: RRTM, a validated correlated-k model for the longwave, J. Geophys. Res.-Atmos., 102, 16663–16682, 1997.
Monin, A. S. and Obukhov, A. M.: Basic laws of turbulent mixing in the surface layer of the atmosphere, Contrib. Geophys. Inst. Acad. Sci. USSR, 151, 163–187, 1954.
Rosenfeld, D., Lohmann, U., Raga, G. B., O'Dowd, C. D., Kulmala, M., Fuzzi, S., Reissell, A., and Andreae, M. O.: Flood or drought:how do aerosols affect precipitation?, Science, 321, 1309–1313, 2008.
Rosenfeld, D., Axisa, D., Woodley, W. L., and Lahav, R.: A Quest for Effective Hygroscopic Cloud Seeding, J. Appl. Meteorol. Clim., 49, 1548–1562, https://doi.org/10.1175/2010jamc2307.1, 2010.
Rosenfeld, D., Sherwood, S., Wood, R., and Donner, L.: Climate effects of aerosol-cloud interactions, Science, 343, 379–380, 2014.
Segal, Y., Khain, A., Pinsky, M., and Rosenfeld, D.: Effects of hygroscopic seeding on raindrop formation as seen from simulations using a 2000-bin spectral cloud parcel model, Atmos. Res., 71, 3–34, 2004.
Seto, J., Tomine, K., Wakimizu, K., and Nishiyama, K.: Artificial cloud seeding using liquid carbon dioxide: Comparisons of experimental data and numerical analyses, J. Appl. Meteorol. Clim., 50, 1417–1431, 2011.
Silverman, B. A.: A critical assessment of hygroscopic seeding of convective clouds for rainfall enhancement, B. Am. Meteorol. Soc., 84, 1219–1230, 2003.
Silverman, B. A. and Sukarnjanaset, W.: Thailand warm-cloud hygroscopic particle seeding experiment, J. Appl. Meteorol. Clim., 39, 1160–1175, 2000.
Tessendorf, S. A., French, J. R., Friedrich, K., Geerts, B., Rauber, R. M., Rasmussen, R. M., Xue, L., Ikeda, K., Blestrud, D. R., Kunkel, M. L., Parkinson, S., Snider, J. R., Aikins, J., Faber, S., Majewski, A., Grasmick, C., Bergmaier, P. T., Janiszeski, A., Springer, A., Weeks, C., Serke, D. J., and Bruintjes, R.: A Transformational Approach to Winter Orographic Weather Modification Research: The SNOWIE Project, B. Am. Meteorol. Soc., 100, 71–92, https://doi.org/10.1175/bams-d-17-0152.1, 2019.
Tessendorf, S. A., Chen, S., Weeks, C., Bruintjes, R., Rasmussen, R. M., and Xue, L.: The Influence of Hygroscopic Flare Seeding on Drop Size Distribution Over Southeast Queensland, J. Geophys. Res.-Atmos., 126, e2020JD033771, https://doi.org/10.1029/2020jd033771, 2021.
Tonttila, J., Afzalifar, A., Kokkola, H., Raatikainen, T., Korhonen, H., and Romakkaniemi, S.: Precipitation enhancement in stratocumulus clouds through airborne seeding: sensitivity analysis by UCLALES-SALSA, Atmos. Chem. Phys., 21, 1035–1048, https://doi.org/10.5194/acp-21-1035-2021, 2021.
Wang, F., Li, Z., Jiang, Q., Wang, G., Jia, S., Duan, J., and Zhou, Y.: Evaluation of hygroscopic cloud seeding in liquid-water clouds: a feasibility study, Atmos. Chem. Phys., 19, 14967–14977, https://doi.org/10.5194/acp-19-14967-2019, 2019.
Wang, J., Yue, Z., Rosenfeld, D., Zhang, L., Zhu, Y., Dai, J., Yu, X., and Li, J.: The Evolution of an AgI Cloud-Seeding Track in Central China as Seen by a Combination of Radar, Satellite, and Disdrometer Observations, J. Geophys. Res.-Atmos., 126, e2020JD033914, https://doi.org/10.1029/2020JD033914, 2021.
Weigel, A. P., Chow, F. K., and Rotach, M. W.: On the nature of turbulent kinetic energy in a steep and narrow Alpine valley, Bound.-Lay. Meteorol., 123, 177–199, 2007.
Xue, L., Chu, X., Rasmussen, R., Breed, D., Boe, B., and Geerts, B.: The Dispersion of Silver Iodide Particles from Ground-Based Generators over Complex Terrain. Part II: WRF Large-Eddy Simulations versus Observations, J. Appl. Meteorol. Clim., 53, 1342–1361, https://doi.org/10.1175/jamc-d-13-0241.1, 2014.
Yin, Y., Levin, Z., Reisin, T., and Tzivion, S.: Seeding convective clouds with hygroscopic flares: Numerical simulations using a cloud model with detailed microphysics, J. Appl. Meteorol., 39, 1460–1472, 2000.