the Creative Commons Attribution 4.0 License.
the Creative Commons Attribution 4.0 License.
 | 20 Sep 2023
Inferring the photolysis rate of NO2 in the stratosphere based on satellite observations
Susan Solomon
Sasha Madronich
Douglas Kinnison
NO and NO2 (NOx) play major roles in both tropospheric and stratospheric chemistry. This paper provides a novel method to obtain a global and accurate photolysis rate for NO2 based on satellite data. The photolysis rate J(NO2) dominates the daytime diurnal variation of NOx photochemistry. Here the spatial variation of J(NO2) at 50–90∘ S in December from 20–40 km is obtained using data from the Michelson Interferometer for Passive Atmospheric Sounding (MIPAS) experiment. Because NO and NO2 rapidly exchange with one another in the daytime, J(NO2) can be attained assuming steady state, and the results are shown to be consistent with model results. The J(NO2) value decreases as the solar zenith angle increases and has a weak altitude dependence. A key finding is that satellite-derived J(NO2) increases in the polar regions, in good agreement with model predictions, due to the effects of ice and snow on surface albedo. Thus, the method presented here provides an observation-based check on the role of albedo in driving polar photochemistry.
- Article
(3508 KB) - Full-text XML
-
Supplement
(775 KB) - BibTeX
- EndNote


Fast photochemistry in the Earth's atmosphere is driven by sunlight and affects the diurnal variation of many species. The properties of sunlight entering the stratosphere, including light intensity and its energy distribution, depend on the solar zenith angle, as well as distributions of absorbing species. Further, the solar zenith angle is related to latitude, season, and local time. The sunlight entering the stratosphere determines the photochemical rates in the stratosphere, thus affecting stratospheric chemistry, and the diurnal variations of species concentration is one of the impacts. Therefore, diurnal variation observations provide key information in analyzing the photochemical properties of the stratosphere. NOx chemistry is one of the most important elements of stratospheric chemistry and plays a leading role in controlling stratospheric ozone concentration (Crutzen, 1979; Johnston, 1971; Crutzen, 1970). The photolysis rate J(NO2) quantifies the process of NO2 photolysis into NO, thus affecting the diurnal variation of NOx. The stratospheric NO and NO2 abundances are controlled by the following reactions.
Because of the short lifetime of NO and NO2, they are in steady state within the sunlit stratosphere. Therefore, the following equation holds.
A number of studies on the diurnal variation of NOx and J(NO2) in the stratosphere have been reported based on models or airborne observations. Fabian et al. (1982) used a two-dimensional model to examine the diurnal variations of NOx at different altitudes. Many studies focused on the diurnal variation of NOx using airborne observations, and these were subsequently compared with models (Pommereau, 1982; Roscoe et al., 1986; Kawa et al., 1990). Madronich et al. (1985) measured J(NO2) in the stratosphere utilizing a balloon platform and compared it to a model; they showed that the J(NO2) value has a weak altitude dependence. Webster and May (1987) measured the diurnal variation of NOx and J(NO2) simultaneously utilizing a balloon. Del Negro et al. (1999) calculated J(NO2) based on the concentrations of NO, NO2, O3, ClO, and HO2 measured on an aircraft and BrO from a model and compared them with a model. They found that the J(NO2) inferred from the data assuming steady state matched their model well. Moreover, it has been emphasized that albedo has a substantial effect on J(NO2) (Madronich, 1987; Bösch et al., 2001; Laepple, 2005; Walker et al., 2022). Further, the surface albedo over ice and snow has a large and important effect on tropospheric chemistry in the polar regions (Walker et al., 2022) due in large part to its effect on J(NO2), highlighting the need to evaluate J(NO2) on a large scale. Surface radiometers have also been used to infer information about J(NO2) for different sky conditions in the troposphere (Shetter et al., 1992; Junkermann et al., 1989). However, aircraft, surface radiometers, and balloon measurements are all local and the number of data are therefore limited. At the same time, models are based on theoretical calculations and require measured data for verification. These considerations are the motivation for this paper, in which satellite data are used to characterize J(NO2) on a global basis, with particular emphasis on values obtained over ice and snow.
Satellite measurements of NOx allow elucidation of its zenith angle and albedo dependence. The global concentrations of NO, NO2, and related species as discussed below can be easily obtained using satellite data and used to determine J(NO2) at different latitudes, albedo, and altitudes. Solomon et al. (1986) reported satellite observations of the NO2 diurnal variation in the stratosphere at solar zenith angles ranging from about 35 to 110∘, but concurrent NO data were not available. Anderson et al. (1981) employed a similar method to study the zenith angle variation of mesospheric O3. The Michelson Interferometer for Passive Atmospheric Sounding (MIPAS) is a Fourier transform spectrometer carried on Envisat, measuring not only NO2 but also NO and O3, as well as ClO, all of which are used here in inferring J(NO2) (see below). MIPAS was designed and operated for the measurement of atmospheric species from space and can detect limb emissions in the middle atmosphere with high spectral resolution and low-noise performance (Fischer et al., 2008).
In this work, the novel method of obtaining the zenith angle dependence of NOx and J(NO2) using satellite data in summer over the polar cap is reported, taking 50–90∘ S in December at 20–40 km as an example. The diurnal variations of NOx and J(NO2) at different altitudes are described. J(NO2) changes with latitude are discussed and a J(NO2) map in the Antarctic is used to elucidate albedo effects. In summary, this work shows a method for obtaining NOx diurnal variation and accurate J(NO2) based on satellite data, expanding the way to attain information on this key photolysis rate.
2.1 MIPAS data
The vertical resolution of MIPAS is approximately 3–8 km in the stratosphere, and the horizontal resolution is 30 km across-track, with about 500 km along-track until 2004 (400 km after 2004). The vertical scan range is 5–150 km. Satellite operation was stopped temporarily in March 2004 due to technical issues and resumed in January 2005 in a new operation mode. MIPAS allows nearly complete global coverage, ranging from 87∘ S to 89∘ N obtained about every 3 d by 73 scans per orbit and 14.3 orbits per day. Each day the satellite passes through the same latitude at two local times (ascending side and descending side, as shown in Fig. 1). Therefore, for this dataset, there are only two solar zenith angles at each latitude. We therefore focus on 50–90∘ S in the polar day in December 2009, for which there are as many solar zenith angles as possible in a relatively small latitude range. The data from the satellite were averaged daily and zonally (because the specific latitudes of the satellite data vary somewhat from one orbit to another, we bin the data using a 2∘ interval). Then we calculate the 4 d running mean, which is shown in Figs. 2 and 3.
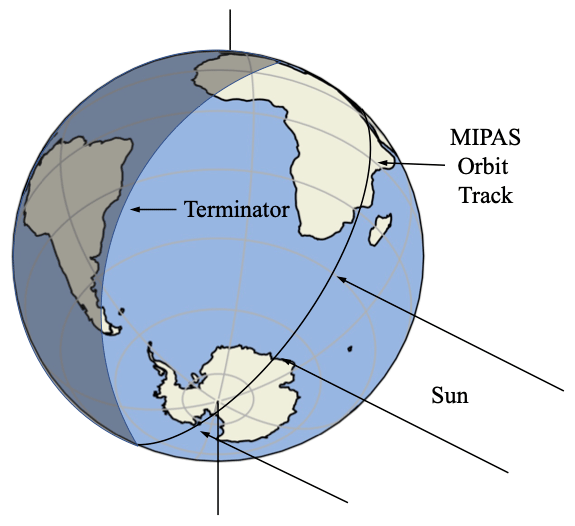
Figure 1Schematic representation of the MIPAS orbit at high latitude in December showing the ascending (dayside) and descending (nightside) portions of the orbit and the terminator.
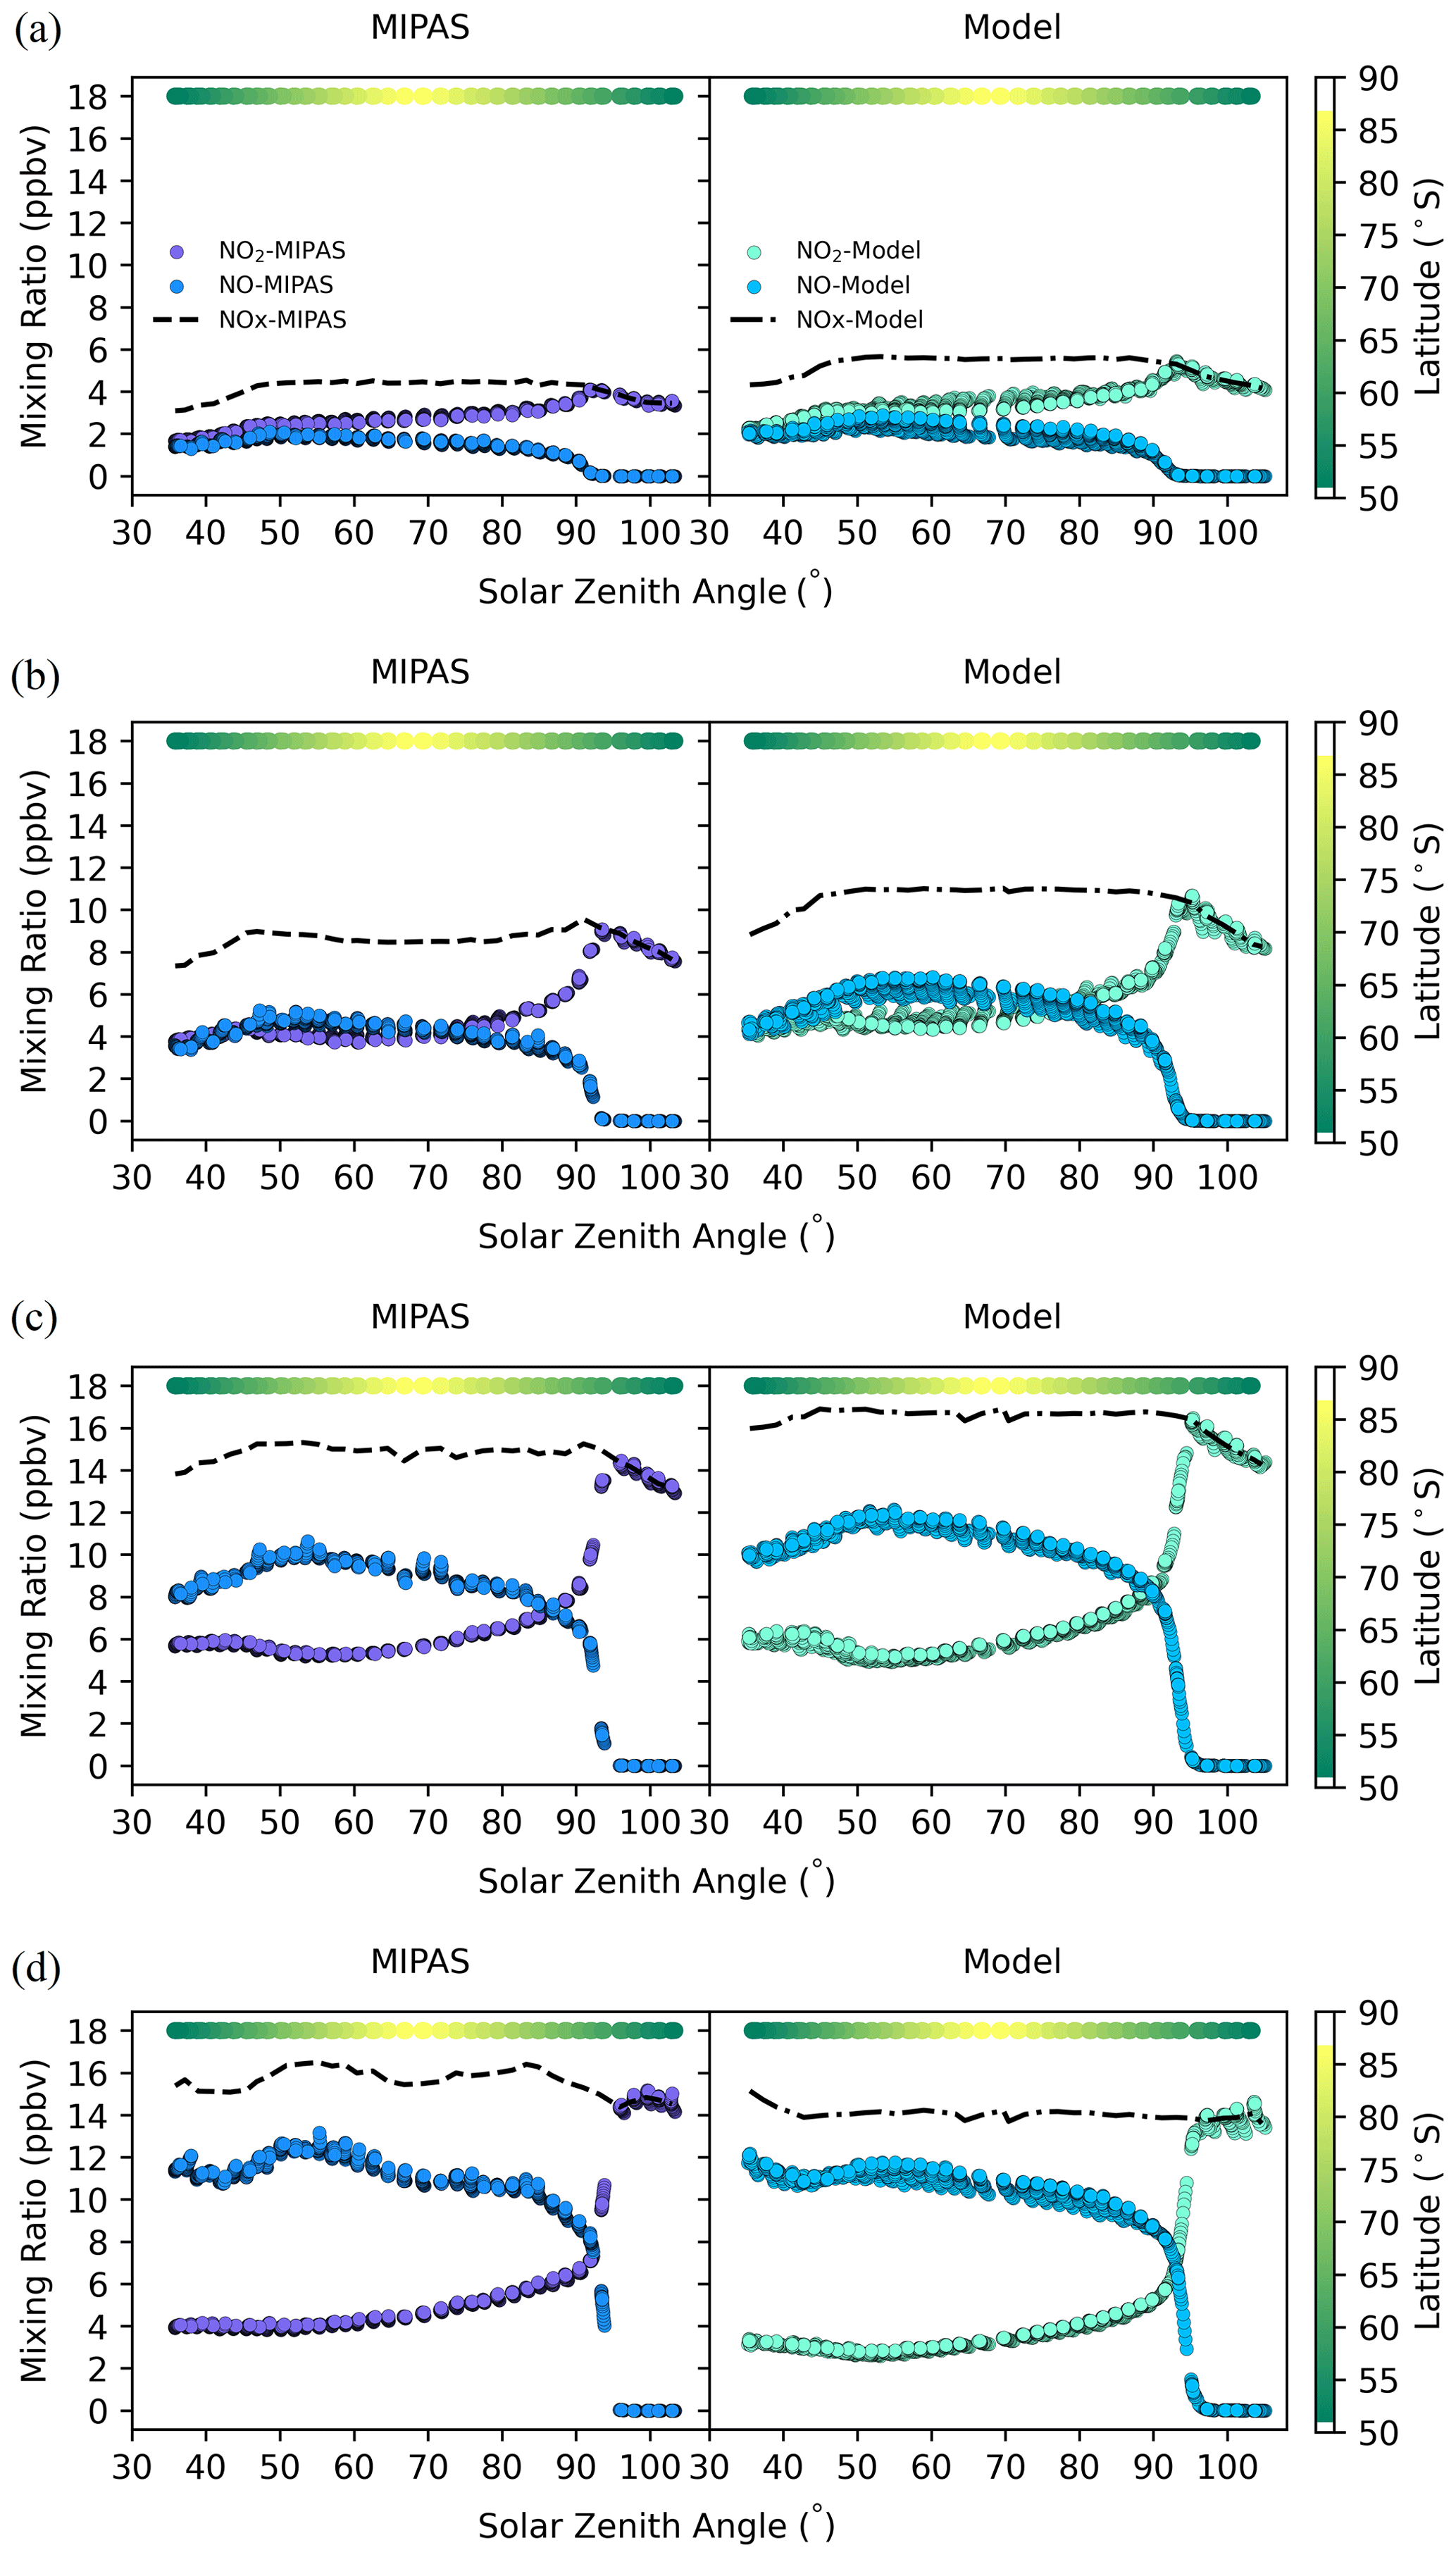
Figure 2The concentrations of NO, NO2, and NOx at 50–90∘ S in December 2009 from MIPAS and the model at different altitudes: (a) 23 km, (b) 28 km, (c) 33 km, and (d) 38 km. Model values are at the same time and location as the satellite data. The color bar represents the latitude of the data points at each solar zenith angle. To ensure clear visual distinction for each point, black outlines are applied around them.
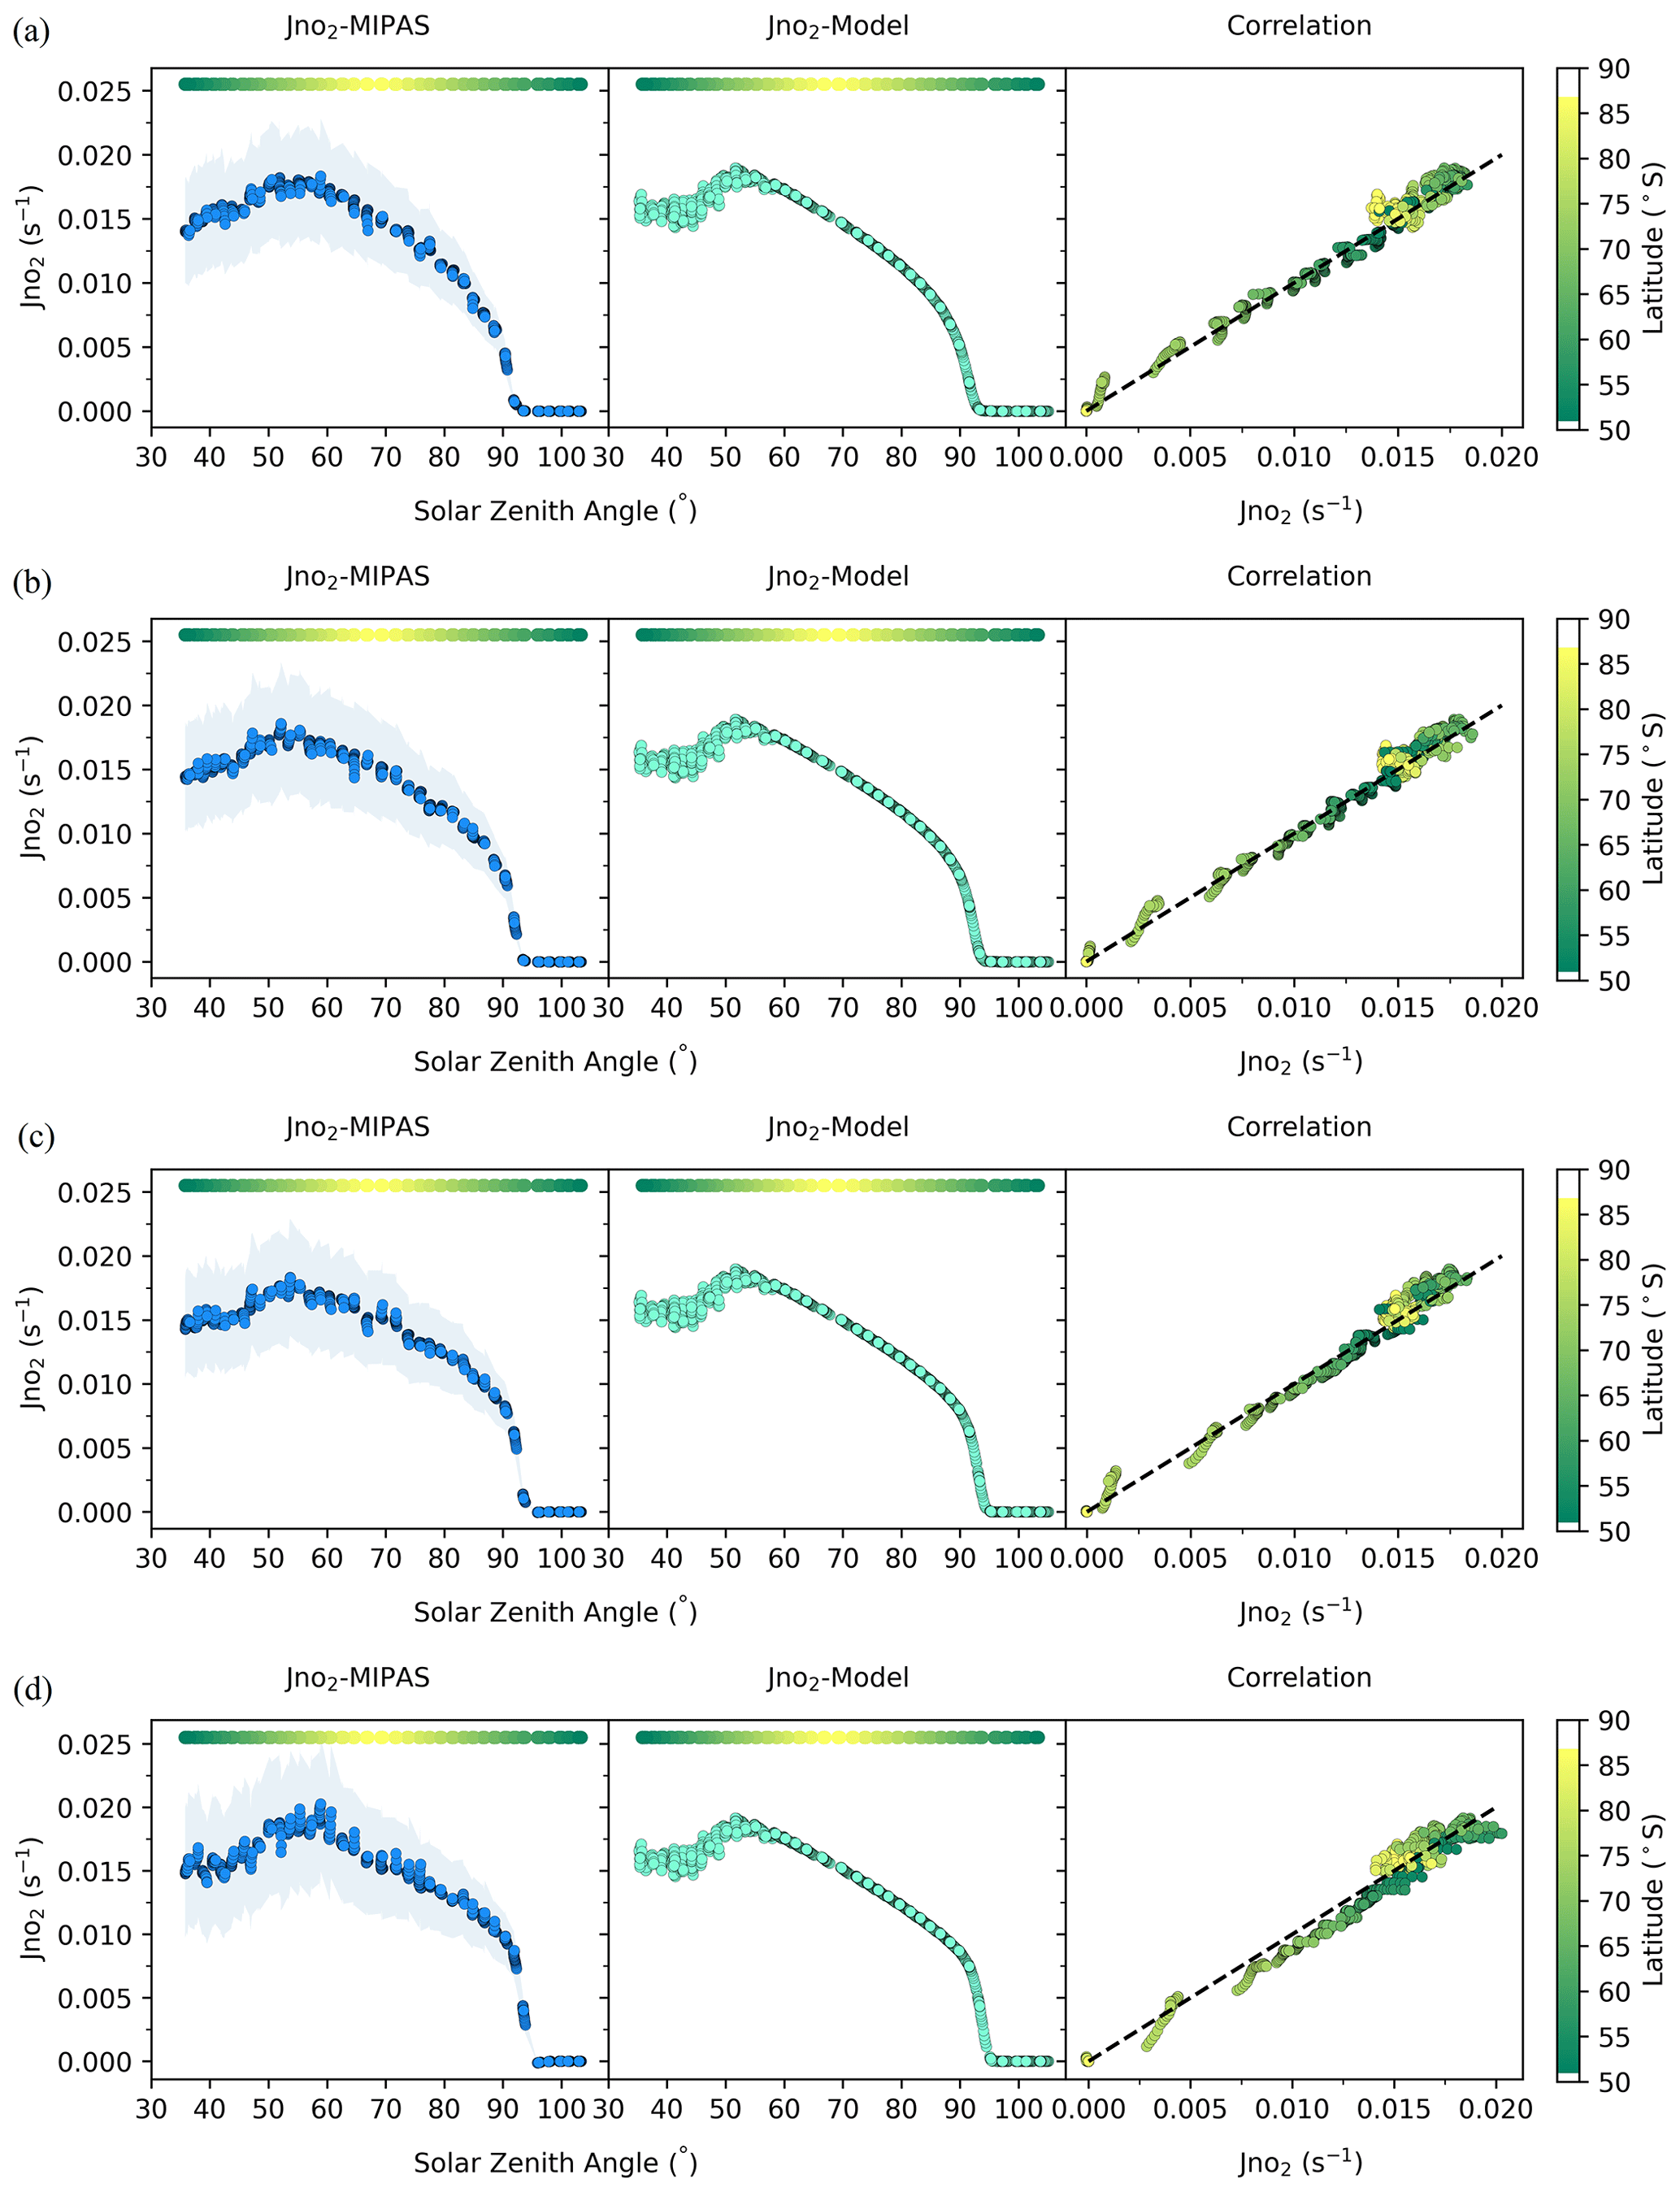
Figure 3J(NO2) at 50–90∘ S from MIPAS and the model at different altitudes: (a) 23 km, (b) 28 km, (c) 33 km, and (d) 38 km. Model values are for the same time and location as the satellite data. The color bar represents the latitude of the data points at each solar zenith angle. In the correlation plots, the abscissa is J(NO2) from MIPAS and the ordinate is J(NO2) from the model; the slope of the dashed line is 1. To ensure clear visual distinction for each point, black outlines are applied around them.
In this paper, we used the NO, NO2, O3, ClO, temperature, and pressure data from V8 MIPAS retrievals performed with the IMK/IAA level 2 processor. The retrieval of temperature was reported by Kiefer et al. (2021). For NO retrieval, the method considered the populations of excited NO states (Funke et al., 2005). This implies that photolysis of NO2 is included in the retrieval priors. However, retrieved NO is only weakly dependent on prior knowledge of J(NO2) values (10 %–15 %). In our calculations, according to Eqs. (2) and (3), NO, NO2, and O3 play comparable roles in the calculation of J(NO2), reducing the impact of prior knowledge on the final results. Therefore, prior knowledge of J(NO2) will have a small effect on our findings as long as prior knowledge of J(NO2) is not completely incorrect. The NO retrieval was documented by Funke et al. (2023), who reported an accuracy of 8 %–15 % for altitudes of 20 to 40 km. Regarding O3, Kiefer et al. (2023) reported an accuracy of 3 %–8 % in the altitude region of interest. The retrievals of NO2 and ClO were described by Funke et al. (2005) and von Clarmann et al. (2009), respectively, with accuracies of 0.2–0.8 ppbv for NO2 and total error of more than 35 % for ClO. However, please note that these papers refer to older data versions. Accuracy estimates for V8 ClO and NO2 are not yet available, but the values quoted here were used as a rough guideline.
2.2 Model calculations
The Whole Atmosphere Community Climate Model version 6 (WACCM6) is used in this study. WACCM6 is a component of the Community Earth System Model version 2 (CESM2; Gettelman et al., 2019; Danabasoglu et al., 2020). The horizontal resolution is 1.9∘ latitude × 2.5∘ longitude, with 88 vertical levels up to about 140 km, and the altitude resolution increases from 0.1 km near the surface to 1.0 km in the upper troposphere–lower stratosphere (UTLS) and 1–2 km in the stratosphere. This work uses the specified dynamics version of WACCM6, wherein the atmosphere below 50 km is nudged to the Modern-Era Retrospective Analysis for Research and Applications version 2 (MERRA-2; Gelaro et al., 2017) temperature and wind fields with a relaxation time of 50 h. The chemistry mechanism includes a detailed representation of the middle atmosphere, with a sophisticated suite of gas-phase and heterogeneous chemistry reactions, including the Ox, NOx, HOx, ClOx, and BrOx reaction families. There are ∼ 100 chemical species and ∼ 300 chemical reactions. Reaction rates are updated following Jet Propulsion Laboratory (JPL) 2015 recommendations (Burkholder et al., 2015). The photolytic approach is based on both inline chemical modules (<200 nm) and a lookup table approach (> 200–750 nm; see Kinnison et al., 2007). The lookup table (LUT) approach uses the Tropospheric Ultraviolet–Visible Radiation Model (TUV4.2; Madronich, 1987; Madronich and Weller, 1990), an advanced radiation transfer model widely used by the scientific community, using the four-stream pseudo-spherical discrete ordinate option. TUV has demonstrated excellent performance in intercomparisons with ground-based measurements, particularly under ideal sky conditions (Shetter et al., 2003). Model values for December 2009 at the same times and locations as the satellite data are selected by the satellite profile algorithm to compare with the satellite data and denoted “model”. The satellite profile algorithm outputs constituents (e.g., J(NO2) and NOx concentrations) at the nearest latitude, longitude, and local time to the observation.
2.3 Chemical equation
NO is assumed to be in a steady state in the sunlit atmosphere at 20–40 km at least for zenith angles less than 94∘ due to its short lifetime. Using the chemistry discussed above, J(NO2) can then be expressed as
where k is the rate constant, J(NO2) is the photolysis rate of NO2, and [O3] is the concentration of O3.
To obtain the concentration of O, O is assumed to be in a steady state with ozone at 20–40 km. The concentration of O can be expressed as
, kNO+ClO, and , as well as their uncertainties, are from JPL (Burkholder et al., 2015), and and its uncertainty are from International Union of Pure and Applied Chemistry (IUPAC; Atkinson et al., 2004). It is worth noting that J(O3) in Eq. (3) comes from the model here, which is a limitation of this study. However, in the stratosphere below about 33 km [O] has a small effect on J(NO2) calculation (less than 8.1 %) due to its low concentration (Johnston and Podolske, 1978). ClO can similarly be ignored when altitudes are lower than 35 km, where ClO concentrations are small (Sagawa et al., 2013); otherwise, using ClO data from MIPAS would introduce large and unnecessary uncertainty. HO2 and BrO can both react with NO, but they are not measured by MIPAS and their contributions to the partitioning between NO and NO2 are negligibly small at the altitudes considered here (Del Negro et al., 1999). Therefore, we do not consider them in this paper.
3.1 NOx concentration at different altitudes
To better understand the diurnal variation of NOx, concentrations of NO and NO2 from MIPAS and the model at different altitudes are shown in Fig. 2. The NO and NO2 concentrations from MIPAS and the model show very good overall consistency. The solar zenith angle of 90∘ is a clear dividing line, showing that light drives the diurnal variation, and the results are in good agreement with the theory.
NO and NO2 exchange with one another, but their sum (NOx) varies relatively little for solar zenith angles less than about 90∘. An increase in NO is matched by a decrease in NO2 for zenith angles from about 30–50∘, and then NO concentration decreases at larger angles, mainly reflecting changes in the photolysis rate as the satellite sweeps across the midlatitudes and polar cap (see below). NO rapidly disappears when the solar zenith angle exceeds 90∘, and the concentrations of NO and NO2 change dramatically during twilight. NO decreases rapidly, while NO2 increases rapidly. When the solar zenith angle is more than 90∘ at these altitudes, NO is completely oxidized to NO2, so there is no NO and is 1. In addition, the concentration of NO2 decreases slightly when the solar zenith angle is more than 90∘, which indicates the formation of N2O5.
It should also be noted that in Fig. 2, the concentrations of NO and NO2 also reflect latitude variations because the data at each zenith angle come from different latitudes as shown by the color bar at the top of each panel, but these variations are fairly small over the summer polar cap and consistent with the model as shown. From 23 to 33 km, the concentrations of NO and NO2 increase with altitude.
3.2 J(NO2) at different altitudes and solar zenith angles
Using Eq. (2) above, J(NO2) and the error bar at different altitudes are shown in Fig. 3 along with the J(NO2) values from the model. The correlation diagrams show that the values inferred from the satellite observations are in excellent agreement with the model. Figure 3 shows that the J(NO2) values at different altitudes within the 20–40 km range are nearly identical. This indicates the weak dependence of the J(NO2) value on altitude, which was also reported by Madronich et al. (1985). This is because NO2 photolysis is largely driven by wavelengths ranging from 300 to 420 nm (Madronich et al., 1983), which lie within a spectral region relatively free of atmospheric absorption. Consequently, the flux remains nearly constant at different altitudes. When the solar zenith angle is higher than about 90∘, the J(NO2) value rapidly drops to 0. The uncertainty is also shown in Fig. 3, and the model J(NO2) is within the error bar. The deviation between the results and the model is significantly smaller than the 1σ uncertainty, implying that the estimates of measurement errors of MIPAS may be conservative. To illustrate how different species affect our calculations at some altitudes, the effects of different gases at 38 km are shown in Fig. S1 in the Supplement. The figure shows that O3, O, and ClO are critical to NOx chemistry at 38 km. However, the concentrations of ClO and O are smaller at altitudes lower than 35 km and have about a 3.6 % and less than 12 % influence in our calculations, respectively. Moreover, the satellite data error of ClO becomes larger at lower altitudes, so ClO is not considered here when the altitude is lower than 35 km.
3.3 J(NO2) at different latitudes
The J(NO2) values from the satellite and the model at different latitudes are next discussed. The clear relationship between J(NO2) and latitude from MIPAS and the model is also displayed in Fig. 4, and the close comparison between the two is remarkable. It is obvious that the satellite-inferred J(NO2) monotonically increases with latitude from 30–70∘ S and then decreases at higher latitudes. J(NO2) over the pole is taken at a larger solar zenith angle, which explains its decrease relative to surrounding parts of Antarctica. Figure 5 displays maps of the detailed distributions of J(NO2) from MIPAS and the model, which exhibits their excellent consistency and shows a sharp transition between midlatitudes and the Antarctic continent or regions covered by sea ice.
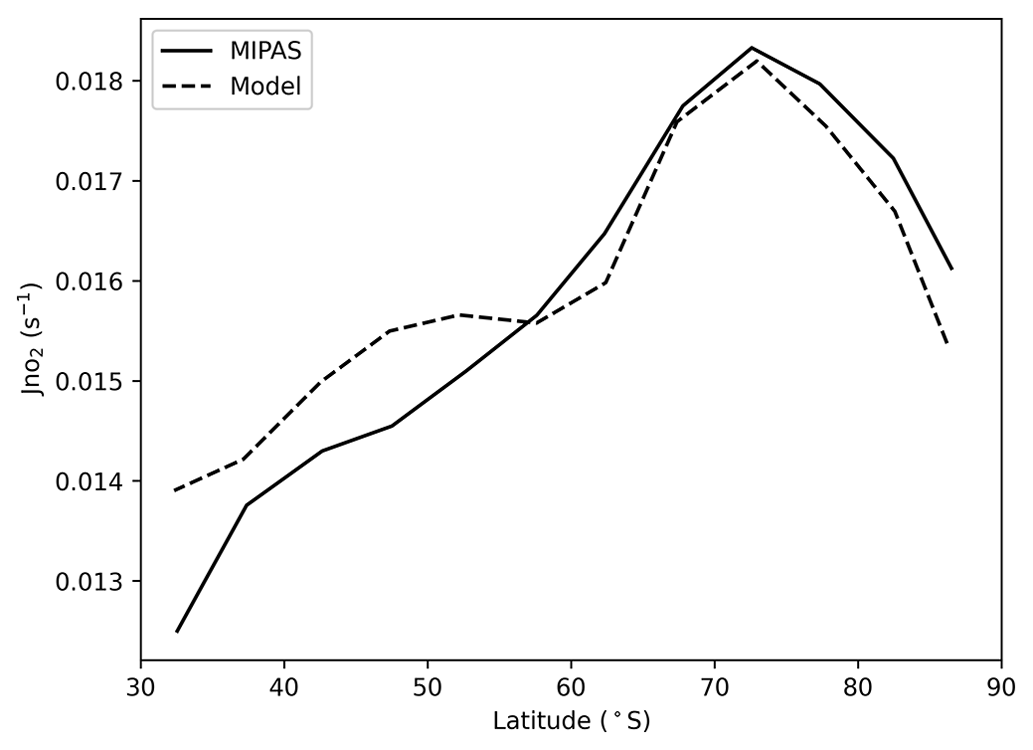
Figure 4The relationship between J(NO2) and latitude from MIPAS and the model at 30–90∘ S and at 28 km. Model data are for the same time and location as the satellite data. J(NO2) is examined wherever the solar zenith angle is less than 70∘ and averaged every 5∘ of latitude.
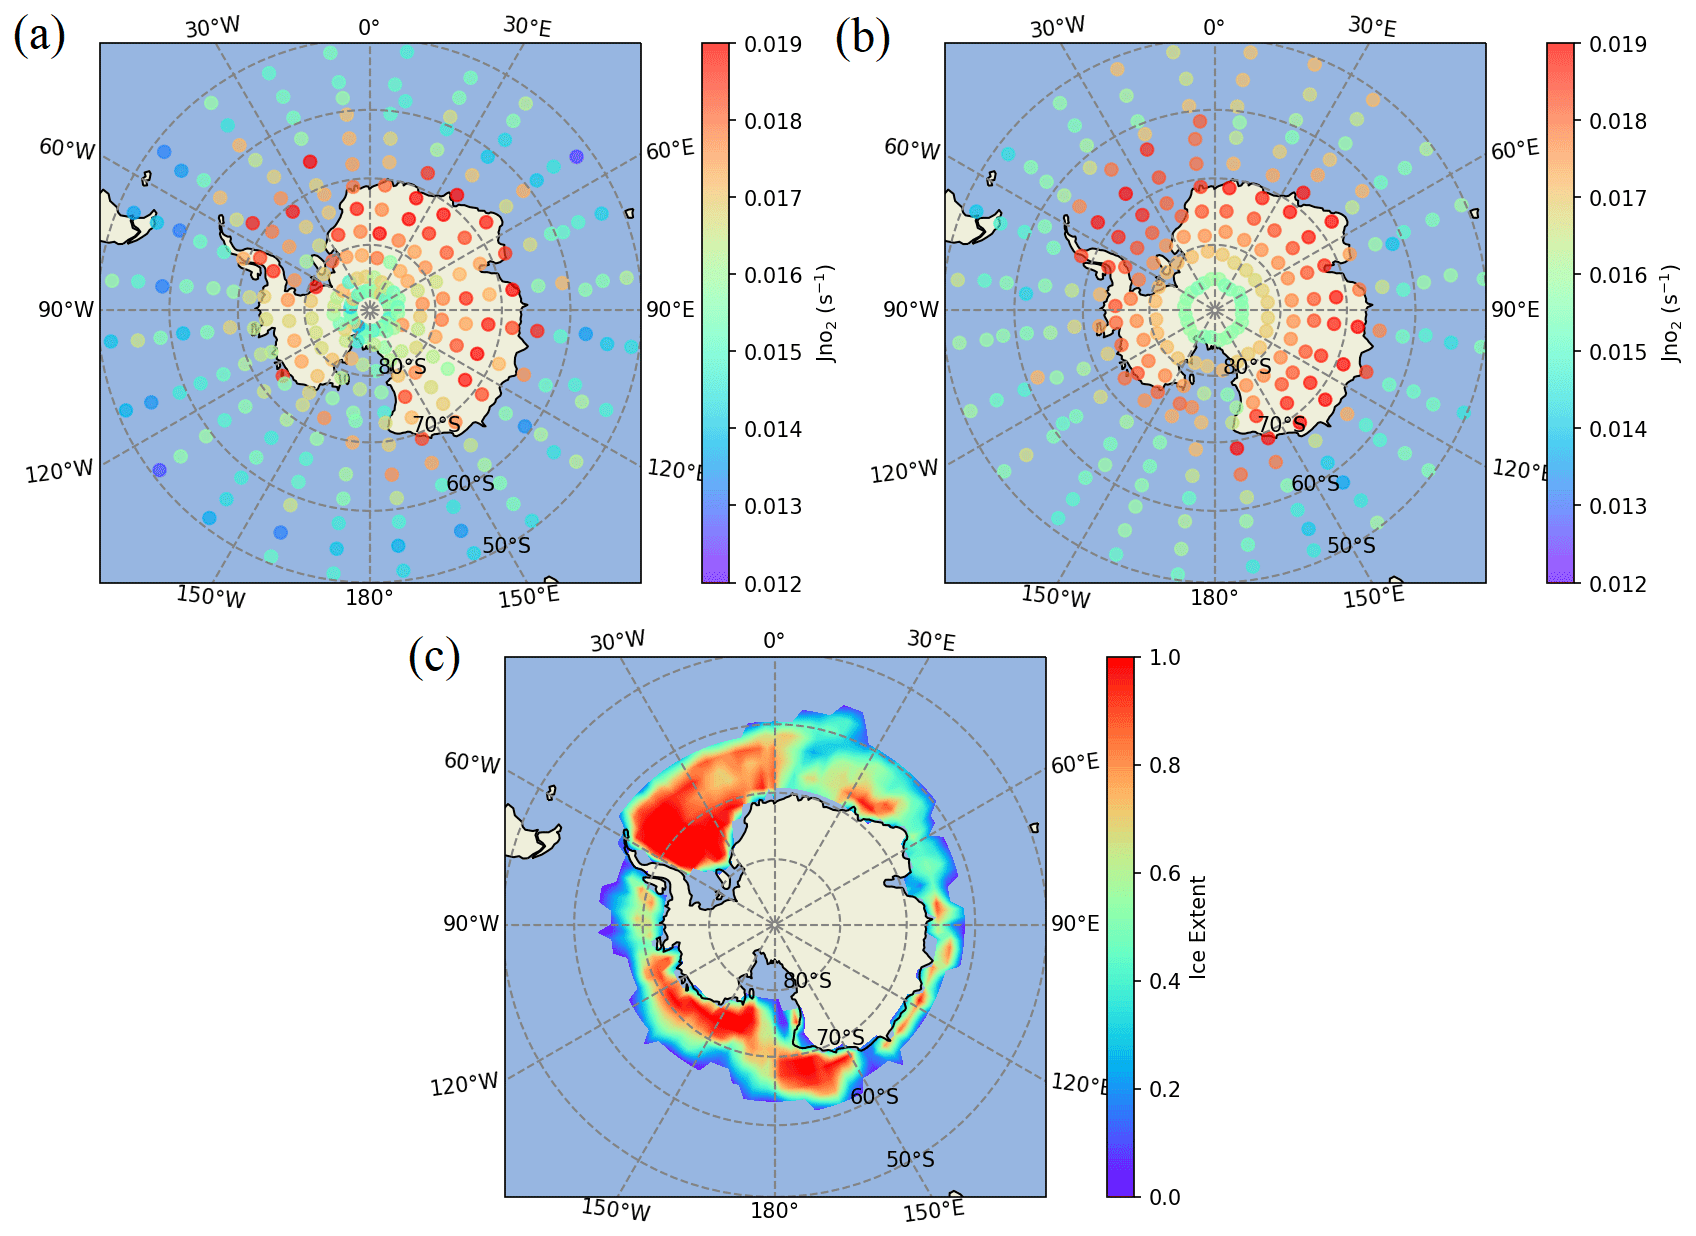
Figure 5The mapping of J(NO2) at 50–90∘ S and at 28 km from (a) MIPAS and (b) the model. (c) The distribution of the sea ice extent in December 2009 in Antarctica from the model. Model J(NO2) data are for the same time and location as the satellite data. J(NO2) is shown wherever the solar zenith angle is less than 70∘ and averaged every 3.33∘ latitude × 15∘ of longitude.
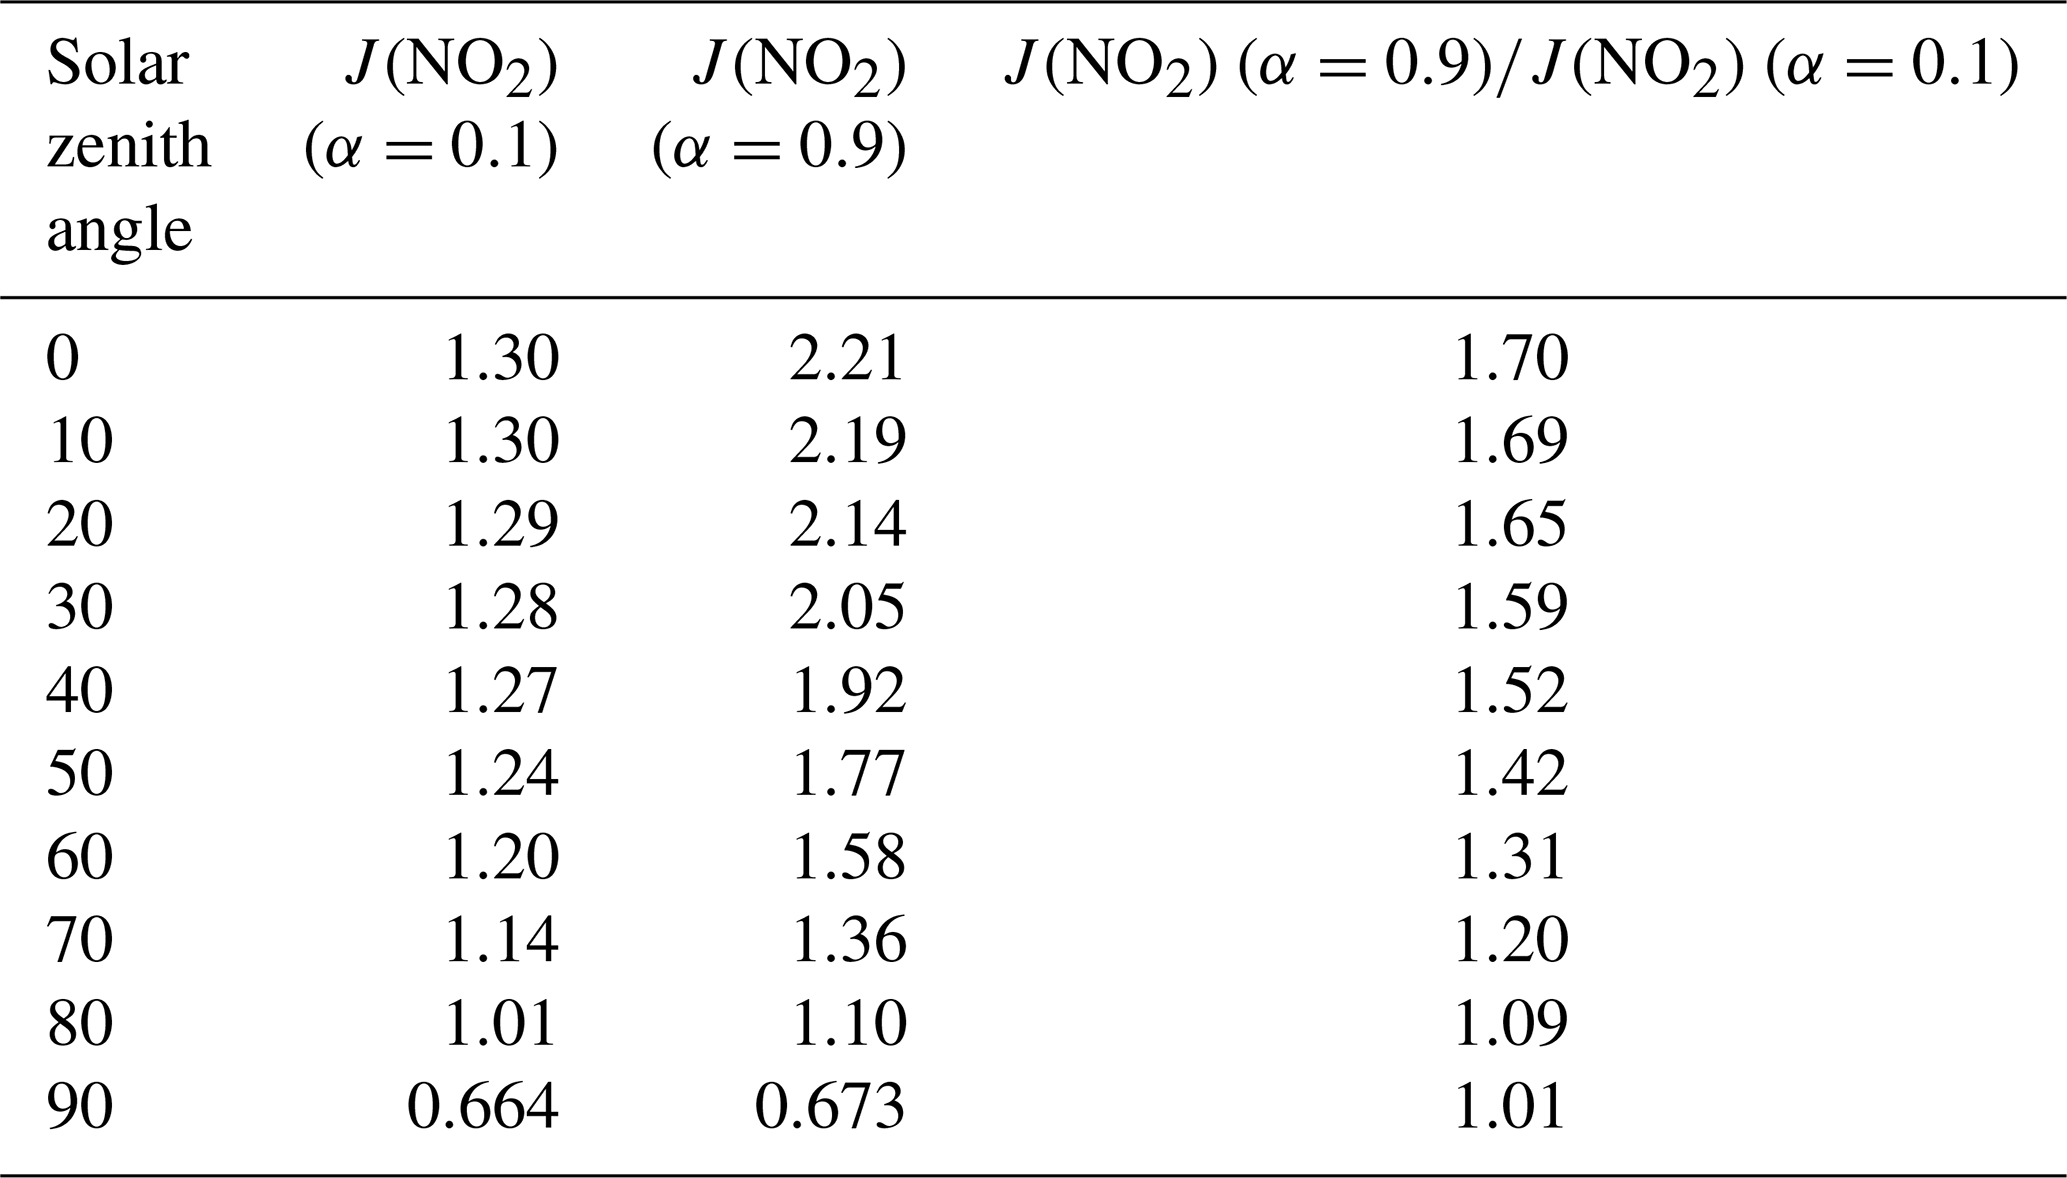
The sharp transitions in J(NO2) values shown in Fig. 5 can only be caused by the large difference in albedo between the ocean and the Antarctic environs, covered by sea ice, land ice, and snow (Brandt et al., 2005; Shao and Ke, 2015). Albedo has a strong influence on J(NO2) because NO2 is more sensitive than most atmospheric species to the effects of scattering and reflection (Madronich et al., 1983; Madronich, 1987; Bösch et al., 2001; Laepple et al., 2005). This is because the atmosphere exhibits considerable transparency at frequencies relevant to NO2 photolysis, allowing a large number of photons to persist throughout the long atmospheric path, reaching Earth's surface and eventually returning to the stratosphere. In the high-latitude area, the ground is covered with ice and snow, and the albedo can be as high as 0.9, while at lower latitudes, the albedo is about 0.1 (Brandt et al., 2005; Shao and Ke, 2015). Table 1 shows the J(NO2) values at different solar zenith angles under different albedos. The results show that the albedo has a strong influence on the values, especially at low solar zenith angles. Based on Fig. 5, J(NO2) above the continental ice is greater than that above the Antarctic sea ice, which may be because the fraction of open water within the pack influences the albedo (Brandt et al., 2005).
Table 1J(NO2) at different solar zenith angles under different albedos (α).
The diurnal variations of NOx species and the resulting J(NO2) from about 50–90∘ S in December at 20–40 km have been evaluated based on MIPAS data. Light has a strong impact on the diurnal variations. NO and NO2 are in steady state in the daytime, and their sum is almost constant.
The calculated J(NO2) is remarkably consistent with the model results, and the J(NO2) value decreases as the solar zenith angle increases. The J(NO2) value rapidly drops to 0 at the solar zenith angle of about 90∘. Moreover, the weak dependence of the J(NO2) value on altitude in this region is evident.
The results from the satellite and the model both indicate that J(NO2) increases with latitude, which can be attributed to more reflected light from ice and snow surfaces with high albedo. In summary, this work presents a new method for obtaining accurate J(NO2) values mainly based on satellite data. Further, this method can be extended to other photolysis rates, paving the way for further tests of global photolysis rate data based on satellites.
The data and code are available at https://doi.org/10.5281/zenodo.7764756 (Guan et al., 2023).
The supplement related to this article is available online at: https://doi.org/10.5194/acp-23-10413-2023-supplement.
SS designed the study. JG analyzed the data and produced the figures. SM and DK ran the models and significantly contributed to the interpretation of findings. JG wrote the paper, with comments from all authors.
The contact author has declared that none of the authors has any competing interests.
Publisher's note: Copernicus Publications remains neutral with regard to jurisdictional claims in published maps and institutional affiliations.
Doug Kinnison was funded in part by NASA (grant no. 80NSSC19K0952). Susan Solomon acknowledges support as the Martin Professor of environmental studies at MIT, while Jian Guan appreciates an MIT presidential fellowship. Sasha Madronich acknowledges partial support by the US Department of Agriculture (USDA) UV-B Monitoring and Research Program, Colorado State University, under the USDA National Institute of Food and Agriculture (grant nos. 2019-34263-30552 and 2022-34263-38472). The CESM project is supported by the National Science Foundation and the Office of Science (BER) of the U.S. Department of Energy. We gratefully acknowledge high-performance computing support from Cheyenne (https://doi.org/10.5065/D6RX99HX, last access: 12 September 2023) provided by NCAR's Computational and Information Systems Laboratory, sponsored by the National Science Foundation. We thank the Institute of Meteorology and Climate Research–Atmospheric Trace Gases and Remote Sensing, as well as Michael Kiefer and Gabriele Stiller for MIPAS data.
This research has been supported by the National Aeronautics and Space Administration (grant no. 80NSSC19K0952) and the National Institute of Food and Agriculture (grant nos. 2019-34263-30552 and 2022-34263-38472).
This paper was edited by John Plane and reviewed by two anonymous referees.
Anderson, G., Gille, J., Bailey, P., and Solomon, S.: LRIR observations of diurnal ozone variation in the mesosphere, in: Proceedings Quadrennial International Ozone Symposium, Boulder, CO, USA, 4–9 August 1980, 580–585, 1981.
Atkinson, R., Baulch, D. L., Cox, R. A., Crowley, J. N., Hampson, R. F., Hynes, R. G., Jenkin, M. E., Rossi, M. J., and Troe, J.: Evaluated kinetic and photochemical data for atmospheric chemistry: Volume I - gas phase reactions of OX, HOX, NOX and SOX species, Atmos. Chem. Phys., 4, 1461–1738, https://doi.org/10.5194/acp-4-1461-2004, 2004.
Bösch, H., Camy-Peyret, C., Chipperfield, M., Fitzenberger, R., Harder, H., Schiller, C., Schneider, M., Trautmann, T., and Pfeilsticker, K.: Comparison of measured and modeled stratospheric UV/Visible actinic fluxes at large solar zenith angles, Geophys. Res. Lett., 28, 1179–1182, https://doi.org/10.1029/2000GL012134, 2001.
Brandt, R. E., Warren, S. G., Worby, A. P., and Grenfell, T. C.: Surface Albedo of the Antarctic Sea Ice Zone, J. Climate, 18, 3606–3622, https://doi.org/10.1175/JCLI3489.1, 2005.
Burkholder, J. B., Sander, S. P., Abbatt, J. P. D., Barker, J. R., Huie, R. E., Kolb, C. E., Kurylo, M. J., Orkin, V. L., Wilmouth, D. M., and Wine, P. H.: Chemical kinetics and photochemical data for use in atmospheric studies: evaluation number 18, Jet Propulsion Laboratory, National Aeronautics and Space Administration, Pasadena, CA, https://jpldataeval.jpl.nasa.gov/pdf/JPL_Publication_15-10.pdf (last access: 12 September 2023), 2015.
Crutzen, P. J.: The influence of nitrogen oxides on the atmospheric ozone content, Q. J. Roy. Meteor. Soc., 96, 320–325, https://doi.org/10.1002/qj.49709640815, 1970.
Crutzen, P. J.: The Role of NO and NO2 in the Chemistry of the Troposphere and Stratosphere, Annu. Rev. Earth Pl. Sc., 7, 443–472, https://doi.org/10.1146/annurev.ea.07.050179.002303, 1979.
Danabasoglu, G., Lamarque, J. -F., Bacmeister, J., Bailey, D. A., DuVivier, A. K., Edwards, J., Emmons, L. K., Fasullo, J., Garcia, R., Gettelman, A., Hannay, C., Holland, M. M., Large, W. G., Lauritzen, P. H., Lawrence, D. M., Lenaerts, J. T. M., Lindsay, K., Lipscomb, W. H., Mills, M. J., Neale, R., Oleson, K. W., Otto-Bliesner, B., Phillips, A. S., Sacks, W., Tilmes, S., Kampenhout, L., Vertenstein, M., Bertini, A., Dennis, J., Deser, C., Fischer, C., Fox-Kemper, B., Kay, J. E., Kinnison, D., Kushner, P. J., Larson, V. E., Long, M. C., Mickelson, S., Moore, J. K., Nienhouse, E., Polvani, L., Rasch, P. J., and Strand, W. G.: The Community Earth System Model Version 2 (CESM2), J. Adv. Model. Earth Sy., 12, e2019MS001916, https://doi.org/10.1029/2019MS001916, 2020.
Del Negro, L. A., Fahey, D. W., Gao, R. S., Donnelly, S. G., Keim, E. R., Neuman, J. A., Cohen, R. C., Perkins, K. K., Koch, L. C., Salawitch, R. J., Lloyd, S. A., Proffitt, M. H., Margitan, J. J., Stimpfle, R. M., Bonne, G. P., Voss, P. B., Wennberg, P. O., McElroy, C. T., Swartz, W. H., Kusterer, T. L., Anderson, D. E., Lait, L. R., and Bui, T. P.: Comparison of modeled and observed values of NO2 and JNO2 during the Photochemistry of Ozone Loss in the Arctic Region in Summer (POLARIS) mission, J. Geophys. Res., 104, 26687–26703, https://doi.org/10.1029/1999JD900246, 1999.
Fabian, P., Pyle, J. A., and Wells, R. J.: Diurnal variations of minor constituents in the stratosphere modeled as a function of latitude and season, J. Geophys. Res., 87, 4981, https://doi.org/10.1029/JC087iC07p04981, 1982.
Fischer, H., Birk, M., Blom, C., Carli, B., Carlotti, M., von Clarmann, T., Delbouille, L., Dudhia, A., Ehhalt, D., Endemann, M., Flaud, J. M., Gessner, R., Kleinert, A., Koopman, R., Langen, J., López-Puertas, M., Mosner, P., Nett, H., Oelhaf, H., Perron, G., Remedios, J., Ridolfi, M., Stiller, G., and Zander, R.: MIPAS: an instrument for atmospheric and climate research, Atmos. Chem. Phys., 8, 2151–2188, https://doi.org/10.5194/acp-8-2151-2008, 2008.
Funke, B., López-Puertas, M., von Clarmann, T., Stiller, G. P., Fischer, H., Glatthor, N., Grabowski, U., Höpfner, M., Kellmann, S., Kiefer, M., Linden, A., Mengistu Tsidu, G., Milz, M., Steck, T., and Wang, D. Y.: Retrieval of stratospheric NOx from 5.3 and 6.2 µm nonlocal thermodynamic equilibrium emissions measured by Michelson Interferometer for Passive Atmospheric Sounding (MIPAS) on Envisat, J. Geophys. Res.-Atmos., 110, D09302, https://doi.org/10.1029/2004JD005225, 2005.
Funke, B., García-Comas, M., Glatthor, N., Grabowski, U., Kellmann, S., Kiefer, M., Linden, A., López-Puertas, M., Stiller, G. P., and von Clarmann, T.: Michelson Interferometer for Passive Atmospheric Sounding Institute of Meteorology and Climate Research/Instituto de Astrofísica de Andalucía version 8 retrieval of nitric oxide and lower-thermospheric temperature, Atmos. Meas. Tech., 16, 2167–2196, https://doi.org/10.5194/amt-16-2167-2023, 2023.
Gelaro, R., McCarty, W., Suárez, M. J., Todling, R., Molod, A., Takacs, L., Randles, C. A., Darmenov, A., Bosilovich, M. G., Reichle, R., Wargan, K., Coy, L., Cullather, R., Draper, C., Akella, S., Buchard, V., Conaty, A., da Silva, A. M., Gu, W., Kim, G.-K., Koster, R., Lucchesi, R., Merkova, D., Nielsen, J. E., Partyka, G., Pawson, S., Putman, W., Rienecker, M., Schubert, S. D., Sienkiewicz, M., and Zhao, B.: The Modern-Era Retrospective Analysis for Research and Applications, Version 2 (MERRA-2), J. Climate, 30, 5419–5454, https://doi.org/10.1175/JCLI-D-16-0758.1, 2017.
Gettelman, A., Mills, M. J., Kinnison, D. E., Garcia, R. R., Smith, A. K., Marsh, D. R., Tilmes, S., Vitt, F., Bardeen, C. G., McInerny, J., Liu, H.-L., Solomon, S. C., Polvani, L. M., Emmons, L. K., Lamarque, J.-F., Richter, J. H., Glanville, A. S., Bacmeister, J. T., Phillips, A. S., Neale, R. B., Simpson, I. R., DuVivier, A. K., Hodzic, A., and Randel, W. J.: The Whole Atmosphere Community Climate Model Version 6 (WACCM6), J. Geophys. Res.-Atmos., 124, 12380–12403, https://doi.org/10.1029/2019JD030943, 2019.
Guan, J., Solomon, S., Madronich, S., and Kinnison, D.: Inferring the Photolysis Rate of NO2 in the Stratosphere Based on Satellite Observations, Zenodo [code/data set], https://doi.org/10.5281/zenodo.7764756, 2023.
Johnston, H.: Reduction of Stratospheric Ozone by Nitrogen Oxide Catalysts from Supersonic Transport Exhaust, Science, 173, 517–522, https://doi.org/10.1126/science.173.3996.517, 1971.
Johnston, H. S. and Podolske, J.: Interpretations of stratospheric photochemistry, Rev. Geophys., 16, 491–519, https://doi.org/10.1029/RG016i004p00491, 1978.
Junkermann, W., Platt, U., and Volz-Thomas, A.: A photoelectric detector for the measurement of photolysis frequencies of ozone and other atmospheric molecules, J. Atmos. Chem., 8, 203–227, https://doi.org/10.1007/BF00051494, 1989.
Kawa, S. R., Fahey, D. W., Solomon, S., Brune, W. H., Proffitt, M. H., Toohey, D. W., Anderson, D. E., Anderson, L. C., and Chan, K. R.: Interpretation of aircraft measurements of NO, ClO, and O3 in the lower stratosphere, J. Geophys. Res., 95, 18597, https://doi.org/10.1029/JD095iD11p18597, 1990.
Kiefer, M., von Clarmann, T., Funke, B., García-Comas, M., Glatthor, N., Grabowski, U., Kellmann, S., Kleinert, A., Laeng, A., Linden, A., López-Puertas, M., Marsh, D. R., and Stiller, G. P.: IMK/IAA MIPAS temperature retrieval version 8: nominal measurements, Atmos. Meas. Tech., 14, 4111–4138, https://doi.org/10.5194/amt-14-4111-2021, 2021.
Kiefer, M., von Clarmann, T., Funke, B., García-Comas, M., Glatthor, N., Grabowski, U., Höpfner, M., Kellmann, S., Laeng, A., Linden, A., López-Puertas, M., and Stiller, G. P.: Version 8 IMK–IAA MIPAS ozone profiles: nominal observation mode, Atmos. Meas. Tech., 16, 1443–1460, https://doi.org/10.5194/amt-16-1443-2023, 2023.
Kinnison, D. E., Brasseur, G. P., Walters, S., Garcia, R. R., Marsh, D. R., Sassi, F., Harvey, V. L., Randall, C. E., Emmons, L., Lamarque, J. F., Hess, P., Orlando, J. J., Tie, X. X., Randel, W., Pan, L. L., Gettelman, A., Granier, C., Diehl, T., Niemeier, U., and Simmons, A. J.: Sensitivity of chemical tracers to meteorological parameters in the MOZART-3 chemical transport model, J. Geophys. Res., 112, D20302, https://doi.org/10.1029/2006JD007879, 2007.
Laepple, T., Schultz, M. G., Lamarque, J. F., Madronich, S., Shetter, R. E., Lefer, B. L., and Atlas, E.: Improved albedo formulation for chemistry transport models based on satellite observations and assimilated snow data and its impact on tropospheric photochemistry, J. Geophys. Res., 110, D11308, https://doi.org/10.1029/2004JD005463, 2005.
Madronich, S.: Photodissociation in the atmosphere: 1. Actinic flux and the effects of ground reflections and clouds, J. Geophys. Res., 92, 9740, https://doi.org/10.1029/JD092iD08p09740, 1987.
Madronich, S. and Weller, G.: Numerical integration errors in calculated tropospheric photodissociation rate coefficients, J. Atmos. Chem., 10, 289–300, https://doi.org/10.1007/BF00053864, 1990.
Madronich, S., Hastie, D. R., Ridley, B. A., and Schiff, H. I.: Measurement of the photodissociation coefficient of NO2 in the atmosphere: I. Method and surface measurements, J. Atmos. Chem., 1, 3–25, https://doi.org/10.1007/BF00113977, 1983.
Madronich, S., Hastie, D. R., Schiff, H. I., and Ridley, B. A.: Measurement of the photodissociation coefficient of NO2 in the atmosphere: II, stratospheric measurements, J. Atmos. Chem., 3, 233–245, https://doi.org/10.1007/BF00210498, 1985.
Pommereau, J. P.: Observation of NO2 diurnal variation in the stratosphere, Geophys. Res. Lett., 9, 850–853, https://doi.org/10.1029/GL009i008p00850, 1982.
Roscoe, H. K., Kerridge, B. J., Gray, L. J., Wells, R. J., and Pyle, J. A.: Simultaneous measurements of stratospheric NO and NO2 and their comparison with model predictions, J. Geophys. Res., 91, 5405, https://doi.org/10.1029/JD091iD05p05405, 1986.
Sagawa, H., Sato, T. O., Baron, P., Dupuy, E., Livesey, N., Urban, J., von Clarmann, T., de Lange, A., Wetzel, G., Connor, B. J., Kagawa, A., Murtagh, D., and Kasai, Y.: Comparison of SMILES ClO profiles with satellite, balloon-borne and ground-based measurements, Atmos. Meas. Tech., 6, 3325–3347, https://doi.org/10.5194/amt-6-3325-2013, 2013.
Shao, Z.-D. and Ke, C.-Q.: Spring–summer albedo variations of Antarctic sea ice from 1982 to 2009, Environ. Res. Lett., 10, 064001, https://doi.org/10.1088/1748-9326/10/6/064001, 2015.
Shetter, R. E., McDaniel, A. H., Cantrell, C. A., Madronich, S., and Calvert, J. G.: Actinometer and Eppley radiometer measurements of the NO2 photolysis rate coefficient during the Mauna Loa Observatory photochemistry experiment, J. Geophys. Res., 97, 10349, https://doi.org/10.1029/91JD02289, 1992.
Shetter, R. E, Junkermann, W., Swartz, W., Frost, G., Crawford, J., Lefer, B., Barrick, J., Hall, S., Hofzumahaus, A., Bais, A., Calvert, J. G., Cantrell, C. A., Madronich, S., muller, M., Kraus, A., Monks, P. S., Edwards, G. D., McKenzie, R., Johnston, P., Schmitt, R., Griffioen, E., Krol, M., Kylling, A., Dickerson, R. R., Lloyd, S. A., Martin, T., Gardiner, B., Mayer, B., Pfister, E., Roth, E. P., keopke, P., Ruggaber, A., Schwander, H., and van Weele, M.: Photolysis frequency of NO2: measurement and modeling during the International Photolysis Frequency Measurement and Modeling Intercomparison (IPMMI), J. Geophys. Res.-Atmos., 108, 8544, https://doi.org/10.1029/2002JD002932, 2003.
Solomon, S., Russell, J. M., and Gordley, L. L.: Observations of the diurnal variation of nitrogen dioxide in the stratosphere, J. Geophys. Res., 91, 5455, https://doi.org/10.1029/JD091iD05p05455, 1986.
von Clarmann, T., Höpfner, M., Kellmann, S., Linden, A., Chauhan, S., Funke, B., Grabowski, U., Glatthor, N., Kiefer, M., Schieferdecker, T., Stiller, G. P., and Versick, S.: Retrieval of temperature, H2O, O3, HNO3, CH4, N2O, ClONO2 and ClO from MIPAS reduced resolution nominal mode limb emission measurements, Atmos. Meas. Tech., 2, 159–175, https://doi.org/10.5194/amt-2-159-2009, 2009.
Walker, H. L., Heal, M. R., Braban, C. F., Leeson, S. R., Simmons, I., Jones, M. R., Kift, R., Marsden, N., and Twigg, M. M.: The Importance of Capturing Local Measurement-Driven Adjustment of Modelled j(NO2), Atmosphere, 13, 1065, https://doi.org/10.3390/atmos13071065, 2022.
Webster, C. R. and May, R. D.: Simultaneous in situ measurements and diurnal variations of NO, NO2, O3, jNO2, CH4, H2O, and CO2 in the 40- to 26-km region using an open path tunable diode laser spectrometer, J. Geophys. Res., 92, 11931, https://doi.org/10.1029/JD092iD10p11931, 1987.