the Creative Commons Attribution 4.0 License.
the Creative Commons Attribution 4.0 License.
 | 08 Sep 2023
Deposition freezing, pore condensation freezing and adsorption: three processes, one description?
Mária Lbadaoui-Darvas
Athanasios Nenes
Heterogeneous ice nucleation impacts the hydrological cycle and climate through affecting cloud microphysical state and radiative properties. Despite decades of research, a quantitative description and understanding of heterogeneous ice nucleation remains elusive. Parameterizations are either fully empirical or heavily rely on classical nucleation theory (CNT), which does not consider molecular-level properties of the ice-nucleating particles – which can alter ice nucleation rates by orders of magnitude through impacting pre-critical stages of ice nucleation. The adsorption nucleation theory (ANT) of heterogeneous droplet nucleation has the potential to remedy this fundamental limitation and provide quantitative expressions in particular for heterogeneous freezing in the deposition mode (the existence of which has even been questioned recently). In this paper we use molecular simulations to understand the mechanism of deposition freezing and compare it with pore condensation freezing and adsorption. Based on the results of our case study, we put forward the plausibility of extending the ANT framework to ice nucleation (using black carbon as a case study) based on the following findings: (i) the quasi-liquid layer at the free surface of the adsorbed droplet remains practically intact throughout the entire adsorption and freezing process; therefore, the attachment of further water vapor to the growing ice particles occurs through a disordered phase, similar to liquid water adsorption. (ii) The interaction energies that determine the input parameters of ANT (the parameters of the adsorption isotherm) are not strongly impacted by the phase state of the adsorbed phase. Thus, not only is the extension of ANT to the treatment of ice nucleation possible, but the input parameters are also potentially transferable across phase states of the nucleating phase at least for the case of the graphite/water model system.
- Article
(15954 KB) - Full-text XML
- BibTeX
- EndNote


Heterogeneous nucleation is a major of source of cloud droplets and ice particles (Hoose and Möhler, 2012; Kanji et al., 2017; Knopf and Alpert, 2023), whose number, size and relative amounts drive the evolution of clouds and their radiative properties and impacts the hydrological cycle and climate (Fowler and Randall, 1996; Pinto, 1998). Its importance has been known for almost a century; yet despite countless studies on the topic, the mechanism of heterogeneous nucleation remains poorly understood (Pruppacher et al., 1998; Laaksonen and Malila, 2021). At present, there is no established theory of heterogeneous nucleation of ice and droplets on insoluble particles. The lack of a such a functional theoretical framework impedes a full understanding of aerosol–cloud interactions, which constitute one of the most uncertain drivers of anthropogenic climate change (Boucher et al., 2013; Seinfeld et al., 2016).
The oldest and most commonly used theory of heterogeneous nucleation is classical nucleation theory (CNT; Fletcher, 1958). CNT determines the conditions required for the formation of a critical droplet/ice particle on a surface from a metastable phase, such as supersaturated vapor or supercooled liquid, assuming that it occurs in a single step without any considerations of pre-critical interactions between the surface and the vapor/liquid phase and that the energetic interactions of the molecules near the surface are the same as in the bulk. Because of these simplifications, CNT does qualitatively predict the nucleation rate trends, but this can lead to very large biases (Hoose and Möhler, 2012; Kanji et al., 2017; Welti et al., 2014), which are partially mitigated by changing the value of the interaction parameters to fit observations. In reality, considerable water adsorption on the surface of insoluble particles occurs already under subsaturated conditions (RH < 100 %), and the presence of pre-critical adsorbed water impacts the nucleation process because much of the water required to generate a critical cluster, and their associated energy content, is available even before activation. Furthermore, the heat of adsorption changes as a function of adsorption layer thickness (Hill, 1949), which might also impact heterogeneous nucleation.
Atmospherically relevant insoluble particles are not always perfectly wettable, in which case adsorbed water can exist as patches or clusters. Heterogeneous ice nucleation is thought to occur on so-called ice nucleation active sites (INAS) whose nanoscale properties – both chemical and structural – enhance freezing of adsorbed clusters, whereas other locations that collect pre-critical clusters might have an opposite effect, for instance because their geometry disfavors the formation of pre-critical ice embryos (Bi et al., 2017). Such cases have been extensively studied by molecular dynamics simulations, albeit – due to the lack of methodology for deposition ice nucleation – only in the immersion freezing mode. Ice nucleation is suppressed on molecularly rough or curved graphene (Lupi et al., 2014a), in wedge-shaped pores of black carbon (Bi et al., 2017) or AgI (Roudsari et al., 2022) for specific wedge angles which block the formation of initial ice embryos. Small steps and edges also alter IN activity of multiple surfaces (Roudsari et al., 2022). For ice-nucleating proteins, both their length and the lateral distance between the aggregate chains alter ice nucleation rates (Qiu et al., 2019), the latter in a non-monotonic way. Certain wedge angles in graphene (Bi et al., 2017) and lateral distances in protein aggregates (Qiu et al., 2019) can reduce ice nucleation rates up to 8 orders of magnitude or reduce the freezing temperature by 10–15 ∘C. Therefore, neglecting these features may introduce non-negligible biases into ice nucleation parameterizations. These considerations are assumed to be valid regardless of the ice nucleation mode in question because the formation of the pre-critical ice embryos is always a prerequisite of ice nucleation. However, neither the wedge angle nor the aggregation state dependence of immersion freezing rates could be predicted from CNT (Bi et al., 2017; Qiu et al., 2019) because the alterations of the ice nucleation rate arise from pre-critical surface-water interactions. Specific surface properties can be accounted for in CNT using contact angle distributions (Niedermeier et al., 2011) or water activity (Knopf and Alpert, 2023) but not in the pre-critical stages impacted mostly by these properties, because CNT does not include any description of pre-critical surface-water interactions.
A promising theoretical framework to treat the CNT conundrum described above is adsorption nucleation theory (ANT; Sorjamaa and Laaksonen, 2007; Laaksonen, 2015; Laaksonen and Malila, 2016). It has the potential to remedy the problem of neglecting pre-critical surface-water interactions by introducing multilayer adsorption into the model. Currently, ANT-based parameterizations exist for the cloud condensation nuclei (CCNs) activity of the most common insoluble atmospheric particles: dust (Kumar et al., 2009a, 2011), black carbon (Kumar et al., 2009b; Laaksonen et al., 2020) and volcanic ash (Lathem et al., 2011). ANT-based droplet nucleation parameterizations have been implemented into regional (Bangert et al., 2012) and global climate models (Kumar et al., 2009b; Karydis et al., 2012), in particular the climate model of the NASA Global Modeling Initiative (GMI), GEOS-Chem (Karydis et al., 2012, 2017), EC-Earth (Hazeleger et al., 2010) and NorESM (Bentsen et al., 2013). ANT uses the Frenkel–Halsey–Hill (FHH; Frenkel, 1946; Halsey, 1948; Hill, 1952) adsorption isotherm to express the equilibrium supersaturation (S) over a growing droplet as
In the second (Kelvin) term of Eq. (1), r is the droplet radius, γ is the surface tension, νw is the volume of a water molecule and kB stands for the Boltzmann constant. The first term is the FHH isotherm (Halsey, 1948) expressed as a function of the number of adsorbed monolayers of water, , where δ and δm denote the average water layer thickness and the thickness of a monolayer, respectively. AFHH and BFHH are the isotherm parameters, which describe the energetics of adsorption and at the macroscopic scale are related to the lateral spread and the width of the adsorbed water layer. AFHH represents the interaction energy of the first adsorbed layer of water with the surface together with the lateral interactions within the layer. BFHH is related to how rapidly the interaction energy between the surface and the consecutive layers decays. AFHH and BFHH are directly linked to intermolecular interactions between the adsorbent and the adsorbate. Since the interaction energies that define AFHH and BFHH directly depend on the nanoscale properties of the surface, ANT provides a macroscopic framework of water vapor adsorption and CCN activation with direct links to the molecular-scale interactions.
ANT has been suggested to be suitable for modeling ice nucleation in the deposition mode. Deposition ice nucleation occurs when an ice-nucleating particle (INP) is in contact with water vapor saturated with respect to ice, which is thought to be the major source of cloud ice particles in the colder regions of mixed-phase clouds as well as in cirrus clouds (Hoose and Möhler, 2012). Deposition-mode ice nucleation parameterizations to date have relied on CNT (Hoose et al., 2010; Niedermeier et al., 2011; Savre and Ekman, 2015; David et al., 2019) or on empirical approaches (Meyers et al., 1992; Ullrich et al., 2017). Some of the classical parameterizations include specific surface-water interactions (Barahona, 2014, 2015; Knopf and Alpert, 2023) but most of them neglect the impact of pre-critical surface-water interactions. Additionally, the microphysical mechanism of deposition ice nucleation is not fully understood. While the majority of researchers agree on the importance of deposition ice nucleation as a primary ice formation mechanism in clouds, an extensive set of studies (Christenson, 2013; Marcolli, 2014; Wagner et al., 2016; Marcolli, 2017; Mahrt et al., 2018; Nichman et al., 2019; David et al., 2019; Marcolli et al., 2021) have questioned its existence altogether. Freezing experiments on porous dust (Marcolli, 2014; Wagner et al., 2016; David et al., 2019) and soot (Mahrt et al., 2018; Nichman et al., 2019; Marcolli et al., 2021) particles together with scanning electron microscopy and molecular simulations (David et al., 2019) show that deposition ice nucleation might occur on surfaces with nanopores whose diameter allows for the formation of a critical ice embryo but which is small enough to collect and hold confined pore water via the inverse Kelvin effect. The impact of pores on deposition ice nucleation is described by the pore condensation freezing (PCF) mechanism, which attributes IN activity of porous surfaces to pore filling, described by the Kelvin equation, and uses CNT to parameterize ice nucleation based on experimentally determined homogeneous ice nucleation and growth (Marcolli, 2014; David et al., 2019, 2020; Marcolli et al., 2021). According to the PCF model the mechanism of deposition ice nucleation involves the filling of nanopores with supercooled water due to capillary condensation and the subsequent immersion or homogeneous freezing within the water-filled pore causing out-of-pore growth of ice. For pore condensation freezing to be plausible, pores should be narrow enough to induce the inverse Kelvin effect but wide enough to hold ice, which has been found to be the case for mesoporous silica (David et al., 2020). Molecular simulations in the above set of studies (David et al., 2019) support this assumption, but they use pores that are prefilled with ice in the initial configuration, and therefore, the initial steps of pore filling and freezing within the pore are not resolved. From the experimentally observed temperature dependence of IN efficiency of porous aerosol particles, the authors conclude that PCF below 235 K involves homogeneous freezing; however, the ice nucleation experiments that lead to this conclusion are performed in droplet emulsions or aerosolized particles, and freezing in pores is not directly observed.
Indirect evidence for the potential extension of ANT to ice nucleation comes from both molecular simulations and experiments. A molecular dynamics study of water nanodroplets on graphite and graphene oxide surfaces with variable hydrophilicity (Lupi and Molinero, 2014) showed that interfacial water in the first and second adsorption layers forms hexagonal arrangements similar to those of the basal plane of hexagonal ice (at 220 K and room temperature). Similar findings were reported in immersion and contact freezing simulations on graphene (Lupi et al., 2014a). Yang et al. (2021) used NEXAFS spectroscopy to elucidate the structure of adsorbed water on AgI and found that water tends to form ice-like structures in adsorption layers even at room temperature, further supporting the similarity of the equilibrium structure of adsorbed liquid water and ice (and hence their corresponding FHH parameters). These findings suggest that the values of AFHH and BFHH can be the same for water and ice. Raman spectroscopy (Kahan et al., 2007), atomic force microscopy (Gelman Constantin et al., 2018) and molecular simulations (Neshyba et al., 2009; Hudait et al., 2017; Pickering et al., 2018) evidence the formation of a quasi-liquid layer at the solid/vapor interface of ice, which implies that the mechanisms of water adsorption and deposition ice nucleation are qualitatively similar (i.e., the attachment of a water molecule to a liquid adsorption layer and a frozen one both occur via interactions with a disordered surface layer of water). Although concerns have been raised about the ability of the models used for the molecular simulations to reproduce properties of the graphene/water interface (Qiu et al., 2018), the majority of the observational and modeling studies to date open the possibility of using ANT as a unified theory of heterogeneous droplet nucleation and deposition ice nucleation. To rigorously demonstrate the plausibility of the extension of ANT to deposition ice nucleation, one has to (i) provide a complete description of the mechanism of deposition ice nucleation at a molecular scale from the initial stages of water vapor adsorption to the nucleation of ice, (ii) highlight similarities and differences between frozen and liquid adsorption layers structure and (iii) compare interaction energies included in AFHH and BFHH for liquid water and ice.
In this work, we address all of the above three crucial points using atomistic and coarse-grained molecular simulations, with the aims (i) of providing novel insights into the much-debated deposition ice nucleation mechanism and (ii) of demonstrating that adsorption and deposition ice nucleation are sufficiently similar in terms of mechanisms and thermodynamics for ANT to be used as a collective framework to describe both of them. It is crucial to conduct atomistic and coarse-grained molecular simulations as discussed by Knopf and Alpert (2023) and shown in Roudsari et al. (2022). They can yield important insights into the ice nucleation mechanism as a function of surface properties (Lupi et al., 2014a, b; Lupi and Molinero, 2014; Bi et al., 2017; Roudsari et al., 2022). Atomistic simulations provide higher-resolution data, but their feasibility is limited by computational cost. Molecular simulations have long been employed to study immersion freezing for all atmospherically relevant substrates (e.g., Lupi et al., 2014a, b; Bi et al., 2017; Qiu et al., 2018, 2019; Sosso et al., 2016a, b). These studies used a variety of enhanced sampling techniques that allow for estimating ice nucleation rates using the assumptions of CNT (Pedevilla et al., 2018) or from the liquid-to-ice flux (Bi et al., 2017; Hussain and Haji-Akbari, 2021). Grand canonical Monte Carlo simulations are widely used to study adsorption and even to quantitatively reconstruct adsorption isotherms (Lbadaoui-Darvas et al., 2021); however, the purely stochastic approach only allows for understanding equilibrium properties of the adsorbed layer and lacks information about adsorption dynamics, which are crucial for understanding the freezing process. David et al. (2019) remedied this caveat by adapting hybrid grand canonical Monte Carlo/molecular dynamics (GCMC/MD) simulations to study deposition ice nucleation on flat and porous silica surfaces. However, as mentioned in the previous sections, the initial structures of these simulations consisted of porous systems pre-filled with hexagonal ice; therefore, the simulations addressed out-of-pore ice growth but not pore filling and in-pore freezing. In this study we remove this important limitation and extend the analysis to the initial steps of the adsorption/freezing process that occur before pore filling is complete. The GCMC/MD simulations are performed at a coarse-grained resolution to allow for the observation of the otherwise slow freezing processes and are complemented by atomistic-scale molecular dynamics simulations that provide a quantitative assessment of the similarities between the interaction energies that drive adsorption and deposition ice nucleation. The two complementary sets of simulations clarify the extent to which adsorption, deposition ice nucleation and PCF can be described using a unifying theory based on ANT, valid for both deposition-mode ice and droplet nucleation. For this study we chose multilayer graphene as a model surface given the potentially important role of soot – mostly from aircraft emissions – as an INP in the upper troposphere (Hoose and Möhler, 2012; Kanji et al., 2017) and the lack of significant knowledge to date on the subject. Soot is active in deposition-mode freezing (Hoose and Möhler, 2012). Laboratory experiments have shown that at temperatures below about 235 K, deposition ice nucleation occurs on porous black carbon particles at considerably lower critical supersaturations than on non-porous black carbon particles (DeMott et al., 1999; Möhler et al., 2005; Mahrt et al., 2018; Nichman et al., 2019). ANT parameterizations of droplet nucleation on various type soot are available (Laaksonen et al., 2020).
2.1 Grand canonical Molecular Dynamics
GCMC/MD simulations were performed using the LAMMPS molecular simulations program package (Thompson et al., 2022). The simulation cell initially contained a graphite slab consisting of nine layers with 8×8 nm lateral dimensions in contact with an empty headspace of nm. A small ice seed consisting of ∼30 water molecules was placed on the surface with the hexagonal plane in contact with the surface to increase the computational efficiency by inducing initial adsorption of the water molecules. The size of the ice seed was chosen to be much smaller than the size of a critical ice nucleus (100–150 molecules); the ice seed size was determined from molecular simulations of immersion and contact freezing on graphitic surfaces (Lupi et al., 2014a) to ensure that the seed would not induce ice nucleation as an artifact. The effect of the seed on ice nucleation is discussed in the light of the results. The target vapor pressure (chemical potential) of water was set to a value that corresponds to 300 % supersaturation with respect to ice (Si=3) at 200 K. The target vapor pressure is not to be confused with the instantaneous vapor pressure in the simulation box; it is strictly the vapor pressure that corresponds to the value expected in the fully converged simulation (i.e., at multilayer coverage). While the number of water molecules shows an increasing trend, the actual vapor pressure in the initial steps of the simulation increases upon the addition of water molecules and converges to the target pressure. The simulation temperature was kept constant using a Nosé–Hoover thermostat (Evans and Holian, 1985). Water molecules were modeled using the coarse-grained mW water model (Molinero and Moore, 2009). The water–carbon interaction parameters ϵCW=0.54392 kJ mol−1, σCW=0.32 nm were adapted from Lupi et al. (2014b) to reproduce the experimental contact angle of water (86∘) at 300 K. The graphitic slab was kept frozen during the simulation, and thus no potential was necessary to describe interactions between the carbon atoms.
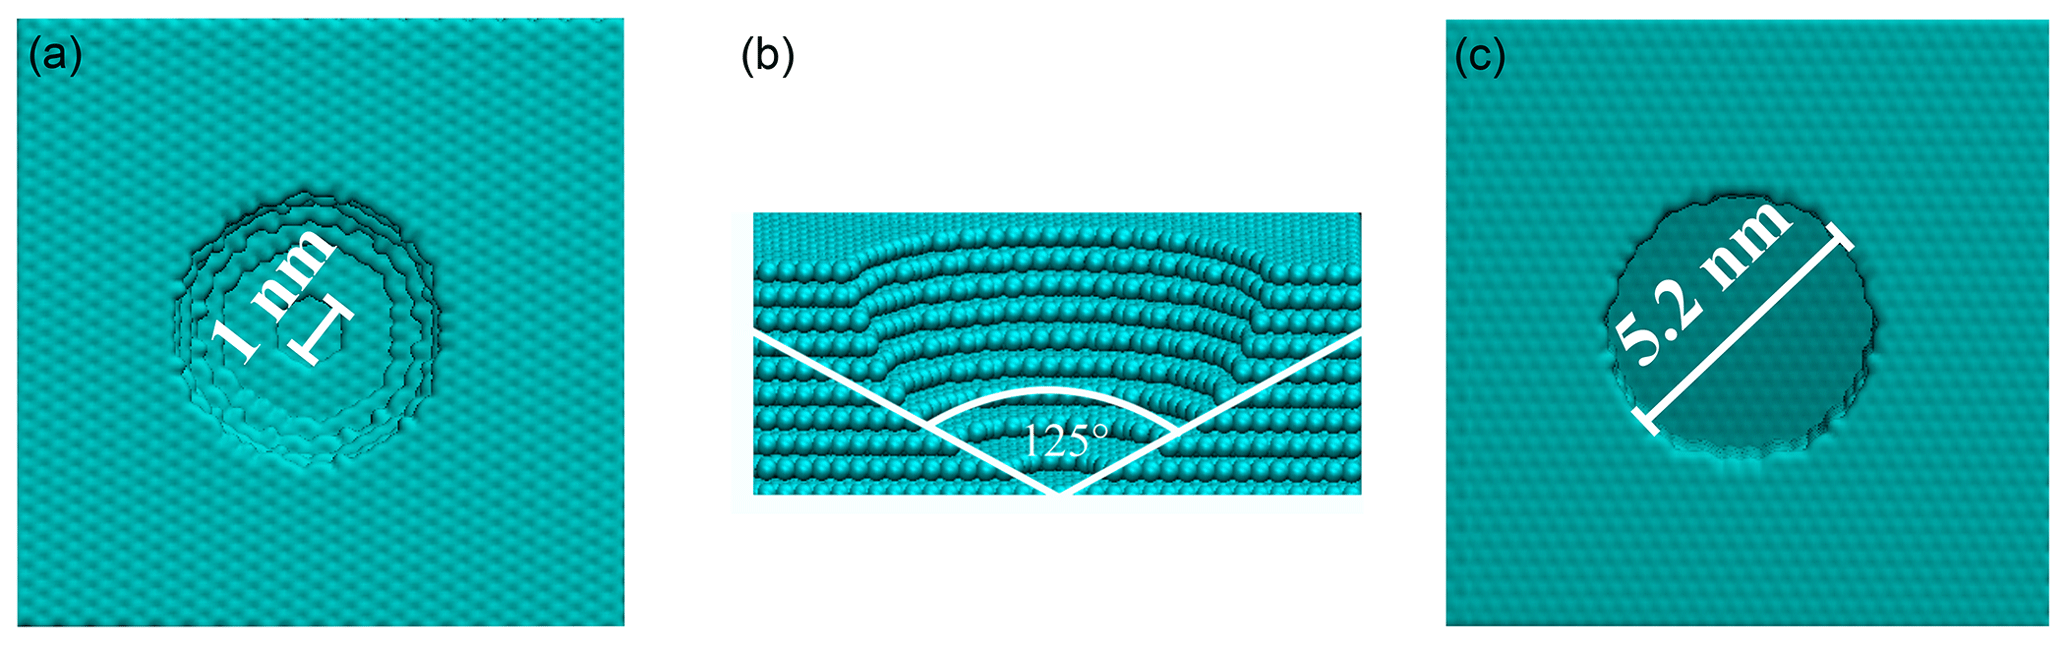
Figure 1Snapshots of pore geometries. Top (a) and side (b) views of the hemispherical pore and top (c) view of the cylindrical pore.
Given that the objective of this simulation was to observe the initial steps of deposition freezing, the run was stopped when an equilibrium number of water molecules was reached (at around 8 ns). In every Monte Carlo step, additions and deletions of water molecules were attempted and accepted or rejected according to the Metropolis algorithm until a stable number of water molecules was reached. Metropolis sampling of displacement moves was disabled to ensure that the molecular structure of the adsorbed nanodroplets is solely a result of deterministic (Newtonian) dynamics. Note that it is important to ensure that the spatial dynamics in the system are not driven by stochastic changes introduced by Monte Carlo sampling; otherwise, it is impossible to estimate time-dependent properties from the simulation. Five Monte Carlo insertion/deletion steps were performed for each classical molecular dynamics step with an integration time step of 5 fs. The ratio of 5 leads to a relatively slow convergence of the vapor pressure, but it ensures a more efficient equilibration of the regions affected by insertion or deletion, thus giving a more exact description of the instantaneous structure of the adsorbed nanodroplets. To confirm the dependence of the mechanism on this parameter, the first 2.5 ns of the simulation were repeated using a ratio of 20 (see Appendix A for the results); the ratio numerically (but not qualitatively) impacts the observed freezing curves – but not any conclusions regarding the mechanism of deposition freezing. Ice formation along the trajectory was analyzed using the CHILL+ algorithm (Nguyen and Molinero, 2015) implemented in the OVITO software (Stukowski, 2009). To understand how surface porosity impacts the mechanism of deposition freezing, we repeated the simulations using surfaces containing one cylindrical pore and one hemispherical pore, both with a radius of 2.6 nm (measured at the top of the pore). Figure 4 shows the pore geometries. The depth of the pores is 2.7 nm.
While graphite is a good choice for an exploratory molecular simulation study as the optimal interaction parameters that reproduce the contact angle of water on graphitic carbon have been reported for both atomistic (Werder et al., 2003; Sergi et al., 2012) and coarse-grained water models (Lupi et al., 2014a, b; Lupi and Molinero, 2014; Qiu et al., 2018), we note that the coarse-grained model used in our simulation overestimates the ice nucleation ability of graphite because it can only reproduce the free energy of the water/graphite interface and not that of the ice/graphene interface because of its resolution. This implies that the results of the GCMC/MD simulations are not necessarily indicative for real graphitic carbon (Qiu et al., 2018). The system models graphene structure with a surface that favors ice nucleation because of the negative free energy of the ice/graphite interface, i.e., a surface that has the lattice of graphite but much lower ice/surface binding free energy. Because of the above caveat, we refrain from estimating any quantitative data from the coarse-grained simulation, but we maintain that the model is still able to provide a qualitative picture of ice nucleation and pore condensation valid for a hypothetical surface with a graphene structure.
2.2 Atomistic molecular dynamics simulations
To avoid bias coming from the above limitation of the coarse-grained model and to be able to explicitly analyze hydrogen bonding, the interaction energies were calculated from atomistic molecular dynamics simulations performed using GROMACS (Abraham et al., 2015). The systems were built out of a graphite slab consisting of 10 layers brought manually in contact with a pre-equilibrated ice and water slab having the same lateral dimensions, consisting of 2880 water molecules. The ice slab was purely hexagonal and the contact between the graphite and the ice was established with the basal hexagonal (0001) plane of the latter. The graphite/water and graphite/ice interfacial systems were first equilibrated on the canonical (NVT) ensemble for 20 ns at 300 and 200 K, respectively, with an integration time step of 1 fs. Equilibration was followed by a 100 ns production run during which configurations were saved for analysis with an intermittence of 5 ps.
Water molecules were described using the TIP5P water model (Mahoney and Jorgensen, 2000), which reproduces most thermodynamic properties of both solid and liquid water well. For carbon atoms, we used a simple generic carbon model from the optimized potentials for liquid simulations (OPLS) family (Jorgensen and Tirado-Rives, 1988; Jorgensen et al., 1996) with modified angles and torsions to describe the graphene structure. The carbon–water interactions were modeled by the Lennard-Jones (LJ) potential between the carbon and the oxygen atoms of the water molecule whose parameters (ϵOC=0.3920 kJ mol−1, nm) reproduce the single water molecule–graphite binding energies needed to produce realistic contact angles (Werder et al., 2003). Carbon–hydrogen interactions were ignored. Long-range Lennard-Jones interactions were truncated to zero beyond a 1 nm cutoff, while long-range Coulomb interactions were taken into account using the particle mesh Ewald (PME) method (Darden et al., 1993).
2.3 Estimation of the interaction energies corresponding to AFHH and BFHH
AFHH and BFHH refer to interaction energies between the adsorbent and the first and consecutive adsorbed layers of water as illustrated in Fig. 2a. For our analysis, we defined layer boundaries using fixed cutoff distances determined based on the mass density profile of the ice slab (Fig. 2b), which was calculated in rectangular bins parallel to the graphite/ice interface. The layer boundaries were determined at the base of the peaks; the layer thickness is 0.4 nm. This value is consistent with the dimensions of a unit cell of hexagonal ice but does not correspond strictly to a monomolecular layer. The choice is rationalized by the fact that a monomolecular layer is not capable of accommodating an ice unit cell, and the ordering of at least two monomolecular layers is needed for ice-like structures to form (Lupi and Molinero, 2014).
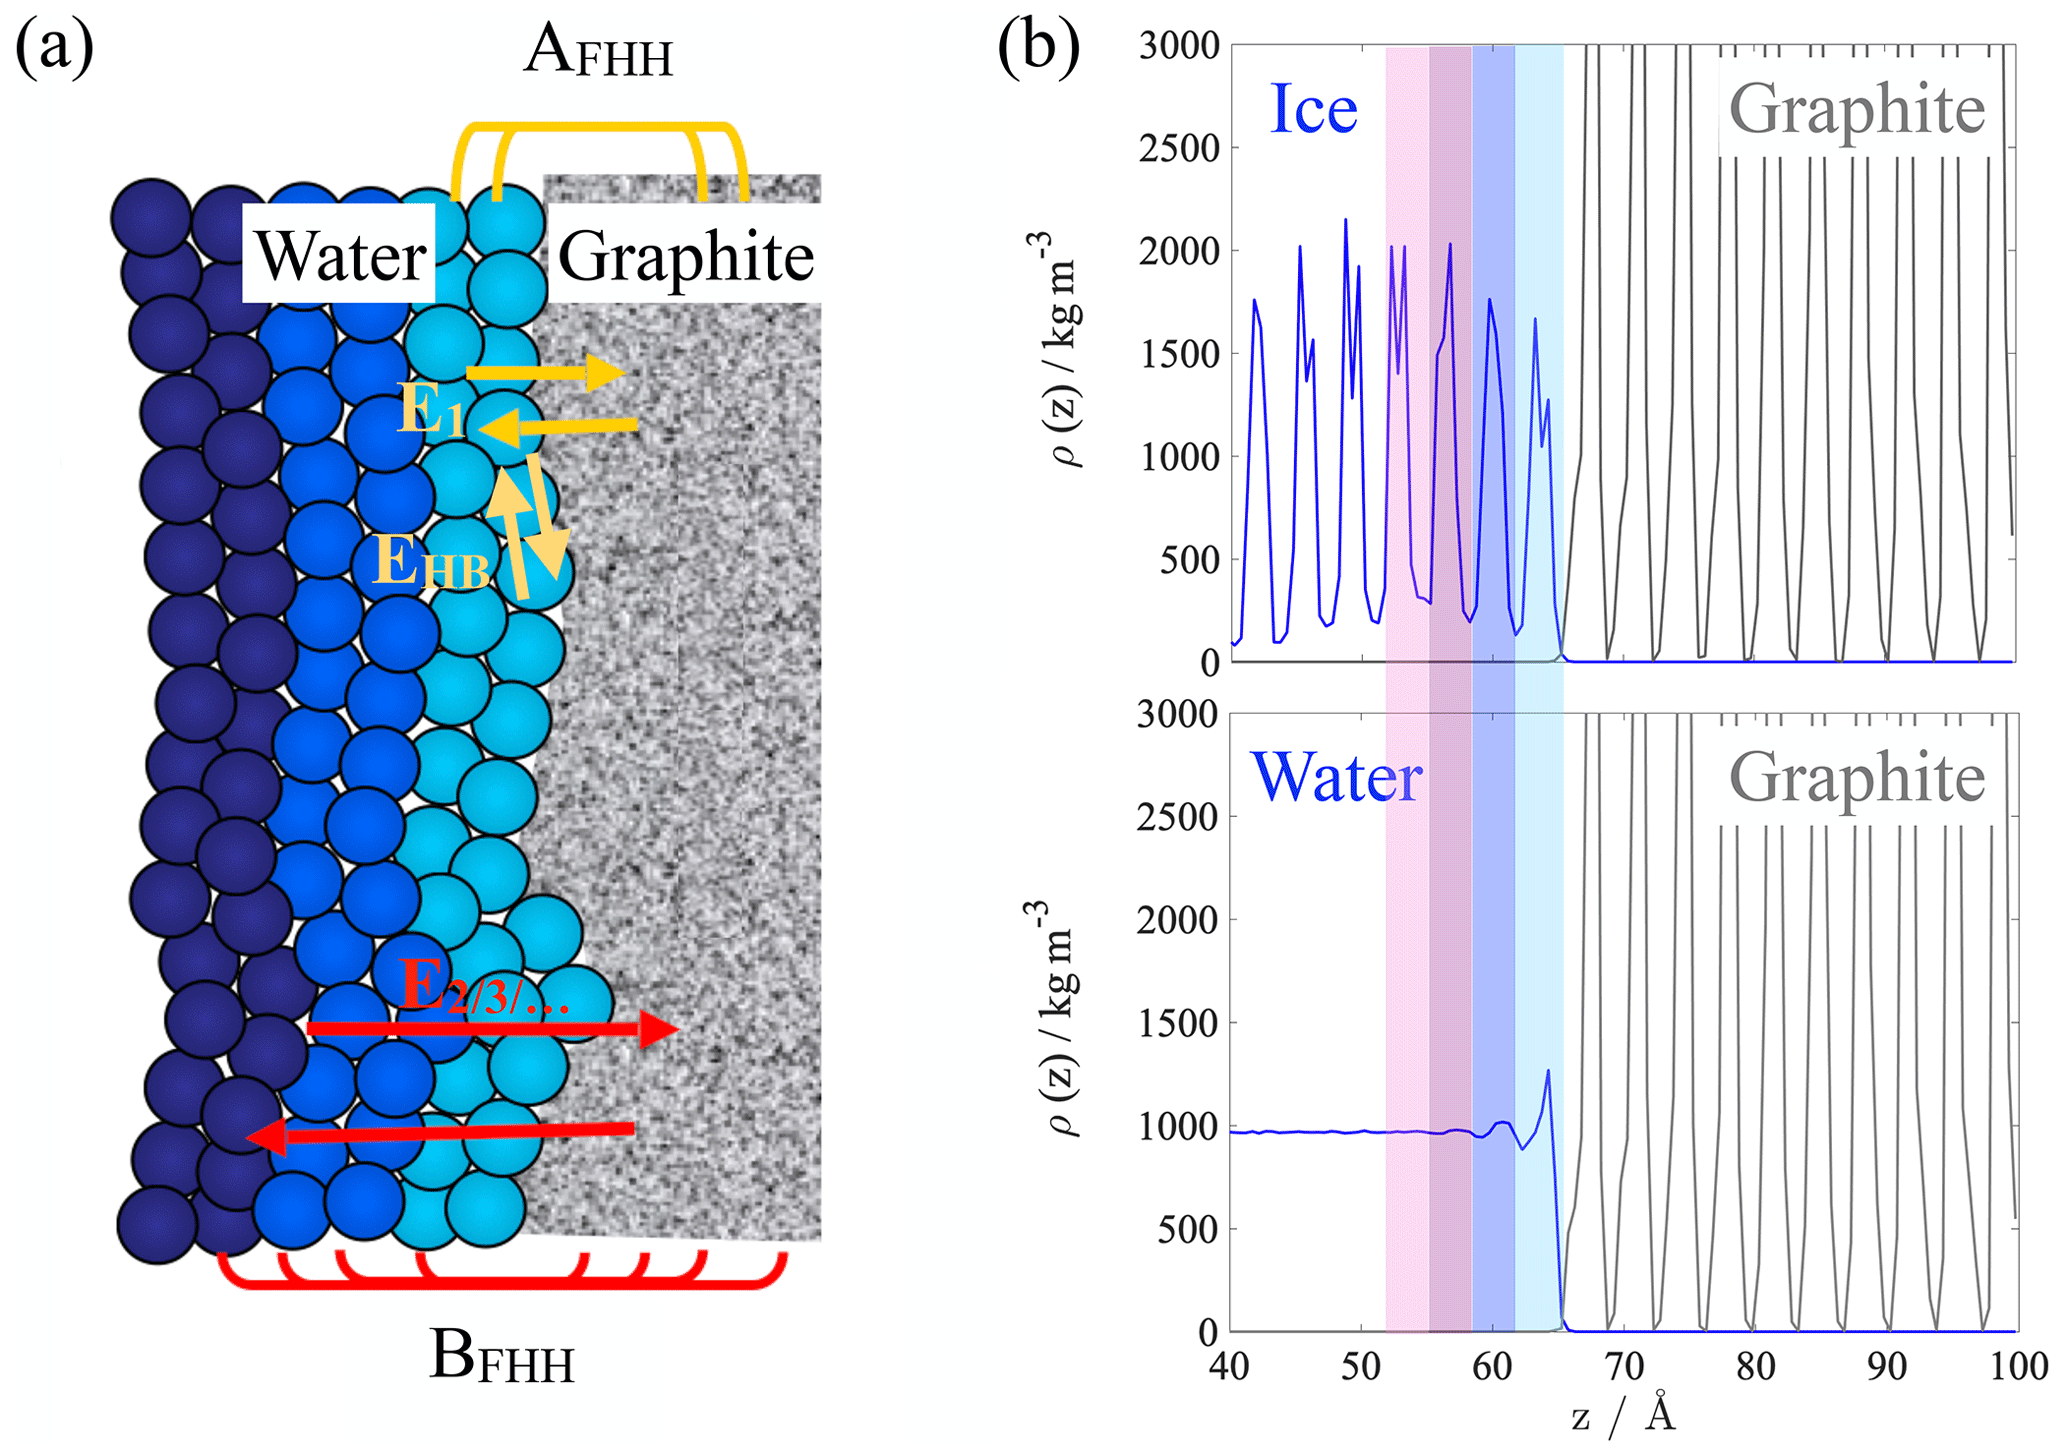
Figure 2(a) Schematic representation of the FHH parameters. (b) Mass density profiles of the atomistic ice/graphite (top) and liquid water/graphite (bottom) interfacial systems, shaded areas represent the first four consecutive layers that were considered in the energetics analysis.
When calculating the layer-by-layer interaction energies in this work, we concentrated on the first four layers of water/ice. Given that the carbon atoms have zero partial charge and the Lennard-Jones parameters of the hydrogen atoms of the TIP5P water model are assumed to be zero, the interaction energy between the graphite slab and the water molecule reduces to the Lennard-Jones interactions between the oxygens of the water molecule (OW) and the carbon atoms (C) of the graphite slab. In this approximation the mean interaction energy per unit area in the ith adsorbed layer with the slab can be written as
where A is the surface area, NC stand for the number of carbon atoms, NWi is the number of water molecules in the ith adsorbed layer and rjk are the pairwise distances between the jth oxygen atom in the layer and the kth carbon. The in-layer lateral interaction energies that are included in AFHH correspond to the energy of lateral hydrogen bonds between the water molecules within the layer.
3.1 Adsorption, deposition ice nucleation and PCF
GCMC/MD trajectories were used to provide a qualitative description of the initial steps of deposition ice nucleation on the surface of our model graphite slab, as well as in a cylindrical and a hemispherical graphitic pore having depths of 2.7 nm and a radii of 2.6 nm. In the following section, the freezing curves and the structure of the adsorption layers are analyzed as a function of surface geometry to reveal (i) the mechanism of deposition ice nucleation and (ii) any similarities or differences with liquid water adsorption.
3.1.1 Adsorption and ice nucleation on non-porous graphite
Figure 3a, b show the time evolution of the number of adsorbed water molecules (adsorption curve, Nwat) and the fraction of frozen water molecules (freezing curve) on the non-porous graphite surface. The frozen fraction is calculated as the sum of hexagonal, cubic and interfacial ice divided by the total adsorbed amount. Since before the saturation of the adsorption layer all water molecules added to the system instantaneously adsorbed on the surface, the adsorbed amount was taken to be equal to the total number of water molecules. The number of adsorbed water molecules in Fig. 3 starts to increase significantly at around 0.5 ns, after the initial reversible attachment of a handful of individual water molecules directly to the surface. The steady increase of adsorbed water molecules begins when additional water molecules attach to pre-existing surface water, which is coherent with the primary mechanism of adsorption of water on graphitic carbon (Popovicheva et al., 2004). During the supercooled liquid adsorption phase, pre-critical ice embryos appear in the nanodroplet in a random manner, both in the bulk and at the graphite surface. The onset of freezing, i.e., when the number of ice-like water molecules starts increasing linearly, can be observed at ∼1.5 ns in Fig. 3b (point I.), when the total number of water molecules reaches ∼1000. The critical nucleus size is ∼80 molecules, determined by directly counting the number of molecules in the largest ice-like cluster at the onset of freezing. The critical cluster – unlike a large fraction of the transient pre-critical embryos – is attached to the graphite surface (point I. in Fig. 3c) In this particular simulation, initially two nanodroplets of similar size develop simultaneously. In parallel repetition under the same conditions, a single nanodroplet forms. Given that the graphite surface is completely homogeneous both chemically and structurally, with no specific adsorption active sites, the number of nanodroplets forming is stochastic. Their average contact angle (θ∼90∘) was estimated from their height (H) and radius (R) as , neglecting line tension corrections. This value is merely 4∘ larger than the experimental value for a macroscopic liquid water droplet, suggesting that the droplet-wise phase of deposition ice nucleation can be described assuming the same average adsorption layer geometry as liquid water adsorption. With the term “droplet-wise”, we refer to the adsorption mechanism relevant for not-completely wettable surfaces, which involves the formation of nanodroplets followed by their merging into continuous multilayer films. Water adsorption on black carbon has been described as droplet-wise in previous work (Laaksonen et al., 2020).
Freezing starts in one of the two nanodroplets, and both continue to grow by adsorption until they merge at ∼2.1 ns (point II. in Fig. 3). The merging of the initial nanodroplets does not have an impact on the contact angle. Freezing in the other nanodroplet starts only after merging (∼2.5 ns); however, it is initiated from an ice embryo that is distinct from the originally frozen nanodroplet, as seen in the top right panel of Fig. 3c (snapshot II.) and in the region highlighted by a red circle in Fig. 5b. The fact that this second ice embryo grows starting from the surface suggests that our qualitative conclusions are not influenced by the presence of the ice seed. We also note here that a supplementary simulation performed with an ratio of 20 (Appendix A) resulted in the melting of the original ice seed during the first 100 ps of the simulation, followed by the formation of a critical nucleus at the graphite surface at a distinct location. The snapshots in Fig. 3c suggest that freezing is initiated at the graphene surface and that the liquid/vapor interface remains largely liquid-like throughout the droplet-wise phase, that is, until complete multilayer surface coverage is reached and the number of water molecules is stabilized in the system. Even in the multilayer phase, a non-negligible fraction of the liquid/vapor interface exhibits liquid-like structure at full coverage, the frozen fraction never exceeds 0.7 and non-ordered molecules are concentrated at the nanodroplet surface, as shown in snapshot III. and IV. of Fig. 3c. This observation is consistent with a quasi-liquid layer on the free surface of ice and proves that during deposition ice nucleation a water molecule attaching to the pre-existing adsorbed nanodroplet or layer has a larger probability to form initial hydrogen bonds with a disordered phase (supercooled liquid) than with ice crystals. Therefore, the mechanism (kinetics, energetics) of deposition ice nucleation and liquid water adsorption can be assumed qualitatively very similar – or to a first approximation identical. The ice formed on the surface stacks disordered in the initial stages, characterized by distinct cubic and hexagonal patches. After merging, cubic and hexagonal patches rearrange into horizontal layers as expected based on previous simulations (Qiu et al., 2018). The cubic-to-hexagonal ratio in the converged multilayer phase is approximately 0.7.
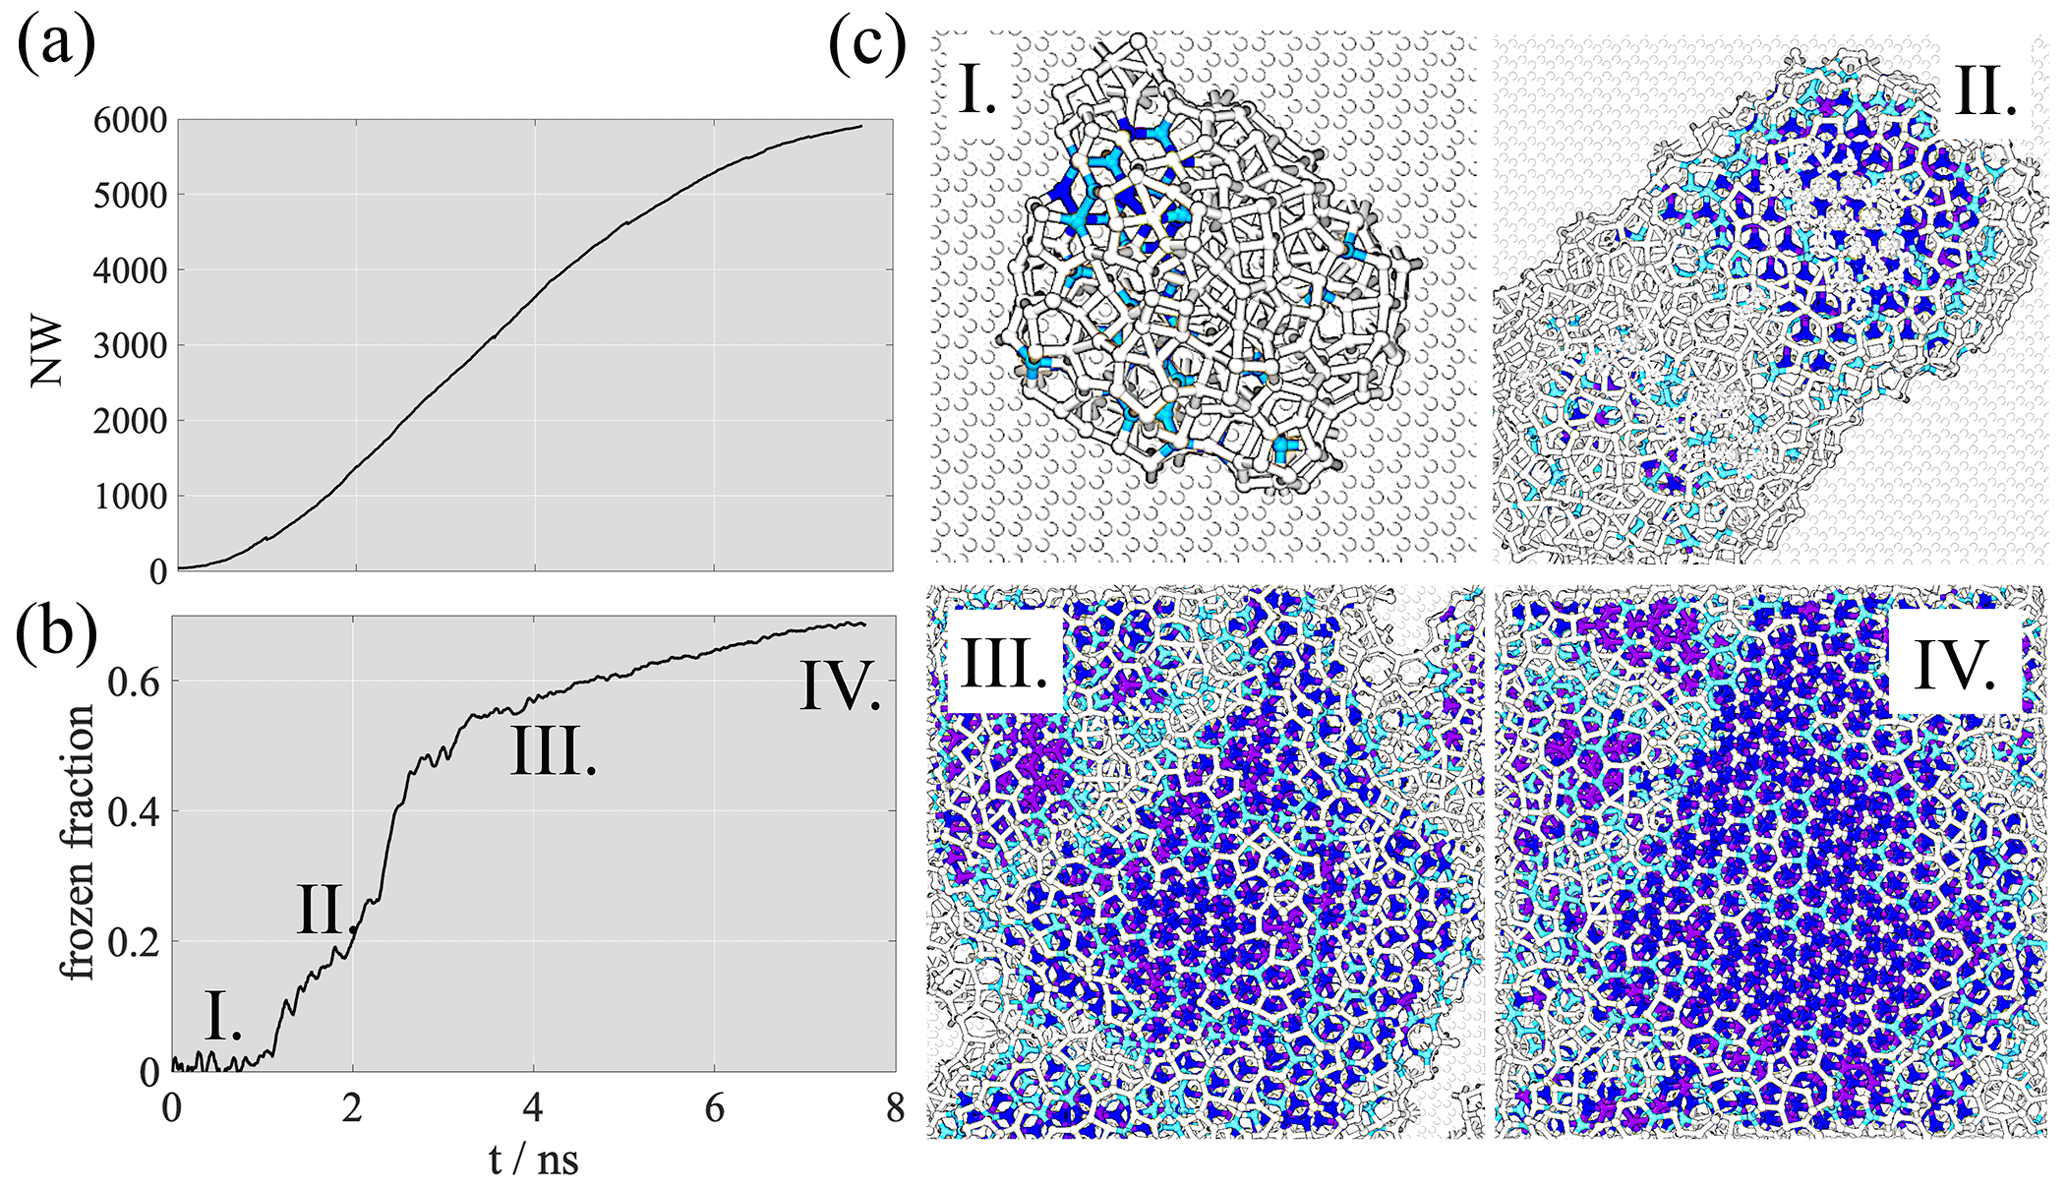
Figure 3(a) Time evolution of the number of water molecules at the flat graphite surface (adsorption curve). (b) The fraction of frozen water molecules as a function of time (freezing curves). (c) Equilibrium snapshots showing the growth and the freezing of the adsorption layer. Liquid-like water molecules and carbon atoms are shown in white, hexagonal ice in dark blue, cubic ice in purple and interfacial ice in light blue.
3.1.2 Adsorption and freezing in graphitic nanopores
Freezing curves observed in the two porous systems are compared to the flat surface results in Fig. 4a. Freezing in the cylindrical pore occurs at 0.8 ns, which is about half the time needed for freezing on a flat surface (∼1.5 ns). Because of this acceleration, freezing is slightly enhanced in the cylindrical pore, but with a freezing curve qualitatively similar to that on the flat surface (i.e., after a linear increase of the frozen fraction between 0.8 and 2 ns), the curve plateaus below 0.7 and ice growth slows down. In the hemispherical pore, ice formation is completely suppressed, despite pore filling following approximately the same linear pattern (Fig. 4b as in the case of the cylindrical pore. The frozen fraction remains below 0.1 after the melting of the small ice seed initially present in the pore. This latter finding is in line with the results of Bi et al. (2017), who observed a non-monotonous suppression of immersion freezing in graphitic wedges as a function of wedge angle. Looking closely at the structure of the bottom of the hemispherical pore we observe that the radius of the lowermost part is 0.5 nm, presumably too small to accommodate a critical ice embryo. Additionally, the angle that describes the aperture of the hemispherical pore (Fig. 4b) is 125∘, which is an angle found to suppress immersion freezing by Bi et al. (2017). The interplay of these geometric hindering factors is potentially responsible for the suppression of freezing in the hemispherical pore. We note that the suppression of freezing despite the presence of the ice seed gives evidence that the seed does not have a significant impact on the qualitative mechanism of ice formation in our simulations. This result is important because it indicates that ice nucleation depends on the surface geometry, which contradicts the hypothesis that in-pore freezing occurs homogeneously.
Freezing onset in the cylindrical pore coincides with a filled pore volume fraction of 0.2 and is preceded by the formation of a supercooled liquid nanodroplet until point I. A snapshot of the nanodroplet having the majority of the water molecules in the disordered phase is shown in point I. of Fig. 4c. The critical nucleus size is ∼80 molecules in this simulation, which is slightly smaller than the critical nucleus size of the model in homogeneous freezing mode at the homogeneous freezing temperature (100–200 molecules; Lupi et al., 2014a); however, due to the stochastic nature of ice nucleation, this small difference in the critical nucleus size does not directly suggest a heterogeneous freezing mechanism. The value corresponds to the critical size observed on the flat surface. The pore-filling fraction at freezing onset is shifted to 0.6 for the simulation where the ratio is 20 (Appendix A). In neither case is complete pore filling required for freezing. The plateau in the frozen fraction (at ∼2 ns) is reached when the filled volume fraction is approximately 0.6, i.e., before complete pore filling. The plateau is maintained until , which corresponds to an out-of-pore nucleation of approximately two molecular layers of ice. In this initial stage of out-of-pore ice growth, the nucleating phase protrudes from the pore assuming a flat circular disk shape up to a height of two molecular layers. The ice slab has a strong stacking disorder, with alternating cubic and hexagonal layers and a cubic-to-hexagonal ratio of ∼1.2.
The surface of this disk is mainly disordered (snapshot II. in Fig. 4c), liquid-like water is concentrated around the three-phase contact line. Adsorption then proceeds by the lateral spread of the disk. In this phase, the attachment of water molecules occurs mostly around the three-phase contact line and results in liquid-like clusters of irregular size and shape around the cylindrical ice slab protruding from the pore (snapshot III. in Fig. 4c). The accumulation of liquid-like water molecules is reflected in the freezing curve by a small decrease of the frozen fraction (III. in Fig. 4) because the rate of adsorption around the ice slab responsible for the lateral spread of the nanodroplet exceeds the rate of freezing. In the final phase of freezing, the spherical cap geometry is recovered and the freezing curve assumes a second linearly increasing segment, with a slope however much smaller than that of the first linear segment. This behavior disappears at a higher ratio, and the shape of the water protruding from the pore turns out to depend on the extent of freezing when out-of-pore nucleation occurs. The free surface of the adsorbate remains largely disordered even in this final stage, which is evidenced by the frozen fraction remaining smaller than 0.7 even at full multilayer coverage.
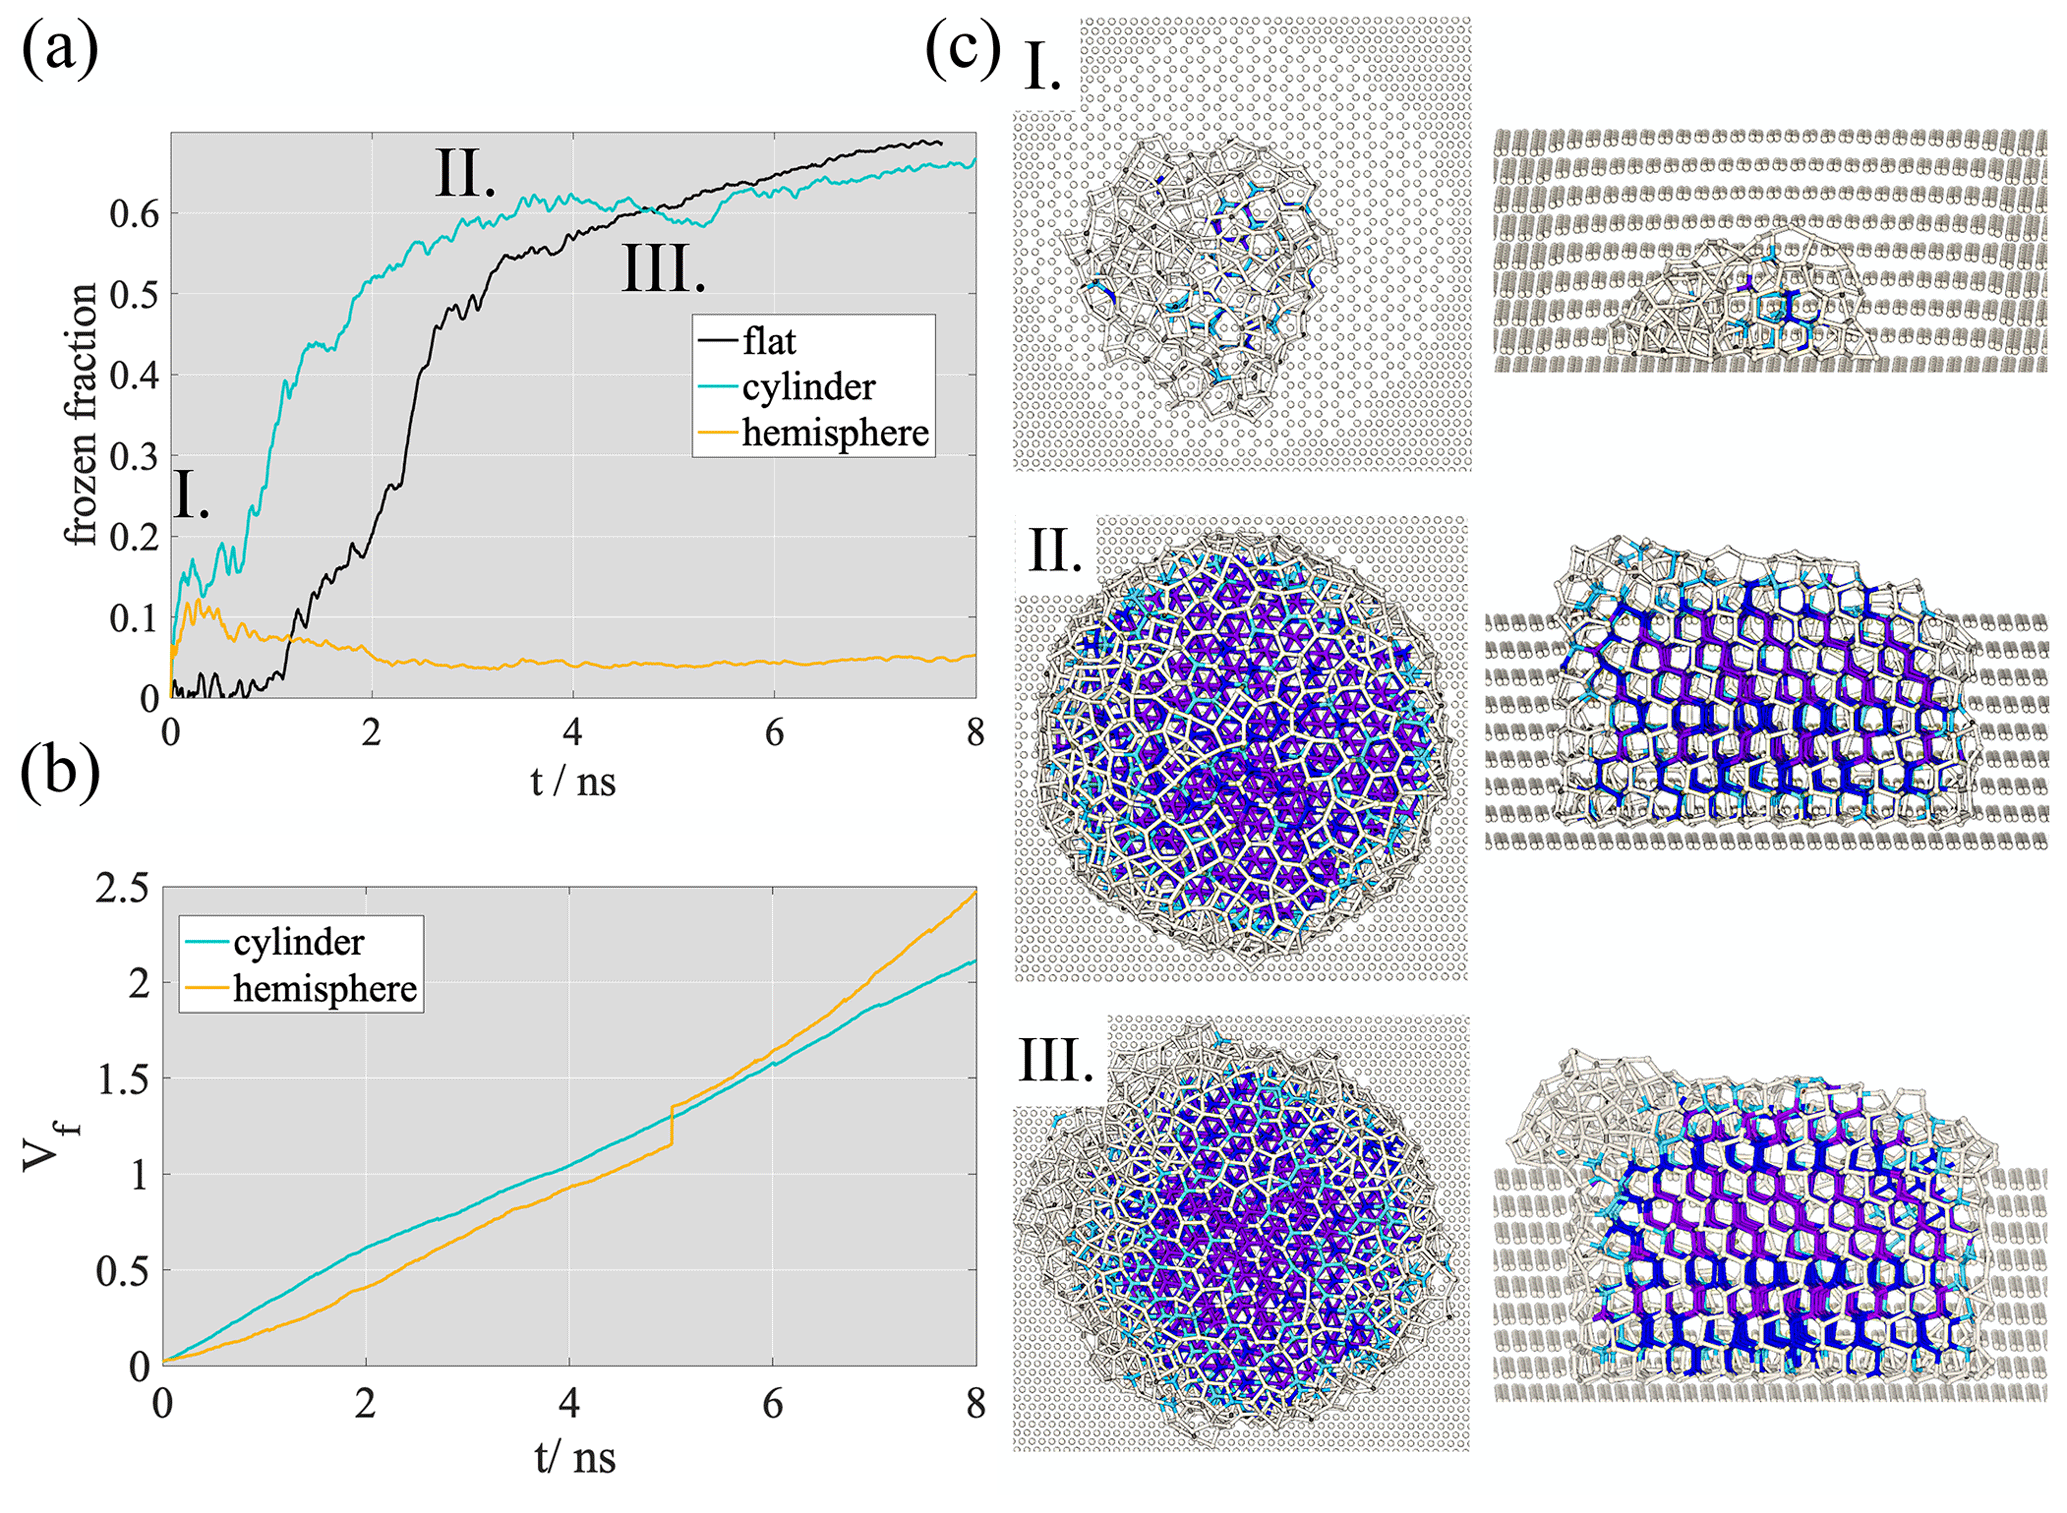
Figure 4(a) Time evolution of the frozen fraction on the flat surface (black) and in the cylindrical (teal) and hemispherical (yellow) pores. (b) Time evolution of the volume fraction filled with water (Vf) in the hemispherical (yellow) and cylindrical (teal) pores. (c) Top and side views of the adsorbing water at freezing onset (I.), at initial stage (II.) and more advanced stage of out-of-pore ice nucleation (III.). Water is indicated with ball and stick notation, sticks standing for intermolecular bonds. Carbon atoms in the graphitic pore are shown as white balls. Liquid water molecules are shown in white, hexagonal ice in dark blue, cubic ice in purple and interfacial ice in light blue.
3.1.3 The detailed mechanism of adsorption and pore condensation freezing
To elucidate the mechanism of deposition ice nucleation in relation to pore condensation and adsorption as underlying basic physical processes, we need to understand how the adsorbed water/ice builds up on the surface. It is possible to gain the necessary information by dividing the adsorbate into layers and observing the growth of the consecutive layers as a function of time. Figure 5a shows the time evolution of the total number of adsorbed (top panel, Ntot) and frozen molecules (bottom panel, Nice) in the first three consecutive adsorbed layers on the flat surface and in the cylindrical pore. The layer boundaries were determined assuming a layer width of 0.4 nm for all three analyzed layers.
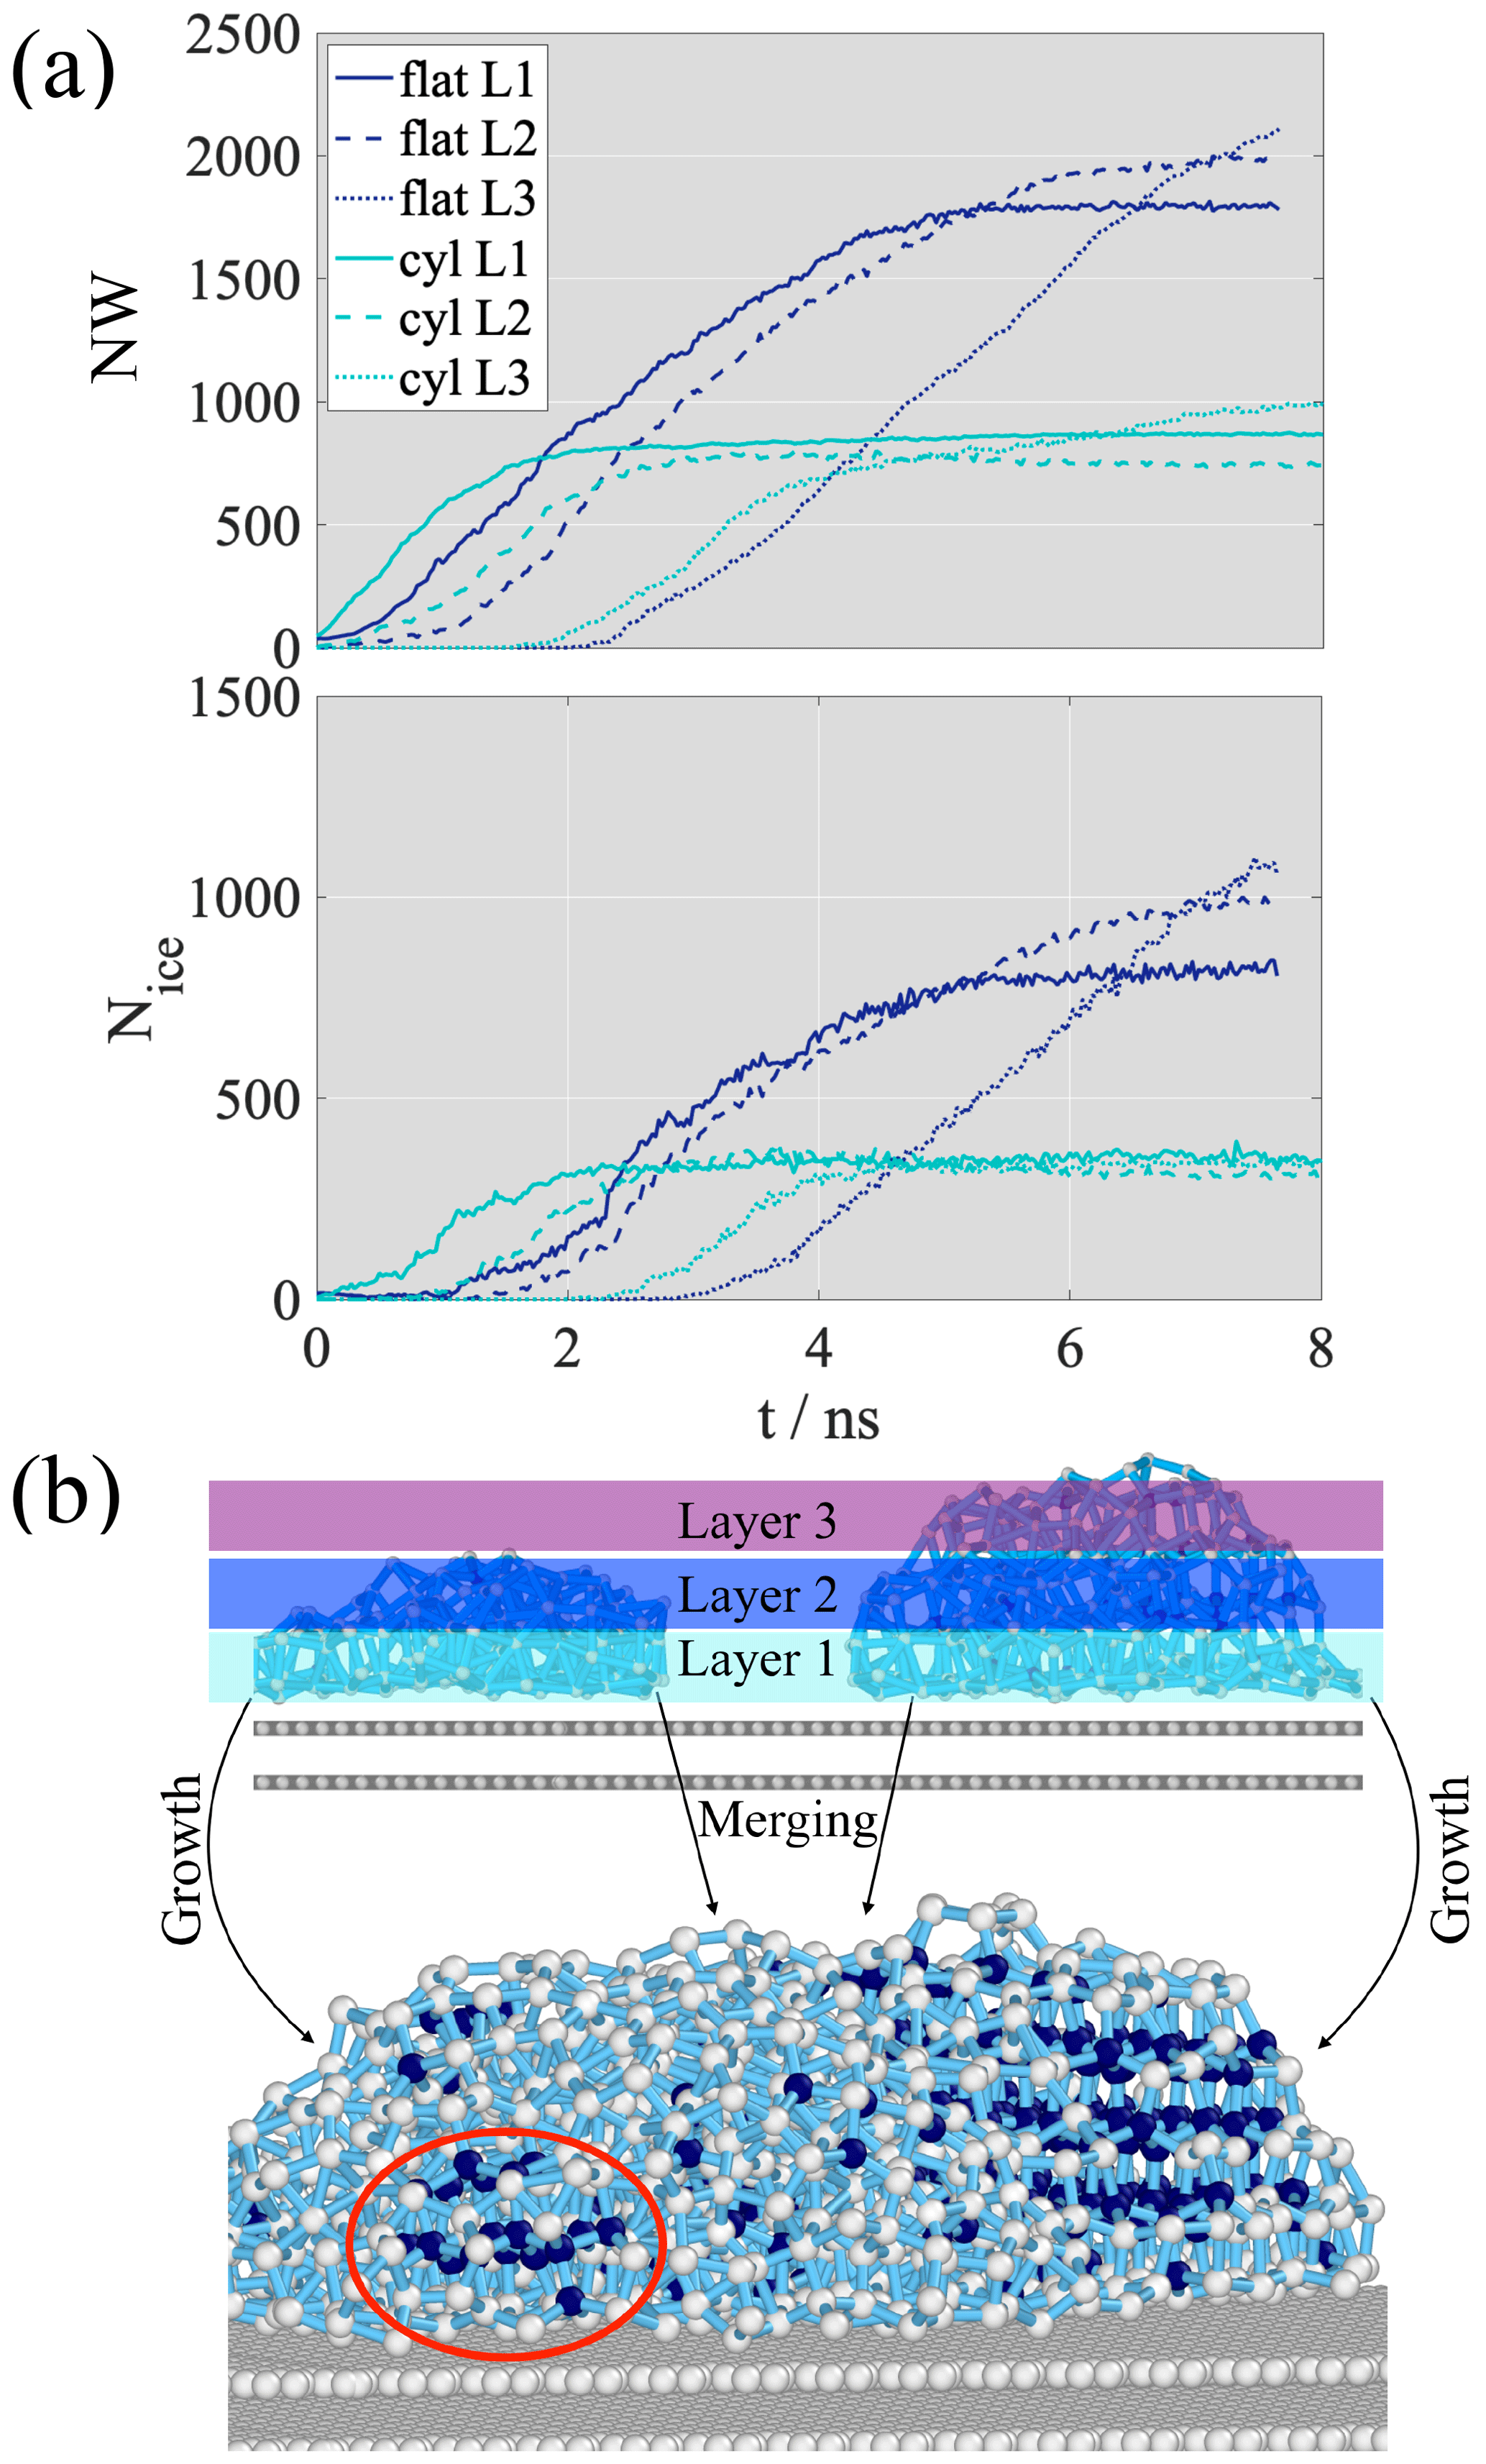
Figure 5(a) The number of water molecules (top) and the number of frozen water molecules (bottom) in the first three consecutive layers of water (L1: layer 1, solid line; L2: layer 2, dashed line; L3: layer 3, dotted line) on the flat surface (dark blue) and in the cylindrical pore (cyan). (b) Schematic sketch of the droplet-wise adsorption and freezing mechanism on the flat surface
On the flat surface, layer 2 starts forming when layer 1 contains around 300 water molecules (corresponding to approximately 17 % of saturation in layer 1) as the saturated layer (plateau) contains ∼1800 water molecules. Layer 3 starts building up when layer 1 and layer 2 contain ∼1000 and ∼800 water molecules, corresponding to 56 % and 41 % saturation, respectively. In the cylindrical pore, the onset of formation for all three layers is shifted to the left compared to the flat surface, indicating enhanced adsorption in the pore, but the mechanism of adsorption is similar to that observed on the non-porous surface. Layer 2 starts forming when layer 1 is 47 % saturated, the formation of layer 3 sets on layer 1 is filled and layer 2 is at a 58 % saturation level compared to the plateau value that corresponds to the number of water molecules in the completely filled layer. The fact that new layers start forming on unsaturated lower layers proves that adsorption is droplet-wise and that the continuous multilayer forms as a result of the merging of smaller nanodroplets.
Freezing curves of the first three consecutive layers shown in the bottom panel Fig. 5a reveal that freezing starts in the first layer near the surface for both the flat surface and cylindrical pore, and the critical nucleus is attached to the surface. The freezing of the consecutive layers is delayed in time and follows curves that are parallel to the freezing curve in layer 1. On the flat surface, freezing onset in layer 1 and layer 2 coincides approximately with the beginning of the formation of layer 2. The freezing of layer 3 is delayed; onset of freezing is seen when layer 1 and layer 2 are about 40 % and 35 % frozen relative to the plateau value of the corresponding layer-by-layer freezing curves. The critical nucleus spreads across the first two layers and grows horizontally before extending to the third layer, but freezing in layer 1 and layer 2 is not complete (does not reached a plateau) before the appearance of ice in layer 3, meaning that what we observe is not layer-by-layer ice growth, representative of barrier-less freezing. In the cylindrical pore, freezing onset occurs faster. Ice appears earlier for each layer than on the flat surface; however, the overall freezing mechanism is the same in the presence and the absence of the pore. Similar to on the flat surface, layer 1 starts to freeze first, followed by layer 2 and layer 3. The presence of water molecules in the second layer is necessary for freezing but complete surface coverage is not required.
The fact that the presence of a second adsorbed layer is always required for ice nucleation is in agreement with the structure of the critical nucleus found in immersion and contact freezing from molecular dynamics simulations using the same model as in this work (Lupi et al., 2014a). This behavior shows that freezing is likely heterogeneous despite the low temperature and requires neither complete pore filling nor a bulk aqueous phase. Note that more than 50 % of the molecules in the nanodroplets in which freezing is observed are interfacial and the bulk water density is not expected to be reached in these droplets because of the layering in the water structure invoked by the presence of the solid interface spanning approximately 1.5 nm. A schematic representation of the freezing mechanism on the flat surface consisting of the partial filling of the surface by nanodroplets having 2–4 layers of water and subsequent freezing and merging of the adsorbed nanodroplets is shown in Fig. 5b. We note that the order of freezing and merging cannot be unambiguously determined from these simulations because of the presence of the ice seed and the inherent stochasticity of ice nucleation. The fact that liquid adsorption always precedes freezing challenges the classical view on deposition ice nucleation, which states that this mechanism does not involve the liquid phase at all. On the other hand, the similarity between the flat surface and the cylindrical pore together with the faster freezing within the pore suggests that pore condensation enhances freezing but the presence of pores does not seem to be necessary for deposition ice nucleation to occur. Instead, adsorption is a necessary prerequisite. The enhancement of freezing in the porous system is due to the faster condensation of water nanodroplets as a result of the inverse Kelvin effect, which reduces the time needed to reach the droplet size suitable to accommodate a critical embryo. We hypothesize that this effect of the pores can be large enough to completely suppress freezing on flat surfaces in mixed porous/flat soot samples by competing for the available vapor-phase molecules. To consolidate this finding, a larger number of parallel observations on more complex surface structures would be needed.
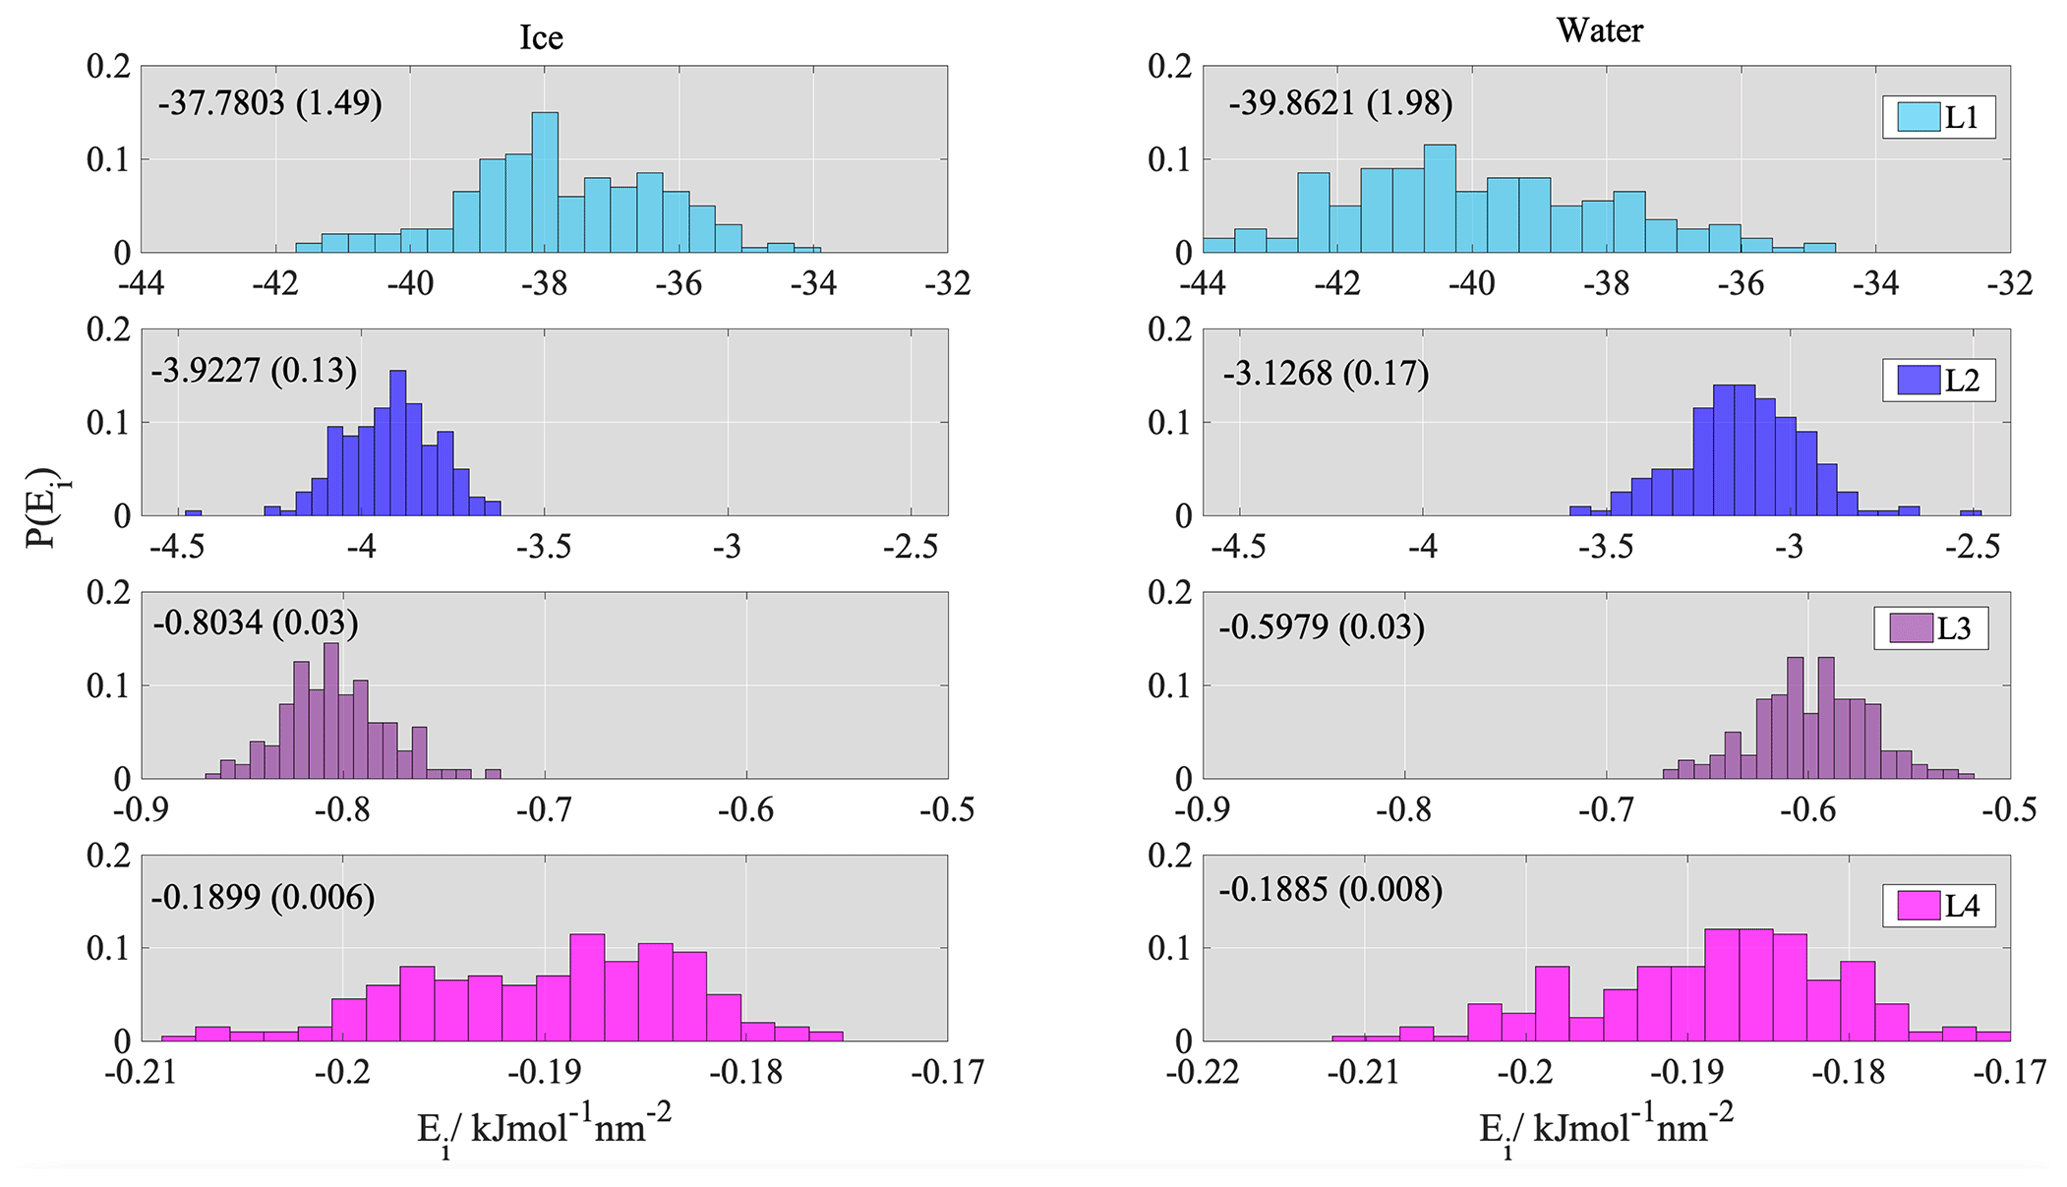
Figure 6Distribution of the interaction energies between the first four adsorbed ice/water layers and the graphite surface. Numbers in the insets show the mean values with the standard deviations in parentheses. Labels L1, L2, L3 and L4 indicate layer 1, 2, 3 and 4, respectively.
3.2 Energetics
For a simple system of two types of Lennard-Jones particles (i,j), i representing the adsorbent and j the adsorbate, the FHH isotherm can be formulated using the Lennard-Jones parameters (Frenkel, 1946; Halsey, 1948; Hill, 1949):
where ϵ, σ and ρ are the Lennard-Jones parameters and density of the adsorbent (i) and the adsorbate (j). h is the adsorbed layer thickness. From Eq. (3), we can derive that in the ideal LJ particle case BFHH=3 and AFHH can be written as
It is in principle possible to estimate AFHH from Eq. (4) if h is known. For ice, we can unambiguously determine hice from the base of the first peak of the density profile presented in Fig. 2; its average value is 0.4 nm. For water, we determined the layer width as described in Appendix B as 0.38 nm; this agrees well with previous studies that found the interfacial layer thickness to be nearly identical to that for ice at the free water surface (0.37–0.4 nm; Kaliannan et al., 2020). According to Eq. (4), for a model LJ system having two phases whose density and adsorption layer thickness corresponds to that of water and ice, and . These values are however not representative for realistic water or ice adsorption on graphene for the following reasons: first, Eqs. (3) and (4) are only valid for layer-by-layer adsorption, whereas water adsorption on graphitic surfaces is droplet-wise, which means that no continuous monolayer is expected before condensation. Second, AFHH also accounts for the in-layer interactions between the adsorbates, which in a hydrogen bonding liquid as water are orders of magnitude stronger than simple Lennard-Jones forces. In addition to this, H bonds also act between the consecutive adsorbed layers, which causes an apparent strengthening of their interactions with the adsorbent; thus BFHH is also expected to be smaller than the value predicted by the theory based on pure Lennard-Jones interactions. Therefore, instead of comparing theoretical values of isotherm parameters, we analyze the underlying interaction energies in the following sections to quantitatively assess whether deposition ice nucleation and droplet nucleation can be described using the same set of adsorption parameters in the framework of ANT.
3.2.1 Comparison of interaction energies
AFHH measures the lateral spread of the adsorption layer and it is made up of the combination of the interaction energy between the surface and the first adsorbed layer and the energy of the lateral interaction within the first adsorption layer. Macroscopically, BFHH is a measure of the width of the adsorption layer; at the nanoscale it comprises the interaction energy between the surface and the second and consecutive adsorption layers. The smaller the value of BFHH, the larger the extent of the interactions.
Figure 6 shows histograms of the layer-by-layer interaction energy per unit area between the solid surface and the first four molecular layers of water/ice. The interaction energy of both water and ice decays rapidly with distance from the solid surface; only the first two molecular layers give a non-negligible contribution to the overall adsorption energy. The interaction energies between the surface and the further layers are smaller than −1 kJ mol−1 nm−2 and inferior to , that is, the kinetic energy of a molecule at the corresponding temperature. This means that thermal motion alone is enough to overcome these values of binding energy. Comparison of the layer-by-layer energy distributions obtained for ice and water reveals that interactions are similar in magnitude: the mean values 37.78 and 39.86 kJ mol−1 nm−2 in layer 1 differ within the statistical error estimated by the standard deviation of the corresponding distributions. In layer 2 the difference between the mean values (0.8 kJ mol−1 nm−2) exceeds the standard deviations; however, it is significantly smaller than kBT, the energy of thermal motion in two dimensions – that is within the layer – at the lower temperature, again rendering thermal motion sufficient to overcome the energy difference. The qualitative similarity of the decay of the interaction energies together with the quantitative similarity between the energy distributions suggest that water and ice adsorption can be described with the same BFHH for graphitic surfaces if only Lennard-Jones-type interactions are present.
AFHH also contains lateral interactions between the water molecules, which are governed by hydrogen bonding within the layer. We calculated the average number of hydrogen bonds formed within layer 1 from the simulation using a cutoff of 0.35 nm for the donor–acceptor (O… H) distance and 30∘ for the hydrogen donor–acceptor (O-H… O) angle. The number of hydrogen bonds per water molecule at the surface is around 2.1 in water and ∼3 in ice; the hydrogen-bonded network in water appears to be slightly less extended than in ice (Fig. 7a). These data are used to estimate the total energy contributions coming from lateral hydrogen bonds in the first layer.
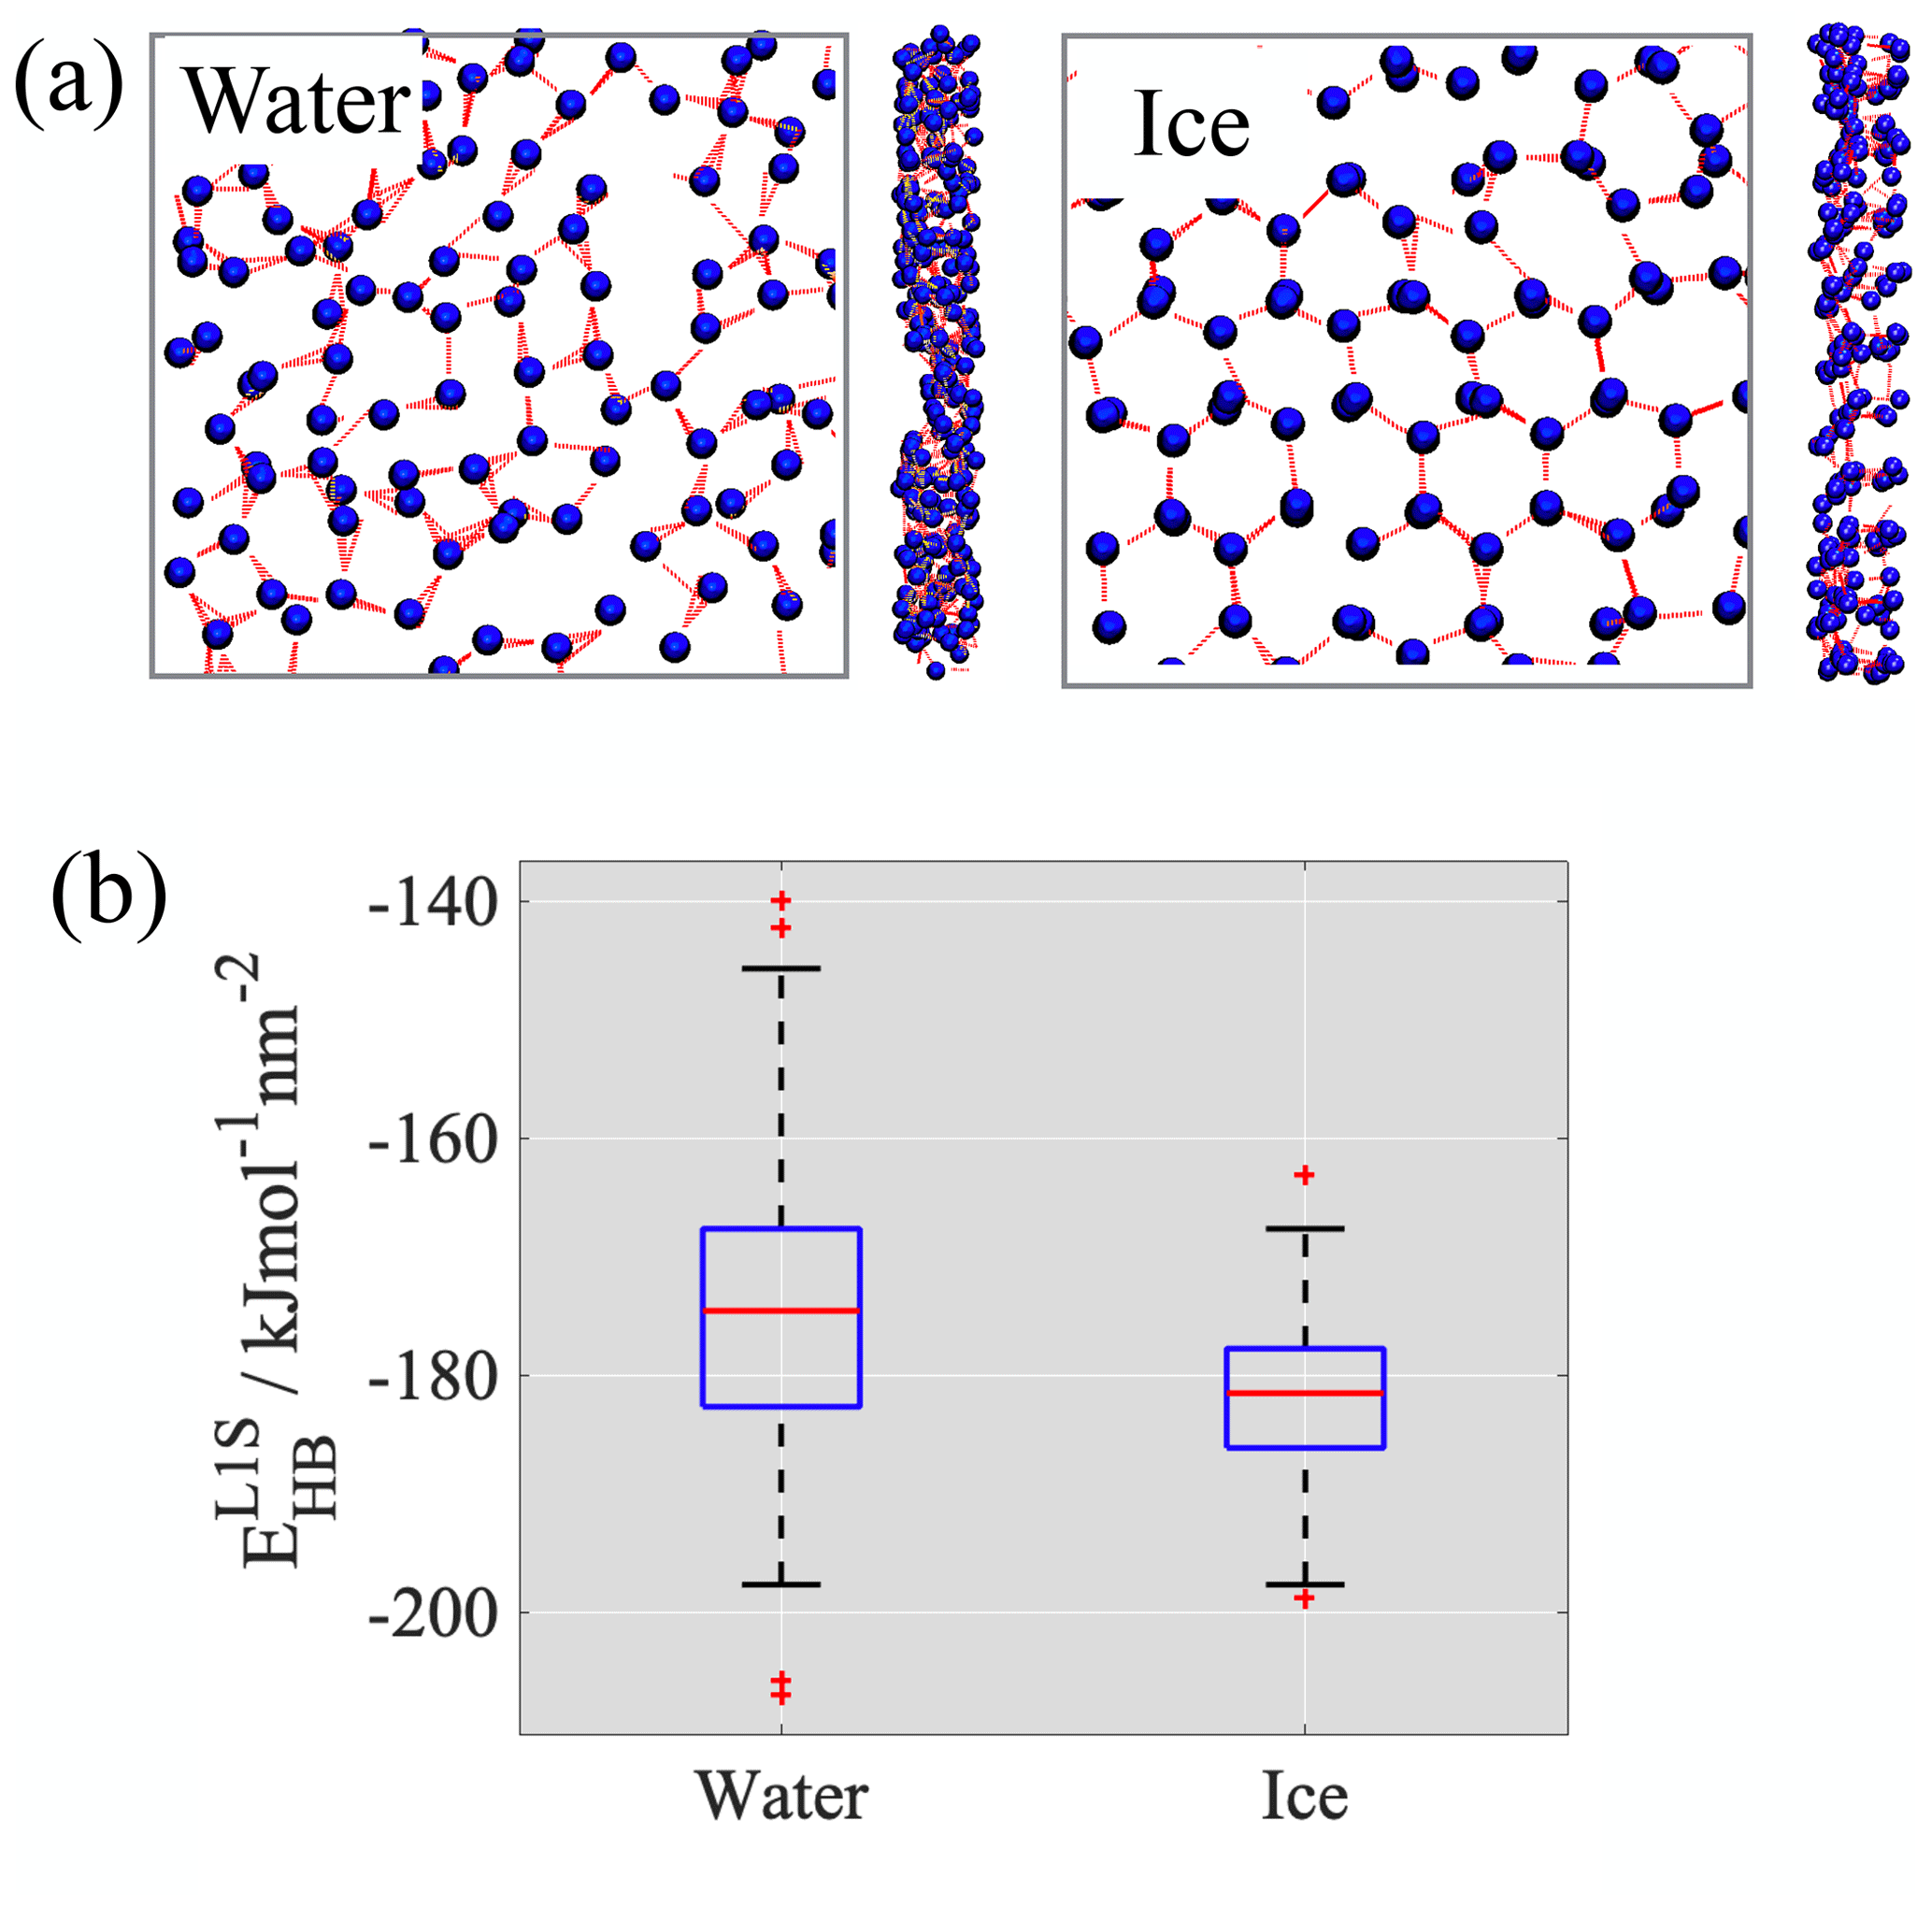
Figure 7(a) Snapshots showing the hydrogen-bonded network in layer 1 of water and ice. (b) Boxplots of the time series of hydrogen bonding energies in the first layer of water and ice.
For the TIP5P water model the energy of a hydrogen bond in the bulk liquid phase is −17.7 kJ mol−1 (Zielkiewicz, 2005). The experimental values for ice range between −18.8 and −13.9 kJ mol−1 (Nissan, 1956) with an average of 15.5 kJ mol−1. Given, to the best of our knowledge, that hydrogen bond energy data are not available in the literature for the ice phases of the TIP5P water model and that the value for liquid water falls within the range of experimental values observed for ice, we assumed the per molecule hydrogen bond energy to be the same in both phases. Box plots obtained from the distribution of hydrogen bond energies per unit area in layer 1 of water and ice are shown in Fig. 7b. The average lateral interaction energy in layer 1 of liquid water is −174.7 ± 12.1 and −181.9 ± 6.3 kJ mol−1 nm−2 in layer 1 of ice. The difference (7.2 kJ mol−1 nm−2) is significant compared to the energy of thermal motion; however, the boxplots created from the distribution of the lateral hydrogen bond energy values clearly indicate that the range of energies excluding outliers (whiskers) for ice corresponds to a subset of the range found in water and reveals a significant overlap between the interquartile ranges delimited by the 25th and 75th percentiles (boxes).
We presented a comprehensive study of deposition freezing on graphitic surfaces in the absence and presence of nanopores with different geometries with the objective of clarifying the relationship between adsorption, pore condensation and deposition freezing. Our results show that deposition freezing is preceded by the droplet-wise adsorption of supercooled liquid water and the free surface of the adsorbed layer remains disordered (i.e., liquid-like) throughout the simulation. This indicates that deposition freezing and water adsorption share similar mechanisms, as water molecules coming from the vapor phase attach to a liquid-like surface. The presence of supercooled liquid nanodroplets that adsorb on the surface before freezing challenges the traditional view on deposition freezing that it does not involve liquid water: at least a “nanophase” of a few thousand water molecules has to be present before ice nucleation occurs. The freezing observed in the simulation is heterogeneous, as it starts from the first adsorbed layer and does not require the presence of many adsorbed layers nor bulk water. We also showed that pore condensation may accelerate but not cause deposition freezing, as freezing curves on the flat surface and in the cylindrical pore are similar but occur earlier in the latter (likely because of concentrating the adsorbed water due to the inverse Kelvin effect). The freezing onset preceded the completion of pore filling in the two different simulation conditions, one that enhances freezing and one that results in realistic equilibrium vapor pressure, which is not in line with the hypothesis of PCF freezing stating that pore filling is a prerequisite for ice nucleation. Finally, freezing curves in pores depended on pore geometry: the hemispherical geometry with a small radius enhances adsorption but suppresses freezing, indicating again that pore condensation is neither a sufficient nor a necessary condition for deposition freezing to occur.
We also demonstrated the potential that deposition freezing might be described by ANT developed for droplet nucleation because (i) the surface of the adsorbed layer remained liquid-like during the whole simulation and (ii) we compared the energetics that define the FHH isotherm parameters for water and ice and found that they are very similar. Future work, which will consist of the direct calculation of the FHH isotherms of water and ice on graphitic surfaces, will focus on further developing ANT to provide a unified parameterization for droplet nucleation and deposition ice nucleation.
An ratio of 20 produces realistic equilibrium vapor pressure; this value was also used in the single previous molecular simulation study of deposition freezing (David et al., 2019). The simulations were repeated using this ratio to examine the impact of the choice of this free parameter on the mechanism of deposition freezing on the flat graphitic surface and in the cylindrical pore. The simulations were approximately 2.5 ns long, sufficient to observe the formation of the critical ice cluster and the initial rapid linear growth of the frozen core. Later phases of the ice nucleation are not expected to depend on the choice of this parameter, since the critical embryo forms at the graphite surface, i.e., embedded in the droplet; thus its growth within the droplet should not depend either on the adsorption of further water molecules on the droplet surface or on the external vapor pressure.
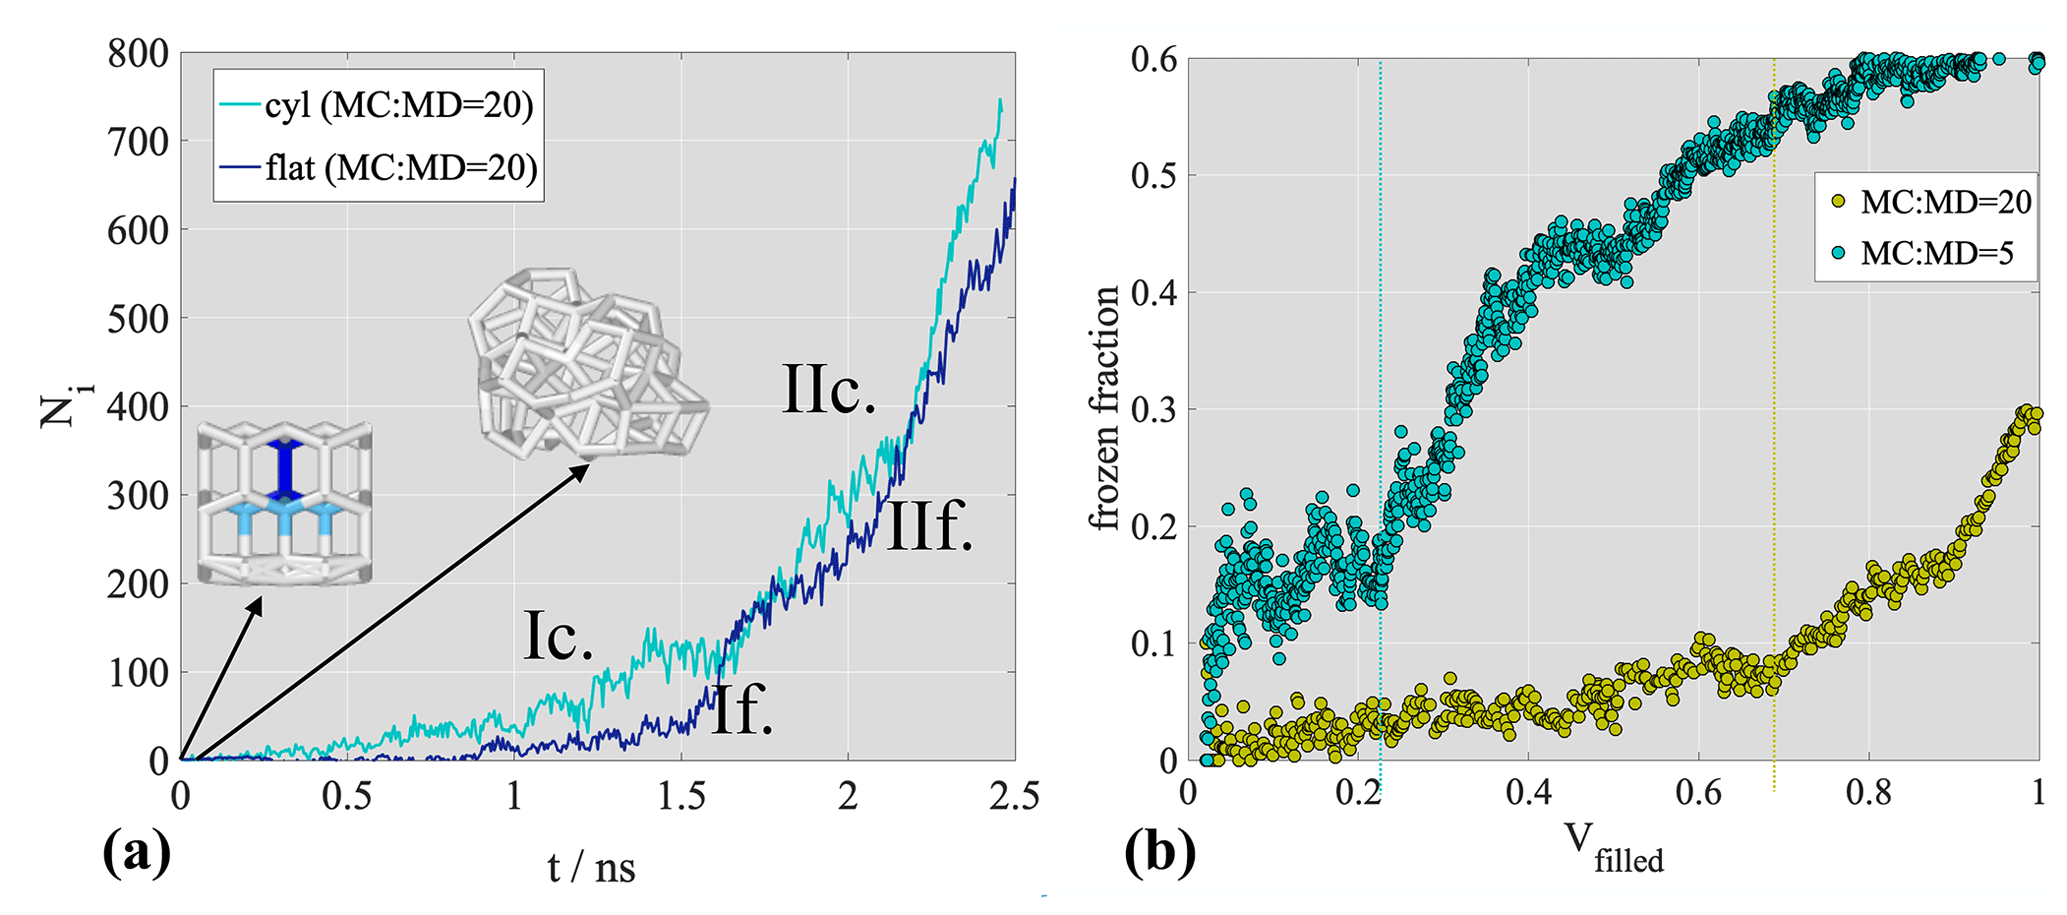
Figure A1(a) Freezing curves calculated from the = 20 simulations. The snapshots in the insets show the initial melting of the ice seed and are taken at t=0 and t=0.05 ns in the cylindrical pore setup. (b) Frozen fraction as a function of the pore-filling ratio (Vf) for the two types of setups in the cylindrical pore. The dotted vertical lines indicate the freezing onset.
Fig. A1a shows freezing curves in the supporting simulations. On the flat surface, freezing is preceded by the adsorption of a supercooled liquid droplet, which contains approximately 1000 water molecules when the critical ice embryo is observed at approximately 1.5 ns (point If.). This is followed by the linear growth of the ice fraction indicating successful nucleation (point IIf.). In the cylindrical pore we also observe the adsorption of a supercooled liquid droplet before the formation of the critical cluster and nucleation (point Ic.), which occurs slightly earlier (1.2 ns) than on the flat surface. The number of ice-like water molecules remains above that on the flat surface. While the difference between the two freezing curves is less pronounced at this ratio, it is still clear that both the flat and the cylindrical surfaces nucleate ice and that the cylindrical pore has enhanced ice nucleation efficiency compared to the flat surface, albeit to a very small extent. Given that freezing was not kinetically favored in this set of simulations, we could observe the melting of the initial ice seed in the early pre-critical stage of the simulation (from 0 to 0.05 ns).
To understand the relationship between pore filling and freezing, we show the frozen fraction as function of the pore-filling ratio (Vf) in the original and the supplementary simulation in Fig. A1b. The freezing onset in the original simulation occurs at Vf∼0.2 and at Vf∼0.6 in the supplementary simulation. Thus the ratio strongly impacts the extent to which the pore is filled when nucleation occurs. However, even with the ratio that is known to reproduce realistic pressures well, the complete filling of the pore is not a necessary condition for freezing.
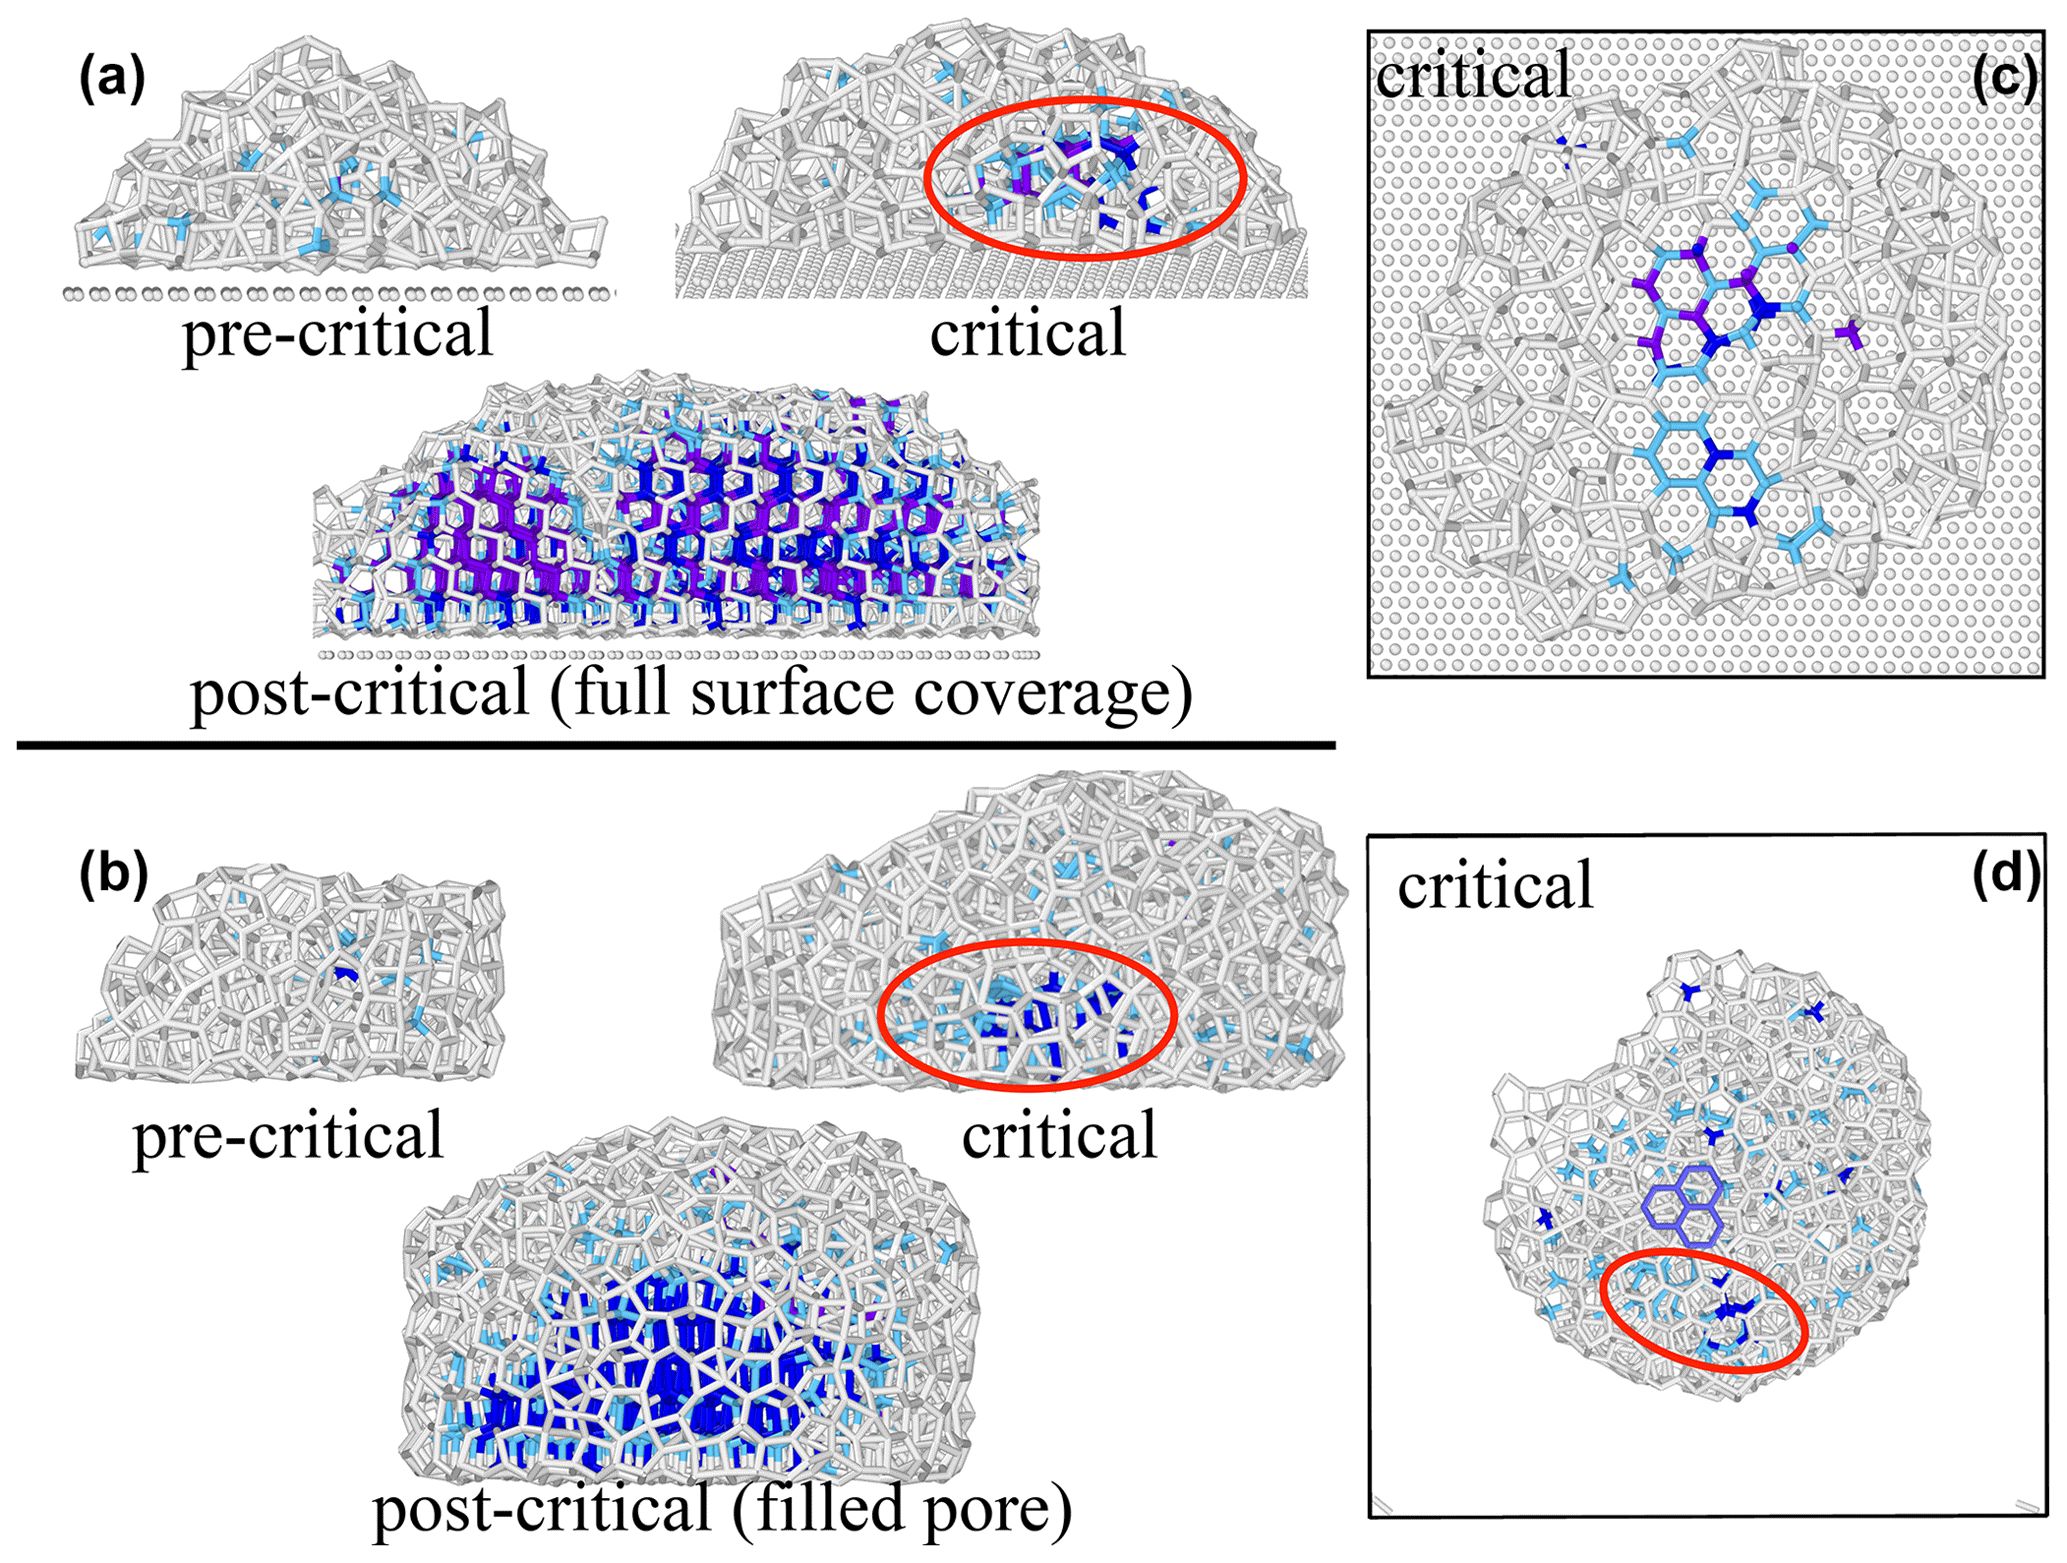
Figure A2(a) Side view snapshots showing the evolution of the droplet adsorbed on the flat surface. (b) Side view snapshots showing the evolution of the droplet in the cylindrical pore. The three blue hexagons indicate the position of initial ice seed. Top view of the critical ice cluster on the flat surface ((c)) and in the cylindrical pore ((d)). The blue hexagons indicate the location of the original ice seed, which melts in the initial few picoseconds of the simulation. White bonds stand for liquid-like water, light blue for interfacial ice, dark blue for hexagonal and purple for cubic ice; carbon atoms are not shown for clarity.
We assess the impact of the choice of ratio on the qualitative mechanism of adsorption and freezing through snapshots showing the growth and the freezing of the droplet taken from the supplementary simulation. The choice of the ratio does not impact most main features of evolution of the droplets and the main conclusion about the freezing processed can be summarized as follows.
-
Freezing is preceded by the adsorption of supercooled droplets. We note that in the supplementary simulation only one such droplet forms, while in the original simulation we observe two smaller droplets. This is however due to the stochasticity of the adsorption process as in a parallel repetition of the simulation with an original ratio of 5, we also observe a single droplet.
-
Even after the freezing onset has been reached, the droplet surface and in particular the three-phase contact line remain liquid-like; thus liquid adsorption and freezing – i.e., the attachment of molecules from the vapor to an existing ice crystal or a liquid droplet – are qualitatively similar.
-
The critical ice embryo forms near the surface, spreads approximately two layers of water and evolves vertically and horizontally; therefore, freezing is heterogeneous and the freezing mechanism is in line with the mechanism proposed for immersion and contact freezing involving the same surface and model parameters based on simple MD simulations (Lupi et al., 2014a). Full surface coverage or complete pore filling is not required for the freezing to occur. In the case of the cylindrical pore, the width of the adsorbed droplet is definitely larger than 2–3 molecular layers on the surface; therefore, it cannot be unambiguously proven that the freezing occurs in the deposition mode and not in the immersion/contact mode.
-
The critical ice embryo is distinct from the original ice seed, which melts in the beginning of the simulation.
Layer-by-layer analysis of the adsorption and freezing in supplementary simulations is summarized in Fig. A3. Fig. A3a shows the number of adsorbed water molecules as a function of time in the first (L1), second (L2) and third (L3) adsorbed layer. Similarly to what has been observed in the original setup, the curves suggest that the adsorption follows a droplet-wise mechanism, i.e., a new layer starts building up before the layer below is saturated (the number of adsorbed molecules reaches a plateau). Fig. A3b shows the number of frozen molecules in the first three consecutive layers of water as a function of time. Freezing is clearly heterogeneous, i.e., the freezing of layer 1, which is in direct contact with the surface, starts before that of layer 2 and layer 3. However, just like adsorption, freezing does not proceed through a layer-by-layer mechanism, which would be indicative of a barrier-less freezing transition. On the flat surface the freezing of layer 1 starts when layer 1, layer 2 and layer 3 contain ∼340, ∼250 and ∼160 molecules, respectively, which is well below the saturation level, in line with the fact that the freezing onset is observed from the simulation in the droplet-wise phase. In the cylindrical pore, freezing starts when layer 1, layer 2 and layer 3 contain ∼330, ∼270 and ∼230 water molecules, all of them below saturation level. The freezing of layer 2 and layer 3 sets on when layer 1 is saturated and layer 2 and layer 3 are at approximately 90 % saturation.
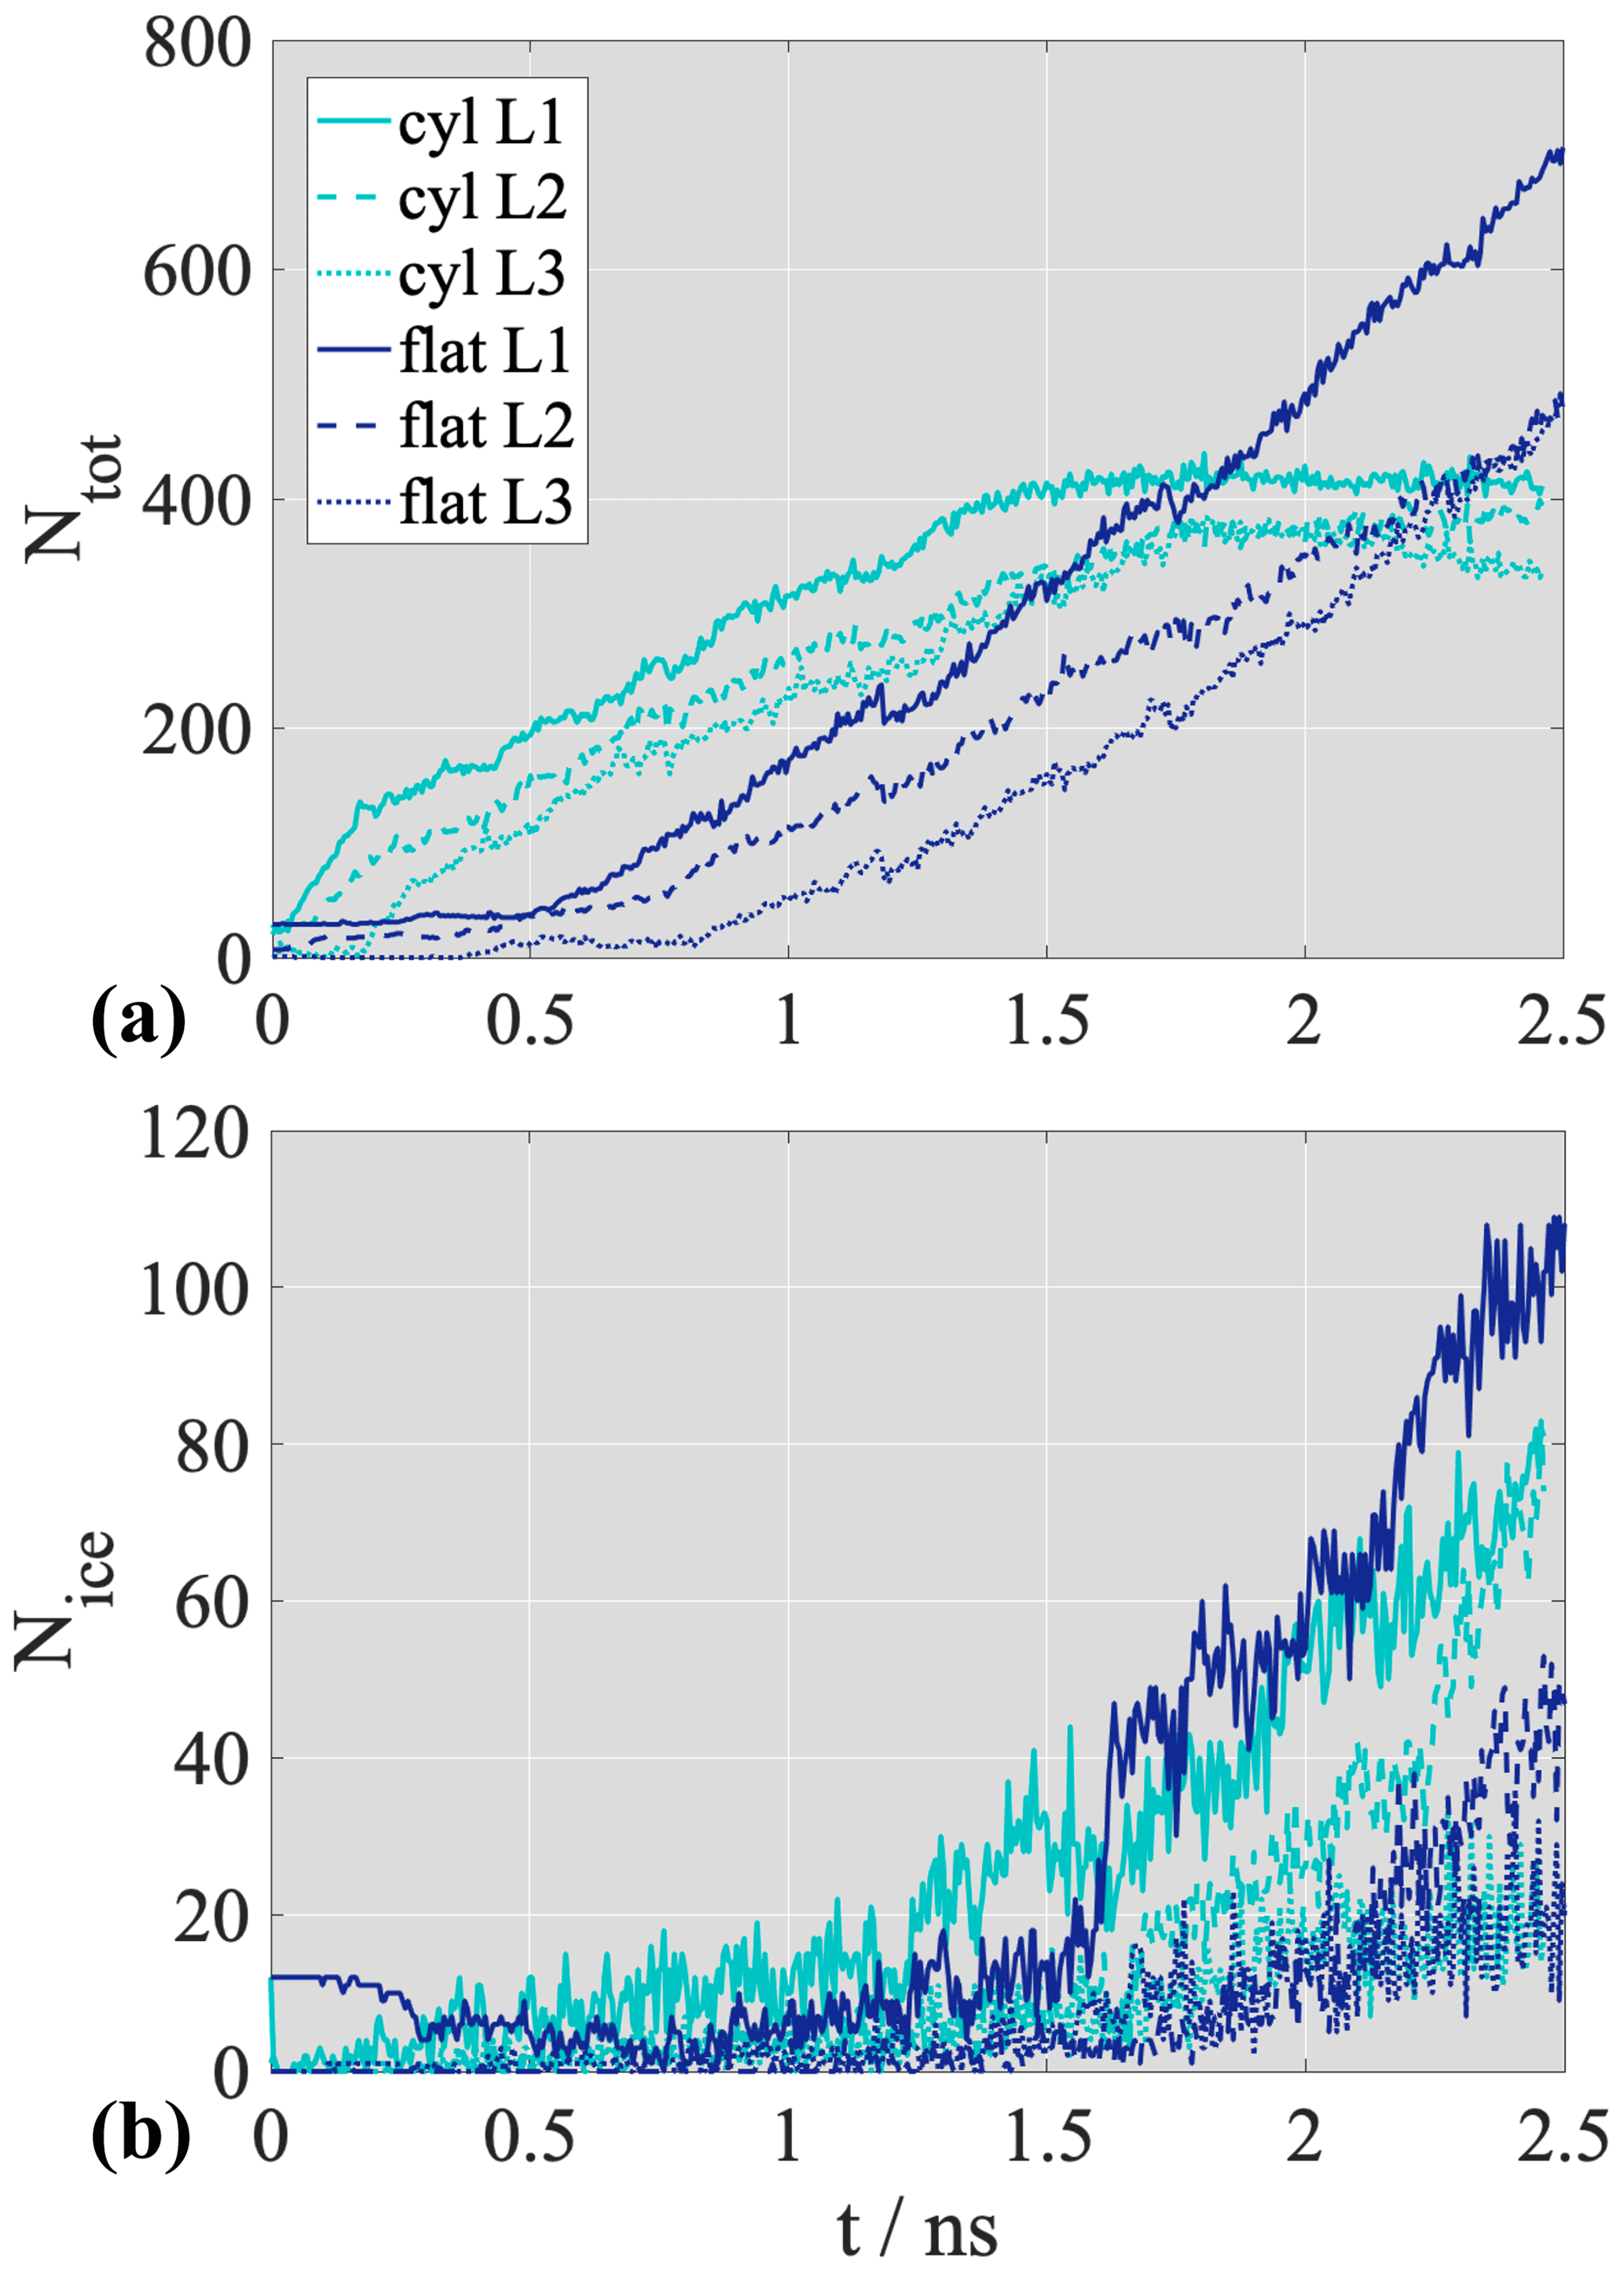
Figure A3The number of water molecules (a) and the number of frozen water molecules (b) in the first three consecutive layers of water (L1: solid line, L2: dashed line, L3: dotted line) on the flat surface (dark blue) and in the cylindrical pore (cyan).
All the above findings are in qualitative agreement with the results of the original simulations; therefore, the choice of this free parameter does not impact the main qualitative conclusions. We acknowledge that a more thorough study involving a series of ratio values would be needed to assess the optimal choice of this parameter for quantitative simulations, including the calculation of nucleation rates.
The number density profile of the first molecular layer of water is shown in Appendix Fig. B1 together with the intrinsic number density profile of the bulk aqueous phase.
The profiles were calculated using the ITIM (Sega et al., 2018) algorithm. The width of the first water layer used for the theoretical calculation of the FHH parameters is taken as the width of the first layer profile, which is 0.38 nm at 10 % height (the choice is such to match the calculation of the width of the ice layers, and it also matches the experimental data, 0.37 nm, of Kaliannan et al., 2020).
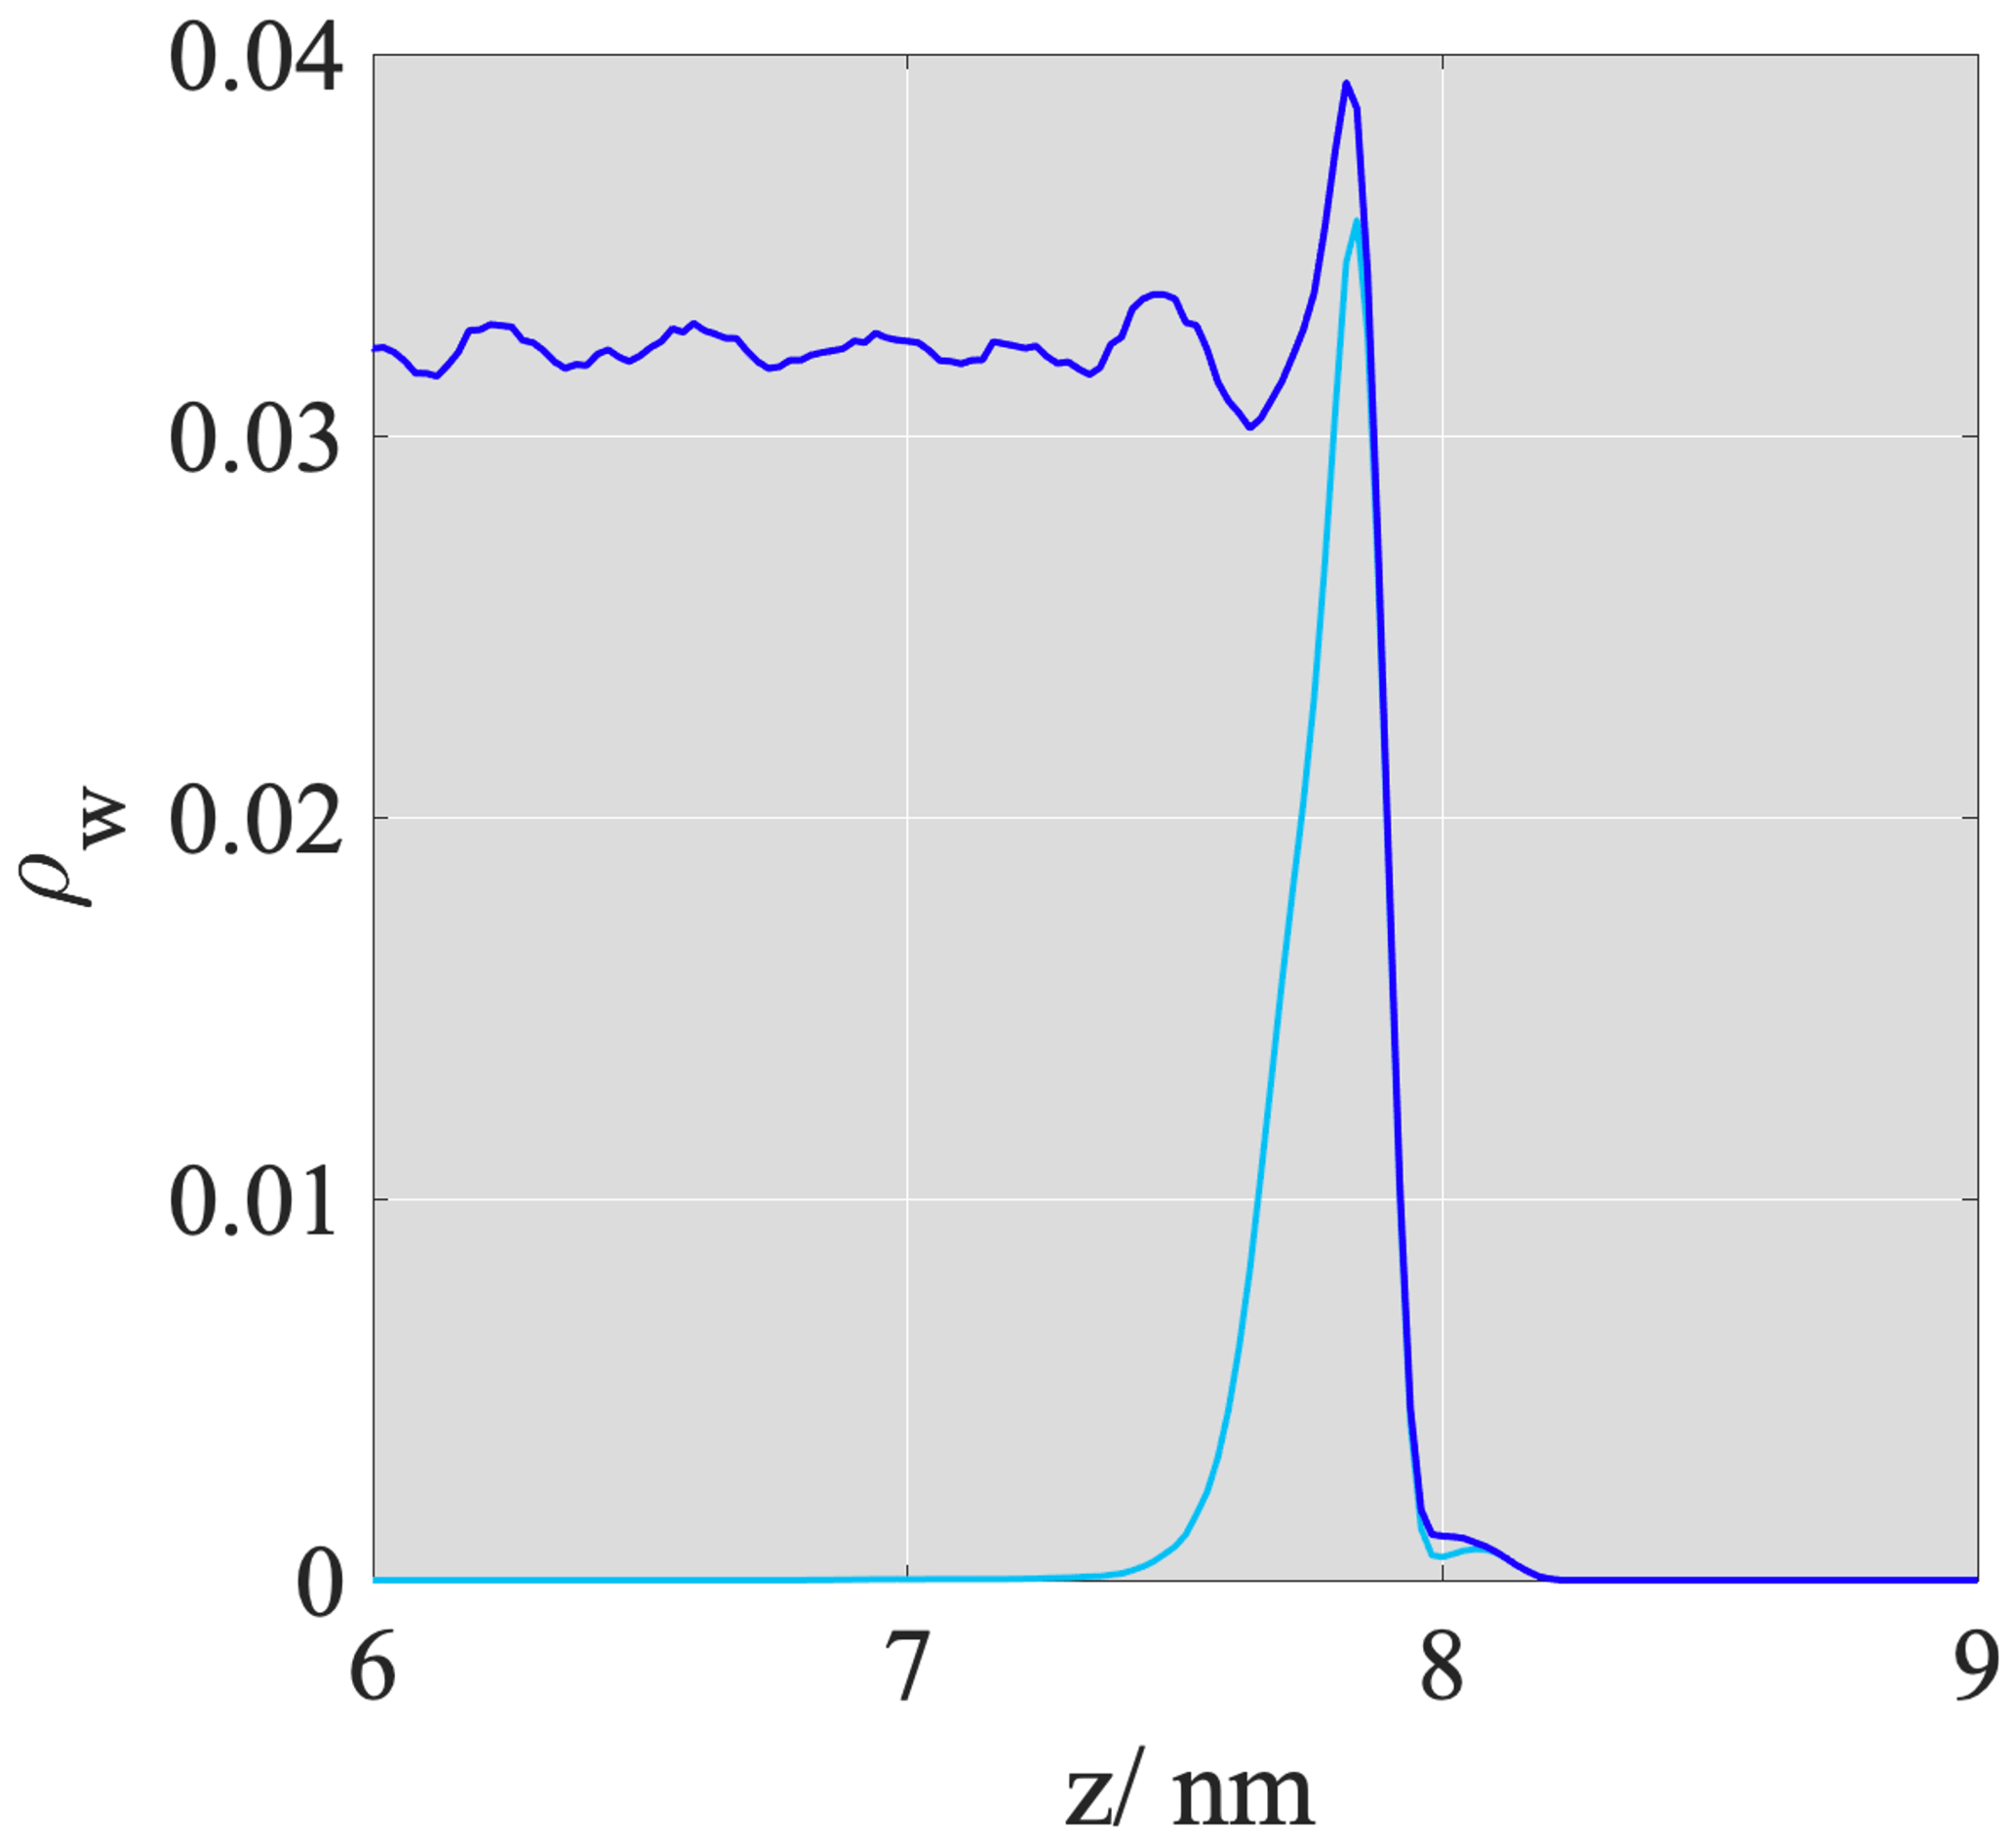
Figure B1Intrinsic number density profile of the aqueous phase (dark blue) and the first molecular layer of water (light blue).
Software and codes used for this work are available online under GNU license. GROMACS: https://www.gromacs.org/ (Abraham et al., 2015), LAMMPS: https://doi.org/10.1016/j.cpc.2021.108171 (Thompson et al., 2022), OVITO: https://doi.org/10.1088/0965-0393/18/1/015012 (Stukowski, 2009).
This paper is the first part of a series discussing a novel theoretical framework for ice nucleation that has yet to be published. Until the complete set of papers is published, we prefer not to share simulated trajectories. Run input files are accessible upon email request to the authors.
MLD designed and performed simulations, undertook the analysis and wrote the article. AL and AN contributed to the analysis, interpreted the results and wrote the article.
At least one of the (co-)authors is a member of the editorial board of Atmospheric Chemistry and Physics. The peer-review process was guided by an independent editor, and the authors also have no other competing interests to declare.
Publisher’s note: Copernicus Publications remains neutral with regard to jurisdictional claims in published maps and institutional affiliations.
Ari Laaksonen acknowledges support by the Academy of Finland (grant no. 345125) and ACCC Flagship funding (grant no. 337552). Athanasios Nenes and Mária Lbadaoui-Darvas acknowledge funding from the Swiss National Science Foundation (project numbers: CRSK-2_195329 and SNF 200021_169506). Mária Lbadaoui-Darvas and Athanasios Nenes acknowledge support from project PyroTRACH (ERC-2016-CoGERC-2016-COG) funded from H2020-EU.1.1. – Excellent Science – European Research Council (ERC), project ID 726165, and the European Union Horizon 2020 project FORCeS under grant agreement no. 821205. Athanasios Nenes acknowledges support by the Swiss National Science Foundation (project no. 192292: Atmospheric Acidity Interactions with Dust and its Impacts, AAIDI). The authors acknowledge the Greek Research & Technology Network (GRNET) in the national HPC facility ARIS for the supercomputing resources granted under project DIceS (no. pr011015).
This paper was edited by Yves Balkanski and reviewed by two anonymous referees.
Abraham, M. J., Murtola, T., Schulz, R., Páll, S., Smith, J. C., Hess, B., and Lindahl, E.: GROMACS: High performance molecular simulations through multi-level parallelism from laptops to supercomputers, SoftwareX, 1, 19–25, 2015. a, b
Bangert, M., Nenes, A., Vogel, B., Vogel, H., Barahona, D., Karydis, V. A., Kumar, P., Kottmeier, C., and Blahak, U.: Saharan dust event impacts on cloud formation and radiation over Western Europe, Atmos. Chem. Phys., 12, 4045–4063, https://doi.org/10.5194/acp-12-4045-2012, 2012. a
Barahona, D.: Analysis of the effect of water activity on ice formation using a new thermodynamic framework, Atmos. Chem. Phys., 14, 7665–7680, https://doi.org/10.5194/acp-14-7665-2014, 2014. a
Barahona, D.: Thermodynamic derivation of the activation energy for ice nucleation, Atmos. Chem. Phys., 15, 13819–13831, https://doi.org/10.5194/acp-15-13819-2015, 2015. a
Bentsen, M., Bethke, I., Debernard, J. B., Iversen, T., Kirkevåg, A., Seland, Ø., Drange, H., Roelandt, C., Seierstad, I. A., Hoose, C., and Kristjánsson, J. E.: The Norwegian Earth System Model, NorESM1-M – Part 1: Description and basic evaluation of the physical climate, Geosci. Model Dev., 6, 687–720, https://doi.org/10.5194/gmd-6-687-2013, 2013. a
Bi, Y., Cao, B., and Li, T.: Enhanced heterogeneous ice nucleation by special surface geometry, Nat. Commun., 8, 15372, https://doi.org/10.1038/ncomms15372, 2017. a, b, c, d, e, f, g, h, i
Boucher, O., Randall, D., Artaxo, P., Bretherton, C., Feingold, G., Forster, P., Kerminen, V.-M., Kondo, Y., Liao, H., Lohmann, U., Rasch, P., Satheesh, S. K., Sherwood, S., Stevens, B., and Zhang, X. Y.: Clouds and aerosols, in: Climate change 2013: the physical science basis. Contribution of Working Group I to the Fifth Assessment Report of the Intergovernmental Panel on Climate Change, Cambridge University Press, 571–657, 2013. a
Christenson, H. K.: Two-step crystal nucleation via capillary condensation, CrystEngComm, 15, 2030–2039, 2013. a
Darden, T., York, D., and Pedersen, L.: Particle mesh Ewald: An N⋅log(N) method for Ewald sums in large systems, J. Chem. Phys., 98, 10089–10092, https://doi.org/10.1063/1.464397, 1993. a
David, R. O., Marcolli, C., Fahrni, J., Qiu, Y., Perez Sirkin, Y. A., Molinero, V., Mahrt, F., Brühwiler, D., Lohmann, U., and Kanji, Z. A.: Pore condensation and freezing is responsible for ice formation below water saturation for porous particles, P. Natl. Acad. Sci. USA, 116, 8184–8189, 2019. a, b, c, d, e, f, g, h
David, R. O., Fahrni, J., Marcolli, C., Mahrt, F., Brühwiler, D., and Kanji, Z. A.: The role of contact angle and pore width on pore condensation and freezing, Atmos. Chem. Phys., 20, 9419–9440, https://doi.org/10.5194/acp-20-9419-2020, 2020. a, b
DeMott, P., Chen, Y., Kreidenweis, S., Rogers, D., and Sherman, D. E.: Ice formation by black carbon particles, Geophys. Res. Lett., 26, 2429–2432, 1999. a
Evans, D. J. and Holian, B. L.: The Nose–Hoover thermostat, J. Chem. Phys., 83, 4069–4074, https://doi.org/10.1063/1.449071, 1985. a
Fletcher, N. H.: Size effect in heterogeneous nucleation, J. Chem. Phys., 29, 572–576, 1958. a
Fowler, L. D. and Randall, D. A.: Liquid and ice cloud microphysics in the CSU general circulation model. Part III: Sensitivity to modeling assumptions, J. Climate, 9, 561–586, 1996. a
Frenkel, J.: Kinetic Theory of Liquids, Oxford University Press, London, 1946. a, b
Gelman Constantin, J., Gianetti, M. M., Longinotti, M. P., and Corti, H. R.: The quasi-liquid layer of ice revisited: the role of temperature gradients and tip chemistry in AFM studies, Atmos. Chem. Phys., 18, 14965–14978, https://doi.org/10.5194/acp-18-14965-2018, 2018. a
Halsey, G.: Physical adsorption on non-uniform surfaces, J. Chem. Phys., 16, 931–937, 1948. a, b, c
Hazeleger, W., Severijns, C., Semmler, T., Ştefănescu, S., Yang, S., Wang, X., Wyser, K., Dutra, E., Baldasano, J. M., Bintanja, R., et al.: EC-Earth: a seamless earth-system prediction approach in action, B. Am. Meteorol. Soc., 91, 1357–1364, 2010. a
Hill, T. L.: Statistical mechanics of adsorption. V. Thermodynamics and heat of adsorption, J. Chem. Phys., 17, 520–535, 1949. a, b
Hill, T. L.: Theory of physical adsorption, in: Advances in catalysis, Vol. 4, Elsevier, 211–258, 1952. a
Hoose, C. and Möhler, O.: Heterogeneous ice nucleation on atmospheric aerosols: a review of results from laboratory experiments, Atmos. Chem. Phys., 12, 9817–9854, https://doi.org/10.5194/acp-12-9817-2012, 2012. a, b, c, d, e
Hoose, C., Kristjánsson, J. E., Chen, J.-P., and Hazra, A.: A classical-theory-based parameterization of heterogeneous ice nucleation by mineral dust, soot, and biological particles in a global climate model, J. Atmos. Sci., 67, 2483–2503, 2010. a
Hudait, A., Allen, M. T., and Molinero, V.: Sink or swim: ions and organics at the ice–air interface, J. Am. Chem. Soc., 139, 10095–10103, 2017. a
Hussain, S. and Haji-Akbari, A.: How to quantify and avoid finite size effects in computational studies of crystal nucleation: The case of heterogeneous ice nucleation, J. Chem. Phys., 154, 014108, https://doi.org/10.1063/5.0026355, 2021. a
Jorgensen, W. L. and Tirado-Rives, J.: The OPLS [optimized potentials for liquid simulations] potential functions for proteins, energy minimizations for crystals of cyclic peptides and crambin, J. Am. Chem. Soc., 110, 1657–1666, https://doi.org/10.1021/ja00214a001, 1988. a
Jorgensen, W. L., Maxwell, D. S., and Tirado-Rives, J.: Development and Testing of the OPLS All-Atom Force Field on Conformational Energetics and Properties of Organic Liquids, J. Am. Chem. Soc., 118, 11225–11236, https://doi.org/10.1021/ja9621760, 1996. a
Kahan, T., Reid, J., and Donaldson, D.: Spectroscopic probes of the quasi-liquid layer on ice, J. Phys. Chem. A, 111, 11006–11012, 2007. a
Kaliannan, N. K., Aristizabal, A. H., Wiebeler, H., Zysk, F., Ohto, T., Nagata, Y., and Kühne, T. D.: Impact of intermolecular vibrational coupling effects on the sum-frequency generation spectra of the water/air interface, Molec. Phys., 118, 1620358, https://doi.org/10.1080/00268976.2019.1620358, 2020. a, b
Kanji, Z. A., Ladino, L. A., Wex, H., Boose, Y., Burkert-Kohn, M., Cziczo, D. J., and Krämer, M.: Overview of Ice Nucleating Particles, Meteorol. Monogr., 58, 1–33, https://doi.org/10.1175/AMSMONOGRAPHS-D-16-0006.1, 2017. a, b, c
Karydis, V. A., Capps, S. L., Russell, A. G., and Nenes, A.: Adjoint sensitivity of global cloud droplet number to aerosol and dynamical parameters, Atmos. Chem. Phys., 12, 9041–9055, https://doi.org/10.5194/acp-12-9041-2012, 2012. a, b
Karydis, V. A., Tsimpidi, A. P., Bacer, S., Pozzer, A., Nenes, A., and Lelieveld, J.: Global impact of mineral dust on cloud droplet number concentration, Atmos. Chem. Phys., 17, 5601–5621, https://doi.org/10.5194/acp-17-5601-2017, 2017. a
Knopf, D. A. and Alpert, P. A.: Atmospheric ice nucleation, Nat. Rev. Phys., 5, 203–217, 2023. a, b, c, d
Kumar, P., Nenes, A., and Sokolik, I. N.: Importance of adsorption for CCN activity and hygroscopic properties of mineral dust aerosol, Geophys. Res. Lett., 36, L24804, https://doi.org/10.1029/2009GL040827, 2009a. a
Kumar, P., Sokolik, I. N., and Nenes, A.: Parameterization of cloud droplet formation for global and regional models: including adsorption activation from insoluble CCN, Atmos. Chem. Phys., 9, 2517–2532, https://doi.org/10.5194/acp-9-2517-2009, 2009b. a, b
Kumar, P., Sokolik, I. N., and Nenes, A.: Cloud condensation nuclei activity and droplet activation kinetics of wet processed regional dust samples and minerals, Atmos. Chem. Phys., 11, 8661–8676, https://doi.org/10.5194/acp-11-8661-2011, 2011. a
Laaksonen, A.: A unifying model for adsorption and nucleation of vapors on solid surfaces, J. Phys. Chem. A, 119, 3736–3745, 2015. a
Laaksonen, A. and Malila, J.: An adsorption theory of heterogeneous nucleation of water vapour on nanoparticles, Atmos. Chem. Phys., 16, 135–143, https://doi.org/10.5194/acp-16-135-2016, 2016. a
Laaksonen, A. and Malila, J.: Nucleation of water, Elsevier, ISBN 9780128143216, 2021. a
Laaksonen, A., Malila, J., and Nenes, A.: Heterogeneous nucleation of water vapor on different types of black carbon particles, Atmos. Chem. Phys., 20, 13579–13589, https://doi.org/10.5194/acp-20-13579-2020, 2020. a, b, c
Lathem, T., Kumar, P., Nenes, A., Dufek, J., Sokolik, I., Trail, M., and Russell, A.: Hygroscopic properties of volcanic ash, Geophys. Res. Lett., 38, L11802, https://doi.org/10.1029/2011GL04729, 2011. a
Lbadaoui-Darvas, M., Garberoglio, G., Karadima, K. S., Cordeiro, M. N. D., Nenes, A., and Takahama, S.: Molecular simulations of interfacial systems: challenges, applications and future perspectives, Molec. Sim., 49, 1229–1266, 1–38, 2021. a
Lupi, L. and Molinero, V.: Does hydrophilicity of carbon particles improve their ice nucleation ability?, J. Phys. Chem. A, 118, 7330–7337, 2014. a, b, c, d
Lupi, L., Hudait, A., and Molinero, V.: Heterogeneous nucleation of ice on carbon surfaces, J. Am. Chem. Soc., 136, 3156–3164, 2014a. a, b, c, d, e, f, g, h, i
Lupi, L., Kastelowitz, N., and Molinero, V.: Vapor deposition of water on graphitic surfaces: Formation of amorphous ice, bilayer ice, ice I, and liquid water, J. Chem. Phys., 141, 18C508, https://doi.org/10.1063/1.4895543, 2014b. a, b, c, d
Mahoney, M. W. and Jorgensen, W. L.: A five-site model for liquid water and the reproduction of the density anomaly by rigid, nonpolarizable potential functions, J. Chem. Phys., 112, 8910–8922, https://doi.org/10.1063/1.481505, 2000. a
Mahrt, F., Marcolli, C., David, R. O., Grönquist, P., Barthazy Meier, E. J., Lohmann, U., and Kanji, Z. A.: Ice nucleation abilities of soot particles determined with the Horizontal Ice Nucleation Chamber, Atmos. Chem. Phys., 18, 13363–13392, https://doi.org/10.5194/acp-18-13363-2018, 2018. a, b, c
Marcolli, C.: Deposition nucleation viewed as homogeneous or immersion freezing in pores and cavities, Atmos. Chem. Phys., 14, 2071–2104, https://doi.org/10.5194/acp-14-2071-2014, 2014. a, b, c
Marcolli, C.: Pre-activation of aerosol particles by ice preserved in pores, Atmos. Chem. Phys., 17, 1595–1622, https://doi.org/10.5194/acp-17-1595-2017, 2017. a
Marcolli, C., Mahrt, F., and Kärcher, B.: Soot PCF: pore condensation and freezing framework for soot aggregates, Atmos. Chem. Phys., 21, 7791–7843, https://doi.org/10.5194/acp-21-7791-2021, 2021. a, b, c
Meyers, M. P., DeMott, P. J., and Cotton, W. R.: New primary ice-nucleation parameterizations in an explicit cloud model, J. Appl. Meteorol. Clim., 31, 708–721, 1992. a
Möhler, O., Büttner, S., Linke, C., Schnaiter, M., Saathoff, H., Stetzer, O., Wagner, R., Krämer, M., Mangold, A., Ebert, V., et al.: Effect of sulfuric acid coating on heterogeneous ice nucleation by soot aerosol particles, J. Geophys. Res.-Atmos., 110, D11210, https://doi.org/10.1029/2004JD005169, 2005. a
Molinero, V. and Moore, E. B.: Water Modeled As an Intermediate Element between Carbon and Silicon, J. Phys. Chem. B, 113, 4008–4016, https://doi.org/10.1021/jp805227c, 2009. a
Neshyba, S., Nugent, E., Roeselová, M., and Jungwirth, P.: Molecular Dynamics Study of Ice- Vapor Interactions via the Quasi-Liquid Layer, J. Phys. Chem. C, 113, 4597–4604, 2009. a
Nguyen, A. H. and Molinero, V.: Identification of Clathrate Hydrates, Hexagonal Ice, Cubic Ice, and Liquid Water in Simulations: the CHILL+ Algorithm, J. Phys. Chem. B, 119, 9369–9376, https://doi.org/10.1021/jp510289t, 2015. a
Nichman, L., Wolf, M., Davidovits, P., Onasch, T. B., Zhang, Y., Worsnop, D. R., Bhandari, J., Mazzoleni, C., and Cziczo, D. J.: Laboratory study of the heterogeneous ice nucleation on black-carbon-containing aerosol, Atmos. Chem. Phys., 19, 12175–12194, https://doi.org/10.5194/acp-19-12175-2019, 2019. a, b, c
Niedermeier, D., Shaw, R. A., Hartmann, S., Wex, H., Clauss, T., Voigtländer, J., and Stratmann, F.: Heterogeneous ice nucleation: exploring the transition from stochastic to singular freezing behavior, Atmos. Chem. Phys., 11, 8767–8775, https://doi.org/10.5194/acp-11-8767-2011, 2011. a, b
Nissan, A.: The hydrogen-bond strength of ice, Nature, 178, 1411–1412, 1956. a
Pedevilla, P., Fitzner, M., Sosso, G. C., and Michaelides, A.: Heterogeneous seeded molecular dynamics as a tool to probe the ice nucleating ability of crystalline surfaces, J. Chem. Phys., 149, 072327, https://doi.org/10.1063/1.5029336, 2018. a
Pickering, I., Paleico, M., Sirkin, Y. A. P., Scherlis, D. A., and Factorovich, M. H.: Grand canonical investigation of the quasi liquid layer of ice: Is it liquid?, J. Phys. Chem. B, 122, 4880–4890, 2018. a
Pinto, J. O.: Autumnal mixed-phase cloudy boundary layers in the Arctic, J. Atmos. Sci., 55, 2016–2038, 1998. a
Popovicheva, O., Kuznetsov, B., Rakhmanova, T., and Shoniya, N.: Water adsorption and crystallization on soot particles, Izv. Atmos. Ocean Phy., 40, 193–201, 2004. a
Pruppacher, H. R., Klett, J. D., and Wang, P. K.: Microphysics of clouds and precipitation, Taylor & Francis, ISBN 0-79-234111-11, 1998. a
Qiu, Y., Lupi, L., and Molinero, V.: Is Water at the Graphite Interface Vapor-like or Ice-like?, J. Phys. Chem. B, 122, 3626–3634, https://doi.org/10.1021/acs.jpcb.7b11476, pMID: 29298058, 2018. a, b, c, d, e
Qiu, Y., Hudait, A., and Molinero, V.: How size and aggregation of ice-binding proteins control their ice nucleation efficiency, J. Am. Chem. Soc., 141, 7439–7452, 2019. a, b, c, d
Roudsari, G., Pakarinen, O. H., Reischl, B., and Vehkamäki, H.: Atomistic and coarse-grained simulations reveal increased ice nucleation activity on silver iodide surfaces in slit and wedge geometries, Atmos. Chem. Phys., 22, 10099–10114, https://doi.org/10.5194/acp-22-10099-2022, 2022. a, b, c, d
Savre, J. and Ekman, A. M.: A theory-based parameterization for heterogeneous ice nucleation and implications for the simulation of ice processes in atmospheric models, J. Geophys. Res.-Atmos., 120, 4937–4961, 2015. a
Sega, M., Hantal, G., Fábián, B., and Jedlovszky, P.: Pytim: A python package for the interfacial analysis of molecular simulations, J. Comput. Chem., 39, 2118–2125, https://doi.org/10.1002/jcc.25384, 2018. a
Seinfeld, J. H., Bretherton, C., Carslaw, K. S., Coe, H., DeMott, P. J., Dunlea, E. J., Feingold, G., Ghan, S., Guenther, A. B., Kahn, R., et al.: Improving our fundamental understanding of the role of aerosol- cloud interactions in the climate system, P. Natl. Acad. Sci. USA, 113, 5781–5790, 2016. a
Sergi, D., Scocchi, G., and Ortona, A.: Molecular dynamics simulations of the contact angle between water droplets and graphite surfaces, Fluid Phase Equil., 332, 173–177,doi10.1016/j.fluid.2012.07.010, 2012. a
Sorjamaa, R. and Laaksonen, A.: The effect of H2O adsorption on cloud drop activation of insoluble particles: a theoretical framework, Atmos. Chem. Phys., 7, 6175–6180, https://doi.org/10.5194/acp-7-6175-2007, 2007. a
Sosso, G. C., Li, T., Donadio, D., Tribello, G. A., and Michaelides, A.: Microscopic mechanism and kinetics of ice formation at complex interfaces: Zooming in on kaolinite, J. Phys. Chem. Lett., 7, 2350–2355, 2016a. a
Sosso, G. C., Tribello, G. A., Zen, A., Pedevilla, P., and Michaelides, A.: Ice formation on kaolinite: Insights from molecular dynamics simulations, J. Chem. Phys., 145, 211927, https://doi.org/10.1063/1.4968796, 2016b. a
Stukowski, A.: Visualization and analysis of atomistic simulation data with OVITO–the Open Visualization Tool, Model. Simul. Mater. Sc., 18, 015012, https://doi.org/10.1088/0965-0393/18/1/015012, 2009. a, b
Thompson, A. P., Aktulga, H. M., Berger, R., Bolintineanu, D. S., Brown, W. M., Crozier, P. S., in't Veld, P. J., Kohlmeyer, A., Moore, S. G., Nguyen, T. D., et al.: LAMMPS-a flexible simulation tool for particle-based materials modeling at the atomic, meso, and continuum scales, Comput. Phys. Commun., 271, 108171, https://doi.org/10.1016/j.cpc.2021.108171, 2022. a, b
Ullrich, R., Hoose, C., Möhler, O., Niemand, M., Wagner, R., Höhler, K., Hiranuma, N., Saathoff, H., and Leisner, T.: A new ice nucleation active site parameterization for desert dust and soot, J. Atmos. Sci., 74, 699–717, 2017. a
Wagner, R., Kiselev, A., Möhler, O., Saathoff, H., and Steinke, I.: Pre-activation of ice-nucleating particles by the pore condensation and freezing mechanism, Atmos. Chem. Phys., 16, 2025–2042, https://doi.org/10.5194/acp-16-2025-2016, 2016. a, b
Welti, A., Kanji, Z. A., Lüönd, F., Stetzer, O., and Lohmann, U.: Exploring the mechanisms of ice nucleation on kaolinite: From deposition nucleation to condensation freezing, J. Atmos. Sci., 71, 16–36, 2014. a
Werder, T., Walther, J. H., Jaffe, R. L., Halicioglu, T., and Koumoutsakos, P.: On the Water−Carbon Interaction for Use in Molecular Dynamics Simulations of Graphite and Carbon Nanotubes, J. Phys. Chem. B, 107, 1345–1352, https://doi.org/10.1021/jp0268112, 2003. a, b
Yang, H., Boucly, A., Gabathuler, J. P., Bartels-Rausch, T., Artiglia, L., and Ammann, M.: Ordered Hydrogen Bonding Structure of Water Molecules Adsorbed on Silver Iodide Particles under Subsaturated Conditions, J. Phys. Chem. C, 125, 11628–11635, 2021. a
Zielkiewicz, J.: Structural properties of water: Comparison of the SPC, SPCE, TIP4P, and TIP5P models of water, J. Chemi. Phys., 123, 104501, https://doi.org/10.1063/1.2018637, 2005. a
- Abstract
- Introduction
- Methods
- Results and discussion
- Conclusions
- Appendix A: Simulations with ratio of 20
- Appendix B: Water density profile and interface layer thickness
- Code availability
- Data availability
- Author contributions
- Competing interests
- Disclaimer
- Acknowledgements
- Financial support
- Review statement
- References