the Creative Commons Attribution 4.0 License.
the Creative Commons Attribution 4.0 License.
 | 19 Jul 2022
Volatility parameterization of ambient organic aerosols at a rural site of the North China Plain
Siman Ren
Yuwei Wang
Gan Yang
Yiliang Liu
Yueyang Li
Lihong Wang
The volatility of organic aerosols plays a key role in determining their gas–particle partitioning, which subsequently alters the physicochemical properties and atmospheric fates of aerosol particles. Nevertheless, an accurate estimation of the volatility of organic aerosols (OAs) remains challenging because most standards for particulate organic compounds are not available, and even for those with standards, their vapor pressures are too low to be measured by most traditional methods. Here, we deployed an iodide-adduct long time-of-flight chemical ionization mass spectrometer (LToF-CIMS) coupled with a Filter Inlet for Gases and AEROsols (FIGAERO) to probe the relationship between the molecular formulae of atmospheric organic aerosols' components and their volatilities. Tmax (i.e., the temperature corresponding to the first signal peak of thermogram) for calibrants was abstracted and validated from the desorption thermograms of mixed organic and inorganic calibrants that were atomized and then collected on a PTFE filter, leading to a linear correlation between Tmax and volatility. In addition, 30 ambient filter samples were collected in winter 2019 at Wangdu station in the Beijing–Tianjin–Hebei region and analyzed by FIGAERO-LToF-CIMS, leading to the identification of 1448 compounds dominated by the CHO (containing carbon, hydrogen, and oxygen atoms) and CHON (containing carbon, hydrogen, oxygen, and nitrogen atoms) species. Among them, 181 organic formulae including 91 CHO and 90 CHON compounds were then selected since their thermograms can be characterized with clear Tmax values in more than 20 out of 30 filter samples and subsequently divided into two groups according to their O C ratios and different thermal desorption behavior. The mean O C of these two groups is 0.56±0.35 (average ± 1 standard deviation) and 0.18±0.08, respectively. Then the parameterizations between volatility and elemental composition for the two group compounds were obtained. Compared with previous volatility parameterizations, our functions provide a better estimation for the volatility of low-volatility organic compounds (LVOCs) in ambient organic aerosols. Furthermore, our results suggest that volatility parameterizations should be specialized for organic compounds with different O C ratios.
- Article
(3511 KB) - Full-text XML
-
Supplement
(2236 KB) - BibTeX
- EndNote


Aerosol particles can significantly impact human health, visibility, and climate (Pöschl, 2005). Organic aerosol (OA) comprises tens of thousands of organic substances and makes up a significant mass fraction of the total submicron particles in the troposphere (Jimenez et al., 2009). Whether an organic compound will exist in the gas phase or particles under a specific temperature is determined by its volatility, which depends on its molar mass and functional groups (Capouet and Müller, 2006; Pankow and Asher, 2008). The volatility of a compound is usually expressed as saturation mass concentration (C0) or saturation vapor pressure (Psat). The effective saturation mass concentration (C*) includes the effect of nonideal thermodynamic mixing with an activity coefficient (γ); thus , and C* equals C0 under the assumption of ideal thermodynamic mixing (Donahue et al., 2011). Saturation mass concentration is regarded as one of the critical physicochemical parameters for organic aerosols' components. The organic compounds with µg m−3 are mostly in the condensed phase, the organic compounds with µg m−3 are almost entirely in the gas phase, and the organic compounds with µg m−3 will be found in both phases under typical conditions (Donahue et al., 2009).
During the past years, two major methods relevant to the chemical ionization mass spectrometer (CIMS) have been developed to characterize the volatility of aerosols. The first one estimates the volatility of an organic species based on its molecular formula. The relationship between C* and molecular formulae of alkane, aldehyde, ketone, alcohol, acid, diol, and diacid was proposed by Donahue et al. (2011), which clarifies the relationship between nC (the numbers of carbon) and nO (the numbers of oxygen) and logC0. The relationship was derived from a group contribution method SIMPOL that actually is a structure-based estimation method (Pankow and Asher, 2008). Li et al. (2016) updated this function by including 31 066 compounds from the National Cancer Institute (NCI) open database, which applies not only to CHO compounds (containing carbon, hydrogen, and oxygen atoms) but also to the nitrogen- and sulfur-containing compounds. However, Isaacman-Vanwertz and Aumont (2021) showed that the volatility of CHON compounds estimated by the Li et al. (2016) parameterization is significantly biased by an increase in the number of nitrogen atoms, and thus they modified the nitrogen coefficient for CHON compounds from the Li et al. (2016) study using a fixed relationship between the nitrogen coefficient and the number of the oxygen atom (i.e., ). On the other hand, Donahue et al. (2011) took only −OH, =O, and −C(O)OH functionalities into account when describing an average effect of an added oxygen, which could result in a large uncertainty when estimating the volatility of highly oxygenated organic molecules (HOMs) that contain hydroperoxide (−OOH) functionalities. Thus, Stolzenburg et al. (2018) and Mohr et al. (2019) updated the parameters for the volatility estimation of HOMs, based on 15 HOMs. The molecular structures of these 15 HOMs are unclear, but their saturation concentrations were estimated using the SIMPOL method on the basis of supposed molecular structures (Tröstl et al., 2016). As the covalently bonded dimers are abundant in HOMs from ozonolysis of α-pinene, Stolzenburg et al. (2018) fitted parameters using monomer and dimer HOMs separately, allowing a parameter to represent the covalent binding. Since molecular formulae of organic aerosols can be obtained by state-of-the-art instruments such as high-resolution mass spectrometers, C* of organic compounds in the aerosol particles can then be calculated based on the above-mentioned empirical functions (Huang et al., 2019).
The second one estimates the volatility of an organic species on the basis of its desorption thermogram. When analyzing physicochemical properties of aerosol particles, one of the most popular techniques is to heat the particles and then detect the evaporated compounds utilizing mass spectrometry techniques, such as using a thermodenuder–particle beam mass spectrometer (Faulhaber et al., 2009), thermal-desorption chemical ionization mass spectrometer (TD-CIMS) (Smith et al., 2004), micro-orifice volatilization impactor coupled to a chemical ionization mass spectrometer (MOVI-CIMS) (Yatavelli and Thornton, 2010), chemical analysis of aerosols online-proton transfer reaction mass spectrometer (CHARON-PTR-MS) (Eichler et al., 2015), and the Filter Inlet for Gases and AEROsols (FIGAERO) coupled with a time-of-flight chemical ionization mass spectrometer (ToF-CIMS) (Lopez-Hilfiker et al., 2014). Basically, the desorption temperature is ramped up linearly, the particulate organic compounds with different vapor pressures are thermo-desorbed and then characterized with distinct thermograms (i.e., desorption signal versus temperature), and the temperature corresponding to the first peak signal (Tmax) correlates with the vaporization enthalpy of a compound (Lopez-Hilfiker et al., 2014). It is thus applicable to estimate C*, i.e., the volatility of the chemical constituents in the particles, from the measured Tmax, after calibration with a set of standards with known vapor pressures (Bannan et al., 2019), which has been widely applied in many previous studies (Nah et al., 2019; Stark et al., 2017; M. Wang et al., 2020; Ye et al., 2019; Ylisirniö et al., 2020). Compared with the parameterization method from organic aerosols' molecular formulae, the thermogram method is able to give a volatility distribution that is likely closer to the real one. The molecular formula method likely treats the thermal decomposition products after heating as evaporated organic molecules and thus overestimates the overall volatility of a group of organics (Stark et al., 2017).
The FIGAERO-ToF-CIMS has been widely used in the field and in laboratory studies in recent years. For example, M. Wang et al. (2020) explored the volatility of aromatic hydrocarbon photo-oxidation products, Ylisirniö et al. (2020) compared the volatility of secondary organic aerosol (SOA) components formed from oxidation of real tree emissions with that formed from oxidation of single volatile organic compound (VOC) systems, and Ye et al. (2019) studied the volatility of nucleated particles from α-pinene oxidation between −50 and +25 ∘C using a FIGAERO-ToF-CIMS. Accurately measuring the desorption thermograms of the standards is one of the essential factors for the success of this method. For example, previous studies typically used the syringe deposition method to prepare the mimic filter, which leads to wide variations in results. A new method for volatility calibration, the atomization method, accurately captures the evaporation of chemical constituents from ambient aerosol particles (Ylisirniö et al., 2021). In addition, the influences of mixing of organic compounds and inorganic salts that are a major component in ambient aerosol particles on the thermograms of organics were not considered in these previous studies.
On the other hand, with rapid economic growth and urbanization in the North China Plain (NCP), air pollution and extreme haze events frequently occurred in this region, the formation of which is closely related to the volatility of aerosol components (Li et al., 2017; Shiraiwa and Seinfeld, 2012). Therefore, it is crucial to understand the volatility of aerosol components in the NCP and, to a larger extent, in the ambient atmosphere.
In this study, we compared the effects of the methods of syringe deposition and atomization on Tmax with a series of authentic organic standards using a long time-of-flight CIMS coupled with FIGAERO (FIGAERO-LToF-CIMS) and investigated the influences of inorganic salts and the mixing of organic compounds on the Tmax of organics. In addition, we developed empirical volatility–molecular formula functions based on selected CHO and CHON compounds with varying O C ratios from ambient particles collected at Wangdu station in the North China Plain, China, from 15 to 22 January 2019. The C* of these selected compounds was estimated by obtained Tmax from thermograms. Lastly, our empirical functions were compared with previous ones.
2.1 FIGAERO-LToF-CIMS
The chemical composition and thermograms of particulate compounds collected on filters were measured via a FIGAERO-LToF-CIMS with a mass resolving power of 7700–8500, and the volatility of compounds was acquired from thermograms (Bertram et al., 2011; Lee et al., 2014; Lopez-Hilfiker et al., 2014). The design and operation of the FIGAERO have been introduced in previous studies (Bannan et al., 2019; Lopez-Hilfiker et al., 2014; Thornton et al., 2020; Ye et al., 2021). In this study, particles collected in the lab calibration experiments or from the field campaign were thermally desorbed utilizing an ultrahigh-purity (UHP) nitrogen flow at 2.3 L min−1, among which 1.0 L min−1 UHP N2 passed the filter and entered the ion–molecule reaction (IMR) chamber. In IMR, organic molecules were charged by iodide ions generated by exposure of a 1.0 L min−1 mixture of CH3I and UHP N2 to a 0.1 mCi radioactive Am-241 source.
The desorption procedure for the calibration experiments and the field measurements was the same, as shown in Fig. S1. During the thermo-desorption process, the heating temperature ramp linearly started from room temperature (∼25 ∘C) to 134 ∘C, and then the filter was held at 134 ∘C for 40 min to ensure that most of the organic compounds were desorbed from the filter (Lopez-Hilfiker et al., 2016). The measured ramping rate for heating was 2.27 ∘C min−1 in this study. A slower ramping rate allows more time to stay at any momentary desorption temperature so that a larger fraction of molecules would evaporate (Ylisirniö et al., 2021). Also, a slower ramping rate can separate compounds with similar volatilities better (Lopez-Hilfiker et al., 2014). Note that the decomposition degree of parental compounds under a slower ramping rate is higher than that under a faster ramping rate, but a slower heating rate leads to a smaller number of thermal decomposition products (Yang et al., 2021). Most of the ambient organic compounds can be desorbed from the filter at less than 134 ∘C (Huang et al., 2019). Furthermore, high-molecular-weight organic compounds (e.g. C27H52O4) can be evaporated from the filter below 120 ∘C (Wang et al., 2016; Zhang et al., 2020). Therefore, the highest temperature of 134 ∘C is feasible in our study.
During ambient filter measurements, background measurements using a blank filter were also conducted. The blank filter was analyzed by the same thermal desorption procedure as that of the field samples. The obtained signals are treated as the background signals. An example of the background signal of an identified compound was shown in Fig. S2.
Tofware software (version 3.1.2, Tofwerk AG, Switzerland) was used to analyze the data of the mass spectrometer. To plot thermograms, signals of evaporated compounds were normalized by the abundance of reagent ions and then subtracted with the background signals, which were normalized similarly. The raw data were acquired at a frequency of 1 Hz and then averaged to a 20 s time interval during the data analysis. As the desorption features of ambient aerosol particles were quite complex, we applied the Levenberg–Marquardt algorithm to fit the thermograms and conducted peak deconvolution for the multimodal thermograms (Goodman and Brenna, 1994; Lopez-Hilfiker et al., 2015; Stolzenburg et al., 2018). In the case of a multimodal thermogram, the higher-temperature peak(s) (i.e., the warmer peak) was assumed to come from the thermal decomposition of larger molecules or isomers with different vapor pressures (Huang et al., 2018; Wang et al., 2016; Zhang et al., 2020). Hence, in this study, Tmax of the cooler peak (i.e., the first peak) was used to estimate the volatility of an organic compound.
2.2 Calibration experiments
The C* versus Tmax calibration curve was obtained by species with known vapor pressures. Two methods referred to as the syringe deposition method and the atomization method were used to prepare filter samples of authentic compounds. For the syringe deposition method, certain amounts of authentic species dissolved in the acetonitrile solvent were injected onto a PTFE filter by a syringe. While the acetonitrile solvent was supposed to quickly evaporate from the filter and have a minor effect on authentic species, only the authentic species were thermally desorbed during the subsequent FIGAERO-LToF-CIMS analysis. For the atomization method, the authentic species dissolved in deionized water were atomized by a commercial atomizer (TSI®3076). Atomized particles were diluted and dried by a zero-gas flow and silica gel, respectively, after which the relative humidity (RH) of the flow was regulated to around ∼2 % (Fig. S3). Then, particles were collected on a PTFE filter and subsequently analyzed by the FIGAERO-LToF-CIMS. The mass of collected particles can be calculated based on the number size distribution of particles measured by a scanning mobility particle sizer (SMPS, TSI®3776), the particle density, the collection time, and the flow rate through the filter (Ylisirniö et al., 2021). Among them, the particle density can be estimated according to the density of corresponding authentic standards and their mixing ratios in the solution.
During our laboratory tests, 11 sets of calibration experiments were conducted. These experiment conditions are summarized in Table 1. One set of (no. 1) experiments using the syringe deposition method were performed, where polyethylene glycols (PEGs) were used as authentic organic standards (Bannan et al., 2019). In addition, 10 sets of atomization experiments were also conducted. The no. 2 set works as an intercomparison with previous syringe deposition (no. 1) experiments. The no. 3–7 sets of experiments were conducted to explore the effects of ammonium sulfate and mixed organic compounds on the Tmax of organics. Erythritol, PEG-6, PEG-7, PEG-8, and citric acid were used as authentic organic standards because they can co-dissolve with ammonium sulfate in deionized water. In no. 3, ammonium sulfate was not added to the standard solution, and there were only organic standards. In no. 4 and no. 5, ammonium sulfate was mixed with erythritol, PEG-6, PEG-7, PEG-8, and citric acid, respectively. Amounts of 200 and 1000 ng atomized particles were collected in no. 4 and no. 5, respectively. It is assumed that the atomized particles were internally mixed with the same mass ratio as that in the solution (Drisdell et al., 2009), consisting of 100 ng 500 ng of ammonium sulfate and 100 ng 500 ng of the mixed organic standard. Although ammonium sulfate is much less volatile than mixed organics and the mixing ratio of ammonium sulfate to organic compounds in atomized particles might be different with that in solution, this assumption likely leads to a minor effect on the matrix effect of ammonium sulfate. In the sixth (no. 6) set, erythritol, PEG-6, PEG-7, PEG-8, and citric acid were mixed together, and 1000 ng atomized particles was collected. In no. 7, ammonium sulfate was mixed with erythritol, PEG-6, PEG-7, PEG-8, and citric acid. The no. 7–11 sets of experiments were conducted to explore the effect of mass loading of filters. Four replicates were performed for each set of experiments.

2.3 Field campaign
An ambient campaign was conducted from 16 December 2018 to 22 January 2019 at Wangdu station, Hebei Province, China (Hu et al., 2022; Y. Wang et al., 2020). The campaign site (38.66∘ N, 115.19∘ E) was mainly influenced by the surrounding transportation, industrial and residential sources, and farmlands and forests and can be treated as a typical suburban station.
Aerosol particles (PM2.5) were collected four times every day, and each collection lasted for 15 min (i.e., 07:00–07:15, 12:00–12:15, 17:30–17:45, and 21:00–21:15 local time, respectively). Ambient PM2.5 was sampled onto PTFE filters (5 µm pore size, 25 mm diameter, Millipore), and the flow rate was regulated at 1.42 L min−1. After the collection, filter samples were preserved at −20 ∘C in a freezer until further analysis. In this study, 30 filter samples between 15 and 22 January 2019 were analyzed with FIGAERO offline because mass loadings of these 30 filter samples varied from 200 to 3500 ng with a median of 1100 ng, which is similar to those in the calibration experiments. The mass concentration of PM2.5 was measured by a commercial synchronized hybrid real-time particulate monitor (TEI, Model 5030i).
2.4 Saturation mass concentration (C*)
2.4.1 Calculation of C*
By correlating the logarithm of Psat at 298 K of these authentic standards in the literature to their Tmax values obtained from the desorption thermograms, a linear relationship can be obtained (Bannan et al., 2019):
where a and b are fitted parameters, and this expression can also be expressed as
On the other hand, Psat can be converted to C* with the assumption of the ideal gas law (Ylisirniö et al., 2020, 2021). In this way, the relationship between C* and Tmax is deduced as
where Mw is the molecular weight of an authentic compound (g mol−1), R is the gas constant (8.314 J mol−1 K−1), and T is the temperature when the Psat is determined (K; in our study, T is 298 K).
2.4.2 Correlation between C* and molecular formulae
We substituted the measured Tmax of selected organic compounds in the ambient aerosol particles into Eq. (3) with fitted a and b values from experiments with authentic standards and obtained their C*. Then we correlated C* to molecular formulae of these selected organic compounds in a function similar to what has been developed in a previous study (Donahue et al., 2011; Mohr et al., 2019):
where is the reference carbon number and set to be 25 (Donahue et al., 2011); nC, nO, and nN are the numbers of carbon, oxygen, and nitrogen atoms in an organic species, respectively; bC, bO, and bN denote the contribution of each kind of atoms to log 10C0, respectively, and bCO is the carbon–oxygen nonideality (Donahue et al., 2011; Li et al., 2016). Values of , and bCO are then fitted with multi-linear least-squares analysis.
3.1 Laboratory calibration
Figure S4 compares the Tmax values for the same authentic organic standards when using different calibration methods. PEG-4 was not detected by CIMS with the second (no. 2) set of calibration experiments, which is consistent with the result of a previous study (Ylisirniö et al., 2021). This observation is most likely due to the high volatility of PEG-4 that leads to its evaporation even before the CIMS measurement (Ylisirniö et al., 2021). The Tmax values measured with the syringe deposition experiments have larger error bars (Fig. S4). The Tmax may increase with increased filter loadings (Wang and Hildebrandt Ruiz, 2018), if calibrated with the same method. However, despite a larger mass loading (500 ng) in the atomization (no. 2) experiments than that (100 ng) in the syringe deposition (no. 1) experiments, the Tmax values measured with the atomization method are about 20 ∘C lower than those with the syringe deposition method for the same compound. This observation can be explained by the fact that the surface area of the material deposited by the syringe is smaller than that of deposited aerosol particles, which requires more time to evaporate and corresponds to higher Tmax values (Ylisirniö et al., 2021).
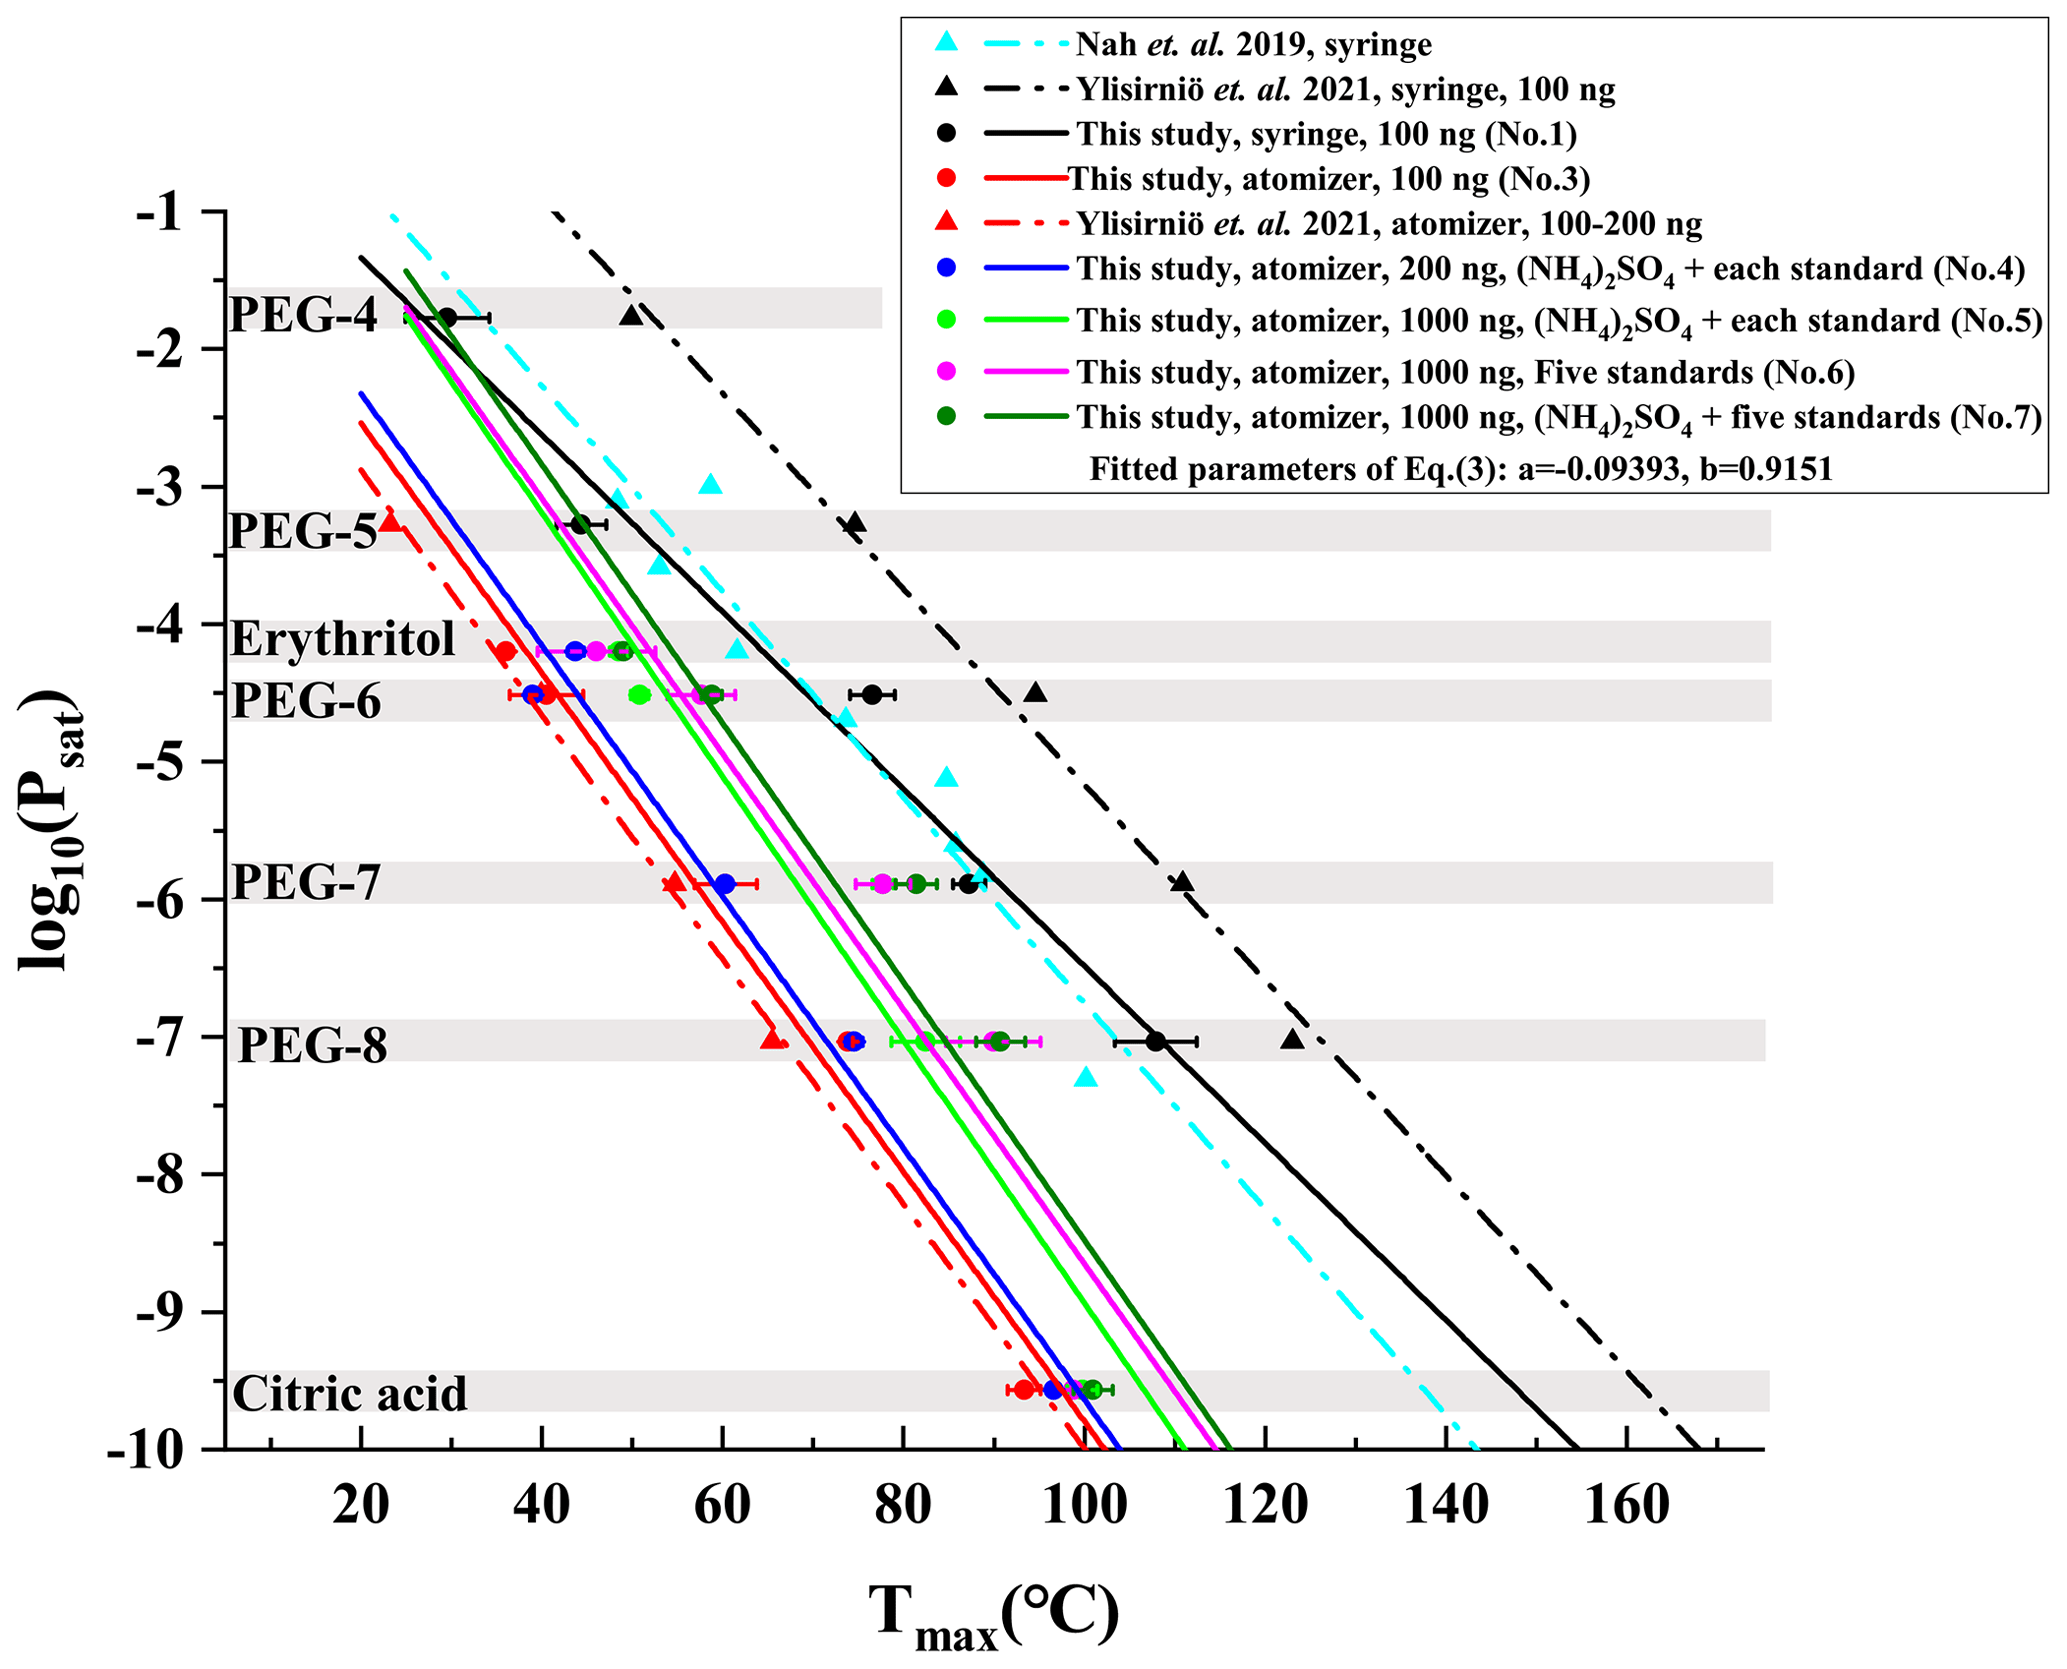
Figure 1Comparison of calibration results obtained in this study with those reported previously. These solid lines denote the calibration results obtained in this study. Error bars represent ± 1 standard deviation of Tmax from four replicate experiments. The fitted parameters correspond to the dark green line. The dashed–dotted light blue line denotes calibration results obtained with acids and erythritol by Nah et al. (2019) using the syringe method. The dashed–dotted black line represents calibration results obtained with 100 ng deposited PEGs (including PEG-4, PEG-5, PEG-6, PEG-7, and PEG-8) by Ylisirniö et al. (2021) using the syringe method. The dashed–dotted red line denotes calibration results obtained with 100–200 ng PEGs (including PEG-5, PEG-6, PEG-7, and PEG-8) by Ylisirniö et al. (2021) using the atomization method.
In Fig. 1, we further compared our calibration results with previously reported ones. Six solid calibration lines acquired in this study are located between the dashed–dotted calibration lines by Ylisirniö et al. (2021) using the atomization method and the syringe deposition method. The solid calibration line obtained with PEGs (O C >0.25) by the syringe deposition method in this study is quite close to the dashed–dotted calibration line that was also obtained by the syringe deposition method with acids (O C: 0.09–0.80) and erythritol (O C >0.25) (Nah et al., 2019). Yet the slopes of two lines are a bit different, which may be attributed to a different O C ratio of organic standards. In addition, the calibration line obtained with 100 ng deposited standards in this study by the atomization method almost overlaps that obtained with the same method, standard, and mass loading (Ylisirniö et al., 2021). However, the calibration line obtained with 100 ng deposited standards in this study by the syringe deposition method is far away from the dashed–dotted calibration line obtained with the same method, standard, and mass loading (Ylisirniö et al., 2021). Clearly, compared with the syringe deposition method, the atomization method shows much better repeatability, even between different studies.
The effects of ammonium sulfate and mixed organic compounds on Tmax of organics are also investigated, as shown in Figs. 1 and S5, since the majority of current atmospheric aerosol particles consists of ∼50 % ammonium sulfate and 50 % carbonaceous components (Drisdell et al., 2009). Clearly, mixing the same amount of ammonium sulfate with each of the five organic standards, as done in no. 4, increased the Tmax values of erythritol and citric acid but did not alter the Tmax values of PEGs 6–8 significantly. Comparison of the Tmax values of no. 6 and no. 7 shows that the Tmax of five organics exhibited a slight increase (1 to 4 ∘C), which is likely due to the addition of ammonium sulfate. Furthermore, elevated Tmax (1 to 8 ∘C) between no. 5 and no. 7 was observed, which means the matrix effects within mixed organic compounds can also enhance the Tmax of organics. The Tmax of five organic compounds increased by 3 to 17 ∘C with the increase of mass loadings according to no. 4 and no. 5 (Fig. S5). Furthermore, as shown in Fig. S6, the Tmax of five organic compounds generally increases with increased mass loadings, and Tmax has increased approximately 8 ∘C as the mass loading increases from 200 to 1500 ng. The 95 % credible intervals of no. 5, no. 6, and no. 7 experiments are significantly larger than the others, which may be attributed to their higher mass loading (1000 ng) than those in other experiments (100, 200, and 500 ng) (Fig. S7). Therefore, the Tmax values of organic compounds are affected together by the addition of ammonium sulfate, the matrix effects within organic compounds, and mass loadings. However, these effects cannot be quantified separately in our study.
Moreover, the fraction of organic species and inorganic salts of nonrefractory submicron aerosol species (NR-PM1) in Beijing in winter 2018 were about 48 % and 52 %, respectively (Zhou et al., 2020). The fraction of organic species and inorganic salts in total particulate matters (PM) in a rural site (Gucheng in Hebei province) in winter 2018 were about 40 % and 60 %, respectively (Xu et al., 2021). The mass ratios of the inorganic salt to organic species were close to 1:1, which was similar to that of our laboratory tests (i.e., no. 7 set of calibration experiments). In addition, Ylisirniö et al. (2021) shows that particle size has a moderate impact on the measured Tmax of organic compounds. The particle size distributions and peak diameters of polydisperse particles in our laboratory experiments (no. 4, no. 6, and no. 7) are similar to those of the ambient samples (Fig. S8). Therefore, in our study, particle size distributions have a minor effect on measured Tmax.
To minimize the uncertainties from multiple factors (e.g., the presence of ammonium sulfate, multiple organic compounds, particle size distributions, and mass loading) on Tmax, the calibration line obtained from no. 7 was utilized to estimate Tmax values of organic compounds in ambient particles and to derive our parameterizations because the experimental conditions of mimic particle samples in no. 7 are the closest to those of the ambient samples and can represent ambient organic aerosol particles.
3.2 Volatility of OA components
We identified 1448 compounds from the filter collected during 07:00–07:15, 15 January 2019, in Wangdu, whose mass defect plot is shown in Fig. 2. Among them, 340 CHO and 663 CHON species account for 43.5 % and 20.8 % of the total signals, respectively, because the iodide-adduct chemical ionization is sensitive toward multifunctional oxygenated organic compounds with minimal fragmentation (Bertram et al., 2011; Lopez-Hilfiker et al., 2016). In addition to 326 other species (30.8 % of the total signals) that have been assigned with molecular formulae but cannot be divided into either the CHO or CHON groups, there are 119 species (4.9 % of the total signals) without attributed molecular formulae.
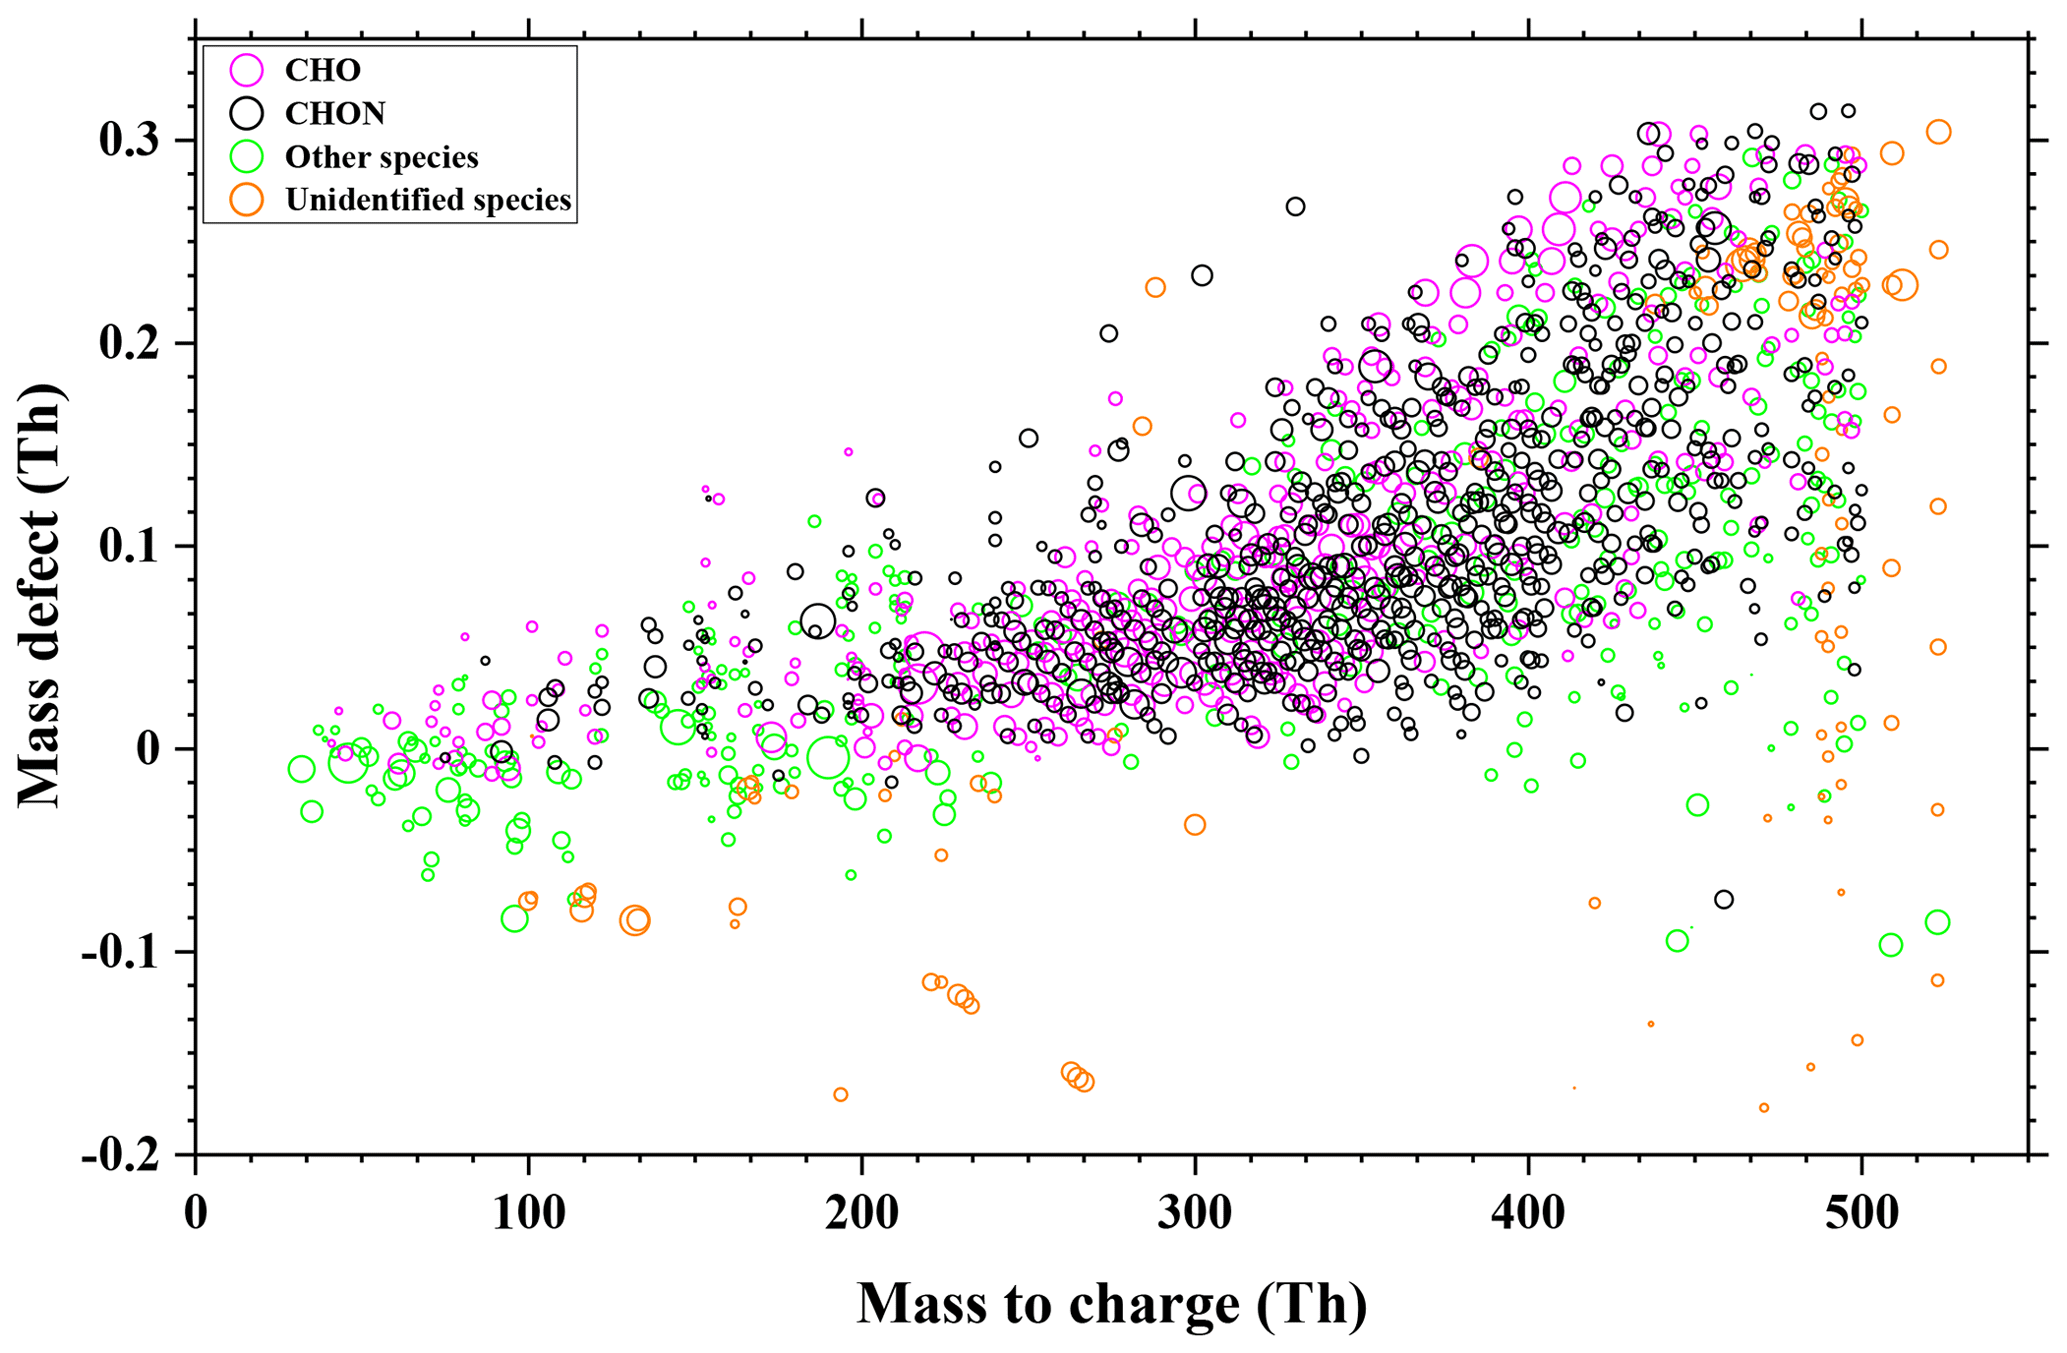
Figure 2A typical mass defect plot for compounds desorbed from a filter collected during 07:00–07:15, 15 January 2019, in Wangdu. The symbol size is proportional to the logarithm of signal intensity. The reagent ion (I−) was not removed from their formulae.
Among the 1448 species, we can attribute a Tmax to 765 species, whose thermograms are characterized with a distinguishable Tmax with one or two desorption peaks, as shown in Fig. S9a and c and S9b and d, respectively. For the rest, their thermograms did not show a peak, and thus the position of Tmax cannot be judged, as shown in Fig. S9e and f. In Fig. S10, we show the thermal desorption temperature of these 765 particulate compounds during the FIGAERO-LToF-CIMS analysis. The desorption temperatures of these organic compounds concentrated in the 80–100 ∘C range. The thermograms of most organic compounds show a single peak, and the mass-to-charge ratios () of these compounds are concentrated in the range of 250–450 Th, and the dominant compounds are C13H25NO2, C16H32O2, C18H35NO4, C6H10O5, C9H17NO2, and C18H34O2.
We analyzed 30 filter samples in total. For each filter, we selected species that can be assigned with a reliable molecular formula in the format of either CHO or CHNO and species that can be designated with a Tmax, the intersection of which correspond to species with both reliable CHO- or CHNO- type molecular formulae and Tmax values. There are 181 such organic compounds including 91 CHO and 90 CHON species that were present in more than 20 out of 30 filter samples. The 181 species are dominant compounds accounting for 34.1 % of the total signal of 1448 compounds. It should be noted that several compounds (e.g., C3H8O3 and CH2O2) with high signals in these 1448 compounds were not further analyzed because they are very volatile at room temperature (25 ∘C), and their thermograms cannot be characterized with clear Tmaxvalues from most filter samples. The molecular formula, molecular weight, Tmax, and C* calculated according to our calibration in Fig. 1 for the 91 CHO and 90 CHON species are summarized in Tables S1 and S2, respectively.
The thermal behaviors of these 181 organic compounds during the FIGAERO analysis are shown in Fig. 3. The cooler peak temperatures in double-peak thermograms mostly appeared in the green rectangular band of 45–80 ∘C, whereas the higher peak temperatures in double peaks are mainly the result of thermal decomposition of higher-molecular-weight organic compounds (Huang et al., 2018) and concentrated in the purple rectangular band of 100–125 ∘C, which is consistent with the result of Wang et al. (2016). On the other hand, the corresponding evaporation temperature for compounds with single-peak thermograms concentrated in the red rectangular band of 80–100 ∘C. Clearly, the compounds in Fig. 3 can be divided into two groups, as illustrated with the two dashed ellipses. For each group, the Tmax values of the single peaks and the cooler ones of double peaks increase with their corresponding molecular weight, which is consistent with the fact that similar compounds with larger molecular weight tend to possess lower volatility.
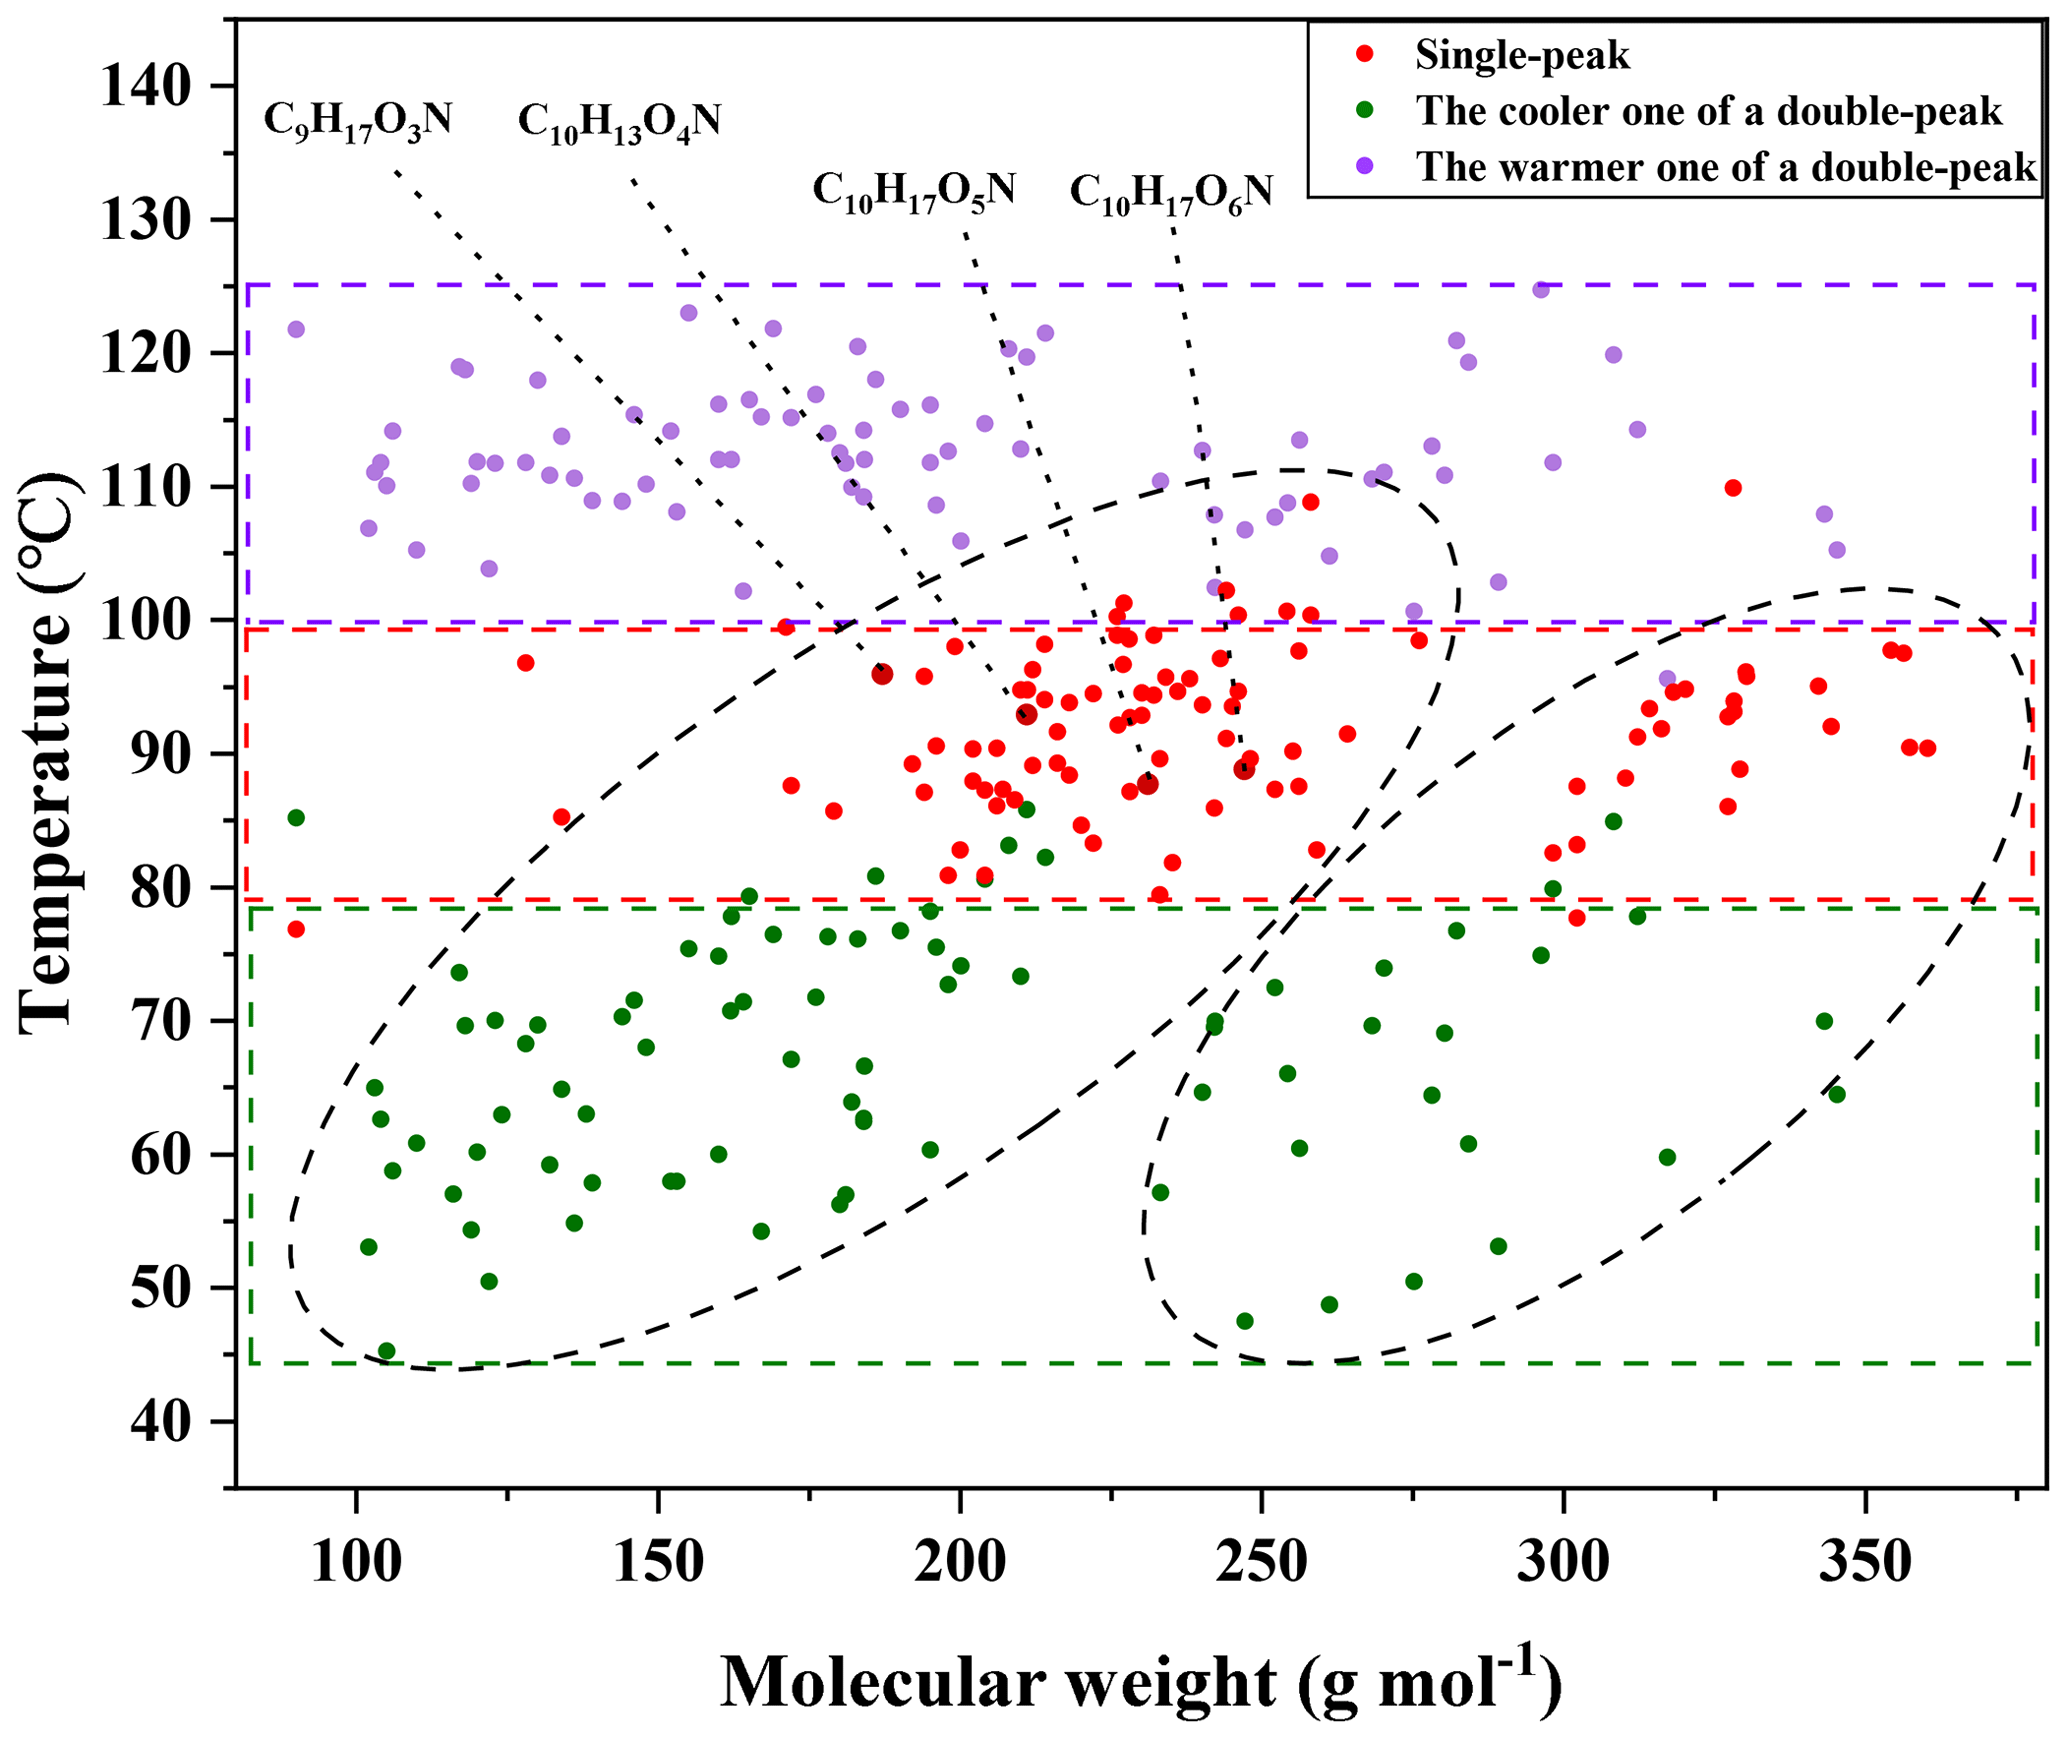
Figure 3Evaporation and decomposition of 91 CHO and 90 CHON compounds, of which the reagent ion (I−) is excluded from their formulae. The signal peaks, the cooler peaks, and the warmer peaks of double peaks are denoted by red, green, and purple circles, respectively. Rectangular bands depict the temperature zones in which peaks appear.
In Fig. 4, the Tmax of these 181 compounds (91 CHO and 90 CHON) is translated into C* values according to Eq. (3). Since most of the warmer peaks of double peaks could be from thermal decomposition, the Tmax values for the higher-temperature ones in double-peak thermograms of 78 compounds are not taken into account. Furthermore, thermal decomposition of the oligomers in organic aerosols can lead to a misinterpretation of the SOA volatility, and the double bond equivalent (DBE) has been used to determine the thermal decomposition degree of an individual compound and SOAs formed from the ozonolysis of α-pinene (Riva et al., 2019; Yang et al., 2021). The contents in Fig. 4 are further color-coded by DBE, instead of O : C, as shown in Fig. S11. In Fig. S11, the DBE distribution of these 181 compounds is random; thus the thermal decomposition could have a minor effect on Tmax. On the other hand, 33 out of the 103 unimodal compounds meet the screening criteria of Yang et al. (2021) for considerable thermal decomposition (DBE ≥ 2, Tmax≥72 ∘C and nO >4), and the unimodal thermograms of these 33 compounds generally do not present broad tailing and fronting, as shown in Fig. S9a and c. The possible thermal decomposition products of these 33 compounds are then investigated. Although thermal decomposition could be very complex, here we only considered dehydration products and decarboxylation products. C9H17O3N and C10H13O4N could be a decarboxylation product of C10H17O5N and a secondary dehydration product of C10H17O6N, respectively. Tmax of C9H17O3N is higher than that of C10H17O5N by about 8 ∘C, and Tmax of C10H13O4N is higher than that of C10H17O6N by about 4 ∘C, which are close to the results of Yang et al. (2021). However, this observation can also be explained by isomers with vastly different vapor pressures (Huang et al., 2018; Lopez-Hilfiker et al., 2015). For a quick identification of these compounds, C9H17O3N, C10H17O5N, C10H13O4N, and C10H17O6N have been marked in Fig. 3. Since only two compounds may be thermal decomposition fragments, thermal decomposition likely has little effect on our subsequent analysis. As shown in Fig. 4, the volatilities of CHO and CHON compounds both concentrate in the range of . In addition, CHO and CHON compounds are randomly distributed in two groups according to O C, and there is no obvious distinction. The species in the dashed red ellipse are the same as those in the left dashed ellipse in Fig. 3, and the compounds in the dashed blue ellipse are the same as those in the right dashed ellipse. The molecular weights of species in the two groups overlapped, although the ones in the dashed red ellipse are characterized by relatively lower molecular weights, and the ones in the dashed blue ellipse have relatively higher molecular weights. The O C ratios can clearly be distinguished for the two groups, 0.56 ± 0.35 (average ± 1 standard deviation) for the red ellipse group and 0.18 ± 0.08 for the blue ellipse group, indicating that the O C ratio of these compounds could be a key parameter.
Table 2The volatility parameterizations of this study and cited literature. In this study, the parameterizations of saturation mass concentration were modified by the least-squares optimization from Eq. (4) at 298 K.

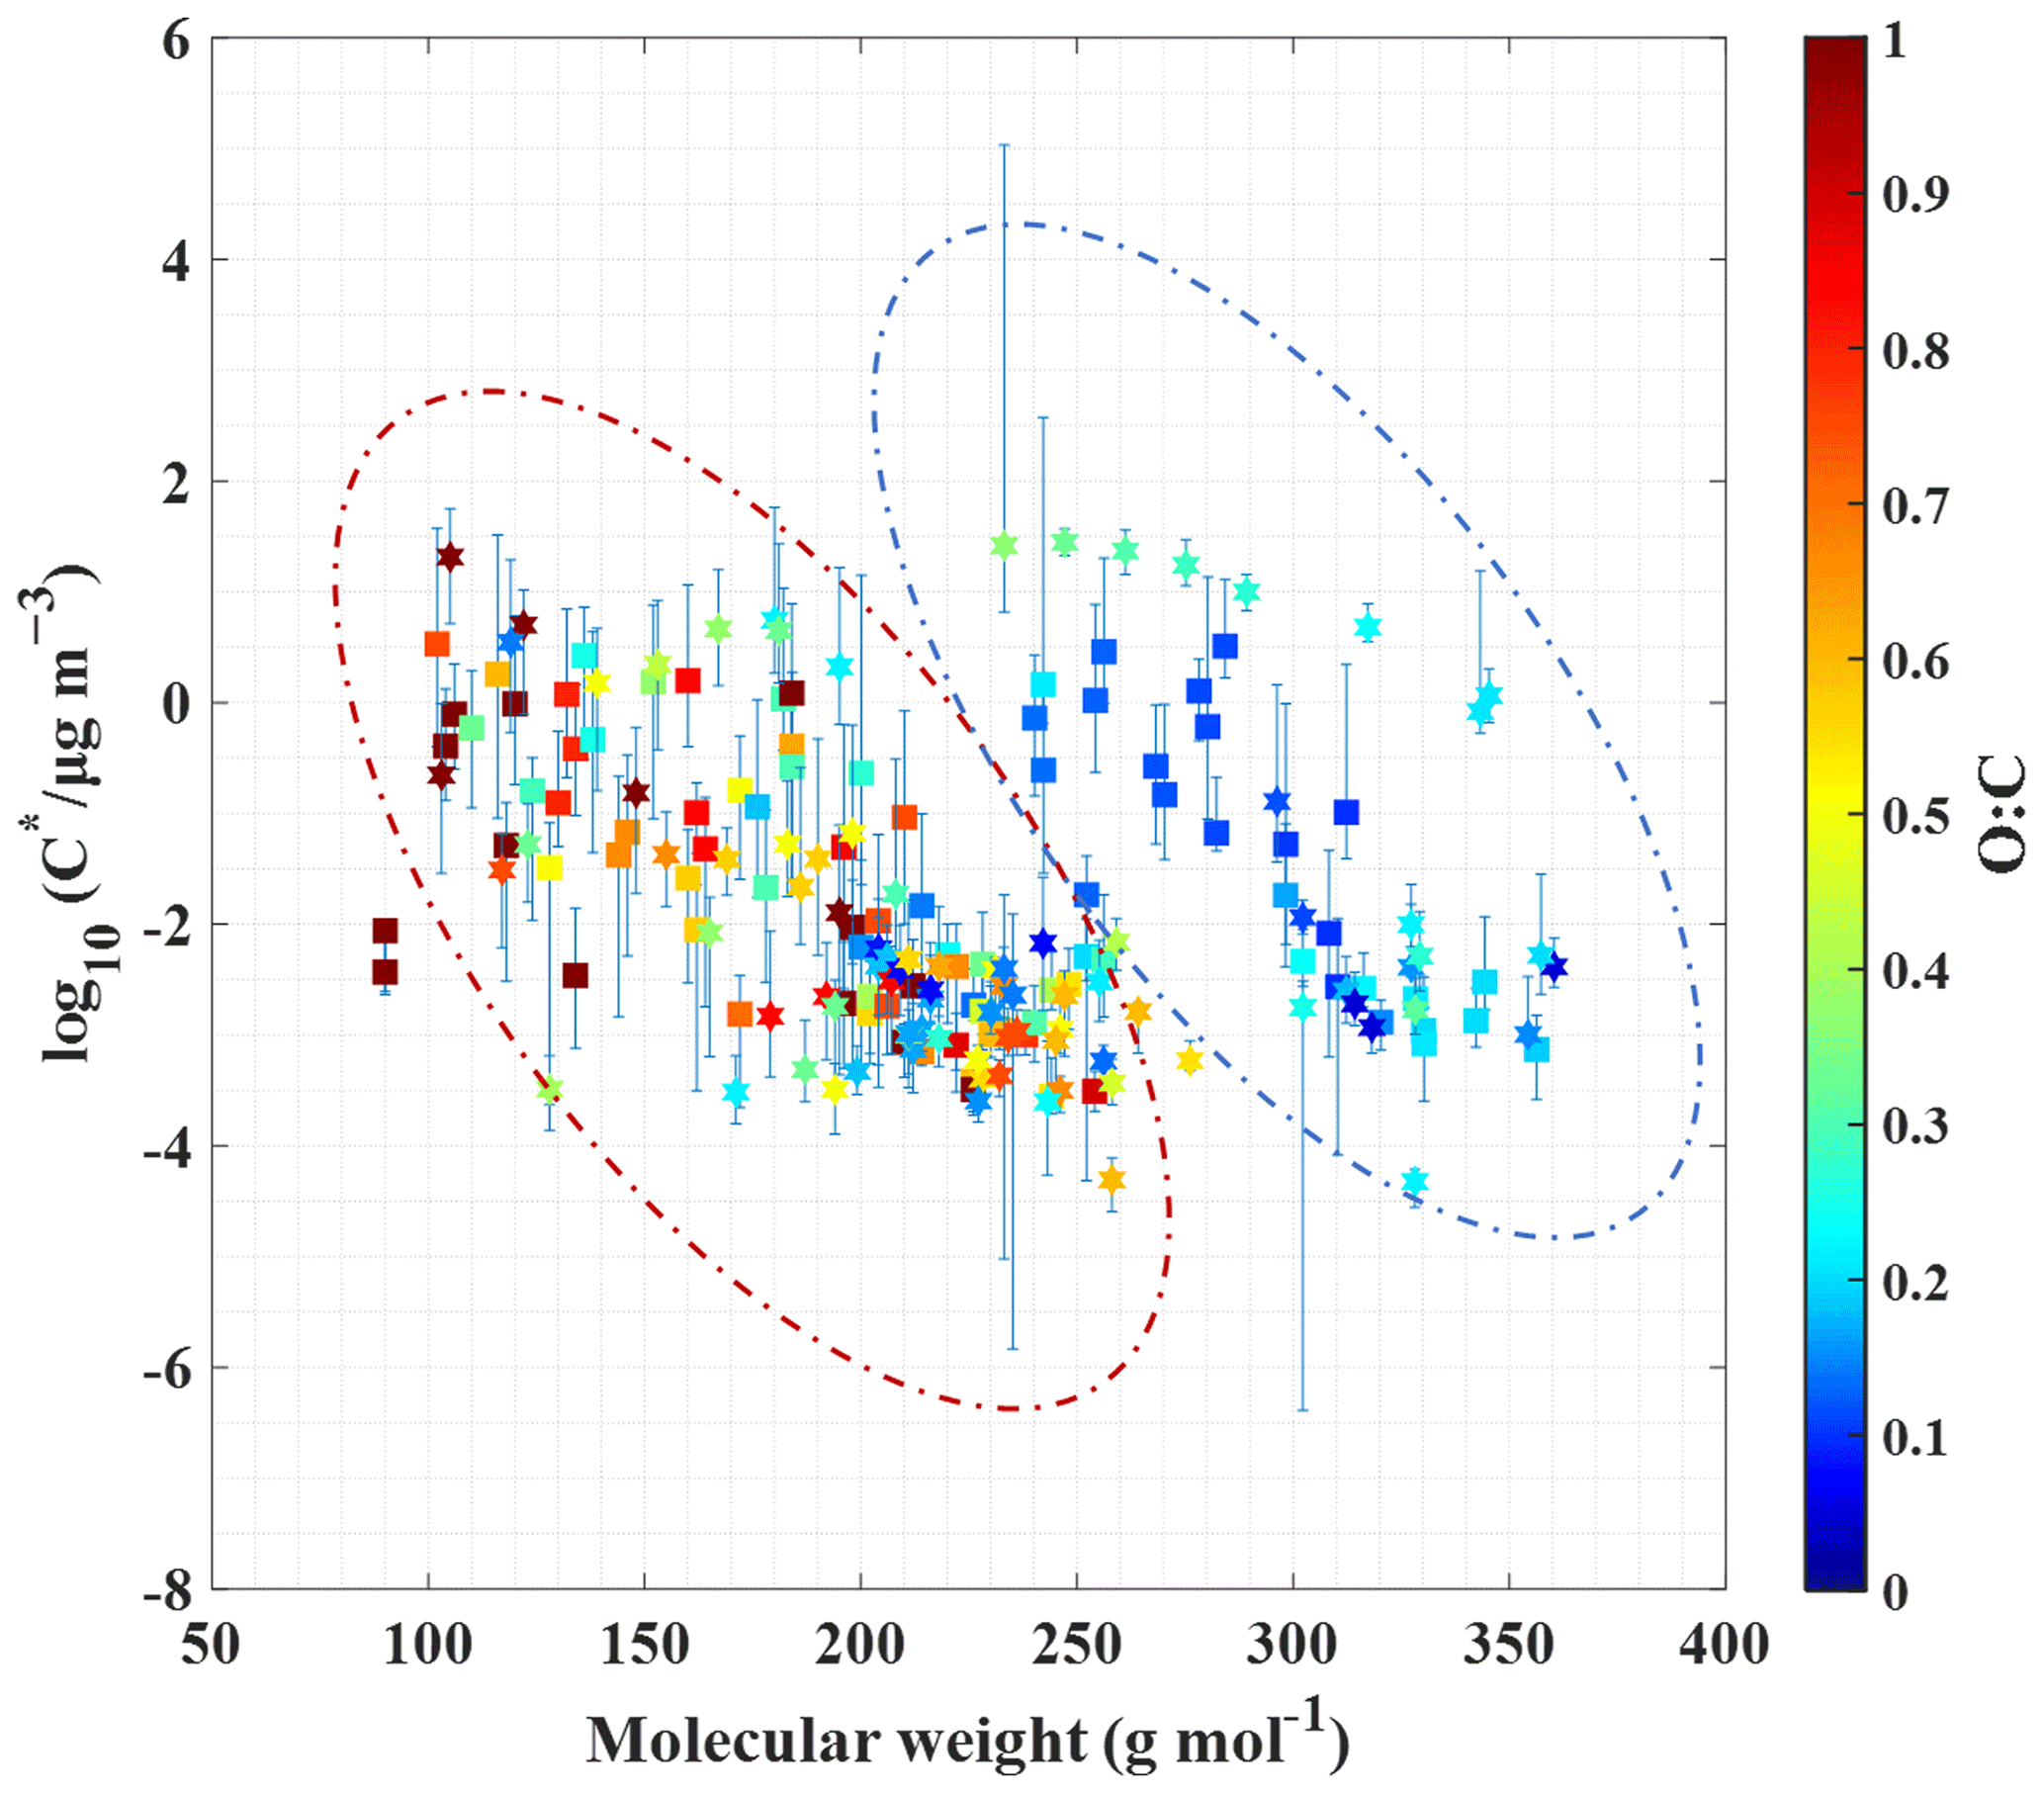
Figure 4Saturation mass concentration of CHO and CHON compounds against their molecular weights, as color-coded by the O C ratios. Note that compounds with an O C ratio equal to or greater than 1.0 are marked with the same color. The CHO and CHON compounds are denoted by squares and hexagrams, respectively. Whiskers denote 25th and 75th percentile values of measured saturation mass concentration from 30 ambient samples, and whiskers are ultimately due to variability in the measured Tmax of CHO and CHON compounds. Dashed ellipses group compounds on the basis of the O C range.
Figure S12 clearly shows the O C characteristics of compounds in the two regions, where the red triangles correspond to those in the dashed red ellipse of Fig. 4, and the blue circles correspond to those in the dashed blue ellipse. The O C ratios of organic compounds in the dashed red ellipse ranged from 0.25 to 1.0, and the O C ratios of those in the dashed blue ellipse varied between 0–0.25 (Fig. S12). C6H10O5 (levoglucosan or related isomers) in the dashed red ellipse is a well-accepted tracer of biomass burning OA (BBOA) (Gaston et al., 2016). C16H32O2 (palmitic acid), C17H34O2 (margaric acid), C18H32O2 (linoleic acid), and C18H34O2 (oleic acid) in the dashed blue ellipse have been previously identified as markers of cooking-influenced OA (COA) (Chow et al., 2007; Pei et al., 2016). The correlation coefficients (Pearson's r) between C6H10O5 and 92 % of compounds in the dashed red ellipse are from 0.64 to 0.98, and the correlation coefficients between C18H34O2 and 37 % of compounds in the dashed blue ellipse are from 0.60 to 0.74. We show examples of the correlation of C6H10O5, C18H32O2, and other compounds in Fig. S13. Indeed, there are a number of sources of COA and BBOA near the campaign site, and the campaign was carried out during the heating season. Hence, organic compounds in the dashed red ellipse may be mainly derived from BBOA, and those in the dashed blue ellipse may be partly derived from COA.
We thus separately optimized the correlation between the molecular elemental composition and the saturation mass concentration of organic compounds in these two regions in Fig. 4. As shown in Table 2, the parameterization of Eq. (4-1) is dedicated to compounds with O C ratios of 0.25–1, whereas Eq. (4-2) is more suitable for compounds with O C ratios of 0–0.25. Mohr et al. (2019) derived parameterization mainly based on HOMs () produced by α-pinene oxidation, whereas our fits are mainly based on semi-volatile organic compounds (SVOCs; ) and low-volatility organic compounds (LVOCs; ), which are predominantly in the particle phase in the atmosphere.
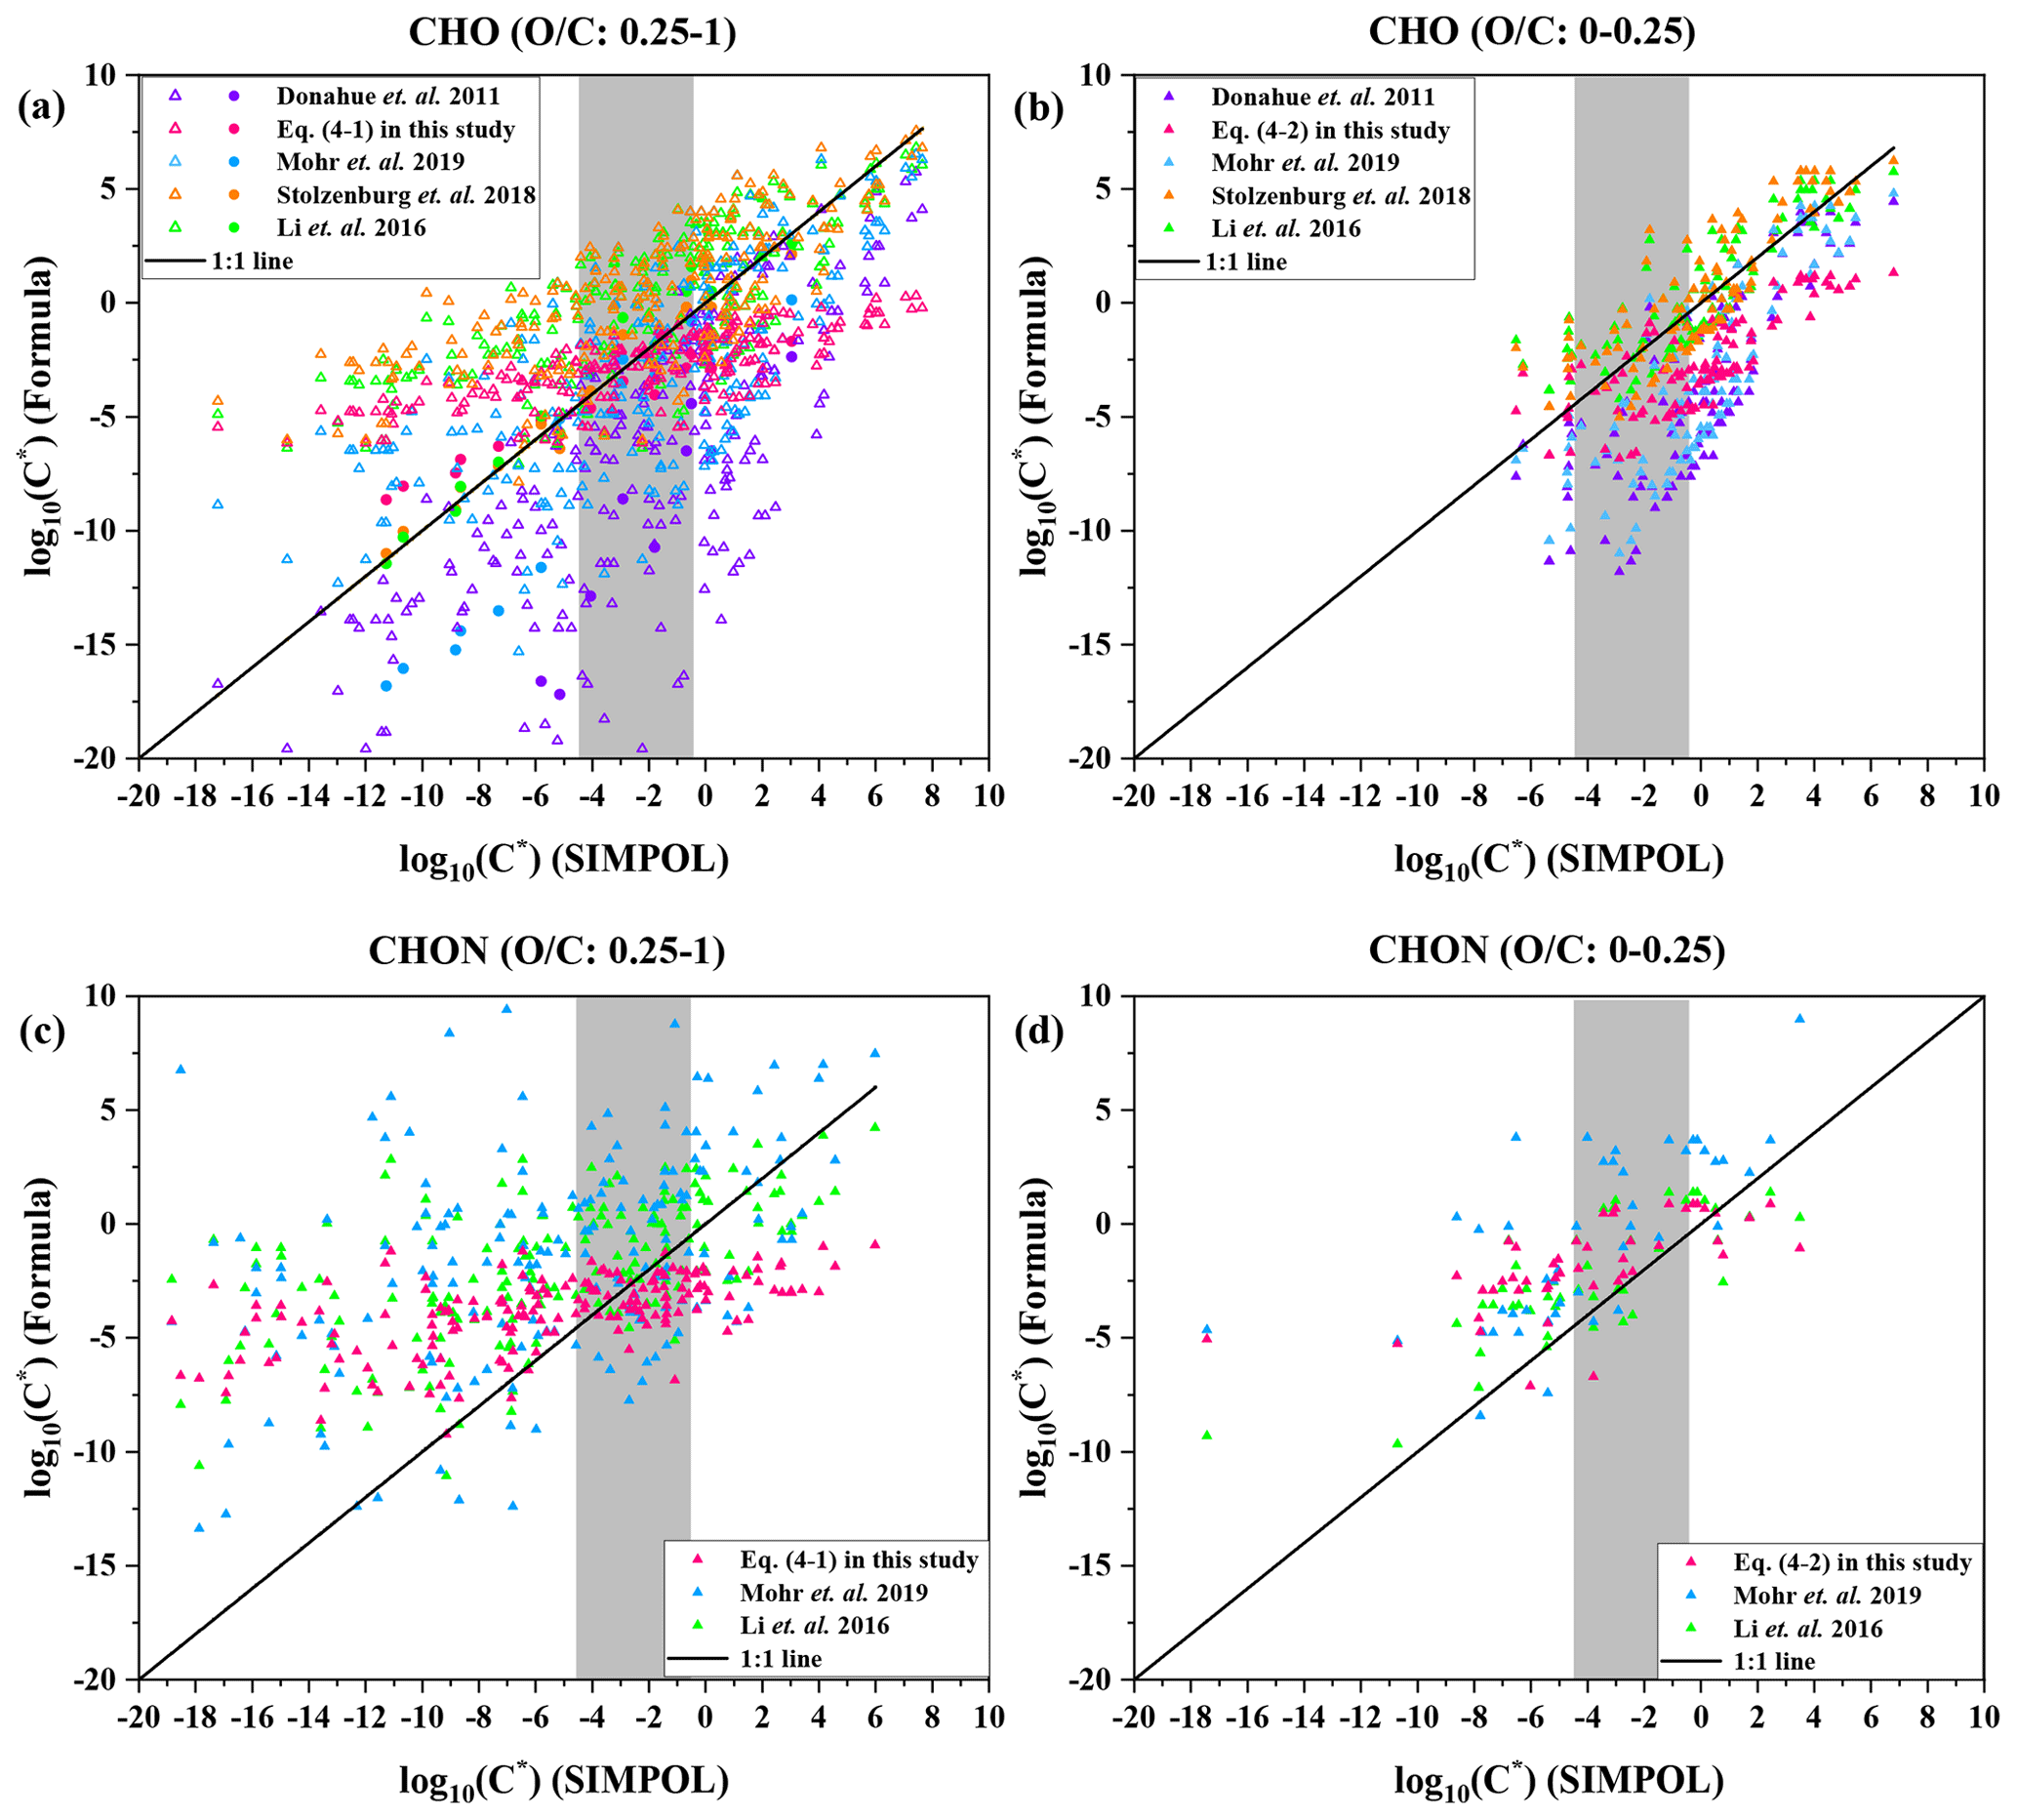
Figure 5Saturation mass concentration (C*) of 15 HOMs (O C: 0.25–1) and 230 CHO compounds (O C: 0.25–1) estimated by Eq. (4-1) (a), 106 CHO compounds (O C: 0-0.25) estimated by Eq. (4-2) (b), 183 CHON compounds (O C: 0.25–1) estimated by Eq. (4-1) (c), 46 CHON compounds (O C: 0–0.25) estimated by Eq. (4-2) (d), and the parametrizations from Donahue et al. (2011), Mohr et al. (2019), Stolzenburg et al. (2018), and Li et al. (2016), against C* estimated by SIMPOL. In (a), the 15 HOMs are denoted by circles, and 230 CHO compounds are denoted by triangles. The 230 CHO (O C: 0.25–1), 106 CHO (O C: 0–0.25), 183 CHON (O C: 0.25–1), and 46 CHON (O C: 0–0.25) compounds are from Zhao et al. (2013) and Mazzoleni et al. (2010) field campaigns. The grey colored band denotes low-volatility organic compounds (LVOCs).
For ambient studies, it is crucial to develop a more accurate empirical formula to estimate the volatility of organics in particles. Parametrization in Donahue et al. (2011) is mainly based on mono-functional compounds such as alcohol, aldehyde, and acid, etc. and could cause a large uncertainty when estimating the volatility of compounds in the range and because volatilities in this region are extrapolated with volatilities of compounds with simpler molecular formulae (Donahue et al., 2011). In addition, compounds in this region may be characterized with multiple functionalities, which lack reference standards in the Donahue et al. (2011) study. Compounds in this region can be roughly regarded as oxygenated organic aerosols (OOAs) (Donahue et al., 2011). In our study, a dashed yellow border is used to mark this region in Fig. S12, which is occupied by organic compounds that are concentrated in the dashed red ellipse of Fig. 4.
We used 15 highly oxygenated organic molecules (HOMs) with O C ratios of 0.25–1 and 230 CHO compounds with O C ratios of 0.25–1 as benchmarks to compare the performance of different parameterization methods, as shown in Fig. 5a. The volatilities of the 15 HOMs were obtained by SIMPOL from the Tröstl et al. (2016) study. The molecular formulae of 230 CHO (O C: 0.25–1) compounds are from Zhao et al. (2013) and Mazzoleni et al. (2010), and the molecular structures of these 230 compounds are predicted to be common; i.e., most of the function groups of their structures are included in SIMPOL, so that the volatilities of these compounds can be estimated by SIMPOL. As expected, volatilities predicted by the Donahue et al. (2011) parameterization are not completely consistent with those by SIMPOL. Although Mohr et al. (2019) and Stolzenburg et al. (2018) both updated parametrizations based on those 15 HOMs detected by Tröstl et al. (2016), compared to the Mohr et al. (2019) parameterization, the volatility predicted by the Stolzenburg et al. (2018) parameterization does match that by SIMPOL better, which could be attributed to the fact that Mohr et al. (2019) did not separately use parameters for dimers and monomers as Stolzenburg et al. (2018) did, so that the effect of the covalent binding is ignored. On the other hand, the accuracy in predication of volatility of the parameterizations of Stolzenburg et al. (2018), Li et al. (2016), and Eq. (4-1) is generally comparable (Fig. 5a). Compared to the parameterizations of Stolzenburg et al. (2018) and Li et al. (2016), the consistency between the parameterization of Eq. (4-1) and SIMPOL is not as good for the more volatile compounds (), but the consistency is better for the LVOCs (), which reflects the inherent strength and deficiency of the FIGAERO method; i.e., the FIGAERO method relies on authentic standards that are commonly LVOCs and is thus less suitable for the more volatile compounds. In this study, we used the saturation mass concentration (C*) of five organic standards concentrates in the range of , as shown in Fig. S14. Moreover, the parameterization of Eq. (4-1) was derived based on the ambient compounds in the dashed red ellipse of Fig. 4, whose volatilities predominantly concentrate in the range of .
Also, we selected 106 CHO compounds with O C ratios of 0–0.25 from compounds observed by Zhao et al. (2013) and Mazzoleni et al. (2010). The saturation mass concentration (C*) of these compounds is estimated by different parameterizations and SIMPOL. As shown in Fig. 5b, compared to parameterizations of Donahue et al. (2011) and Mohr et al. (2019), the parameterizations of Stolzenburg et al. (2018), Li et al. (2016), and Eq. (4-2) are more consistent with SIMPOL. This is mainly because the parameterization of Donahue et al. (2011) was developed according to higher-volatility organic compounds, whose volatilities concentrate in the range of , but those 106 CHO compounds selected have lower volatility and their volatilities concentrate in the range of . For the Mohr et al. (2019) parametrization, this could be explained by the fact that those 106 CHO compounds have a lower O C (0–0.25), but the O C of 15 HOMs used to update parametrization by Mohr et al. (2019) is 0.25–1. Compared to the parameterizations of Stolzenburg et al. (2018) and Li et al. (2016), in general, the Eq. (4-2) parameterization does not match SIMPOL as well. However, the parameterizations of Stolzenburg et al. (2018), Li et al. (2016), and Eq. (4-2) are comparable for LVOCs. This may again be explained by the difference between the C* of our organic standards in the literature and those calculated by SIMPOL and by the volatility distribution of organic standards (Fig. S14).
We selected 183 CHON compounds with O C ratios of 0.25–1 and 46 CHON compounds with O C ratios of 0–0.25 from Zhao et al. (2013) and Mazzoleni et al. (2010). The molecular structures of selected species are assumed to be common. Then their saturation mass concentration (C*) is estimated by different parameterizations and SIMPOL, respectively. The parameterizations of Donahue et al. (2011) and Stolzenburg et al. (2018) rely only on carbon and oxygen numbers and do not explicitly mention the nitrogen coefficient (bN); thus these two parameterizations are excluded from the comparison of the volatility of CHON compounds. As shown in Fig. 5c, the performance of Eq. (4-1) parameterization for CHON compounds (O C: 0.25–1) is similar to that for CHO compounds (O C: 0.25–1) (Fig. 5a). The volatilities LVOCs predicted by the Eq. (4-1) parameterization are more consistent with SIMPOL than the parameterizations of Li et al. (2016) and Mohr et al. (2019). In Fig. 5d, the volatilities of CHON compounds (O C: 0–0.25) predicted by the parameterizations of Li et al. (2016) and our study are comparable, and most of the data points are close to the 1:1 line.
Although the applicability of the parameterizations of Li et al. (2016) and Stolzenburg et al. (2018) is more extensive, and the volatilities estimated by these two parameterizations agree well with SIMPOL, Li et al. (2016) and Stolzenburg et al. (2018) modified parameterizations based on a large number of organic species from the NCI open database and SIMPOL calculations, respectively. However, the parameterizations of Eq. (4-1) and (4-2) were derived from organic compounds with different O C ratios in ambient particles, whose volatilities were estimated by the calibration experiments instead of SIMPOL. Therefore, Eq. (4-1) and (4-2) can better represent the volatility of ambient organic aerosols. In addition, in Fig. 5, for LVOCs, the volatility estimation by Eq. (4-1) and (4-2) is better than Li et al. (2016) and Stolzenburg et al. (2018). Compared with the extremely low-volatility organic compounds (ELVOCs), intermediate-volatility organic compounds (IVOCs), and semi-volatile organic compounds (SVOCs), the low-volatility organic compounds (LVOCs) have a dominant contribution to particle growth in new particle formation events. Hence, our parameterizations could be well applied to assess the condensational growth of newly formed particles.
In summary, our study developed empirical volatility-molecular formula functions (Eq. 4-1 and 4-2), based on measured C* of selected CHO and CHON compounds in ambient particles. The parameterizations of Eq. (4-1) and (4-2) can more accurately predict the volatility of LVOCs with higher O C (0.25–1) and lower O C (0–0.25) in the ambient organic aerosols, respectively, owing to the nature of the FIGAERO method. The comparison with previous empirical functions suggests that it is feasible to modify empirical functions based on atmospheric organic compounds with unknown structures and functional groups using calibration experiments. When analyzing the volatility of atmospheric organic aerosols, it is suggested to create the calibration curve from experiments with the same conditions as that of ambient samples because the addition of inorganic salts, mixing of organic compounds, mass loadings, and particle size distributions could together influence Tmax values of organic compounds. Furthermore, our results suggest that there should be specialized volatility parameterization for different O C compounds.
All data related to this article can be available upon request from the corresponding authors.
The supplement related to this article is available online at: https://doi.org/10.5194/acp-22-9283-2022-supplement.
LINWA designed the study. GY, YILI, and YILU conducted the field campaign. SR, YW, YULI, LIHWA, GY, and YILI carried out laboratory experiments. SR analyzed the data. SR, LINWA, and LY wrote the paper with contributions from all of the other co-authors.
The contact author has declared that none of the authors has any competing interests.
Publisher’s note: Copernicus Publications remains neutral with regard to jurisdictional claims in published maps and institutional affiliations.
This research has been supported by the National Natural Science Foundation of China (grant nos. 21925601, 92044301, 92143301, and 22127811).
This paper was edited by Nga Lee Ng and reviewed by four anonymous referees.
Bannan, T. J., Le Breton, M., Priestley, M., Worrall, S. D., Bacak, A., Marsden, N. A., Mehra, A., Hammes, J., Hallquist, M., Alfarra, M. R., Krieger, U. K., Reid, J. P., Jayne, J., Robinson, W., McFiggans, G., Coe, H., Percival, C. J., and Topping, D.: A method for extracting calibrated volatility information from the FIGAERO-HR-ToF-CIMS and its experimental application, Atmos. Meas. Tech., 12, 1429–1439, https://doi.org/10.5194/amt-12-1429-2019, 2019.
Bertram, T. H., Kimmel, J. R., Crisp, T. A., Ryder, O. S., Yatavelli, R. L. N., Thornton, J. A., Cubison, M. J., Gonin, M., and Worsnop, D. R.: A field-deployable, chemical ionization time-of-flight mass spectrometer, Atmos. Meas. Tech., 4, 1471–1479, https://doi.org/10.5194/amt-4-1471-2011, 2011.
Capouet, M. and Müller, J.-F.: A group contribution method for estimating the vapour pressures of α-pinene oxidation products, Atmos. Chem. Phys., 6, 1455–1467, https://doi.org/10.5194/acp-6-1455-2006, 2006.
Chow, J. C., Watson, J. G., Lowenthal, D. H., Chen, L. W. A., Zielinska, B., Mazzoleni, L. R., and Magliano, K. L.: Evaluation of organic markers for chemical mass balance source apportionment at the Fresno Supersite, Atmos. Chem. Phys., 7, 1741–1754, https://doi.org/10.5194/acp-7-1741-2007, 2007.
Donahue, N. M., Robinson, A. L., and Pandis, S. N.: Atmospheric organic particulate matter: From smoke to secondary organic aerosol, Atmos. Environ., 43, 94–106, https://doi.org/10.1016/j.atmosenv.2008.09.055, 2009.
Donahue, N. M., Epstein, S. A., Pandis, S. N., and Robinson, A. L.: A two-dimensional volatility basis set: 1. organic-aerosol mixing thermodynamics, Atmos. Chem. Phys., 11, 3303–3318, https://doi.org/10.5194/acp-11-3303-2011, 2011.
Drisdell, W. S., Saykally, R. J., and Cohen, R. C.: On the evaporation of ammonium sulfate solution, P. Natl. Acad. Sci. USA, 106, 18897–18901, https://doi.org/10.1073/pnas.0907988106, 2009.
Eichler, P., Müller, M., D'Anna, B., and Wisthaler, A.: A novel inlet system for online chemical analysis of semi-volatile submicron particulate matter, Atmos. Meas. Tech., 8, 1353–1360, https://doi.org/10.5194/amt-8-1353-2015, 2015.
Faulhaber, A. E., Thomas, B. M., Jimenez, J. L., Jayne, J. T., Worsnop, D. R., and Ziemann, P. J.: Characterization of a thermodenuder-particle beam mass spectrometer system for the study of organic aerosol volatility and composition, Atmos. Meas. Tech., 2, 15–31, https://doi.org/10.5194/amt-2-15-2009, 2009.
Gaston, C. J., Lopez-Hilfiker, F. D., Whybrew, L. E., Hadley, O., McNair, F., Gao, H., Jaffe, D. A., and Thornton, J. A.: Online molecular characterization of fine particulate matter in Port Angeles, WA: Evidence for a major impact from residential wood smoke, Atmos. Environ., 138, 99–107, https://doi.org/10.1016/j.atmosenv.2016.05.013, 2016.
Goodman, K. J. and Brenna, J. T.: Curve Fitting for Restoration of Accuracy for Overlapping Peaks in Gas Chromatography/Combustion Isotope Ratio Mass Spectrometry, Anal. Chem., 66, 1294–1301, https://doi.org/10.1021/ac00080a015, 1994.
Hu, X., Yang, G., Liu, Y., Lu, Y., Wang, Y., Chen, H., Chen, J., and Wang, L.: Atmospheric gaseous organic acids in winter in a rural site of the North China Plain, J. Environ. Sci., 113, 190–203, https://doi.org/10.1016/j.jes.2021.05.035, 2022.
Huang, W., Saathoff, H., Pajunoja, A., Shen, X., Naumann, K.-H., Wagner, R., Virtanen, A., Leisner, T., and Mohr, C.: α-Pinene secondary organic aerosol at low temperature: chemical composition and implications for particle viscosity, Atmos. Chem. Phys., 18, 2883–2898, https://doi.org/10.5194/acp-18-2883-2018, 2018.
Huang, W., Saathoff, H., Shen, X., Ramisetty, R., Leisner, T., and Mohr, C.: Seasonal characteristics of organic aerosol chemical composition and volatility in Stuttgart, Germany, Atmos. Chem. Phys., 19, 11687–11700, https://doi.org/10.5194/acp-19-11687-2019, 2019.
Isaacman-VanWertz, G. and Aumont, B.: Impact of organic molecular structure on the estimation of atmospherically relevant physicochemical parameters, Atmos. Chem. Phys., 21, 6541–6563, https://doi.org/10.5194/acp-21-6541-2021, 2021.
Jimenez, J. L., Canagaratna, M. R., Donahue, N. M., Prevot, A. S. H., Zhang, Q., Kroll, J. H., DeCarlo, P. F., Allan, J. D., Coe, H., Ng, N. L., Aiken, A. C., Docherty, K. S., Ulbrich, I. M., Grieshop, A. P., Robinson, A. L., Duplissy, J., Smith, J. D., Wilson, K. R., Lanz, V. A., Hueglin, C., Sun, Y. L., Tian, J., Laaksonen, A., Raatikainen, T., Rautiainen, J., Vaattovaara, P., Ehn, M., Kulmala, M., Tomlinson, J. M., Collins, D. R., Cubison, M. J., Dunlea, E. J., Huffman, J. A., Onasch, T. B., Alfarra, M. R., Williams, P. I., Bower, K., Kondo, Y., Schneider, J., Drewnick, F., Borrmann, S., Weimer, S., Demerjian, K., Salcedo, D., Cottrell, L., Griffin, R., Takami, A., Miyoshi, T., Hatakeyama, S., Shimono, A., Sun, J. Y., Zhang, Y. M., Dzepina, K., Kimmel, J. R., Sueper, D., Jayne, J. T., Herndon, S. C., Trimborn, A. M., Williams, L. R., Wood, E. C., Middlebrook, A. M., Kolb, C. E., Baltensperger, U., and Worsnop, D. R.: Evolution of organic aerosols in the atmosphere, Science, 326, 1525–1529, https://doi.org/10.1126/science.1180353, 2009.
Lee, B. H., Lopez-Hilfiker, F. D., Mohr, C., Kurtén, T., Worsnop, D. R., and Thornton, J. A.: An iodide-adduct high-resolution time-of-flight chemical-ionization mass spectrometer: Application to atmospheric inorganic and organic compounds, Environ. Sci. Technol., 48, 6309–6317, https://doi.org/10.1021/es500362a, 2014.
Li, H., Zhang, Q., Zhang, Q., Chen, C., Wang, L., Wei, Z., Zhou, S., Parworth, C., Zheng, B., Canonaco, F., Prévôt, A. S. H., Chen, P., Zhang, H., Wallington, T. J., and He, K.: Wintertime aerosol chemistry and haze evolution in an extremely polluted city of the North China Plain: significant contribution from coal and biomass combustion, Atmos. Chem. Phys., 17, 4751–4768, https://doi.org/10.5194/acp-17-4751-2017, 2017.
Li, Y., Pöschl, U., and Shiraiwa, M.: Molecular corridors and parameterizations of volatility in the chemical evolution of organic aerosols, Atmos. Chem. Phys., 16, 3327–3344, https://doi.org/10.5194/acp-16-3327-2016, 2016.
Lopez-Hilfiker, F. D., Mohr, C., Ehn, M., Rubach, F., Kleist, E., Wildt, J., Mentel, Th. F., Lutz, A., Hallquist, M., Worsnop, D., and Thornton, J. A.: A novel method for online analysis of gas and particle composition: description and evaluation of a Filter Inlet for Gases and AEROsols (FIGAERO), Atmos. Meas. Tech., 7, 983–1001, https://doi.org/10.5194/amt-7-983-2014, 2014.
Lopez-Hilfiker, F. D., Mohr, C., Ehn, M., Rubach, F., Kleist, E., Wildt, J., Mentel, Th. F., Carrasquillo, A. J., Daumit, K. E., Hunter, J. F., Kroll, J. H., Worsnop, D. R., and Thornton, J. A.: Phase partitioning and volatility of secondary organic aerosol components formed from α-pinene ozonolysis and OH oxidation: the importance of accretion products and other low volatility compounds, Atmos. Chem. Phys., 15, 7765–7776, https://doi.org/10.5194/acp-15-7765-2015, 2015.
Lopez-Hilfiker, F. D., Mohr, C., D'Ambro, E. L., Lutz, A., Riedel, T. P., Gaston, C. J., Iyer, S., Zhang, Z., Gold, A., Surratt, J. D., Lee, B. H., Kurten, T., Hu, W. W., Jimenez, J., Hallquist, M., and Thornton, J. A.: Molecular Composition and Volatility of Organic Aerosol in the Southeastern U.S.: Implications for IEPOX Derived SOA, Environ. Sci. Technol., 50, 2200–2209, https://doi.org/10.1021/acs.est.5b04769, 2016.
Mazzoleni, L. R., Ehrmann, B. M., Shen, X., Marshall, A. G., and Collett, J. L.: Water-Soluble Atmospheric Organic Matter in Fog: Exact Masses and Chemical Formula Identification by Ultrahigh-Resolution Fourier Transform Ion Cyclotron Resonance Mass Spectrometry, Environ. Sci. Technol., 44, 3690–3697, https://doi.org/10.1021/es903409k, 2010.
Mohr, C., Thornton, J. A., Heitto, A., Lopez-Hilfiker, F. D., Lutz, A., Riipinen, I., Hong, J., Donahue, N. M., Hallquist, M., Petäjä, T., Kulmala, M., and Yli-Juuti, T.: Molecular identification of organic vapors driving atmospheric nanoparticle growth, Nat. Commun., 10, 1–7, https://doi.org/10.1038/s41467-019-12473-2, 2019.
Nah, T., Xu, L., Osborne-Benthaus, K. A., White, S. M., France, S., and Ng, N. L.: Mixing order of sulfate aerosols and isoprene epoxydiols affects secondary organic aerosol formation in chamber experiments, Atmos. Environ., 217, 116953, https://doi.org/10.1016/j.atmosenv.2019.116953, 2019.
Pankow, J. F. and Asher, W. E.: SIMPOL.1: a simple group contribution method for predicting vapor pressures and enthalpies of vaporization of multifunctional organic compounds, Atmos. Chem. Phys., 8, 2773–2796, https://doi.org/10.5194/acp-8-2773-2008, 2008.
Pei, B., Cui, H., Liu, H., and Yan, N.: Chemical characteristics of fine particulate matter emitted from commercial cooking, Front. Environ. Sci. Eng., 10, 559–568, https://doi.org/10.1007/s11783-016-0829-y, 2016.
Pöschl, U.: Atmospheric aerosols: Composition, transformation, climate and health effects, Angew. Chemie – Int. Ed., 44, 7520–7540, https://doi.org/10.1002/anie.200501122, 2005.
Riva, M., Heikkinen, L., Bell, D. M., Peräkylä, O., Zha, Q., Schallhart, S., Rissanen, M. P., Imre, D., Petäjä, T., Thornton, J. A., Zelenyuk, A., and Ehn, M.: Chemical transformations in monoterpene-derived organic aerosol enhanced by inorganic composition, npj Clim. Atmos. Sci., 2, 1–9, https://doi.org/10.1038/s41612-018-0058-0, 2019.
Shiraiwa, M. and Seinfeld, J. H.: Equilibration timescale of atmospheric secondary organic aerosol partitioning, Geophys. Res. Lett., 39, 2012GL054008, https://doi.org/10.1029/2012GL054008, 2012.
Smith, J. N., Moore, K. F., McMurry, P. H., and Eisele, F. L.: Atmospheric Measurements of Sub-20 nm Diameter Particle Chemical Composition by Thermal Desorption Chemical Ionization Mass Spectrometry, Aerosol Sci. Tech., 38, 100–110, https://doi.org/10.1080/02786820490249036, 2004.
Stark, H., Yatavelli, R. L. N., Thompson, S. L., Kang, H., Krechmer, J. E., Kimmel, J. R., Palm, B. B., Hu, W., Hayes, P. L., Day, D. A., Campuzano-Jost, P., Canagaratna, M. R., Jayne, J. T., Worsnop, D. R., and Jimenez, J. L.: Impact of Thermal Decomposition on Thermal Desorption Instruments: Advantage of Thermogram Analysis for Quantifying Volatility Distributions of Organic Species, Environ. Sci. Technol., 51, 8491–8500, https://doi.org/10.1021/acs.est.7b00160, 2017.
Stolzenburg, D., Fischer, L., Vogel, A. L., Heinritzi, M., Schervish, M., Simon, M., Wagner, A. C., Dada, L., Ahonen, L. R., Amorim, A., Baccarini, A., Bauer, P. S., Baumgartner, B., Bergen, A., Bianchi, F., Breitenlechner, M., Brilke, S., Mazon, S. B., Chen, D., Dias, A., Draper, D. C., Duplissy, J., Haddad, I. El, Finkenzeller, H., Frege, C., Fuchs, C., Garmash, O., Gordon, H., He, X., Helm, J., Hofbauer, V., Hoyle, C. R., Kim, C., Kirkby, J., Kontkanen, J., Kürten, A., Lampilahti, J., Lawler, M., Lehtipalo, K., Leiminger, M., Mai, H., Mathot, S., Mentler, B., Molteni, U., Nie, W., Nieminen, T., Nowak, J. B., Ojdanic, A., Onnela, A., Passananti, M., Petäjä, T., Quéléver, L. L. J., Rissanen, M. P., Sarnela, N., Schallhart, S., Tauber, C., Tomé, A., Wagner, R., Wang, M., Weitz, L., Wimmer, D., Xiao, M., Yan, C., Ye, P., Zha, Q., Baltensperger, U., Curtius, J., Dommen, J., Flagan, R. C., Kulmala, M., Smith, J. N., Worsnop, D. R., Hansel, A., Donahue, N. M., and Winkler, P. M.: Rapid growth of organic aerosol nanoparticles over a wide tropospheric temperature range, P. Natl. Acad. Sci. USA, 115, 9122–9127, https://doi.org/10.1073/pnas.1807604115, 2018.
Thornton, J. A., Mohr, C., Schobesberger, S., D'Ambro, E. L., Lee, B. H., and Lopez-Hilfiker, F. D.: Evaluating Organic Aerosol Sources and Evolution with a Combined Molecular Composition and Volatility Framework Using the Filter Inlet for Gases and Aerosols (FIGAERO), Acc. Chem. Res., 53, 1415–1426, https://doi.org/10.1021/acs.accounts.0c00259, 2020.
Tröstl, J., Chuang, W. K., Gordon, H., Heinritzi, M., Yan, C., Molteni, U., Ahlm, L., Frege, C., Bianchi, F., Wagner, R., Simon, M., Lehtipalo, K., Williamson, C., Craven, J. S., Duplissy, J., Adamov, A., Almeida, J., Bernhammer, A. K., Breitenlechner, M., Brilke, S., Dias, A., Ehrhart, S., Flagan, R. C., Franchin, A., Fuchs, C., Guida, R., Gysel, M., Hansel, A., Hoyle, C. R., Jokinen, T., Junninen, H., Kangasluoma, J., Keskinen, H., Kim, J., Krapf, M., Kürten, A., Laaksonen, A., Lawler, M., Leiminger, M., Mathot, S., Möhler, O., Nieminen, T., Onnela, A., Petäjä, T., Piel, F. M., Miettinen, P., Rissanen, M. P., Rondo, L., Sarnela, N., Schobesberger, S., Sengupta, K., Sipilä, M., Smith, J. N., Steiner, G., Tomè, A., Virtanen, A., Wagner, A. C., Weingartner, E., Wimmer, D., Winkler, P. M., Ye, P., Carslaw, K. S., Curtius, J., Dommen, J., Kirkby, J., Kulmala, M., Riipinen, I., Worsnop, D. R., Donahue, N. M., and Baltensperger, U.: The role of low-volatility organic compounds in initial particle growth in the atmosphere, Nature, 533, 527–531, https://doi.org/10.1038/nature18271, 2016.
Wang, D. S. and Hildebrandt Ruiz, L.: Chlorine-initiated oxidation of n-alkanes under high-NOx conditions: insights into secondary organic aerosol composition and volatility using a FIGAERO–CIMS, Atmos. Chem. Phys., 18, 15535–15553, https://doi.org/10.5194/acp-18-15535-2018, 2018.
Wang, M., Yao, L., Zheng, J., Wang, X., Chen, J., Yang, X., Worsnop, D. R., Donahue, N. M., and Wang, L.: Reactions of Atmospheric Particulate Stabilized Criegee Intermediates Lead to High-Molecular-Weight Aerosol Components, Environ. Sci. Technol., 50, 5702–5710, https://doi.org/10.1021/acs.est.6b02114, 2016.
Wang, M., Chen, D., Xiao, M., Ye, Q., Stolzenburg, D., Hofbauer, V., Ye, P., Vogel, A. L., Mauldin, R. L., Amorim, A., Baccarini, A., Baumgartner, B., Brilke, S., Dada, L., Dias, A., Duplissy, J., Finkenzeller, H., Garmash, O., He, X. C., Hoyle, C. R., Kim, C., Kvashnin, A., Lehtipalo, K., Fischer, L., Molteni, U., Petäjä, T., Pospisilova, V., Quéléver, L. L. J., Rissanen, M., Simon, M., Tauber, C., Tomé, A., Wagner, A. C., Weitz, L., Volkamer, R., Winkler, P. M., Kirkby, J., Worsnop, D. R., Kulmala, M., Baltensperger, U., Dommen, J., El-Haddad, I., and Donahue, N. M.: Photo-oxidation of Aromatic Hydrocarbons Produces Low-Volatility Organic Compounds, Environ. Sci. Technol., 54, 7911–7921, https://doi.org/10.1021/acs.est.0c02100, 2020.
Wang, Y., Yang, G., Lu, Y., Liu, Y., Chen, J., and Wang, L.: Detection of gaseous dimethylamine using vocus proton-transfer-reaction time-of-flight mass spectrometry, Atmos. Environ., 243, 117875, https://doi.org/10.1016/j.atmosenv.2020.117875, 2020.
Xu, W., Chen, C., Qiu, Y., Li, Y., Zhang, Z., Karnezi, E., Pandis, S. N., Xie, C., Li, Z., Sun, J., Ma, N., Xu, W., Fu, P., Wang, Z., Zhu, J., Worsnop, D. R., Ng, N. L., and Sun, Y.: Organic aerosol volatility and viscosity in the North China Plain: contrast between summer and winter, Atmos. Chem. Phys., 21, 5463–5476, https://doi.org/10.5194/acp-21-5463-2021, 2021.
Yang, L. H., Takeuchi, M., Chen, Y., and Ng, N. L.: Characterization of thermal decomposition of oxygenated organic compounds in FIGAERO-CIMS, Aerosol Sci. Technol., 55, 1321–1342, https://doi.org/10.1080/02786826.2021.1945529, 2021.
Yatavelli, R. L. N. and Thornton, J. A.: Particulate Organic Matter Detection Using a Micro-Orifice Volatilization Impactor Coupled to a Chemical Ionization Mass Spectrometer (MOVI-CIMS), Aerosol Sci. Technol., 44, 61–74, https://doi.org/10.1080/02786820903380233, 2010.
Ye, C., Yuan, B., Lin, Y., Wang, Z., Hu, W., Li, T., Chen, W., Wu, C., Wang, C., Huang, S., Qi, J., Wang, B., Wang, C., Song, W., Wang, X., Zheng, E., Krechmer, J. E., Ye, P., Zhang, Z., Wang, X., Worsnop, D. R., and Shao, M.: Chemical characterization of oxygenated organic compounds in the gas phase and particle phase using iodide CIMS with FIGAERO in urban air, Atmos. Chem. Phys., 21, 8455–8478, https://doi.org/10.5194/acp-21-8455-2021, 2021.
Ye, Q., Wang, M., Hofbauer, V., Stolzenburg, D., Chen, D., Schervish, M., Vogel, A., Mauldin, R. L., Baalbaki, R., Brilke, S., Dada, L., Dias, A., Duplissy, J., El Haddad, I., Finkenzeller, H., Fischer, L., He, X., Kim, C., Kürten, A., Lamkaddam, H., Lee, C. P., Lehtipalo, K., Leiminger, M., Manninen, H. E., Marten, R., Mentler, B., Partoll, E., Petäjä, T., Rissanen, M., Schobesberger, S., Schuchmann, S., Simon, M., Tham, Y. J., Vazquez-Pufleau, M., Wagner, A. C., Wang, Y., Wu, Y., Xiao, M., Baltensperger, U., Curtius, J., Flagan, R., Kirkby, J., Kulmala, M., Volkamer, R., Winkler, P. M., Worsnop, D., and Donahue, N. M.: Molecular Composition and Volatility of Nucleated Particles from α-Pinene Oxidation between −50 ∘C and +25 ∘C, Environ. Sci. Technol., 53, 12357–12365, https://doi.org/10.1021/acs.est.9b03265, 2019.
Ylisirniö, A., Buchholz, A., Mohr, C., Li, Z., Barreira, L., Lambe, A., Faiola, C., Kari, E., Yli-Juuti, T., Nizkorodov, S. A., Worsnop, D. R., Virtanen, A., and Schobesberger, S.: Composition and volatility of secondary organic aerosol (SOA) formed from oxidation of real tree emissions compared to simplified volatile organic compound (VOC) systems, Atmos. Chem. Phys., 20, 5629–5644, https://doi.org/10.5194/acp-20-5629-2020, 2020.
Ylisirniö, A., Barreira, L. M. F., Pullinen, I., Buchholz, A., Jayne, J., Krechmer, J. E., Worsnop, D. R., Virtanen, A., and Schobesberger, S.: On the calibration of FIGAERO-ToF-CIMS: importance and impact of calibrant delivery for the particle-phase calibration, Atmos. Meas. Tech., 14, 355–367, https://doi.org/10.5194/amt-14-355-2021, 2021.
Zhang, B., Hu, X., Yao, L., Wang, M., Yang, G., Lu, Y., Liu, Y., and Wang, L.: Hydroxyl radical-initiated aging of particulate squalane, Atmos. Environ., 237, 117663, https://doi.org/10.1016/j.atmosenv.2020.117663, 2020.
Zhao, Y., Hallar, A. G., and Mazzoleni, L. R.: Atmospheric organic matter in clouds: exact masses and molecular formula identification using ultrahigh-resolution FT-ICR mass spectrometry, Atmos. Chem. Phys., 13, 12343–12362, https://doi.org/10.5194/acp-13-12343-2013, 2013.
Zhou, W., Xu, W., Kim, H., Zhang, Q., Fu, P., Worsnop, D. R., and Sun, Y.: A review of aerosol chemistry in Asia: Insights from aerosol mass spectrometer measurements, Environ. Sci. Process. Impacts, 22, 1616–1653, https://doi.org/10.1039/d0em00212g, 2020.