the Creative Commons Attribution 4.0 License.
the Creative Commons Attribution 4.0 License.
 | 18 Jul 2022
Light absorption by brown carbon over the South-East Atlantic Ocean
Michal Segal-Rozenhaimer
Haochi Che
Caroline Dang
Arthur J. Sedlacek III
Ernie R. Lewis
Amie Dobracki
Jenny P. S. Wong
Paola Formenti
Steven G. Howell
Athanasios Nenes
Biomass burning emissions often contain brown carbon (BrC), which represents a large family of light-absorbing organics that are chemically complex, thus making it difficult to estimate their absorption of incoming solar radiation, resulting in large uncertainties in the estimation of the global direct radiative effect of aerosols. Here we investigate the contribution of BrC to the total light absorption of biomass burning aerosols over the South-East Atlantic Ocean with different optical models, utilizing a suite of airborne measurements from the ORACLES 2018 campaign. An effective refractive index of black carbon (BC), , that characterizes the absorptivity of all absorbing components at 660 nm wavelength was introduced to facilitate the attribution of absorption at shorter wavelengths, i.e. 470 nm. Most values of the imaginary part of the effective refractive index, keBC, were larger than those commonly used for BC from biomass burning emissions, suggesting contributions from absorbers besides BC at 660 nm. The TEM-EDX single-particle analysis further suggests that these long-wavelength absorbers might include iron oxides, as iron is found to be present only when large values of keBC are derived. Using this effective BC refractive index, we find that the contribution of BrC to the total absorption at 470 nm (RBrC,470) ranges from ∼8 %–22 %, with the organic aerosol mass absorption coefficient (MACOA,470) at this wavelength ranging from 0.30±0.27 to 0.68±0.08 m2 g−1. The core–shell model yielded much higher estimates of MACOA,470 and RBrC,470 than homogeneous mixing models, underscoring the importance of model treatment. Absorption attribution using the Bruggeman mixing Mie model suggests a minor BrC contribution of 4 % at 530 nm, while its removal would triple the BrC contribution to the total absorption at 470 nm obtained using the AAE (absorption Ångström exponent) attribution method. Thus, it is recommended that the application of any optical properties-based attribution method use absorption coefficients at the longest possible wavelength to minimize the influence of BrC and to account for potential contributions from other absorbing materials.
- Article
(3990 KB) - Full-text XML
-
Supplement
(579 KB) - BibTeX
- EndNote


Black carbon (BC) and brown carbon (BrC) are the two main light-absorbing carbonaceous aerosols that play a significant role in Earth's radiative forcing and climate (Bond et al., 2013; Laskin et al., 2015; Brown et al., 2018). BC is the principal atmospheric particulate absorber and absorbs strongly over the entire solar spectrum (Bond and Bergstrom, 2006). Biomass burning (BB) contributes approximately of the global primary organic aerosol (OA) budget, which is currently treated in most climate models as “white carbon” that only scatters and does not absorb light (Bond et al., 2013). However, studies show that BB OA contains a substantial amount of BrC, which predominantly absorbs at short visible and near-UV wavelengths (Chen and Bond, 2010; Lack et al., 2012; Saleh et al., 2014; Taylor et al., 2020). Feng et al. (2013) found that the absorption of BrC can shift BB direct radiative forcing to positive values. The contribution of BrC to the total absorption by carbonaceous aerosols is estimated to be ∼20 %–50 %, with a global radiative effect of ∼0.03–0.6 W m−2 (Kirchstetter and Thatcher, 2012; Wang et al., 2013; Feng et al., 2013; Saleh et al., 2015; Jo et al., 2016). However, values reported by these studies are subject to substantial uncertainties, and investigations of BrC properties are still very much in a developmental stage (Szopa et al., 2021). Thus, to realize a substantive reduction in the uncertainty, a better attribution of BrC light absorption is required.
Several methods have been employed to investigate the light absorption of BrC. The AAE (absorption Ångström exponent) attribution method utilizes the different spectral dependences of the absorption by BC and BrC to determine the contribution from BrC at short wavelengths (Lack and Langridge, 2013; J. Wang et al., 2018; Taylor et al., 2020). Most earlier studies assumed the AAE of BC (AAEBC) to be unity, although this assumption may introduce large uncertainties (Lack and Langridge, 2013) because AAEBC varies with size, mixing state, and wavelength (Lack and Cappa, 2010; Fig. 2 in Liu et al., 2015, 2018). Revised methods with more realistic values of AAEBC have been proposed, such as using the AAE from two long-visible wavelengths (Taylor et al., 2020) or that from the Mie model (J. Wang et al., 2018). A major drawback of these methods is that they are suitable only for mixtures of BC and BrC, and if other absorbing materials are present, such as dusts, more information is needed to account for their contribution to light absorption at longer wavelengths. Another methodology involves measuring the absorption of organics that have been extracted with either an organic solvent or water and represents, thus far the only way to directly measure BrC absorption (Wong et al., 2019). The drawback to this approach is that not all organics can be extracted with one or two solvents, as highlighted by the work of Chen and Bond (2010), who reported extraction efficiencies of ∼70 % in water and ∼90 % in methanol. This inability to extract all organics means that insoluble organic substances remain unknown since they are not measured. This, in turn, could lead to cases where the absorption properties of the extracted organics might be different from those derived from in situ measurements. In addition, this method is carried out offline and requires elaborate laboratory analysis. Still another approach to estimate the absorption of BrC is through optical closure, which determines the BrC absorption as the difference of the total measured absorption and that of BC calculated using Mie theory (Saleh et al., 2014; Liu et al., 2015). In this approach, the accuracy of BrC absorption relies heavily on the accuracy of BC absorption calculation. Values commonly used for the refractive index of BC (mBC) from BB emissions in these calculations have ranged from 1.5+0.3i to 1.95+0.79i (Liu et al., 2015; Chylek et al., 2019; Taylor et al., 2020; Kahnert and Kanngießer, 2020), which will lead to large differences in BC absorption simulation results (Taylor et al., 2020). To date there is no consensus on the best value of mBC. Another factor influencing the BC absorption calculation, and hence the estimated BrC absorption, is the mixing state of BC and non-BC components within particles. Liu et al. (2015) used the core–shell (CS) Mie model and Rayleigh–Debye–Gans approximation to investigate the effect of BC microphysics on the estimation of BrC absorption and found it to be highly sensitive to the model treatment. Saleh et al. (2014) compared internal and external mixtures of BC and BrC and found internally mixed cases yielded smaller BrC absorption than externally mixed ones. Similar to the AAE attribution method, the presence of absorbing materials other than BC and BrC can lead to errors in the attribution of BrC absorption. For example, light-absorbing iron oxides (FeOx) were found to be common in field studies, especially for BB emissions (Ito et al., 2018), yet few studies perform measurements of size distributions and chemical composition of this particle type, making it difficult to separate their contribution to the total absorption from that of BrC.
The savannah regions in Africa experience widespread annual BB events from July to October, which are estimated to account for approximately of global BB emissions (van der Werf et al., 2010). These aerosols are transported westward over the South-East Atlantic, making the region of the west coast of southern Africa and the South-East Atlantic that with the largest BrC absorption aerosol optical depth (Brown et al., 2018) and hence an ideal natural laboratory for investigating the absorption of BrC from BB emissions. In this study, we estimate the absorption of BrC using the optical closure method, utilizing in situ aircraft measurements and offline single-particle analysis from the ORACLES (ObseRvations of Aerosols above CLouds and their intEractionS) 2018 campaign (Redemann et al., 2021). An effective refractive index of BC (meBC), which attempts to capture the absorption of all possible absorbing components at 660 nm, is introduced to facilitate the absorption attribution at shorter wavelengths. The core–shell model and homogeneous models are applied and compared in this study. The range of values of the OA mass absorption coefficient (MACOA,470) and contribution of BrC to the total absorption at 470 nm (RBrC,470) using the optical closure method are also obtained.
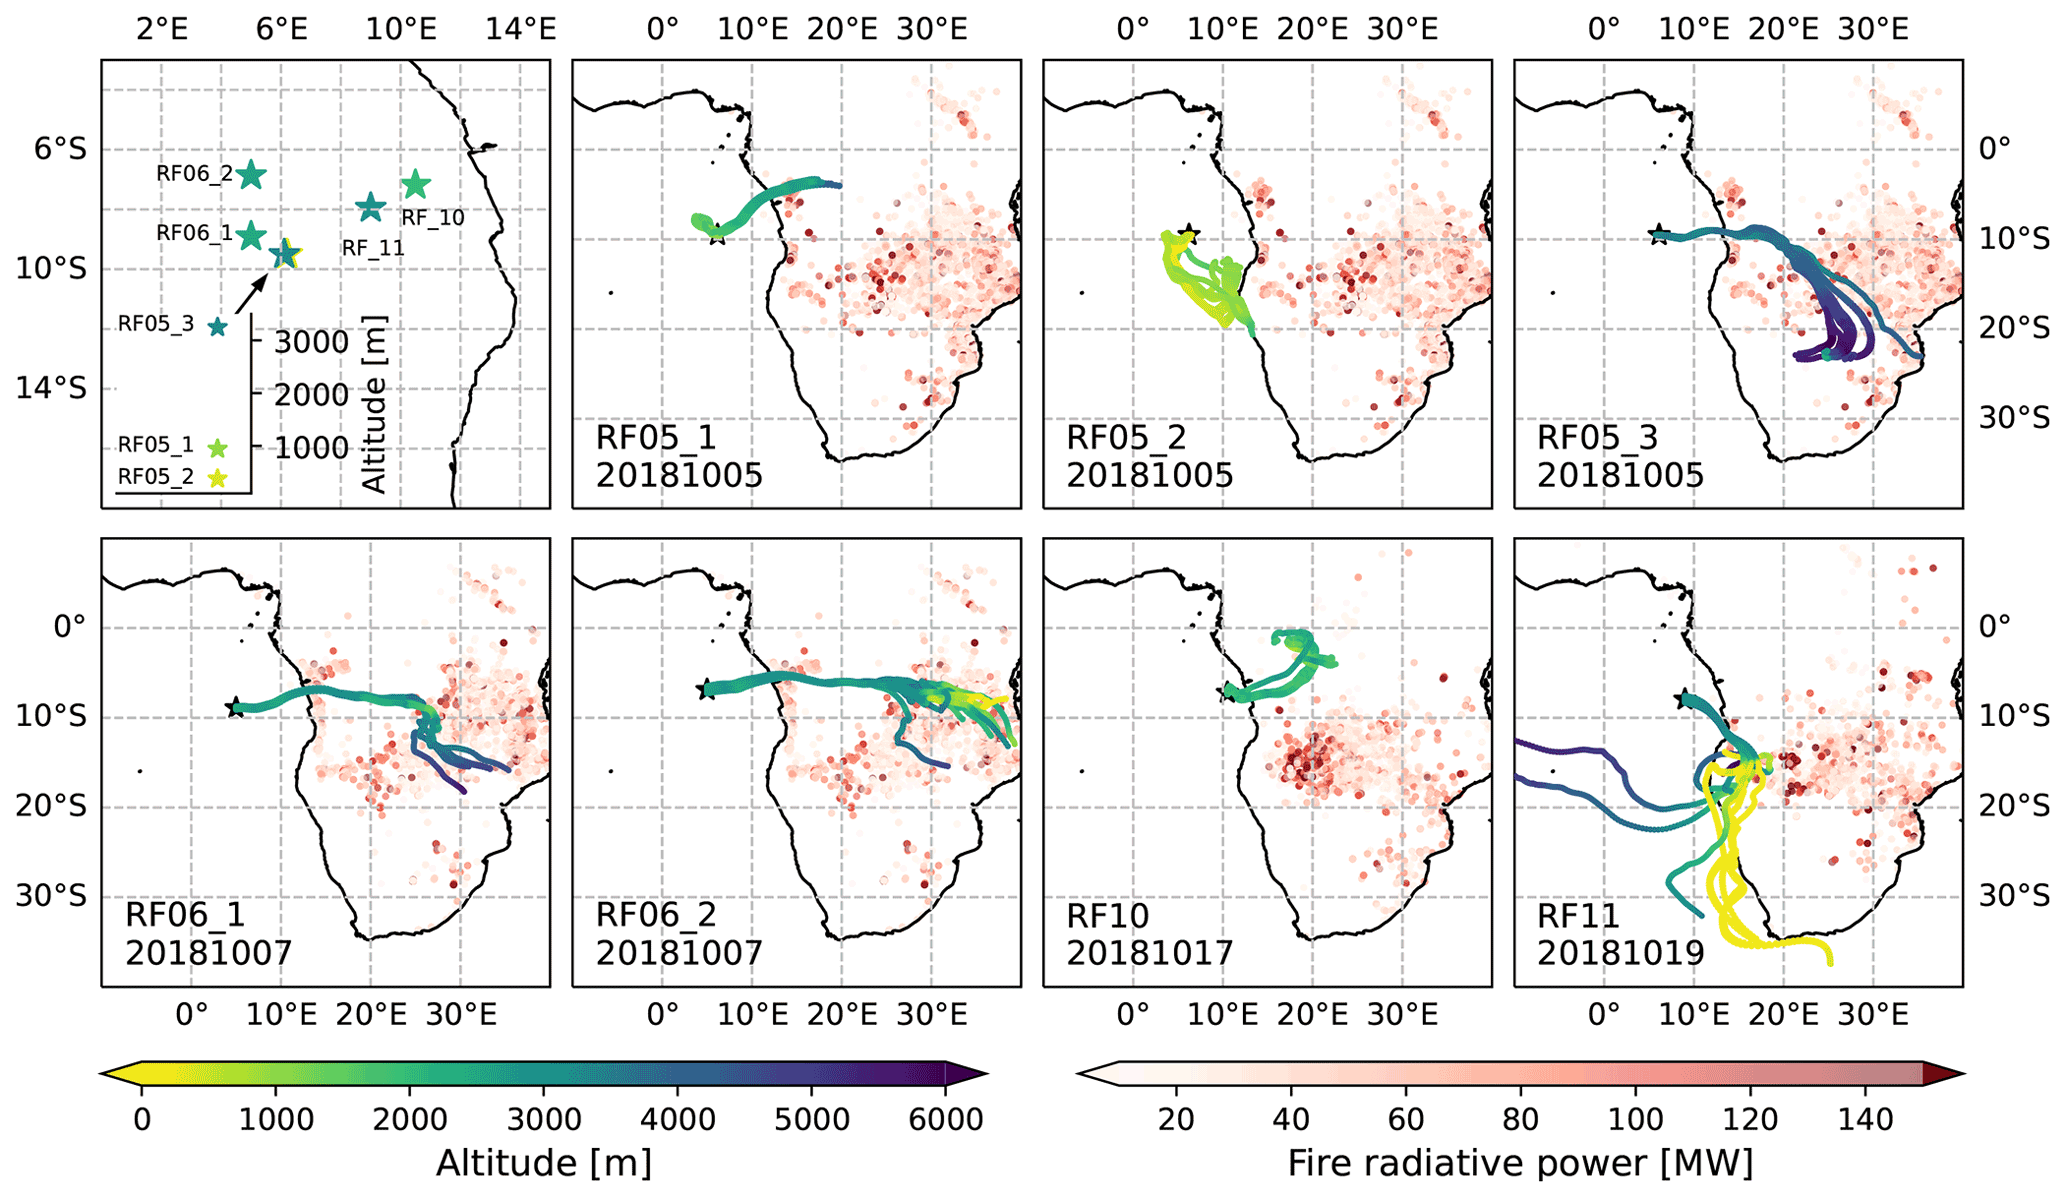
Figure 1Upper left panel: overview of the flight locations during ORACLES 2018 investigated in this study. All other panels: 7 d back-trajectories and fire radiative power from MODIS 6 Collection Active Fire Detections (MCD14ML) at the end day of the trajectory (only data with confidence >50 % are used here).
2.1 Site and instrumentation
ORACLES was a 3-year NASA-funded airborne field campaign to investigate the influence of BB emissions from southern Africa on regional and global climate (Redemann et al., 2021). We investigated aerosol optical properties from straight and level runs during seven research flights (RFs) from the ORACLES 2018 campaign (Fig. 1): RF05_1, RF05_2, RF05_3, RF06_1, RF06_2, RF10, and RF11. The specifications for each flight can be found in Table 1 in Dang et al. (2021). These flights were chosen as they provided investigations of aerosol properties in the marine boundary layer (MBL) and free troposphere (FT), from relatively aged aerosols to highly aged aerosols, and are comprehensive in online and offline measurements with few missing data. RF05_1 and RF05_2 were within the MBL at an altitude of ∼940 and 380 m, respectively; other flights were in the aerosol layer in the FT at an altitude equal to or greater than 2 km. The aerosol/plume age, modelled with a 2-week forecast using the Weather Research and Aerosol Aware Microphysics (WRF-AAM) model (Thompson and Eidhammer, 2014), was estimated to be ∼11 d for RF05_1 and RF05_2 and ∼7 d for RF05_3, RF06_1, RF06_2, RF10, and RF11 (Fig. S1 in the Supplement).
The mass and number concentrations of the refractory BC particles and the single-particle mass and mixing state were determined by the Single-Particle Soot Photometer (SP2; Droplet Measurement Technologies). Coating thicknesses of refractory-black-carbon-containing particles were derived from scattering measurements using the leading-edge-only (LEO) method of Gao et al. (2007). The SP2 detects BC particles with core diameters from 80–650 nm; a log-normal function was fit to BC number size distribution to account for BC particles with core diameters outside this range (Schwarz et al., 2006). The mass equivalent diameter of BC was calculated as , where m and ρBC represent the mass and density of BC, respectively, with ρBC assumed to be 1.8 g cm−3 (Bond and Bergstrom, 2006). The uncertainty of the measured BC mass concentration and coating thicknesses is estimated to be 20 % and 22 %, respectively (Laborde et al., 2012). The mass ratio (MR) of non-BC substance to BC for BC-containing particles was determined by , where Dp and Dc represent the diameter of coated BC particle and BC core, respectively; the i denotes the ith particle in the investigated time window. The determination of ρBC-free will be discussed in Sect. 2.2.
A particle soot absorption photometer (PSAP; Radiance Research) was used to determine 1 Hz aerosol absorption coefficients at wavelengths 470, 530, and 660 nm, which were corrected with the wavelength-averaged Virkkula correction (Virkkula, 2010) and smoothed to 10 s to reduce noise. The uncertainty of absorption coefficients is estimated to be 20 % (Fischer et al., 2010).
A high-resolution time-of-flight aerosol mass spectrometer (HR-ToF-AMS, Aerodyne Research) measured mass concentrations of sulfate (), nitrate (), ammonium (), chloride (Cl−), and OA from particles with vacuum aerodynamic diameters between 50 and 500 nm.
We determine single-particle mixing state and elemental composition from offline analysis of particles sampled on Paella TEM grids. Around 50 particles per filter were analysed. A JEOL™ JEM-2010F FEG-TEM with a ThermoNoran™ EDX detector was used. TEM was performed at 200 KeV accelerating voltage, with a take-off angle of 15.9∘ for X-ray emission from the sample. The elemental weight percentage per particle was determined using the NSS software (Thermo Electron Corporation) with the Cliff–Lorimer absorbance correction method. Detailed descriptions can be found in Dang et al. (2021).
All in situ instruments were mounted in the NASA P-3 aircraft and operated under dry conditions. Data for BC mass concentration less than 0.1 µg m−3 or absorption coefficients at 660 nm less than 1.5 Mm−1 were not included. Measurements were averaged to 10 s and adjusted to STP values at 273.15 K and 1013 hPa.
2.2 Optical models
Most of the particles were found to be nearly spherical from the images obtained by TEM, with >70 % of the particles having aspect ratios (the largest and smallest characteristic sizes of arbitrarily shaped particle) smaller than 1.5. Therefore, we applied Mie theory to determine aerosol optical properties. Models such as T-matrix or the discrete dipole approximation model were not used as they would require a large number of free parameters (Scarnato et al., 2013; He et al., 2016). We investigated the sensitivity of our closure simulations to four different models for the BC-containing particles – the ideal core–shell (CS) model and three homogeneous mixing models: (1) the volume mixing (VM) model, (2) the Maxwell–Garnett (MG) model, and (3) the Bruggeman (BG) model. The number size distribution of BC-containing particles was obtained from the BC core size distribution and the BC 2-D size and mixing state (i.e. coating thickness) distribution from SP2. The open-source PyMieScatt code was used in this study (Sumlin et al., 2018). Detailed descriptions and inputs of the four models can be found in Sect. S1 in the Supplement. We assumed that the non-BC components were homogeneously mixed and calculated the refractive index of the mixture, mBC-free, with the VM rule. The mass concentrations of , , , and Cl− measured by AMS were converted to those of inorganic salts to facilitate calculation, using the simplified ion-pairing scheme proposed by Gysel et al. (2007), modified as follows:
where n represents the number of moles. As potassium salts are the most frequently detected salts from TEM-EDX analysis (Dang et al., 2021), the residual anions were assumed to be combined with potassium, i.e. KNO3 and K2SO4; however, a small fraction of and detected by the AMS might be organics and thus lack an accompanying cation. Densities of the various salts and OA used to convert the mass concentrations to volume concentrations were taken from Kuang et al. (2020; Table 1) and Liu et al. (2015). The mBC-free is calculated as
where mi and Vi represent the refractive indices and volumes of aforementioned salts; mOA and VOA are those for OA. The refractive indices of salts are taken from Fierz-Schmidhauser et al. (2010) and Cotterell et al. (2017). The real part of the refractive index of OA varies from 1.35 to 1.7 (Lack and Cappa, 2010; Liu et al., 2013; Saleh et al., 2014; Moise et al., 2015); 1.55 is used in this study. OA is assumed to be non-absorbing in the calculation. The average and standard deviation of calculated mBC-free is 1.52±0.015, consistent with the values used in BrC studies in literature (Saleh et al., 2013; Liu et al., 2021, 2015). The particle effective refractive indices for the VM, MG, and BG models can then be obtained using the corresponding mixing rules (Sect. S1) with mBC-free and mBC. The determination of the refractive index of BC will be discussed in the following section.
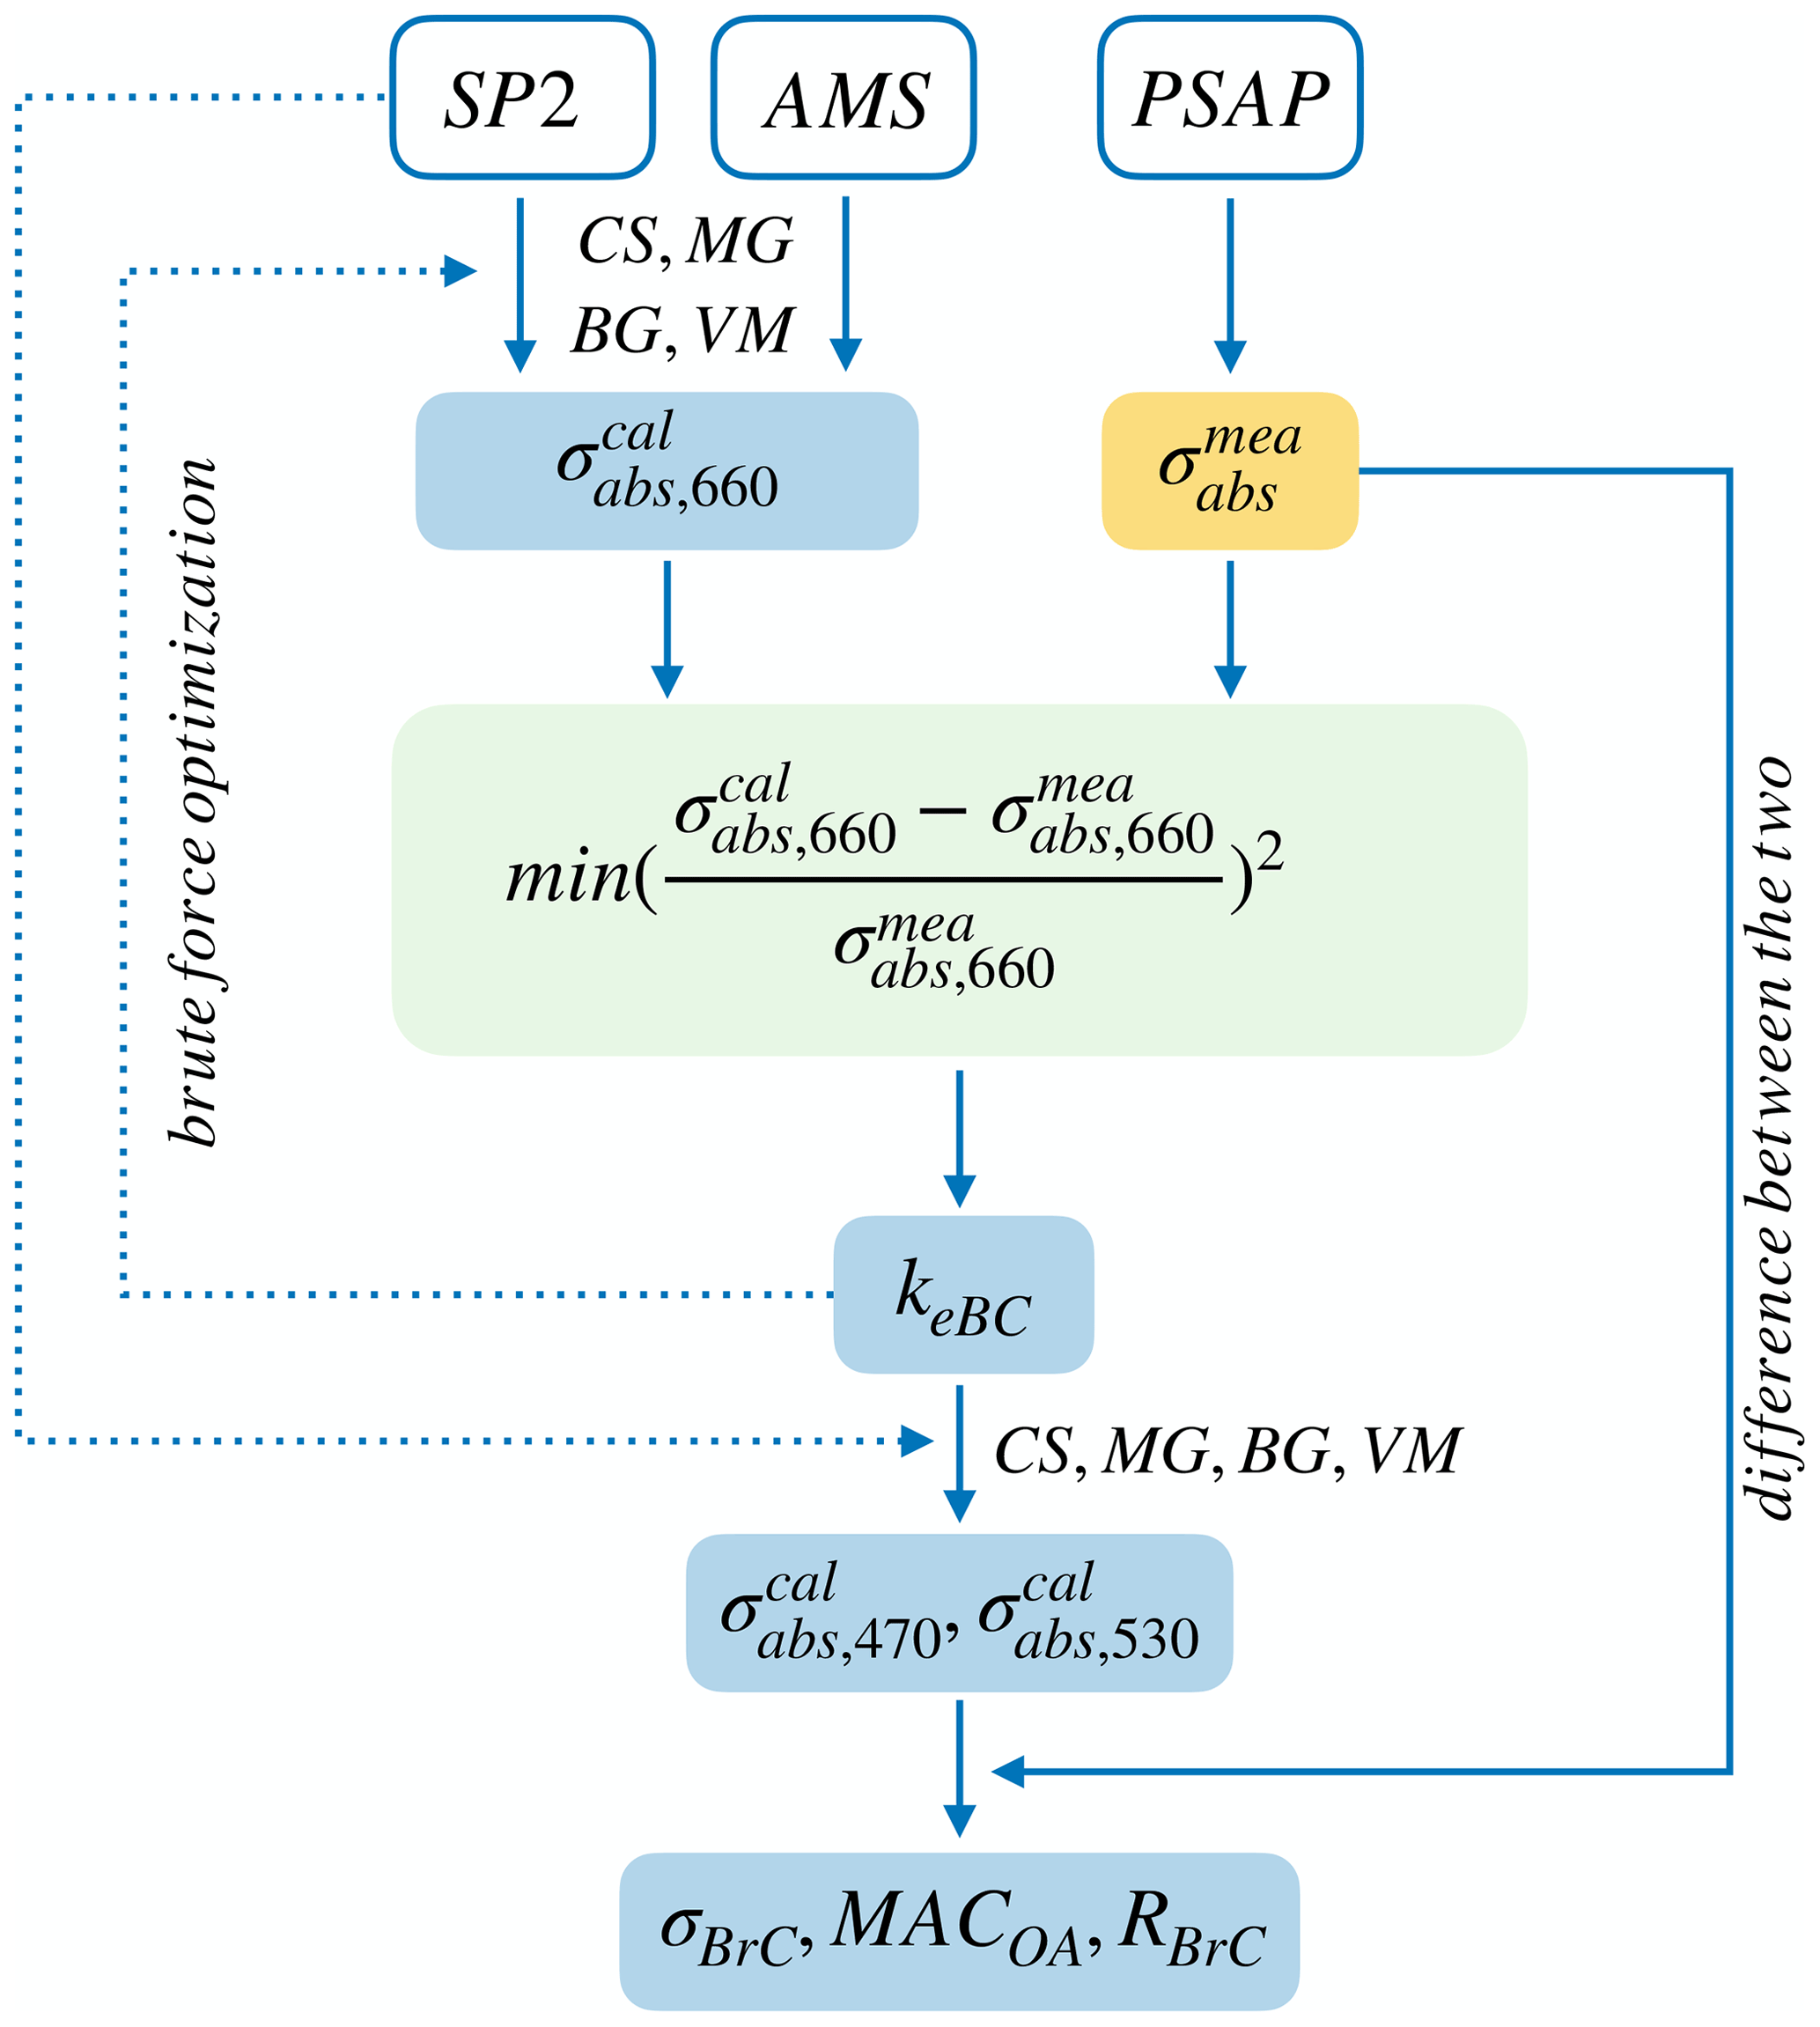
Figure 2Schematic diagram of the iterative derivation of BrC absorption attribution performed in this study. Cells in white, yellow, and blue represent instrument, measurements, and calculations, respectively. The green box is the optimization step used to determine the values of the imaginary part of the effective refractive index of BC, keBC, once the deviation of measured and calculated absorption coefficients at 660 nm ( and ) is minimized. keBC is held constant at investigated wavelengths, i.e. 470, 530, and 660 nm.
2.3 Optical calculation procedure
The numerical value selected for mBC has a large impact on the absorption attributed to BC (Fig. 3) and hence on the estimated absorption by BrC, but as noted above, there is no consensus on the best value of mBC. Additionally, the lack of measurements of possible absorbers other than BC and BrC such as magnetite makes it difficult to correctly estimate the BrC absorption, so approaches that take these components into consideration are required. Here, we introduce an effective refractive index of BC, , to represent the refractive index of BC and any other absorbing components at 660 nm in this study. The meBC would be the same as mBC if the absorption at 660 nm is solely contributed by BC; however, if other absorbing components are present, the imaginary part (keBC) of meBC would be greater than that (kBC) of mBC, the amount of which depends on the absorptivity and relative amount of these absorbers. The real part of meBC is held constant at 1.95, the upper bound of the values commonly used for BC (Bond and Bergstrom, 2006; Saleh et al., 2013; Liu et al., 2015; Kahnert and Kanngießer, 2020). It only has a minor influence on absorption calculations (Liu et al., 2021): a sensitivity test of the calculated absorption to the real part of meBC when the latter is varied from 1.75 to 2.26 shows that, at the extreme case of RF10 with the thickest coating in this study, the absorption increased less than 5 % at 660 nm.
The retrieval of keBC is illustrated in Fig. 2. OA is assumed to be non-absorbing; thus, the imaginary refractive index kOA is taken as zero in this calculation. Values of keBC were determined by minimizing the squares, χ2, of the relative differences between the measured and calculated absorption coefficients at 660 nm for each model:
where and are the calculated and measured absorption coefficients at 660 nm, respectively. The value of keBC is searched from 0.3 to 2.6, over a greater range than the values of kBC recorded in literature (Chylek et al., 2019; Kahnert and Kanngießer, 2020) and with a span of 0.01. The keBC values with χ2 greater than 0.1 are excluded.
The absorption of BrC at the long visible, i.e. 660 nm, is expected to be very small or negligible considering the aged nature of aerosols in our study (Sedlacek III et al., 2018; Adler et al., 2019; Li et al., 2019). Therefore, we assume that the contribution of BrC to keBC can be neglected and use it to differentiate the BrC absorption from that of other substances, i.e. BC and any other absorbers. This assumption of nil contribution of BrC to keBC yields a lower bound of BrC absorption at 530 and 470 nm. An evaluation of the influence of this assumption to the BrC absorption at shorter wavelengths is discussed in Sect. S2. As illustrated in Fig. 2, meBC was held constant over the range of investigated wavelengths, i.e. 470–660 nm. This is supported by mBC that is usually considered to be very weakly dependent on, or independent of, wavelength in the visible spectrum (e.g. Chang and Charalampopoulos, 1990; Moteki et al., 2010; Saleh et al., 2014). As discussed later in Sect. 3.1, other absorbers contributing to meBC, if any, are hypothesized to be magnetite, whose refractive index is also mostly invariant between wavelengths 470 and 660 nm (Amaury et al., unpublished data, http://www.astro.uni-jena.de/Laboratory/OCDB/mgfeoxides.html, last access: 8 July 2022; Ackerman and Toon, 1981; X. L. Zhang et al., 2015). Thus, the assumption of constant meBC between 470 and 660 nm is reasonable in our study, although it may lead to overestimations of BrC absorption for highly aged particles, as discussed further in Sect. 3.2.
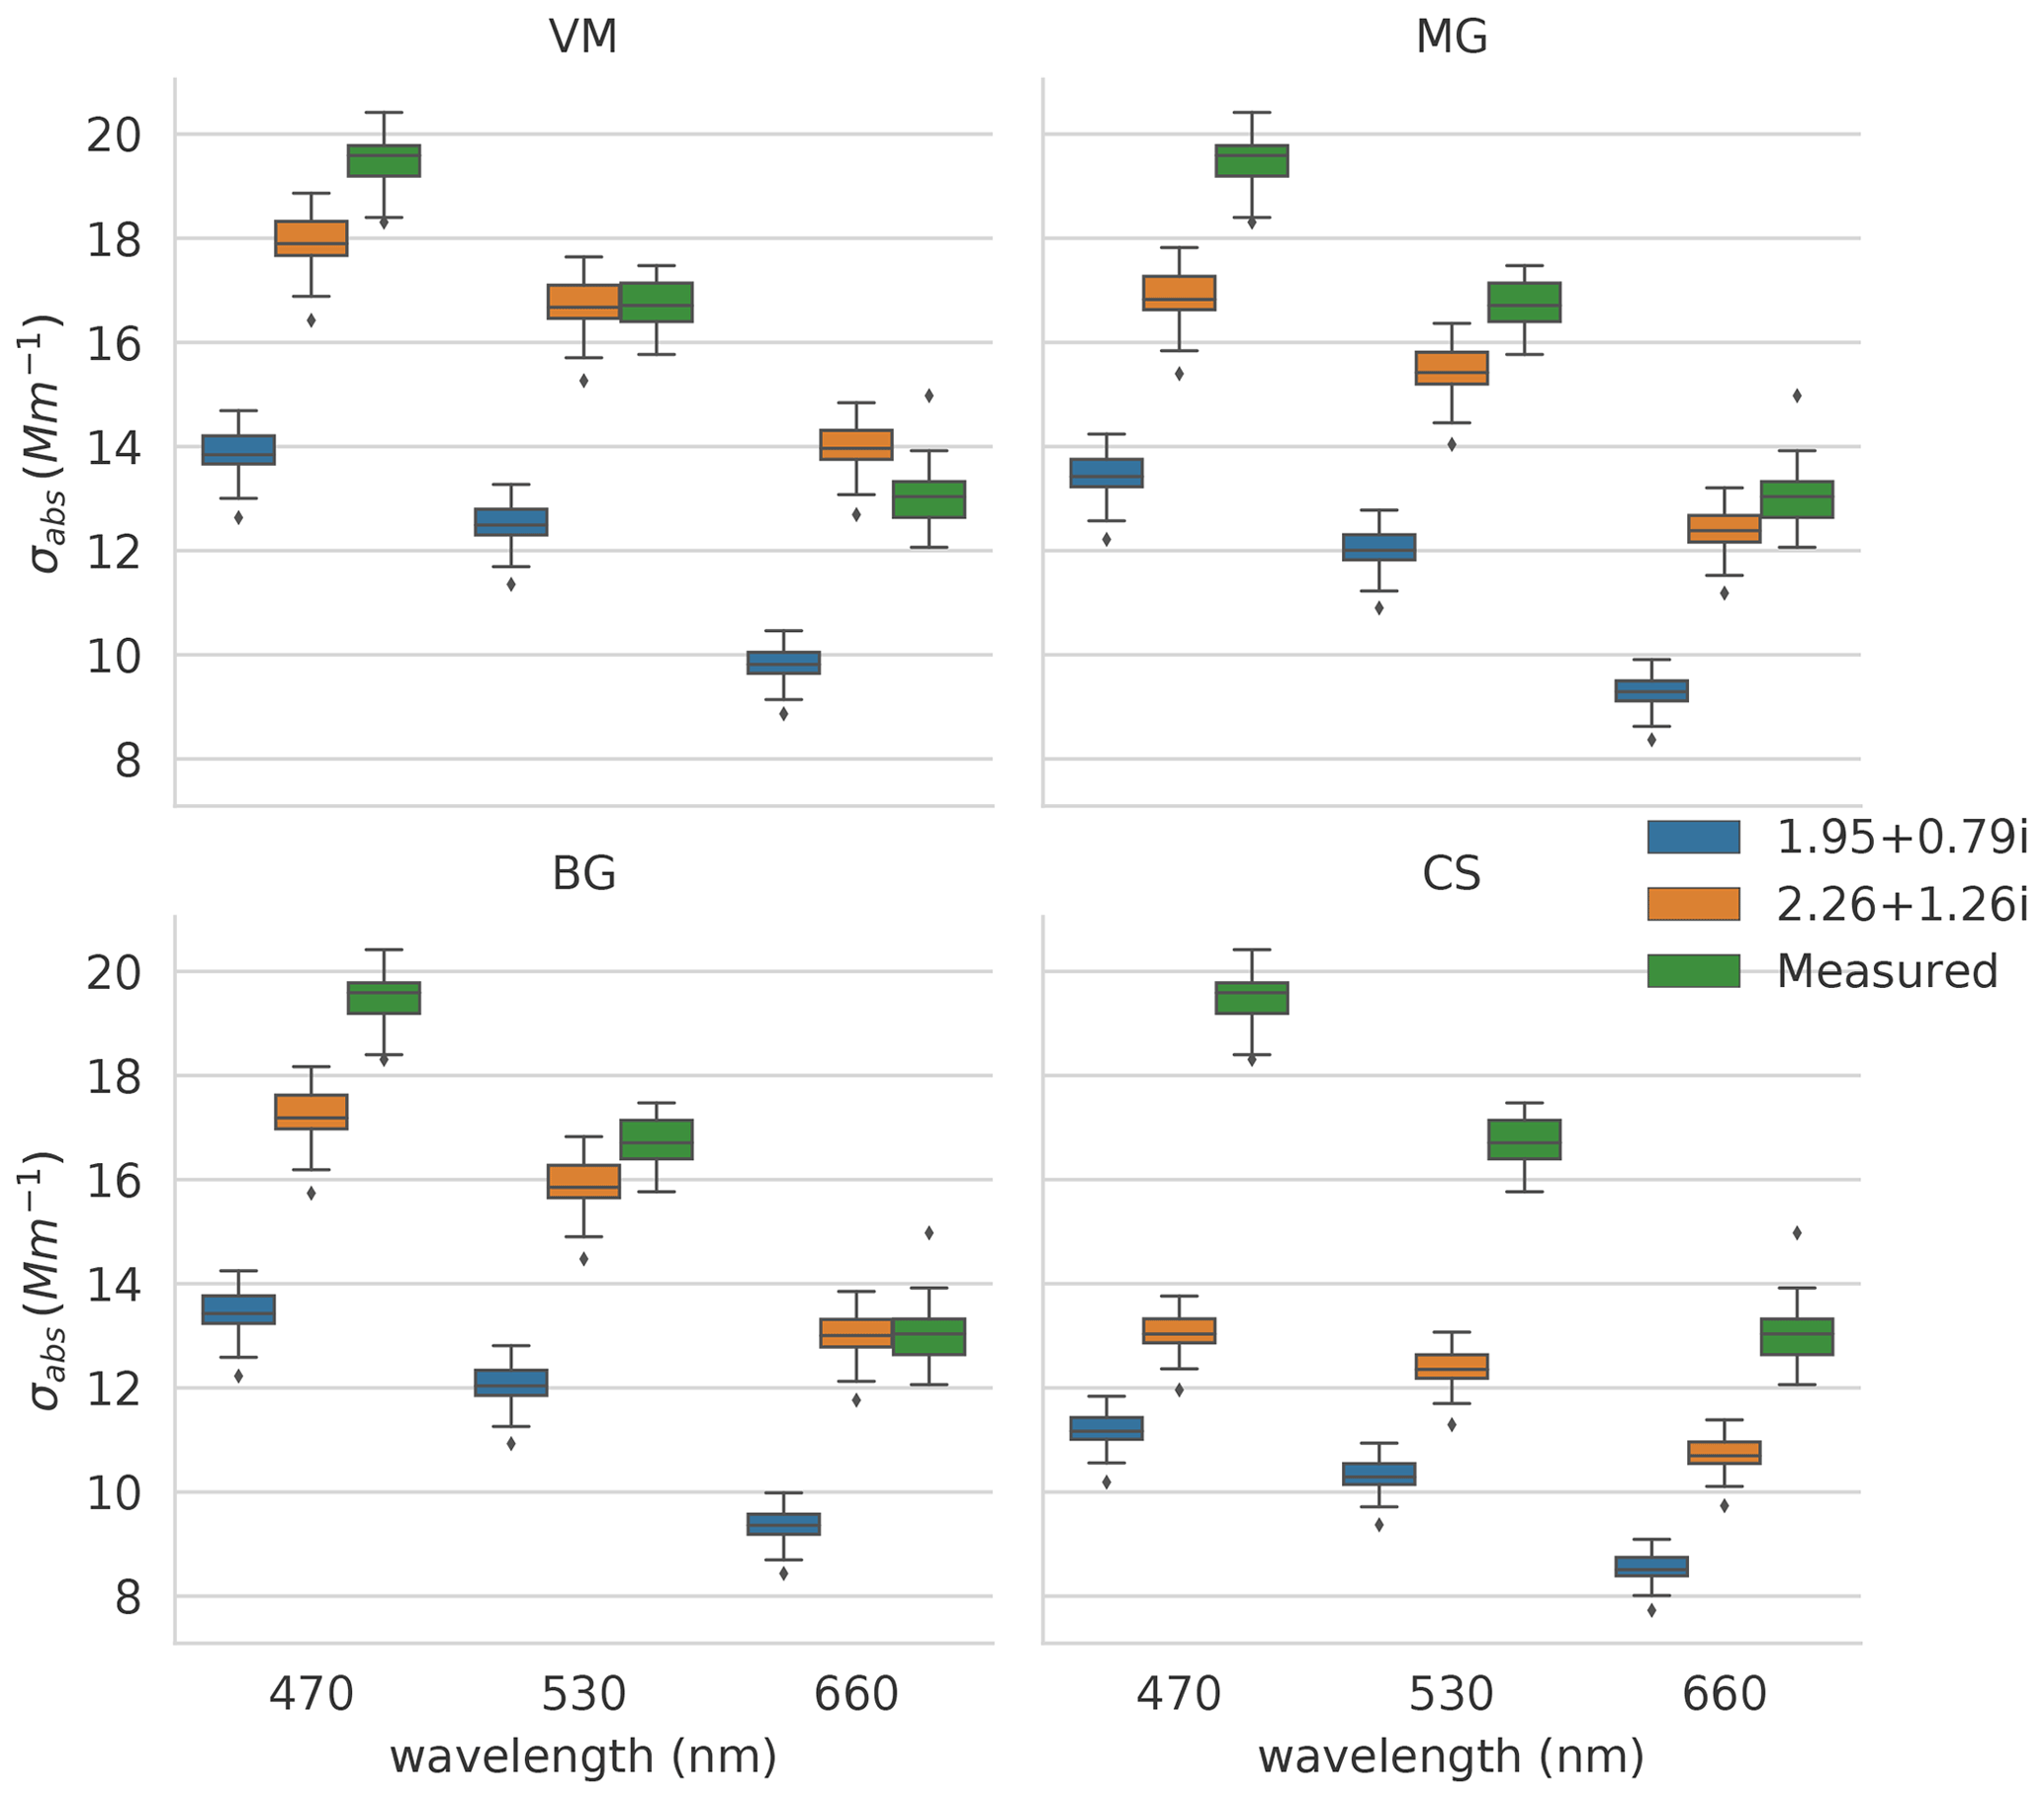
Figure 3Modelled (blue and orange markers) and measured (green markers) absorption coefficients (σabs) at PSAP wavelengths for RF06_1. Variables are modelled with two mBC values (shown in the legend) using the CS, MG, BG, and VM models (specified on the top of each plot). OA is assumed to be non-absorbing with the refractive index mOA of 1.55+0i. The horizontal lines in the boxes represent the median value, the boxes represent the 25th to 75th percentile, the whiskers represent 1.5 times the interquartile range, and the diamonds represent outliers.
The absorption of BrC at wavelength λ () is calculated as the difference between measured absorption coefficient () and that calculated with meBC ():
The fractional contribution of BrC to the total absorption at wavelength λ, RBrC,λ, is defined as
and is assumed to be zero at 660 nm in our study. The mass absorption cross section (MAC) of OA at wavelength λ, MACOA,λ, can be determined from and the mass concentration of OA, MOA:
Similarly, the mass absorption coefficient of BC (MACBC) is defined as , where and MBC represent the measured absorption coefficient at wavelength λ and the mass concentration of BC, respectively.
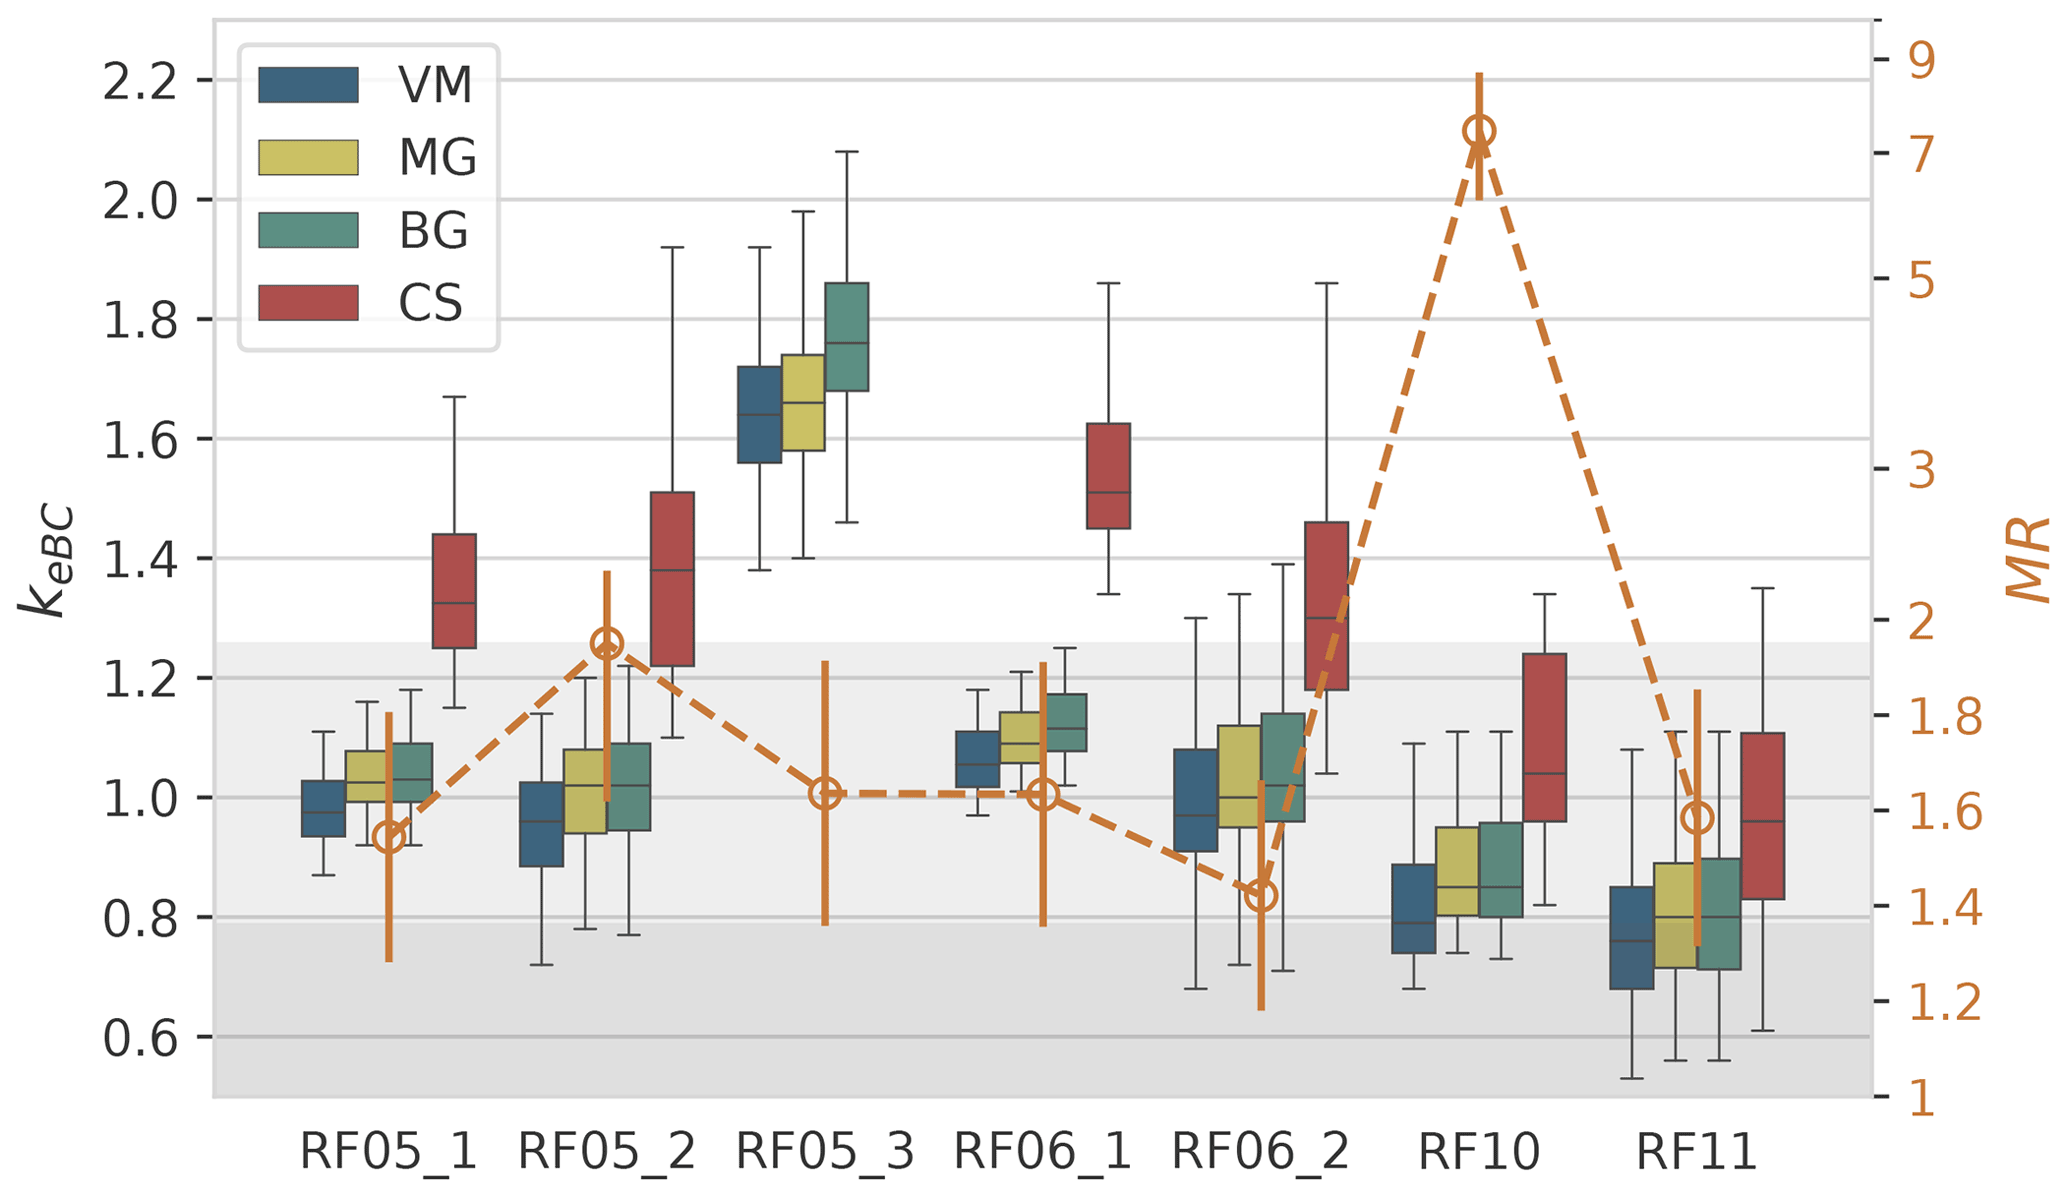
Figure 4Box plot of keBC (left axis) derived from different models and the MR values (orange open dots, right axis) for each flight. Error bars of MR represent 20 % uncertainty. The right y axis uses the log scale. The light and dark grey shaded region shows keBC smaller than 1.26, the largest kBC value determined by Moteki et al. (2010), and 0.79, the largest value of commonly used kBC, respectively.
3.1 Effective refractive index of BC (meBC)
In this section, we present and discuss the results of keBC derived from the aforementioned four models for each flight. Uncertainties of keBC retrieved from various models have been determined by Monte Carlo uncertainty analysis in Sect. S3. The values of keBC for each flight determined by the various models are shown in Fig. 4. No meBC for RF05_3 was obtained with the CS model because the criterion of χ2 smaller than 0.1 was not met, as the absorption coefficient calculated with the CS model using the largest possible mBC (i.e. 2.26+1.26i) was only half of the measurement for RF05_3 (Fig. S2). Variations of keBC show similar patterns among different models (Fig. 4). The values derived from the CS and VM models are the highest and lowest, respectively, and the values derived from the MG and BG models are between the other two models and very close to each other, in agreement with the absorption results calculated with various models in previous studies (Lesins et al., 2002; Fierce et al., 2017a; Taylor et al., 2020). The values of keBC for RF05_1, RF05_2, RF06_1, and RF06_2 from the CS model have greatly exceeded the largest value of kBC of 1.26 (grey shaded region in Fig. 4), determined by Moteki et al. (2010) for soot particles from an urban source (Tokyo). Little confidence has been placed in the value of keBC from the CS model, except for RF10 for two main reasons. First, the MR for all samples is less than 2, and application of the CS model can be inappropriate for particles with such low MR values (Liu et al., 2017). Furthermore, the TEM analysis found few core–shell structures (e.g. example of RF05_1 in Fig. 5) among investigated samples, with most BC-containing particles composed of condensed BC nodules internally mixed with salts/organics (e.g. example of RF05_3 in Fig. 5) or aggregates attached to non-BC components (e.g. example of RF05_2 in Fig. 5). Representative TEM images of different types of BC-containing particles for each flight are shown in Fig. 5. The use of the CS model for RF10 was supported by its high MR value of 7.4, which has exceeded the lower bound of MR for the use of CS model proposed by Liu et al. (2017), although a fair number of BC particles homogeneously mixed with salts and OA were detected as well (Fig. 5). In addition, results of the BrC contribution to the total absorption suggest that homogeneous models might be inappropriate for RF10, as discussed in detail in Sect. 3.3.
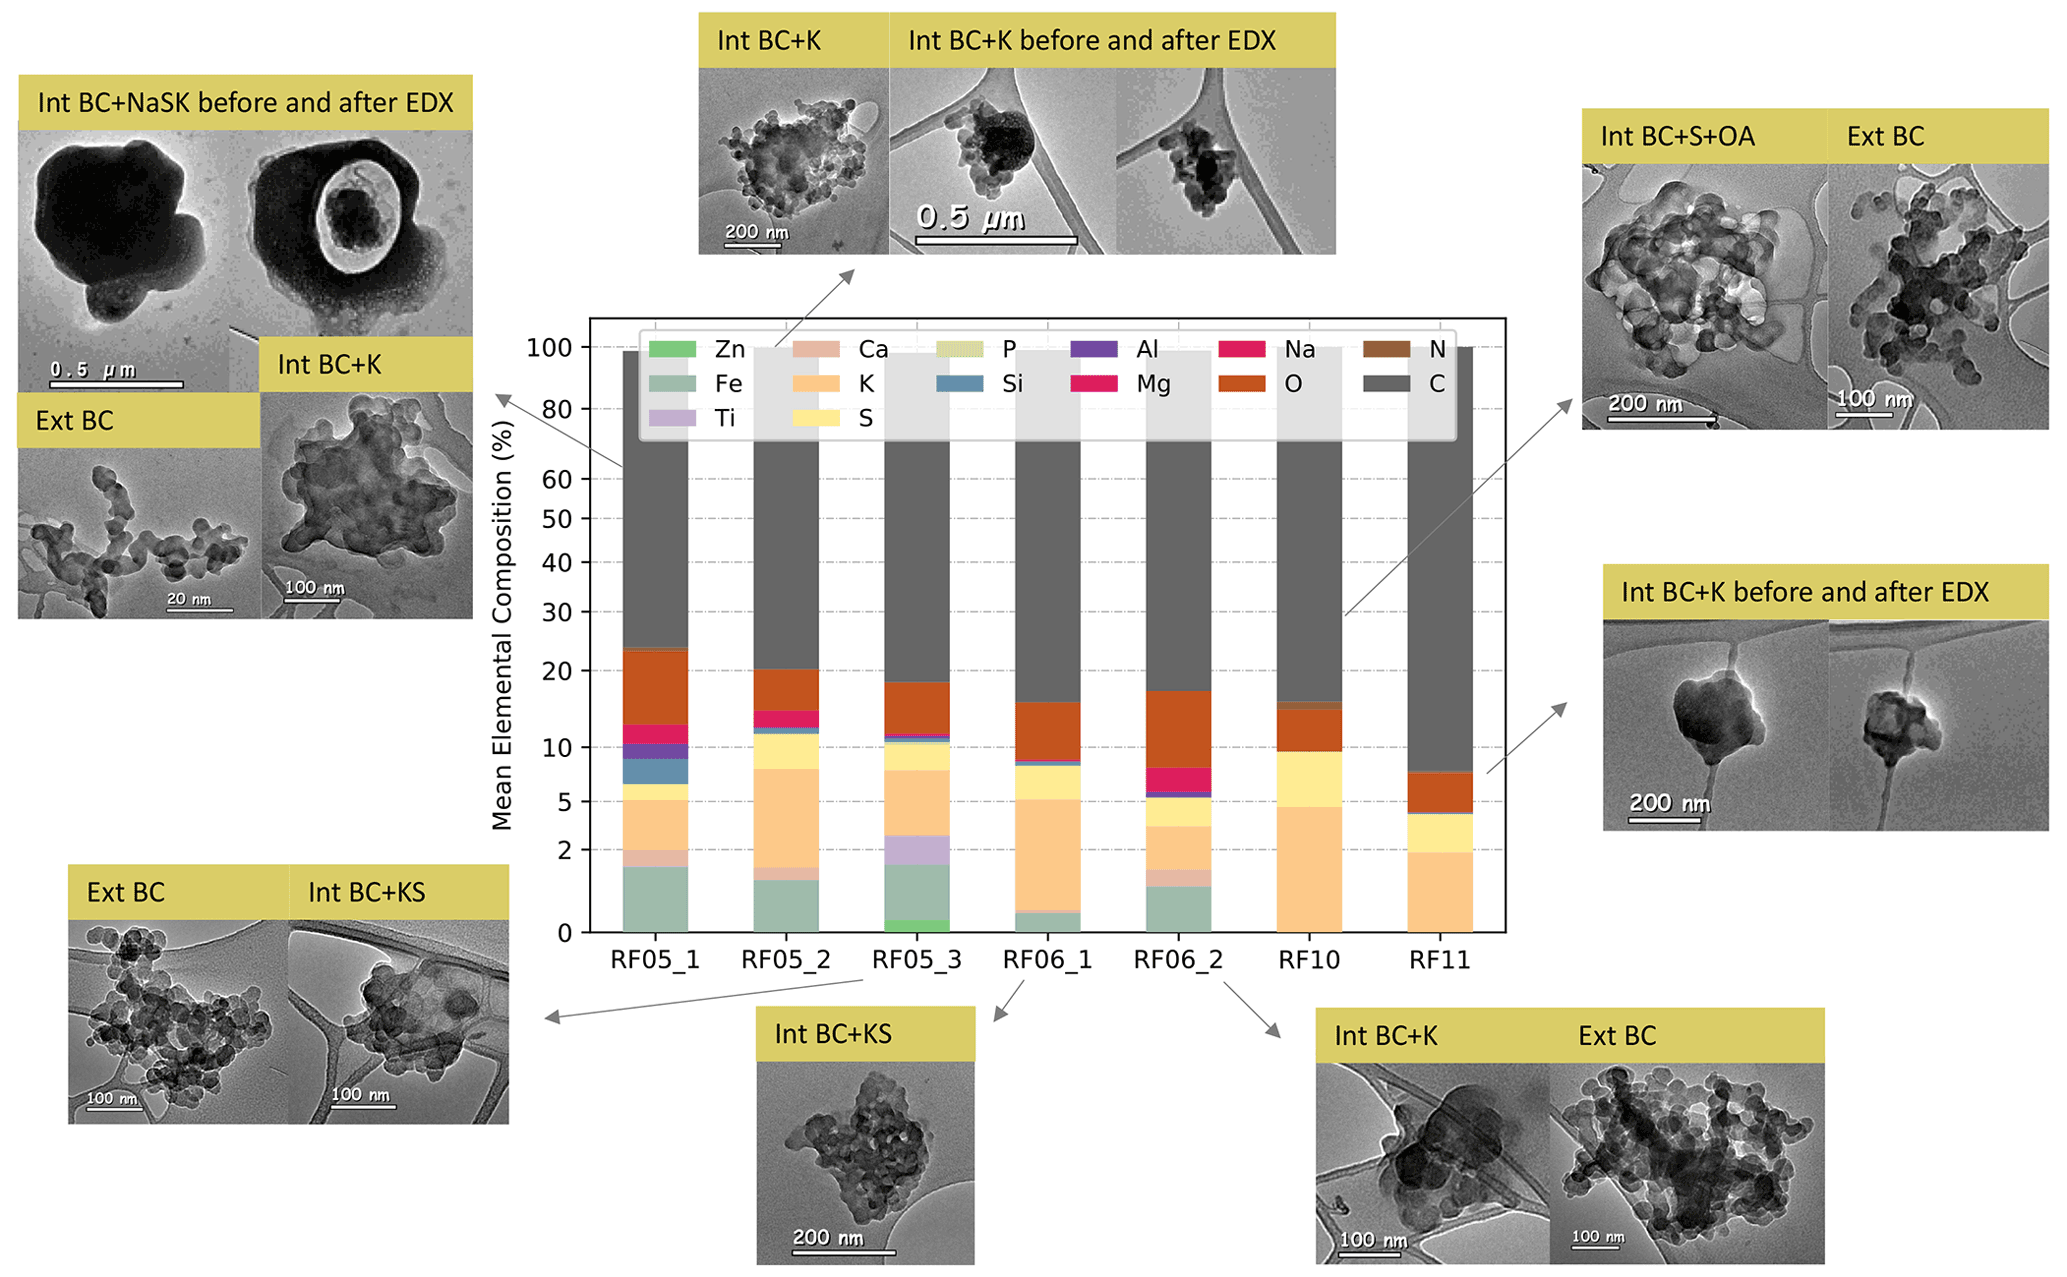
Figure 5Elemental composition and representative microphysical images of different types of BC-containing particles from TEM analysis for each flight. Int BC and Ext BC represent internally and externally mixed BC particles, respectively. For example, Int BC+K stands for internally mixed BC with potassium salts. The y axis uses a scale.
As discussed in Sect. 2.3, keBC should be the same as kBC if the absorption at 660 nm arises only from BC; higher keBC value indicates larger absorptivity of absorbers at 660 nm. The values of keBC for RF05_1, RF05_2, RF05_3, RF06_1, and RF06_2, for which iron (Fe) was detected from the TEM-EDX (as shown in the bar chart in Fig. 5), are mostly larger than unity and greater than those for RF10 and RF11, for which no iron was detected. Therefore, we suspect higher keBC values may be related to iron oxides (FeOx) that absorb at 660 nm. We have examined all possible compounds of detected elements from EDX and found that magnetite is the only compound that is not rare in the atmosphere and also absorbs strongly at 660 nm. Magnetite shows a strong and uniform absorptivity over the visible spectrum, with the reported imaginary refractive index ranging from 0.58 to 1.0 (Amaury et al., unpublished data, http://www.astro.uni-jena.de/Laboratory/OCDB/mgfeoxides.html, last access: 8 July 2022; Ackerman and Toon, 1981; X. L. Zhang et al., 2015), and therefore can contribute to the high values of keBC at 660 nm. Studies show that magnetite can be transformed from Fe(III) at high temperatures, such as goethite and hematite (Till et al., 2015; Ito et al., 2018), which happen to be the two most abundant forms of FeOx in African dust (Formenti et al., 2014). Therefore, we hypothesize that a part of the magnetite might be converted from Fe(III) during biomass burning. Additionally, magnetite can be emitted from anthropogenic activities, such as steel manufacturing, oil combustion, and engines and brakes of motor vehicles (Machemer, 2004; Liati et al., 2015; Moteki et al., 2017; Kurisu et al., 2019). The significance of anthropogenic magnetite in radiative forcing has been investigated and highlighted in recent studies (Moteki et al., 2017; Ito et al., 2018; Lamb et al., 2021). Although there is no investigation on magnetite in sub-Saharan Africa yet, the industrial and motor vehicle emissions in Africa are likely to contribute magnetite. Furthermore, the pyrometallurgical process is a widely used extraction method in copper mining, a major industry in the central African Copperbelt (https://www.pyrometallurgy.co.za/PyroSA/, last access: 8 July 2022, Vítková et al., 2010; Sikamo et al., 2016; Shengo et al., 2019), of which iron is a common unwanted slag element (Meter et al., 1999). Therefore, we suspect it might also contribute magnetite, considering the high temperature of the pyrometallurgical process.
RF05_3, collected at the uppermost aerosol layer (Fig. 4), is an exception among all flights, since the values of the absorption coefficient at 660 nm calculated with all four models are considerably smaller than the measured ones (Fig. S2). The MG, BG, and VM models yield median keBC values greater than 1.6; no values met the criterion of χ2<0.1 for the CS model. The MACBC of RF05_3 is the highest among all flights, with values (mean ± standard deviation) of 20.0±0.8, 17.8±0.8, and 14.3±0.7 m2 g−1 at 470, 530, and 660 nm, respectively. The absorption enhancement, EAbs, defined as the ratio of MACBC to the value for uncoated BC reported by Bond and Bergstrom (2006), is 2.3±0.1 for all three wavelengths. To the best of our knowledge, except for modelling or laboratory studies of thickly coated particles (Bond et al., 2006; Jacobson, 2012; Peng et al., 2016; Che et al., 2022a), such high values of EAbs, particularly at long visible wavelengths, are rarely reported in field measurements (Cui et al., 2016). Taylor et al. (2020) presented relatively high MACBC values of 20±4, 15±3, and 12±2 m2 g−1 at 405, 514, and 655 nm, respectively and an EAbs of 1.85±0.45 for CLARIFY 2017 (Cloud-Aerosol-Radiation Interaction and Forcing 2017 measurement campaign; Haywood et al., 2021), which are generally comparable to or smaller than those for RF05_3. However, particles in CLARIFY 2017 are universally thickly coated, with median MR values of 8–12, and therefore would be expected to have large values of Eabs, as opposed to RF05_3, which had a median MR (Fig. 4) of 1.6. We calculated absorption coefficients for RF05_3 at 660 nm using the VM model, which usually yields a higher estimation of the measurements (Taylor et al., 2020) and a mBC of 1.95+0.79i, an upper bound of the commonly used BC refractive index (Liu et al., 2021). Uncertainties related to calculated absorption coefficients can be found in Sect. S3. The calculated absorption, which is very likely an overestimation of the measurement, is only able to explain ∼57 % of the measured absorption coefficient (Fig. S2), implying that the remaining amount of absorption which cannot be attributed to BC might result from other absorbers. This unexplained portion of absorption in RF05_3 is at least twice as high as that in other flights (e.g. Figs. 3 and S2). Back-trajectories show that air parcels in RF05_3 passed by the Copperbelt in Zambia (Fig. 1), where the pyrometallurgical process in copper mining might contribute large amounts of magnetite. In addition, we noticed titanium (Ti) on the particles from RF05_3. Although titanium oxides are not absorbing, several forms of Ti have been reported to strongly absorb at visible wavelengths (Pflüger and Fink, 1997; Palm et al., 2018). Therefore, we suspect this unexplained absorption in RF05_3 may also be related to absorbing titanium compounds.

Figure 6Values of MACOA,470 (boxes) derived using different models and the mass concentration of OA, MOA (orange dots, left y axis), for each flight. Error bars represent 1σ standard deviation. The scale of both x axes is symmetric log. The horizontal lines of box plot represent the median value, the boxes represent the 25th to 75th percentile, and the whiskers represent 1.5 times the interquartile range. RF05_1 and RF05_2 were measured in the MBL with plume aged larger than 11 d; other flights were measured in the FT with ageing time around 7 d. The aerosol/plume age provided by a 2-week forecast using the Weather Research and Aerosol Aware Microphysics (WRF-AAM) model.
3.2 Mass absorption coefficient of OA (MACOA)
Values of MACOA,470 calculated from Eq. (11) using the different models are shown in Fig. 6. The uncertainty of MACOA,470 has been determined using Monte Carlo uncertainty analysis in Sect. S3. The values of MACOA,470 from the three homogeneous models were fairly close to each other, as expected from previous studies (Lesins et al., 2002), while MACOA,470 from the CS model was much greater, highlighting the importance of model treatment. From Sect. 3.1, results of RF10 from the CS model and the results of other flights calculated with homogeneous models are more plausible, with the values (mean ± standard deviation) of MACOA,470 for RF05_3, RF06_1, RF06_2, RF10, and RF11 ranging from 0.30±0.27 to 0.68±0.08 m2 g−1. This result at 470 nm is generally comparable to the value of 0.31±0.09 m2 g−1 at 405 nm for highly aged aerosols sampled downwind of ORACLES in CLARIFY 2017 campaign (Taylor et al., 2020).
RF05_1 and RF05_2, whose particles are as least as aged as those in CLARIFY, showed unexpectedly high MACOA,470 values of 1.84±0.64 and 2.38±1.89 m2 g−1, respectively. Although the values of MOA for these samples are low (Fig. 6), measurements from all instruments are within the detection limit, which would argue that these values are valid. X. Wang et al. (2018) used airborne measurements to constrain their global model and found the best MACOA to represent the measurements was 1.33 m2 g−1 for freshly emitted BB OA at 365 nm. Lin et al. (2017) investigated relatively fresh BB aerosols subject to atmospheric processing during a night-long BB event in an urban environment and reported a MAC of 0.9 m2 g−1 for water-extractable BrC at 470 nm under the peak BB episode. Our values of MACOA,470 for RF05_1 and RF05_2 are much higher than those for much fresher BB aerosols, which seems unrealistic, as BrC bleaching is expected to occur during transport (Hems et al., 2021; Che et al., 2021). One possible explanation is that secondary BrC formation occurred, perhaps through aqueous-phase chemistry during transport (Hems et al., 2021), as RF05_1 and RF05_2 were sampled in the MBL with higher RHs. Saleh et al. (2013) reported that secondary BrC can be more absorbing than primary BrC at short visible wavelengths; however, to the best of our knowledge, such high MAC like those in RF05_1 and RF05_2 for secondary BrC have not been documented (Kasthuriarachchi et al., 2020).
We assume a constant meBC over the investigated spectrum, i.e. 470–660 nm, while the meBC would be underestimated at shorter wavelengths if there are some components with strong absorption at short visible but not at long visible wavelengths and therefore lead to an overestimation of MACOA.470. Hematite, whose imaginary refractive index ranges from 0 to 1.0 at 470 nm and 0 to ∼0.2 at 670 nm (X. L. Zhang et al., 2015; Go et al., 2022), is the second most abundant FeOx in western African dust (Formenti et al., 2014). Particles in RF05_1 and RF05_2 experienced over 11 d of transport and thus may have more opportunities to mix with hematite and therefore lead to an overestimation of MACOA. While lacking measurements to determine the compound, it is difficult to verify our speculation. A modified SP2 has been reported by Yoshida et al. (2016) that can discriminate black-coloured magnetite and red-coloured hematite; thus, we recommend adding such measurement capabilities in future BB investigations over Africa and the South-East Atlantic region.
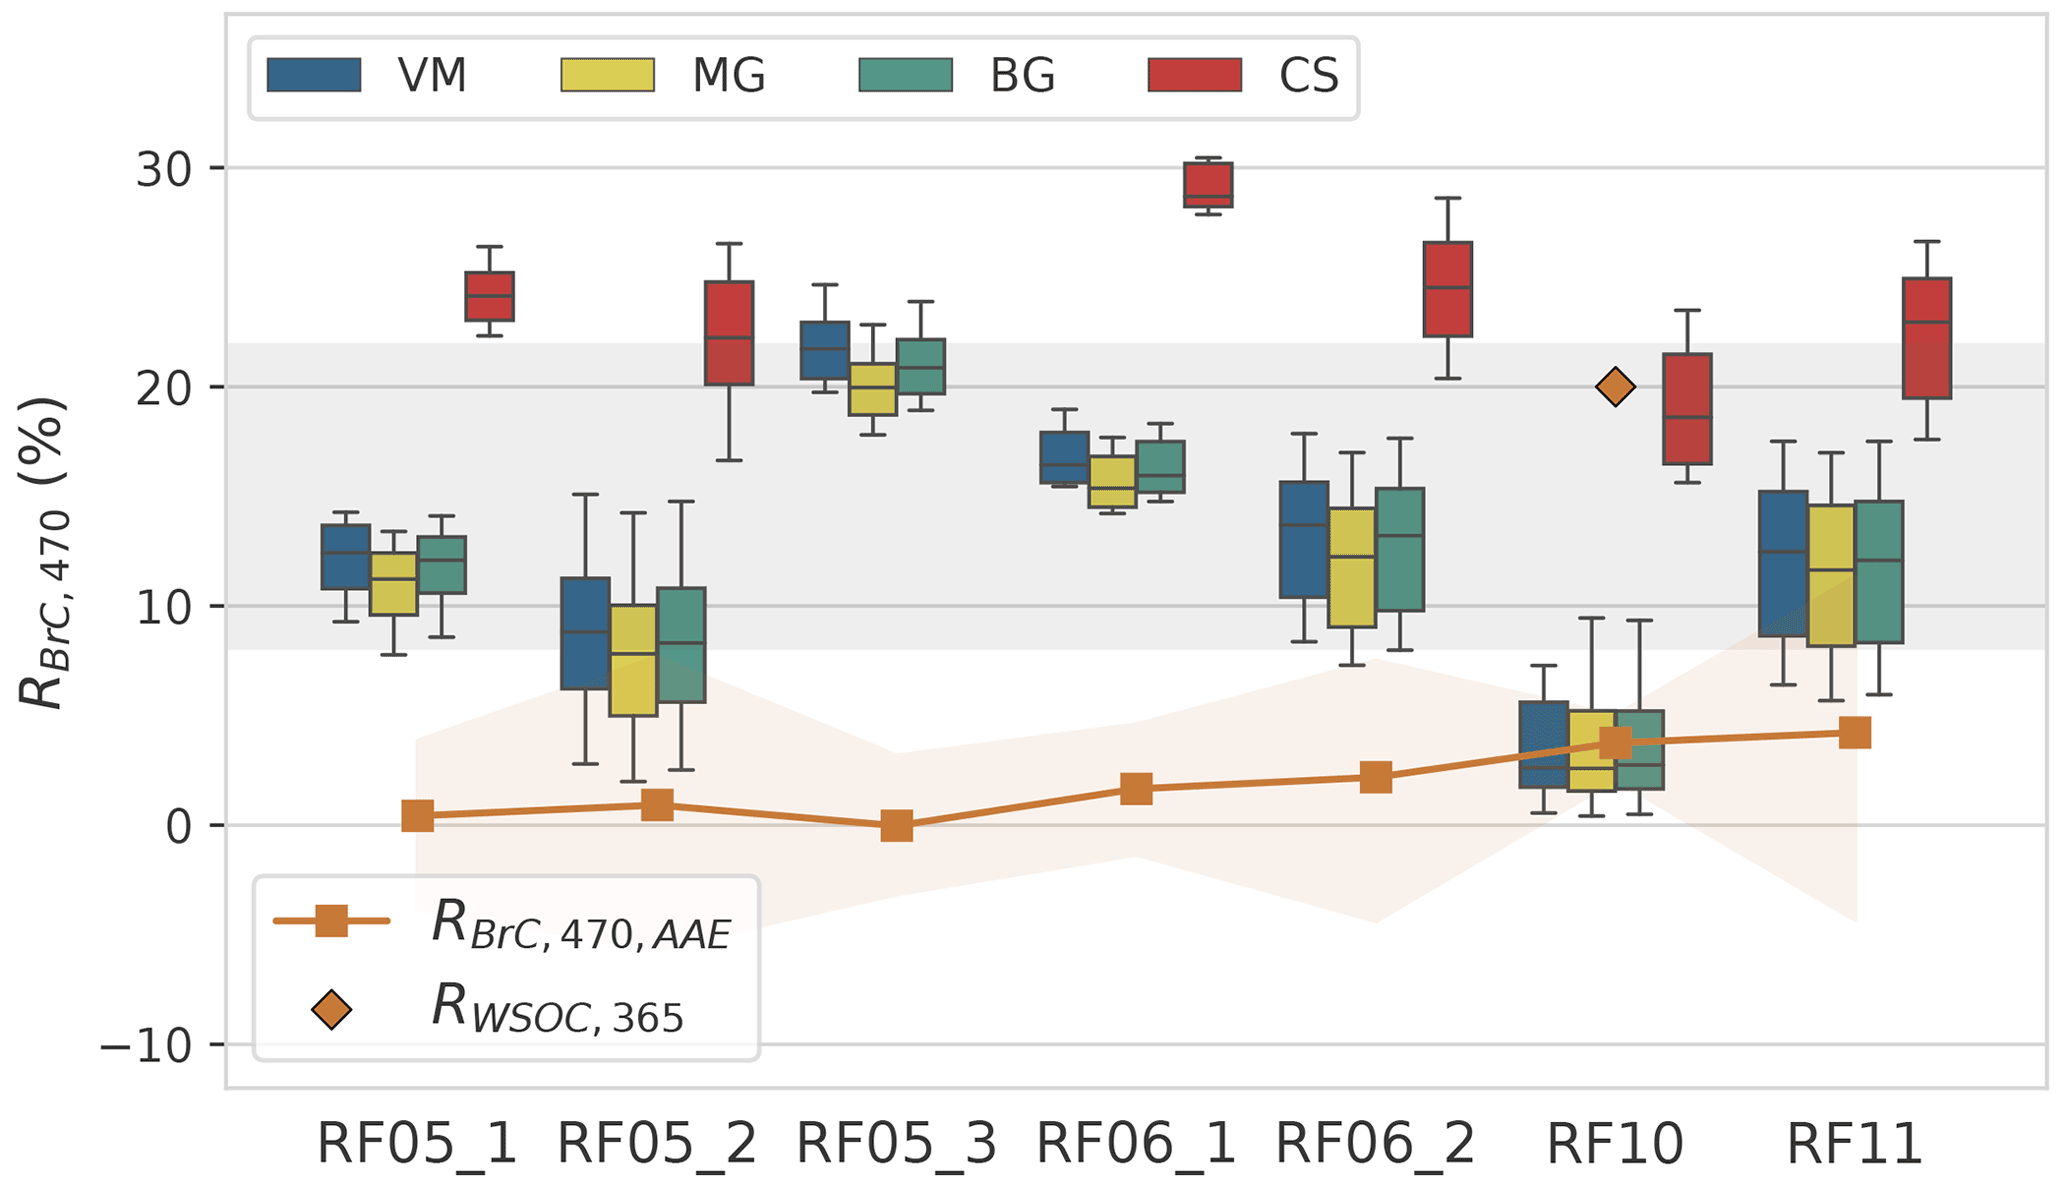
Figure 7Contribution of BrC to the total absorption obtained from optical closure approach in this study (boxes, RBrC,470) and from the AAE attribution method (orange squares, ) at 470 nm. The grey zone indicates the RBrC,470 range of 8 %–22 % in this study. Orange shades of represent the 10th and 90th percentile. The orange diamond is the contribution of WSOC (water-soluble organic carbon) to the total absorption, (Athanasios Nenes, personal communication, 2021).
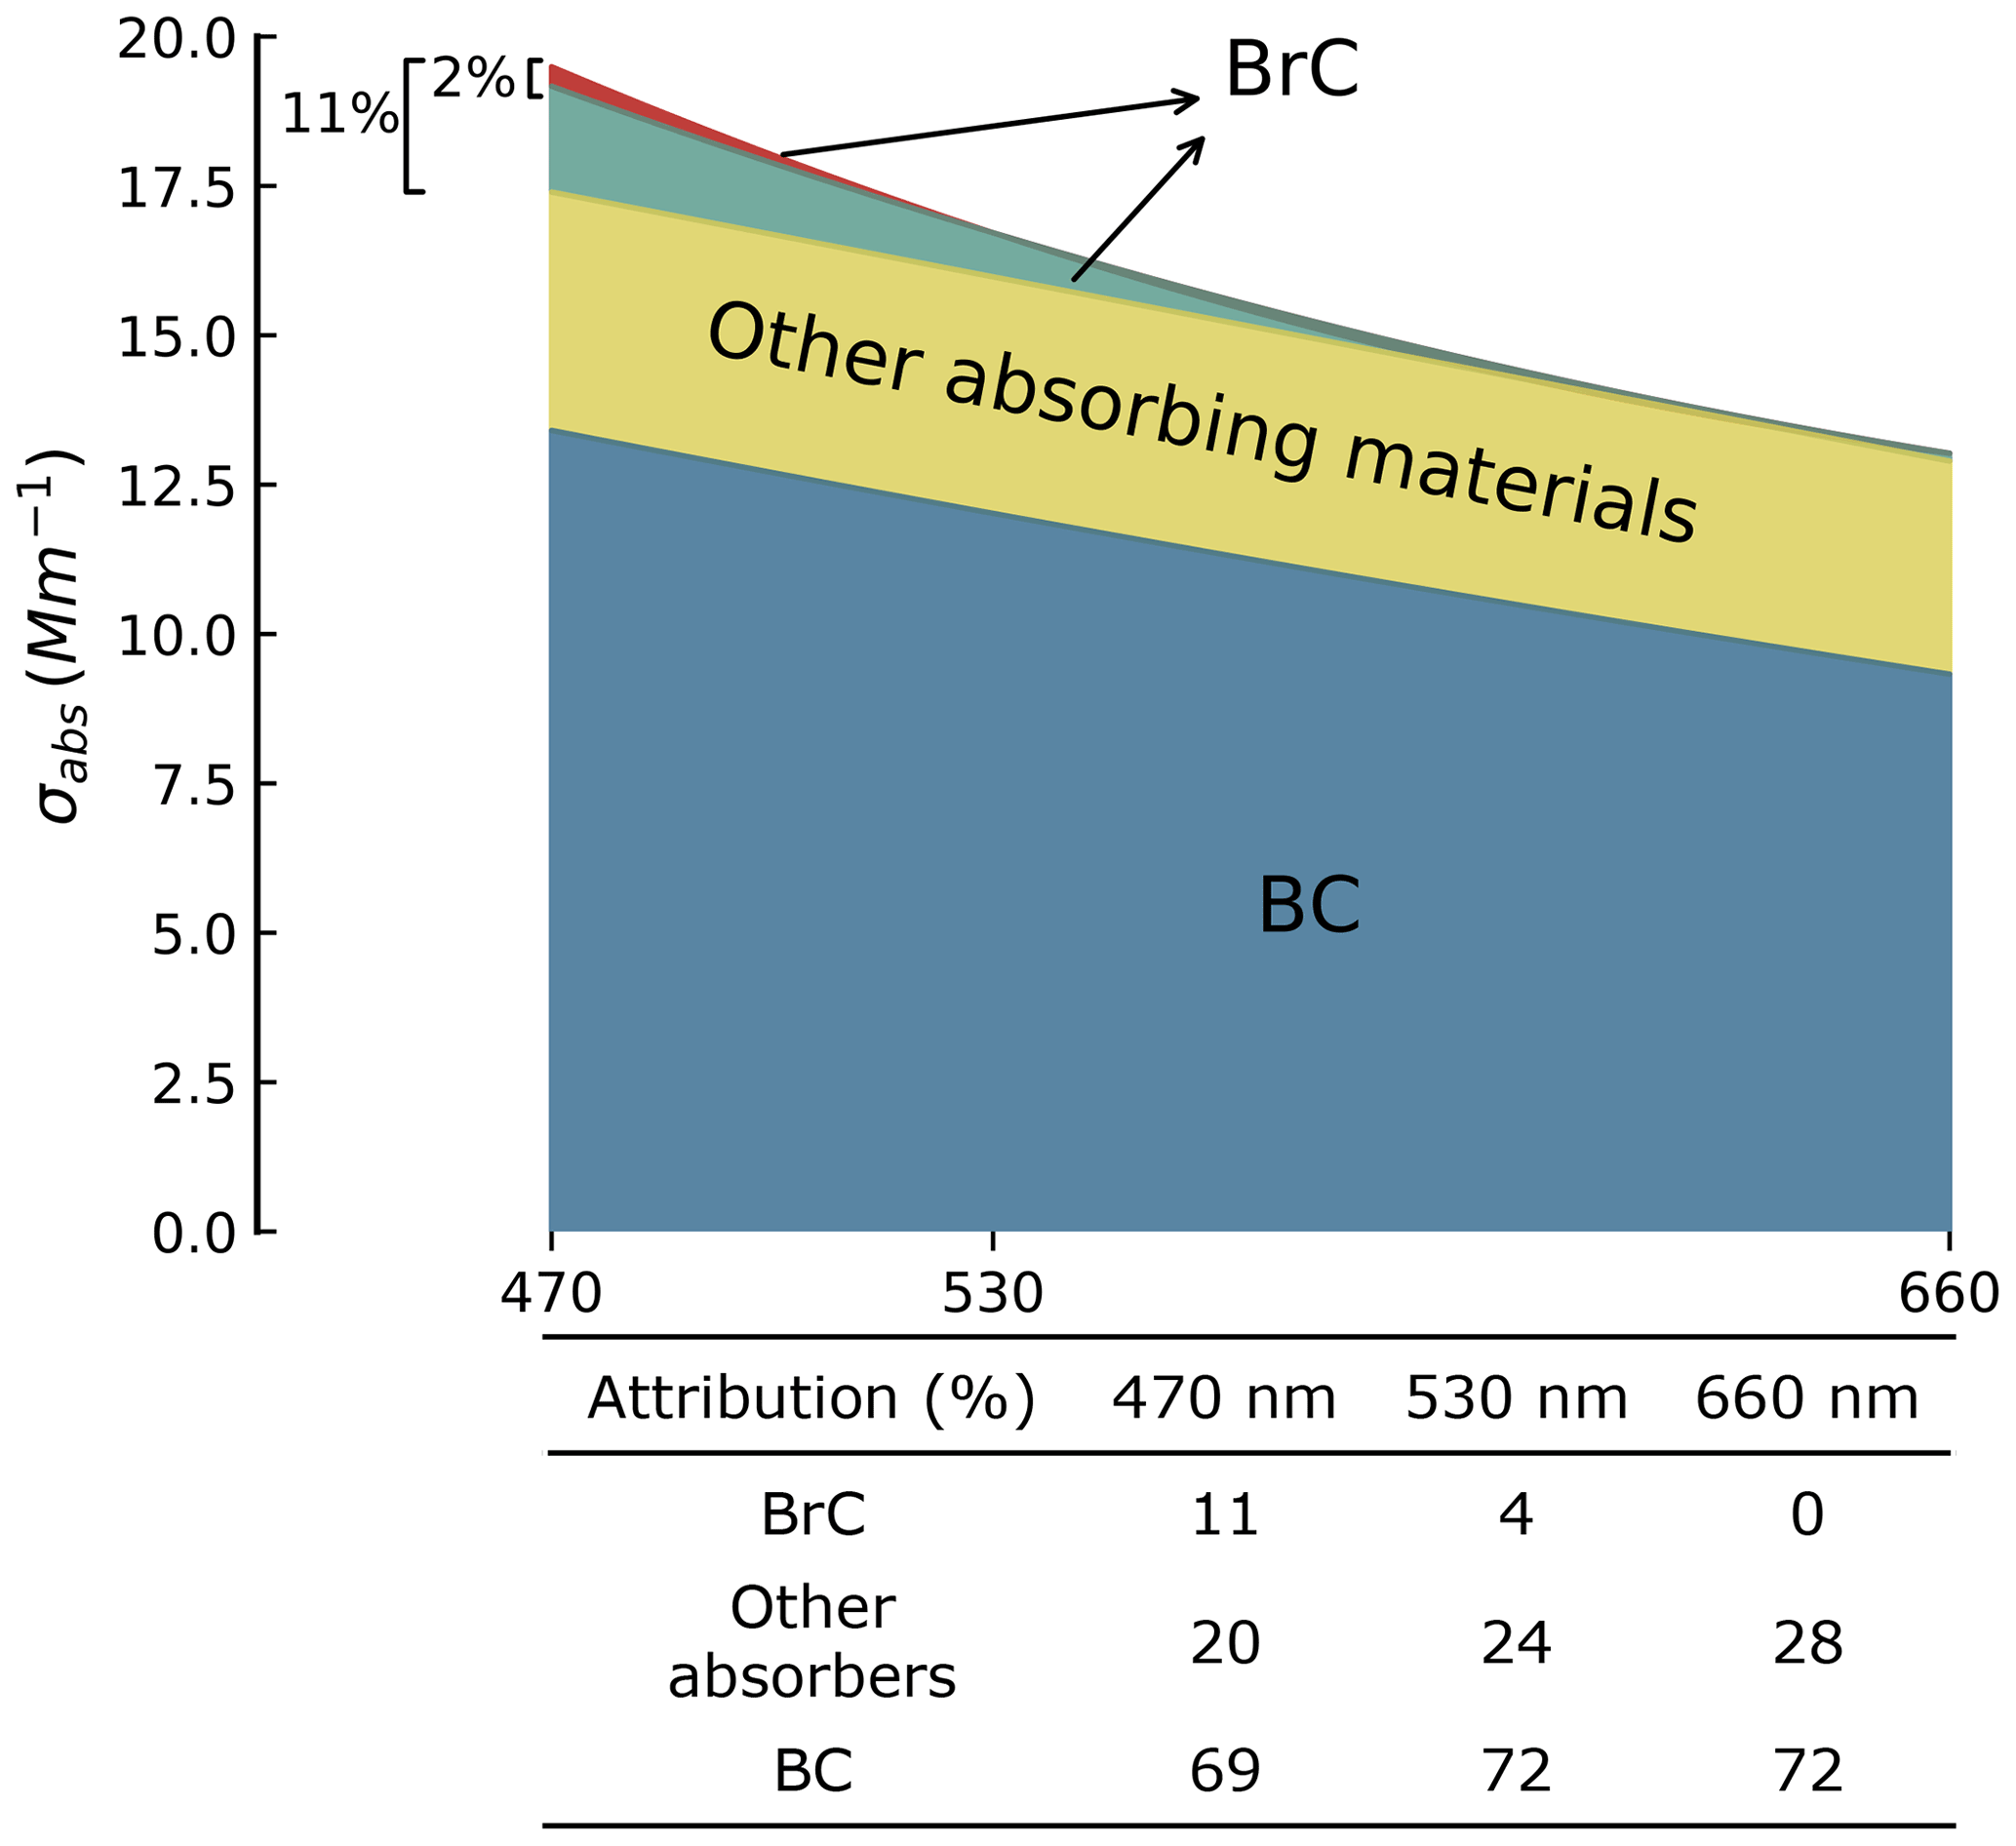
Figure 8Illustration of the attribution of absorption for RF06_1. Blue area represents the absorption of BC, calculated with using BG model. The upper border of the yellow region represents absorption coefficients calculated with corresponding meBC for RF06_1 using BG model assuming non-absorbing OA; the yellow area illustrates the absorption by absorbing components besides BC and BrC, calculated as the difference between the two absorption coefficients calculated by the BG model using meBC and mBC, respectively. The upper border of the red region is drawn with measured absorption coefficients at 470, 530, and 660 nm. The red region stands for the BrC absorption coefficient calculated from the AAE attribution method with Eq. (13). The 2 % and 11 % are the proportions of BrC at 470 nm estimated from the AAE attribution method and our optical closure method, respectively. The table in the lower panel shows the absorption attribution at 470, 530, and 660 nm from the optical closure method. Uncertainties can be found in Table S2 in the Supplement.
3.3 Contribution of BrC to total absorption (RBrC)
The contribution of BrC to the total absorption at 470 nm, RBrC,470, which was calculated using the optical closure method from Eq. (10), is shown in Fig. 7. The uncertainties using various models can be found in Sect. S3. Similar to the results for MACOA,470, the MG, BG, and VM models yield fairly close results for RBrC,470, while those from the CS model are higher, consistent with previous studies (Lesins et al., 2002; Taylor et al., 2020). It is noted that the values of RBrC,470 from MG, BG, and VM models at 470 nm for RF10 are the lowest among all flights, with an average of 3.6±2.6 %. Little confidence is placed on this value because particles with similar age in RF05_3, RF06_1, RF06_2, and RF11 all showed a much higher value of RBrC,470. In addition, Athanasios Nenes et al. (personal communication, 2021) reported the contribution of water-soluble organic carbon (WSOC) to the total absorption at 365 nm of 20 % (Fig. 7) for particles measured at a similar location in the plume 10 min later than RF10, with no distinct changes in either the meteorological conditions or aerosol properties. Therefore, we expect the AAE of BrC at wavelength pair, AAE, derived from and (absorption coefficients of BrC at 365 and 470 nm) to be within the range of ∼2–11 in literature (Laskin et al., 2015). Since is unknown, we calculated by extrapolating the measured to 365 nm with the measured AAE and approximated the AAE with the 20 % of and the from homogeneous models. This method yields an underestimation of AAE, while its value can still reach 18, much higher than the upper limit of the AAE range reported in literature (Laskin et al., 2015), suggesting that the use of homogeneous models for RF10 may not be appropriate. As discussed in Sect. 3.1, the values of RBrC,470 for RF10 from the CS model and RF05_1, RF05_2, RF05_3, RF06_1, RF06_2, and RF11 from homogeneous models are more plausible. Particles of RF05_1 and RF05_2 may contain hematite, in which case their RBrC,470 may be overestimated (Sect. 3.2). Generally, in our study, the RBrC,470 ranges from ∼8 %–22 % at 470 nm (grey zone in Fig. 7), slightly lower than the contribution of 13 %–26 % at 500 nm for relatively fresh OA in the wood smoke from Kirchstetter and Thatcher (2012) and generally comparable to or slightly higher than the result of ∼11 % at 405 nm for highly aged aerosols from CLARIFY 2017, which were sampled downwind of ORACLES, implying the bleaching of BrC during transport (Hems et al., 2021; Che et al., 2022b).
We calculated the contribution of BrC to the total absorption using the AAE attribution method () and compared it with that from our optical closure method (RBrC,470). In the AAE attribution method, the absorption coefficient of BC at the investigated wavelength (470 nm in our case) is determined by extrapolating the absorption coefficient at a longer wavelength (530 nm in our case) with the AAE of BC. For example, in this study, the average AAE at 530/660 wavelength pair (AAE) for all flights is 0.93±0.16, which is just below unity and within the range expected for BC (Liu et al., 2018; Taylor et al., 2020). Thus, we assume that the absorption coefficients at 530 nm () and AAE have no significant contribution from BrC and that the AAE for BC is independent of wavelength. The contribution of BrC to the total absorption, , can then be calculated as below.
, , and represent the measured absorption coefficients at 470, 530, and 660 nm, respectively. is the absorption coefficient calculated from the AAE attribution method at 470 nm. Actually, this assumption is not always true as the AAE varies with both the wavelength and core size and coating thickness of BC particles (Lack and Cappa, 2010; Wang et al., 2016). The results of are shown in Fig. 7, with averages of all flights below 5 %, roughly a factor of 3 smaller than the RBrC,470 from the optical closure approach.
The AAE attribution method is widely used for its simplicity, while there is one caveat that need to be noted when applying this method. The absorption coefficients and AAE, in this case, , , and AAE, should be for BC only, without contributions from other absorbers, such as BrC (Lack and Cappa, 2010). However, it is usually very difficult to completely exclude the impact of these absorbers in the calculation. The homogeneous models are usually reported to overestimate BC absorption (H. Zhang et al., 2015; Fierce et al., 2017b; Taylor et al., 2020) and hence underestimate BrC absorption, while the values of the contribution of BrC determined by the AAE attribution method are even lower than those from the homogeneous methods, which we suspect might be partly attributed to the impact of absorbers besides BC. Therefore, we evaluated the absorption attribution at detected wavelengths by taking RF06_1 as an example. The contribution of BrC derived from the AAE attribution method is 2 % for RF06_1, approximately a factor of 5 smaller than that from the optical closure method with the BG model, 11 % (Figs. 7 and 8). As illustrated in Fig. 8, includes the contribution of BrC, which accounts for 4 % of the total absorption, and that of absorbers beyond BC and BrC, which accounts for 21 %. Note this attribution is based on the BC absorption coefficient calculated from the BG model with , which yields an upper bound of BC absorption (Liu et al., 2021). All calculated parameters are subject to uncertainties as discussed in Sect. S3. If we remove the 4 % BrC from in Eq. (13), the BrC contribution to absorption at 470 nm would increase to 6 %, 2 times larger than 2 %, indicating a substantial impact of BrC on the result of the AAE attribution method, even though the BrC absorption may only exist as a small portion. Thus, we recommend that application of any optical property-based attribution method to use absorption coefficients at the longest possible wavelength to minimize the influence of BrC and, in the meanwhile, to account for potential contributions from other absorbing materials.
We investigated the contribution of BrC to the total absorption of BB aerosols with different models utilizing measurements from ORACLES 2018 field campaign. An effective BC refractive index, , that was constrained by absorption measurements to account for all absorbing components at 660 nm, was introduced in this study. Most of the values derived for keBC were greater than the commonly used kBC values, suggesting contributions from absorbing materials besides BC at 660 nm. TEM-EDX single-particle analysis further suggests that these absorbers might include FeOx that absorbs at long visible wavelengths, i.e. magnetite, as Fe is only present for flights with large values of keBC. RF05_3 yielded the largest values of keBC, approximately 60 %–100 % greater than that of other flights, implying a greater contribution of absorbers besides BC to the total absorption at 660 nm than other flights, which might be due to a larger amount of magnetite in these samples or the result of possible absorbing titanium compounds, which are present on this filter.
As refractive indices of BC and magnetite are generally constant over the range of wavelengths considered, i.e. 470 and 660 nm, we assumed meBC to be independent of wavelength and calculated MACOA and the contribution of BrC to total absorption at 470 nm, RBrC,470, with different models. The values of MACOA.470 and RBrC,470 from the three homogeneous mixing models were fairly close to each other, while those from the CS model were much higher, underscoring the importance of model treatment. The values of MACOA.470 and RBrC,470 from the CS model for RF10 and from homogeneous models for other flights are found to be more plausible, based on the morphology of BC-containing particles from TEM analysis, MR values from SP2, and the contribution of WSOC to the total absorption at 365 nm. The values of RBrC,470 ranged from ∼8 %–22 %, with MACOA.470 varying between 0.30±0.27 and 0.68±0.08 m2 g−1 for the various flights. Values from our results were generally comparable to or slightly higher than the MACOA,470 of 0.31±0.09 m2 g−1 and RBrC of ∼11 % at 405 nm for highly aged aerosols from CLARIFY 2017, which were sampled downwind of ORACLES, while under a much longer wavelength, i.e. 470 nm, implying the bleaching of BrC during transport. High MACOA,470 values of 1.84±0.64 and 2.38±1.89 m2 g−1 were observed for RF05_1 and RF05_2, respectively, which is suspected to be caused by hematite, an abundant FeOx in African dust, which may have mixed with the BC particles in RF05_1 and RF05_2 during the 11 d transport. Measurements of a modified SP2 that can distinguish between hematite and magnetite and obtain FeOx concentrations are highly recommended.
Contribution of BrC to the total absorption obtained from the AAE attribution method, , was calculated and compared to that from our optical closure method. is generally <5 %, approximately a factor of 3 smaller than that from our optical closure method. Absorption attribution using the Bruggeman mixing Mie model suggests a minor BrC contribution of 4 % at 530 nm for RF06_1, and its removal would triple the BrC contribution to the total absorption at 470 nm from 2 % to 6 % obtained using the AAE attribution method, suggesting a substantial impact of BrC to the result of AAE attribution method, even though the BrC may only exist as a small portion. Thus, when applying optical property-based attribution methods, it is recommended to use the absorption coefficient at the longest possible wavelength to minimize the influence of BrC and to account for other absorbers.
Airborne measurements are available via https://doi.org/10.5067/Suborbital/ORACLES/P3/2018_V2 (ORACLES Science Team, 2020).
The supplement related to this article is available online at: https://doi.org/10.5194/acp-22-9199-2022-supplement.
MSR and LZ developed the ideas for the direction of the paper. MSR, AJS, ERL, AD, JPSW, PF, SGH, and AN carried out the airborne measurements. MSR, HC, CD, AJS, ERL, AD, JPSW, SGH, and AN processed the aircraft data. LZ and HC performed the data analysis. LZ prepared the paper with inputs and comments from all co-authors.
At least one of the (co-)authors is a guest member of the editorial board of Atmospheric Chemistry and Physics for the special issue “New observations and related modelling studies of the aerosol-cloud-climate system in the Southeast Atlantic and southern Africa regions”. The peer-review process was guided by an independent editor, and the authors also have no other competing interests to declare.
Publisher's note: Copernicus Publications remains neutral with regard to jurisdictional claims in published maps and institutional affiliations.
This article is part of the special issue “New observations and related modelling studies of the aerosol–cloud–climate system in the Southeast Atlantic and southern Africa regions (ACP/AMT inter-journal SI)”. It is not associated with a conference.
Lu Zhang would like to thank the postdoctoral fellowship funding from Tel Aviv University, Department of Exact Sciences. Michal Segal-Rozenhaimer and Haochi Che were funded by United States Department of Energy (DOE) Atmospheric System Research (ASR) grant DE-SC0020084. Caroline Dang was funded by a NASA postdoctoral fellowship. Arthur J. Sedlacek III and Ernie R. Lewis were funded by the Scientific Focus Area (SFA) Science Plan program that is supported by the Office of Biological and Environmental Research in the Department of Energy, Office of Science, through the United States Department of Energy contract no. DE-SC0012704 to Brookhaven National Laboratory. Paola Formenti is supported by the AErosols, RadiatiOn and CLOuds in southern Africa (AEROCLO-sA) project funded by the French National Research Agency under grant agreement no. ANR-15-CE01-0014-01, the French national programs LEFE/INSU and PNTS, the French National Agency for Space Studies (CNES), the European Union's Seventh Framework Programme (FP7/2014-2018) under EUFAR2 contract no. 312609, and the South African National Research Foundation (NRF) under grant UID 105958. The authors would like to thank the ORACLES team and the two anonymous reviewers for their helpful comments.
This research has been supported by the Tel Aviv University (postdoctoral fellowship); the United States Department of Energy (DOE) Atmospheric System Research (ASR; grant DE-SC0020084); a NASA postdoctoral fellowship; the Scientific Focus Area (SFA) Science Plan program that is supported by the Office of Biological and Environmental Research in the Department of Energy, Office of Science, through the United States Department of Energy (contract no. DE-SC0012704) to Brookhaven National Laboratory; the AErosols, RadiatiOn and CLOuds in southern Africa (AEROCLO-sA) project funded by the French National Research Agency (grant agreement no. ANR-15-CE01-0014-01); the French national programs LEFE/INSU and PNTS; the French National Agency for Space Studies (CNES); the European Union's Seventh Framework Programme (FP7/2014-2018; EUFAR2 contract no. 312609); and the South African National Research Foundation (NRF; grant UID 105958).
This paper was edited by Frank Eckardt and reviewed by two anonymous referees.
Ackerman, T. P. and Toon, O. B.: Absorption of visible radiation in atmosphere containing mixtures of absorbing and nonabsorbing particles, Appl. Optics, 20, 3661–3668, https://doi.org/10.1364/AO.20.003661, 1981.
Adler, G., Wagner, N. L., Lamb, K. D., Manfred, K. M., Schwarz, J. P., Franchin, A., Middlebrook, A. M., Washenfelder, R. A., Womack, C. C., Yokelson, R. J., and Murphy, D. M.: Evidence in biomass burning smoke for a light-absorbing aerosol with properties intermediate between brown and black carbon, Aerosol Sci. Technol., 53, 976–989, https://doi.org/10.1080/02786826.2019.1617832, 2019.
Bond, T. C. and Bergstrom, R. W.: Light Absorption by Carbonaceous Particles: An Investigative Review, Aerosol Sci. Technol., 40, 27–67, https://doi.org/10.1080/02786820500421521, 2006.
Bond, T. C., Habib, G., and Bergstrom, R. W.: Limitations in the enhancement of visible light absorption due to mixing state, J. Geophys. Res.-Atmos., 111, D20211, https://doi.org/10.1029/2006JD007315, 2006.
Bond, T. C., Doherty, S. J., Fahey, D. W., Forster, P. M., Berntsen, T., DeAngelo, B. J., Flanner, M. G., Ghan, S., Kärcher, B., Koch, D., Kinne, S., Kondo, Y., Quinn, P. K., Sarofim, M. C., Schultz, M. G., Schulz, M., Venkataraman, C., Zhang, H., Zhang, S., Bellouin, N., Guttikunda, S. K., Hopke, P. K., Jacobson, M. Z., Kaiser, J. W., Klimont, Z., Lohmann, U., Schwarz, J. P., Shindell, D., Storelvmo, T., Warren, S. G., and Zender, C. S.: Bounding the role of black carbon in the climate system: A scientific assessment, J. Geophys. Res.-Atmos., 118, 5380–5552, https://doi.org/10.1002/jgrd.50171, 2013.
Brown, H., Liu, X., Feng, Y., Jiang, Y., Wu, M., Lu, Z., Wu, C., Murphy, S., and Pokhrel, R.: Radiative effect and climate impacts of brown carbon with the Community Atmosphere Model (CAM5), Atmos. Chem. Phys., 18, 17745–17768, https://doi.org/10.5194/acp-18-17745-2018, 2018.
Chang, H. and Charalampopoulos, T. T.: Determination of the wavelength dependence of refractive indices of flame soot, P. Roy. Soc. A, 430, 577–591, https://doi.org/10.1098/rspa.1990.0107, 1990.
Che, H., Segal-Rozenhaimer, M., Zhang, L., Dang, C., Zuidema, P., Sedlacek III, A. J., Zhang, X., and Flynn, C.: Seasonal variations in fire conditions are important drivers in the trend of aerosol optical properties over the south-eastern Atlantic, Atmos. Chem. Phys., 22, 8767–8785, https://doi.org/10.5194/acp-22-8767-2022, 2022a.
Che, H., Segal-Rozenhaimer, M., Zhang, L., Dang, C., Zuidema, P., Dobracki, A., Sedlacek III, A. J., Coe, H., Wu, H., Taylor, J., Zhang, X., Redemann, J., and Haywood, J.: Cloud processing and weeklong ageing affect biomass burning aerosol properties over the south-eastern Atlantic, Commun. Earth Environ., accepted, 2022b.
Chen, Y. and Bond, T. C.: Light absorption by organic carbon from wood combustion, Atmos. Chem. Phys., 10, 1773–1787, https://doi.org/10.5194/acp-10-1773-2010, 2010.
Chylek, P., Lee, J. E., Romonosky, D. E., Gallo, F., Lou, S., Shrivastava, M., Carrico, C. M., Aiken, A. C., and Dubey, M. K.: Mie Scattering Captures Observed Optical Properties of Ambient Biomass Burning Plumes Assuming Uniform Black, Brown, and Organic Carbon Mixtures, J. Geophys. Res.-Atmos., 124, 11406–11427, https://doi.org/10.1029/2019JD031224, 2019.
Cotterell, M. I., Willoughby, R. E., Bzdek, B. R., Orr-Ewing, A. J., and Reid, J. P.: A complete parameterisation of the relative humidity and wavelength dependence of the refractive index of hygroscopic inorganic aerosol particles, Atmos. Chem. Phys., 17, 9837–9851, https://doi.org/10.5194/acp-17-9837-2017, 2017.
Cui, X., Wang, X., Yang, L., Chen, B., Chen, J., Andersson, A., and Gustafsson, Ö.: Radiative absorption enhancement from coatings on black carbon aerosols, Sci. Total Environ., 551–552, 51–56, https://doi.org/10.1016/j.scitotenv.2016.02.026, 2016.
Dang, C., Segal-Rozenhaimer, M., Che, H., Zhang, L., Formenti, P., Taylor, J., Dobracki, A., Purdue, S., Wong, P.-S., Nenes, A., Sedlacek, A., Coe, H., Redemann, J., Zuidema, P., and Haywood, J.: Biomass burning and marine aerosol processing over the southeast Atlantic Ocean: A TEM single particle analysis, Atmos. Chem. Phys. Discuss. [preprint], https://doi.org/10.5194/acp-2021-724, in review, 2021.
Feng, Y., Ramanathan, V., and Kotamarthi, V. R.: Brown carbon: a significant atmospheric absorber of solar radiation?, Atmos. Chem. Phys., 13, 8607–8621, https://doi.org/10.5194/acp-13-8607-2013, 2013.
Fierce, L., Riemer, N., and Bond, T. C.: Toward Reduced Representation of Mixing State for Simulating Aerosol Effects on Climate, B. Am. Meteorol. Soc., 98, 971–980, https://doi.org/10.1175/BAMS-D-16-0028.1, 2017a.
Fierce, L., Riemer, N., and Bond, T. C.: Toward Reduced Representation of Mixing State for Simulating Aerosol Effects on Climate, B. Am. Meteorol. Soc., 98, 971–980, https://doi.org/10.1175/BAMS-D-16-0028.1, 2017b.
Fierz-Schmidhauser, R., Zieger, P., Gysel, M., Kammermann, L., DeCarlo, P. F., Baltensperger, U., and Weingartner, E.: Measured and predicted aerosol light scattering enhancement factors at the high alpine site Jungfraujoch, Atmos. Chem. Phys., 10, 2319–2333, https://doi.org/10.5194/acp-10-2319-2010, 2010.
Fischer, E. V., Jaffe, D. A., Marley, N. A., Gaffney, J. S., and Marchany-Rivera, A.: Optical properties of aged Asian aerosols observed over the U.S. Pacific Northwest, J. Geophys. Res.-Atmos., 115, D20209, https://doi.org/10.1029/2010JD013943, 2010.
Formenti, P., Caquineau, S., Desboeufs, K., Klaver, A., Chevaillier, S., Journet, E., and Rajot, J. L.: Mapping the physico-chemical properties of mineral dust in western Africa: mineralogical composition, Atmos. Chem. Phys., 14, 10663–10686, https://doi.org/10.5194/acp-14-10663-2014, 2014.
Gao, R. S., Schwarz, J. P., Kelly, K. K., Fahey, D. W., Watts, L. A., Thompson, T. L., Spackman, J. R., Slowik, J. G., Cross, E. S., Han, J.-H., Davidovits, P., Onasch, T. B., and Worsnop, D. R.: A Novel Method for Estimating Light-Scattering Properties of Soot Aerosols Using a Modified Single-Particle Soot Photometer, Aerosol Sci. Technol., 41, 125–135, https://doi.org/10.1080/02786820601118398, 2007.
Go, S., Lyapustin, A., Schuster, G. L., Choi, M., Ginoux, P., Chin, M., Kalashnikova, O., Dubovik, O., Kim, J., da Silva, A., Holben, B., and Reid, J. S.: Inferring iron-oxide species content in atmospheric mineral dust from DSCOVR EPIC observations, Atmos. Chem. Phys., 22, 1395–1423, https://doi.org/10.5194/acp-22-1395-2022, 2022.
Gysel, M., Crosier, J., Topping, D. O., Whitehead, J. D., Bower, K. N., Cubison, M. J., Williams, P. I., Flynn, M. J., McFiggans, G. B., and Coe, H.: Closure study between chemical composition and hygroscopic growth of aerosol particles during TORCH2, Atmos. Chem. Phys., 7, 6131–6144, https://doi.org/10.5194/acp-7-6131-2007, 2007.
Haywood, J. M., Abel, S. J., Barrett, P. A., Bellouin, N., Blyth, A., Bower, K. N., Brooks, M., Carslaw, K., Che, H., Coe, H., Cotterell, M. I., Crawford, I., Cui, Z., Davies, N., Dingley, B., Field, P., Formenti, P., Gordon, H., de Graaf, M., Herbert, R., Johnson, B., Jones, A. C., Langridge, J. M., Malavelle, F., Partridge, D. G., Peers, F., Redemann, J., Stier, P., Szpek, K., Taylor, J. W., Watson-Parris, D., Wood, R., Wu, H., and Zuidema, P.: The CLoud–Aerosol–Radiation Interaction and Forcing: Year 2017 (CLARIFY-2017) measurement campaign, Atmos. Chem. Phys., 21, 1049–1084, https://doi.org/10.5194/acp-21-1049-2021, 2021.
He, C., Takano, Y., Liou, K.-N., Yang, P., Li, Q., and Mackowski, D. W.: Intercomparison of the GOS approach, superposition T-matrix method, and laboratory measurements for black carbon optical properties during aging, J. Quant. Spectrosc. Ra., 184, 287–296, https://doi.org/10.1016/j.jqsrt.2016.08.004, 2016.
Hems, R. F., Schnitzler, E. G., Liu-Kang, C., Cappa, C. D., and Abbatt, J. P. D.: Aging of Atmospheric Brown Carbon Aerosol, ACS Earth Space Chem., 5, 722–748, https://doi.org/10.1021/acsearthspacechem.0c00346, 2021.
Ito, A., Lin, G., and Penner, J. E.: Radiative forcing by light-absorbing aerosols of pyrogenetic iron oxides, Sci. Rep.-UK, 8, 7347, https://doi.org/10.1038/s41598-018-25756-3, 2018.
Jacobson, M. Z.: Investigating cloud absorption effects: Global absorption properties of black carbon, tar balls, and soil dust in clouds and aerosols, J. Geophys. Res.-Atmos., 117, D06205, https://doi.org/10.1029/2011JD017218, 2012.
Jo, D. S., Park, R. J., Lee, S., Kim, S.-W., and Zhang, X.: A global simulation of brown carbon: implications for photochemistry and direct radiative effect, Atmos. Chem. Phys., 16, 3413–3432, https://doi.org/10.5194/acp-16-3413-2016, 2016.
Kahnert, M. and Kanngießer, F.: Modelling optical properties of atmospheric black carbon aerosols, J. Quant. Spectrosc. Ra., 244, 106849, https://doi.org/10.1016/j.jqsrt.2020.106849, 2020.
Kasthuriarachchi, N. Y., Rivellini, L.-H., Adam, M. G., and Lee, A. K. Y.: Light Absorbing Properties of Primary and Secondary Brown Carbon in a Tropical Urban Environment, Environ. Sci. Technol., 54, 10808–10819, https://doi.org/10.1021/acs.est.0c02414, 2020.
Kirchstetter, T. W. and Thatcher, T. L.: Contribution of organic carbon to wood smoke particulate matter absorption of solar radiation, Atmos. Chem. Phys., 12, 6067–6072, https://doi.org/10.5194/acp-12-6067-2012, 2012.
Kuang, Y., He, Y., Xu, W., Zhao, P., Cheng, Y., Zhao, G., Tao, J., Ma, N., Su, H., Zhang, Y., Sun, J., Cheng, P., Yang, W., Zhang, S., Wu, C., Sun, Y., and Zhao, C.: Distinct diurnal variation in organic aerosol hygroscopicity and its relationship with oxygenated organic aerosol, Atmos. Chem. Phys., 20, 865–880, https://doi.org/10.5194/acp-20-865-2020, 2020.
Kurisu, M., Adachi, K., Sakata, K., and Takahashi, Y.: Stable Isotope Ratios of Combustion Iron Produced by Evaporation in a Steel Plant, ACS Earth Space Chem., 3, 588–598, https://doi.org/10.1021/acsearthspacechem.8b00171, 2019.
Laborde, M., Mertes, P., Zieger, P., Dommen, J., Baltensperger, U., and Gysel, M.: Sensitivity of the Single Particle Soot Photometer to different black carbon types, Atmos. Meas. Tech., 5, 1031–1043, https://doi.org/10.5194/amt-5-1031-2012, 2012.
Lack, D. A. and Cappa, C. D.: Impact of brown and clear carbon on light absorption enhancement, single scatter albedo and absorption wavelength dependence of black carbon, Atmos. Chem. Phys., 10, 4207–4220, https://doi.org/10.5194/acp-10-4207-2010, 2010.
Lack, D. A. and Langridge, J. M.: On the attribution of black and brown carbon light absorption using the Ångström exponent, Atmos. Chem. Phys., 13, 10535–10543, https://doi.org/10.5194/acp-13-10535-2013, 2013.
Lack, D. A., Langridge, J. M., Bahreini, R., Cappa, C. D., Middlebrook, A. M., and Schwarz, J. P.: Brown carbon and internal mixing in biomass burning particles, P. Natl. Acad. Sci. USA, 109, 14802–14807, https://doi.org/10.1073/pnas.1206575109, 2012.
Lamb, K. D., Matsui, H., Katich, J. M., Perring, A. E., Spackman, J. R., Weinzierl, B., Dollner, M., and Schwarz, J. P.: Global-scale constraints on light-absorbing anthropogenic iron oxide aerosols, npj Clim. Atmos. Sci., 4, 1–12, https://doi.org/10.1038/s41612-021-00171-0, 2021.
Laskin, A., Laskin, J., and Nizkorodov, S. A.: Chemistry of Atmospheric Brown Carbon, Chem. Rev., 115, 4335–4382, https://doi.org/10.1021/cr5006167, 2015.
Lesins, G., Chylek, P., and Lohmann, U.: A study of internal and external mixing scenarios and its effect on aerosol optical properties and direct radiative forcing, J. Geophys. Res.-Atmos., 107, AAC 5-1–AAC 5-12, https://doi.org/10.1029/2001JD000973, 2002.
Li, C., He, Q., Schade, J., Passig, J., Zimmermann, R., Meidan, D., Laskin, A., and Rudich, Y.: Dynamic changes in optical and chemical properties of tar ball aerosols by atmospheric photochemical aging, Atmos. Chem. Phys., 19, 139–163, https://doi.org/10.5194/acp-19-139-2019, 2019.
Liati, A., Pandurangi, S. S., Boulouchos, K., Schreiber, D., and Arroyo Rojas Dasilva, Y.: Metal nanoparticles in diesel exhaust derived by in-cylinder melting of detached engine fragments, Atmos. Environ., 101, 34–40, https://doi.org/10.1016/j.atmosenv.2014.11.014, 2015.
Lin, P., Bluvshtein, N., Rudich, Y., Nizkorodov, S. A., Laskin, J., and Laskin, A.: Molecular Chemistry of Atmospheric Brown Carbon Inferred from a Nationwide Biomass Burning Event, Environ. Sci. Technol., 51, 11561–11570, https://doi.org/10.1021/acs.est.7b02276, 2017.
Liu, C., Chung, C. E., Yin, Y., and Schnaiter, M.: The absorption Ångström exponent of black carbon: from numerical aspects, Atmos. Chem. Phys., 18, 6259–6273, https://doi.org/10.5194/acp-18-6259-2018, 2018.
Liu, D., Taylor, J. W., Young, D. E., Flynn, M. J., Coe, H., and Allan, J. D.: The effect of complex black carbon microphysics on the determination of the optical properties of brown carbon, Geophys. Res. Lett., 42, 613–619, https://doi.org/10.1002/2014GL062443, 2015.
Liu, D., Whitehead, J., Alfarra, M. R., Reyes-Villegas, E., Spracklen, D. V., Reddington, C. L., Kong, S., Williams, P. I., Ting, Y.-C., Haslett, S., Taylor, J. W., Flynn, M. J., Morgan, W. T., McFiggans, G., Coe, H., and Allan, J. D.: Black-carbon absorption enhancement in the atmosphere determined by particle mixing state, Nat. Geosci., 10, 184–188, https://doi.org/10.1038/ngeo2901, 2017.
Liu, D., Li, S., Hu, D., Kong, S., Cheng, Y., Wu, Y., Ding, S., Hu, K., Zheng, S., Yan, Q., Zheng, H., Zhao, D., Tian, P., Ye, J., Huang, M., and Ding, D.: Evolution of Aerosol Optical Properties from Wood Smoke in Real Atmosphere Influenced by Burning Phase and Solar Radiation, Environ. Sci. Technol., 55, 5677–5688, https://doi.org/10.1021/acs.est.0c07569, 2021.
Liu, J., Bergin, M., Guo, H., King, L., Kotra, N., Edgerton, E., and Weber, R. J.: Size-resolved measurements of brown carbon in water and methanol extracts and estimates of their contribution to ambient fine-particle light absorption, Atmos. Chem. Phys., 13, 12389–12404, https://doi.org/10.5194/acp-13-12389-2013, 2013.
Machemer, S. D.: Characterization of Airborne and Bulk Particulate from Iron and Steel Manufacturing Facilities, Environ. Sci. Technol., 38, 381–389, https://doi.org/10.1021/es020897v, 2004.
Meter, S. L., Formenti, P., Piketh, S. J., Annegarn, H. J., and Kneen, M. A.: PIXE investigation of aerosol composition over the Zambian Copperbelt, Nucl. Instrum. Meth. B, 150, 433–438, https://doi.org/10.1016/S0168-583X(98)01020-9, 1999.
Moise, T., Flores, J. M., and Rudich, Y.: Optical Properties of Secondary Organic Aerosols and Their Changes by Chemical Processes, Chem. Rev., 115, 4400–4439, https://doi.org/10.1021/cr5005259, 2015.
Moteki, N., Kondo, Y., and Nakamura, S.: Method to measure refractive indices of small nonspherical particles: Application to black carbon particles, J. Aerosol Sci., 41, 513–521, https://doi.org/10.1016/j.jaerosci.2010.02.013, 2010.
Moteki, N., Adachi, K., Ohata, S., Yoshida, A., Harigaya, T., Koike, M., and Kondo, Y.: Anthropogenic iron oxide aerosols enhance atmospheric heating, Nat. Commun., 8, 15329, https://doi.org/10.1038/ncomms15329, 2017.
ORACLES Science Team: ORACLES data archive, Moffett Field, CA, NASA Ames Earth Science Project Office (ESPO), https://doi.org/10.5067/Suborbital/ORACLES/P3/2018_V2, 2020.
Palm, K. J., Murray, J. B., Narayan, T. C., and Munday, J. N.: Dynamic optical properties of metal hydrides, ACS Photonics, 5, 4677–4686, https://doi.org/10.1021/acsphotonics.8b01243, 2018.
Peng, J., Hu, M., Guo, S., Du, Z., Zheng, J., Shang, D., Levy Zamora, M., Zeng, L., Shao, M., Wu, Y.-S., Zheng, J., Wang, Y., Glen, C. R., Collins, D. R., Molina, M. J., and Zhang, R.: Markedly enhanced absorption and direct radiative forcing of black carbon under polluted urban environments, P. Natl. Acad. Sci. USA, 113, 4266–4271, https://doi.org/10.1073/pnas.1602310113, 2016.
Pflüger, J. and Fink, J.: Handbook of Optical Constants of Solids, Academic Press, 293–310 pp., https://doi.org/10.1016/B978-012544415-6.50055-8, 1997.
Redemann, J., Wood, R., Zuidema, P., Doherty, S. J., Luna, B., LeBlanc, S. E., Diamond, M. S., Shinozuka, Y., Chang, I. Y., Ueyama, R., Pfister, L., Ryoo, J.-M., Dobracki, A. N., da Silva, A. M., Longo, K. M., Kacenelenbogen, M. S., Flynn, C. J., Pistone, K., Knox, N. M., Piketh, S. J., Haywood, J. M., Formenti, P., Mallet, M., Stier, P., Ackerman, A. S., Bauer, S. E., Fridlind, A. M., Carmichael, G. R., Saide, P. E., Ferrada, G. A., Howell, S. G., Freitag, S., Cairns, B., Holben, B. N., Knobelspiesse, K. D., Tanelli, S., L'Ecuyer, T. S., Dzambo, A. M., Sy, O. O., McFarquhar, G. M., Poellot, M. R., Gupta, S., O'Brien, J. R., Nenes, A., Kacarab, M., Wong, J. P. S., Small-Griswold, J. D., Thornhill, K. L., Noone, D., Podolske, J. R., Schmidt, K. S., Pilewskie, P., Chen, H., Cochrane, S. P., Sedlacek, A. J., Lang, T. J., Stith, E., Segal-Rozenhaimer, M., Ferrare, R. A., Burton, S. P., Hostetler, C. A., Diner, D. J., Seidel, F. C., Platnick, S. E., Myers, J. S., Meyer, K. G., Spangenberg, D. A., Maring, H., and Gao, L.: An overview of the ORACLES (ObseRvations of Aerosols above CLouds and their intEractionS) project: aerosol–cloud–radiation interactions in the southeast Atlantic basin, Atmos. Chem. Phys., 21, 1507–1563, https://doi.org/10.5194/acp-21-1507-2021, 2021.
Saleh, R., Hennigan, C. J., McMeeking, G. R., Chuang, W. K., Robinson, E. S., Coe, H., Donahue, N. M., and Robinson, A. L.: Absorptivity of brown carbon in fresh and photo-chemically aged biomass-burning emissions, Atmos. Chem. Phys., 13, 7683–7693, https://doi.org/10.5194/acp-13-7683-2013, 2013.
Saleh, R., Robinson, E. S., Tkacik, D. S., Ahern, A. T., Liu, S., Aiken, A. C., Sullivan, R. C., Presto, A. A., Dubey, M. K., Yokelson, R. J., Donahue, N. M., and Robinson, A. L.: Brownness of organics in aerosols from biomass burning linked to their black carbon content, Nat. Geosci., 7, 647–650, https://doi.org/10.1038/ngeo2220, 2014.
Saleh, R., Marks, M., Heo, J., Adams, P. J., Donahue, N. M., and Robinson, A. L.: Contribution of brown carbon and lensing to the direct radiative effect of carbonaceous aerosols from biomass and biofuel burning emissions, J. Geophys. Res.-Atmos., 120, 10285–10296, https://doi.org/10.1002/2015JD023697, 2015.
Scarnato, B. V., Vahidinia, S., Richard, D. T., and Kirchstetter, T. W.: Effects of internal mixing and aggregate morphology on optical properties of black carbon using a discrete dipole approximation model, Atmos. Chem. Phys., 13, 5089–5101, https://doi.org/10.5194/acp-13-5089-2013, 2013.
Schwarz, J. P., Gao, R. S., Fahey, D. W., Thomson, D. S., Watts, L. A., Wilson, J. C., Reeves, J. M., Darbeheshti, M., Baumgardner, D. G., Kok, G. L., Chung, S. H., Schulz, M., Hendricks, J., Lauer, A., Kärcher, B., Slowik, J. G., Rosenlof, K. H., Thompson, T. L., Langford, A. O., Loewenstein, M., and Aikin, K. C.: Single-particle measurements of midlatitude black carbon and light-scattering aerosols from the boundary layer to the lower stratosphere, J. Geophys. Res.-Atmos., 111, D16207, https://doi.org/10.1029/2006JD007076, 2006.
Sedlacek III, A. J., Buseck, P. R., Adachi, K., Onasch, T. B., Springston, S. R., and Kleinman, L.: Formation and evolution of tar balls from northwestern US wildfires, Atmos. Chem. Phys., 18, 11289–11301, https://doi.org/10.5194/acp-18-11289-2018, 2018.
Shengo, M. L., Kime, M.-B., Mambwe, M. P., and Nyembo, T. K.: A review of the beneficiation of copper-cobalt-bearing minerals in the Democratic Republic of Congo, J. Sustain. Min., 18, 226–246, https://doi.org/10.1016/j.jsm.2019.08.001, 2019.
Sikamo, J., Mwanza, A., and Mweemba, C.: Copper mining in Zambia – history and future, J. South. Afr. Inst. Min. Metall., 116, 491–496, https://doi.org/10.17159/2411-9717/2016/v116n6a1, 2016.
Sumlin, B. J., Heinson, W. R., and Chakrabarty, R. K.: Retrieving the aerosol complex refractive index using PyMieScatt: A Mie computational package with visualization capabilities, J. Quant. Spectrosc. Ra., 205, 127–134, https://doi.org/10.1016/j.jqsrt.2017.10.012, 2018.
Szopa, S., Naik, V., Adhikary, B., Artaxo, P., Berntsen, T., Collins, W. D., Fuzzi, S., Gallardo, L., Kiendler-Scharr, A., Klimont, Z., Liao, H., Unger, N., and Zanis, P.: Short-Lived Climate Forcers, in: Climate Change 2021: The Physical Science Basis. Contribution of Working Group I to the Sixth Assessment Report of the Intergovernmental Panel on Climate Change, Cambridge University Press, Cambridge, United Kingdom and New York, NY, USA, 817–922, https://doi.org/10.1017/9781009157896.008, 2021.
Taylor, J. W., Wu, H., Szpek, K., Bower, K., Crawford, I., Flynn, M. J., Williams, P. I., Dorsey, J., Langridge, J. M., Cotterell, M. I., Fox, C., Davies, N. W., Haywood, J. M., and Coe, H.: Absorption closure in highly aged biomass burning smoke, Atmos. Chem. Phys., 20, 11201–11221, https://doi.org/10.5194/acp-20-11201-2020, 2020.
Thompson, G. and Eidhammer, T.: A Study of Aerosol Impacts on Clouds and Precipitation Development in a Large Winter Cyclone, J. Atmos. Sci., 71, 3636–3658, https://doi.org/10.1175/JAS-D-13-0305.1, 2014.
Till, J. L., Guyodo, Y., Lagroix, F., Morin, G., and Ona-Nguema, G.: Goethite as a potential source of magnetic nanoparticles in sediments, Geology, 43, 75–78, https://doi.org/10.1130/G36186.1, 2015.
van der Werf, G. R., Randerson, J. T., Giglio, L., Collatz, G. J., Mu, M., Kasibhatla, P. S., Morton, D. C., DeFries, R. S., Jin, Y., and van Leeuwen, T. T.: Global fire emissions and the contribution of deforestation, savanna, forest, agricultural, and peat fires (1997–2009), Atmos. Chem. Phys., 10, 11707–11735, https://doi.org/10.5194/acp-10-11707-2010, 2010.
Virkkula, A.: Correction of the Calibration of the 3-wavelength Particle Soot Absorption Photometer (3ë PSAP), Aerosol Sci. Technol., 44, 706–712, https://doi.org/10.1080/02786826.2010.482110, 2010.
Vítková, M., Ettler, V., Johan, Z., Køíbek, B., Šebek, O., and Mihaljeviè, M.: Primary and secondary phases in copper-cobalt smelting slags from the Copperbelt Province, Zambia, Mineral. Mag., 74, 581–600, https://doi.org/10.1180/minmag.2010.074.4.581, 2010.
Wang, J., Nie, W., Cheng, Y., Shen, Y., Chi, X., Wang, J., Huang, X., Xie, Y., Sun, P., Xu, Z., Qi, X., Su, H., and Ding, A.: Light absorption of brown carbon in eastern China based on 3-year multi-wavelength aerosol optical property observations and an improved absorption Ångström exponent segregation method, Atmos. Chem. Phys., 18, 9061–9074, https://doi.org/10.5194/acp-18-9061-2018, 2018.
Wang, L., Li, Z., Tian, Q., Ma, Y., Zhang, F., Zhang, Y., Li, D., Li, K., and Li, L.: Estimate of aerosol absorbing components of black carbon, brown carbon, and dust from ground-based remote sensing data of sun-sky radiometers, J. Geophys. Res.-Atmos., 118, 6534–6543, https://doi.org/10.1002/jgrd.50356, 2013.
Wang, X., Heald, C. L., Sedlacek, A. J., de Sá, S. S., Martin, S. T., Alexander, M. L., Watson, T. B., Aiken, A. C., Springston, S. R., and Artaxo, P.: Deriving brown carbon from multiwavelength absorption measurements: method and application to AERONET and Aethalometer observations, Atmos. Chem. Phys., 16, 12733–12752, https://doi.org/10.5194/acp-16-12733-2016, 2016.
Wang, X., Heald, C. L., Liu, J., Weber, R. J., Campuzano-Jost, P., Jimenez, J. L., Schwarz, J. P., and Perring, A. E.: Exploring the observational constraints on the simulation of brown carbon, Atmos. Chem. Phys., 18, 635–653, https://doi.org/10.5194/acp-18-635-2018, 2018
Wong, J. P. S., Tsagkaraki, M., Tsiodra, I., Mihalopoulos, N., Violaki, K., Kanakidou, M., Sciare, J., Nenes, A., and Weber, R. J.: Atmospheric evolution of molecular-weight-separated brown carbon from biomass burning, Atmos. Chem. Phys., 19, 7319–7334, https://doi.org/10.5194/acp-19-7319-2019, 2019.
Yoshida, A., Moteki, N., Ohata, S., Mori, T., Tada, R., Dagsson-Waldhauserová, P., and Kondo, Y.: Detection of light-absorbing iron oxide particles using a modified single-particle soot photometer, Aerosol Sci. Technol., 50, 1–4, https://doi.org/10.1080/02786826.2016.1146402, 2016.
Zhang, H., Zhou, C., Wang, Z., Zhao, S., and Li, J.: The influence of different black carbon and sulfate mixing methods on their optical and radiative properties, J. Quant. Spectrosc. Ra., 161, 105–116, https://doi.org/10.1016/j.jqsrt.2015.04.002, 2015.
Zhang, X. L., Wu, G. J., Zhang, C. L., Xu, T. L., and Zhou, Q. Q.: What is the real role of iron oxides in the optical properties of dust aerosols?, Atmos. Chem. Phys., 15, 12159–12177, https://doi.org/10.5194/acp-15-12159-2015, 2015.