the Creative Commons Attribution 4.0 License.
the Creative Commons Attribution 4.0 License.
 | 14 Jul 2022
Estimation of surface ammonia concentrations and emissions in China from the polar-orbiting Infrared Atmospheric Sounding Interferometer and the FY-4A Geostationary Interferometric Infrared Sounder
Pu Liu
Jia Ding
Lei Liu
Xuejun Liu
Ammonia (NH3) is the most important alkaline gas in the atmosphere, which has negative effects on biodiversity, ecosystems, soil acidification and human health. China has the largest NH3 emissions globally, mainly associated with agricultural sources including nitrogen fertilizer and livestock. However, there is still a limited number of ground monitoring sites in China, hindering our understanding of both surface NH3 concentrations and emissions. In this study, using the polar-orbiting satellite (Infrared Atmospheric Sounding Interferometer – IASI) and Fengyun-4A Geostationary Interferometric Infrared Sounder (GIIRS), we analyzed the changes in hourly NH3 concentrations and estimated surface NH3 concentrations and NH3 emissions in China. GIIRS-derived NH3 concentrations in the daytime were generally higher than those at night, with high values during 10:00–16:00 local time. Satellite-derived surface NH3 concentrations were generally consistent with the ground observations, with R-square at 0.72 and slope equal to 1.03. Satellite-based NH3 emissions ranged from 12.17 to 17.77 Tg N yr−1 during 2008–2019. Spatially, high values of NH3 emissions mainly occurred in the North China Plain, Northeast China and the Sichuan Basin, while low values were mainly distributed in West China (Qinghai–Tibet Plateau). Our study shows a high predictive power of using satellite data to estimate surface NH3 concentrations and NH3 emissions over multiple temporal and spatial scales, which provides an important reference for understanding NH3 changes over China.
- Article
(9709 KB) - Full-text XML
- Companion paper
-
Supplement
(1355 KB) - BibTeX
- EndNote


Ammonia (NH3) is a highly active gas in the atmosphere and the most important alkaline gas, playing an important role in atmospheric chemistry (Fowler et al., 2013). NH3 reacts with acid pollutants (SO2 and NOx) to form fine particulate matter, such as PM2.5, leading to haze pollution. In addition, the deposition of NH3 and NH could also cause environmental problems such as water eutrophication, biodiversity loss and soil acidification (Paerl et al., 2014). China has become a major region for NH3 emissions globally because of rapid growth of population and agricultural production (Zhang et al., 2017; Liu et al., 2022). To provide a scientific basis for dealing with NH3 pollution, it is urgent to accurately estimate both surface NH3 concentrations and emissions in China.
Surface NH3 concentrations can be estimated by ground measurements and model simulations. Ground measurements are considered to be the most accurate quantitative method. Current national NH3 observation networks in China include the National Nitrogen Deposition Monitoring Network (NNDMN) established by China Agricultural University (Xu et al., 2015) and the Ammonia Monitoring Network (AMoN-China) established based on the Chinese Ecosystem Research Network (CERN) (Pan et al., 2018). The NNDMN can measure ground NH3 concentrations since 2010, while AMoN-China only makes the measurements in 2015–2016. The above two monitoring networks both monitor surface NH3 concentrations on a monthly basis and lack monitoring of the hourly NH3 changes. Some studies have conducted research on the intra-day/hourly changes in NH3 concentrations based on ground observations. Werner et al. (2017) measured hourly NH3 concentration in 2012 at the Harwell site in the UK and found that high NH3 concentration usually occurred in the afternoon. Similarly, Kutzner et al. (2021) observed the hourly NH3 concentration at the SIRTA Observatory in Paris and found that NH3 concentration was highest in the late afternoon. Pandolfi et al. (2012) studied the day–night cycle of NH3 concentration at the two stations in Barcelona in summer and found that the NH3 concentration was highly associated with local meteorology and traffic emissions. However, there is still a limited number of monitoring sites on the hourly NH3 changes in China.
Agricultural fertilizer and livestock production have led to a large amount of NH3 emissions. China's cultivated land area accounts for less than 10 % of the world, but it consumes about 30 % of the world's nitrogen (N) fertilizer (Peng et al., 2002). Estimation of NH3 emissions is mainly based on a bottom-up method using NH3 source statistics (fertilization, animal husbandry, etc.) and emission factors. Zhou et al. (2016) calculated the annual farmland NH3 emission (3.96 ± 0.76 Tg N yr−1) over China in 2008 based on the bottom-up method, which was 40 % higher than the emission in the Intergovernmental Panel on Climate Change (IPCC) Tier-1 guidelines (2.89 Tg N yr−1). Zhang et al. (2017) reassessed China's NH3 emissions based on the mass balance method and found that NH3 emissions increased from 12.1 ± 0.8 in 2000 to 15.6 ± 0.9 Tg N yr−1 in 2015, with an annual growth rate of 1.9 %. Fu et al. (2020) estimated that China's NH3 emissions increased from 4.7 in 1980 to 11 Tg N yr−1 in 2016. Although many studies regarding NH3 emissions have been carried out in China, great uncertainties and large ranges (7–16 Tg N yr−1) still existed in the estimates of China's NH3 emissions (Dong et al., 2010; Huang et al., 2012; Kang et al., 2016).
Besides the bottom-up estimates, some studies used data assimilation methods by ground monitoring data to constrain NH3 emission estimates. Paulot et al. (2014) assimilated GEOS-Chem with ground observations of wet reactive Nitrogen (Nr) deposition and estimated China's NH3 emission as 8.4 Tg N yr−1 in 2008, with seasonal NH3 emission peaking in summer. Gilliland et al. (2003) used the data assimilation method by the Community Multiscale Air Quality (CMAQ) with the wet NH concentration data from the USA National Atmospheric Deposition Program Network and found that obvious seasonal differences appeared in NH3 emissions linked to N fertilizer and temperature. Kong et al. (2019) carried out inversion by assimilating surface AMoN NH3 observation data and improved the accuracy of temporal and spatial patterns of NH3 emissions in China.
In recent years, atmospheric remote sensing has developed rapidly, which can monitor NH3 at a global scale, including the polar-orbiting satellite instruments such as the Tropospheric Emission Spectrometer (TES), Infrared Atmospheric Sounding Interferometer (IASI), Cross-track Infrared Sounder (CrIS), Atmospheric Infrared Sounder (AIRS), and Greenhouse Gases Observing Satellite (GOSAT) (Someya et al., 2020). Many studies have reported the effectiveness of using satellite data to study NH3 dynamics. Pinder et al. (2011) found that TES observation can capture spatial–temporal NH3 patterns compared with surface measurement. Van Damme et al. (2014) studied the seasonal and annual NH3 changes in the Northern Hemisphere and Southern Hemisphere using the IASI NH3 column data and found that the seasonality in the Southern Hemisphere is mainly related to biomass burning. Shephard and Cady-Pereira (2015) developed the CrIS NH3 inversion algorithms and found that CrIS can capture the global spatial distribution of NH3 concentration. Warner et al. (2016) identified the main hotspots of agricultural NH3 regions using AIRS, such as South Asia, China, the United States and some parts of Europe, and found that NH3 concentrations had increased in these agricultural regions since 2003. In addition, some studies also used the satellite measurements to improve the estimates of NH3 emissions. Zhang et al. (2017) developed a top-down inversion method using TES NH3 observation to quantify China's NH3 emission and obtained annual NH3 emission as 11.7 Tg N yr−1 in 2008. Marais et al. (2021) estimated NH3 emissions in the UK based on the IASI and CrIS and found that the relative errors of IASI-derived NH3 emissions were 11 %–36 % and 9 %–27 %, respectively. Van Damme et al. (2018) used the high-resolution IASI NH3 maps to identify, classify and quantify NH3 emission hotspots in the world, which was helpful for understanding the human point NH3 sources. Dammers et al. (2019) identified global 249 NH3 emission point sources based on CrIS, whose total emission was about 2.5 times higher than that reported in the HTAPv2 emissions.
Besides the polar-orbiting satellite, China's Geostationary Interferometric Infrared Sounder (GIIRS) on board the Chinese FY-4A satellite can measure hourly changes in atmospheric NH3 in almost all of Asia per day, which provides great potential to study the diel cycle of NH3. In this study, GIIRS is used to study the NH3 diel cycle (hourly changes), which is essential for understanding the differences between different times in a day by the polar-orbiting satellites (such as the IASI at 09:30 and CrIS at 13:30). Second, the surface NH3 concentration in China is estimated based on both GIIRS and IASI, which is then compared with the NNDMN. Third, NH3 emission in China is calculated based on satellite-derived surface NH3 concentration and the feedback relationship between surface NH3 concentration and emission by a chemistry transport model (GEOS-Chem). Finally, the spatial–temporal characteristics of satellite-derived surface NH3 concentration and emission are analyzed, and the uncertainties are discussed.
2.1 Satellite GIIRS NH3
The Geostationary Interferometric Infrared Sounder (GIIRS) on board the Fengyun-4A geostationary satellite (FY-4A) launched by China in 2016 is the world's first hyperspectral atmospheric infrared sounder (Cai et al., 2020). The FY-4A GIIRS-detected spectral range is 700–2250 cm−1, including 1648 spectral channels and 14 radiation-imaging channels, covering visible light, shortwave, medium and longwave infrared bands. The spatial resolutions of the detector are 2.0 km in the visible bands and 16 km in the infrared bands. It covers almost the whole of Asia and scans 10 times a day (Zhang et al., 2019). The GIIRS can detect the temperature and humidity profiles and trace gases at high frequencies.
NH3 has two large absorption characteristics in the longwave infrared (about 930 and 965 cm−1). The contribution of NH3 to the brightness temperature of these two bands is between 2 and 4 K. The core of inversion algorithms is based on the so-called hyperspectral radiation index (HRI), which quantifies the spectral characteristics of NH3. The HRI depends on whether the satellite instrument detects the presence of NH3. The average value of the HRI is 0 with a standard deviation of 1, and the HRI range is . The algorithm for estimating IASI NH3 column concentration is to convert the HRI into a column using the so-called neural network (Clarisse et al., 2021).
In this study, we use hourly NH3 concentrations during 2019–2020 (from November 2019 to October 2020) to study the NH3 diel cycle with a resolution of 0.5∘. The original data are in Hierarchical Data Format Version 5 (HDF5), and the unit of NH3 is molec. cm−2. The data are processed with MATLAB software. First, observations with considerable uncertainties (relative error exceeds 50 %) and high clouds (cloud cover exceeds 20 %) are removed (Fig. S1a in the Supplement). Secondly, the world standard time (UTC) by GIIRS is converted to local time (LT).
2.2 Satellite IASI NH3
The IASI instrument is on board the polar solar-synchronous Metop-A platform. It has been running stably since 2006 to measure the infrared radiation emitted by the Earth (Van Damme et al., 2014). IASI can measure the infrared radiation emitted by the Earth's surface and atmosphere in the spectral range of 645–2760 cm−1. It can observe the world twice a day and cross the Equator at 09:30 and 21:30 local time, with a spatial resolution of 12 km at nadir. However, only daytime satellite measurements are used, because nighttime measurements usually have greater uncertainties related to thermal contrasts (Van Damme et al., 2017).
The near-real-time dataset of the total NH3 column (built by artificial neural network for IASI, ANNI; ANNI-NH3-v3) was used here. The properties of IASI NH3 data include NH3 column concentration, longitude, latitude, measurement time, cloud cover, uncertainty, solar zenith angle and other parameters. The daily NH3 column from 2008 to 2019 was used. The format of the original data is the Network Common Data Format, and the unit is mol m−2. The observation data with cloud cover larger than 20 % and the uncertainty above 50 % were removed (Fig. S1b). We gridded the data to 0.1∘ by using the arithmetic average methods.
2.3 Ground NH3 measurements
Surface NH3 concentrations in the NNDMN were used to compare with the satellite estimates including 43 observation stations. The land types of the NNDMN sites cover cities, farmland, coastal areas, forests and grasslands. Measurements during the period from January 2010 to December 2015 by the NNDMN were used. Surface NH3 concentrations were measured using an active DELTA (DEnuder for Long-Term Atmospheric sampling) (Flechard et al., 2011). For the hourly measurements, we collected the data from the published papers, including five sites (Table S1 in the Supplement), Xianghe (39.75∘ N, 116.96∘ E; December 2017–February 2018) (He et al., 2020), Fudan University (31.30∘ N, 121.50∘ E; 1 July 2013–30 September 2014) (Wang et al., 2015), Dianshan Lake (31.09∘ N, 120.98∘ E; 1 July 2013–30 June 2014) (Wang et al., 2015), Jinshan Chemical Industry Park (30.73∘ N, 121.27∘ E; 6 January–30 June 2014) (Wang et al., 2015) and Gucheng (39.15∘ N, 115.73∘ E; March 2016–May 2017) (Kuang et al., 2020). The Xianghe site in Hebei Province and the Dianshan Lake site in Shanghai represent rural environments. Jinshan Chemical Industry Park represents industrial environments. The Gucheng site in Hebei and the Fudan University site in Shanghai represent urban environments.
2.4 GEOS-Chem
The GEOS-Chem model version 12.3.0 is a three-dimensional chemistry transport model developed by Harvard University, which has been widely used in the field of atmospheric studies (Eastham et al., 2014). The nested regional model in Asia was used in this study driven by assimilated GEOS-5 meteorological data at a horizontal resolution of ∘ × ∘. Dry deposition calculation in GEOS-Chem follows a standard resistance-in-series model (Wesely, 2007), while wet deposition includes both convective updraft and large-scale precipitation scavenging (Jacob, 1999). The GEOS-Chem model here does not consider land–atmosphere bidirectional NH3 exchange, and the NH3 flux was parameterized as uncoupled emission and dry deposition processes. Anthropogenic emissions over China were from the Regional Emission in Asia (REAS-v2) inventory. The GEOS-Chem outputs of NH3 concentrations include 47 layers from the ground to the top of the atmosphere, which were used to capture NH3 vertical profiles. The feedback between surface NH3 concentration and emissions was also calculated by GEOS-Chem.
2.5 Satellite-based surface NH3 estimates and emissions
Surface NH3 concentrations were estimated using the satellite NH3 columns as well as NH3 vertical profiles. To gain the continuous vertical NH3 profile, the Gaussian function was used to fit the 47 layers' NH3 concentrations. A three-parameter Gaussian function was used to fit NH3 vertical profiles at each grid box from GEOS-Chem according to previous studies (Liu et al., 2019).
where Z is the height of a layer in an atmospheric chemical transport model (ACTM); ρmax, Z0 and σ are the maximum of NH3 concentration, the corresponding height with the maximum of NH3 concentration and the thickness of the NH3 concentration layer (1 standard error of the Gaussian function).
The satellite-derived NH3 concentration at the height of hG can be calculated as
where represents the ratio of NH3 concentration at the height of hG to total columns (, Strop represents satellite-derived NH3 columns, and is the ratio of average surface NH3 concentration () to that at satellite overpass time () by an ACTM.
The mass balance method (Lamsal et al., 2011; Geddes and Martin, 2017; Cooper et al., 2017) was used to exploit the feedback ratio of surface NH3 concentrations and NH3 emissions (Marais et al., 2021):
where Es is satellite-based NH3 emissions, is satellite-derived surface NH3 concentrations and is the ratio of surface NH3 concentrations and NH3 emissions simulated by GEOS-Chem.
3.1 GIIRS-based hourly NH3 concentrations during 2019–2020
Figure 1 shows the hourly NH3 concentrations observed from GIIRS during 2019–2020. Daytime NH3 columns were significantly higher than those at night. The intra-day hourly NH3 columns showed an overall increase first and then a decrease, with high values during 10:00–16:00. The increase in temperature enhanced the volatilization of NH3, which may explain high values of NH3 concentrations during the daytime.

Figure 1Monthly average NH3 concentrations for each of the 10 GIIRS overpass time periods during 2019–2020.
Ground-based measurements of hourly NH3 concentrations are very lacking, and the timespan may be different from GIIRS measurements. Here we only used them to show the hourly patterns of NH3 concentrations (Fig. 2). The Xianghe site in Hebei Province and Dianshan Lake site in Shanghai represent rural environments. Jinshan Chemical Industry Park represents industrial environments. The Gucheng site in Hebei and the Fudan University site in Shanghai represent urban environments.
NH3 concentration in the rural environment basically shows a normal distribution, and high NH3 concentration generally appears between 09:00 and 16:00, which may be related to agricultural activities and temperature. In the industrial environment (Jinshan Chemical Industry Park, JSP), NH3 concentration fluctuates irregularly, and two peaks appear at 18:00–23:00 and 06:00–08:00, while NH3 concentration tends to be stable at other times. In the urban environment, the changes in NH3 concentration by satellite at the Gucheng site are consistent with ground monitoring, showing a clear peak around 09:00–14:00. NH3 concentration at the Fudan University site gradually decreases from the morning peak to the afternoon. The evaporation of dew may drive the NH3 increase from the morning to the noon (Wang et al., 2015). NH3 concentration by ground monitoring in cities (Gucheng and Fudan University) has double peaks between 08:00–11:00 and 18:00–22:00, which may also be related to traffic emissions. In summary, except for industrial sites, hourly NH3 in China has a large variability between day and night, and the hourly NH3 patterns are affected by many factors, of which anthropogenic emissions and temperature seem to be the most important drivers.
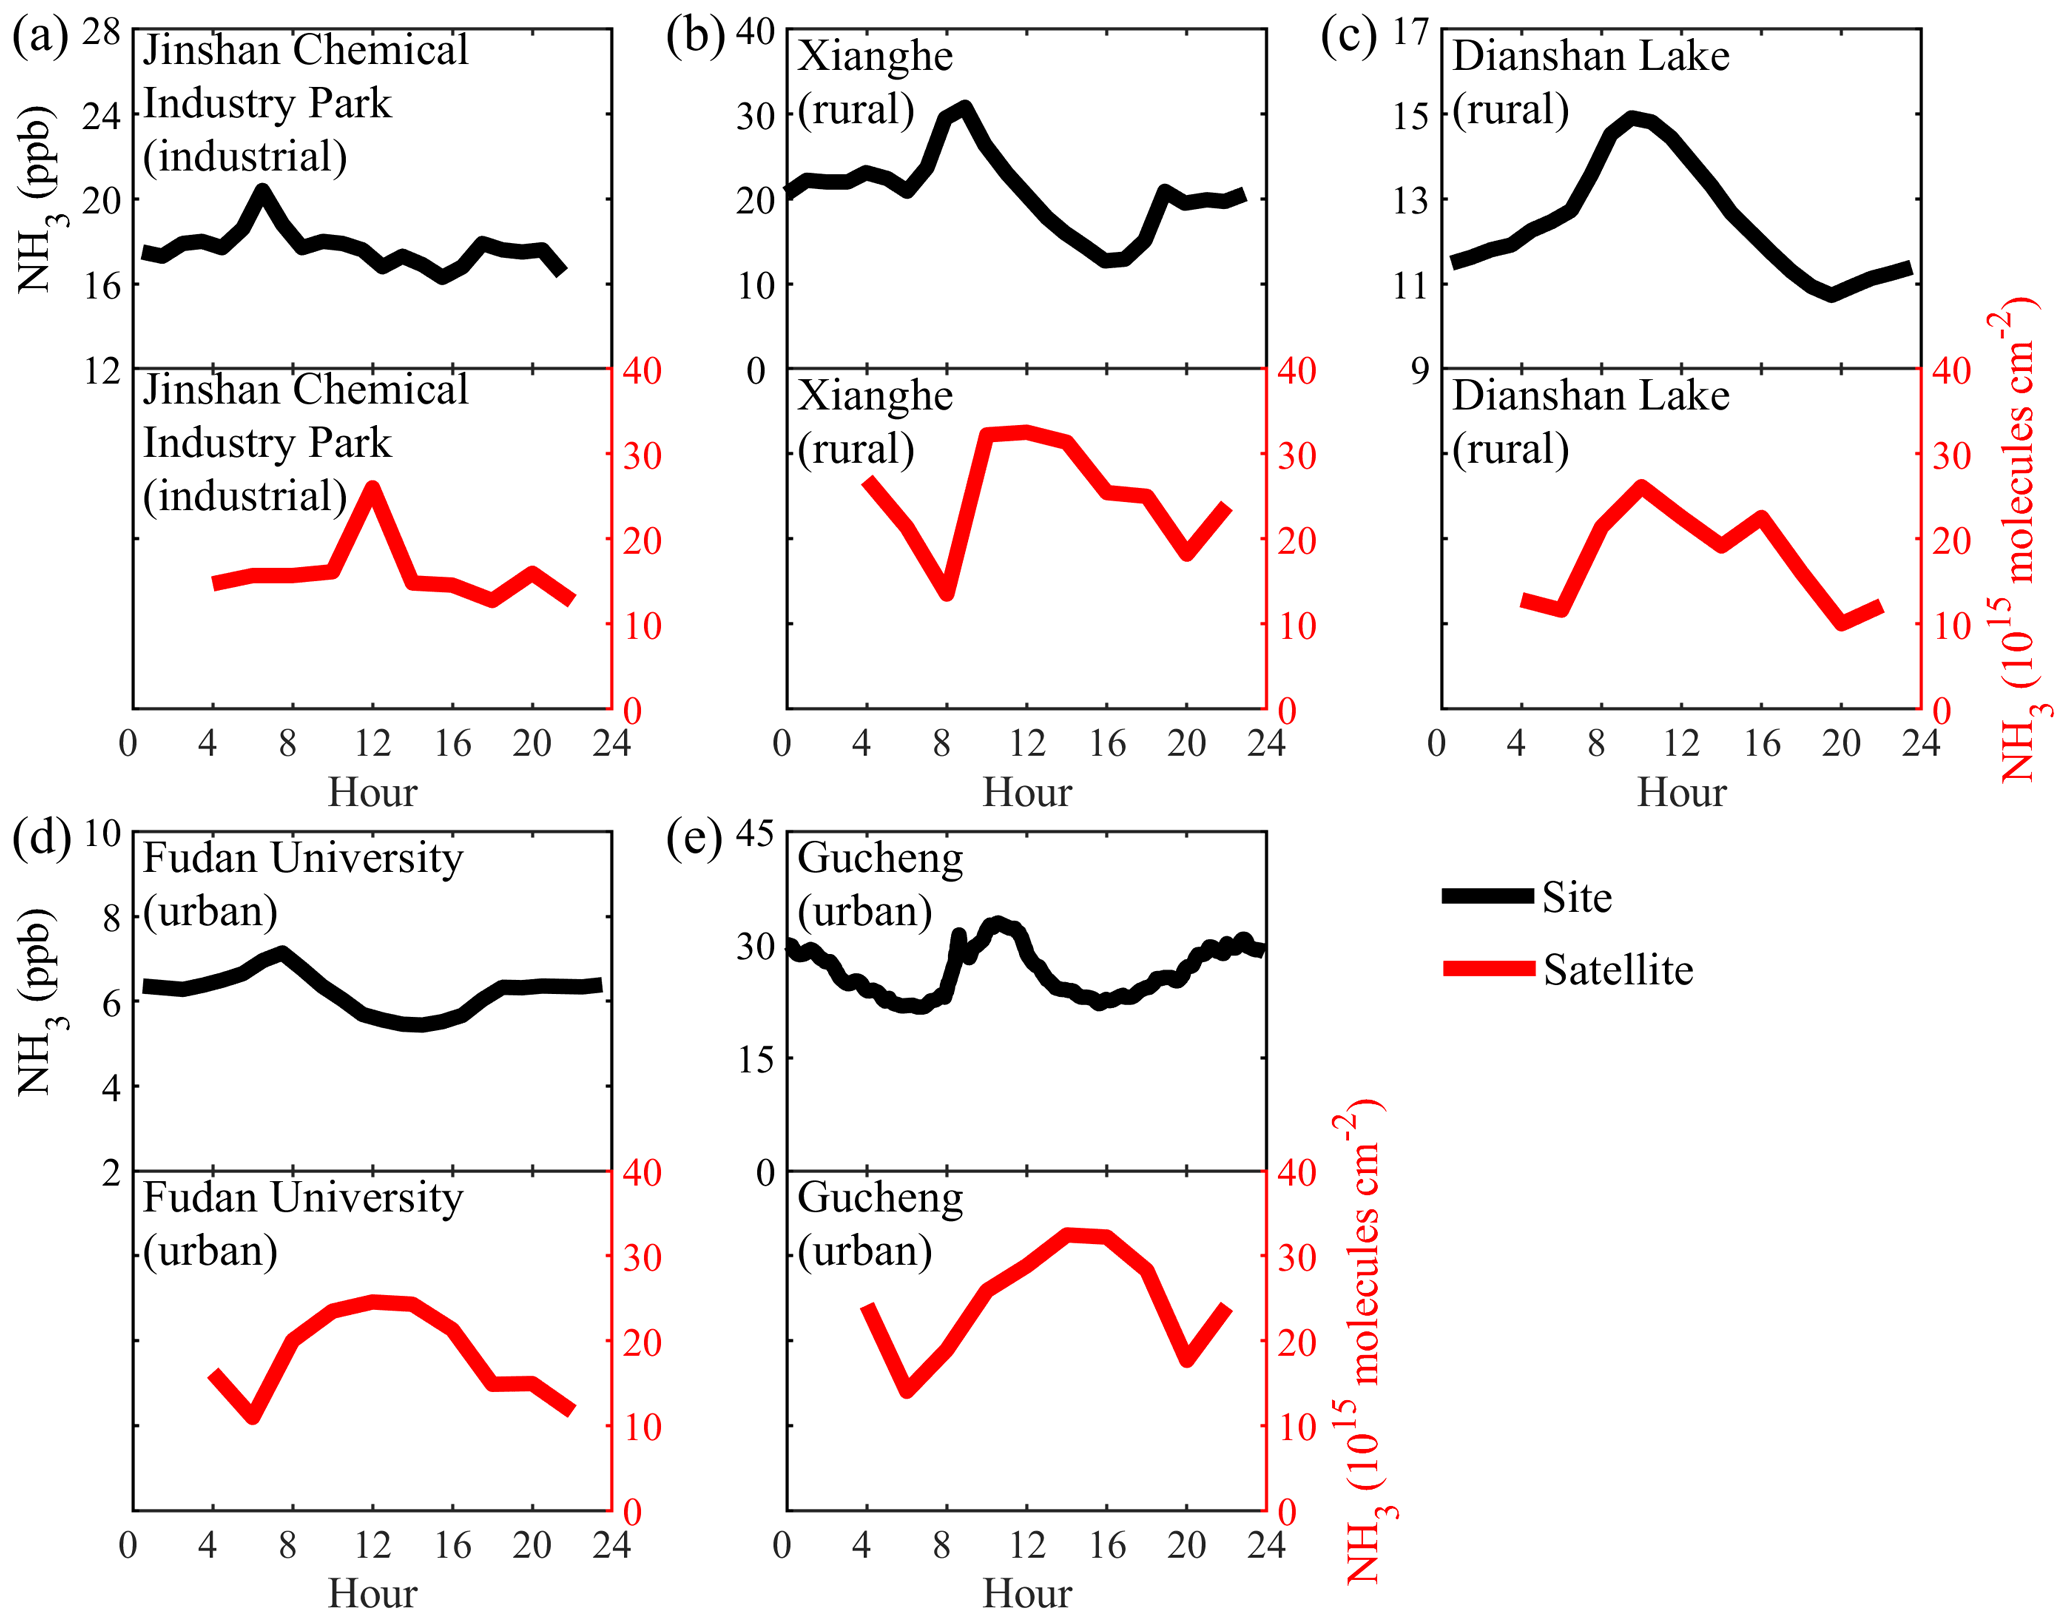
Figure 2GIIRS-based and measured hourly NH3 concentrations at five sites: Jinshan Chemical Industry Park (JSP, a), Xianghe (XH, b), Dianshan Lake (DSL, c), Fudan University (FDU, d) and Gucheng (GC, e).
Spatial distribution of GIIRS-based surface NH3 concentrations across China had large variability (Fig. 3). High surface NH3 concentration (>10 µg N m−3) is mainly concentrated in the North China Plain (NCP), followed by the Sichuan Basin, Northeast China and parts of Xinjiang, while low values (<4 µg N m−3) are mainly concentrated in the Qinghai–Tibet Plateau. High surface NH3 concentration (126.85 µg N m−3) appears in July (6.78 µg N m−3 on average), and the lowest value (0.23 µg N m−3) appears in November (3.25 µg N m−3 on average). There are obvious seasonal changes in surface NH3 concentrations in the NCP with high values in summer and low values in winter, related to both agricultural N fertilizer and higher temperature.
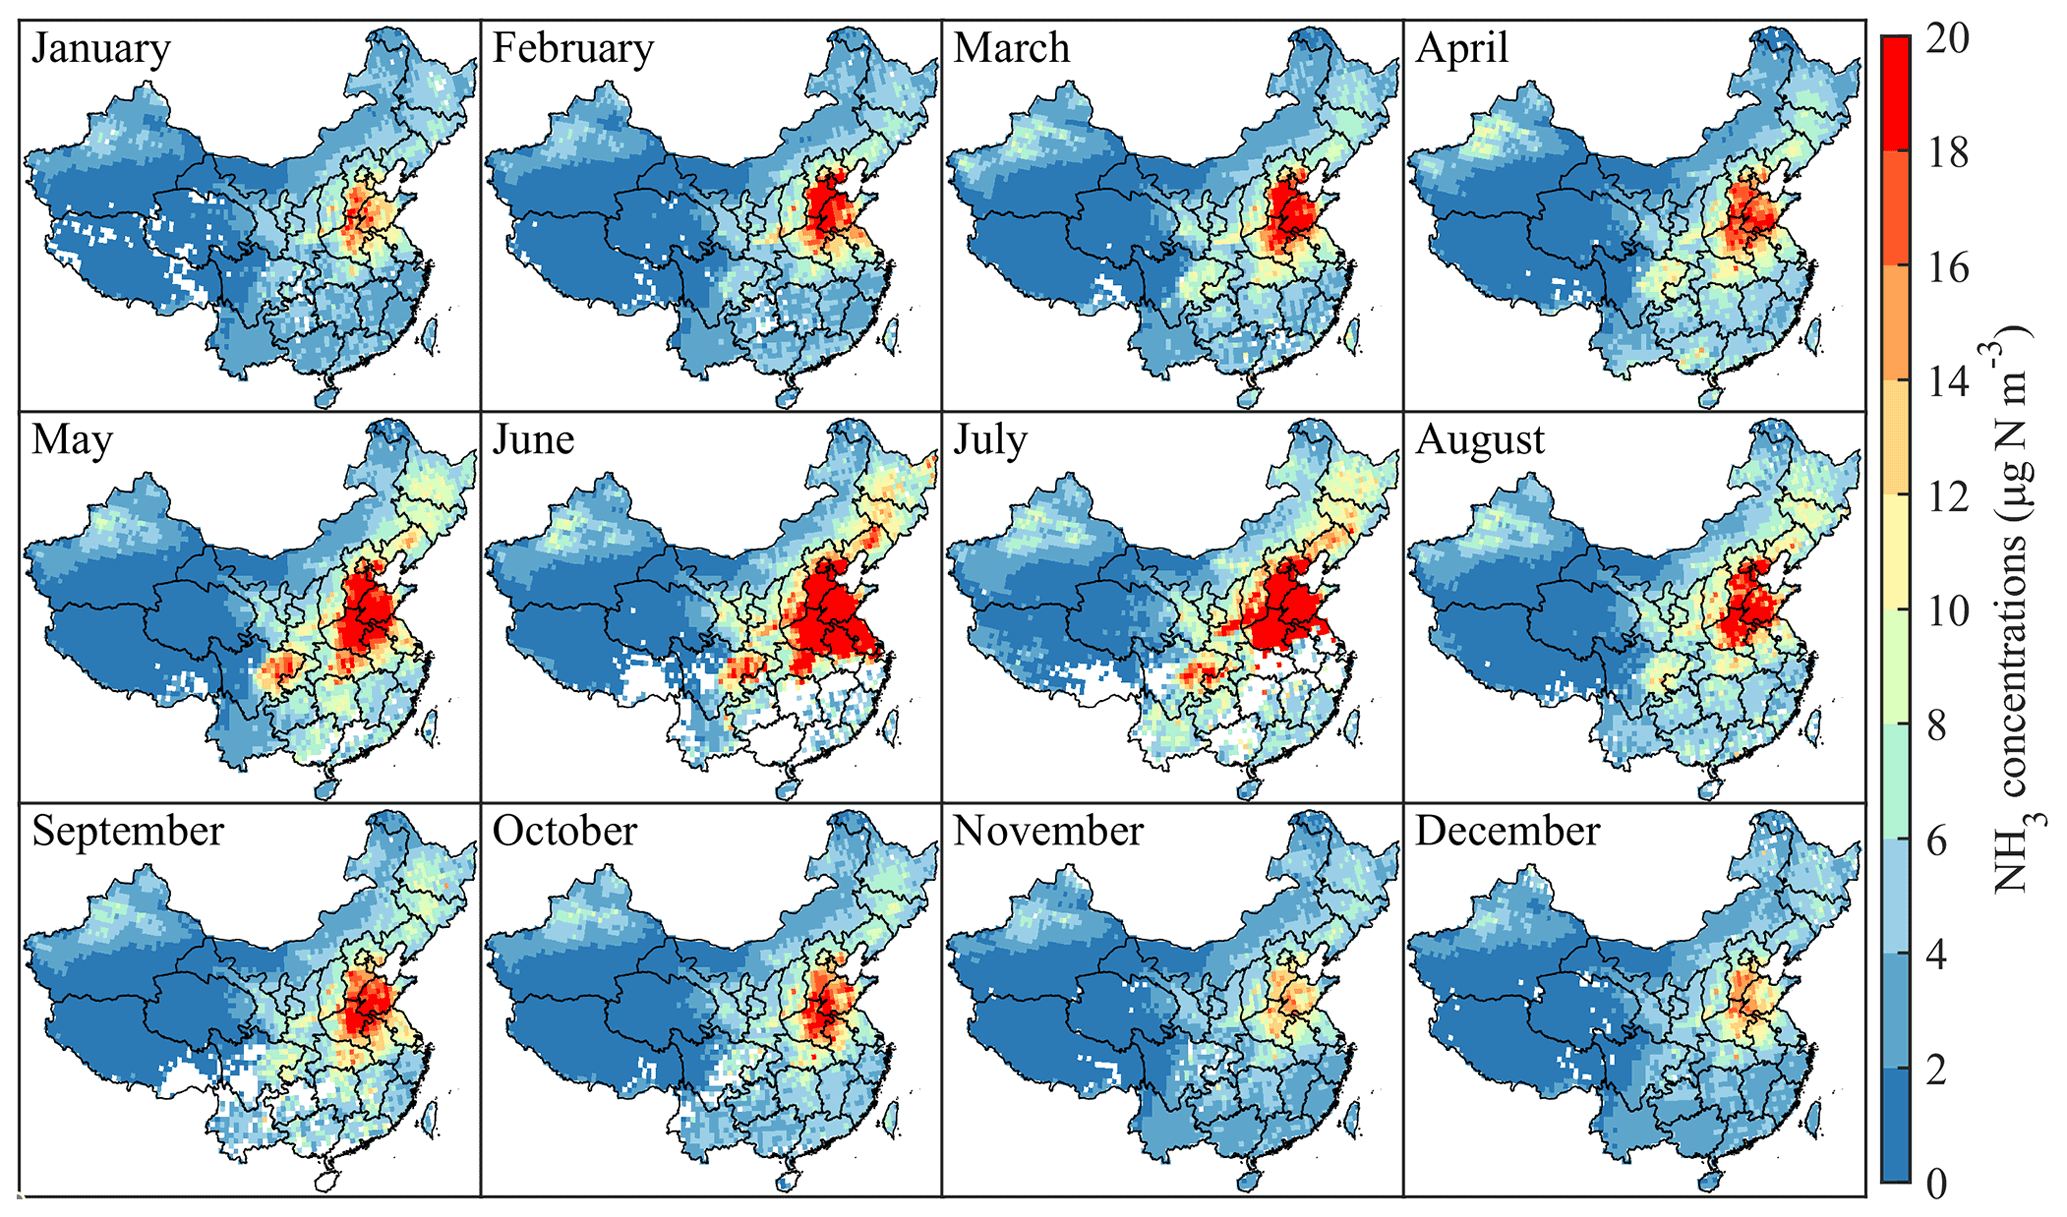
Figure 3Spatial distribution of monthly surface NH3 concentrations in China by GIIRS in 2019–2020.
3.2 IASI-based NH3 surface concentrations
The observation data of the NNDMN in China were collected to compare with the IASI-derived surface NH3 concentration. In general, a good consistency was found between measurements and satellite estimates, with the regression R2 as 0.72 and the RMSE as 2.24 µg N m−3. The coefficient of the fitted line was 1.03 ≈ 1, and the bias was 2.59 % (Fig. 4).
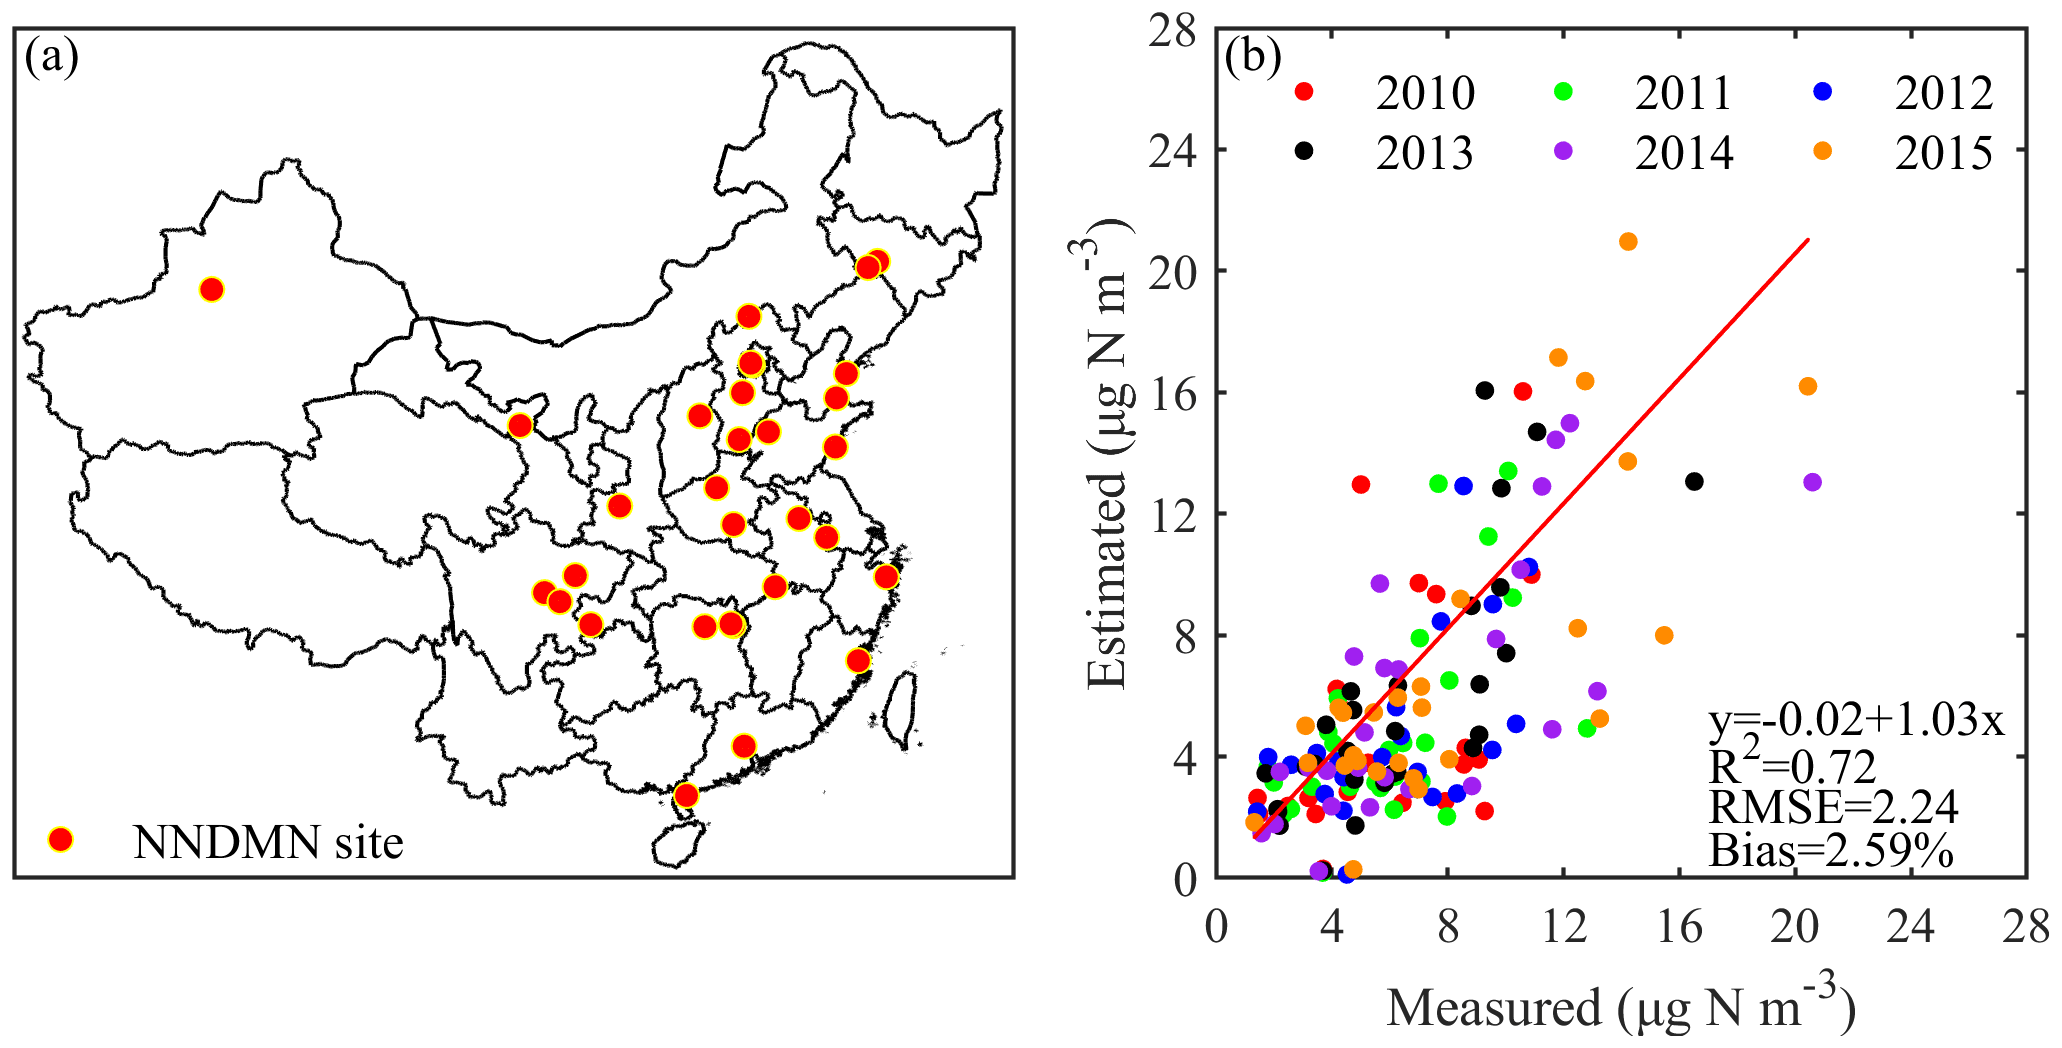
Figure 4Comparison of IASI surface NH3 concentrations with NNDMN measurements. (a) The locations of NNDMN; (b) the regression results between satellite estimates and measurements.
Monthly regression R2 between the satellite-derived NH3 concentration and the measured NH3 was 0.38–0.84 (Fig. 5). The regression R2 reached the higher value (>0.80) in July and August. The RMSE ranged from 2.29 to 3.36 µg N m−3, which reached the maximum value of 3.36 µg N m−3 in July and reached the smallest value in March (2.29 µg N m−3). The bias is basically less than 31 % for all months and reached the minimum value of 0.67 % in February, indicating that the monthly IASI-derived surface concentrations obtained are consistent with measurements.
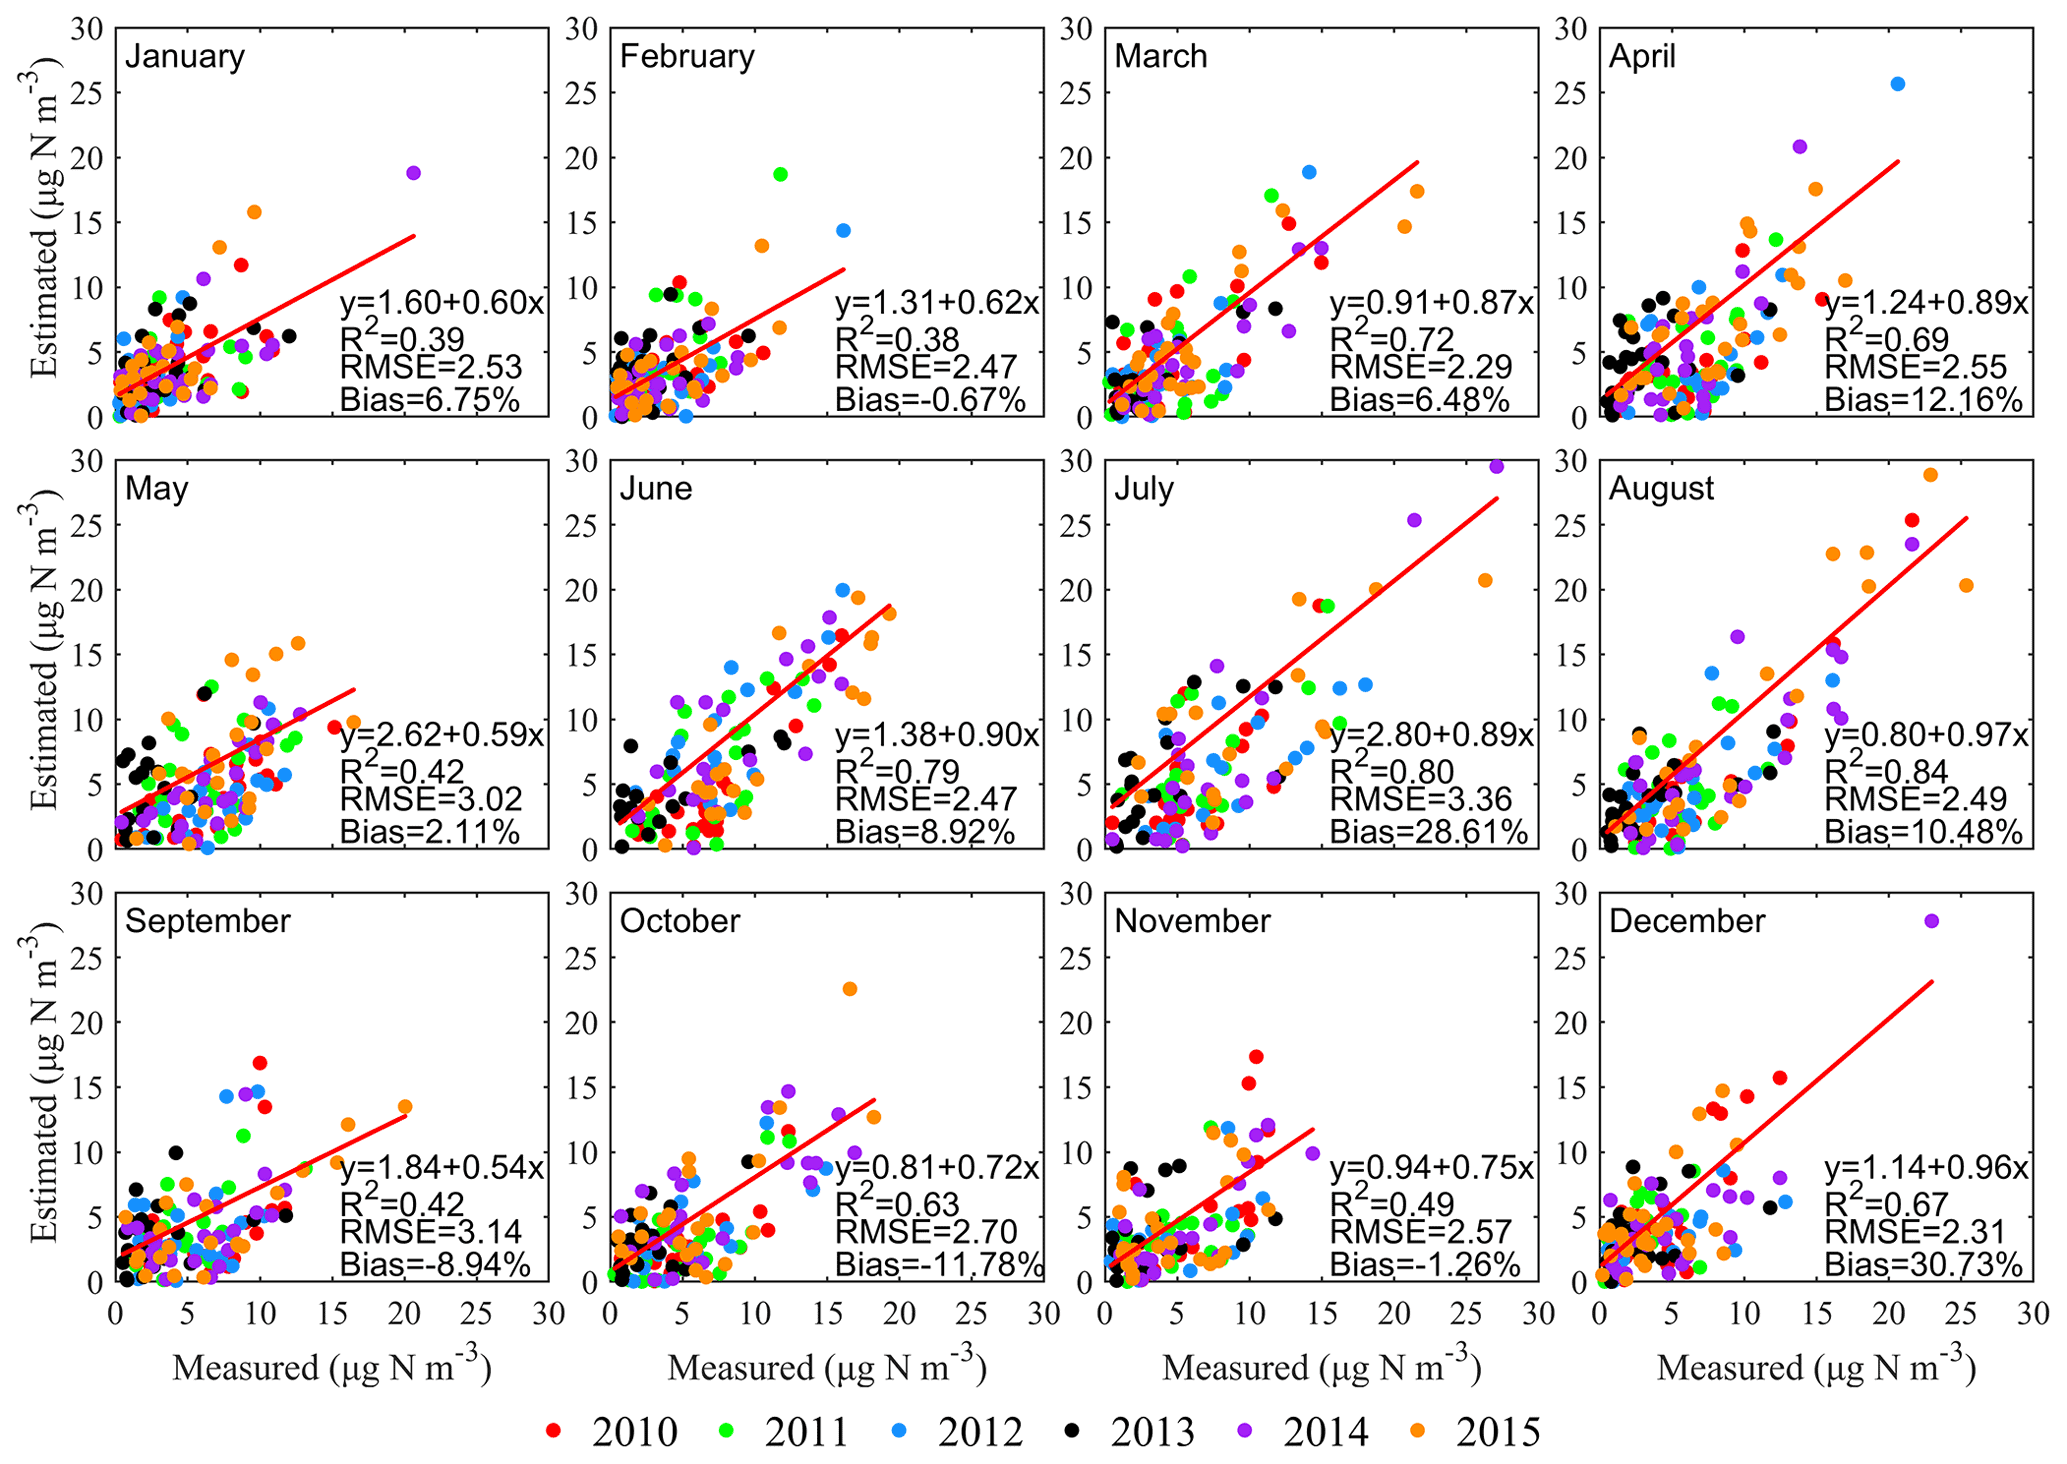
Figure 5Comparison of monthly average values of ground measured and IASI-derived NH3 surface concentrations in 2010–2015.
Figure 6 shows the monthly changes in surface NH3 concentrations in Huinong County in Ningxia from 2010 to 2015 for a total of 72 months. Surface NH3 concentrations retrieved by the IASI were compared with the observation data at Huinong. The highest value of each year basically appeared from June to August, and the lowest values appeared from December to January. In the past 6 years, the maximum measured NH3 concentration appeared in June 2015 (18.9 µg N m−3), and the minimum appeared in November 2012 (0.6 µg N m−3). The observation data and satellite data have the same seasonal changes.
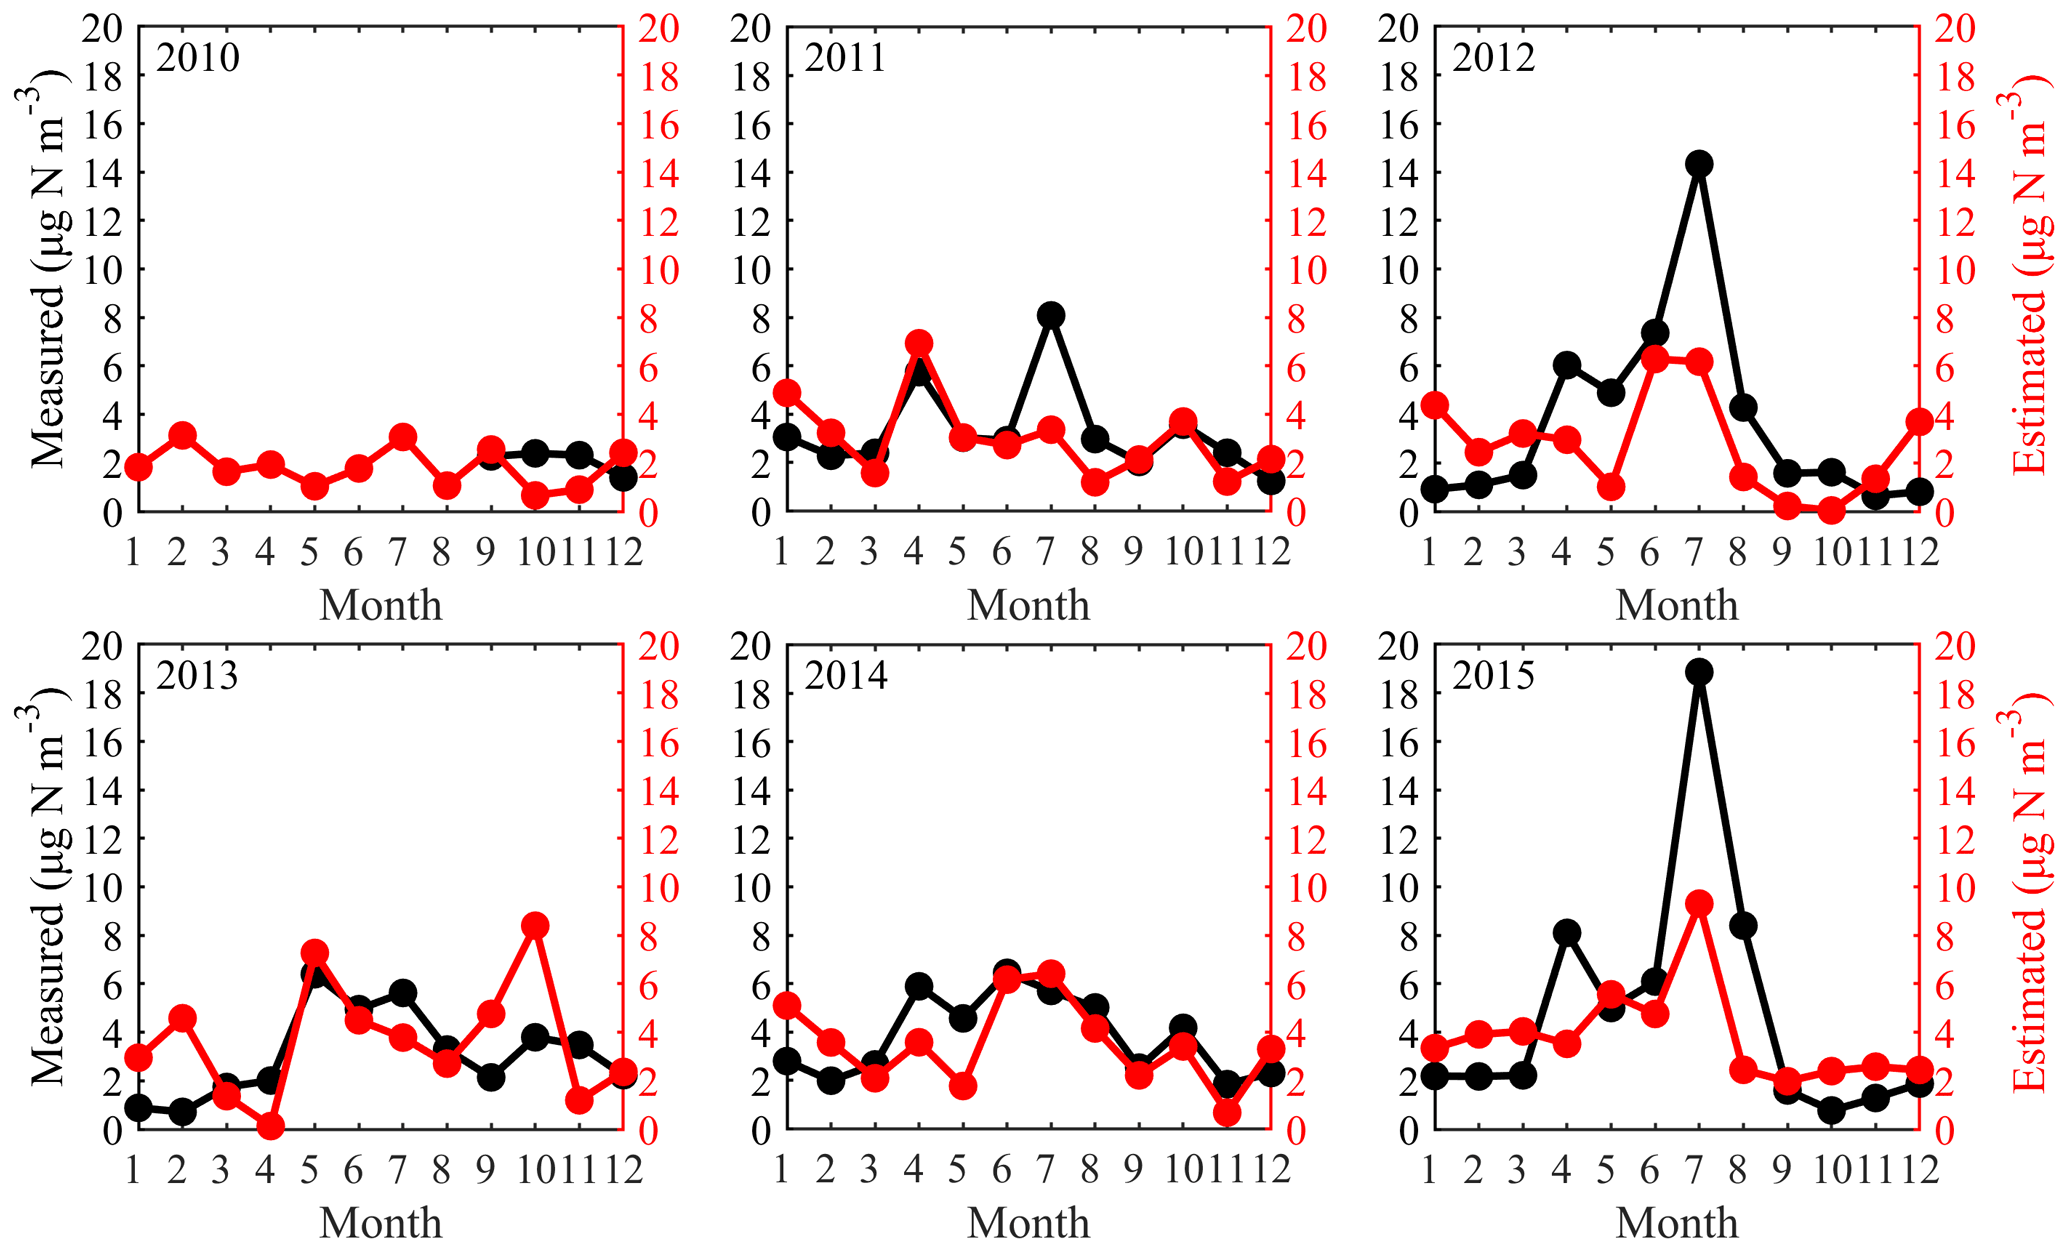
Figure 6Monthly changes in NH3 concentrations in Huinong County in Ningxia from 2010 to 2015 for a total of 72 months during 2010–2015.
Figures 3 and 7 show the spatial distribution of GIIRS-derived and IASI-derived surface NH3 concentrations in 2019. The spatial distribution and gradients of surface NH3 concentrations by the GIIRS and IASI have the same gradients from the eastern to western regions. One notable difference occurred in the middle and lower reaches of the Yangtze River in June and July since the GIIRS observations are affected by clouds and had missing data.
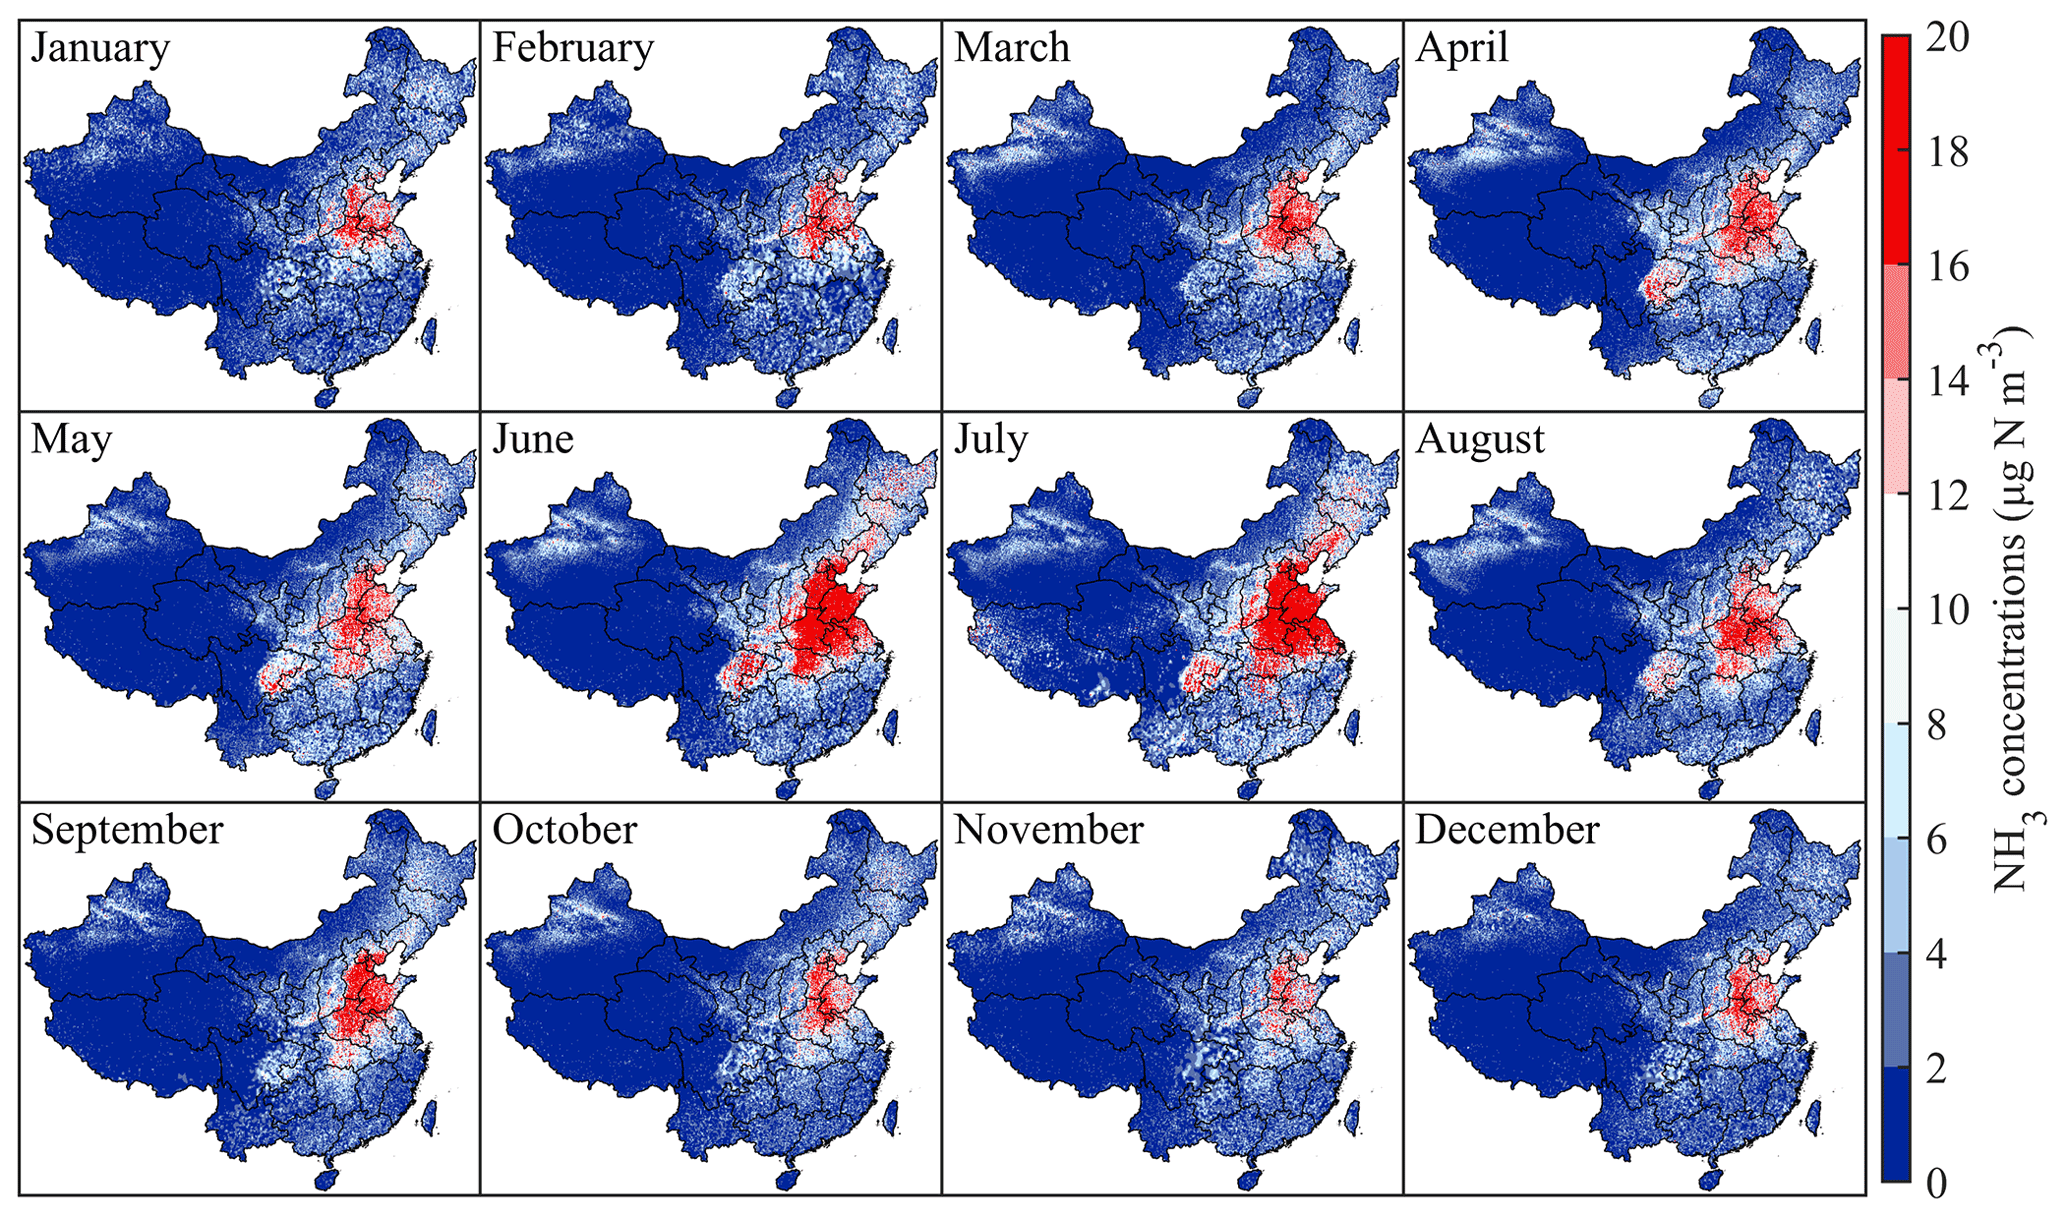
Figure 7Spatial distribution of monthly surface NH3 concentrations in China by the IASI in 2019.
3.3 IASI-derived NH3 emissions
Based on the top-down estimates, China's NH3 emissions ranged from 12.17 to 17.77 Tg N yr−1 during 2008–2019. From 2008 to 2015, NH3 emissions increased from 13.00 to 17.06 Tg N yr−1. Since 2008, the temperature in China has risen steadily (Ding et al., 2007), promoting the volatilization of NH3, which partly explains the increase in NH3 emissions from 2008 to 2015. After 2015, NH3 emissions fluctuated and changed slightly (16.08–17.77 Tg N yr−1). Compared with other studies, the change in NH3 emissions from 2008 to 2015 is consistent with previous estimates, and the overall NH3 emissions show an upward trend (Kang et al., 2016; Zhang et al., 2018; Ma, 2020; Fu et al., 2020; Zhang et al., 2021). Our estimates are on the rise as a whole, but the calculated values are generally lower than those by Zhang et al. (2017) (around 15 Tg N yr−1) but larger than those by EDGAR and Kang et al. (2016).
In terms of spatial distribution, high NH3 emissions are generally distributed in the North China Plain, Sichuan Basin and Northeast China, while the low values are mainly distributed in Southwest China (especially the Qinghai–Tibet Plateau). The North China Plain is China's granary, with developed agriculture and animal husbandry, high population densities and strong human activities (including vehicle emissions) (Zhang et al., 2006; Wang et al., 2020). In contrast, South China is rich in rainfall, which promotes the deposition of NH3 and suppresses its volatilization to a certain extent.
The spatial distributions of NH3 emissions in January, April, July and October were selected to characterize the seasonal variations. The average emissions for the four months were 1.15, 1.31, 2.31 and 1.16 kg N ha−1 in January, April, July and October, indicating that NH3 emission is highest in summer and lowest in winter. The annual average emission intensity of 2019 is 16.53 kg N ha−1 (0.09–313.47 kg N ha−1). Figure 8b shows the monthly changes in NH3 emissions, which basically shows a normal distribution. High values are generally distributed in June and July, and low values are generally distributed in November and December. They reached the maximum monthly emission of 2.6 Tg N m−1 in July 2019 and reached the minimum monthly emission in November and December (1.1 Tg N m−1).
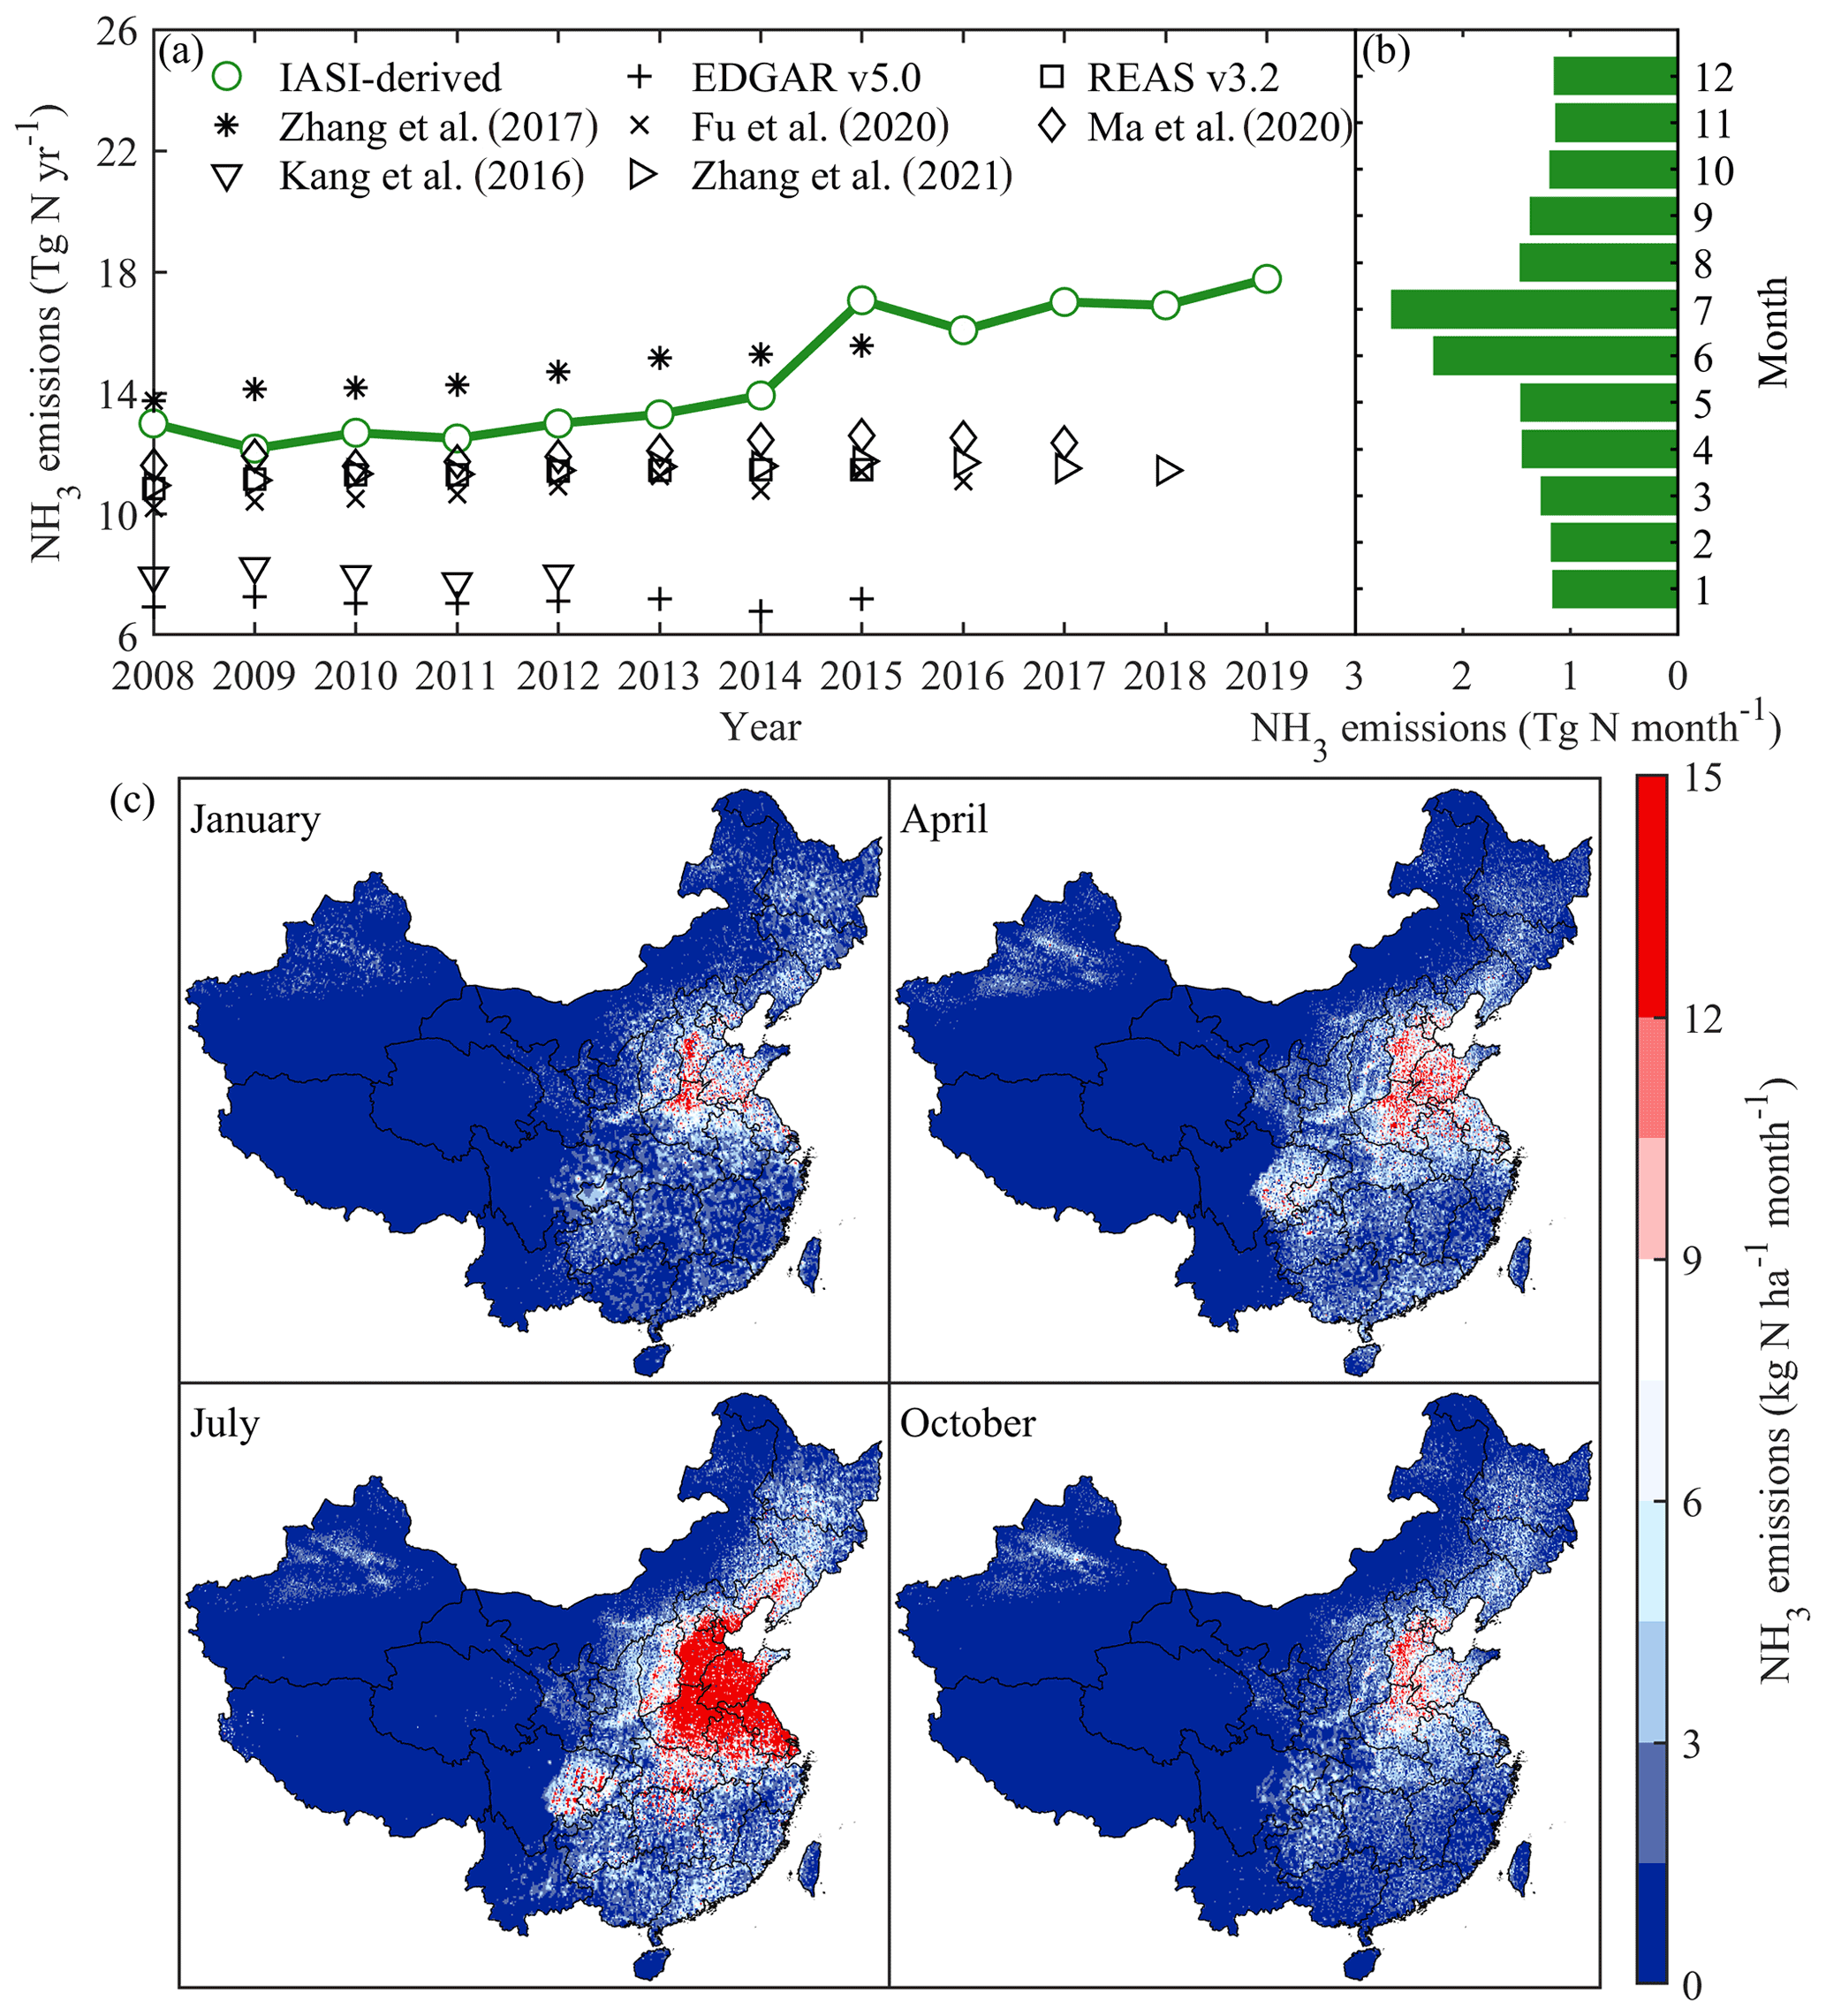
Figure 8Annual changes in NH3 emissions (a), monthly changes in NH3 emissions in 2019 (b) and spatial distribution of NH3 emissions by month in 2019 (c).
This study developed satellite-based surface NH3 concentrations and emissions in China based on remote sensing data (IASI and GIIRS). However, several limitations have been identified in this study. First, the Fengyun geostationary satellite used in this study can achieve hourly NH3 concentrations, but the time series is still very short (November 2019–October 2020), and satellite observations are affected by clouds and meteorological conditions, resulting in missing values in parts of the Yangtze River basin.
Second, we used a relatively fixed average conversion ratio (Fig. S2) to estimate surface NH3 concentrations and NH3 emissions in China, ignoring the time-series variation of the ratio, due to the temporal constraint of the emission inventory. In this case, non-emission factors led to a higher satellite-observed NH3 column; for example, emission reductions of SO2 and NO2 led to an increased NH3 column (Lachatre et al., 2019; Fu et al., 2020), which can introduce uncertainty into NH3 emission calculations using concentration as the main parameter.
Third, the spatial resolution of the NH3 vertical profile simulated by the atmospheric model is relatively coarse (0.5∘). In order to make it consistent with the spatial resolution of the remote sensing data, the outputs of GEOS-Chem (vertical profiles and feedback ratio between emissions and surface NH3 concentrations) were adjusted through resampling methods. Owing to the resolution limit, the ratio-based mass balance approach to estimate NH3 emissions neglected the effects of internal transport of NH3 and displacement of emission sources within the fine grid.
Finally, there are some uncertainties and biases in the observed NH3 column by satellite. Earlier versions of the IASI NH3 column product were 25 %–50 % lower than ground-based measurements (Whitburn et al., 2016; Dammers et al., 2017). However, version 3 of IASI–NH3 lacks a comprehensive ground-based measurement assessment, which has only been compared with limited aircraft observations (Guo et al., 2021). Comparing IASI-derived surface NH3 concentrations with measurements of ground sites (NNDMN) generally shows consistency in this study. Further work is needed for the complete assessment and error analysis.
At present, there are more and more satellite sensors (GOSAT, CrIS, AIRS, etc.) that can monitor NH3 concentrations. This study only used IASI and GIIRS, and in the future, data from different satellites can be merged to analyze NH3 changes on multiple temporal and spatial scales.
We use GIIRS to study the NH3 diel cycle and estimate surface NH3 concentrations and emissions based on the IASI in China. There are obvious hourly changes in NH3 concentration in China using GIIRS. Overall, NH3 concentrations are larger in the daytime than at nighttime in China. Hourly NH3 concentrations at different regions show different patterns, but high values generally appear at 10:00–16:00. Comparing ground measured and IASI-derived NH3 surface concentrations by NNDMN from 2010 to 2015, the coefficient of the fitted line is 1.03 ≈ 1 and the low bias is 2.59 %, indicating satellite estimates have good consistency with the measurements. IASI-derived Chinese NH3 emissions range from 12.17 to 17.77 Tg N yr−1 during 2008–2019, among which NH3 emissions increase from 2008 to 2015. The emission intensity of NH3 in China presents a strong spatial heterogeneity, being high in the east and low in the west. The high values are mainly distributed in the North China Plain,Sichuan Basin and Northeast China. High values are generally distributed in summer, and low values generally occur in winter. This study provides an important reference basis for the formulation of NH3 pollution prevention and control policy in China.
IASI NH3 data were obtained from https://iasi.aeris-data.fr/nh3_iasi_a_data (Clarisse et al., 2022). GIIRS NH3 data were obtained from https://doi.org/10.5281/zenodo.5051433 (Clarisse, 2021).
The supplement related to this article is available online at: https://doi.org/10.5194/acp-22-9099-2022-supplement.
The study was conceived by LL, and data analysis was performed by JD. The paper was written by PL, with editing from WX and XL. LL was involved in obtaining the project grant and supervised the study.
The contact author has declared that none of the authors has any competing interests.
Publisher’s note: Copernicus Publications remains neutral with regard to jurisdictional claims in published maps and institutional affiliations.
The analysis in this study is supported by the Supercomputing Center of Lanzhou University.
This study is supported by the National Natural Science Foundation of China (grant nos. 42001347, 41705130 and 41922037) and the Chinese State Key Research and Development Programme (grant nos. 2017YFC0210100 and 2017YFD0200101).
This paper was edited by Theodora Nah and reviewed by three anonymous referees.
Cai, X., Bao, Y., Petropoulos, G. P., Lu, F., Lu, Q., Zhu, L., and Wu, Y.: Temperature and humidity profile retrieval from FY4-GIIRS hyperspectral data using artificial neural networks, Remote Sens., 12, 1872, https://doi.org/10.3390/rs12111872, 2020.
Clarisse, L.: Atmospheric Ammonia (NH3) total columns from the FY-4A Geostationary Interferometric Infrared Sounder (GIIRS) (Version 2), Zenodo [data set], https://doi.org/10.5281/zenodo.5051433, 2021.
Clarisse, L., Van Damme, M., Hurtmans, D., Franco, B., Clerbaux, C., and Coheur, P. F.: The diel cycle of NH3 observed from the FY-4A Geostationary Interferometric Infrared Sounder (GIIRS), Geophys. Res. Lett., 48, e2021GL093010, https://doi.org/10.1029/2021GL093010, 2021.
Clarisse, L., Van Damme, M., and Coheur, P.-F.: Near-real time daily IASI/Metop-A ULB-LATMOS ammonia (NH3) L2 product (total column), AERIS data infrastructure [data set], https://iasi.aeris-data.fr/nh3_iasi_a_data, last access: 5 February 2022.
Cooper, M., Martin, R. V., Padmanabhan, A., and Henze, D. K.: Comparing mass balance and adjoint methods for inverse modeling of nitrogen dioxide columns for global nitrogen oxide emissions, J. Geophys. Res.-Atmos., 122, 4718–4734, https://doi.org/10.1002/2016JD025985, 2017.
Dammers, E., Shephard, M. W., Palm, M., Cady-Pereira, K., Capps, S., Lutsch, E., Strong, K., Hannigan, J. W., Ortega, I., Toon, G. C., Stremme, W., Grutter, M., Jones, N., Smale, D., Siemons, J., Hrpcek, K., Tremblay, D., Schaap, M., Notholt, J., and Erisman, J. W.: Validation of the CrIS fast physical NH3 retrieval with ground-based FTIR, Atmos. Meas. Tech., 10, 2645–2667, https://doi.org/10.5194/amt-10-2645-2017, 2017.
Dammers, E., McLinden, C. A., Griffin, D., Shephard, M. W., Van Der Graaf, S., Lutsch, E., Schaap, M., Gainairu-Matz, Y., Fioletov, V., Van Damme, M., Whitburn, S., Clarisse, L., Cady-Pereira, K., Clerbaux, C., Coheur, P. F., and Erisman, J. W.: NH3 emissions from large point sources derived from CrIS and IASI satellite observations, Atmos. Chem. Phys., 19, 12261–12293, https://doi.org/10.5194/acp-19-12261-2019, 2019.
Ding, Y. H., Ren, G. Y., Zhao, Z. C., Xu, Y., Luo, Y., Li, Q. P., and Zhang, J.: Detection, causes and projection of climate change over China: An overview of recent progress, Adv. Atmos. Sci., 24, 954–971, https://doi.org/10.1007/s00376-007-0954-4, 2007.
Dong, W., Xing, J., and Wang, S.: Temporal and spatial distribution of anthropogenic ammonia emissions in China: 1994–2006, Huanjing Kexue, 31, 1457–1463, 2010.
Eastham, S. D., Weisenstein, D. K., and Barrett, S. R.: Development and evaluation of the unified tropospheric–stratospheric chemistry extension (UCX) for the global chemistry-transport model GEOS-Chem, Atmos. Environ., 89, 52–63, https://doi.org/10.1016/j.atmosenv.2014.02.001, 2014.
Flechard, C. R., Nemitz, E., Smith, R. I., Fowler, D., Vermeulen, A. T., Bleeker, A., Erisman, J. W., Simpson, D., Zhang, L., Tang, Y. S., and Sutton, M. A.: Dry deposition of reactive nitrogen to European ecosystems: a comparison of inferential models across the NitroEurope network, Atmos. Chem. Phys., 11, 2703–2728, https://doi.org/10.5194/acp-11-2703-2011, 2011.
Fowler, D., Coyle, M., Skiba, U., Sutton, M. A., Cape, J. N., Reis, S., Sheppard, L. J., Jenkins, A., Grizzetti, B., Galloway, J. N., Vitousek, P., Leach, A., Bouwman, A. F., Butterbach-Bahl, K., Dentener, F., Stevenson, D., Amann, M., and Voss, M.: The global nitrogen cycle in the twenty-first century, Philos. T. R. Soc. B, 368, 20130164, https://doi.org/10.1098/rstb.2013.0164, 2013.
Fu, H., Luo, Z., and Hu, S.: A temporal-spatial analysis and future trends of ammonia emissions in China, Sci. Total Environ., 731, 138897, https://doi.org/10.1016/j.scitotenv.2020.138897, 2020.
Geddes, J. A. and Martin, R. V.: Global deposition of total reactive nitrogen oxides from 1996 to 2014 constrained with satellite observations of NO2 columns, Atmos. Chem. Phys., 17, 10071–10091, https://doi.org/10.5194/acp-17-10071-2017, 2017.
Gilliland, A. B., Dennis, R. L., Roselle, S. J., and Pierce, T. E.: Seasonal NH3 emission estimates for the eastern United States based on ammonium wet concentrations and an inverse modeling method, J. Geophys. Res.-Atmos., 108, 4477, https://doi.org/10.1029/2002jd003063, 2003.
Guo, X., Wang, R., Pan, D., Zondlo, M. A., Clarisse, L., Van Damme, M., Whitburn, S., Coheur, P. F., Clerbaux, C., Franco, B., Golston, L. M., Wendt, L., Sun, K., Tao, L., Miller, D., Mikoviny, T., Müller, M., Wisthaler, A., Tevlin, A. G., Murphy, J. G., Nowak, J. B., Roscioli, J. R., Volkamer, R., Kille, N., Neuman, J. A., Eilerman, S. J., Crawford, J. H., Yacovitch, T. I., Barrick, J. D., and Scarino, A. J.: Validation of IASI satellite ammonia observations at the pixel scale using in situ vertical profiles, J. Geophys. Res.-Atmos., 126, e2020JD033475, https://doi.org/10.1029/2020jd033475, 2021.
He, Y., Pan, Y., Zhang, G., Ji, D., Tian, S., Xu, X., Zhang, R., and Wang, Y.: Tracking ammonia morning peak, sources and transport with 1 Hz measurements at a rural site in North China Plain, Atmos. Environ., 235, 117630, https://doi.org/10.1016/j.atmosenv.2020.117630, 2020.
Huang, X., Song, Y., Li, M., Li, J., Huo, Q., Cai, X., Zhu, T., Hu, M., and Zhang, H.: A high-resolution ammonia emission inventory in China, Global Biogeochem. Cy., 26, GB1030, https://doi.org/10.1029/2011gb004161, 2012.
Jacob, D. J.: Introduction to atmospheric chemistry, Princeton University Press, https://doi.org/10.1515/9781400841547, 1999.
Kang, Y., Liu, M., Song, Y., Huang, X., Yao, H., Cai, X., Zhang, H., Kang, L., Liu, X., Yan, X., He, H., Zhang, Q., Shao, M., and Zhu, T.: High-resolution ammonia emissions inventories in China from 1980 to 2012, Atmos. Chem. Phys., 16, 2043–2058, https://doi.org/10.5194/acp-16-2043-2016, 2016.
Kong, L., Tang, X., Zhu, J., Wang, Z., Pan, Y., Wu, H., Wu, L., Wu, Q., He, Y., Tian, S., Xie, Y., Liu, Z., Sui, W., Han, L., and Carmichael, G.: Improved inversion of monthly ammonia emissions in China based on the Chinese ammonia monitoring network and ensemble Kalman filter, Environ. Sci. Technol., 53, 12529–12538, https://doi.org/10.1021/acs.est.9b02701, 2019.
Kuang, Y., Xu, W., Lin, W., Meng, Z., Zhao, H., Ren, S., Zhang, G., Liang, L., and Xu, X.: Explosive morning growth phenomena of NH3 on the North China Plain: Causes and potential impacts on aerosol formation, Environ. Pollut., 257, 113621, https://doi.org/10.1016/j.envpol.2019.113621, 2020.
Kutzner, R. D., Cuesta, J., Chelin, P., Petit, J.-E., Ray, M., Landsheere, X., Tournadre, B., Dupont, J.-C., Rosso, A., Hase, F., Orphal, J., and Beekmann, M.: Diurnal evolution of total column and surface atmospheric ammonia in the megacity of Paris, France, during an intense springtime pollution episode, Atmos. Chem. Phys., 21, 12091–12111, https://doi.org/10.5194/acp-21-12091-2021, 2021.
Lachatre, M., Fortems-Cheiney, A., Foret, G., Siour, G., Dufour, G., Clarisse, L., Clerbaux, C., Coheur, P.-F., Van Damme, M., and Beekmann, M.: The unintended consequence of SO2 and NO2 regulations over China: increase of ammonia levels and impact on PM2.5 concentrations, Atmos. Chem. Phys., 19, 6701–6716, https://doi.org/10.5194/acp-19-6701-2019, 2019.
Lamsal, L., Martin, R., Padmanabhan, A., Van Donkelaar, A., Zhang, Q., Sioris, C., Chance, K., Kurosu, T., and Newchurch, M.: Application of satellite observations for timely updates to global anthropogenic NOx emission inventories, Geophys. Res. Lett., 38, L05810, https://doi.org/10.1029/2010GL046476, 2011.
Liu, L., Zhang, X., Wong, A. Y. H., Xu, W., Liu, X., Li, Y., Mi, H., Lu, X., Zhao, L., Wang, Z., Wu, X., and Wei, J.: Estimating global surface ammonia concentrations inferred from satellite retrievals, Atmos. Chem. Phys., 19, 12051–12066, https://doi.org/10.5194/acp-19-12051-2019, 2019.
Liu, L., Xu, W., Lu, X., Zhong, B., Guo, Y., Lu, X., Zhao, Y., He, W., Wang, S., Zhang, X., Liu, X., and Vitousek, P.: Exploring global changes in agricultural ammonia emissions and their contribution to nitrogen deposition since 1980, P. Natl. Acad. Sci. USA, 119, e2121998119, https://doi.org/10.1073/pnas.2121998119, 2022.
Ma, S.: High-resolution assessment of ammonia emissions in China: Inventories, driving forces and mitigation, Atmos. Environ., 229, 117458, https://doi.org/10.1016/j.atmosenv.2020.117458, 2020.
Marais, E. A., Pandey, A. K., Van Damme, M., Clarisse, L., Coheur, P. F., Shephard, M. W., Cady-Pereira, K. E., Misselbrook, T., Zhu, L., Luo, G., and Yu, F.: UK Ammonia Emissions Estimated With Satellite Observations and GEOS-Chem, J. Geophys. Res.-Atmos., 126, e2021JD035237, https://doi.org/10.1029/2021JD035237, 2021.
Paerl, H. W., Gardner, W. S., McCarthy, M. J., Peierls, B. L., and Wilhelm, S. W.: Algal blooms: noteworthy nitrogen, Science, 346, 175–175, https://doi.org/10.1126/science.346.6206.175-a, 2014.
Pan, Y., Tian, S., Zhao, Y., Zhang, L., Zhu, X., Gao, J., Huang, W., Zhou, Y., Song, Y., Zhang, Q., and Wang, Y.: Identifying ammonia hotspots in China using a national observation network, Environ. Sci. Technol., 52, 3926–3934, https://doi.org/10.1021/acs.est.7b05235, 2018.
Pandolfi, M., Amato, F., Reche, C., Alastuey, A., Otjes, R. P., Blom, M. J., and Querol, X.: Summer ammonia measurements in a densely populated Mediterranean city, Atmos. Chem. Phys., 12, 7557–7575, https://doi.org/10.5194/acp-12-7557-2012, 2012.
Paulot, F., Jacob, D. J., Pinder, R. W., Bash, J. O., Travis, K., and Henze, D. K.: Ammonia emissions in the United States, European Union, and China derived by high-resolution inversion of ammonium wet deposition data: Interpretation with a new agricultural emissions inventory (MASAGE_NH3), J. Geophys. Res.-Atmos., 119, 4343–4364, https://doi.org/10.1002/2013jd021130, 2014.
Peng, S., Huang, J., Zhong, X., Yang, J., Wang, G., Zou, Y., Zhang, F., Zhu, Q., Buresh, R., and Witt, C.: Challenge and opportunity in improving fertilizer-nitrogen use efficiency of irrigated rice in China, Agr. Sci. China, 1, 776–785, 2002.
Pinder, R. W., Walker, J. T., Bash, J. O., Cady-Pereira, K. E., Henze, D. K., Luo, M. Z., Osterman, G. B., and Shephard, M. W.: Quantifying spatial and seasonal variability in atmospheric ammonia with in situ and space-based observations, Geophys. Res. Lett., 38, L04802, https://doi.org/10.1029/2010gl046146, 2011.
Shephard, M. W. and Cady-Pereira, K. E.: Cross-track Infrared Sounder (CrIS) satellite observations of tropospheric ammonia, Atmos. Meas. Tech., 8, 1323–1336, https://doi.org/10.5194/amt-8-1323-2015, 2015.
Someya, Y., Imasu, R., Shiomi, K., and Saitoh, N.: Atmospheric ammonia retrieval from the TANSO-FTS/GOSAT thermal infrared sounder, Atmos. Meas. Tech., 13, 309–321, https://doi.org/10.5194/amt-13-309-2020, 2020.
Van Damme, M., Clarisse, L., Heald, C. L., Hurtmans, D., Ngadi, Y., Clerbaux, C., Dolman, A. J., Erisman, J. W., and Coheur, P. F.: Global distributions, time series and error characterization of atmospheric ammonia (NH3) from IASI satellite observations, Atmos. Chem. Phys., 14, 2905–2922, https://doi.org/10.5194/acp-14-2905-2014, 2014.
Van Damme, M., Whitburn, S., Clarisse, L., Clerbaux, C., Hurtmans, D., and Coheur, P.-F.: Version 2 of the IASI NH3 neural network retrieval algorithm: near-real-time and reanalysed datasets, Atmos. Meas. Tech., 10, 4905–4914, https://doi.org/10.5194/amt-10-4905-2017, 2017.
Van Damme, M., Clarisse, L., Whitburn, S., Hadji-Lazaro, J., Hurtmans, D., Clerbaux, C., and Coheur, P. F.: Industrial and agricultural ammonia point sources exposed, Nature, 564, 99–103, https://doi.org/10.1038/s41586-018-0747-1, 2018.
Wang, S., Nan, J., Shi, C., Fu, Q., Gao, S., Wang, D., Cui, H., Saiz-Lopez, A., and Zhou, B.: Atmospheric ammonia and its impacts on regional air quality over the megacity of Shanghai, China, Sci. Rep.-UK, 5, 1–13, https://doi.org/10.1038/srep15842, 2015.
Wang, Z., Zhang, X., Liu, L., Cheng, M., and Xu, J.: Spatial and seasonal patterns of atmospheric nitrogen deposition in North China, Atmospheric and Oceanic Science Letters, 13, 188–194, https://doi.org/10.1080/16742834.2019.1701385, 2020.
Warner, J. X., Wei, Z., Strow, L. L., Dickerson, R. R., and Nowak, J. B.: The global tropospheric ammonia distribution as seen in the 13-year AIRS measurement record, Atmos. Chem. Phys., 16, 5467–5479, https://doi.org/10.5194/acp-16-5467-2016, 2016.
Werner, M., Kryza, M., Geels, C., Ellermann, T., and Skjøth, C. A.: Ammonia concentrations over Europe – application of the WRF-Chem model supported with dynamic emission, Pol. J. Environ. Stud., 26, 1323–1341, https://doi.org/10.15244/pjoes/67340, 2017.
Wesely, M.: Parameterization of surface resistances to gaseous dry deposition in regional-scale numerical models, Atmos. Environ., 41, 52–63, https://doi.org/10.1016/j.atmosenv.2007.10.058, 2007.
Whitburn, S., Van Damme, M., Clarisse, L., Bauduin, S., Heald, C., Hadji-Lazaro, J., Hurtmans, D., Zondlo, M. A., Clerbaux, C., and Coheur, P. F.: A flexible and robust neural network IASI-NH3 retrieval algorithm, J. Geophys. Res.-Atmos., 121, 6581–6599, https://doi.org/10.1002/2016JD024828, 2016.
Xu, W., Luo, X. S., Pan, Y. P., Zhang, L., Tang, A. H., Shen, J. L., Zhang, Y., Li, K. H., Wu, Q. H., Yang, D. W., Zhang, Y. Y., Xue, J., Li, W. Q., Li, Q. Q., Tang, L., Lu, S. H., Liang, T., Tong, Y. A., Liu, P., Zhang, Q., Xiong, Z. Q., Shi, X. J., Wu, L. H., Shi, W. Q., Tian, K., Zhong, X. H., Shi, K., Tang, Q. Y., Zhang, L. J., Huang, J. L., He, C. E., Kuang, F. H., Zhu, B., Liu, H., Jin, X., Xin, Y. J., Shi, X. K., Du, E. Z., Dore, A. J., Tang, S., Collett Jr., J. L., Goulding, K., Sun, Y. X., Ren, J., Zhang, F. S., and Liu, X. J.: Quantifying atmospheric nitrogen deposition through a nationwide monitoring network across China, Atmos. Chem. Phys., 15, 12345–12360, https://doi.org/10.5194/acp-15-12345-2015, 2015.
Zhang, L., Chen, Y., Zhao, Y., Henze, D. K., Zhu, L., Song, Y., Paulot, F., Liu, X., Pan, Y., Lin, Y., and Huang, B.: Agricultural ammonia emissions in China: reconciling bottom-up and top-down estimates, Atmos. Chem. Phys., 18, 339–355, https://doi.org/10.5194/acp-18-339-2018, 2018.
Zhang, Q., Yu, Y., Zhang, W., Luo, T., and Wang, X.: Cloud detection from FY-4A's geostationary interferometric infrared sounder using machine learning approaches, Remote Sens., 11, 3035, https://doi.org/10.3390/rs11243035, 2019.
Zhang, X., Wu, Y., Liu, X., Reis, S., Jin, J., Dragosits, U., Van Damme, M., Clarisse, L., Whitburn, S., Coheur, P.-F. O., and Gu, B.: Ammonia emissions may be substantially underestimated in China, Environ. Sci. Technol., 51, 12089–12096, https://doi.org/10.1021/acs.est.7b02171, 2017.
Zhang, X. M., Ren, C. C., Gu, B. J., and Chen, D. L.: Uncertainty of nitrogen budget in China, Environ. Pollut., 286, 117216, https://doi.org/10.1016/j.envpol.2021.117216, 2021.
Zhang, Y., Liu, X., Zhang, F., Ju, X., Zou, G., and Hu, K.: Spatial and temporal variation of atmospheric nitrogen deposition in the North China Plain, Acta Ecologica Sinica, 26, 1633–1638, https://doi.org/10.1016/S1872-2032(06)60026-7, 2006.
Zhou, F., Ciais, P., Hayashi, K., Galloway, J., Kim, D.-G., Yang, C., Li, S., Liu, B., Shang, Z., and Gao, S.: Re-estimating NH3 emissions from Chinese cropland by a new nonlinear model, Environ. Sci. Technol., 50, 564–572, https://doi.org/10.1021/acs.est.5b03156, 2016.