the Creative Commons Attribution 4.0 License.
the Creative Commons Attribution 4.0 License.
 | 13 Jul 2022
Particle phase-state variability in the North Atlantic free troposphere during summertime is determined by atmospheric transport patterns and sources
Zezhen Cheng
Megan Morgenstern
Bo Zhang
Matthew Fraund
Nurun Nahar Lata
Rhenton Brimberry
Matthew A. Marcus
Lynn Mazzoleni
Paulo Fialho
Silvia Henning
Birgit Wehner
Claudio Mazzoleni
Free tropospheric aerosol particles have important but poorly constrained climate effects due to transformations of their physicochemical properties during long-range transport. In this study, we investigate the chemical composition and provide an overview of the phase states of individual particles that have undergone long-range transport over the North Atlantic Ocean in June and July 2014, 2015, and 2017 to the Observatory of Mount Pico (OMP) in the Azores. The OMP is an ideal site for studying long-range-transported free tropospheric particles because local emissions have a negligible influence and contributions from the boundary layer are rare. We used the FLEXible PARTicle Lagrangian particle dispersion model (FLEXPART) to determine the origins and transport trajectories of sampled air masses and found that most of them originated from North America and recirculated over the North Atlantic Ocean. The FLEXPART analysis showed that the sampled air masses were highly aged (average plume age >10 d). Size-resolved chemical compositions of individual particles were probed using computer-controlled scanning electron microscopy with an energy-dispersive X-ray spectrometer (CCSEM-EDX) and scanning transmission X-ray microscopy with near-edge X-ray absorption fine structure spectroscopy (STXM-NEXAFS). CCSEM-EDX results showed that the most abundant particle types were carbonaceous (∼ 29.9 % to 82.0 %), sea salt (∼ 0.3 % to 31.6 %), and sea salt with sulfate (∼ 2.4 % to 31.5 %). We used a tilted stage interfaced within an environmental scanning electron microscope (ESEM) to determine the phase states of individual submicron particles. We found that most particles (∼ 47 % to 99 %) were in the liquid state at the time of collection due to inorganic inclusions. Moreover, we also observed substantial fractions of solid and semisolid particles (∼ 0 % to 30 % and ∼ 1 % to 42 %, respectively) during different transport patterns and events, reflecting the particles' phase-state variability for different atmospheric transport events and sources. Combining phase state measurements with FLEXPART CO tracer analysis, we found that wildfire-influenced plumes can result in particles with a wide range of viscosities after long-range transport in the free troposphere. We also used temperature and RH values extracted from the Global Forecast System (GFS) along the FLEXPART-simulated path to predict the phase state of the particles during transport and found that neglecting internal mixing with inorganics would lead to an overestimation of the viscosity of free tropospheric particles. Our findings warrant future investigation aiming at the quantitative assessment of the influence of internal mixing on the phase states of the individual particles. This study also provides insights into the chemical composition and phase state of free tropospheric particles, which can help models to reduce uncertainties about the effects of ambient aerosol particles on climate.
- Article
(7761 KB) - Full-text XML
-
Supplement
(3377 KB) - BibTeX
- EndNote


Atmospheric aerosol particles play a vital role in regional and global climates. They influence the climate by interacting with solar and terrestrial radiation and by interacting with clouds when acting as cloud droplet condensation and heterogeneous ice nuclei (Bellouin et al., 2020; Bond et al., 2013; Fan et al., 2016; Laskin et al., 2015; Moosmüller et al., 2009; Saleh, 2020). The efficiency of atmospheric particles acting as cloud droplets or ice nuclei strongly depends on their chemical composition and physical properties (Fan et al., 2016; Myhre, et al., 2013; Seinfeld et al., 2016). However, the current understanding of the climate effects of atmospheric aerosols is still limited. One reason for such a gap in our understanding is that atmospheric aerosols have a wide range of viscosities and exhibit different phase states (e.g., solid (viscosity >1012 Pa s), semisolid (102 to 1012 Pa s), and liquid (<102 Pa s)) (Reid et al., 2018; Virtanen et al., 2010, 2011). The viscosity affects the ability of the particle to participate in several important atmospheric processes, such as cloud condensation (Hodas et al., 2015; Liu et al., 2018b), heterogeneous ice nucleation (more viscous or solid particles can promote ice formation) (Berkemeier et al., 2014; Knopf et al., 2018; Murray et al., 2010; Reid et al., 2018; Sharma et al., 2018), and the atmospheric aging process (e.g., higher viscosity reduces atmospheric reactivity and therefore slows aging) (Berkemeier et al., 2016; Kuwata and Martin, 2012; Liu et al., 2018a; Marshall et al., 2016; Pöschl and Shiraiwa, 2015a; Renbaum-Wolff et al., 2013). Several studies have found that the viscosity of atmospheric aerosols is affected by factors such as the emission source, formation mechanism, material properties, chemical composition, and ambient conditions (Koop et al., 2011; Li et al., 2020; Shiraiwa et al., 2017; Shrivastava et al., 2017; Virtanen et al., 2010). Several studies have focused on the viscosity and/or phase state of atmospherically relevant submicron-sized particles (Bateman et al., 2014, 2015; Hosny et al., 2016; Jain and Petrucci, 2015; Li et al., 2017; Pajunoja et al., 2016; Renbaum-Wolff et al., 2013; Virtanen et al., 2010), but only a few studies have reported field measurements of the phase state of ambient particles (Bateman et al., 2016, 2017; Liu et al., 2017, 2019; Pajunoja et al., 2016; Slade et al., 2019), and even more sparse are studies of the aerosol phase state at high altitude in the free troposphere (FT). This data gap is due to limitations of the measurement techniques. Such limitations stem from the low particle concentrations at remote sites, particle sizes beyond the instrument's detection range, and the challenges involved in directly measuring the phase states of individual particles. These drawbacks can be addressed by collecting aerosols on substrates and applying offline aerosol phase-state analysis. One example of such an analysis is to use tilted SEM imaging to determine the phase states of particles based on the shapes they acquire upon impacting the substrate. In fact, solid, semisolid, and liquid organic particles will deform to near spheric, dome-like, and flat shapes, respectively, when they impact on the substrates (Cheng et al., 2021; Reid et al., 2018; Sharma et al., 2018; Wang et al., 2016). Based on this approach, we applied a new analytical platform that uses tilted environmental scanning electron microscope (ESEM) imaging to directly observe and assess the phase states of particles based on their shape deformation on the substrate (Cheng et al., 2021).
The FT is the atmospheric layer that extends above the planetary boundary layer (PBL) from about 1 km altitude to the tropopause (Seinfeld and Pandis, 2006). Particles are injected into the FT mainly through convection and frontal uplift or are formed by the oxidation of precursor gases (North et al., 2014). In turn, FT aerosols can be transported to the PBL via entrainment (De Wekker and Kossmann, 2015), dry deposition (Zufall and Davidson, 1998), and dry intrusions, which are events in which cold, dry air rapidly descends from the FT down to the PBL (Ilotoviz et al., 2021; Raveh-Rubin, 2017; Raveh-Rubin and Catto, 2019; Tomlin et al., 2021). The chemical composition of FT aerosols is complex (Bondy et al., 2018; Cozic et al., 2008; Dzepina et al., 2015; Schum et al., 2018; Zhou et al., 2019) and continuously evolves, since FT aerosols typically have long lifetimes and are transported over long distances before reaching remote locations (Cozic et al., 2008; Gogoi et al., 2014; Haywood and Boucher, 2000; Huang et al., 2008). Thus, FT aerosols have longer atmospheric aging times to experience more physical interactions and chemical reactions with other atmospheric components, leading to more complex physical and chemical properties (Dunlea et al., 2009; Gogoi et al., 2014; Huang et al., 2008; Jaffe et al., 2005; Laing et al., 2016; Sun et al., 2009; Zhou et al., 2019). Several previous studies focused on FT aerosols at remote sites, improving our understanding of local aerosols and aerosols transported over long ranges (Boose et al., 2016; China et al., 2015, 2017; Clarke et al., 2013; Dzepina et al., 2015; Rinaldi et al., 2015; Rose et al., 2017; Schum et al., 2018; Zhou et al., 2019). For instance, Dzepina et al. (2015) conducted a study at the Observatory of Mount Pico (OMP) during the summer of 2012; they found that FT aerosols underwent atmospheric oxidation such as photooxidation and aqueous-phase reactions (e.g., cloud processing) during long-range transport by evaluating their chemical and physical properties. Moreover, Zhou et al. (2019) reported that organic aerosols in the FT were more oxidized and less volatile than those in the boundary layer, based on a study at the Mount Bachelor Observatory. Similarly, after analyzing samples collected at the OMP during summertime, Schum et al. (2018) found that FT organic aerosols might be more viscous than PBL aerosols due to lower ambient temperature and relative humidity (RH) values, suggesting that FT organic aerosols might be less reactive than PBL organic particles. FT aerosols also indirectly affect the climate by changing cloud albedo, since they can act as cloud condensation nuclei (CCN) and ice-nucleating particles (INP) (China et al., 2017; Clarke et al., 2013; Rose et al., 2017), and their chemical composition, particle size, mixing state, and phase state can affect their roles as CCN and INP (Ching et al., 2017; King et al., 2012; Knopf et al., 2018; Murray et al., 2010; Riemer et al., 2019; Schmale et al., 2017; Wang et al., 2010). Therefore, a better understanding of the chemical composition and phase state of FT aerosols would improve the estimation of aerosol climate effects in current models. In this study, we focus on the chemical composition and phase state of FT aerosols and their correlation.
High-altitude mountaintop observatories are often used to study FT particles and atmospheric chemistry due to their advantages with respect to airborne field studies, such as lower costs and long-term continuous measurements (Zhou et al., 2019). Various mountaintop sites are operating all over the world to investigate the properties of FT aerosols and trace gases, such as the High Altitude Research Station Jungfraujoch, Switzerland (Bianchi et al., 2016; Boose et al., 2016; Cozic et al., 2008; Motos et al., 2020), Mt. Cimone station in Italy (Fischer et al., 2003; Marinoni et al., 2008; Rinaldi et al., 2015), Mount Bachelor Observatory in central Oregon, USA (Briggs et al., 2016; Weiss-Penzias et al., 2006; Zhou et al., 2019), and the OMP in the North Atlantic Ocean (Dzepina et al., 2015; Val Martin et al., 2008b). Along with these sites, the OMP is an ideal site for studying FT aerosols that are transported over long ranges from North America to Europe and have negligible contributions from local sources (Val Martin et al., 2008a, b), and it is one of the sites that is least influenced by the PBL (Collaud Coen et al., 2018). The OMP is located in the summit caldera of the Pico Volcano (2225 m a.s.l.) on Pico Island in the Azores archipelago in the North Atlantic. The influences of local emissions and the marine boundary layer during summer on the air masses sampled at the site are typically negligible, making the OMP an excellent location for long-range-transported FT particles above the North Atlantic Ocean (Schum et al., 2018).
In this study, we present an overview of the overall phase state of individual FT atmospheric internally mixed aerosol particles collected at OMP over 3 different years: in July 2014 (“Pico 2014”), June and July 2015 (“Pico 2015”), and 2017 (“Pico 2017”). Analyses of samples from the 3 years using tilted-view ESEM imaging and scanning transmission X-ray microscopy with near-edge X-ray absorption fine structure spectroscopy (STXM-NEXAFS) to study the phase states of individual particles are reported. The chemical compositions and phase states of individual particles in Pico 2014 samples have been reported in a previous study (Lata et al., 2021). The chemical compositions of individual particles in Pico 2015 samples will be discussed in future work. This study focuses on detailed individual particle analysis of the Pico 2017 samples. We performed FLEXible PARTicle Lagrangian particle dispersion model (FLEXPART) simulations to select specific events to retrieve the origins, transport trajectories, atmospheric aging times, temperatures, and relative humidities of the sampled air masses along the transport path. We applied multimodal microspectroscopy techniques to probe the chemical composition and phase state of aged and long-range-transported particles. This study highlights how the phase state of FT particles varies during different atmospheric transport events by combining probabilistic FLEXPART back-trajectory analysis with chemical composition data.
2.1 Sampling site and sample collection
Samples of atmospheric particles were collected at the OMP, which is located in the summit caldera of the Pico Volcano (at 2225 m.a.s.l., 38.47∘ N, 28.40∘ W) in the Azores, Portugal (Dzepina et al., 2015; Honrath et al., 2004; Val Martin et al., 2008b). Pico 2014 and Pico 2015 samples were collected during July 2014 and June and July 2015 at the OMP, and details of the sampling times and conditions are listed in Table S1 in the Supplement. Pico 2017 samples were collected during June and July 2017, and Table S2 reports the corresponding sampling times and environmental conditions. Available hourly temperatures and RH variations are shown in Fig. S2 in the Supplement. Additional experimental details are provided in the Supplement. The same collection and storage protocol was used for all Pico samples from all 3 years. All samples were collected on TEM B-film grids (300 mesh, Ted Pella, Inc.) and lacey formvar grids (300 mesh, Ted Pella, Inc.) using a four-stage cascade impactor (MPS-4G1) at a flow rate of ∼7 L min−1 for multimodal microspectroscopy analysis. Particles were collected on the third and/or fourth stages of the impactor with 50 % cutoff aerodynamic diameters of >0.15 and >0.05 µm, respectively (see Tables S1 and S2). Samples were placed in dedicated storage boxes wrapped in Al foil and kept in zip lock bags immediately after collection to avoid exposure to light and the outside air, which is a typical sample storage strategy for field-collected aerosol samples (e.g., Adachi and Buseck, 2011; Kirillova et al., 2016; Marsh et al., 2017; Stockwell et al., 2016). The samples were then stored in ambient conditions to reduce the chances of particle modifications and oxidation. However, we cannot exclude with certainty that some of these transformations might have taken place between the sampling and the analysis times. This is a limitation of any offline analysis of field-collected samples. We underline that the site is quite difficult to access; therefore, samples were delivered and analyzed as soon as this was feasible (less than 1 year after collection). Moreover, from 5 to 21 July 2017, we also deployed a scanning mobility particle sizer (SMPS, TROPOS; for details, see Wiedensohler et al., 2012) coupled with a silica gel diffusion dryer to monitor the dry particle size distribution (<40 % RH) and the total particle concentration with 5 min time resolution (Siebert et al., 2021).
2.2 Origins of sampled air masses using FLEXPART
FLEXPART was used to determine the origins of the sampled air masses and their transport trajectories to OMP (Owen and Honrath, 2009; Seibert and Frank, 2004; Stohl et al., 2005). FLEXPART backward simulations were driven by meteorology fields of the Global Forecast System (GFS), featuring 3 h temporal resolution, 1∘ horizontal resolution, and 26 vertical levels (NCEP, 2017). The output was saved in a grid with a horizontal resolution of 1∘ latitude by 1∘ longitude and 11 vertical levels from the surface to 15 000 m a.s.l. More details of the model configurations can be found in Zhang et al. (2014, 2017). FLEXPART simulated the spatial distribution of the upwind residence times of the observed air masses. Transport trajectories (also called “retroplumes”) of air masses were obtained by integrating the matrices of residence time over time and altitude. We calculated a FLEXPART CO tracer by multiplying the FLEXPART residence times by CO emission inventories from the Emissions Database for Global Atmospheric Research (EDGAR, version 3.2; Olivier and Berdowski, 2001) and the Global Fire Assimilation System (Kaiser et al., 2012) to estimate the influences from anthropogenic and wildfire sources, respectively (Dzepina et al., 2015). We also extracted ambient temperatures and relative humidities along the FLEXPART-simulated transport pathways by sampling the meteorological conditions in the GFS fields for each aerosol sample. The ambient temperature and relative humidity were used to estimate the aerosol phase state during transport (Schum et al., 2018).
2.3 Microspectroscopic analysis of individual particles
The particles collected from the OMP were analyzed with STXM-NEXAFS and computer-controlled scanning electron microscopy with energy-dispersive X-ray spectroscopy (CCSEM-EDX) to probe their physicochemical properties (Laskin et al., 2005, 2006). We utilized an ESEM (Quanta 3D, Thermo Fisher) equipped with an FEI Quanta digital field emission gun operated at 20 kV and 480 pA. Ambient particle samples were analyzed with the ESEM at 293 K under vacuum conditions (∼2 × 10⁻⁶ Torr) and therefore at RH values near zero, which might lead to losses of volatile and semivolatile materials. Moreover, the temperature and RH inside the ESEM chamber differed from those at the OMP during sample collections (about 10 K higher and 6 %–67 % lower, respectively; see Fig. S2). The RH and T affect the phase state of airborne particles; however, our inference of the particle's phase state at the time of collection is based on the shape that the particle acquires at impaction on the substrate, which would be unlikely to change significantly within the ESEM chamber due to adhesion forces between the particle and the substrate. These limitations need to be considered when interpreting our results. ESEM images were used to retrieve the shapes, morphologies, and projected sizes (area-equivalent diameters) of individual particles. The CCSEM, which was equipped with an EDX spectrometer (EDAX, Inc.), and the EDX spectra of individual particles were used to determine the chemical compositions of the particles by quantifying the relative percentages of 15 elements (C, N, O, Na, Mg, Al, Si, P, S, Cl, K, Ca, Mn, Fe, and Zn). Since the EDX analysis of light elements such as C, N, and O is considered semiquantitative and there were C and O contributions from the B-film substrate, we performed postcorrection of the element percentages of C, N, and O (see Sect. S1 and Fig. S1 in the Supplement). The corrected average percentages of those 15 elements in all samples are shown in Fig. S3. All samples are dominated by C, N, and O (the average element percentages of C, N, and O for each sample are 51.3 % to 88.6 %, 0.6 % to 22.0 %, and 7.5 % to 27.9 %, respectively), and the microscopy images show a minor fraction of soot particles, suggesting that most particles are organic rich. Based on their element percentages, each particle in Pico 2017 can be classified as either organic (OC), carbonaceous with nitrogen (CNO), carbonaceous with sulfate (CNOS), sea salt (Na rich), sea salt with sulfate (Na rich with S), dust (Al, Si, Ca, Fe), dust with sulfate (Al, Si, Ca, Fe, S), or others (see Fig. S4). The CCSEM-EDX-based particle classification for Pico 2014 can be found in Lata et al. (2021), and that for Pico 2015 will be discussed in our future work.
We performed STXM-NEXAFS at beamline 5.3.2.2 of the Advanced Light Source (ALS) at the Lawrence Berkley National Laboratory to probe the chemical bonding of carbon functional groups of individual particles. Due to beamline time constraints on the STXM analysis, we focused only on selected samples and a limited number of selected particles (653 for SA1, 208 for SA2, and 425 for SA3 of Pico 2014, 86 for S3 and 37 for S5 of Pico 2015, and 140 for S3-3 and 166 for S4-2 of Pico 2017). STXM uses a focused monochromatic soft X-ray beam generated by the synchrotron light source using a zone plate with 25 nm outer zones. The sample is rastered under the beam, and the transmitted intensity is recorded to create an image. Spectroscopy is done by repeating this process at 111 energies to create a “stack” in which each pixel contains a transmission spectrum (Moffet et al., 2011). STXM-NEXAFS data were also used to calculate the total carbon absorbance (TCA) and the organic volume fraction (OVF). The TCA at each pixel was calculated according to Eq. (1):
where OD320 and OD278 are the optical densities (ODs) at the post-edge (320 eV) and pre-edge (278 eV) of the carbon K-edge, respectively, and the TCAs of individual particles were calculated as an average over each particle (O'Brien et al., 2014). The OD was calculated as
where I0 is the incident X-ray radiation intensity, I is the transmitted intensity, μ is the mass absorption coefficient (cm2 g−1), ρ is the density (g cm−3), and t is the thickness of the particle (cm). Thus, the TCA is proportional to the particle thickness, and it can be used as an indicator of particle thickness (O'Brien et al., 2014; Tomlin et al., 2020). The OVF was calculated based on a previously published method (Fraund et al., 2019). Briefly, we assume that each pixel in a particle is a mixture of elemental carbon (EC), organic (OC), and inorganic (IN) components. Thus, the OVF at each pixel can be calculated as the ratio of the thickness of the organic component (tOC) to the total thickness of that pixel (the sum of the thicknesses of OC, IN, and EC: ), and the OVF of each particle is the average over the different pixels within each particle (Fraund et al., 2019; Moffet et al., 2010; Pham et al., 2017). Based on Eq. (2), the ODs at the pre-edge and post-edge and the sp2 peak (285.4 eV) were used to calculate the thicknesses of OC, IN, and EC, respectively (Fraund et al., 2019). Due to the variability of the μ and ρ values for the different OC and inorganic species, we used (NH4)2SO4 as a surrogate for the IN of the particles based on the particles' average elemental composition retrieved from the CCSEM-EDX measurements (see Sect. 3.2.1), and we used oxalic acid (C2H2O4) as a surrogate for the organic components since oxalic acid has been shown to be abundant in ambient organic particles and has a representative oxygen-to-carbon ratio that is similar enough to that of ambient organic particles (Fraund et al., 2019; Sorooshian et al., 2006; Yamasoe et al., 2000).
In addition, OD values at four critical energies (pre-edge, sp2, –COOH (288.5 eV), and post-edge) acquired from STXM spectra were used to classify the regions in an individual particle as OC (OD288.5–OD278>0), IN ( >0.5), or EC () >0.35), based on a previously published method (Fraund et al., 2019; Moffet et al., 2010, 2013). We classified each particle into six typical classes based on the volume fractions of OC, EC, and IN: (1) OC rich (OC is greater than 96 % and both EC and IN are less than 2 %); (2) EC rich (EC is greater than 96 % and both OC and IN are less than 2 %); (3) IN rich (IN is greater than 96 % and both OC and EC are less than 2 %); (4) OCEC (both OC and EC are greater than 2 % and IN is less than 2 %); (5) OCIN (both OC and IN are greater than 2 % and EC is less than 2 %); and (6) OCINEC (OC, EC, and IN are all greater than 2 %).
2.4 Tilted imaging
We utilized tilted-view imaging combined with ESEM to estimate the phase states of particles based on their shapes. For each sample, we evaluated more than 150 randomly selected particles. Moreover, tilted-view imaging and CCSEM-EDX experiments were performed independently. Typically, the shapes of solid, semisolid, and liquid organic particles are near-spherical, dome-like, and flat, respectively, when they impact on the surface of a substrate (Reid et al., 2018). For organic materials with solid inorganic (e.g., dust, soot, and salt) inclusions, the particle shape might be irregular and may not follow the corrected aspect ratio threshold we proposed for organics (Cheng et al., 2021). Therefore, this study investigates only the phase states of organic particles that are not irregular in shape. To quantitatively assess the phase states of particles, we use the corrected aspect ratio of the particle (corrected particle width height ratio () retrieved from tilted SEM images. A higher aspect ratio means that the particle deformed significantly upon impaction and is more liquid (less viscous) (Cheng et al., 2021; Reid et al., 2018; Sharma et al., 2018; Wang et al., 2016). In this study, we used the same method introduced in Cheng et al. (2021) to retrieve the corrected aspect ratios of the particles. Briefly, we first calculated the tilted aspect ratio using the maximum particle lengths in the horizontal and vertical directions in the tilted ESEM images (Wtilted and Htilted, respectively) at a tilted view angle of 75∘ (tilted aspect ratio = ()), where Htilted is the projection of the arc from the top to the base onto the horizontal plane and Wtilted is the projection of the base width onto the horizontal plane, which is equal to Wcorrected. The shape will appear circular in the tilted SEM images for solid spherical organic particles (Wtilted and Htilted are equal to Wcorrected and Hcorrected, respectively). Thus, the tilted aspect ratio is equal to the corrected aspect ratio for solid spherical particles. However, the shapes of semisolid and liquid organic particles will be distorted in the vertical direction (Wtilted=Wcorrected, but Htilted>Hcorrected). When the particle is extremely flat (it is in a liquid state and has very low viscosity), Htilted is the projection of the vertical diameter of the base onto the horizontal plane. Thus, in this case, the measured tilted aspect ratio is greater than or equal to 1 cos(tilt angle) (= 3.86 in this study). Therefore, we consider any particles with a measured aspect ratio from tilted SEM images of greater than 3.86 as biased, and we assigned an aspect ratio of 3.86 to them due to the extremely flat shape of the particle. To retrieve the correct aspect ratios of semisolid and solid particles, we applied the same conversion of tilted aspect ratios suggested by Cheng et al. (2021) when the tilted aspect ratio was greater than 1.3. Thus, all aspect ratios discussed throughout this manuscript are the corrected aspect ratios. Then, we applied previously proposed corrected aspect ratio thresholds to categorize the phase states of particles; these thresholds were 1.00 to 1.30, 1.30 to 1.85, and >1.85 for solid, semisolid, and liquid states, respectively (Cheng et al., 2021). These thresholds were determined based on known RH-dependent glass transitions of organic materials (e.g., Suwannee River fulvic acid (SRFA)) on the same grid type (Carbon Type-B TEM grids, Ted Pella Inc.) as used in this study (Cheng et al., 2021). Using the same grid type should minimize the effect of changes in surface tension and wettability, which might potentially affect the contact angle and therefore the aspect ratios. Although tilted imaging can provide a direct and convenient measurement of the particle phase state, potential differences between the temperature and RH inside the ESEM chamber and those at the sampling site might cause deformation of the particles.
3.1 Transport patterns and air mass sources
In this section, we discuss the influences of varying plume ages, transport patterns, and air mass sources on the physicochemical properties of FT aerosols. We used FLEXPART retroplumes to examine transport patterns for the Pico 2017 samples up to 20 d upwind (Fig. 1) and the FLEXPART CO tracer to estimate plume ages and the relative contributions of anthropogenic and wildfire emissions (Fig. S5). Transport patterns and CO source contributions for all 2014, 2015, and 2017 samples are listed in Table 1. The plume ages and relative contributions from anthropogenic and biomass-burning emissions can reveal air mass sources, types, and transport patterns. Although they do not directly reflect aerosol sources and ages, they are still good indicators to help interpret observed aerosol properties, especially in comparisons of different samples. We also analyzed the vertical distribution of air mass residence time (Fig. S6 for S3-1 to S4-4 and Fig. S7b, d, f, h, j, and i for S1 to S6) and the temperature and RH during transport to gain a better understanding of the ambient conditions that are critical for aerosol property transitions. Figure 1a shows that sample S3-1 was collected during a 6 d period of recirculation over the North Atlantic Ocean. About 80 % of the S3-1 air masses were contributed by anthropogenic emissions from North America based on the contribution of CO sources, and this sample was also expected to have been influenced by ocean sea sprays due to its long residence time over the ocean and the air mass contributions from the marine boundary layer (Fig. S6a). All the other samples (Fig. 1b to h) were dominated by air masses from North America but differed in transport pathways, travel distances, and impacts of anthropogenic and wildfire emissions. Although samples S3-2 and S3-3 were collected on the same day, the CO contributions of the sources were different, with greater contributions from North American anthropogenic sources for S3-2 (∼ 47 %) compared to S3-3 (∼ 31 %) (Table 1). Moreover, retroplumes also show that S3-3 received larger air masses from Central America than S3-2. Air masses of S3-4 were transported across the United States (contribution from anthropogenic CO sources: ∼ 21 %) and then combined with outflow from Asia (contribution from anthropogenic CO sources: ∼ 63 %). Air masses of S4-1, S4-3, and S4-4 were transported across the United States and received air masses from Canada, and the transport periods from North America to the OMP were approximately 7, 5, and 5 d, respectively. Air masses of S4-2 were transported from the Arctic and then transported across Canada, and the transport period for the S4-2 air masses from Canada to the OMP was roughly 5 d. For S4-1 to S4-4, wildfire emissions also provided significant CO contributions (∼ 21 %, ∼ 35 %, ∼ 50 %, and ∼ 44 %, respectively) (Table 1 and Fig. S5). The estimated average plume ages are listed in Table 1. As shown in Table 1, all samples were highly aged during long-range transport and had similar aging times (∼ 13 d). Sample S4-4 had the shortest aging time (∼ 11 d), and the samples S4-1 and S4-2 had the longest aging times (∼ 14 d).
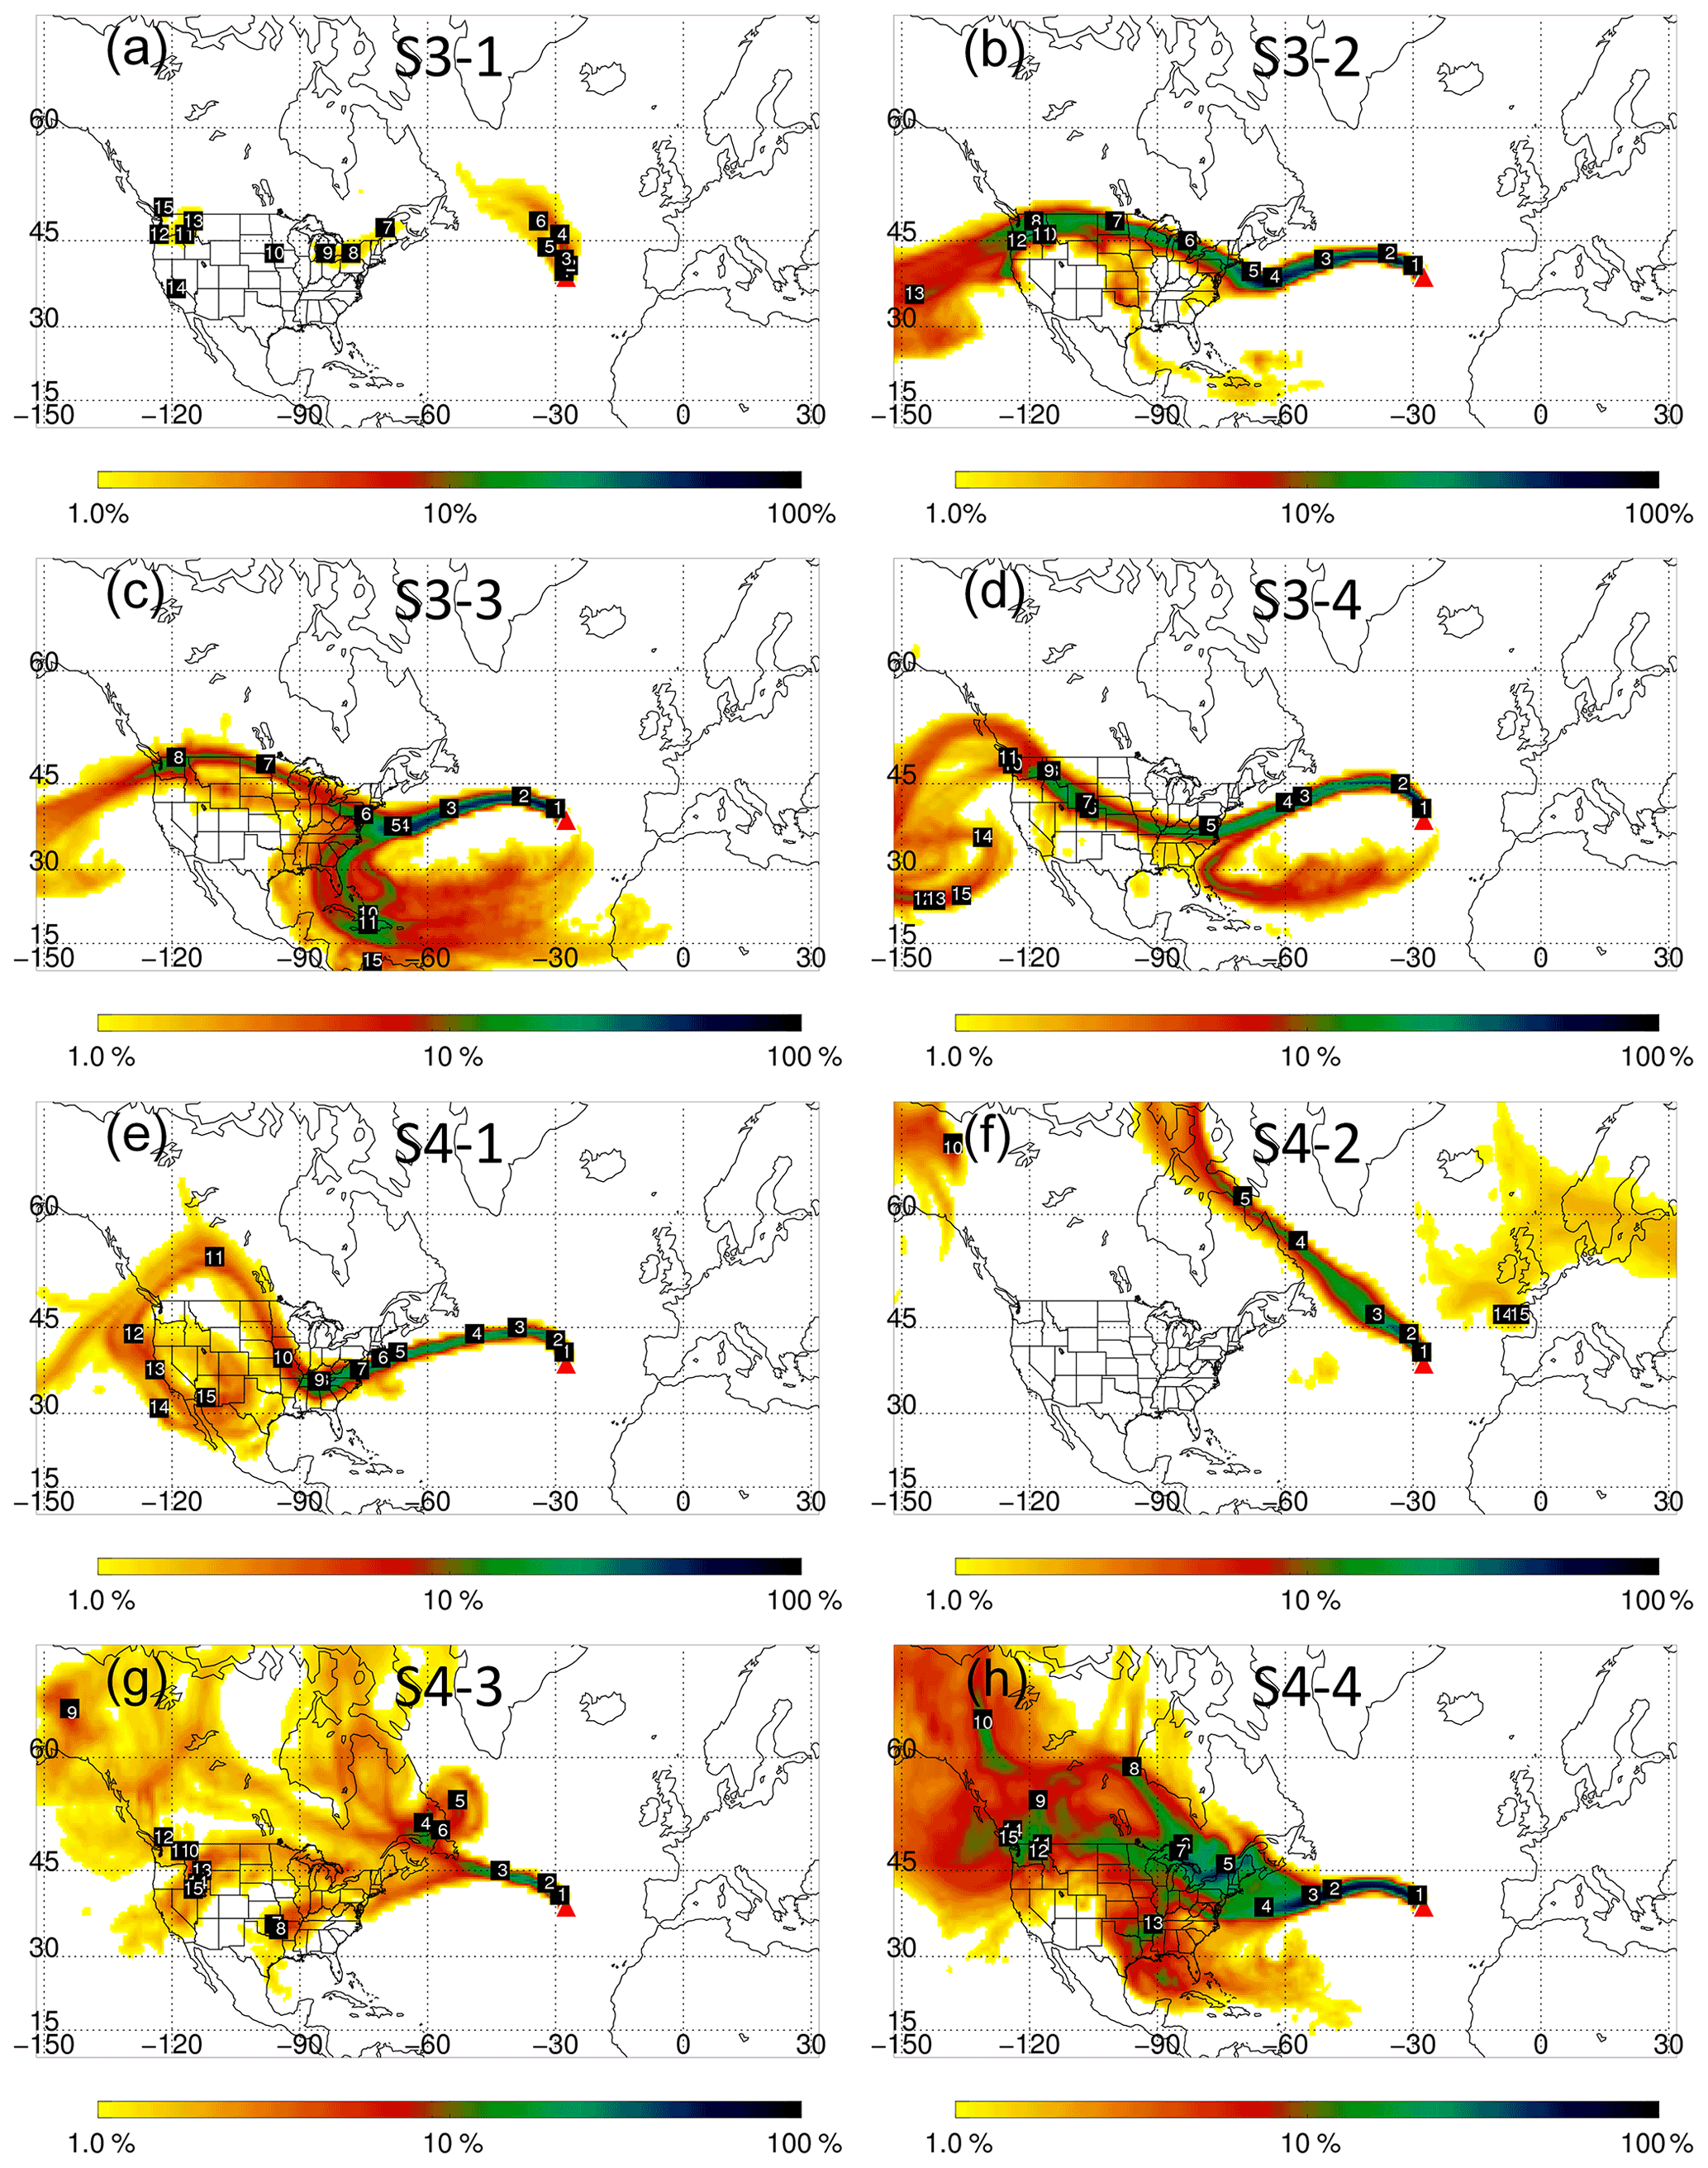
Figure 1Column-integrated residence times over a transport time of 20 d, as retrieved from FLEXPART retroplumes for 2017. (a) S3-1, (b) S3-2, (c) S3-3, (d) S3-4, (e) S4-1, (f) S4-2, (g) S4-3, and (h) S4-4. The vertical distribution of retroplume residence times at given upwind times are shown in Fig. S6. The color bars indicate the ratio of the column-integrated residence time to the maximal residence time at each upwind time on a logarithmic scale, and the x axis and y axis represent latitude and longitude, respectively. The numbers indicate the location of the highest vertically integrated residence time on a given upwind day.
Table 1Summary of the Pico 2014, 2015, and 2017 samples. S3 and S4 Pico 2017 samples were collected on stage 3 (50 % cutoff size: >0.15 µm) and stage 4 (50 % cutoff size: >0.05 µm) of a four-stage cascade impactor (MPS-4G1), respectively. The Pico 2014 samples were collected on stage 3 and the Pico 2015 samples on stages 3 and 4 of the cascade impactor. Percentages of particles in particular phase states were retrieved based on tilted imaging. Additional information on sampling times and conditions and the fractions of different species in each sample based on CCSEM-EDX and STXM-NEXAFS is listed in Tables S1 and S2.
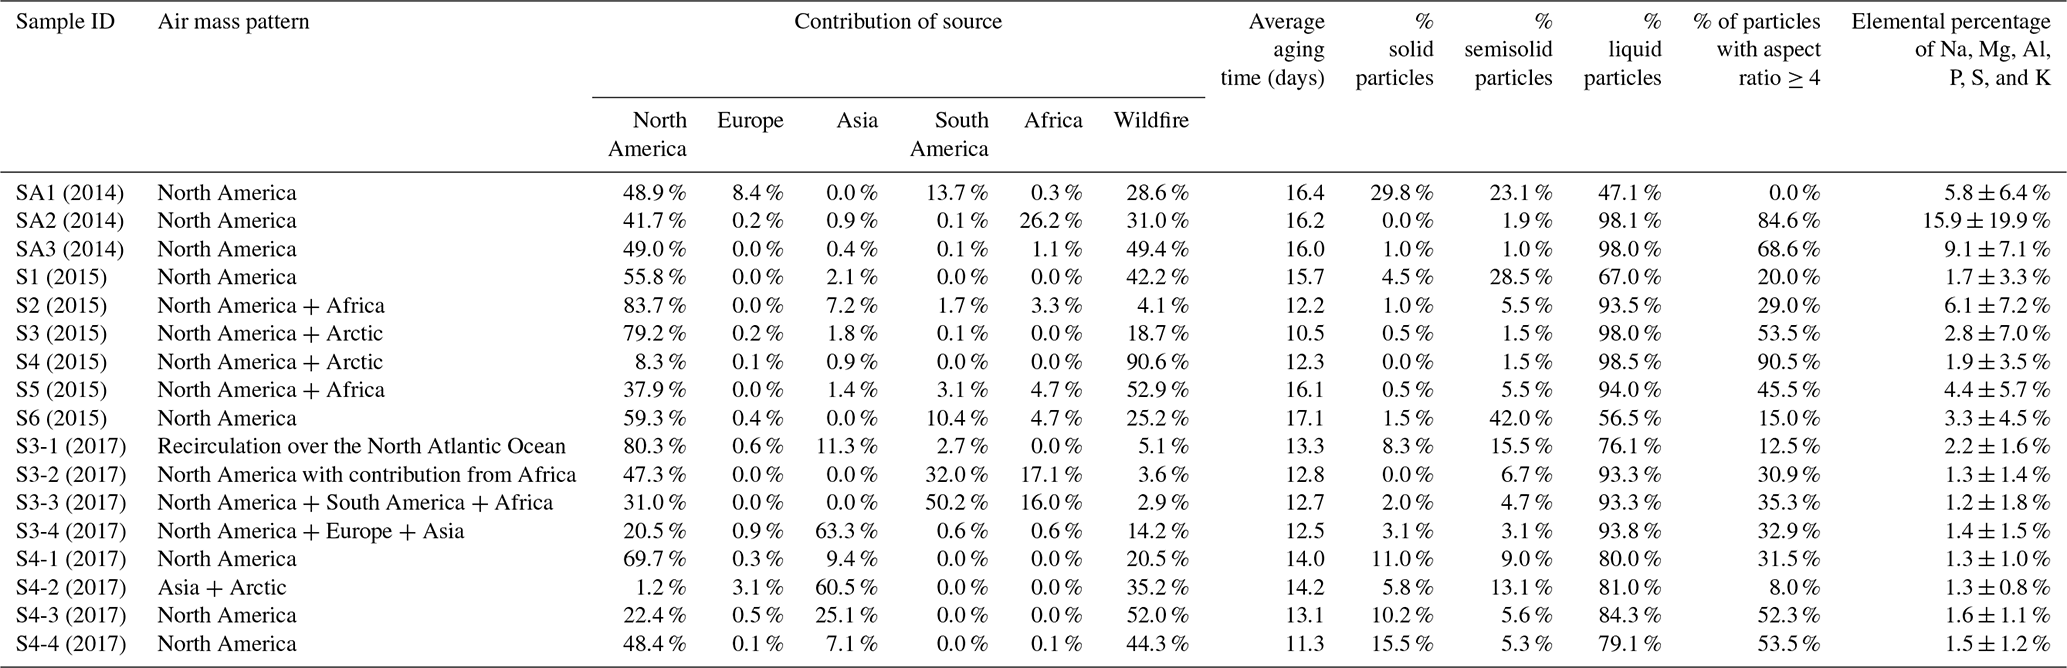
We also performed the same FLEXPART analyses of the Pico 2014 and 2015 samples (SA1 to SA3 and S1 to S6) to trace the retroplumes of air masses and the sources of these air masses, and the results are listed in Table 1. FLEXPART simulation results for Pico 2014 samples have been discussed in Lata et al. (2021). Briefly, air masses for SA1 and SA2 originated in the Eastern US and recirculated over the North Atlantic Ocean, and the air mass for SA3 originated in Canada and the US and recirculated over the North Atlantic Ocean. The average atmospheric aging time for SA1, SA2, and SA3 was ∼ 16 d. Based on the CO tracer analysis, the major CO sources for SA1 were anthropogenic emissions in North America (∼ 49 %), anthropogenic emissions in South America (∼ 8 %), and wildfires in North America (∼ 19 %). For SA2, the major CO sources were North American anthropogenic emissions (∼ 42 %), African anthropogenic emissions (∼ 16 %), and North American wildfires (∼ 31 %). For SA3, anthropogenic (∼ 49 %) and wildfire (∼ 49 %) emissions in North America were the two major CO contributors (Lata et al., 2021). Like the Pico 2014 and Pico 2017 samples, all the Pico 2015 samples originated from North America and then recirculated over the North Atlantic Ocean (Fig. S7). Based on the CO tracer simulations (Fig. S8), the major source of CO for sample S2 was anthropogenic emissions in North America (∼ 84 %), and S1, S3, S5, and S6 were influenced by both anthropogenic and wildfire CO emissions in North America (∼ 56 %, ∼ 79 %, ∼ 38 %, and ∼ 59 % for anthropogenic CO sources, and ∼ 42 %, ∼ 19 %, ∼ 53 %, and ∼ 25 % for wildfire CO sources, respectively). Wildfire emissions in North America are the major CO source for S4 (∼ 91 %). The average aging time for Pico 2015 samples varied between ∼ 10 and ∼ 17 d.
3.2 Chemical characterization of the OMP samples
3.2.1 Chemically resolved size distribution of individual particles
Figure 2 shows the particle size distribution and the total particle concentration based on SMPS measurements at the OMP, and the CO tracer concentrations (retrieved from FLEXPART simulations) in the air masses that arrived at the OMP for the period 5–21 July 2017. The mobility diameter ranged from 30 to 500 nm, and the mode was around 60 ± 22 nm (Fig. 2a). The total particle concentration was around 279 ± 114 # cm−3. The size range, size mode, and particle concentration were comparable to those found in previous studies for FT particles (10–1000, <100 nm, 101 to 104 # cm−3, respectively) (Igel et al., 2017; Rose et al., 2017; Sanchez et al., 2018; Schmeissner et al., 2011; Sun et al., 2021; Venzac et al., 2009; Zhao et al., 2020). Figure 2b shows that the total particle concentrations positively correlate with the CO tracer concentrations from 5 to 12 July and from 18 to 21 July, suggesting that the major sources of particles during these periods might be anthropogenic and wildfire emissions. On the other hand, particle concentrations between late on 12 July and 17 July were above 279 # cm−3, while the CO tracer level was relatively low (<10 ppbv) compared to other days, which might indicate additional sources of particles (e.g., sea spray and dust).
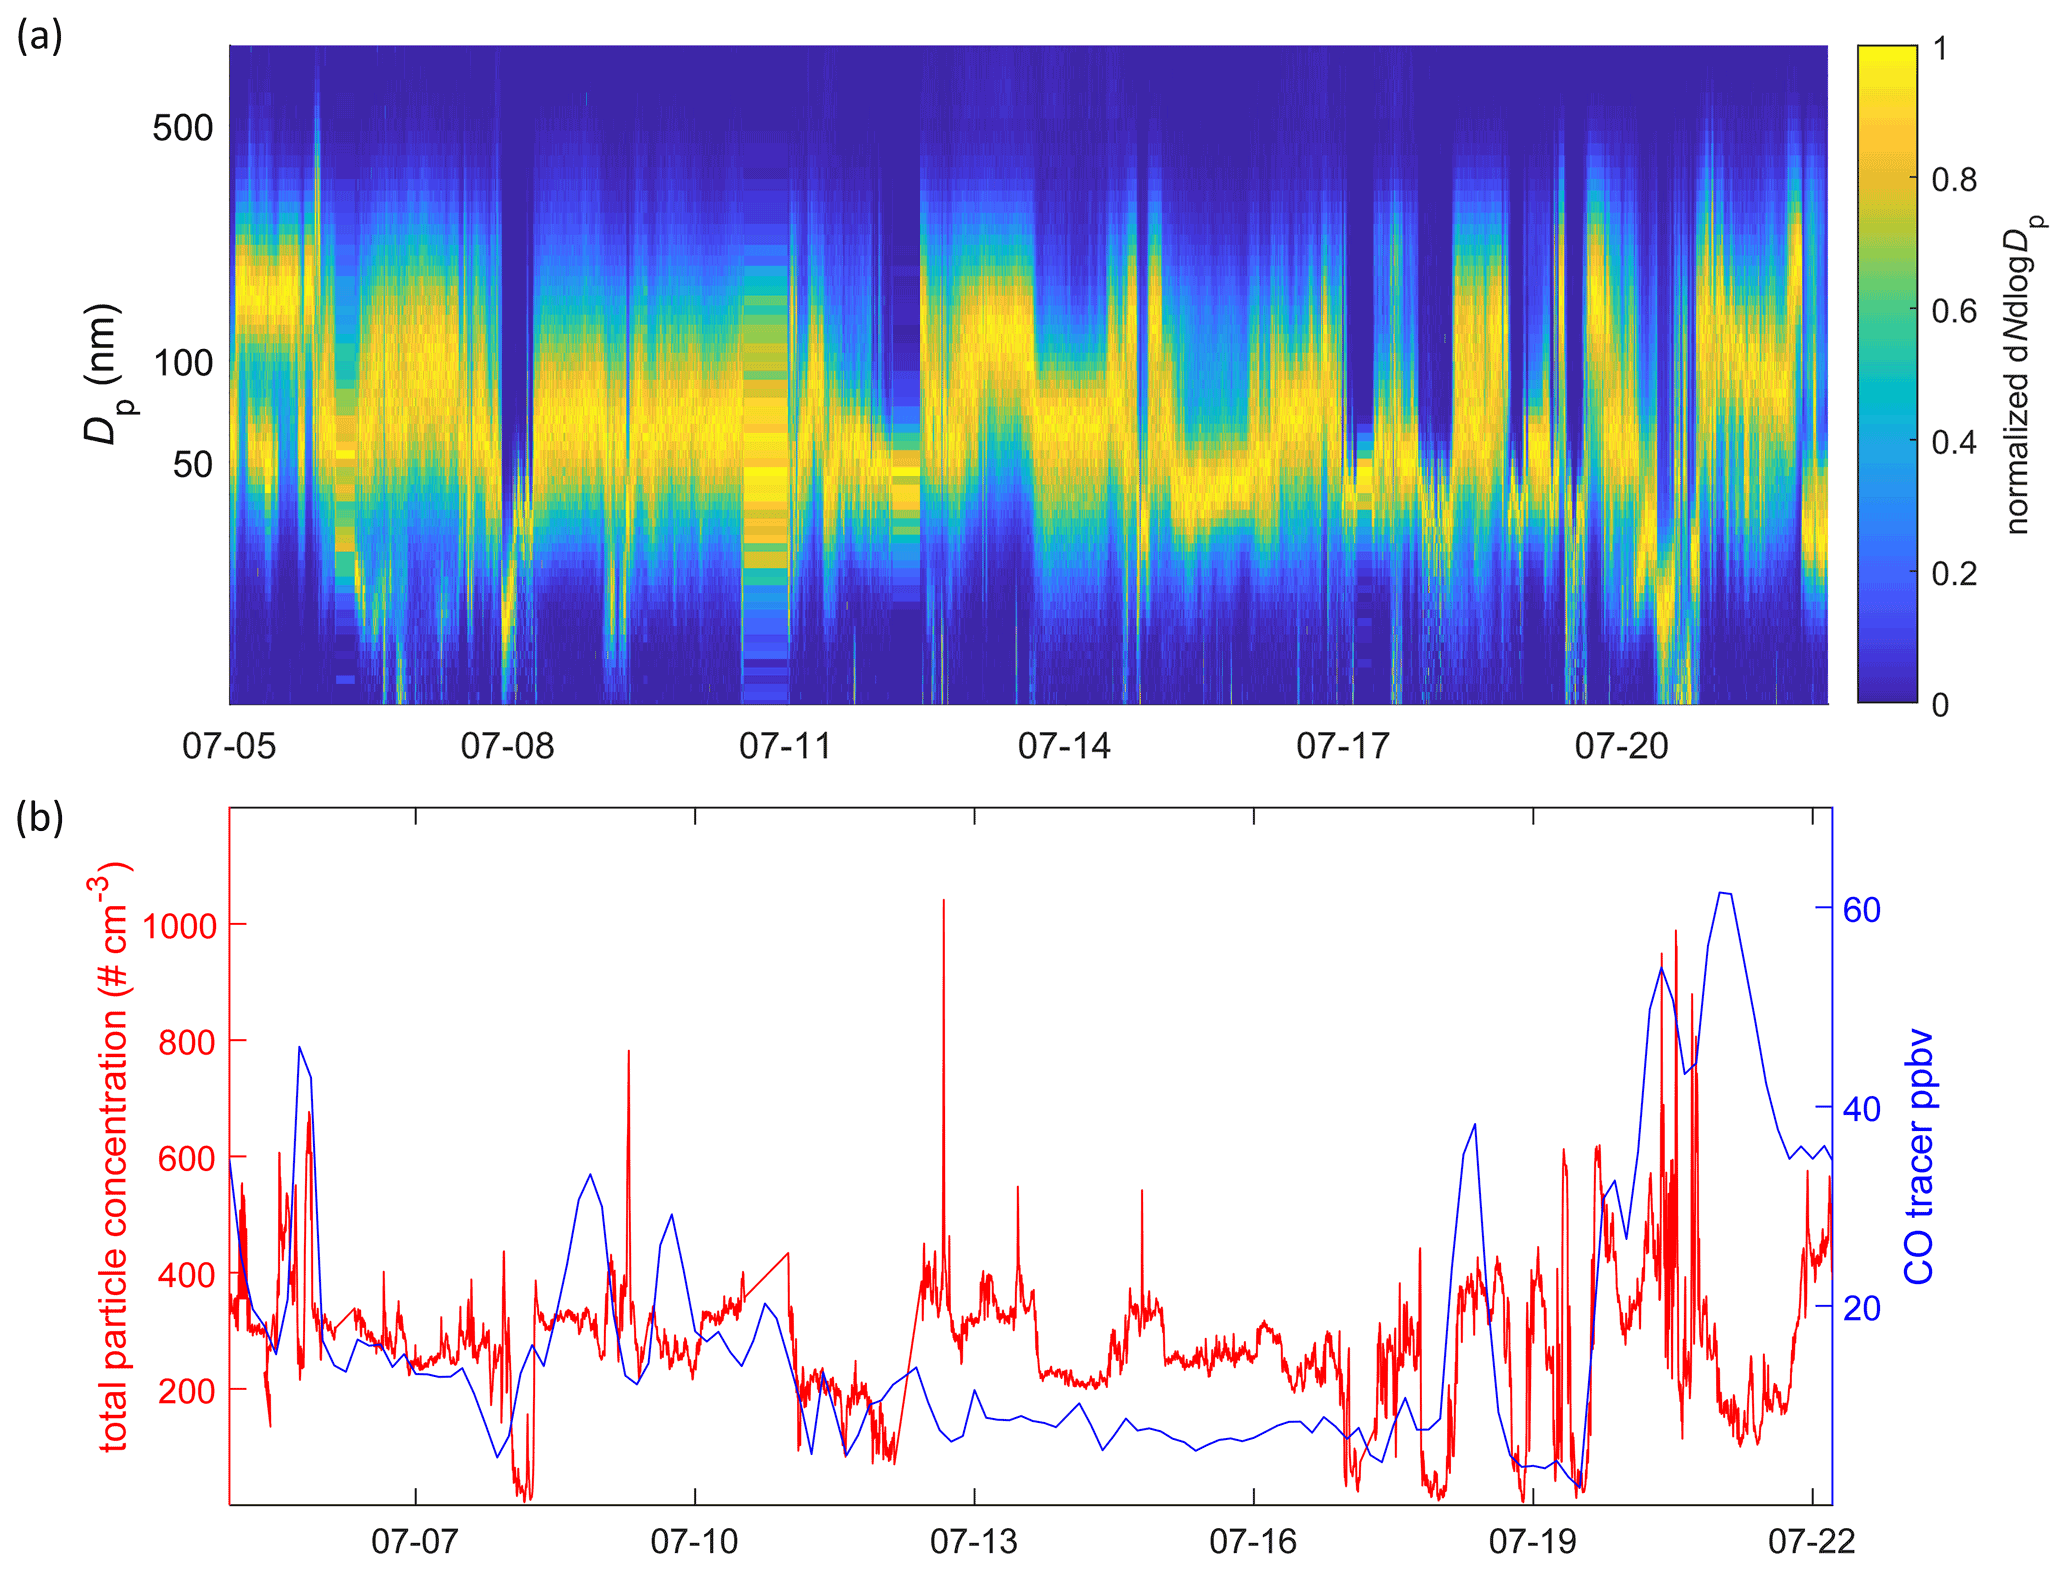
Figure 2(a) Normalized particle size distribution from 10 to 800 nm from SMPS measurements, and (b) the SMPS-derived total particle concentration (left y axis, red line) and CO tracer concentration retrieved from FLEXPART simulations (right y axis, blue line) from 5 to 21 July 2017.
Figure 3 shows chemically resolved size distributions inferred from the CCSEM-EDX data. The number fraction of each particle class in each sample is listed in Table S2. Tilted transmission electron microscopy (tilt angle 70∘) images show that inorganic inclusions (e.g., sea salt, nitrate, sulfate, dust) are internally mixed and coated by organics (Fig. S9). Figure 3a shows the average number fractions of different particle types in each sample, and Fig. 3b to i show chemically specific normalized particle size distributions. Overall, the carbonaceous aerosols (OC+CNO) have the highest number fraction in samples S3-2 to S4-4 (∼ 42 % to 69 %) and the second highest in sample S4-1 (∼ 30 %). Moreover, sea salt particles and sea salt with sulfate particles comprise a significant fraction of each sample (∼ 8.8 % to 31.59 % and ∼ 5.2 % to 31.5 %, respectively). Sea salt particles were typically from marine sprays, since air masses were transported over the North Atlantic Ocean. Sea salt with sulfate particles with area-equivalent diameters greater than 0.6 µm have been shown to be a product of aqueous phase processing (i.e., fog and cloud processing) (Ervens et al., 2011; Kim et al., 2019; Lee et al., 2011, 2012; Zhou et al., 2019), and those with area-equivalent diameters less than 0.6 µm might have been generated from marine sources (Sorooshian et al., 2007; Yu et al., 2005). Sea salt and sea salt with sulfate particles dominated (∼ 28.2 % and ∼ 31.5 %, respectively) sample S3-1, which had a smaller fraction of organic particles (OC and CNO, ∼ 6.3 % and ∼ 23.4 %, respectively) than those in other samples. This result is supported by the FLEXPART retroplumes, which suggested a 6 to 7 d long recirculation over the North Atlantic Ocean, causing marine spray particles to have a more considerable impact. Although sample S3-2 was collected 2 h before S3-3, their chemical compositions differed. S3-2 has more CNO and less OC and sea salt particles than S3-3, which might be due to a larger contribution from Asia and a smaller contribution from South America and the Pacific Ocean than for S3-3 (Table 1 and Fig. 1b and c). Details of the chemically resolved size distribution for Pico 2014 samples have been discussed in Lata et al. (2021). Briefly, all samples (SA1, SA2, and SA3) are dominated by carbonaceous particles (∼ 68 %, ∼ 57 %, and ∼ 67 % by number, respectively). Besides carbonaceous particles, there are high fractions of CNOS particles in SA1 and SA3 (∼ 14 % and ∼ 23 %, respectively), suggesting potential cloud processing. ∼ 11 % of the particles in SA1 are dust, which might have originated from Africa. The fraction of sea salt particles is high in SA2 (∼ 23 %) due to the longer recirculation time over the North Arctic Ocean (∼ 15 d) (Lata et al., 2021). Among the Pico 2015 samples, carbonaceous particles dominate S1 and S3 to S6 (∼ 62 %, ∼ 63 %, ∼ 80 %, ∼ 52 %, and ∼ 61 %, respectively). Sulfate (CNOS and sea salt with sulfate) particles are also abundant in all samples (∼ 18 % to 34 %), suggesting that these particles were possibly involved in cloud processing (Ervens et al., 2011; Kim et al., 2019; Lee et al., 2011, 2012; Zhou et al., 2019). Samples S2 and S5 have high dust contributions (∼ 16 % and ∼ 14 %, respectively) due to air masses from Africa. We will discuss the chemically resolved particle size distributions in more detail in forthcoming work.
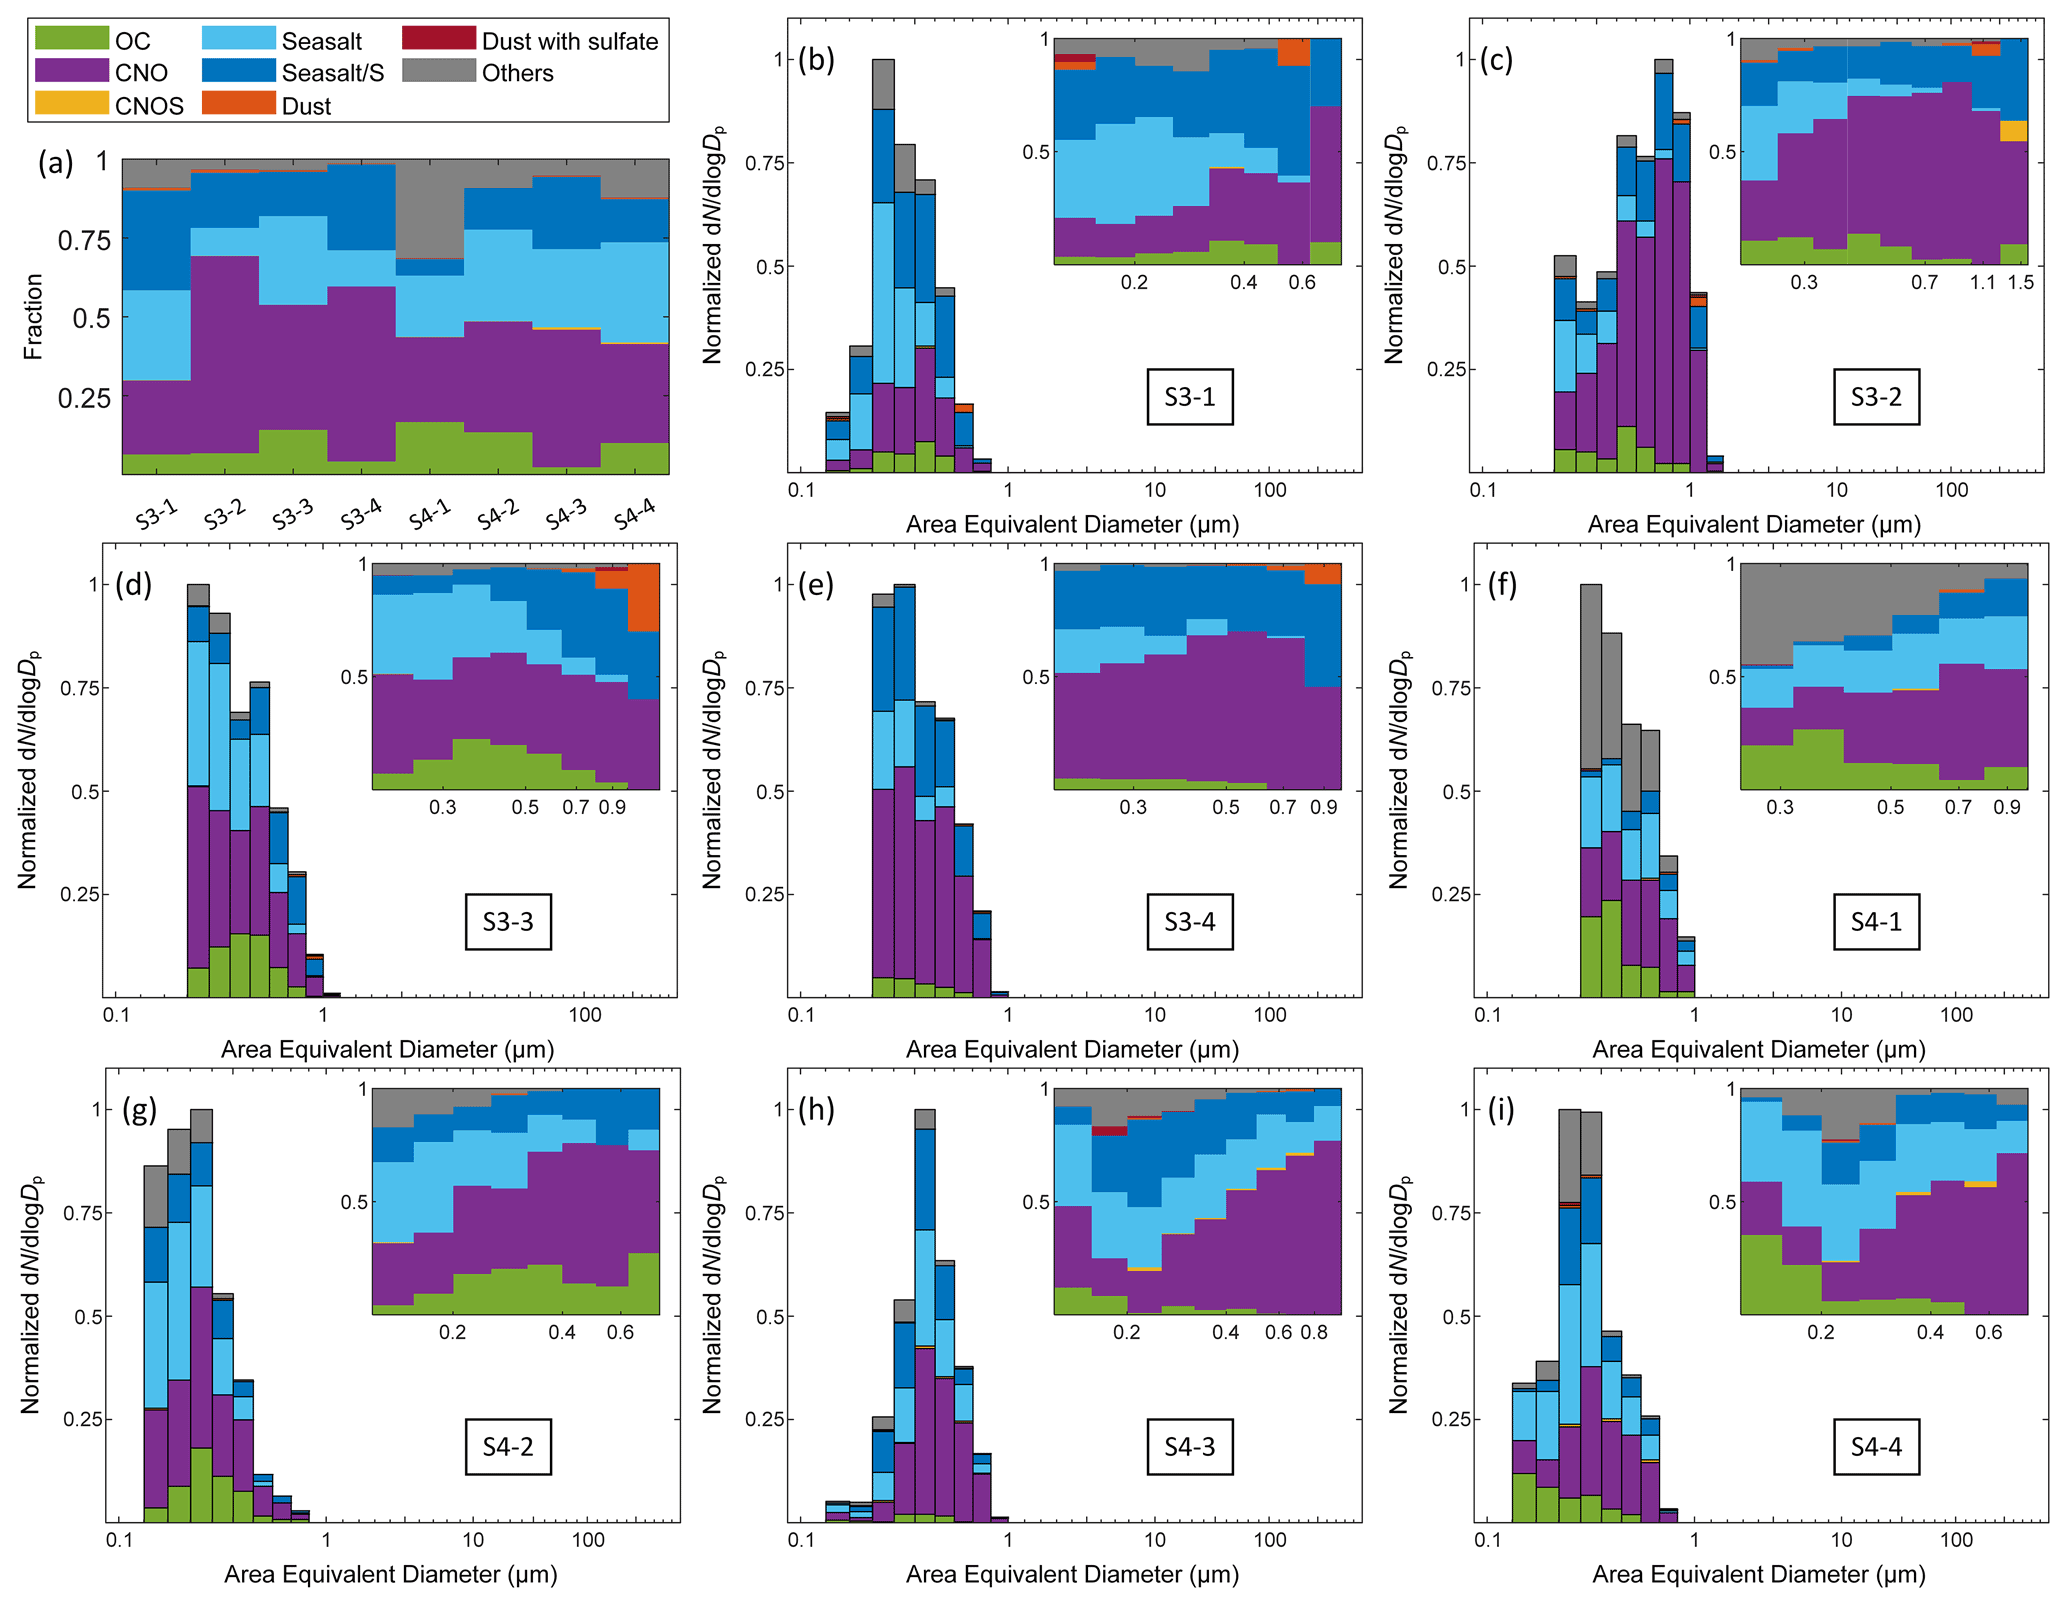
Figure 3Chemically resolved size distributions were inferred from the CCSEM-EDX data for 2017. (a) Fractions of different particle types for all samples. Normalized chemically resolved size distributions of (b) S3-1, (c) S3-2, (d) S3-3, (e) S3-4, (f) S4-1, (g) S4-2, (h) S4-3, and (i) S4-4. Insets represent the normalized number fractions of different particle types as a function of particle size.
3.2.2 Chemical imaging of individual particles
Figure 4 shows STXM-NEXAFS carbon K-edge chemical speciation maps and spectra for four typical particle mixing states of OC (green), IN (cyan), and EC (red) found in S3-3 and S4-2: (a) organic particle (green), (b) EC core (red) coated by OC (green), (c) internally mixed EC (red) and IN (cyan) coated by OC (green), and (d) IN (cyan) coated by OC (green). The STXM-NEXAFS spectra for these four types of particles show that one of the major components of these particles is OC, since the R−COOH (288.5 eV) and (286.5 eV) peaks are more intense. However, the particles also contain inorganic components. Moreover, STXM images (see Fig. 4) indicate that the particles are internally mixed and coated by organic species, suggesting that our samples might be highly aged during transport in the FT (China et al., 2015; Motos et al., 2020). This observation is consistent with our tilted TEM images showing that EC and IN inclusions were internally mixed with organics (Fig. S9).
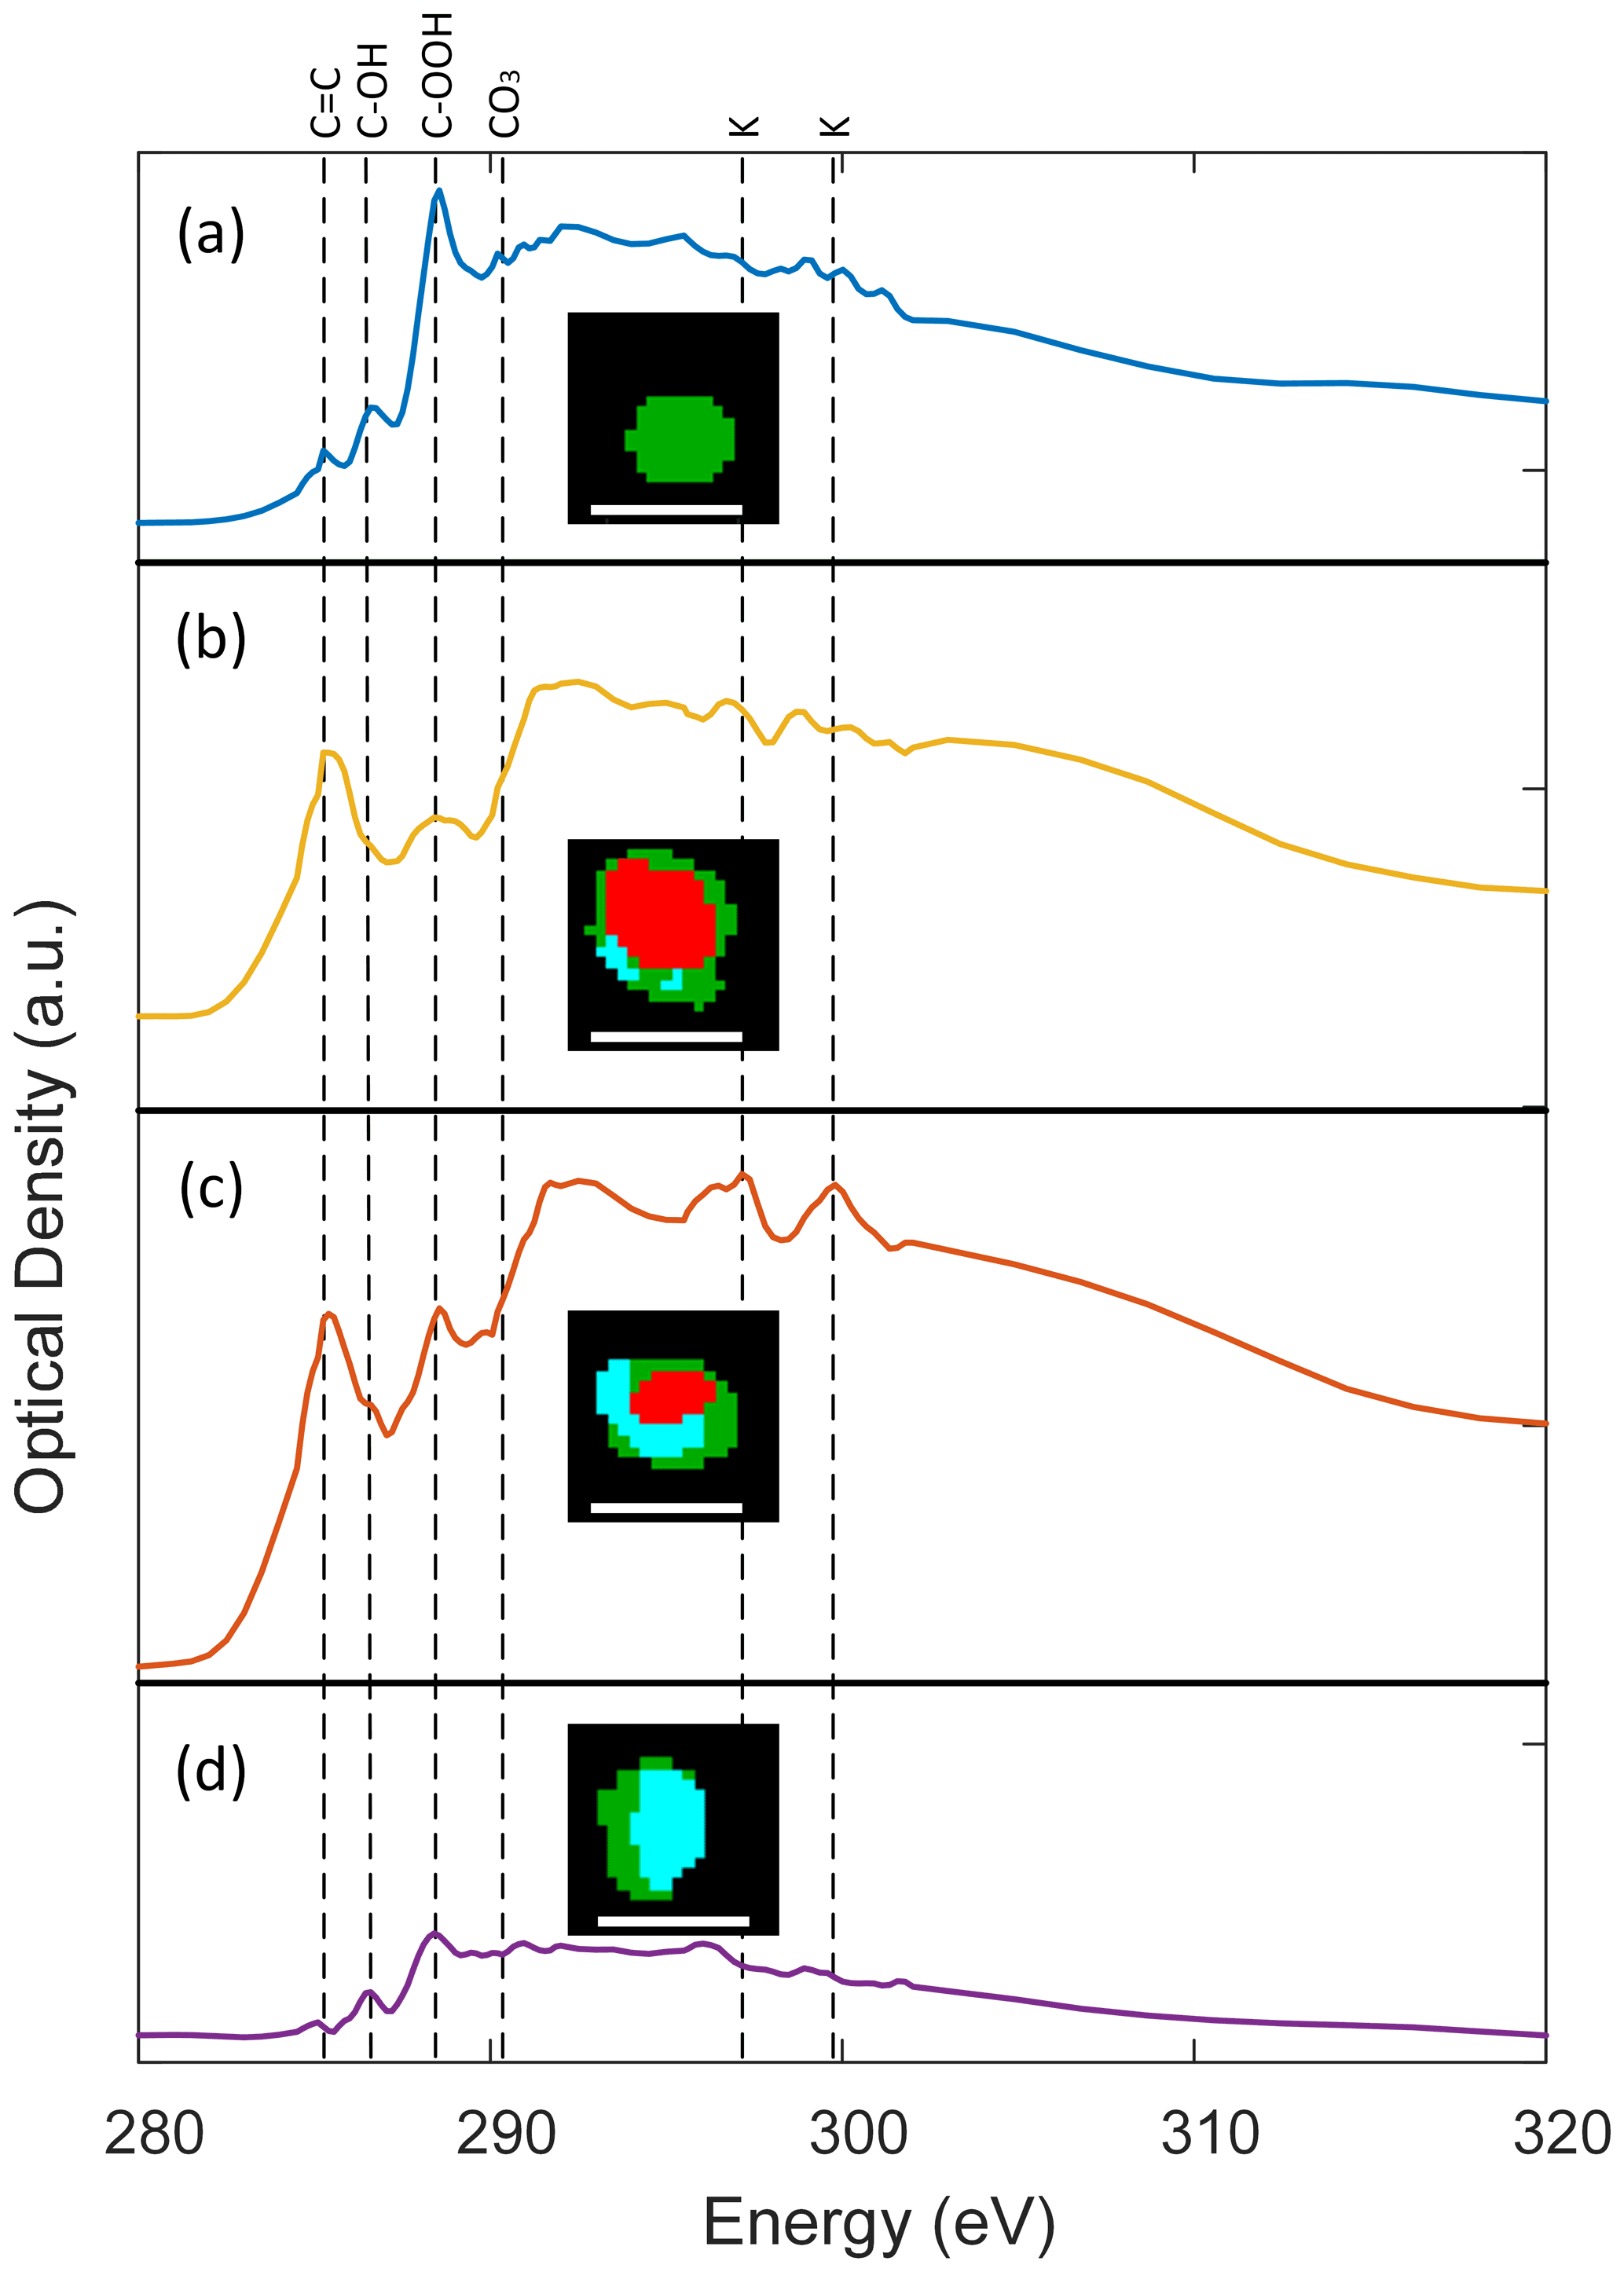
Figure 4Representative STXM-NEXAFS spectra of (a) an organic particle (green), (b) an EC core (red) coated by OC (green), (c) an internally mixed EC (red) and IN (cyan) core coated by OC (green), and (d) an IN (cyan) core coated by OC (green) from the Pico 2017 S3-3 and S4-2 samples. White scale bars represent 500 nm.
The chemically resolved particle size distributions for seven samples (SA1–SA3, S3, S5, S3-3, and S4-2) analyzed with STXM-NEXAFS are shown in Fig. S10. In the S3-3 and S4-2 samples, OCIN particles are dominant (∼ 87.8 % and ∼ 98.8 %, respectively), and there is only a very small fraction of OC-rich particles (∼ 5.2 % and ∼ 1.2 %, respectively). Based on the CCSEM-EDX measurements, most of the IN is sea salt, which might have originated from the marine boundary layer while the air mass crossed the Atlantic Ocean. Moreover, we did not find any EC-rich, IN-rich, and OCEC particles in either sample, but we did find a small portion of OCINEC particles (∼ 7.0 %) in S3-3. In the Pico 2014 samples, OCIN particles are also dominant (∼ 83 %, ∼ 64 %, and ∼ 77 % for SA1, SA2, and SA3, respectively) (Lata et al., 2021). For SA1 and SA3, this IN might come from sulfate generated from cloud processing; for SA2, the IN might come from sea spray (Lata et al., 2021). For the Pico 2015 samples, S3 is dominated by OC (∼ 69 %). S5 also has a significant fraction of OC (∼ 22 %), but OCIN and OCINEC are more dominant (∼ 35 % and ∼ 38 %, respectively). The EC might originate from wildfires (see Sect. 3.1), and the IN might come from sea spray and cloud processing (see Sect. 3.1 and 3.2.1).
3.3 Phase states of particles
3.3.1 Phase states of particles at the OMP site
As discussed in Sect. 2.4, we used tilted-view SEM images to determine the particles' phase states at the OPM. Figure 5 shows violin plots of the “corrected” aspect ratio (left) and representative tilted images (right) for Pico 2014 (a to c), Pico 2015 (d to i), and Pico 2017 (j to q). The number fractions of particles in each phase state for Pico 2014, 2015, and 2017 samples are listed in Table 1. As shown in Fig. 5, all samples are dominated by liquid particles (from ∼ 47 % to ∼ 99 % by number) at the time of sample collection during summertime. We also observed considerable fractions of semisolid (∼ 1 % to 42 %) and solid particles (∼ 0 % to 30 %) for specific events, suggesting that the abundances of liquid, semisolid, and solid particles in the FT depend on atmospheric transport events and particle sources. A potential explanation for the high fraction of liquid particles is that our samples are internally mixed with inorganic species (e.g., sea salt and sulfate), based on the tilted TEM images and CCSEM-EDX and STXM-NEXAFS measurements (see Sect. 3.2). Previous laboratory studies have found that, under the same conditions, the viscosity of a homogeneous internally mixed particle containing organics and inorganics (e.g., nitrate, sulfate, and sodium salt) decreases with increasing inorganic fraction (Dette and Koop, 2015; Power et al., 2013; Rovelli et al., 2019; Saukko et al., 2012; Schill and Tolbert, 2014; Song et al., 2021; Wang et al., 2015), since these inorganics are more hygroscopic and thus increase the overall hygroscopicity of the internally mixed particles. Also, Richards et al. (2020) have reported that divalent ions (e.g., Mg2+ and Ca2+) can increase aerosol viscosity due to ion–molecule interactions. Although our analytical technique cannot identify the chemical formula that includes these divalent ions, this phenomenon might not be critical for our samples because we found only minor fractions of Mg and Ca. Moreover, limited field studies have investigated the influence of inorganic inclusions on the viscosity and/or phase state of ambient organic aerosols and found similar results to laboratory studies (Liu et al., 2019; Slade et al., 2019). Slade et al. (2019) performed field measurements at the University of Houston Mobile Air Quality Laboratory and found that aerosols are less viscous and more liquid during daytime than at night due to higher amounts of inorganic sulfate. Liu et al. (2019) found that liquid-state particles were abundant (43 ± 6 %) in Shenzhen, China from 17 April to 11 May 2017 due to high inorganic mass fractions in the particles (62.6 ± 12.4 % of dry particles, on average). Thus, these laboratory and field studies support our findings since our samples have abundant inorganic species inclusions such as sea salt and sulfate (see Sect. 3.2), and the percentage of elements associated with these species (Na, Mg, Al, P, S, and K) ranged from ∼ 1.2 % to 15.9 % (see Table 1).

Figure 5Violin plots of the corrected aspect ratio (left) and typical tilted images (right) for Pico 2014 (a–c), Pico 2015 (d–i), and Pico 2017 (j–q). The distributions in the two panels to the left of the image in each of (d–i) are the aspect ratios of Pico 2015 particles collected on stages 3 (left) and 4 (right). The shaded regions correspond to the different phase states (red: solid state; green: semisolid state; blue: liquid state). The red lines indicate the means and the black dots the medians.
In addition to the inorganic species that are internally mixed with organic species, another potential explanation for the abundance of liquid particles in our samples might be that our samples were highly aged during long-range transport, since their average aging times were more than 10 d. Aging processes can reduce particle viscosity due to photodegradation and photobleaching (Koop et al., 2011; Malecha and Nizkorodov, 2016; Pajunoja et al., 2016; Pan et al., 2009; Sumlin et al., 2017). A previous study at Pico investigated the molecular composition of water-soluble organic matter and found compounds with low oxygenation (Dzepina et al., 2015). The authors hypothesized that aqueous-phase processing (cloud processing) and fragmentation (photolysis) might be responsible for the selective removal of some fraction of the highly aged polar compounds. Similarly, another study at the site highlighted (after removing the inorganic salts) the presence of organic components with lower ratios, and that particles were in the solid state during the long-range transport (Schum et al., 2018). These results suggest that, apart from environmental factors, the inorganic components, the molecular weight of organic compounds, and the ratio (or aging time) all affect the phase state of an internally mixed particle. Thus, we hypothesize that a substantial fraction of the solid and semisolid particles might be less oxidized and less prone to be removed via aqueous-phase processes than the liquid particles in the FT during transport.
Besides these two potential explanations, many aspects can still affect the phase states of particles. Particles can transit from the solid to the semisolid to the liquid state when the RH and/or temperature increase (Koop et al., 2011). Thus, these particles might transit to different phase states if the ambient conditions change. For example, the measured RH at the OMP was highest during the S2 and S3 sample collection periods (61.3 ± 2.4 % and 67.3 ± 2.3 %, respectively) and lowest during the S4-2 and S4-3 collection periods (6.6 ± 0.3 % and 9 %, respectively). The lower RH at the OMP during the S4-2 and S4-3 collection periods might help explain the observation of more abundant solid-state particles in S4-2 and S4-3 than in S2 and S3.
Moreover, Cheng et al. (2015), Petters and Kasparoglu (2020), and Kaluarachchi et al. (2022) have shown that particle size also affects particle viscosity. This appears to be the case for some samples when comparing the aspect ratio distributions for the Pico 2015 particles collected on stage 3 (left violin plots, 50 % cutoff size is >0.15 µm) with the corresponding distributions for those collected on stage 4 (right violin plots, 50 % cutoff size is >0.05 µm); see Fig. 5d to i. For samples S1, S2, S4, and S6, particles from stage 3 have a lower mode and mean aspect ratio than those from stage 4, indicating that larger particles have higher fractions of more viscous particles than smaller particles. However, the aspect ratio distributions for particles collected on stage 3 in samples S3 and S5 have higher modes and mean values than those collected on stage 4, suggesting a higher fraction of less viscous particles from S3 and S5 on stage 3. Due to these inconsistent observations and the limited number of samples, we cannot draw clear conclusions regarding the size dependence of particle viscosity; this important aspect should be the objective of future studies.
In addition, we observed two different types of aspect ratio distributions: (a) narrow distributions with mean aspect ratios below 4 and a smaller fraction of particles (<35 %) with aspect ratios greater than 4 (with the standard deviation of the aspect ratio ranging from 0.9 to 2.1) (Fig. 5a, d, e, and i to o) and (b) broad distributions with a larger fraction of the particles (>40 %) with aspect ratios greater than 4 (with the standard deviation of the aspect ratio ranging from 1.4 to 2.4) (Fig. 5b, c, f, g, h, p, and q). The correlation analyses of the aspect ratio against the FLEXPART CO tracer suggest that the sources of samples that have a type (b) distribution usually have a high CO contribution from wildfires (>30 %). There are two exceptions, S4-2 from Pico 2017 and S1 from Pico 2015, which received wildfire CO contributions of greater than 30 % (∼ 35 % and ∼ 42 %, respectively) but have type (a) distributions. For S4-2, a possible reason is that the volatile and less viscous species in the particles that collected on the TEM grid had already evaporated – leaving these tiny residuals around these big particles (see Fig. 5f right panel) – due to differences in temperature, RH, and pressure between the OMP and the SEM chamber, a phenomenon which has not been observed in other samples. Hence, those particles remaining on the substrate in S4-2 had a higher viscosity than the original particles. For S1, the altitude of the center of the air mass during transport was lower than for other samples (Fig. S7b), which might have led to a more considerable impact of the PBL on S1. To test the hypothesis that the source and FT aerosol viscosity are correlated, we applied a paired-difference t-test (α=0.05) of the number fraction of particles that have aspect ratios greater than 4 (see Table 1) and the contribution of wildfire CO sources based on the FLEXPART CO tracer simulation (see Table 1), and the results suggest that these two are positively correlated (p=0.0186). It should be noted that we only had a limited number of samples (17) for this study. Thus, it is necessary to perform more studies to improve our knowledge of the influence of sources on FT particle phase state and viscosity.
Moreover, we also observed considerable fractions of semisolid and solid particles in samples with high wildfire CO contributions (∼ 1 % to 29 % and ∼ 0 % to 16 %, respectively), suggesting that wildfire-influenced plumes can also emit highly viscous particles. The presence of high-viscosity organic particles in wildfire-influenced plumes in the FT after long-range transport is in accordance with a previous study at Pico (Schum et al., 2018). Therefore, our results suggest that the viscosity of FT particles depends on their source, and that a wildfire-influenced plume results in particles with a wide range of viscosities in the FT. Knowledge of the phase state and/or viscosity of wildfire aerosols is limited. Many studies have reported observations of tar balls, a solid spherical organic aerosol, in biomass emissions (Adachi et al., 2019; Adachi and Buseck, 2011; China et al., 2013; Hoffer et al., 2017; Posfai et al., 2004). DeRieux et al. (2018) predicted the viscosity of biomass-burning particles using their chemical composition and found that their viscosity varied between 10−2 and 109 Pa s, depending on the RH. Liu et al. (2021) found that ambient and lab-generated biomass-burning particles are in a nonsolid state at RHs of between 20 % and 50 %. Li et al. (2020) predicted the viscosity of ambient biomass-burning organic aerosols from the volatility distribution and found that it varies from 10−2 Pa s (liquid state) to above 1012 Pa s (solid state) in Athens (Greece) and from 10−2 Pa s (liquid state) to ∼ 109 Pa s in Mexico City (Mexico). Therefore, these studies support our finding that biomass burning can emit particles with a broad viscosity distribution. This finding underlines the importance of constraining source-specific contributions to determine the phase state of FT particles, which is still not well documented.
Besides tilted imaging, we also investigated the phase states of particles by utilizing STXM-NEXAFS measurements to retrieve the TCA. Typically, particles with the same area-equivalent diameter but a higher TCA are more viscous (more solid-like), since they are less flat in shape (Fraund et al., 2020; Tomlin et al., 2020). However, if a particle has a solid inorganic core (e.g., dust or soot) and an organic coating, its TCA will be low, indicating a low thickness. In this case, it is difficult to probe the phase state of the organic coating, and tilted imaging provides better estimates, since we can directly observe the thickness of the entire particle. Figure 6 shows the TCA as a function of the area-equivalent diameter of the impacted particle for samples from Pico 2014, Pico 2015, and Pico 2017 (left panel) and a histogram plot of the OVF to investigate the contribution of inorganic inclusions to the phase state of the particle. Symbols are colored according to the OVF. Shaded areas represent regions of different phase states (liquid: blue, semisolid: green, and solid: red), with the boundaries of each region based on measurements of field and lab-generated organic particles reported in O'Brien et al. (2014). As shown in Fig. 6, TCA values for our samples are very low, and more than 90 % of the particles in each sample are in the liquid state, consistent with our tilted imaging measurements. Except for S3, all the samples have OVFs of around 0.20 ± 0.22, suggesting that these carbonaceous particles contain other elements.
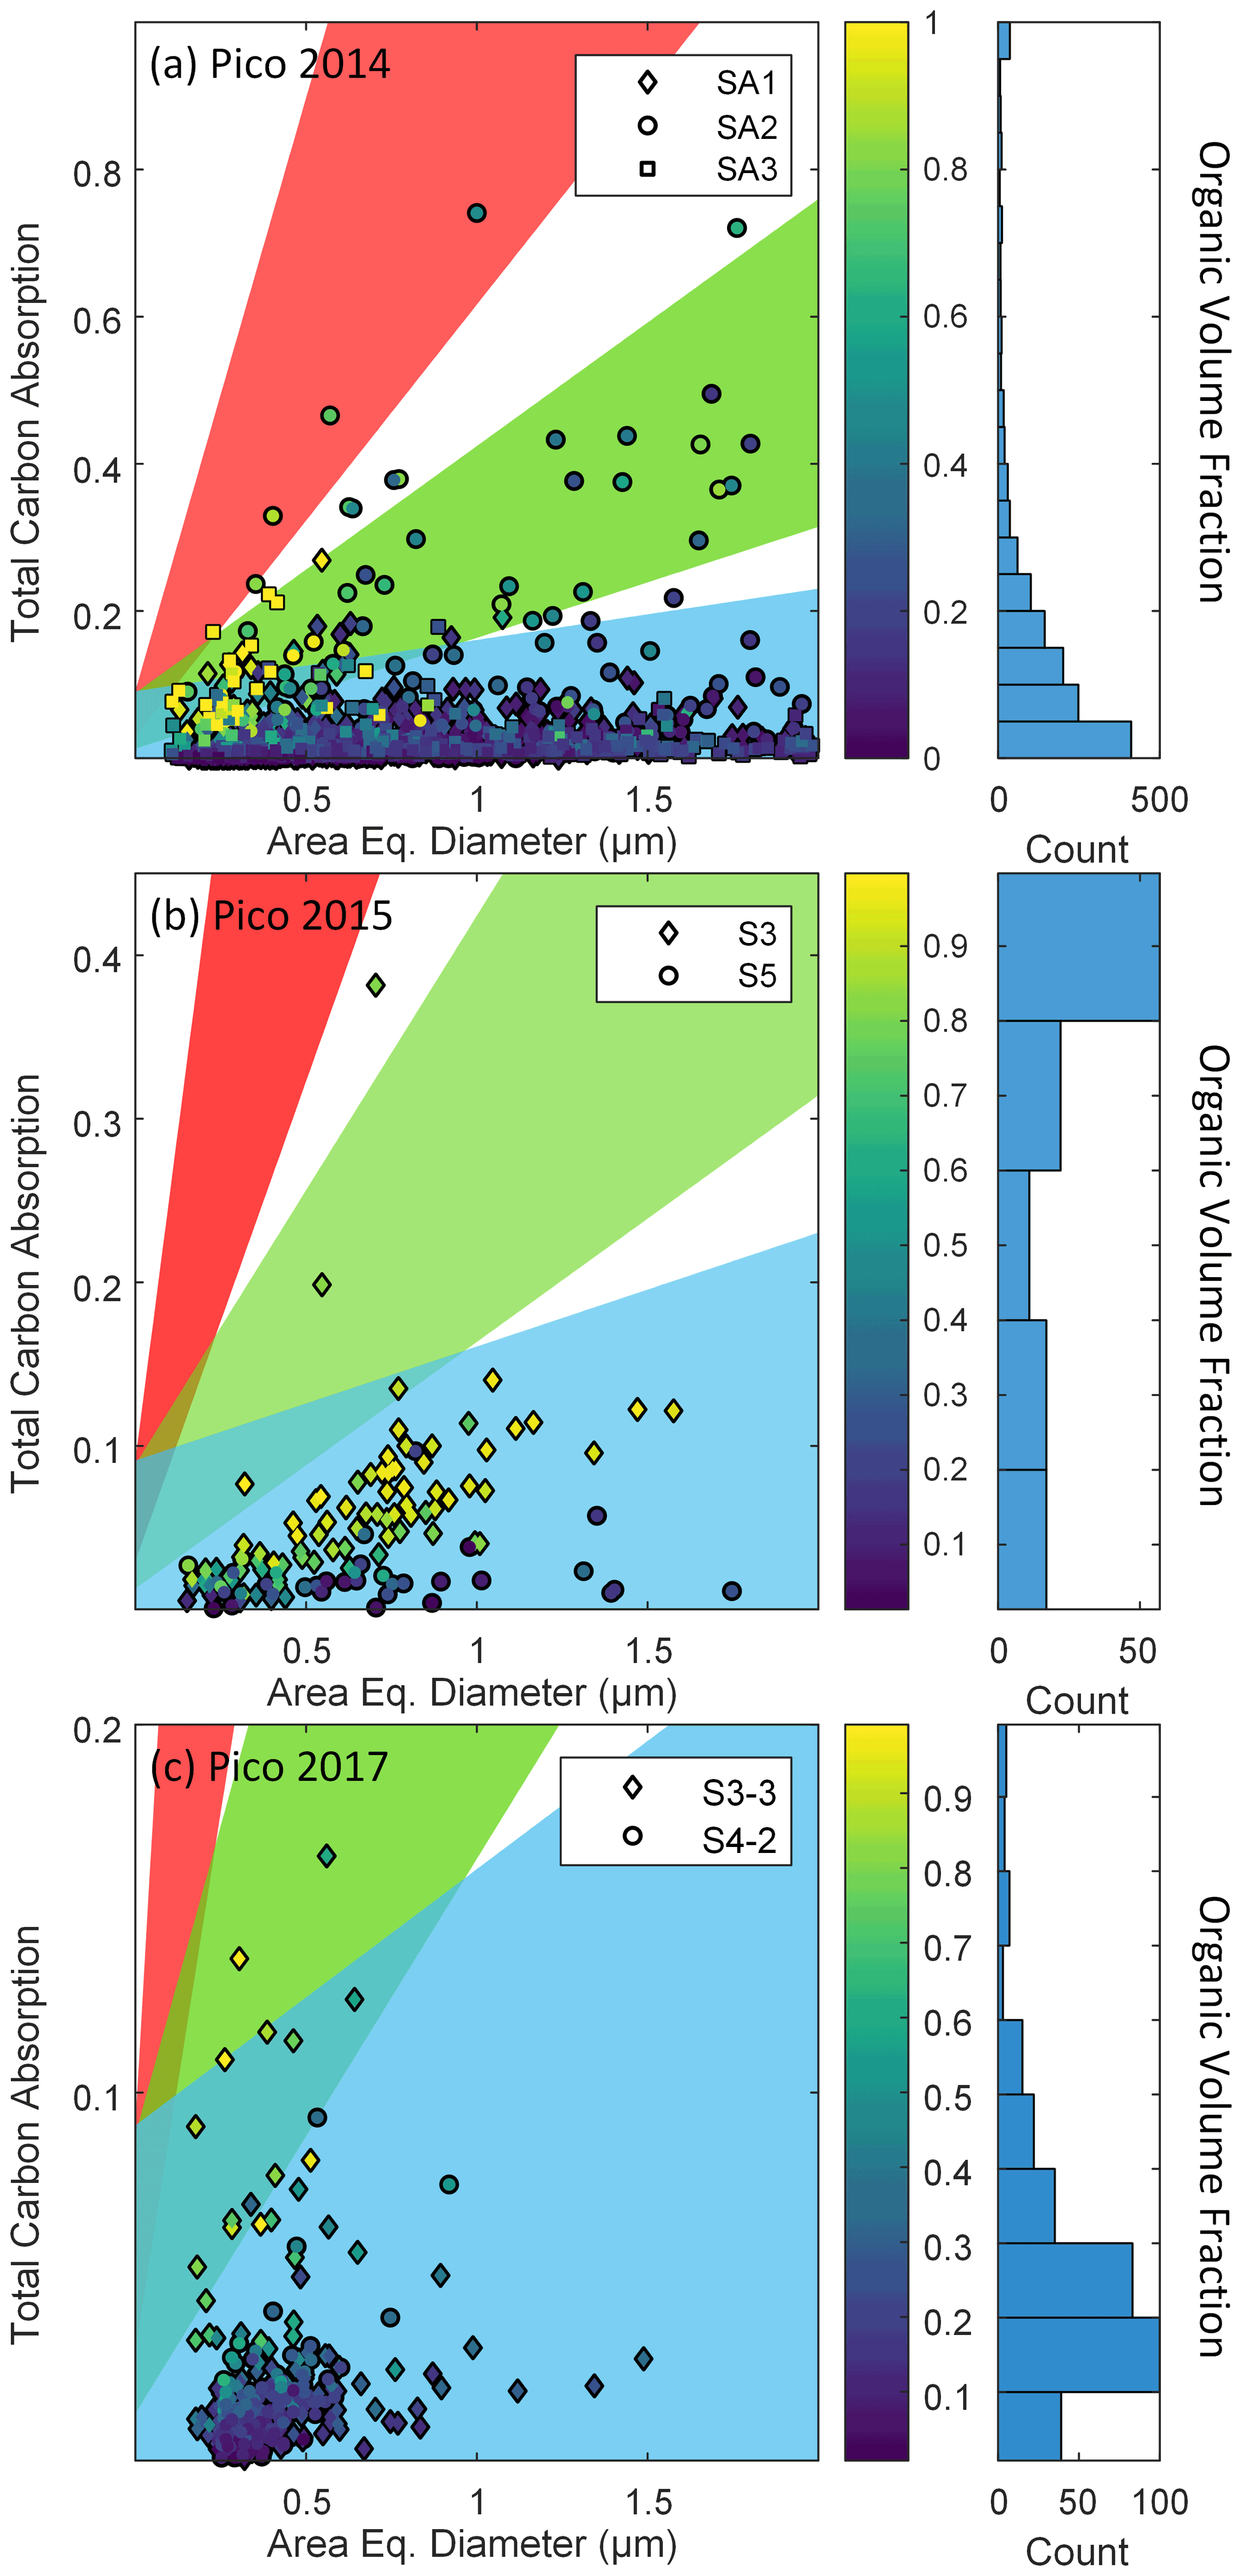
Figure 6Total carbon absorption (TCA) as a function of area-equivalent diameter of the impacting particle (a) and histogram plots of TCA from (a) Pico 2014, (b) Pico 2015, and (c) Pico 2017. Symbols are colored by organic volume fraction (retrieved from STXM-NEXAFS measurements). Shaded areas represent different phase-state regions (liquid: blue, semisolid: green, and solid: red). Side plots are histograms of the organic volume fraction.
3.3.2 Phase state of particles during long-range transport
Due to changing atmospheric conditions, the phase state of an aerosol might be more variable during transport than at the sampling site. To investigate the phase state of the particles during transport, we estimated the expected phase states of the samples indirectly by calculating their glass transition temperatures (Tg), which is the transition temperature between solid and semisolid states (Koop et al., 2011). To calculate the Tg of a mixture (e.g., internally mixed organics and inorganics), we need to know the properties of each component (e.g., mass fractions, density, hygroscopicity, and dry Tg). Due to limited information on inorganic species type and volume fraction for our samples, we can only predict the RH-dependent Tg values of organic particles (Tg,org) (Koop et al., 2011). Typically, organic particles maintain a solid state when , a semisolid state when , and a liquid state when (Schmedding et al., 2020; Shiraiwa et al., 2017). We calculated the expected Tg,org during air mass transport using the temperature and RH extracted from the GFS along the FLEXPART-simulated path. We used the density (ρorg), hygroscopicity (κorg), and dry glass transition temperature () of organic particles as reported by Schum et al. (2018) (see Sect. S2 in the Supplement), since we do not have molecular compositions for our samples and the samples studied in Schum et al. (2018) were also collected at the OMP during the same seasonal period (June and July).
The predicted Tg,org values based on FLEXPART for each Pico 2017 sample during transport are shown in Fig. S11. Values were estimated for up to 5 d before the air masses arrived at the OMP to avoid increased uncertainties associated with possible meteorological conditions due to the spread of the air masses (see Fig. S6). The predicted Tg,org to T ratio is shown as functions of the temperature and relative humidity in Fig. S12. For all samples, the extracted ambient temperature was relatively stable during transport and slightly increased when the air masses approached the OMP. On the other hand, the ambient RH was more variable from grid cell to grid cell. The RH decreased when the air masses reached the OMP. Therefore, the ambient RH and dry Tg (see Sect. S2 in the Supplement) yield a wide range of Tg,org values (191.1–329.1 K) during transport (Fig. S11). Overall, the predicted average Tg,org values for all samples exceed the ambient temperature extracted from FLEXPART during most of the transport period (Fig. S11), implying that organic particles would likely be solid in the FT. These results are consistent with a previous study at the site (Schum et al., 2018) and other modeling studies (Li et al., 2021; Schmedding et al., 2020; Shiraiwa et al., 2017; Shrivastava et al., 2017) indicating that organic particles in the FT are likely in solid and semisolid states. We also calculated the Tg,org of organic particles at the OMP using meteorological data collected at the OMP (Table S2), and this also showed that the organics in our samples should have been in a solid state at the time they were sampled at the OMP, since the predicted Tg,org is higher than the measured temperature. Moreover, the Tg,org at the OMP calculated using FLEXPART data is close to that calculated using local meteorological data (difference <4.4 %), and the differences between the FLEXPART-simulated temperature and RH at the site and those measured at the OMP are not significant (less than 4 ∘C and between ∼ 3.5 % and ∼ 12 % for RH), which indicates that the FLEXPART data can be used to predict the phase state of organic particles during long-range transport.
In addition to the potential differences in the molecular formula of organics and ambient conditions between our study and Schum et al. (2018), our offline phase-state measurements show that the samples collected at the OMP might have a lower Tg than the theoretically predicted Tg,org. This might be due to the fact that our sampled particles were internally mixed with hygroscopic inorganic species (e.g., sea salt and sulfate, see Sect. 3.2), which are expected to decrease the viscosity and the Tg of the particles (Dette and Koop, 2015; Power et al., 2013; Rovelli et al., 2019; Saukko et al., 2012; Schill and Tolbert, 2014; Song et al., 2021; Wang et al., 2015). Moreover, in the calculation of Tg,org, we assumed the CCN-derived κorg to be 0.12 (Schum et al., 2018), which might be lower than that of ambient internally mixed particles (Ching et al., 2019; Kristensen et al., 2016; Pringle et al., 2010; Schulze et al., 2020). This underestimation of κ would lead to an overestimation of Tg. Thus, our results suggest that estimating the phase state of the particles without considering the mixing state of FT particles might not lead to accurate predictions of their viscosity and Tg because the presence of hygroscopic inorganic inclusions (e.g., sea salt and sulfate) can reduce the viscosity of FT particles at the RH and T values encountered in the FT during transport. Moreover, our results highlight the essential roles of FT sites such as the OMP in studying the phase state and viscosity of FT particles, since these sites provide unique opportunities to comprehensively understand FT aerosol chemical composition, physical properties, and hygroscopicity. This information is necessary to predict the particles' phase state in the FT more accurately, which is critical for predicting their effects on climate.
The phase state and viscosity of free tropospheric particles are important properties for estimating the climatic effects of aerosols. However, current understanding of their phase state and viscosity is limited, especially for aerosols in the remote free troposphere. In this study, we analyzed the chemical properties and phase states of single particles collected in the free troposphere at the OMP in the Azores over 3 different years. We combined the single-particle analysis with FLEXPART analysis to estimate the particles' phase state during transport. We utilized multimodal microspectroscopy techniques (CCSEM-EDX, tilted-view imaging combined with ESEM, and STXM-NEXAFS) to probe the chemical composition, phase state, and mixing state of long-range transported free-tropospheric particles. The source and air-mass transport trajectories and ages were also determined using FLEXPART. FLEXPART CO tracer simulations showed that North American wildfire emissions primarily influenced SA3, S1, S3, S6, S4-2, S4-3, and S4-4, while the rest of the samples were largely influenced by anthropogenic sources. CCSEM-EDX analysis indicates that carbonaceous aerosols are the dominant type in all samples. Carbonaceous sulfate and sea salt with sulfate particles are also present, probably due to the contributions of marine sprays and cloud processing. The CCSEM-EDX analysis and FLEXPART simulations revealed that transport patterns could affect particle chemical composition. The offline single-particle phase state analysis showed that the major fraction of the particles were liquid (∼ 47 % to 99 %). However, there were also considerable fractions of solid (∼ 0 % to 30 % by number) and semisolid (∼ 0.1 % to 42 %) particles, and their relative abundances depend on the transport pattern and particle sources. We hypothesize that the high abundance of liquid particles is due to the presence of inorganic inclusions (e.g., sulfate and Na salt) and the long atmospheric aging times (>10 d), which can reduce the viscosity of organics due to photodegradation and photobleaching. Moreover, we found that samples with a significant influence of wildfire emissions (wildfire CO contribution >30 %) had a broader viscosity distribution than those collected during events dominated by anthropogenic emissions. This finding underscores the need to further study the influence of emission sources on the viscosity of FT particles. Our results suggest that neglecting the contribution of internally mixed inorganic species when calculating the particle hygroscopicity properties of organic aerosols might lead to overestimated viscosities of internally mixed particles. Indeed, the inorganic inclusions reduced the calculated particle viscosity, implying that the particle's probability of remaining liquid in the FT is enhanced. Moreover, the fraction and chemical composition of inorganic inclusions may further influence the phase state variations. These effects have been previously shown in laboratory studies by measuring the viscosity of organic and inorganic mixtures (Dette and Koop, 2015; Power et al., 2013; Richards et al., 2020; Rovelli et al., 2019; Saukko et al., 2012; Schill and Tolbert, 2014; Song et al., 2021; Wang et al., 2015), and in ambient samples (Liu et al., 2019; Slade et al., 2019). Moreover, the effects of internally mixed inorganics on particle viscosity are not considered in current climate models (Li et al., 2021; Rasool et al., 2021; Schmedding et al., 2020; Shiraiwa et al., 2017; Shrivastava et al., 2022). These liquid particles are expected to be less stable, to have faster heterogeneous reaction rates, to be more reactive, and to be quickly photodegraded in the FT (Berkemeier et al., 2016; Kuwata and Martin, 2012; Lienhard et al., 2015; Liu et al., 2018a; Marshall et al., 2016; Pöschl and Shiraiwa, 2015b; Renbaum-Wolff et al., 2013). This study has assessed the phase state of internally mixed FT particles at the time of sample collection and highlighted the importance of accounting for inorganic inclusions when evaluating the phase state of internally mixed particles. Our results might not fully represent the phase state of FT particles during transport due to differences in ambient temperature and RH. Moreover, the aspect ratio thresholds used to determine the particles' phase states are based on limited standards. Future studies should focus on improving the aspect ratio thresholds by using more standards with known viscosities and determining the viscosities of individual internally mixed particles as functions of the temperature and RH.
| Acronym | Definition |
| FT | Free troposphere or free tropospheric |
| ESEM | Environmental scanning electron microscope |
| PBL | Planetary boundary layer |
| OMP | The Observatory of Mount Pico |
| RH | Relative humidity |
| CCN | Cloud condensation nuclei |
| INP | Ice-nucleating particles |
| Pico 2014 | Atmospheric aerosol particles collected at OMP during July 2014 |
| Pico 2015 | Atmospheric aerosol particles collected at OMP during June and July of 2015 |
| Pico 2017 | Atmospheric aerosol particles collected at OMP during June and July of 2017 |
| FLEXPART | FLEXible PARTicle Lagrangian particle dispersion model |
| SMPS | Scanning mobility particle sizer |
| GFS | Global Forecast System |
| EDGAR | Emissions Database for Global Atmospheric Research |
| STXM-NEXAFS | Scanning transmission X-ray microscopy with near-edge X-ray absorption fine structure spectroscopy |
| CCSEM-EDX | Computer-controlled scanning electron microscopy with energy-dispersive X-ray spectroscopy |
| OC | Organic |
| CNO | Carbonaceous with nitrogen |
| CNOS | Carbonaceous with sulfate |
| Na rich | Sea salt |
| Na rich with S | Sea salt with sulfate |
| ALS | Advanced Light Source |
| TCA | Total carbon absorbance |
| OVF | Organic volume fraction |
| OD | Optical density |
| EC | Elemental carbon |
| IN | Inorganic components |
| tOC | Thickness of organic component |
| tEC | Thickness of elemental carbon component |
| tIN | Thickness of inorganic component |
| OC rich | Particles for which OC is greater than 96 % and both EC and IN are less than 2 % |
| EC rich | Particles for which EC is greater than 96 % and both OC and IN are less than 2 % |
| IN rich | Particles for which IN is greater than 96 % and both OC and EC are less than 2 % |
| OCEC | Particles for which both OC and EC are greater than 2 % and IN is less than 2 % |
| OCIN | Particles for which both OC and IN are greater than 2 % and EC is less than 2 % |
| OCINEC | Particles for which OC, EC, and IN are all greater than 2 % |
| Wcorrected | Corrected particle width |
| Hcorrected | Corrected particle height |
| Wtilted | Maximum particle length in the horizontal |
| Htilted | Maximum particle length in the vertical |
| SRFA | Suwannee River fulvic acid |
| TEM | Transmission electron microscopy |
| Tg | Glass transition temperature |
| Tg,org | Tg value of organic particles |
| ρorg | Density of organics |
| κorg | Hygroscopicity of organics |
| Dry glass transition temperature of organics | |
All the measurement data are provided in the Supplement.
The supplement related to this article is available online at: https://doi.org/10.5194/acp-22-9033-2022-supplement.
ZC, CM, and SC designed the study. BW, SH, PF, LM, and CM collected samples and performed online measurements. ZC, MF, MM, NNL, RB, and SC performed the microscopy experiments and analysis; ZC, NNL, MAM, and SC performed the STXM/NEXAFS experiments and analysis. BZ performed the FLEXPART simulation. ZC wrote the first manuscript draft. All authors reviewed and edited the manuscript.
The contact author has declared that none of the authors has any competing interests.
Publisher's note: Copernicus Publications remains neutral with regard to jurisdictional claims in published maps and institutional affiliations.
This article is part of the special issue “Marine aerosols, trace gases, and clouds over the North Atlantic (ACP/AMT inter-journal SI)”. It is not associated with a conference.
A portion of this research was performed using a project award (https://doi.org/10.46936/lser.proj.2019.50835/60000118) from the Environmental Molecular Sciences Laboratory, a DOE Office of Science User Facility sponsored by the Biological and Environmental Research program. STXM/NEXAFS analysis at beamline 5.3.2.2 of the Advanced Light Source at Lawrence Berkeley National Laboratory is supported by the Director, Office of Science, Office of Basic Energy Sciences of the US Department of Energy. We acknowledge funding from the US Department of Energy, Office of Science (BER), Atmospheric System Research. The sample collection at Pico Mountain Observatory was supported with funding from the NSF, DOE, and NASA’s Earth and Space Science Graduate Fellowships. Logistic support for the Observatory’s operation was provided by the Regional Government of the Azores through the Regional Secretary for Science and the Pico Island Natural Park. We thank Mike Dziobak, Kendra Wright, Sumit Kumar, Andrea Baccarini, Stefano Viviani, Jacques Huber, and Detlev Helmig for their support in the field. Measurements in 2017 were funded by the German Science Foundation (Deutsche Forschungsgemeinschaft, DFG).
This research has been supported by the US Department of Energy (grant nos. DE-SC0006941 and DE-AC05-76RL01830 EMSL, DE-AC02-05CH11231 ALS), the National Science Foundation (grant no. AGS-1110059), NASA (grant nos. NNX12AN97H, and NNX13AN68H), and the German Science Foundation (Grant no. SI 1543/4-1, WE 2757/2-1, and HE 6770/2-1).
This paper was edited by Sergey A. Nizkorodov and reviewed by three anonymous referees.
Adachi, K. and Buseck, P. R.: Atmospheric tar balls from biomass burning in Mexico, J. Geophys. Res., 116, 2–8, https://doi.org/10.1029/2010JD015102, 2011.
Adachi, K., Sedlacek, A. J., Kleinman, L., Springston, S. R., Wang, J., Chand, D., Hubbe, J. M., Shilling, J. E., Onasch, T. B., Kinase, T., Sakata, K., Takahashi, Y., and Buseck, P. R.: Spherical tarball particles form through rapid chemical and physical changes of organic matter in biomass-burning smoke, P. Natl. Acad. Sci. USA, 116, 19336–19341, https://doi.org/10.1073/pnas.1900129116, 2019.
Bateman, A. P., Belassein, H., and Martin, S. T.: Impactor apparatus for the study of particle rebound: Relative humidity and capillary forces, Aerosol Sci. Technol., 48, 42–52, https://doi.org/10.1080/02786826.2013.853866, 2014.
Bateman, A. P., Bertram, A. K., and Martin, S. T.: Hygroscopic Influence on the Semisolid-to-Liquid Transition of Secondary Organic Materials, J. Phys. Chem., 119, 4386–4395, https://doi.org/10.1021/jp508521c, 2015.
Bateman, A. P., Gong, Z., Liu, P., Sato, B., Cirino, G., Zhang, Y., Artaxo, P., Bertram, A. K., Manzi, A. O., Rizzo, L. V., Souza, R. A. F., Zaveri, R. A., and Martin, S. T.: Sub-micrometre particulate matter is primarily in liquid form over Amazon rainforest, Nat. Geosci., 9, 34–37, https://doi.org/10.1038/ngeo2599, 2016.
Bateman, A. P., Gong, Z., Harder, T. H., de Sá, S. S., Wang, B., Castillo, P., China, S., Liu, Y., O'Brien, R. E., Palm, B. B., Shiu, H.-W., Cirino, G. G., Thalman, R., Adachi, K., Alexander, M. L., Artaxo, P., Bertram, A. K., Buseck, P. R., Gilles, M. K., Jimenez, J. L., Laskin, A., Manzi, A. O., Sedlacek, A., Souza, R. A. F., Wang, J., Zaveri, R., and Martin, S. T.: Anthropogenic influences on the physical state of submicron particulate matter over a tropical forest, Atmos. Chem. Phys., 17, 1759–1773, https://doi.org/10.5194/acp-17-1759-2017, 2017.
Bellouin, N., Quaas, J., Gryspeerdt, E., Kinne, S., Stier, P., Watson-Parris, D., Boucher, O., Carslaw, K. S., Christensen, M., Daniau, A. L., Dufresne, J. L., Feingold, G., Fiedler, S., Forster, P., Gettelman, A., Haywood, J. M., Lohmann, U., Malavelle, F., Mauritsen, T., McCoy, D. T., Myhre, G., Mülmenstädt, J., Neubauer, D., Possner, A., Rugenstein, M., Sato, Y., Schulz, M., Schwartz, S. E., Sourdeval, O., Storelvmo, T., Toll, V., Winker, D., and Stevens, B.: Bounding Global Aerosol Radiative Forcing of Climate Change, Rev. Geophys., 58, 1–45, https://doi.org/10.1029/2019RG000660, 2020.
Berkemeier, T., Shiraiwa, M., Pöschl, U., and Koop, T.: Competition between water uptake and ice nucleation by glassy organic aerosol particles, Atmos. Chem. Phys., 14, 12513–12531, https://doi.org/10.5194/acp-14-12513-2014, 2014.
Berkemeier, T., Steimer, S. S., Krieger, U. K., Peter, T., Pöschl, U., Ammann, M., and Shiraiwa, M.: Ozone uptake on glassy, semi-solid and liquid organic matter and the role of reactive oxygen intermediates in atmospheric aerosol chemistry, Phys. Chem. Chem. Phys., 18, 12662–12674, https://doi.org/10.1039/c6cp00634e, 2016.
Bianchi, F., Tröstl, J., Junninen, H., Frege, C., Henne, S., Hoyle, C. R., Molteni, U., Herrmann, E., Adamov, A., Bukowiecki, N., Chen, X., Duplissy, J., Gysel, M., Hutterli, M., Kangasluoma, J., Kontkanen, J., Kürten, A., Manninen, H. E., Münch, S., Peräkylä, O., Petäjä, T., Rondo, L., Williamson, C., Weingartner, E., Curtius, J., Worsnop, D. R., Kulmala, M., Dommen, J., and Baltensperger, U.: New particle formation in the free troposphere: A question of chemistry and timing, Science, 352, 1109–1112, https://doi.org/10.1126/science.aad5456, 2016.
Bond, T. C., Doherty, S. J., Fahey, D. W., Forster, P. M., Berntsen, T., Deangelo, B. J., Flanner, M. G., Ghan, S., Kärcher, B., Koch, D., Kinne, S., Kondo, Y., Quinn, P. K., Sarofim, M. C., Schultz, M. G., Schulz, M., Venkataraman, C., Zhang, H., Zhang, S., Bellouin, N., Guttikunda, S. K., Hopke, P. K., Jacobson, M. Z., Kaiser, J. W., Klimont, Z., Lohmann, U., Schwarz, J. P., Shindell, D., Storelvmo, T., Warren, S. G., and Zender, C. S.: Bounding the role of black carbon in the climate system: A scientific assessment, Geophys. Res.-Atmos., 118, 5380–5552, https://doi.org/10.1002/jgrd.50171, 2013.
Bondy, A. L., Bonanno, D., Moffet, R. C., Wang, B., Laskin, A., and Ault, A. P.: The diverse chemical mixing state of aerosol particles in the southeastern United States, Atmos. Chem. Phys., 18, 12595–12612, https://doi.org/10.5194/acp-18-12595-2018, 2018.
Boose, Y., Kanji, Z. A., Kohn, M., Sierau, B., Zipori, A., Crawford, I., Lloyd, G., Bukowiecki, N., Herrmann, E., Kupiszewski, P., Steinbacher, M., and Lohmann, U.: Ice nucleating particle measurements at 241 K during winter months at 3580 m MSL in the swiss alps, J. Atmos. Sci., 73, 2203–2228, https://doi.org/10.1175/JAS-D-15-0236.1, 2016.
Briggs, N. L., Jaffe, D. A., Gao, H., Hee, J. R., Baylon, P. M., Zhang, Q., Zhou, S., Collier, S. C., Sampson, P. D., and Cary, R. A.: Particulate matter, ozone, and nitrogen species in aged wildfire plumes observed at the Mount Bachelor Observatory, Aerosol Air Qual. Res., 16, 3075–3087, https://doi.org/10.4209/aaqr.2016.03.0120, 2016.
Cheng, Y., Su, H., Koop, T., Mikhailov, E., and Pöschl, U.: Size dependence of phase transitions in aerosol nanoparticles, Nat. Commun., 6, 1–7, https://doi.org/10.1038/ncomms6923, 2015.
Cheng, Z., Sharma, N., Tseng, K.-P., Kovarik, L., and China, S.: Direct observation and assessment of phase states of ambient and lab-generated sub-micron particles upon humidification, RSC Adv., 11, 15264–15272, https://doi.org/10.1039/d1ra02530a, 2021.
China, S., Mazzoleni, C., Gorkowski, K., Aiken, A. C., and Dubey, M. K.: Morphology and mixing state of individual freshly emitted wildfire carbonaceous particles, Nat. Commun., 4, 2122, https://doi.org/10.1038/ncomms3122, 2013.
China, S., Scarnato, B., Owen, R. C., Zhang, B., Ampadu, M. T., Kumar, S., Dzepina, K., Dziobak, M. P., Fialho, P., Perlinger, J. A., Hueber, J., Helmig, D., Mazzoleni, L. R., and Mazzoleni, C.: Morphology and mixing state of aged soot particles at a remote marine free troposphere site: Implications for optical properties, Geophys. Res. Lett., 42, 1243–1250, https://doi.org/10.1002/2014GL062404, 2015.
China, S., Alpert, P. A., Zhang, B., Schum, S., Dzepina, K., Wright, K., Owen, R. C., Fialho, P., Mazzoleni, L. R., Mazzoleni, C., and Knopf, D. A.: Ice cloud formation potential by free tropospheric particles from long-range transport over the Northern Atlantic Ocean, J. Geophys. Res.-Atmos., 122, 3065–3079, https://doi.org/10.1002/2016JD025817, 2017.
Ching, J., Fast, J., West, M., and Riemer, N.: Metrics to quantify the importance of mixing state for CCN activity, Atmos. Chem. Phys., 17, 7445–7458, https://doi.org/10.5194/acp-17-7445-2017, 2017.
Ching, J., Adachi, K., Zaizen, Y., Igarashi, Y., and Kajino, M.: Aerosol mixing state revealed by transmission electron microscopy pertaining to cloud formation and human airway deposition, NPJ Clim. Atmos. Sci., 2, 1–7, https://doi.org/10.1038/s41612-019-0081-9, 2019.
Clarke, A. D., Freitag, S., Simpson, R. M. C., Hudson, J. G., Howell, S. G., Brekhovskikh, V. L., Campos, T., Kapustin, V. N., and Zhou, J.: Free troposphere as a major source of CCN for the equatorial pacific boundary layer: long-range transport and teleconnections, Atmos. Chem. Phys., 13, 7511–7529, https://doi.org/10.5194/acp-13-7511-2013, 2013.
Collaud Coen, M., Andrews, E., Aliaga, D., Andrade, M., Angelov, H., Bukowiecki, N., Ealo, M., Fialho, P., Flentje, H., Hallar, A. G., Hooda, R., Kalapov, I., Krejci, R., Lin, N.-H., Marinoni, A., Ming, J., Nguyen, N. A., Pandolfi, M., Pont, V., Ries, L., Rodríguez, S., Schauer, G., Sellegri, K., Sharma, S., Sun, J., Tunved, P., Velasquez, P., and Ruffieux, D.: Identification of topographic features influencing aerosol observations at high altitude stations, Atmos. Chem. Phys., 18, 12289–12313, https://doi.org/10.5194/acp-18-12289-2018, 2018.
Cozic, J., Verheggen, B., Weingartner, E., Crosier, J., Bower, K. N., Flynn, M., Coe, H., Henning, S., Steinbacher, M., Henne, S., Collaud Coen, M., Petzold, A., and Baltensperger, U.: Chemical composition of free tropospheric aerosol for PM1 and coarse mode at the high alpine site Jungfraujoch, Atmos. Chem. Phys., 8, 407–423, https://doi.org/10.5194/acp-8-407-2008, 2008.
DeRieux, W.-S. W., Li, Y., Lin, P., Laskin, J., Laskin, A., Bertram, A. K., Nizkorodov, S. A., and Shiraiwa, M.: Predicting the glass transition temperature and viscosity of secondary organic material using molecular composition, Atmos. Chem. Phys., 18, 6331–6351, https://doi.org/10.5194/acp-18-6331-2018, 2018.
Dette, H. P. and Koop, T.: Glass Formation Processes in Mixed Inorganic Organic Aerosol Particles, J. Phys. Chem. A, 119, 4552–4561, https://doi.org/10.1021/jp5106967, 2015.
De Wekker, S. F. J. and Kossmann, M.: Convective boundary layer heights over mountainous terrain – A review of concepts, Front. Earth Sci., 3, 1–22, https://doi.org/10.3389/feart.2015.00077, 2015.
Dunlea, E. J., DeCarlo, P. F., Aiken, A. C., Kimmel, J. R., Peltier, R. E., Weber, R. J., Tomlinson, J., Collins, D. R., Shinozuka, Y., McNaughton, C. S., Howell, S. G., Clarke, A. D., Emmons, L. K., Apel, E. C., Pfister, G. G., van Donkelaar, A., Martin, R. V., Millet, D. B., Heald, C. L., and Jimenez, J. L.: Evolution of Asian aerosols during transpacific transport in INTEX-B, Atmos. Chem. Phys., 9, 7257–7287, https://doi.org/10.5194/acp-9-7257-2009, 2009.
Dzepina, K., Mazzoleni, C., Fialho, P., China, S., Zhang, B., Owen, R. C., Helmig, D., Hueber, J., Kumar, S., Perlinger, J. A., Kramer, L. J., Dziobak, M. P., Ampadu, M. T., Olsen, S., Wuebbles, D. J., and Mazzoleni, L. R.: Molecular characterization of free tropospheric aerosol collected at the Pico Mountain Observatory: a case study with a long-range transported biomass burning plume, Atmos. Chem. Phys., 15, 5047–5068, https://doi.org/10.5194/acp-15-5047-2015, 2015.
Ervens, B., Turpin, B. J., and Weber, R. J.: Secondary organic aerosol formation in cloud droplets and aqueous particles (aqSOA): a review of laboratory, field and model studies, Atmos. Chem. Phys., 11, 11069–11102, https://doi.org/10.5194/acp-11-11069-2011, 2011.
Fan, J., Wang, Y., Rosenfeld, D., and Liu, X.: Review of aerosol-cloud interactions: Mechanisms, significance, and challenges, J. Atmos. Sci., 73, 4221–4252, https://doi.org/10.1175/JAS-D-16-0037.1, 2016.
Fischer, H., Kormann, R., Klüpfel, T., Gurk, Ch., Königstedt, R., Parchatka, U., Mühle, J., Rhee, T. S., Brenninkmeijer, C. A. M., Bonasoni, P., and Stohl, A.: Ozone production and trace gas correlations during the June 2000 MINATROC intensive measurement campaign at Mt. Cimone, Atmos. Chem. Phys., 3, 725–738, https://doi.org/10.5194/acp-3-725-2003, 2003.
Fraund, M., Park, T., Yao, L., Bonanno, D., Pham, D. Q., and Moffet, R. C.: Quantitative capabilities of STXM to measure spatially resolved organic volume fractions of mixed organic inorganic particles, Atmos. Meas. Tech., 12, 1619–1633, https://doi.org/10.5194/amt-12-1619-2019, 2019.
Fraund, M., Bonanno, D. J., China, S., Pham, D. Q., Veghte, D., Weis, J., Kulkarni, G., Teske, K., Gilles, M. K., Laskin, A., and Moffet, R. C.: Optical properties and composition of viscous organic particles found in the Southern Great Plains, Atmos. Chem. Phys., 20, 11593–11606, https://doi.org/10.5194/acp-20-11593-2020, 2020.
Gogoi, M. M., Moorthy, K. K., Kompalli, S. K., Chaubey, J. P., Babu, S. S., Manoj, M. R., Nair, V. S., and Prabhu, T. P.: Physical and optical properties of aerosols in a free tropospheric environment: Results from long-term observations over western trans-Himalayas, Atmos. Environ., 84, 262–274, https://doi.org/10.1016/j.atmosenv.2013.11.029, 2014.
Haywood, J. and Boucher, O.: Estimates of the direct and indirect radiative forcing due to tropospheric aerosols: A review, Rev. Geophys., 38, 513–543, https://doi.org/10.1029/1999RG000078, 2000.
Hodas, N., Zuend, A., Mui, W., Flagan, R. C., and Seinfeld, J. H.: Influence of particle-phase state on the hygroscopic behavior of mixed organic–inorganic aerosols, Atmos. Chem. Phys., 15, 5027–5045, https://doi.org/10.5194/acp-15-5027-2015, 2015.
Hoffer, A., Tóth, Á., Pósfai, M., Chung, C. E., and Gelencsér, A.: Brown carbon absorption in the red and near-infrared spectral region, Atmos. Meas. Tech., 10, 2353–2359, https://doi.org/10.5194/amt-10-2353-2017, 2017.
Honrath, R. E., Owen, R. C., Val Martín, M., Reid, J. S., Lapina, K., Fialho, P., Dziobak, M. P., Kleissl, J., and Westphal, D. L.: Regional and hemispheric impacts of anthropogenic and biomass burning emissions on summertime CO and O3 in the North Atlantic lower free troposphere, J. Geophys. Res., 109, 1–17, https://doi.org/10.1029/2004JD005147, 2004.
Hosny, N. A., Fitzgerald, C., Vyšniauskas, A., Athanasiadis, A., Berkemeier, T., Uygur, N., Pöschl, U., Shiraiwa, M., Kalberer, M., Pope, F. D., and Kuimova, M. K.: Direct imaging of changes in aerosol particle viscosity upon hydration and chemical aging, Chem. Sci., 7, 1357–1367, https://doi.org/10.1039/c5sc02959g, 2016.
Huang, J., Minnis, P., Chen, B., Huang, Z., Liu, Z., Zhao, Q., Yi, Y., and Ayers, J. K.: Long-range transport and vertical structure of Asian dust from CALIPSO and surface measurements during PACDEX, J. Geophys. Res.-Atmos, 113, 1–13, https://doi.org/10.1029/2008JD010620, 2008.
Igel, A. L., Ekman, A. M. L., Leck, C., Tjernström, M., Savre, J., and Sedlar, J.: The free troposphere as a potential source of arctic boundary layer aerosol particles, Geophys. Res. Lett., 44, 7053–7060, https://doi.org/10.1002/2017GL073808, 2017.
Ilotoviz, E., Ghate, V. P., and Raveh-Rubin, S.: The Impact of Slantwise Descending Dry Intrusions on the Marine Boundary Layer and Air-Sea Interface Over the ARM Eastern North Atlantic Site, J. Geophys. Res.-Atmos., 126, e2020JD033879, https://doi.org/10.1029/2020JD033879, 2021.
Jaffe, D., Prestbo, E., Swartzendruber, P., Weiss-Penzias, P., Kato, S., Takami, A., Hatakeyama, S., and Kajii, Y.: Export of atmospheric mercury from Asia, Atmos. Environ., 39, 3029–3038, https://doi.org/10.1016/j.atmosenv.2005.01.030, 2005.
Jain, S. and Petrucci, G. A.: A new method to measure aerosol particle bounce using a cascade electrical low pressure impactor, Aerosol Sci. Technol., 49, 390–399, https://doi.org/10.1080/02786826.2015.1036393, 2015.
Kaiser, J. W., Heil, A., Andreae, M. O., Benedetti, A., Chubarova, N., Jones, L., Morcrette, J.-J., Razinger, M., Schultz, M. G., Suttie, M., and van der Werf, G. R.: Biomass burning emissions estimated with a global fire assimilation system based on observed fire radiative power, Biogeosciences, 9, 527–554, https://doi.org/10.5194/bg-9-527-2012, 2012.
Kaluarachchi, C. P., Or, V. W., Lan, Y., Madawala, C. K., Hasenecz, E. S., Crocker, D. R., Morris, C. K., Lee, H. D., Mayer, K. J., Sauer, J. S., Lee, C., Dorce, G., Malfatti, F., Stone, E. A., Cappa, C. D., Grassian, V. H., Prather, K. A., and Tivanski, A. V.: Size-Dependent Morphology, Composition, Phase State, and Water Uptake of Nascent Submicrometer Sea Spray Aerosols during a Phytoplankton Bloom, ACS Earth Sp. Chem., 6, 116–130, https://doi.org/10.1021/acsearthspacechem.1c00306, 2022.
Kim, H., Collier, S., Ge, X., Xu, J., Sun, Y., Jiang, W., Wang, Y., Herckes, P., and Zhang, Q.: Chemical processing of water-soluble species and formation of secondary organic aerosol in fogs, Atmos. Environ., 200, 158–166, https://doi.org/10.1016/j.atmosenv.2018.11.062, 2019.
King, S. M., Butcher, A. C., Rosenoern, T., Coz, E., Lieke, K. I., De Leeuw, G., Nilsson, E. D., and Bilde, M.: Investigating primary marine aerosol properties: CCN activity of sea salt and mixed inorganic-organic particles, Environ. Sci. Technol, 46, 10405–10412, https://doi.org/10.1021/es300574u, 2012.
Kirillova, E. N., Marinoni, A., Bonasoni, P., Vuillermoz, E., Facchini, M. C., Fuzzi, S., and Decesari, S.: Light absorption properties of brown carbon in the high Himalayas, J. Geophys. Res.-Atmos., 121, 9621–9639, https://doi.org/10.1002/2016JD025030, 2016.
Knopf, D. A., Alpert, P. A., and Wang, B.: The Role of Organic Aerosol in Atmospheric Ice Nucleation: A Review, ACS Earth Sp. Chem., 2, 168–202, https://doi.org/10.1021/acsearthspacechem.7b00120, 2018.
Koop, T., Bookhold, J., Shiraiwa, M., and Pöschl, U.: Glass transition and phase state of organic compounds: Dependency on molecular properties and implications for secondary organic aerosols in the atmosphere, Phys. Chem. Chem. Phys, 13, 19238–19255, https://doi.org/10.1039/c1cp22617g, 2011.
Kristensen, T. B., Müller, T., Kandler, K., Benker, N., Hartmann, M., Prospero, J. M., Wiedensohler, A., and Stratmann, F.: Properties of cloud condensation nuclei (CCN) in the trade wind marine boundary layer of the western North Atlantic, Atmos. Chem. Phys., 16, 2675–2688, https://doi.org/10.5194/acp-16-2675-2016, 2016.
Kuwata, M. and Martin, S. T.: Phase of atmospheric secondary organic material affects its reactivity, P. Natl. Acad. Sci. USA, 109, 17354–17359, https://doi.org/10.1073/pnas.1209071109, 2012.
Laing, J. R., Jaffe, D. A., and Hee, J. R.: Physical and optical properties of aged biomass burning aerosol from wildfires in Siberia and the Western USA at the Mt. Bachelor Observatory, Atmos. Chem. Phys., 16, 15185–15197, https://doi.org/10.5194/acp-16-15185-2016, 2016.
Laskin, A., Wietsma, T. W., Krueger, B. J., and Grassian, V. H.: Heterogeneous chemistry of individual mineral dust particles with nitric acid: A combined CCSEM/EDX, ESEM, and ICP-MS study, J. Geophys. Res., 110, D10208, https://doi.org/10.1029/2004JD005206, 2005.
Laskin, A., Cowin, J. P., and Iedema, M. J.: Analysis of individual environmental particles using modern methods of electron microscopy and X-ray microanalysis, J. Electron Spectros. Relat. Phenomena, 150, 260–274, https://doi.org/10.1016/j.elspec.2005.06.008, 2006.
Laskin, A., Laskin, J., and Nizkorodov, S. A.: Chemistry of Atmospheric Brown Carbon, Chem. Rev., 115, 4335–4382, https://doi.org/10.1021/cr5006167, 2015.
Lata, N. N., Zhang, B., Schum, S., Mazzoleni, L., Brimberry, R., Marcus, M. A., Cantrell, W. H., Fialho, P., and Mazzoleni, C.: Aerosol Composition, Mixing State, and Phase State of Free Tropospheric Particles and Their Role in Ice Cloud Formation, ACS Earth Sp. Chem., 5, 3499–3510, https://doi.org/10.1021/acsearthspacechem.1c00315, 2021.
Lee, A. K. Y., Herckes, P., Leaitch, W. R., MacDonald, A. M., and Abbatt, J. P. D.: Aqueous OH oxidation of ambient organic aerosol and cloud water organics: Formation of highly oxidized products, Geophys. Res. Lett., 38, 2–6, https://doi.org/10.1029/2011GL047439, 2011.
Lee, A. K. Y., Hayden, K. L., Herckes, P., Leaitch, W. R., Liggio, J., Macdonald, A. M., and Abbatt, J. P. D.: Characterization of aerosol and cloud water at a mountain site during WACS 2010: secondary organic aerosol formation through oxidative cloud processing, Atmos. Chem. Phys., 12, 7103–7116, https://doi.org/10.5194/acp-12-7103-2012, 2012.
Lienhard, D. M., Huisman, A. J., Krieger, U. K., Rudich, Y., Marcolli, C., Luo, B. P., Bones, D. L., Reid, J. P., Lambe, A. T., Canagaratna, M. R., Davidovits, P., Onasch, T. B., Worsnop, D. R., Steimer, S. S., Koop, T., and Peter, T.: Viscous organic aerosol particles in the upper troposphere: diffusivity-controlled water uptake and ice nucleation?, Atmos. Chem. Phys., 15, 13599–13613, https://doi.org/10.5194/acp-15-13599-2015, 2015.
Liu, P., Li, Y. J., Wang, Y., Bateman, A. P., Zhang, Y., Gong, Z., Bertram, A. K., and Martin, S. T.: Highly Viscous States Affect the Browning of Atmospheric Organic Particulate Matter, ACS Cent. Sci., 4, 207–215, https://doi.org/10.1021/acscentsci.7b00452, 2018a.
Liu, P., Song, M., Zhao, T., Gunthe, S. S., Ham, S., He, Y., Qin, Y. M., Gong, Z., Amorim, J. C., Bertram, A. K., and Martin, S. T.: Resolving the mechanisms of hygroscopic growth and cloud condensation nuclei activity for organic particulate matter, Nat. Commun., 9, 4076, https://doi.org/10.1038/s41467-018-06622-2, 2018b.
Liu, Y., Wu, Z., Wang, Y., Xiao, Y., Gu, F., Zheng, J., Tan, T., Shang, D., Wu, Y., Zeng, L., Hu, M., Bateman, A. P., and Martin, S. T.: Submicrometer Particles Are in the Liquid State during Heavy Haze Episodes in the Urban Atmosphere of Beijing, China, Environ. Sci. Technol. Lett., 4, 427–432, https://doi.org/10.1021/acs.estlett.7b00352, 2017.
Liu, Y., Wu, Z., Huang, X., Shen, H., Bai, Y., Qiao, K., Meng, X., Hu, W., Tang, M., and He, L.: Aerosol Phase State and Its Link to Chemical Composition and Liquid Water Content in a Subtropical Coastal Megacity, Environ. Sci. Technol., 53, 5027–5033, https://doi.org/10.1021/acs.est.9b01196, 2019.
Liu, Y., Meng, X., Wu, Z., Huang, D., Wang, H., Chen, J., Chen, J., Zong, T., Fang, X., Tan, T., Zhao, G., Chen, S., Zeng, L., Guo, S., Huang, X., He, L., Zeng, L., and Hu, M.: The particle phase state during the biomass burning events, Sci. Total Environ., 792, 148035, https://doi.org/10.1016/j.scitotenv.2021.148035, 2021.
Li, Y. J., Liu, P. F., Bergoend, C., Bateman, A. P., and Martin, S. T.: Rebounding hygroscopic inorganic aerosol particles: Liquids, gels, and hydrates, Aerosol Sci. Technol., 51, 388–396, https://doi.org/10.1080/02786826.2016.1263384, 2017.
Li, Y., Day, D. A., Stark, H., Jimenez, J. L., and Shiraiwa, M.: Predictions of the glass transition temperature and viscosity of organic aerosols from volatility distributions, Atmos. Chem. Phys., 20, 8103–8122, https://doi.org/10.5194/acp-20-8103-2020, 2020.
Li, Y., Carlton, A. G., and Shiraiwa, M.: Diurnal and Seasonal Variations in the Phase State of Secondary Organic Aerosol Material over the Contiguous US Simulated in CMAQ, ACS Earth Sp. Chem, 5, 1971–1982, https://doi.org/10.1021/acsearthspacechem.1c00094, 2021.
Malecha, K. T. and Nizkorodov, S. A.: Photodegradation of Secondary Organic Aerosol Particles as a Source of Small, Oxygenated Volatile Organic Compounds, Environ. Sci. Technol., 50, 9990–9997, https://doi.org/10.1021/acs.est.6b02313, 2016.
Marinoni, A., Cristofanelli, P., Calzolari, F., Roccato, F., Bonafè, U., and Bonasoni, P.: Continuous measurements of aerosol physical parameters at the Mt. Cimone GAW Station (2165 m a.s.l., Italy), Sci. Total Environ., 391, 241–251, https://doi.org/10.1016/j.scitotenv.2007.10.004, 2008.
Marsh, A., Rovelli, G., Song, Y. C., Pereira, K. L., Willoughby, R. E., Bzdek, B. R., Hamilton, J. F., Orr-Ewing, A. J., Topping, D. O., and Reid, J. P.: Accurate representations of the physicochemical properties of atmospheric aerosols: When are laboratory measurements of value?, Faraday Discuss., 200, 639–661, https://doi.org/10.1039/c7fd00008a, 2017.
Marshall, F. H., Miles, R. E. H., Song, Y. C., Ohm, P. B., Power, R. M., Reid, J. P., and Dutcher, C. S.: Diffusion and reactivity in ultraviscous aerosol and the correlation with particle viscosity, Chem. Sci., 7, 1298–1308, https://doi.org/10.1039/c5sc03223g, 2016.
Moffet, R. C., Henn, T., Laskin, A., and Gilles, M. K.: Automated chemical analysis of internally mixed aerosol particles using X-ray spectromicroscopy at the carbon K-edge, Anal. Chem., 82, 7906–7914, https://doi.org/10.1021/ac1012909, 2010.
Moffet, R. C., Tivanski, A. V., and Gilles, M. K.: Scanning Transmission X-ray Microscopy: Applications in Atmospheric Aerosol Research, in Fundamentals and Applications in Aerosol Spectroscopy, edited by: Signorell, R. and Reid, J. P., Taylor and Francis Books, Inc., Boca Raton, FL, 419–462, ISBN: 9781420085617, 2011.
Moffet, R. C., Rödel, T. C., Kelly, S. T., Yu, X. Y., Carroll, G. T., Fast, J., Zaveri, R. A., Laskin, A., and Gilles, M. K.: Spectro-microscopic measurements of carbonaceous aerosol aging in Central California, Atmos. Chem. Phys., 13, 10445–10459, https://doi.org/10.5194/acp-13-10445-2013, 2013.
Moosmüller, H., Chakrabarty, R. K., and Arnott, W. P.: Aerosol light absorption and its measurement: A review, J. Quant. Spectrosc. Radiat. Transf., 110, 844–878, https://doi.org/10.1016/j.jqsrt.2009.02.035, 2009.
Motos, G., Corbin, J. C., Schmale, J., Modini, R. L., Bertò, M., Kupiszewski, P., Baltensperger, U., and Gysel-Beer, M.: Black Carbon Aerosols in the Lower Free Troposphere are Heavily Coated in Summer but Largely Uncoated in Winter at Jungfraujoch in the Swiss Alps, Geophys. Res. Lett., 47, 1–10, https://doi.org/10.1029/2020GL088011, 2020.
Murray, B. J., Wilson, T. W., Dobbie, S., Cui, Z., Al-Jumur, S. M. R. K., Möhler, O., Schnaiter, M., Wagner, R., Benz, S., Niemand, M., Saathoff, H., Ebert, V., Wagner, S., and Kärcher, B.: Heterogeneous nucleation of ice particles on glassy aerosols under cirrus conditions, Nat. Geosci., 3, 233–237, https://doi.org/10.1038/ngeo817, 2010.
Myhre, G., Shindell, D., Bréon, F.-M., W. Collins, J. F., Huang, J., Koch, D., Lamarque, J.-F., Lee, D., Mendoza, B., Nakajima, T., Robock, A., Stephens, G., Takemura, T., and Zhang, H.: Anthropogenic and Natural Radiative Forcing, in: Climate Change 2013: The Physical Science Basis. Contribution of Working Group I to the Fifth Assessment Report of the Intergovernmental Panel on Climate Change, chapt. 8: , edited by: Stocker, T. F., Qin, D., Plattner, G.-K., Tignor, M., Allen, S. K., Boschung, J., Nauels, A., Xia, Y., Bex, V., and Midgley, P. M., Cambridge, United Kingdom and New York, NY, USA, 659–740, https://doi.org/10.1017/CBO9781107415324.018, 2013.
NCEP (National Centers for Environmental Prediction): NCEP Global Forecast System (GFS) Analyses and Forecasts [data set], https://www.ncei.noaa.gov/data/global-forecast-system/access/historical/, (last access: 1 May 2022), 2017.
North, G. R., Zhang, F., and Pyle, J.: Encyclopedia of Atmospheric Sciences, 2nd edn., edited by: North, G. R., Pyle, J., and Zhang, F., Academic Press, Cambridge, MA, ISBN: 9780123822260, 2014.
O'Brien, R. E., Neu, A., Epstein, S. A., Macmillan, A. C., Wang, B., Kelly, S. T., Nizkorodov, S. A., Laskin, A., Moffet, R. C., and Gilles, M. K.: Physical properties of ambient and laboratory- generated secondary organic aerosol, Geophys. Res. Lett., 41, 4347–4353, https://doi.org/10.1002/2014GL060219, 2014.
Olivier, J. G. J. and Berdowski, J. J. M.: Global emission sources and sinks, in: The Climate System, edited by: Berdowski, J., Guicherit, R. R., and Heij, B., Swets & Zeitlinger, Netherlands, 33–78, INVS: 905809255, 2001.
Owen, R. C. and Honrath, R. E.: Technical note: a new method for the Lagrangian tracking of pollution plumes from source to receptor using gridded model output, Atmos. Chem. Phys., 9, 2577–2595, https://doi.org/10.5194/acp-9-2577-2009, 2009.
Pajunoja, A., Hu, W., Leong, Y. J., Taylor, N. F., Miettinen, P., Palm, B. B., Mikkonen, S., Collins, D. R., Jimenez, J. L., and Virtanen, A.: Phase state of ambient aerosol linked with water uptake and chemical aging in the southeastern US, Atmos. Chem. Phys., 16, 11163–11176, https://doi.org/10.5194/acp-16-11163-2016, 2016.
Pan, X., Underwood, J. S., Xing, J.-H., Mang, S. A., and Nizkorodov, S. A.: Photodegradation of secondary organic aerosol generated from limonene oxidation by ozone studied with chemical ionization mass spectrometry, Atmos. Chem. Phys., 9, 3851–3865, https://doi.org/10.5194/acp-9-3851-2009, 2009.
Petters, M. and Kasparoglu, S.: Predicting the influence of particle size on the glass transition temperature and viscosity of secondary organic material, Sci. Rep., 10, 1–10, https://doi.org/10.1038/s41598-020-71490-0, 2020.
Pham, D. Q., O'Brien, R., Fraund, M., Bonanno, D., Laskina, O., Beall, C., Moore, K. A., Forestieri, S., Wang, X., Lee, C., Sultana, C., Grassian, V., Cappa, C. D., Prather, K. A., and Moffet, R. C.: Biological Impacts on Carbon Speciation and Morphology of Sea Spray Aerosol, ACS Earth Sp. Chem., 1, 551–561, https://doi.org/10.1021/acsearthspacechem.7b00069, 2017.
Pöschl, U. and Shiraiwa, M.: Multiphase Chemistry at the Atmosphere-Biosphere Interface Influencing Climate and Public Health in the Anthropocene, Chem. Rev., 115, 4440–4475, https://doi.org/10.1021/cr500487s, 2015a.
Pöschl, U. and Shiraiwa, M.: Multiphase Chemistry at the Atmosphere-Biosphere Interface Influencing Climate and Public Health in the Anthropocene, Chem. Rev., 115, 4440–4475, https://doi.org/10.1021/cr500487s, 2015b.
Posfai, M., Gelencser, A., Simonics, R., Arato, K., Li, J., Hobbs, P. V., and Buseck, P. R.: Atmospheric tar balls: Particles from biomass and biofuel burning, J. Geophys. Res., 109, D06213, https://doi.org/10.1029/2003JD004169, 2004.
Power, R. M., Simpson, S. H., Reid, J. P., and Hudson, A. J.: The transition from liquid to solid-like behaviour in ultrahigh viscosity aerosol particles, Chem. Sci., 4, 2597–2604, https://doi.org/10.1039/c3sc50682g, 2013.
Pringle, K. J., Tost, H., Pozzer, A., Pöschl, U., and Lelieveld, J.: Global distribution of the effective aerosol hygroscopicity parameter for CCN activation, Atmos. Chem. Phys., 10, 5241–5255, https://doi.org/10.5194/acp-10-5241-2010, 2010.
Rasool, Q. Z., Shrivastava, M., Octaviani, M., Zhao, B., Gaudet, B., and Liu, Y.: Modeling Volatility-Based Aerosol Phase State Predictions in the Amazon Rainforest, ACS Earth Sp. Chem., 5, 2910–2924, https://doi.org/10.1021/acsearthspacechem.1c00255, 2021.
Raveh-Rubin, S.: Dry intrusions: Lagrangian climatology and dynamical impact on the planetary boundary layer, J. Clim., 30, 6661–6682, https://doi.org/10.1175/JCLI-D-16-0782.1, 2017.
Raveh-Rubin, S. and Catto, J. L.: Climatology and dynamics of the link between dry intrusions and cold fronts during winter, Part II: Front-centred perspective, Clim. Dyn., 53, 1893–1909, https://doi.org/10.1007/s00382-019-04793-2, 2019.
Reid, J. P., Bertram, A. K., Topping, D. O., Laskin, A., Martin, S. T., Petters, M. D., Pope, F. D., and Rovelli, G.: The viscosity of atmospherically relevant organic particles, Nat. Commun., 9, 956, https://doi.org/10.1038/s41467-018-03027-z, 2018.
Renbaum-Wolff, L., Grayson, J. W., Bateman, A. P., Kuwata, M., Sellier, M., Murray, B. J., Shilling, J. E., Martin, S. T., and Bertram, A. K.: Viscosity of a-pinene secondary organic material and implications for particle growth and reactivity, P. Natl. Acad. Sci. USA, 110, 8014–8019, https://doi.org/10.1073/pnas.1219548110, 2013.
Richards, D. S., Trobaugh, K. L., Hajek-Herrera, J., Price, C. L., Sheldon, C. S., Davies, J. F., and Davi, R. D.: Ion-molecule interactions enable unexpected phase transitions in organic-inorganic aerosol, Sci. Adv., 6, 1–12, https://doi.org/10.1126/sciadv.abb5643, 2020.
Riemer, N., Ault, A. P., West, M., Craig, R. L., and Curtis, J. H.: Aerosol Mixing State: Measurements, Modeling, and Impacts, Rev. Geophys., 57, 187–249, https://doi.org/10.1029/2018RG000615, 2019.
Rinaldi, M., Gilardoni, S., Paglione, M., Sandrini, S., Fuzzi, S., Massoli, P., Bonasoni, P., Cristofanelli, P., Marinoni, A., Poluzzi, V., and Decesari, S.: Organic aerosol evolution and transport observed at Mt. Cimone (2165 m a.s.l.), Italy, during the PEGASOS campaign, Atmos. Chem. Phys., 15, 11327–11340, https://doi.org/10.5194/acp-15-11327-2015, 2015.
Rose, C., Sellegri, K., Moreno, I., Velarde, F., Ramonet, M., Weinhold, K., Krejci, R., Andrade, M., Wiedensohler, A., Ginot, P., and Laj, P.: CCN production by new particle formation in the free troposphere, Atmos. Chem. Phys., 17, 1529–1541, https://doi.org/10.5194/acp-17-1529-2017, 2017.
Rovelli, G., Song, Y. C., MacLean, A. M., Topping, D. O., Bertram, A. K., and Reid, J. P.: Comparison of Approaches for Measuring and Predicting the Viscosity of Ternary Component Aerosol Particles, Anal. Chem., 91, 5074–5082, https://doi.org/10.1021/acs.analchem.8b05353, 2019.
Saleh, R.: From Measurements to Models: Toward Accurate Representation of Brown Carbon in Climate Calculations, Curr Pollut. Rep, 6, 90–104, https://doi.org/10.1007/s40726-020-00139-3, 2020.
Sanchez, K. J., Chen, C. L., Russell, L. M., Betha, R., Liu, J., Price, D. J., Massoli, P., Ziemba, L. D., Crosbie, E. C., Moore, R. H., Müller, M., Schiller, S. A., Wisthaler, A., Lee, A. K. Y., Quinn, P. K., Bates, T. S., Porter, J., Bell, T. G., Saltzman, E. S., Vaillancourt, R. D., and Behrenfeld, M. J.: Substantial Seasonal Contribution of Observed Biogenic Sulfate Particles to Cloud Condensation Nuclei, Sci. Rep., 8, 1–14, https://doi.org/10.1038/s41598-018-21590-9, 2018.
Saukko, E., Lambe, A. T., Massoli, P., Koop, T., Wright, J. P., Croasdale, D. R., Pedernera, D. A., Onasch, T. B., Laaksonen, A., Davidovits, P., Worsnop, D. R., and Virtanen, A.: Humidity-dependent phase state of SOA particles from biogenic and anthropogenic precursors, Atmos. Chem. Phys., 12, 7517–7529, https://doi.org/10.5194/acp-12-7517-2012, 2012.
Schill, G. P. and Tolbert, M. A.: Heterogeneous ice nucleation on simulated sea-spray aerosol using Raman microscopy, J. Phys. Chem. C., 118, 29234–29241, https://doi.org/10.1021/jp505379j, 2014.
Schmale, J., Henning, S., Henzing, B., Keskinen, H., Sellegri, K., Ovadnevaite, J., Bougiatioti, A., Kalivitis, N., Stavroulas, I., Jefferson, A., Park, M., and Schlag, P.: Data Descriptor : Collocated observations of cloud condensation nuclei, particle size distributions, and chemical composition, Sci. Data, 4, 170003, https://doi.org/10.1038/sdata.2017.3, 2017.
Schmedding, R., Rasool, Q. Z., Zhang, Y., Pye, H. O. T., Zhang, H., Chen, Y., Surratt, J. D., Lopez-Hilfiker, F. D., Thornton, J. A., Goldstein, A. H., and Vizuete, W.: Predicting secondary organic aerosol phase state and viscosity and its effect on multiphase chemistry in a regional-scale air quality model, Atmos. Chem. Phys., 20, 8201–8225, https://doi.org/10.5194/acp-20-8201-2020, 2020.
Schmeissner, T., Krejci, R., Ström, J., Birmili, W., Wiedensohler, A., Hochschild, G., Gross, J., Hoffmann, P., and Calderon, S.: Analysis of number size distributions of tropical free tropospheric aerosol particles observed at Pico Espejo (4765 m a.s.l.), Venezuela, Atmos. Chem. Phys., 11, 3319–3332, https://doi.org/10.5194/acp-11-3319-2011, 2011.
Schulze, B. C., Charan, S. M., Kenseth, C. M., Kong, W., Bates, K. H., Williams, W., Metcalf, A. R., Jonsson, H. H., Woods, R., Sorooshian, A., Flagan, R. C., and Seinfeld, J. H.: Characterization of Aerosol Hygroscopicity Over the Northeast Pacific Ocean: Impacts on Prediction of CCN and Stratocumulus Cloud Droplet Number Concentrations, Earth Sp. Sci., 7, e2020EA001098, https://doi.org/10.1029/2020ea001098, 2020.
Schum, S. K., Zhang, B., Džepina, K., Fialho, P., Mazzoleni, C., and Mazzoleni, L. R.: Molecular and physical characteristics of aerosol at a remote free troposphere site: implications for atmospheric aging, Atmos. Chem. Phys., 18, 14017–14036, https://doi.org/10.5194/acp-18-14017-2018, 2018.
Seibert, P. and Frank, A.: Source-receptor matrix calculation with a Lagrangian particle dispersion model in backward mode, Atmos. Chem. Phys., 4, 51–63, https://doi.org/10.5194/acp-4-51-2004, 2004.
Seinfeld, J. H. and Pandis, S. N.: Atmospheric Chemistry and Physics: From Air Pollution to Climate Change, 2nd edn., John Wiley and Sons, Inc., Hoboken, New Jersey, ISBN: 9780471720171, 2006.
Seinfeld, J. H., Bretherton, C., Carslaw, K. S., Coe, H., DeMott, P. J., Dunlea, E. J., Feingold, G., Ghan, S., Guenther, A. B., Kahn, R., Kraucunas, I., Kreidenweis, S. M., Molina, M. J., Nenes, A., Penner, J. E., Prather, K. A., Ramanathan, V., Ramaswamy, V., Rasch, P. J., Ravishankara, A. R., Rosenfeld, D., Stephens, G., and Wood, R.: Improving our fundamental understanding of the role of aerosol-cloud interactions in the climate system, P. Natl. Acad. Sci. USA, 113, 5781–5790, https://doi.org/10.1073/pnas.1514043113, 2016.
Sharma, N., China, S., Bhandari, J., Gorkowski, K., Dubey, M., Zaveri, R. A., and Mazzoleni, C.: Physical Properties of Aerosol Internally Mixed With Soot Particles in a Biogenically Dominated Environment in California, Geophys. Res. Lett., 45, 11473–11482, https://doi.org/10.1029/2018GL079404, 2018.
Shiraiwa, M., Li, Y., Tsimpidi, A. P., Karydis, V. A., Berkemeier, T., Pandis, S. N., Lelieveld, J., Koop, T., and Pöschl, U.: Global distribution of particle phase state in atmospheric secondary organic aerosols, Nat. Commun., 8, 15002, https://doi.org/10.1038/ncomms15002, 2017.
Shrivastava, M., Lou, S., Zelenyuk, A., Easter, R. C., Corley, R. A., Thrall, B. D., Rasch, P. J., Fast, J. D., Simonich, S. L. M., Shen, H., and Tao, S.: Global long-range transport and lung cancer risk from polycyclic aromatic hydrocarbons shielded by coatings of organic aerosol, P. Natl. Acad. Sci. USA, 114, 1246–1251, https://doi.org/10.1073/pnas.1702221114, 2017.
Shrivastava, M., Rasool, Q. Z., Zhao, B., Octaviani, M., Zaveri, R. A., Zelenyuk, A., Gaudet, B., Liu, Y., Shilling, J. E., Schneider, J., Schulz, C., Zöger, M., Martin, S. T., Ye, J., Guenther, A., Souza, R. F., Wendisch, M., and Pöschl, U.: Tight Coupling of Surface and In-Plant Biochemistry and Convection Governs Key Fine Particulate Components over the Amazon Rainforest, ACS Earth Sp. Chem, 6, 380–390, https://doi.org/10.1021/acsearthspacechem.1c00356, 2022.
Siebert, H., Szodry, K. E., Egerer, U., Wehner, B., Henning, S., Chevalier, K., Lückerath, J., Welz, O., Weinhold, K., Lauermann, F., Gottschalk, M., Ehrlich, A., Wendisch, M., Fialho, P., Roberts, G., Allwayin, N., Schum, S., Shaw, R. A., Mazzoleni, C., Mazzoleni, L., Nowak, J. L., Malinowski, S. P., Karpinska, K., Kumala, W., Czyzewska, D., Luke, E. P., Kollias, P., Wood, R., and Mellado, J. P.: Observations of aerosol, cloud, turbulence, and radiation properties at the top of the Marine Boundary Layer over the Eastern North Atlantic Ocean, B. Am. Meteorol. Soc., 102, E123–E147, https://doi.org/10.1175/BAMS-D-19-0191.1, 2021.
Slade, J. H., Ault, A. P., Bui, A. T., Ditto, J. C., Lei, Z., Bondy, A. L., Olson, N. E., Cook, R. D., Desrochers, S. J., Harvey, R. M., Erickson, M. H., Wallace, H. W., Alvarez, S. L., Flynn, J. H., Boor, B. E., Petrucci, G. A., Gentner, D. R., Griffin, R. J., and Shepson, P. B.: Bouncier Particles at Night: Biogenic Secondary Organic Aerosol Chemistry and Sulfate Drive Diel Variations in the Aerosol Phase in a Mixed Forest, Environ. Sci. Technol., 53, 4977–4987, https://doi.org/10.1021/acs.est.8b07319, 2019.
Song, Y.-C., Lilek, J., Lee, J. B., Chan, M. N., Wu, Z., Zuend, A., and Song, M.: Viscosity and phase state of aerosol particles consisting of sucrose mixed with inorganic salts, Atmos. Chem. Phys., 21, 10215–10228, https://doi.org/10.5194/acp-21-10215-2021, 2021.
Sorooshian, A., Varutbangkul, V., Brechtel, F. J., Ervens, B., Feingold, G., Bahreini, R., Murphy, S. M., Holloway, J. S., Atlas, E. L., Buzorius, G., Jonsson, H., Flagan, R. C., and Seinfeld, J. H.: Oxalic acid in clear and cloudy atmospheres: Analysis of data from International Consortium for Atmospheric Research on Transport and Transformation 2004, J. Geophys. Res., 111, 1–17, https://doi.org/10.1029/2005JD006880, 2006.
Sorooshian, A., Lu, M. L., Brechtel, F. J., Jonsson, H., Feingold, G., Flagan, R. C., and Seinfeld, J. H.: On the source of organic acid aerosol layers above clouds, Environ. Sci. Technol., 41, 4647–4654, https://doi.org/10.1021/es0630442, 2007.
Stockwell, C. E., Jayarathne, T., Cochrane, M. A., Ryan, K. C., Putra, E. I., Saharjo, B. H., Nurhayati, A. D., Albar, I., Blake, D. R., Simpson, I. J., Stone, E. A., and Yokelson, R. J.: Field measurements of trace gases and aerosols emitted by peat fires in Central Kalimantan, Indonesia, during the 2015 El Niño, Atmos. Chem. Phys., 16, 11711–11732, https://doi.org/10.5194/acp-16-11711-2016, 2016.
Stohl, A., Forster, C., Frank, A., Seibert, P., and Wotawa, G.: Technical note: The Lagrangian particle dispersion model FLEXPART version 6.2, Atmos. Chem. Phys., 5, 2461–2474, [code] https://doi.org/10.5194/acp-5-2461-2005, 2005.
Sumlin, B. J., Pandey, A., Walker, M. J., Pattison, R. S., Williams, B. J., and Chakrabarty, R. K.: Atmospheric Photooxidation Diminishes Light Absorption by Primary Brown Carbon Aerosol from Biomass Burning, Environ. Sci. Technol. Lett, 4, 540–545, https://doi.org/10.1021/acs.estlett.7b00393, 2017.
Sun, J., Hermann, M., Yuan, Y., Birmili, W., Collaud Coen, M., Weinhold, K., Madueño, L., Poulain, L., Tuch, T., Ries, L., Sohmer, R., Couret, C., Frank, G., Brem, B. T., Gysel-Beer, M., Ma, N., and Wiedensohler, A.: Long-term trends of black carbon and particle number concentration in the lower free troposphere in Central Europe, Environ. Sci. Eur., 33, 47, https://doi.org/10.1186/s12302-021-00488-w, 2021.
Sun, Y., Zhang, Q., Macdonald, A. M., Hayden, K., Li, S. M., Liggio, J., Liu, P. S. K., Anlauf, K. G., Leaitch, W. R., Steffen, A., Cubison, M., Worsnop, D. R., van Donkelaar, A., and Martin, R. V.: Size-resolved aerosol chemistry on Whistler Mountain, Canada with a high-resolution aerosol mass spectrometer during INTEX-B, Atmos. Chem. Phys., 9, 3095–3111, https://doi.org/10.5194/acp-9-3095-2009, 2009.
Tomlin, J. M., Jankowski, K. A., Rivera-Adorno, F. A., Fraund, M., Stirm, B. H., Kaeser, R., Eakins, G. S., Mo, R. C., Shepson, P. B., and Laskin, A.: Chemical Imaging of Fine Mode Atmospheric Particles Collected from a Research Aircraft over Agricultural Fields, ACS Earth Sp. Chem., 4, 2171–2184, https://doi.org/10.1021/acsearthspacechem.0c00172, 2020.
Tomlin, J. M., Jankowski, K. A., Veghte, D. P., China, S., Wang, P., Fraund, M., Weis, J., Zheng, G., Wang, Y., Rivera-Adorno, F., Raveh-Rubin, S., Knopf, D. A., Wang, J., Gilles, M. K., Moffet, R. C., and Laskin, A.: Impact of dry intrusion events on the composition and mixing state of particles during the winter Aerosol and Cloud Experiment in the Eastern North Atlantic (ACE-ENA), Atmos. Chem. Phys., 21, 18123–18146, https://doi.org/10.5194/acp-21-18123-2021, 2021.
Val Martin, M., Honrath, R. E., Owen, R. C., and Lapina, K.: Large-scale impacts of anthropogenic pollution and boreal wildfires on the nitrogen oxides over the central North Atlantic region, J. Geophys. Res., 113, 1–11, https://doi.org/10.1029/2007JD009689, 2008a.
Val Martin, M., Honrath, R. E., Owen, R. C., and Li, Q. B.: Seasonal variation of nitrogen oxides in the central North Atlantic lower free troposhere, J. Geophys. Res., 113, 1–15, https://doi.org/10.1029/2007JD009688, 2008b.
Venzac, H., Sellegri, K., Villani, P., Picard, D., and Laj, P.: Seasonal variation of aerosol size distributions in the free troposphere and residual layer at the puy de Dôme station, France, Atmos. Chem. Phys., 9, 1465–1478, https://doi.org/10.5194/acp-9-1465-2009, 2009.
Virtanen, A., Joutsensaari, J., Koop, T., Kannosto, J., Yli-Pirilä, P., Leskinen, J., Mäkelä, J. M., Holopainen, J. K., Pöschl, U., Kulmala, M., Worsnop, D. R., and Laaksonen, A.: An amorphous solid state of biogenic secondary organic aerosol particles, Nature, 467, 824–827, https://doi.org/10.1038/nature09455, 2010.
Virtanen, A., Kannosto, J., Kuuluvainen, H., Arffman, A., Joutsensaari, J., Saukko, E., Hao, L., Yli-Pirilä, P., Tiitta, P., Holopainen, J. K., Keskinen, J., Worsnop, D. R., Smith, J. N., and Laaksonen, A.: Bounce behavior of freshly nucleated biogenic secondary organic aerosol particles, Atmos. Chem. Phys., 11, 8759–8766, https://doi.org/10.5194/acp-11-8759-2011, 2011.
Wang, B., O'Brien, R. E., Kelly, S. T., Shilling, J. E., Mo, R. C., Gilles, M. K., and Laskin, A.: Reactivity of Liquid and Semisolid Secondary Organic Carbon with Chloride and Nitrate in Atmospheric Aerosols, J. Phys. Chem. A, 119, 4498–4508, 2015.
Wang, B., Harder, T. H., Kelly, S. T., Piens, D. S., China, S., Kovarik, L., Keiluweit, M., Arey, B. W., Gilles, M. K., and Laskin, A.: Airborne soil organic particles generated by precipitation, Nat. Geosci., 9, 433–437, https://doi.org/10.1038/ngeo2705, 2016.
Wang, J., Cubison, M. J., Aiken, A. C., Jimenez, J. L., and Collins, D. R.: The importance of aerosol mixing state and size-resolved composition on CCN concentration and the variation of the importance with atmospheric aging of aerosols, Atmos. Chem. Phys., 10, 7267–7283, https://doi.org/10.5194/acp-10-7267-2010, 2010.
Weiss-Penzias, P., Jaffe, D. A., Swartzendruber, P., Dennison, J. B., Chand, D., Hafner, W., and Prestbo, E.: Observations of Asian air pollution in the free troposphere at Mount Bachelor Observatory during the spring of 2004, J. Geophys. Res., 111, 1–15, https://doi.org/10.1029/2005JD006522, 2006.
Wiedensohler, A., Birmili, W., Nowak, A., Sonntag, A., Weinhold, K., Merkel, M., Wehner, B., Tuch, T., Pfeifer, S., Fiebig, M., Fjäraa, A. M., Asmi, E., Sellegri, K., Depuy, R., Venzac, H., Villani, P., Laj, P., Aalto, P., Ogren, J. A., Swietlicki, E., Williams, P., Roldin, P., Quincey, P., Hüglin, C., Fierz-Schmidhauser, R., Gysel, M., Weingartner, E., Riccobono, F., Santos, S., Grüning, C., Faloon, K., Beddows, D., Harrison, R., Monahan, C., Jennings, S. G., O'Dowd, C. D., Marinoni, A., Horn, H.-G., Keck, L., Jiang, J., Scheckman, J., McMurry, P. H., Deng, Z., Zhao, C. S., Moerman, M., Henzing, B., de Leeuw, G., Löschau, G., and Bastian, S.: Mobility particle size spectrometers: harmonization of technical standards and data structure to facilitate high quality long-term observations of atmospheric particle number size distributions, Atmos. Meas. Tech., 5, 657–685, https://doi.org/10.5194/amt-5-657-2012, 2012.
Yamasoe, M. A., Artaxo, P., Miguel, A. H., and Allen, A. G.: Chemical composition of aerosol particles from direct emissions of vegetation fires in the Amazon Basin: Water-soluble species and trace elements, Atmos. Environ., 34, 1641–1653, https://doi.org/10.1016/S1352-2310(99)00329-5, 2000.
Yu, J. Z., Huang, X. F., Xu, J., and Hu, M.: When aerosol sulfate goes up, so does oxalate: Implication for the formation mechanisms of oxalate, Environ. Sci. Technol., 39, 128–133, https://doi.org/10.1021/es049559f, 2005.
Zhang, B., Owen, R. C., Perlinger, J. A., Kumar, A., Wu, S., Val Martin, M., Kramer, L., Helmig, D., and Honrath, R. E.: A semi-Lagrangian view of ozone production tendency in North American outflow in the summers of 2009 and 2010, Atmos. Chem. Phys., 14, 2267–2287, https://doi.org/10.5194/acp-14-2267-2014, 2014.
Zhang, B., Owen, R. C., Perlinger, J. A., Helmig, D., Val Martin, M., Kramer, L., Mazzoleni, L. R., and Mazzoleni, C.: Ten-year chemical signatures associated with long-range transport observed in the free troposphere over the central North Atlantic, Elem. Sci. Anth., 5, 194, https://doi.org/10.1525/elementa.194, 2017.
Zhao, B., Shrivastava, M., Donahue, N. M., Gordon, H., Schervish, M., Shilling, J. E., Zaveri, R. A., Wang, J., Andreae, M. O., Zhao, C., Gaudet, B., Liu, Y., Fan, J., and Fast, J. D.: High concentration of ultrafine particles in the Amazon free troposphere produced by organic new particle formation, P. Natl. Acad. Sci. USA, 117, 25344–25351, https://doi.org/10.1073/pnas.2006716117, 2020.
Zhou, S., Collier, S., Jaffe, D. A., and Zhang, Q.: Free tropospheric aerosols at the Mt. Bachelor Observatory: more oxidized and higher sulfate content compared to boundary layer aerosols, Atmos. Chem. Phys., 19, 1571–1585, https://doi.org/10.5194/acp-19-1571-2019, 2019.
Zufall, M. J. and Davidson, C. I.: Dry Deposition of Particles from the Atmosphere, in Air Pollution in the Ural Mountains: Environmental, Health and Policy Aspects, edited by: Linkov, I. and Wilson, R., Springer, Dordrecht, 55–56, ISBN: 978-94-011-5208-2., 1998.