the Creative Commons Attribution 4.0 License.
the Creative Commons Attribution 4.0 License.
 | 12 Jul 2022
Long-term trend of ozone pollution in China during 2014–2020: distinct seasonal and spatial characteristics and ozone sensitivity
Wenjie Wang
David D. Parrish
Siwen Wang
Fengxia Bao
Ruijing Ni
Suding Yang
Hongli Wang
Yafang Cheng
In the past decade, ozone (O3) pollution has become a severe environmental problem in China's major cities. Here, based on available observational records, we investigated the long-term trend of O3 pollution in China during 2014–2020. The O3 concentrations were slightly higher in urban areas than in non-urban areas. During these 7 years, the highest O3 concentrations primarily occurred during summer in northern China, and during autumn or spring in southern China. Although O3 precursors, including nitrogen oxides (NOx) and carbon monoxide (CO), continuously decreased, O3 concentrations generally increased throughout the 7 years with a slower increasing rate after 2017. The long-term trend of O3 concentrations differed across seasons, especially from 2019 to 2020, when O3 concentrations decreased in summer and increased in winter. To analyse the causes of this observed trend, a photochemical box model was used to investigate the change in the O3 sensitivity regime in two representative cities – Beijing and Shanghai. Our model simulations suggest that the summertime O3 sensitivity regime in urban areas of China has changed from a VOC-limited regime to a transition regime during 2014–2020. By 2020, the urban photochemistry was in a transition regime in summer but in a VOC-limited regime in winter. This study helps to understand the distinct trends of O3 in China and provides insights into efficient future O3 control strategies in different regions and seasons.
- Article
(3897 KB) - Full-text XML
-
Supplement
(596 KB) - BibTeX
- EndNote


Tropospheric ozone (O3) is an air pollutant that is detrimental to human health, vegetation and ecosystem productivity (Ainsworth et al., 2012; Mills et al., 2018; Monks et al., 2015; Fiore et al., 2009). The inhalation of O3 impairs the functioning of the human respiratory and cardiovascular systems through its reaction with the lining of the lung and other surfaces in the respiratory tract (Jindal, 2007). The O3 is also an important greenhouse gas that leads to positive radiative forcing (Stocker et al., 2014). A comprehensive characterisation of the spatial (latitude, longitude and altitude) and temporal distribution of tropospheric O3 is critical to our understanding of these issues. Here we summarise this distribution over China from the available observational records to the extent possible.
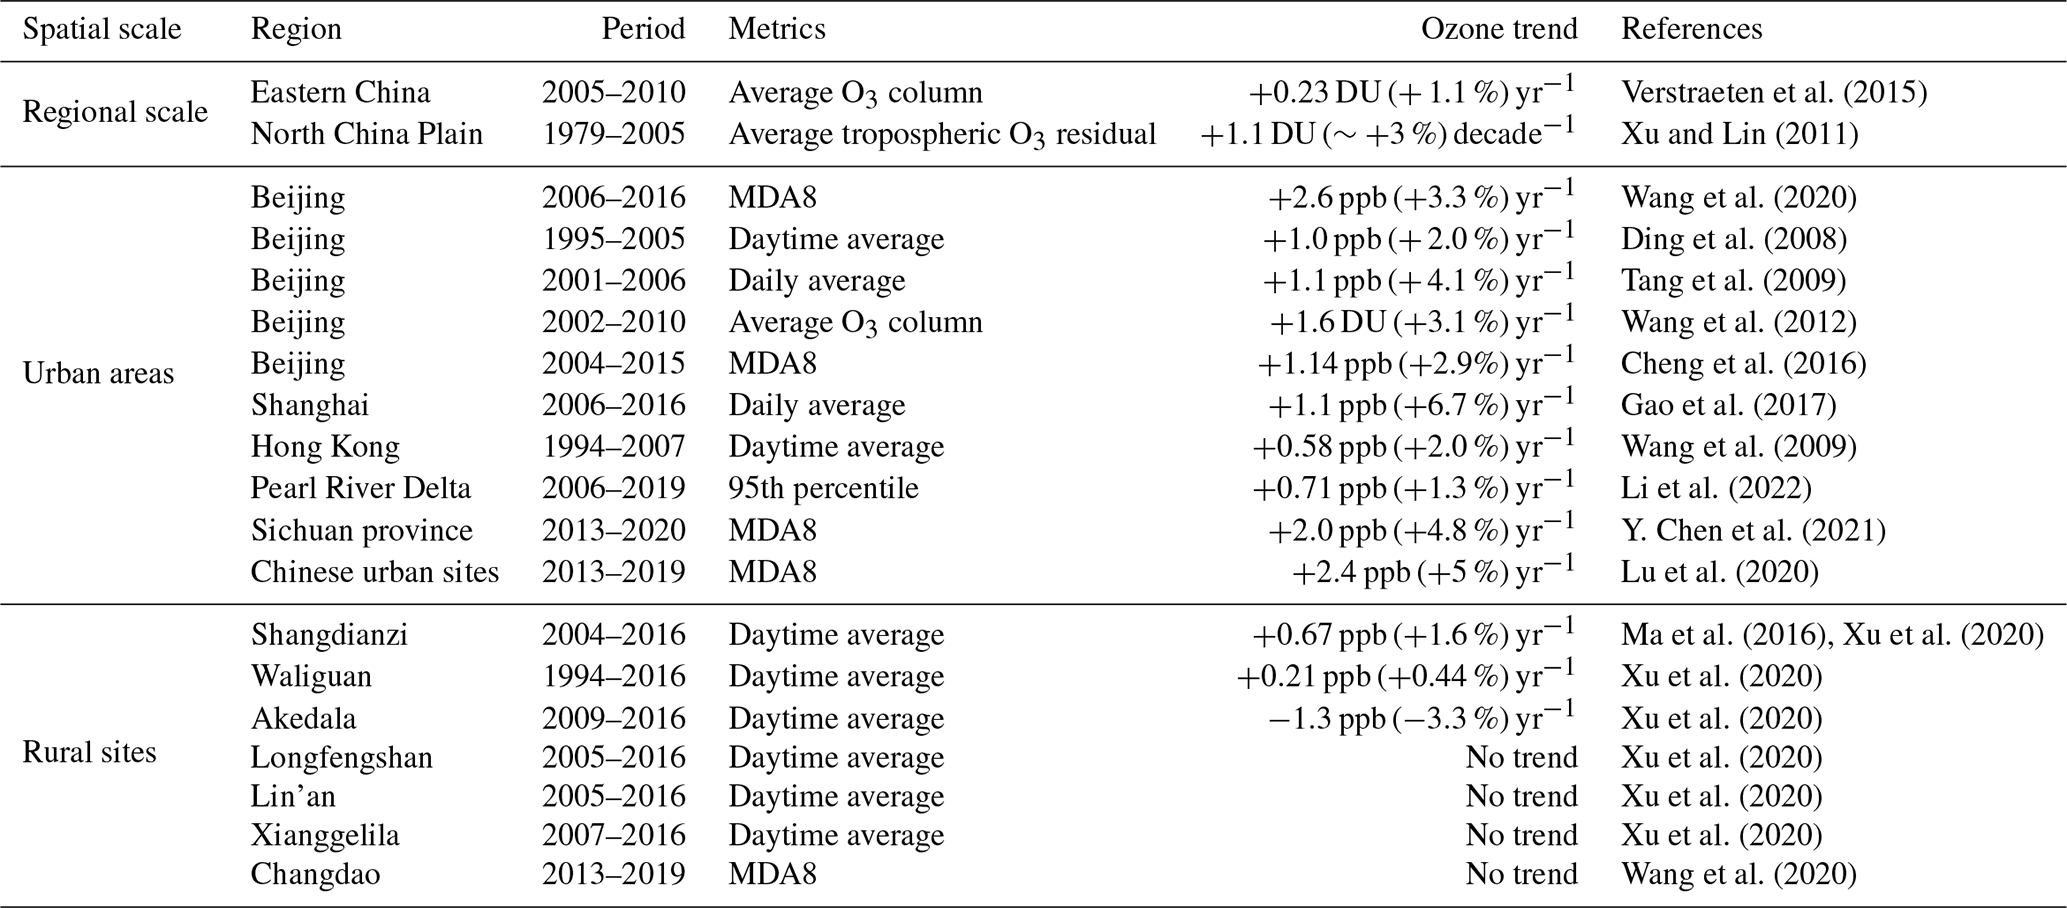
China has undergone rapid economic development, leading to a higher demand for energy and a greater usage of fossil fuels during the past several decades. As a result, high anthropogenic emissions to the atmosphere have produced severe O3 pollution in urban areas of China, where the daily maximum 8 h average (MDA8) O3 concentrations often exceed the standard of 80 ppb (Li et al., 2014; K. Li et al., 2019; Zhang et al., 2014; Lu et al., 2018). In contrast to the generally decreasing O3 levels in the United States and Europe, available surface O3 observations have widely shown significant upward trends in China since 1990 in rural areas (Wang et al., 2009; Ma et al., 2016; Sun et al., 2016; Xu et al., 2020), urban areas (K. Li et al., 2019; Wang et al., 2020; Zhang et al., 2014; Lu et al., 2018) and over regional scales (Verstraeten et al., 2015; Xu and Lin, 2011). Measured O3 trends in previous studies are summarised in Table 1. For a direct comparison of these results reported in different units, we have included estimated trends in units of % yr−1 for all studies. Xu and Lin (2011) and Verstraeten et al. (2015) have reported that tropospheric O3 concentrations increased in summer during 1979–2005 in the North China Plain (NCP) and during 2005–2010 in eastern China, at a rate of 1.1 % and 3.0 % yr−1, respectively, based on satellite measurements. Urban O3 concentrations increased significantly in Beijing, Shanghai, Hong Kong, Sichuan Basin and other cities during the past 1–2 decades, at rates of 2.0 % to 6.7 % yr−1 (Gao et al., 2017; Cheng et al., 2016; Wang et al., 2020; Y. Chen et al., 2021; Li et al., 2020; Lu et al., 2018). A significant increase in O3 (+1.6 % yr−1) was detected at Shangdianzi, a rural site in NCP (Ma et al., 2016). A moderate increase (+0.44 % yr−1) was detected at the global background site (Waliguan) in western China (Xu et al., 2018, 2020). No significant trend was detected at either the eastern coastal Changdao site (Wang et al., 2020) or the Longfengshan site on the northeastern edge of China (Xu et al., 2020). In general, these studies show that O3 concentrations in China have risen in the past 3–4 decades. As a result, China has become a global hotspot for ground-level O3 pollution. The present annual mortality rate attributed to long-term O3 exposure in China is estimated to be ∼ 50 000 to 316 000 deaths (Liu et al., 2018; Malley et al., 2017).
Table 1The reported trends of ozone (O3) concentration in China.
Global model simulations suggest that the average lifetime of O3 in the troposphere is about 22 d (Stevenson et al., 2006; Young et al., 2013). In the free troposphere at northern mid-latitudes, where prevailing westerly winds dominate, the net O3 lifetime is considerably longer, and is greater than the transport time around the Earth (Trickl et al., 2011). Consequently, the O3 increase in China not only influenced domestic public health, but also influenced downwind countries (Brown-Steiner and Hess, 2011; Lin et al., 2012), and thus increased global background O3 concentrations. Several studies indicate that rising Asian emissions influenced baseline O3 concentrations in America and Europe through the hemispheric transmission of O3 and its precursors (Cooper et al., 2010; Verstraeten et al., 2015). The baseline O3 concentrations at northern mid-latitudes increased at an average rate of ∼0.60 ppb yr−1 from 1980 to 2000 (Parrish et al., 2020). Such an increase in baseline O3 concentrations makes it more difficult to further reduce O3 in America and Europe. Gaudel et al. (2020) reported that tropospheric O3 has increased above 11 regions of the Northern Hemisphere since the mid-1990s. Therefore, a detailed characterisation of O3 pollution in China will aid understanding of the variation in baseline O3 and guide the reduction of O3 throughout northern mid-latitudes.
The Chinese government launched the Air Pollution Prevention and Control Action Plan in 2013–2017 and the Clean Air Action Plan in 2018–2020, to reduce anthropogenic emissions (Cheng et al., 2019). In this case, O3 precursors decreased a lot while O3 pollution remained severe (Shao et al., 2021). Therefore, it is necessary to clearly understand the response of O3 to precursors' changes. The response of O3 to precursors' changes is primarily determined by the O3 precursor sensitivity. Wang et al. (2021) have analysed the O3 precursor sensitivity using satellite observations of formaldehyde to NO2 ratio. There are more studies that analyse the O3 precursor sensitivity by using chemical transport models (X. Chen et al., 2021; Kang et al., 2021; K. Li et al., 2019). Comprehensive measurements of O3 precursors (VOCs and NOx) and meteorological factors (photolysis frequencies, temperature and humidity) help to better identify the O3 precursor sensitivity (Kleinman et al., 1997; Kleinman, 2005). In this study, with comprehensive measurement data constrained in the observation-based box model, the O3 sensitivity regimes can be better diagnosed (Wang et al., 2020) and become complementary to early studies. The goal of this study is to elucidate the spatial distribution, seasonal variation and temporal trends of O3 as well as the O3 precursor sensitivity in China by using comprehensive surface observations. Our study will provide a better understanding of the response of O3 to emission reductions, and inform the development of control measures to effectively mitigate O3 in the future.
2.1 Measurements
Hourly surface O3, nitrogen dioxide (NO2) and carbon monoxide (CO) concentrations during 2014–2020 were obtained from the public website of the China Ministry of Ecology and Environment (MEE) (https://quotsoft.net/air/, last access: 1 August 2021). The surface monitoring network covered 940 stations in the summer of 2014, and extended to 1669 stations by 2020 (∼330 cities). The O3 concentrations at 940 sites with continuous observations over these 7 years were analysed. These measurements document the air quality in Chinese cities and have been analysed in recent studies (K. Li et al., 2019; Lu et al., 2018). Total solar radiation data in 2013 were acquired from the meteorological data set of fundamental meteorological elements of the national weather station in China (v3.0), but data after 2013 are unavailable.
The Tropospheric Ozone Assessment Report (TOAR; Fleming et al., 2018) used the population density together with NOAA nighttime lights to classify the urban and non-urban sites. Given that it is not easy to acquire the nighttime light data in China, urban and non-urban sites are distinguished by population density in this study. Population density data were acquired from the Gridded Population of the World (GPW), v4; https://sedac.ciesin.columbia.edu/data/set/gpw-v4-population-density-rev11 (last access: 1 August 2021). This is a data set of the world's population gridded at ∼5 km resolution. According to the China Statistical Yearbook 2018 (China Statistics Press, 2018), China's urban population density was 2500 people per square kilometre. In the following analysis, urban sites correspond to a population density of ≥2500 people per square kilometre, and non-urban sites correspond to a population density of <2500 people per square kilometre.
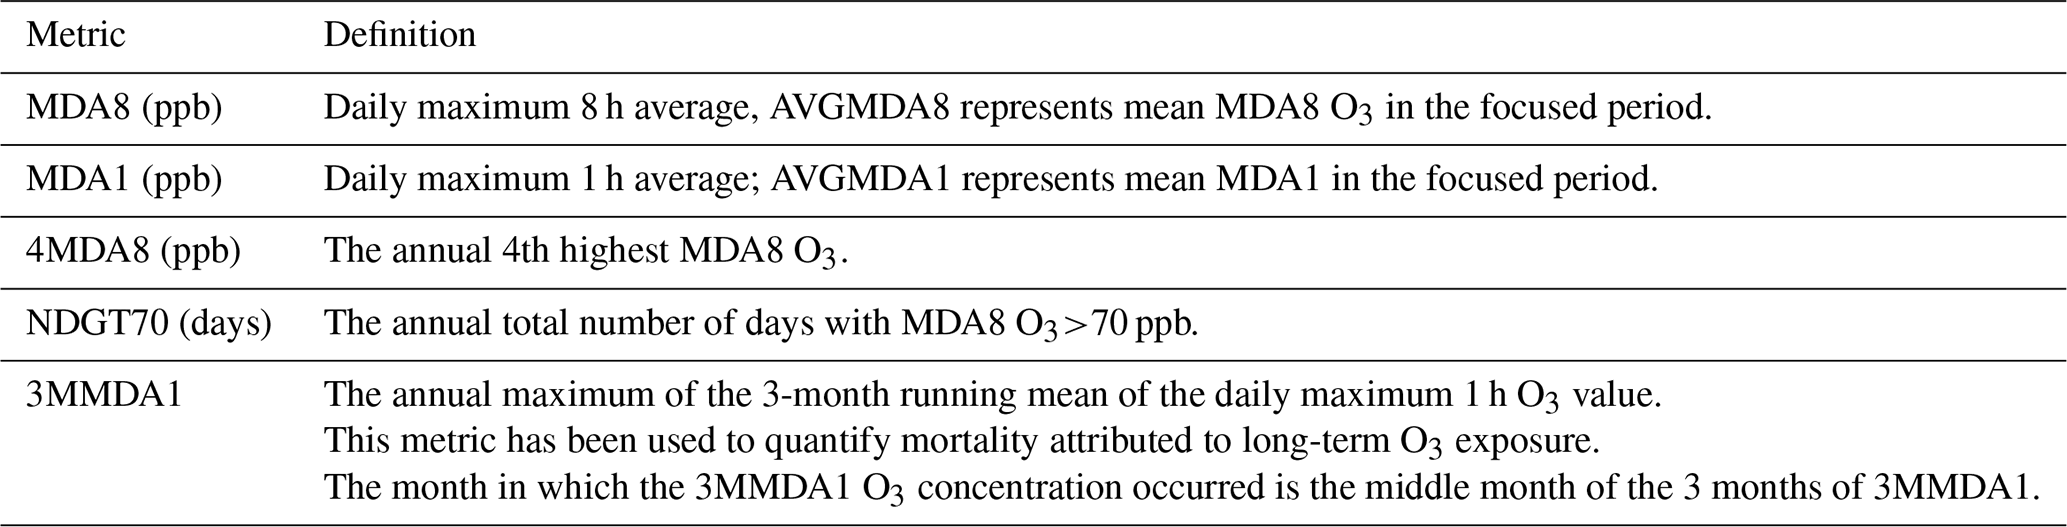
To reflect the breadth of different health-related indicators used globally, four metrics – AVGMDA8, 4MDA8, NDGT70, 3MMDA1 – are used here to characterise O3 pollution levels. The definitions of these metrics are given in Table 2. The AVGMDA8 represents the mean value of MDA8 O3 concentrations, and 4MDA8 represents the annual 4th highest MDA8 O3 concentrations. The 3MMDA1 represents the annual maximum of the 3-month running mean of the daily maximum 1 h (MDA1) O3 concentrations. Since these metrics are determined from different parts of the distribution of O3 concentrations, their spatial distribution and temporal variation may differ. We derived all metrics from the hourly measurements that were filtered by data quality-control procedures following the TOAR data completeness requirements and procedures (Schultz et al., 2017; Lefohn et al., 2018). The calculations of AVGMDA8, 4MDA8 and NDGT70 are based on MDA8 O3 concentrations. The MDA8 O3 concentration is the maximum value of 8 h running averages calculated from 00:00 to 23:00 local time, Beijing time (UT+8). Note that if the data availability at a certain site is less than 60 % (i.e. less than 5 h for 8 h averages or 15 h for 1 d), the MDA8 value was considered missing. For the calculation of these metrics (AVGMDA8, 4MDA8, NDGT70), if less than 60 % of MDA8 values are available (i.e. less than 220 MDA8 values for a year or 55 MDA8 values for a season), the annual or seasonal mean values of the metrics at a certain site were considered missing. The calculation of 3MMDA1 was based on the MDA1 O3 value. Similar to the MDA8 O3 value, if less than 60 % of data are available (i.e. less than 15 h for 1 d), the MDA1 value at a certain site was considered missing. For the calculation of 3MMDA1, if less than 60 % of MDA1 values are available (i.e. less than 55 MDA1 values for 3 months and 220 MDA1 values for a year), the 3MMDA1 value at a certain site was considered missing.
Beijing and Shanghai are the two largest cities in China and have undergone severe O3 pollution in the past decade (Wang et al., 2020; Xu et al., 2019). Measurement data in Beijing and Shanghai were analysed to show the variation characteristic of O3 sensitivity regimes. The data of O3, NO2 and CO were acquired from the public website of the China MEE (https://quotsoft.net/air/, last access: 1 August 2021. Meteorological factors (including temperature, relative humidity, photolysis frequencies and air pressure) and VOCs were measured during 2014–2020 at two representative urban sites in Beijing and Shanghai: Peking University and Shanghai Academy of Environmental Sciences. Temporal trends and composition of VOCs at the two sites were considered to be representative across Beijing and Shanghai (Wang et al., 2010; Xu et al., 2011; Zhang et al., 2012). The VOCs were measured using a commercial gas chromatography–mass spectrometer/flame ionisation detector (GC–MS/FID) system coupled with a cryogen-free preconcentration device (Wang et al., 2014). The system contains two-channel sampling and GC column separation, which is able to measure C2–C5 hydrocarbons with the FID in one channel and measure C5–C12 hydrocarbons using MS detection in the other channel. The time resolution was 1 h, and ambient air was sampled during the first 5 min of each hour for both channels. The uncertainties for VOC measurements by GC–MS/FID are estimated to be 15 %–20 % (Wang et al., 2014).
2.2 Zero-dimensional photochemical box model
A zero-dimensional photochemical box model was used to simulate the sensitivity of O3 production and loss to its precursor concentrations. Compared with regional 3-D models, the box model has the advantage that it can be constrained by comprehensive measurements to eliminate the uncertainty from emission inventories. The box model includes MCM v.3.3.1 as the chemical mechanism. Hourly averages of CO, NO2, NO, O3, SO2, VOCs (56 species), formaldehyde, acetaldehyde, photolysis frequencies, temperature, air pressure and relative humidity were used as model constraints. Since HONO was not measured, it was calculated according to the concentration of NO2 and the observed ratio of HONO to NO2 in Beijing (Hendrick et al., 2014). The model simulations were performed in a time-dependent mode with a spin-up of 2 d. For physical removal processes, a 24 h lifetime was assumed for all simulated species, which approximately simulates the effects of dilution and surface deposition. This modelling approach has been used previously (Wang et al., 2019, 2020, 2021a).
The RO2, HO2 and OH radicals were simulated by the box model to calculate the net ozone production rate [P(O3)] and ozone loss rate [L(O3)] as shown in Eqs. (1) and (2) as derived by Mihelcic et al. (2003).
where θ is the fraction of O1D from O3 photolysis that reacts with water vapour, and i and j represent the number of species of RO2 and alkenes, respectively.
3.1 The spatial distribution and seasonal variation of ozone (O3) pollution
Figure 1 presents the spatial distributions of the mean values of four O3 metrics (AVGMDA8, 4MDA8, NDGT70 and 3MMDA1) at non-urban and urban sites in China during 2014–2020. The spatial distribution was similar between urban and non-urban sites for all four metrics; for example, warm-season AVGMDA8 O3 concentrations at 74 % of urban sites and 67 % of non-urban sites exceed the air quality standard Grade I limit of 50 ppb. Hotspots of O3 pollution mainly occurred in the more economically developed areas of northern, eastern and central China. At both urban and non-urban sites, the highest regional average O3 concentrations occur in NCP with the average warm-season AVGMDA8 O3 concentration of 66 ppb, significantly higher than the corresponding national average value of 54 ppb. Although the solar radiation in NCP is not the strongest across China (Jiang et al., 2019), NCP has a large density of urban and industrial activities. Previous studies denote that NCP has the highest NOx and VOC emissions over China (Liu et al., 2016; M. Li et al., 2019). This clearly indicates that O3 pollution is closely related to anthropogenic activities. In addition, the high O3 concentration over NCP is also related to the high temperature extremes (Wang et al., 2022).
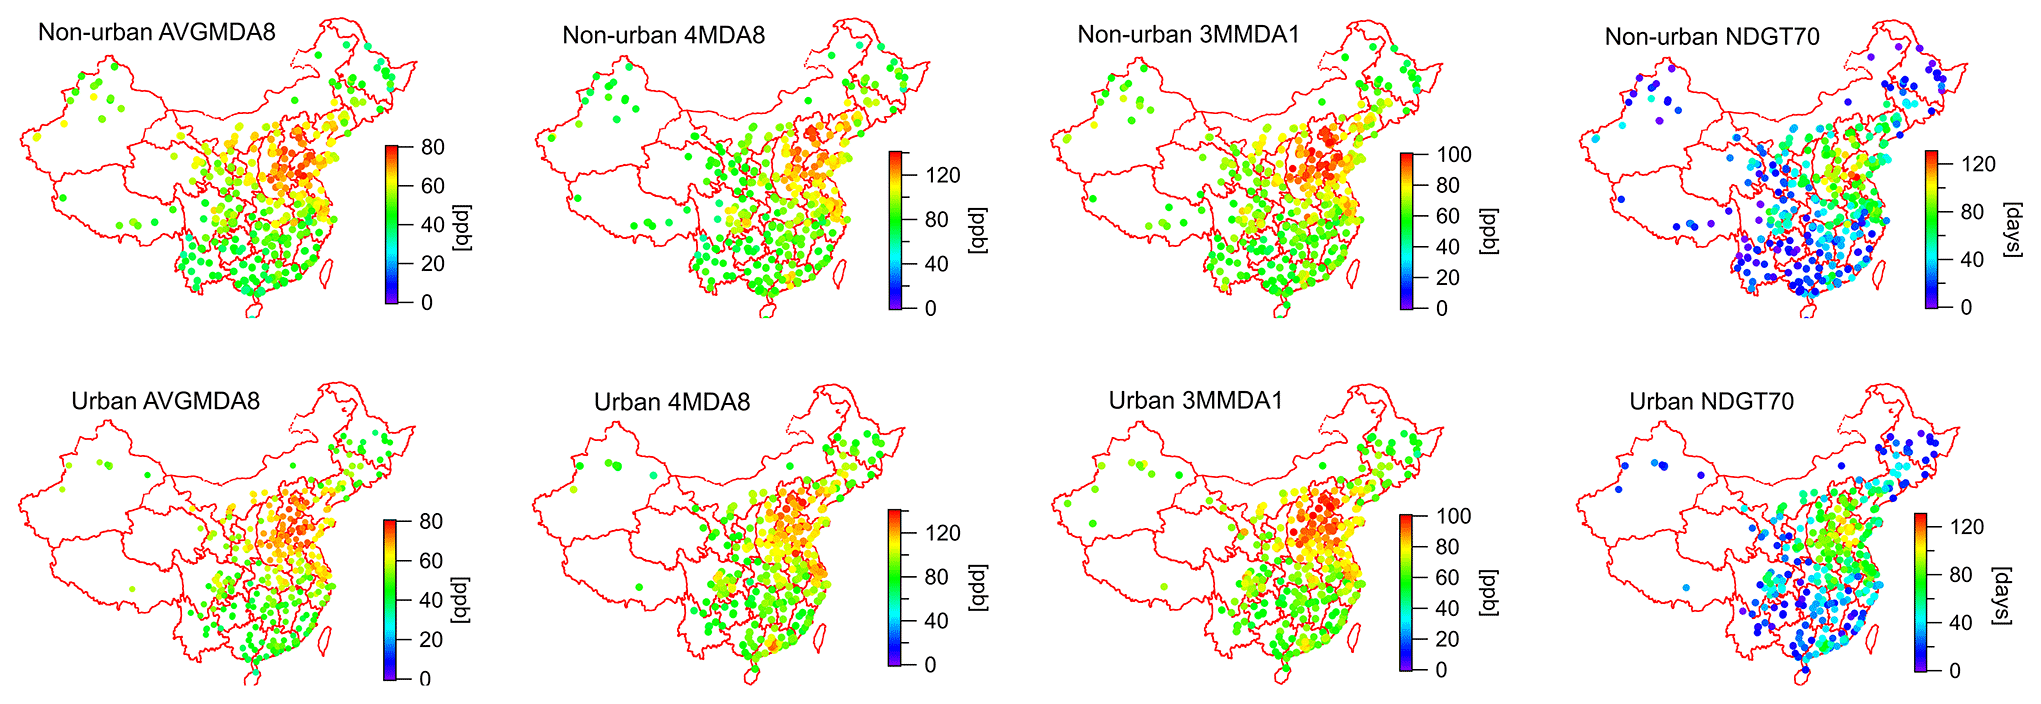
Figure 1Spatial distribution of four ozone (O3) metrics (AVGMDA8, 4MDA8, 3MMDA1, NDGT70) at urban and non-urban sites averaged over 2014–2020. The AVGMDA8 is the mean MDA8 O3 in the warm season (April–September); other metrics are annual values.
The month in which the 3MMDA1 O3 concentration occurred is defined as the middle month in the 3 months of 3MMDA1, which can indicate the season when maximum O3 pollution occurred. As shown in Fig. 2, the month in which the 3MMDA1 O3 concentration occurred shows a significant spatial variation. In most years, the 3MMDA1 O3 concentration in northern China (north of the Yangtze River) occurred mainly during summer (June, July and August), whereas in southern China (south of the Yangtze River), it occurred during autumn (September, October and November) or spring (March, April and May). In northern China, sunlight intensity is highest during summer and photochemical production from anthropogenic and biogenic precursors maximises. In southern China, the southwest monsoon prevails during summer, leading to an inflow of marine air with low O3 concentrations and reduced photochemical O3 production due to more cloudy and rainy weather (Yin et al., 2019); thus in this region, the highest O3 usually appears during autumn when sunlight intensity maximises.

Figure 2Spatial distribution of the month in which 3MMDA1 ozone (O3) concentration occurred during 2014–2020. Rectangles included on the 2018 map in northeast and southwest China represent the Heilongjiang and Yunnan provinces, respectively.
It is notable that the 3MMDA1 O3 concentration mainly occurred during spring in both the Heilongjiang and Yunnan provinces, which are located in northeast and southwest China, respectively. This is consistent with a previous study reporting that the Yunnan province and northeast China had peak O3 in spring 2014–2017 (Yin et al., 2019). A springtime maximum was also found for the column O3 in Yunnan, retrieved from satellite data (Xiao and Jiang, 2013). The occurrence of maximum O3 concentrations in spring has been attributed to several factors, including (1) the peak occurrence of stratospheric intrusions, (2) photochemistry of precursors built up during winter, and (3) biomass-burning either as forest fires or for land clearance (Monks et al., 2015). The Heilongjiang province is located in the northernmost part of China (43∘26′–53∘33′ N) with relatively low temperature and light intensity, and thus its photochemical production of O3 is weak all year round. We surmise that the springtime maxima of O3 in this province is due to the first two causes: the stratospheric intrusion of O3 in spring (Stohl et al., 2003) and O3 production in spring from accumulated precursors that were emitted from coal burning for heating during the wintertime. The Yunnan province is located in a plateau area with an average altitude of 2000 m; the elevated terrain of this province is more likely to be influenced by the descending free tropospheric air masses with high O3 concentrations from the stratospheric origin (Stohl et al., 2003; Cooper et al., 2012). Additionally, higher sunlight intensity during spring in this lower-latitude province is also conducive to the photochemical production of O3.
We also compared the seasonal variations of MDA1 O3 concentrations in three typical Chinese city clusters, i.e. Beijing–Tianjin–Hebei (BTH), Yangtze River Delta (YRD) and Pearl River Delta (PRD) (Fig. 3). In each city cluster there is a distinct seasonal O3 pattern: a sharp unimodal distribution with a summer maximum in BTH, a broad distribution with a spring maximum in YRD, and a less distinct, unimodal distribution with an autumn maximum in PRD. Meteorological factors determine the different O3 distribution patterns; most importantly, PRD and YRD received more precipitation in summer than BTH, and PRD was especially affected by the inflow of marine air during the southwest monsoon. Furthermore, in PRD, typhoons led to less cloud cover, and thus more solar radiation in autumn, which accelerated O3 production (Qu et al., 2021). As shown in Fig. 3, the O3 seasonal variations in the three city clusters are overall consistent with those of solar radiation in representative cities of the three city clusters (Beijing in BTH, Shanghai in YRD and Guangzhou in PRD). This result indicates that the local photochemistry driven by solar radiation plays a crucial role in O3 seasonal variations.
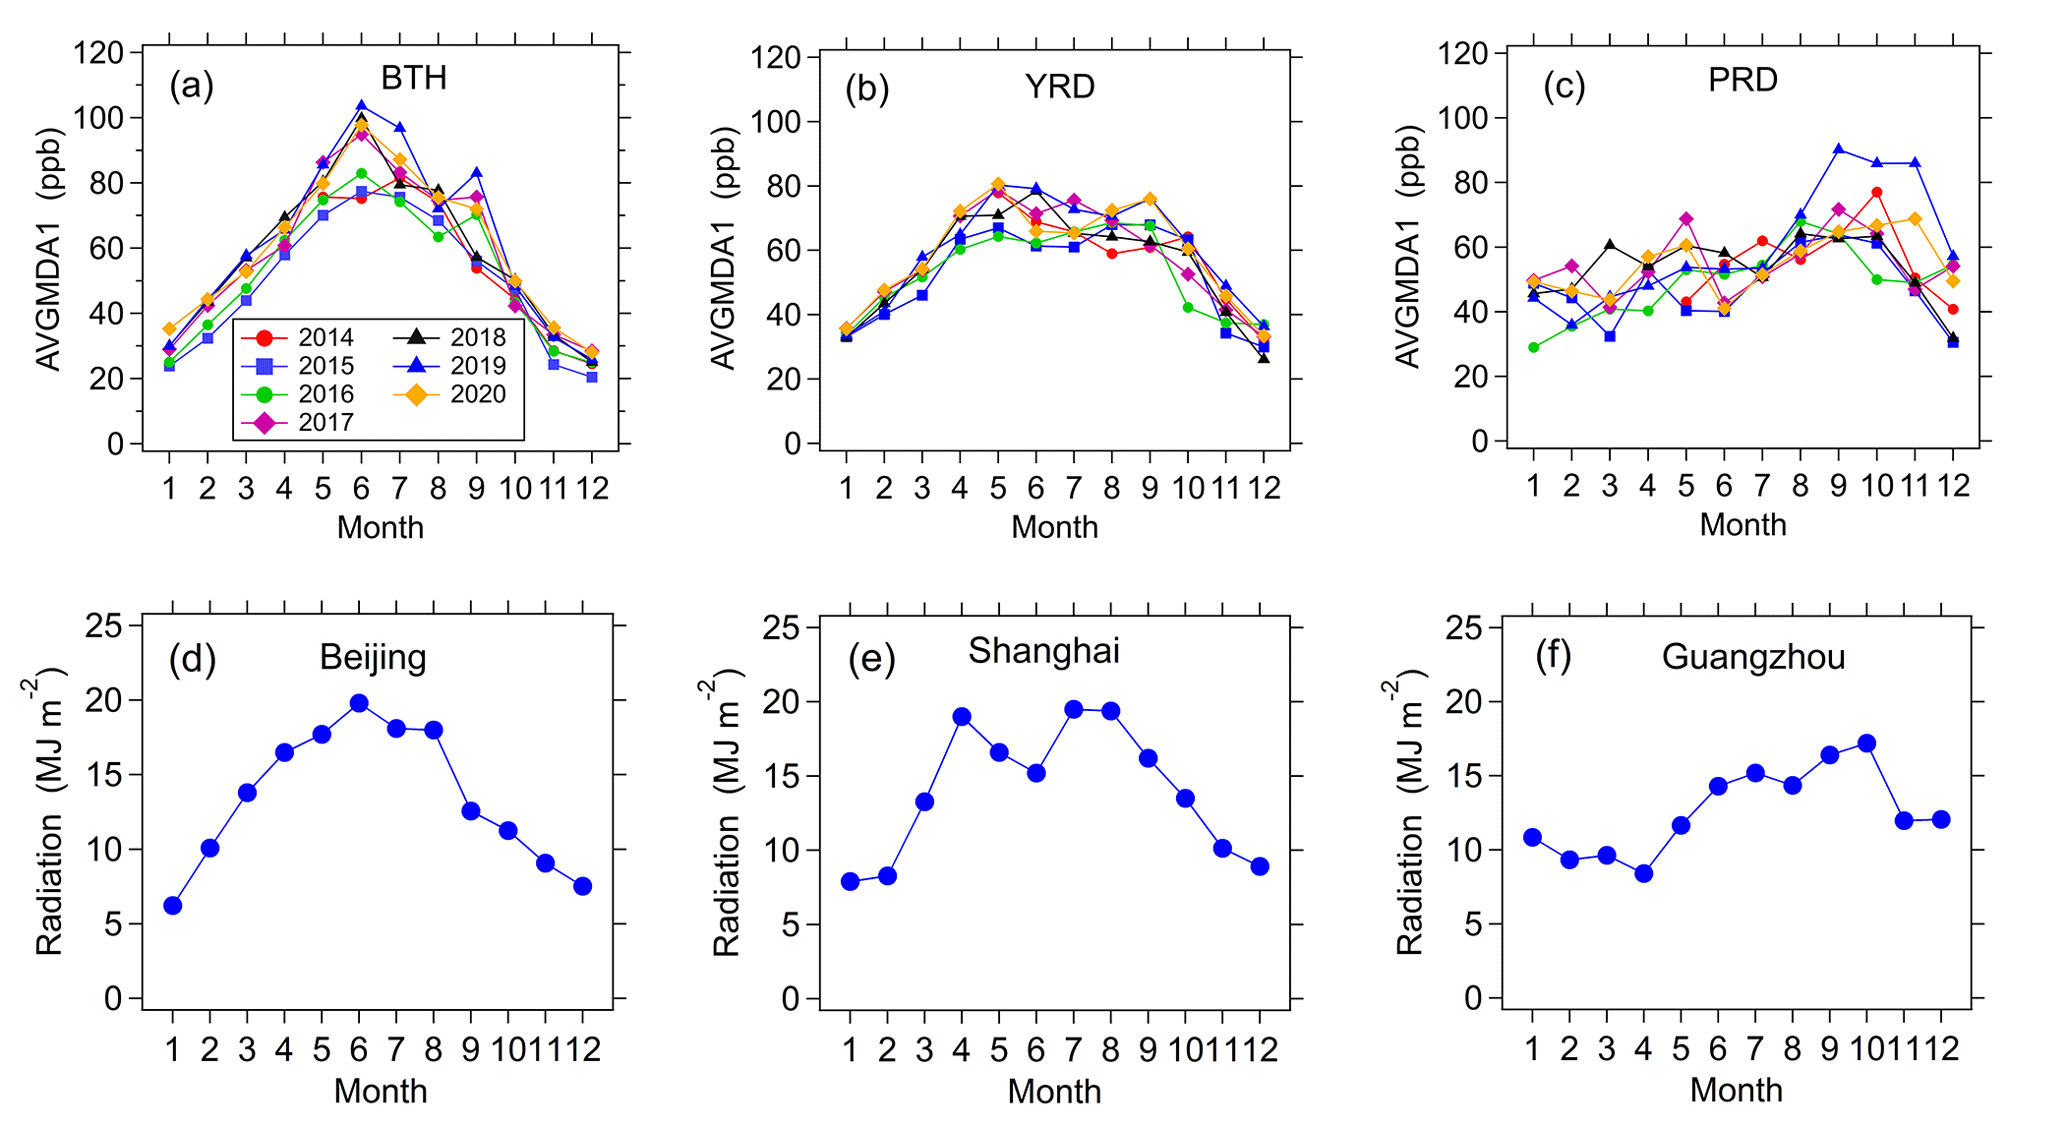
Figure 3Seasonal variations in monthly mean MDA1 O3 concentrations over all sites in BTH (a), YRD (b) and PRD (c) during 2014–2020. Seasonal variations in monthly mean solar radiation in representative cities of the three city clusters: Beijing in BTH (d), Shanghai in YRD (e) and Guangzhou in PRD (f) in 2013.
3.2 Temporal trend of O3 pollution
Figure 4 summarises variations of four O3 metrics (warm-season AVGMDA8, 4MDA8, 3MMDA1 and NDGT70) during 2014–2020 for Chinese urban and non-urban sites. Figure S1 in the Supplement presents the spatial distribution of warm- season AVGMDA8 O3 concentrations at urban and non-urban sites for each year during 2014–2020. The levels of these four metrics at urban sites were slightly higher than at non-urban sites with the difference less than 8 % (Fig. 4). These results in China differ from those in Europe and North America, where the mean levels of these metrics at urban sites were slightly lower than those at non-urban sites (Fleming et al., 2018). From 2014 to 2020, the trends of O3 were generally similar between urban and non-urban sites. The four metrics all generally increased from 2014 to 2020 with the increasing rate getting slower after 2017. Overall, the rapid increase of O3 concentrations in China has either slowed or ended (depending upon metric) after 2017. During 2014–2017, AVGMDA8 and NDGT70 increased at rates of 7.4 % and 20 % yr−1, respectively. The 4MDA8 and 3MMDA1, which characterise extremely high O3 levels, increased at rates of 3.7 % and 3.5 % yr−1, respectively. Obviously, the increasing rates of 4MDA8 and 3MMDA1 were significantly slower than those of AVGMDA8 and NDGT70. In Fig. 4, the variations in the four metrics are fitted by quadratic functions. The quadratic polynomial coefficients are all negative and statistically significant for the four metrics, which is strong evidence that the increasing trend has slowed.
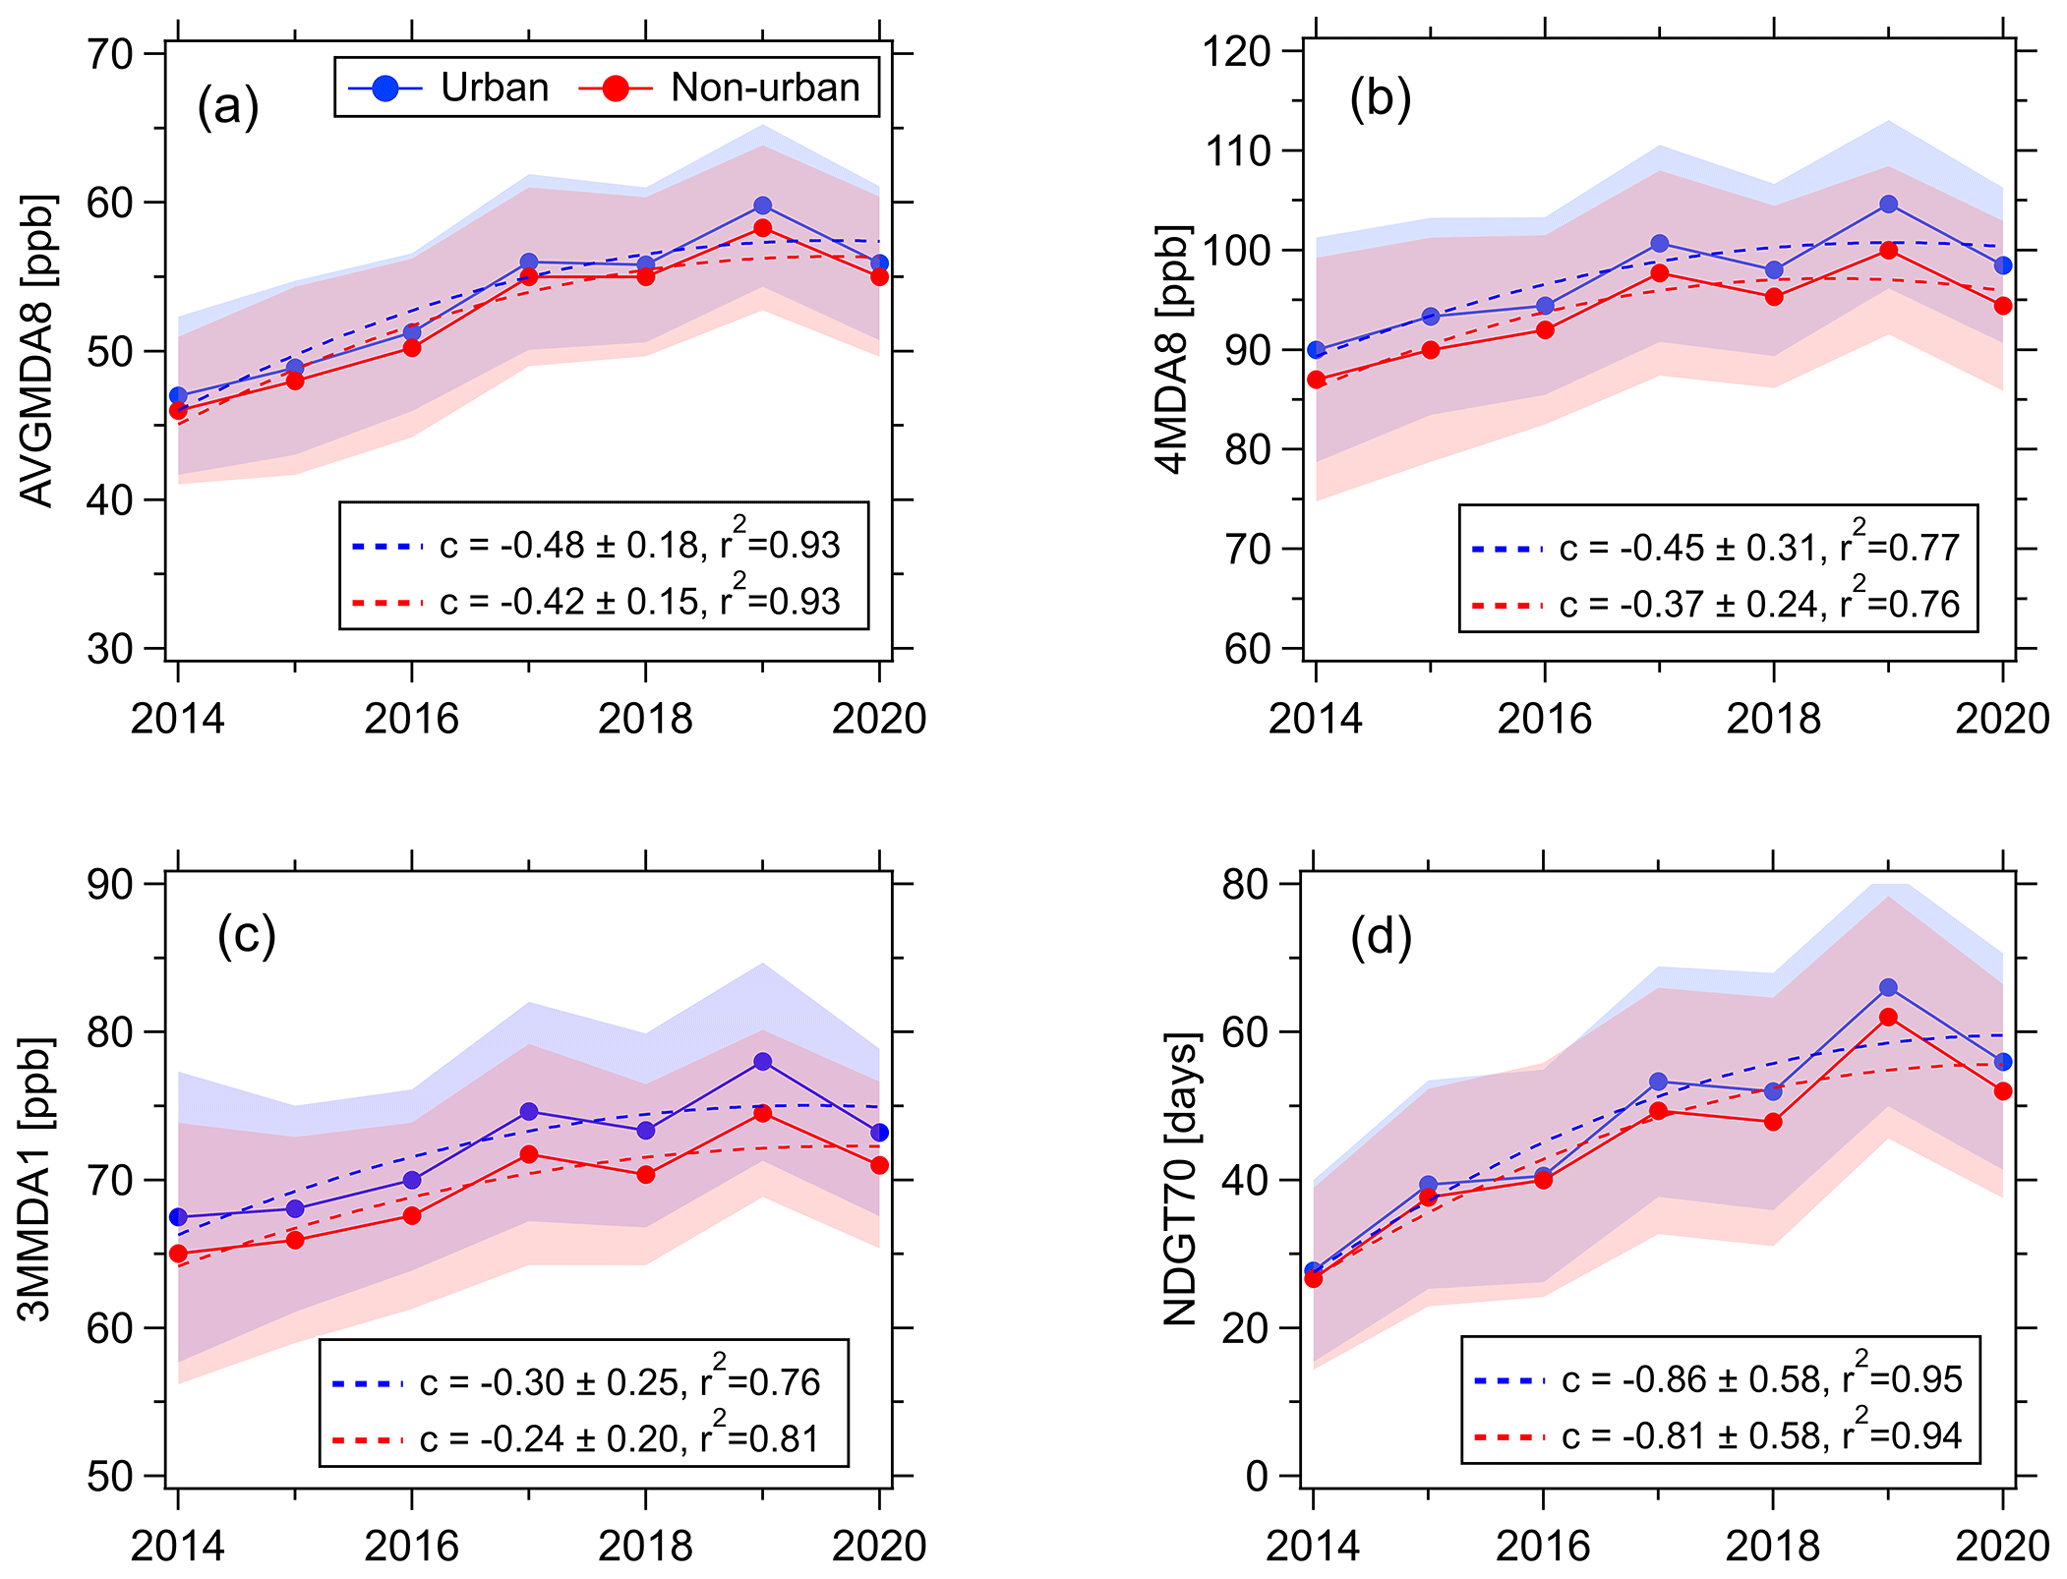
Figure 4Variations in four O3 metrics: AVGMDA8 (a), 4MDA8 (b), 3MMDA1 (c) and NDGT70 (d) at urban and non-urban sites during 2014–2020. The AVGMDA8 is the mean MDA8 O3 in the warm season (April–September), and the other metrics are annual values. Shaded areas represent the range of mean values ± the 50 % standard deviation (SD) for each metric. The dashed lines are fitted by the polynomial function ( bx + cx2). The quadratic polynomial coefficient c (± 1 SD) and the determination coefficient r2 are given.
Because the trends of O3 are generally similar between urban and non-urban sites (Fig. 4), the nationwide (including both urban and non-urban) AVGMDA8 was used to analyse O3 trends for different seasons. Figure 5 shows variations in seasonal and annual AVGMDA8 during 2014–2020. For the national average, AVGMDA8 was highest in summer, followed by spring, autumn and winter. This metric increased in all four seasons from 2014 to 2017, with the fastest increase in spring (3.1 ppb yr−1, r2=0.94), followed by winter (2.9 ppb yr−1, r2=0.91), summer (2.0 ppb yr−1, r2=0.90) and autumn (1.2 ppb yr−1, r2=0.81). The annual average increased at a rate of 2.0 ppb yr−1 (r2=0.95) from 2014 to 2017. The more rapid increase of O3 concentration in spring than in summer resulted in a decrease in the gap between the two seasons. This is consistent with a recent study reporting that O3 pollution in NCP extended to the spring season (Li et al., 2021). After 2017, AVGMDA8 remained relatively stable in summer and spring, but still increased significantly in autumn and winter. Compared to 2019, the seasonal average MDA8 O3 concentration decreased by 5.5 ppb in the summer of 2020, but increased by 5.1 ppb in the winter of 2020. Figure 6 illustrates the spatial patterns of the summer and winter changes in seasonal average MDA8 O3 from 2019 to 2020. During summer, O3 decreased significantly in most regions of China, with greater decreases in central China and NCP. During winter, O3 increased significantly throughout China. The cause of these changes will be discussed in Sect. 3.3.
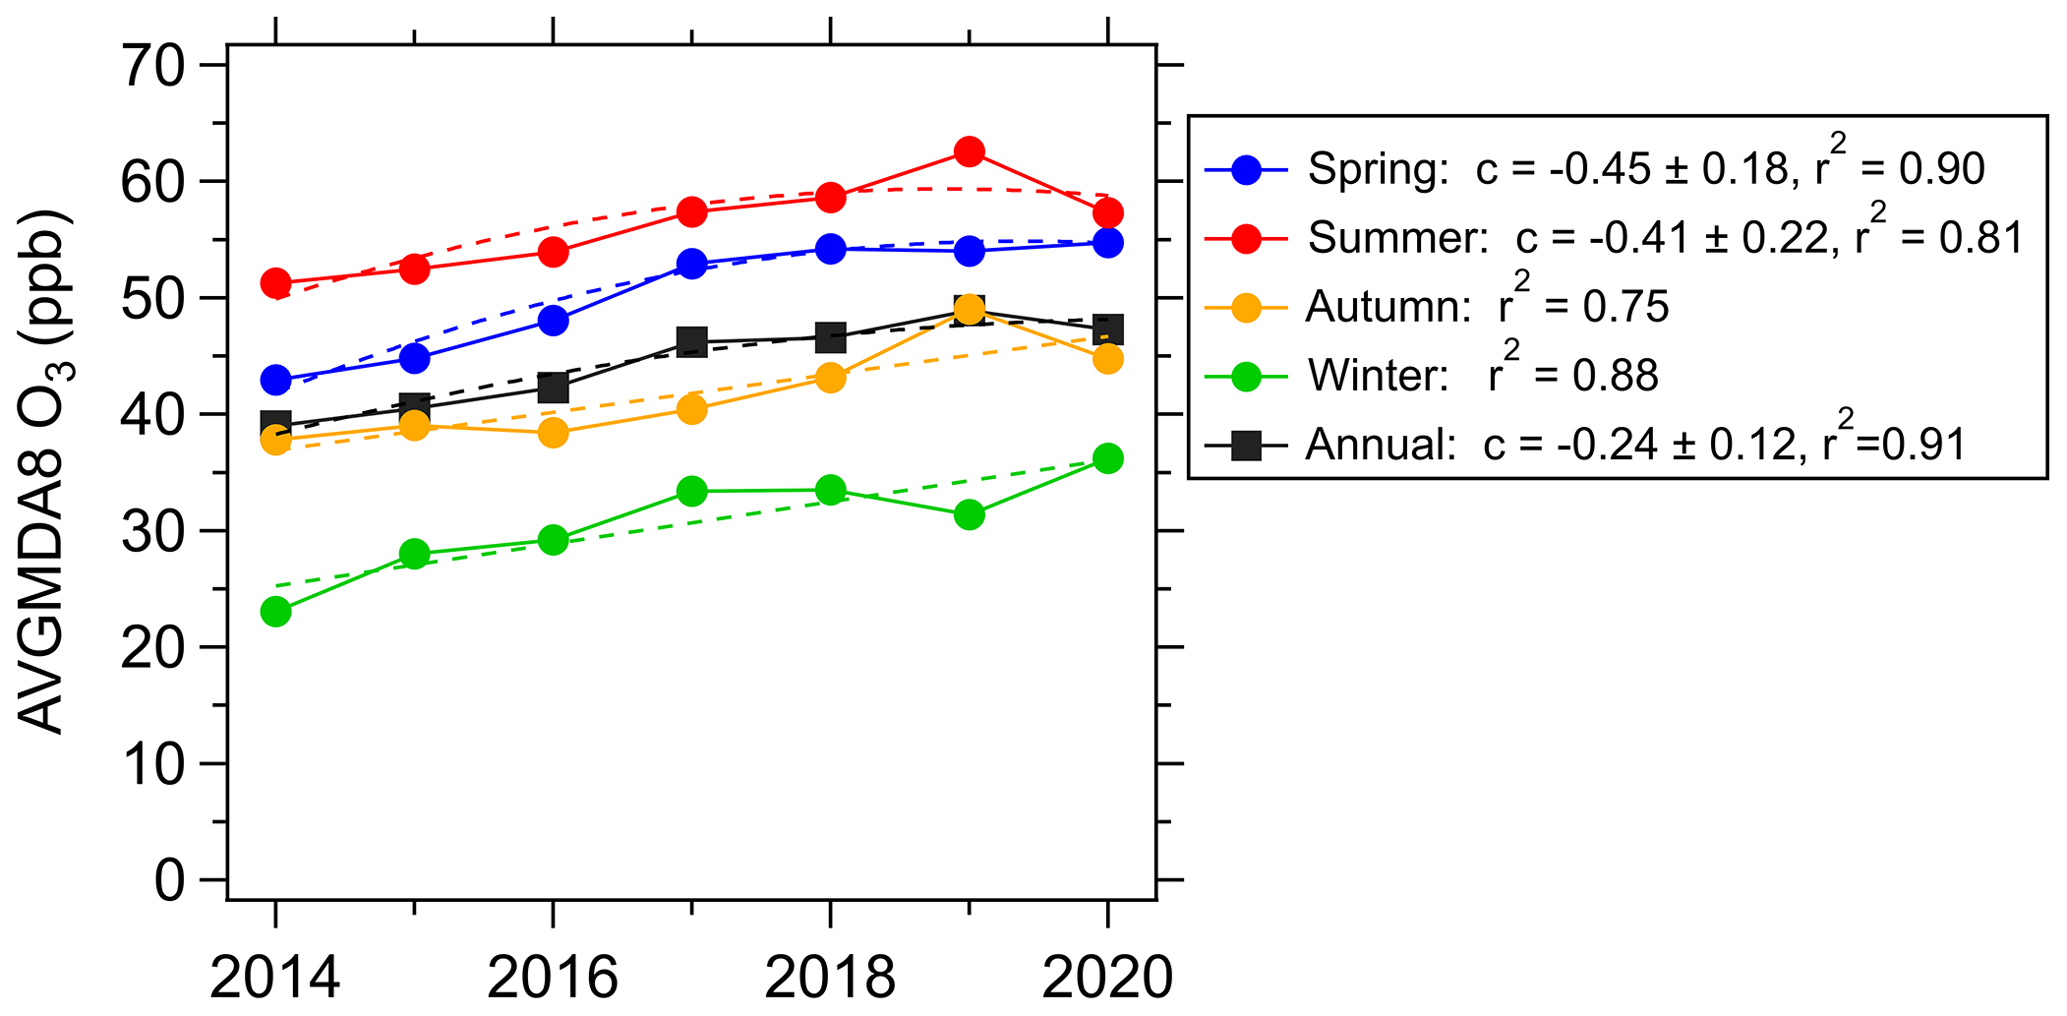
Figure 5Variations in seasonal and annual AVGMDA8 O3 levels during 2014–2020. The trends for spring, summer and annual averages are fitted by the polynomial function ( bx + cx2) and the trends for autumn and winter are fitted by the linear function ( bx). The quadratic polynomial coefficient c (± 1 SD) and the determination coefficient r2 are given.
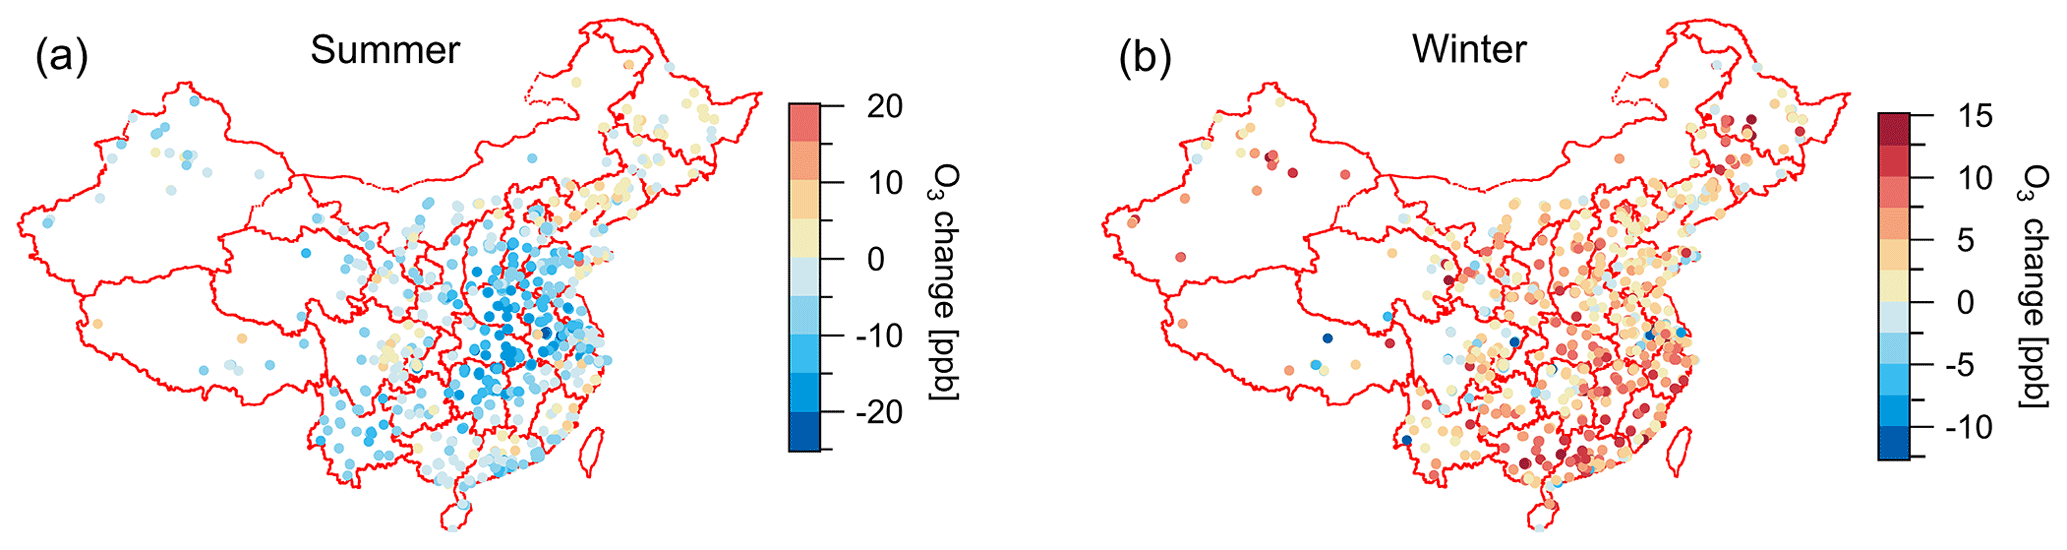
Figure 6The change in seasonal averages of MDA8 O3 from 2019 to 2020 in China during summer (a) and winter (b).
The trends of the O3 precursors, NO2 and CO, were investigated based on the observational data. As shown in Fig. 7, both NO2 and CO decreased significantly from 2014 to 2020 for both annual and seasonal averages. Notably, NO2 decreased faster after 2017 than before 2017. Both the Multi-resolution Emission Inventory for China (MEIC) and ozone monitoring instrument (OMI NO2) data show a decrease during 2013–2019 (Shah et al., 2020), which is consistent with our result. The emission inventory suggests that VOCs emissions were stable during 2013–2019 in China (M. Li et al., 2019; Zheng et al., 2021). During 2020 emissions of VOCs, CO and NOx decreased significantly in winter but only slightly in summer, compared to 2019 (Zheng et al., 2021), which is consistent with the changes of measured NO2 and CO (Fig. 7).
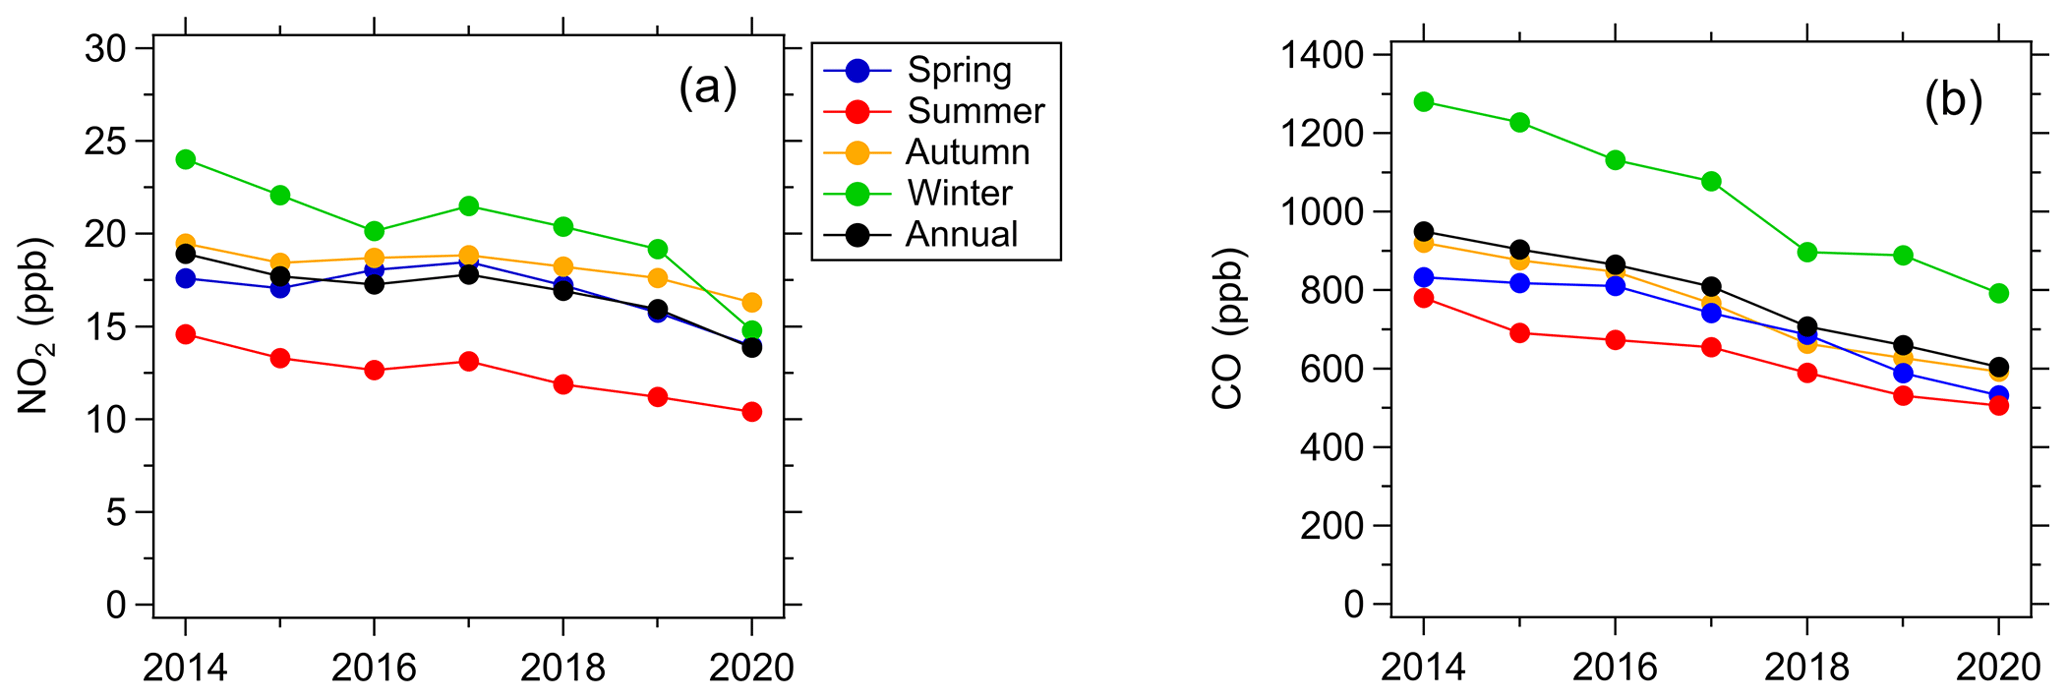
Figure 7Variations in seasonal and annual average concentrations of NO2 and CO measured during 2014–2020 in China.
Figure 8 shows the trend of measured VOC reactivity in Beijing and Shanghai in summertime during 2014–2020. The VOC reactivity is defined as the sum of all VOC concentrations multiplied by their respective reaction rate coefficients with OH, as shown in Eq. (3). The VOC reactivity is more related to P(O3) than VOC concentrations (Zhang et al., 2014; Wang et al., 2020, 2021b). The summertime reactivity of VOCs decreased at a rate of −0.39 s−1 (−7.5 %) yr−1 (r2=0.56) in Beijing and −0.46 s−1 (−8.4 %) yr−1 (r2=0.59) in Shanghai. It is notable that the trends of VOC reactivity in Beijing and Shanghai are different from that of VOC emissions across China.
where represents the reaction rate coefficients between OH radicals and VOC species i. The [VOCi] is the concentration of VOC species i and n is the number of VOC species.
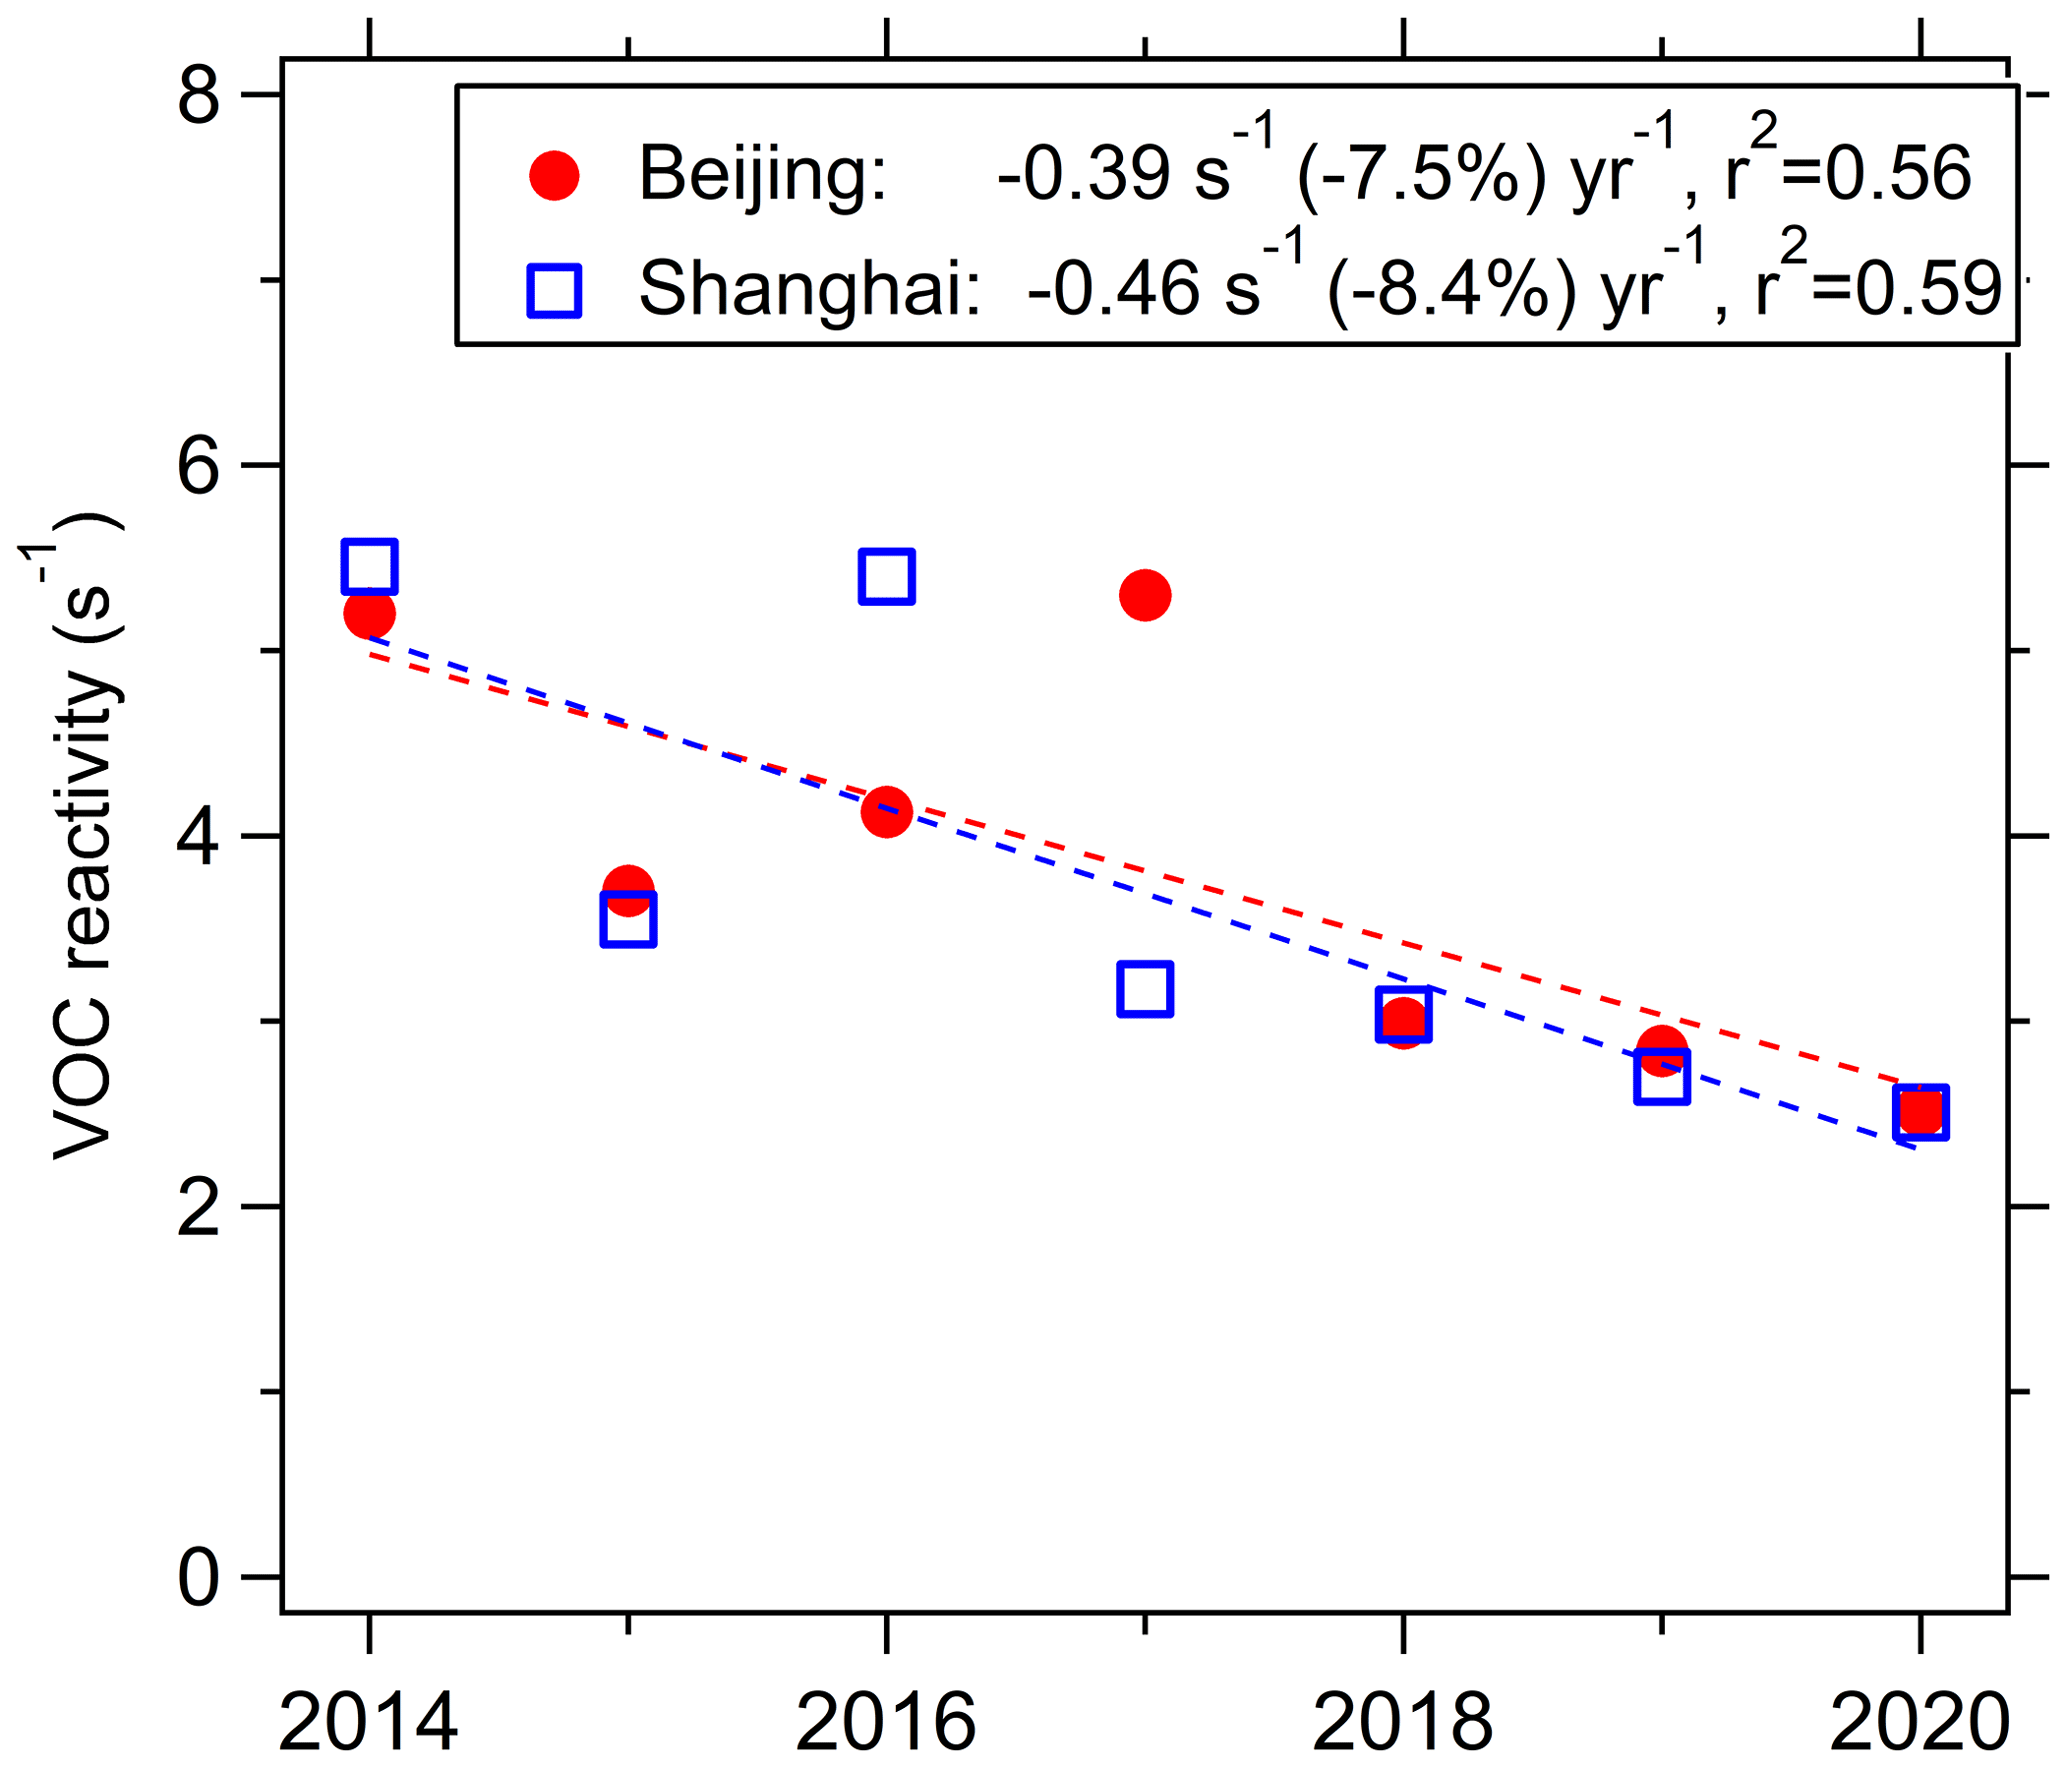
Figure 8Variations in averages of daytime VOC reactivity in Beijing and Shanghai, during summertime of 2014–2020.
3.3 The impact of photochemistry on O3 temporal trend
The O3 concentrations are influenced by photochemical processes that depend on precursor concentrations and meteorological conditions. Changes in O3 precursor emissions, particularly VOC and NOx, are the primary factors driving O3 trends in China. The relationship between O3 and its precursor concentrations is generally nonlinear – a decrease in precursor concentrations does not necessarily result in a corresponding decrease in O3 concentration. Differing responses of O3 production to VOC and NOx emission changes allow three O3 sensitivity regimes to be distinguished: VOC-limited, NOx-limited and transition regimes (Kleinman, 1994; Kleinman et al., 1997). In this section, based on comprehensive measurements in Beijing, the impact of photochemical regimes on the temporal trend of O3 in urban areas of China was discussed.
As discussed in Sect. 3.2, during summer when O3 pollution is most severe, O3 increased from 2014 to 2017, but remained relatively stable after 2017 (Fig. 5). To explore the impact of photochemical regimes on the temporal trend of O3 in summer, the zero-dimensional photochemical box model, constrained by long-term measurements in Beijing and Shanghai, was used to examine the variation in the sensitivity of O3 to precursor emissions. The O3 sensitivity regime was diagnosed by testing the response of P(O3) as calculated from Eq. (1) to the changes of VOC and NOx concentrations (Fig. 9). The box model simulations suggest that in Beijing, VOC reduction would significantly decrease O3 during all 7 years, while NOx reduction would significantly increase O3 during 2014–2017, but only slightly increase O3 in 2018 and slightly decrease O3 during 2019–2020. The 2014–2018 results are consistent with the VOC-limited regime in which a reduction in VOCs is effective in mitigating O3 production, while a reduction in NOx increases O3 production. The 2019–2020 results are consistent with the transition regime in which reductions of either VOCs or NOx can decrease O3 production. These results indicated that the summertime photochemical environment in Beijing shifted from a VOC-limited regime to a transition regime. The Shanghai simulations show similar behaviour in terms of the shift in the photochemical regime.
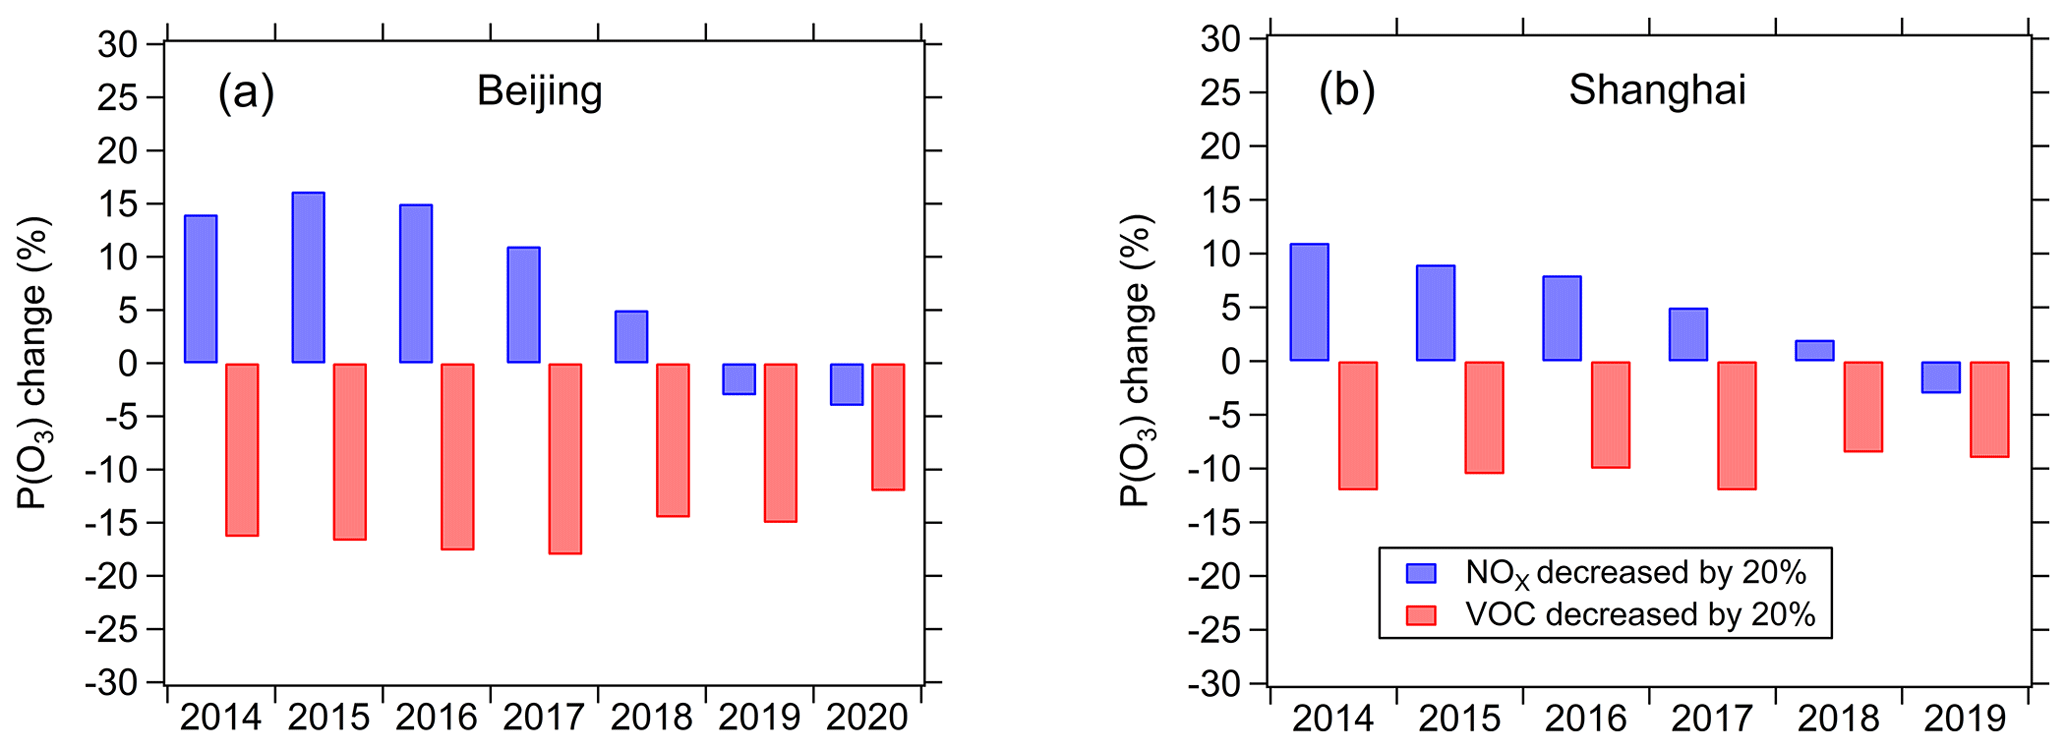
Figure 9Sensitivity of summertime mean daytime net ozone production rate [P(O3)] to VOCs and NOx simulated by the photochemical box model during 2014–2020 in Beijing (a) and Shanghai (b). The VOCs and NOx are decreased by 20 % to test the fractional change of P(O3).
Previous 3-D model studies have reported results similar to our box model simulation; urban areas in China were in the VOC-limited regime during the summer of 2013–2017, but in the transition regime after 2017 (Shao et al., 2021; Kang et al., 2021; K. Li et al., 2019). Tang et al. (2021) showed that O3 production in Beijing was transitioning from VOC-sensitive to NOx-sensitive over the 2013–2018 period. The sharp decrease in NOx combined with a smaller change in VOCs in Shanghai has led to a shift in the O3 production from a VOC-limited regime to a NOx-limited regime over the past decade (Xu et al., 2019). In addition to model studies, satellite-observed formaldehyde NO2 ratios also indicate that there is a shift from the VOC-limited regime to the transitional regime in NCP, YRD and PRD, which is associated with a rapid drop in anthropogenic NOx emissions from 2016 to 2019 (Wang et al., 2021). These studies agree that O3 sensitivity during summer in urban areas of China has gradually changed from a VOC-limited regime to a transition or NOx-limited regime due to faster decreases in NOx emissions than in VOC emissions over the past decade. Therefore, we surmise that the rapid increase of summertime O3 during 2013–2017 is due to the decrease in NOx under VOC-limited conditions, and that the slowing of the summertime O3 increase after 2017 is due to decreased NOx emissions and relatively stable VOC emissions under the conditions of the transition regime. This finding lends more confidence to the effective reduction in summertime O3 through continued reductions in the emissions of VOC and NOx.
Another issue is that compared to 2019, MDA8 O3 concentrations decreased in summer but increased in winter during 2020 (Figs. 5 and 6) despite the decrease of NOx, CO and VOCs (Fig. 7). Based on measurements in Beijing and Shanghai in 2019, the observation-based box model was used to examine the sensitivity of O3 to precursors in summer and winter. As shown in Fig. 10, during the summer of 2019, Beijing and Shanghai were in the transition regime, when reductions in VOCs and NOx both decreased the integrated P(O3). During winter, in the VOC-limited regime, the P(O3) decreased with the reduction in VOCs, but increased with the reduction in NOx. This result demonstrates that summer and winter had different O3 sensitivity characteristics in 2019. Based on WRF-Chem model simulations, Kang et al. (2021) also reported that O3 sensitivity entered the transition or NOx-limited regime during summer 2020, but was still in the VOC-limited regime during winter 2020. In addition, the WRF-Chem model results by Le et al. (2020) indicate that the chemical regime was VOC-limited during the COVID-19 pandemic lockdown period during the winter 2020 in China, and the decrease in NOx led to significant O3 increases. These studies are consistent with our simulation results in Beijing. The difference in O3 sensitivity regimes between winter and summer is likely to be a crucial cause of opposite O3 changes between winter and summer in 2020. Although P(O3) and concentrations are much smaller in winter, O3 can influence particulate matter (PM) formation through increasing the atmospheric oxidising capacity (AOC) in this season (Le et al., 2020). Therefore, different O3 sensitivity regimes between winter and summer should be fully considered to effectively mitigate both O3 and PM in the two seasons.
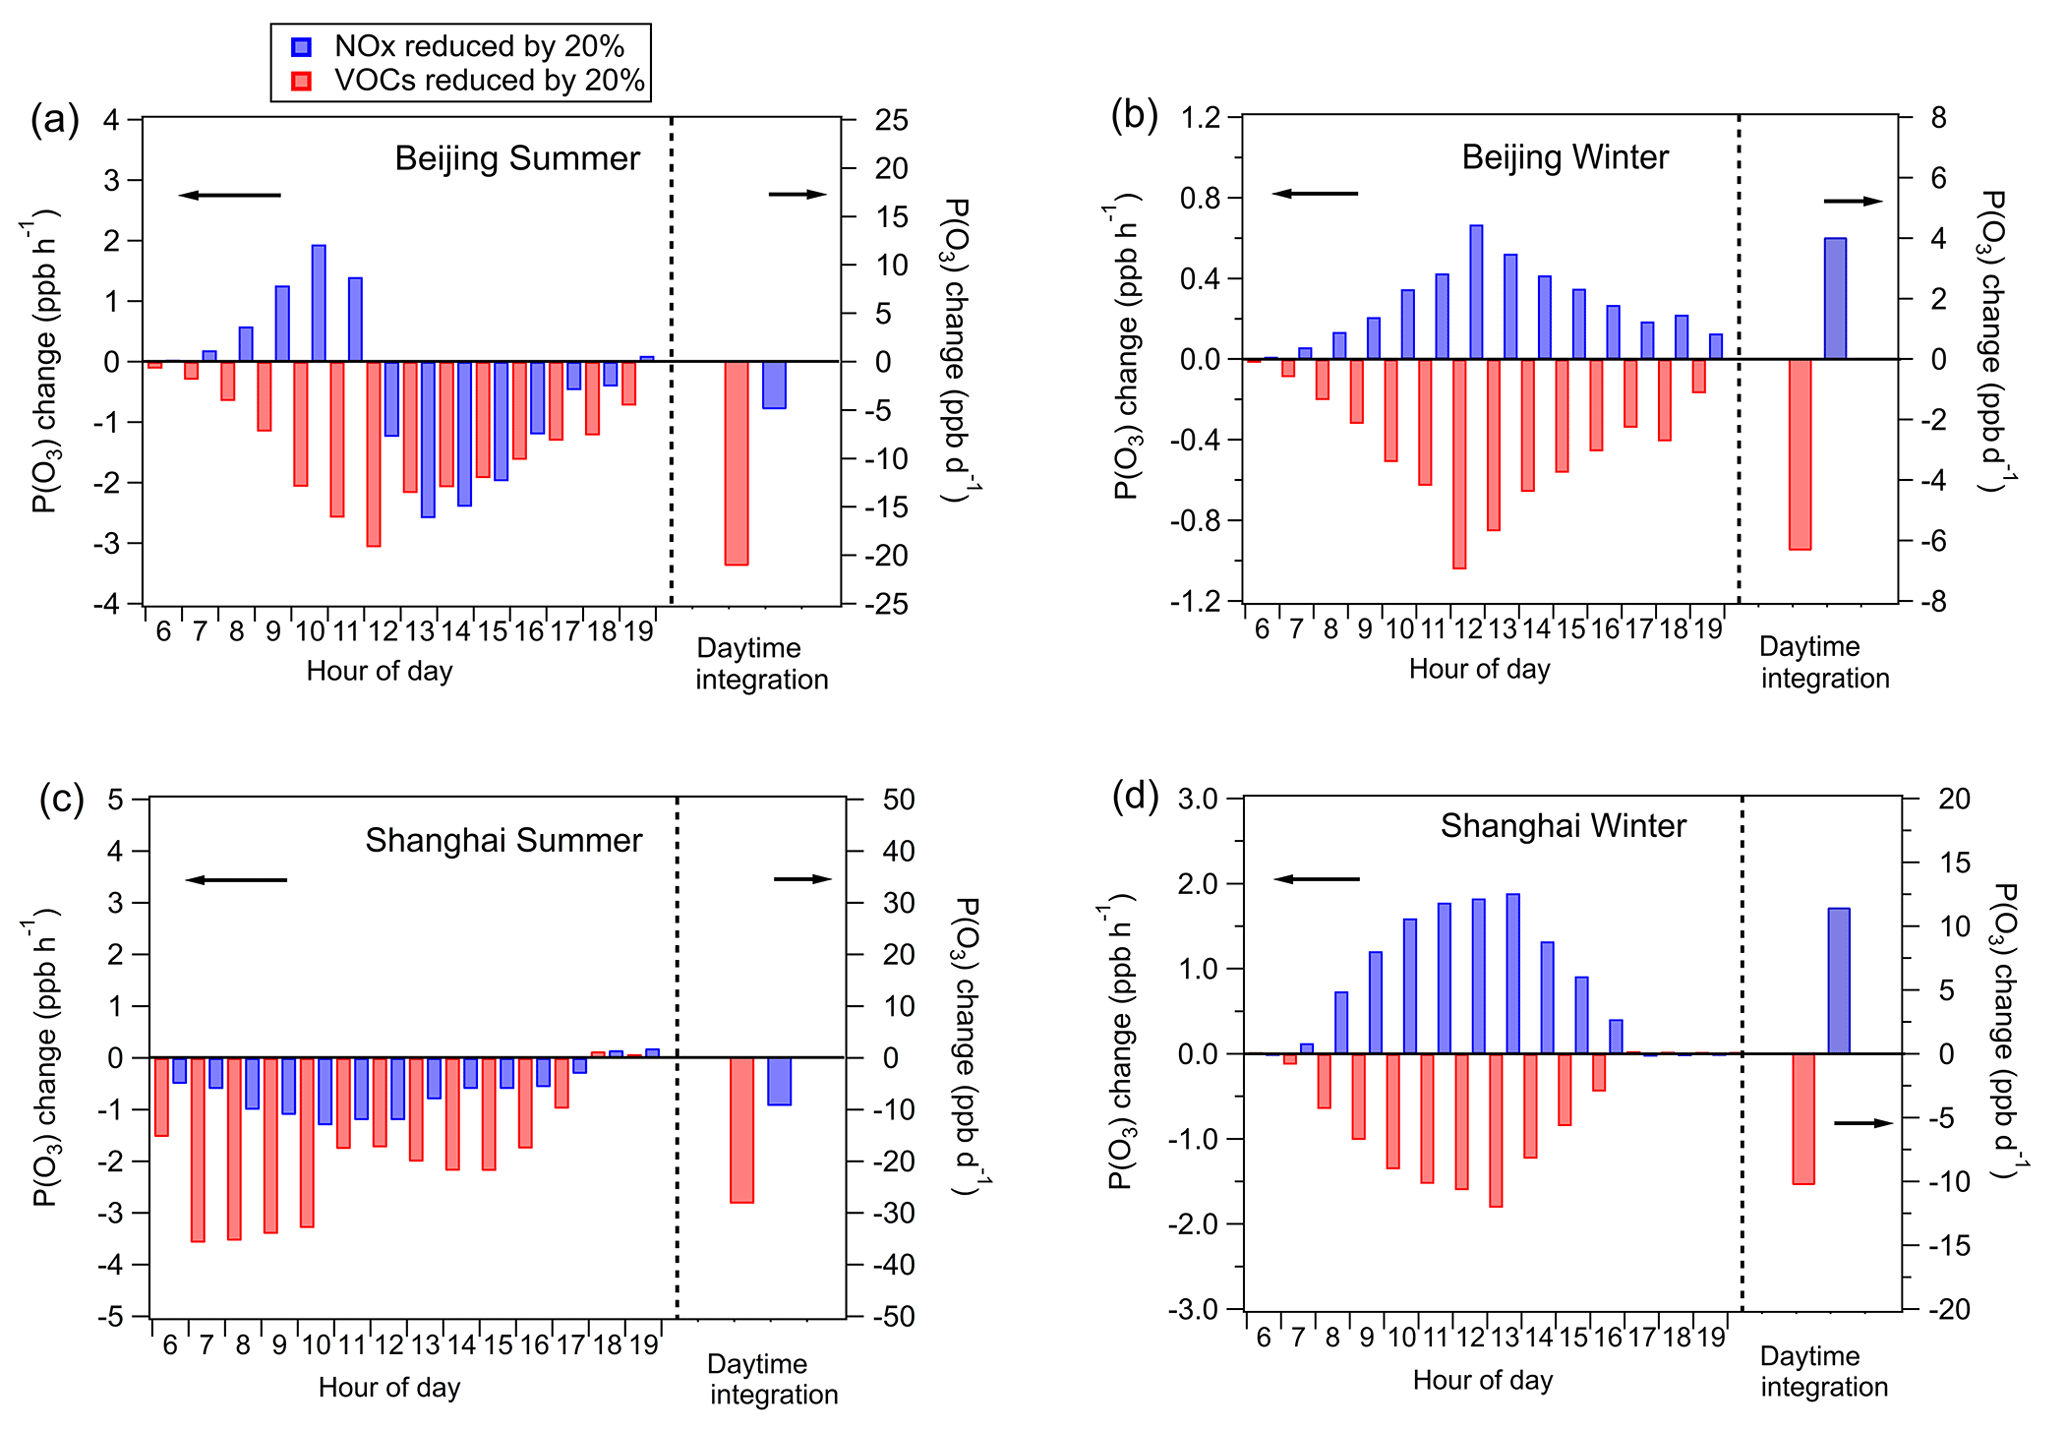
Figure 10Sensitivity of net ozone production rate [P(O3)] to 20 % reductions in emissions of VOCs and NOx for summer and winter of 2019 in Beijing and Shanghai.
Furthermore, the influence of meteorological factors on the O3 change from 2019 to 2020 was investigated. Table S1 shows the average values of primary meteorological factors including temperature, relative humidity, wind speed, wind direction, air pressure and photolysis frequency of NO2 (j(NO2)) during 2019 and 2020 in Beijing and Shanghai. Temperature increased in winter but decreased in summer from 2019 to 2020. Previous studies indicate that O3 concentrations show a positive correlation with temperature (He et al., 2017; Jacob and Winner, 2009). We surmise that the changes in temperature may partly contribute to the contrasting changes in O3 concentrations between summer and winter from 2019 to 2020. Besides temperature, the significant changes in relative humidity may also influence the O3 change. The j(NO2) maintained stability in both winter and summer from 2019 to 2020, indicating a minor effect of photolysis frequencies on O3 changes.
3.4 Additional considerations
There are several limitations of this study. One limitation is that the measurement data of VOCs are only available in two megacities – Beijing and Shanghai. The trends of VOCs in Beijing and Shanghai cannot fully represent that in the whole country. As a result, the influence of the VOC variation on the O3 trend across China is not completely elucidated. The diagnosis of O3 precursor sensitivity is also based on measurement data in the two megacities, which may not reflect the situation of the whole country. Another limitation of this study is that the photochemical box model is constrained by observations near the ground; hence it may not accurately represent some aspects of the photochemistry throughout the boundary layer. The O3 precursor sensitivity in the upper layer of the boundary layer probably differs from that near the ground under certain conditions due to varied VOC and NOx levels and meteorological factors with height (Zhang et al., 2018; Sun et al., 2018). Therefore, to acquire a more broadened and comprehensive diagnosis of O3 precursor sensitivity, the measurement of VOCs in more cities and over the whole boundary layer is required in the future. Lastly, the transport effect of O3 is important in O3 pollution in China (Han et al., 2018; Shen et al., 2022; Yang et al., 2022). However, our study has not considered the transport effect which probably plays a crucial role in O3 trend, and may also lead to uncertainties concerning the diagnosis of O3 precursor sensitivities.
During the past decade, China has devoted substantial resources to improving the environment. These efforts reduced atmospheric PM loading, but ambient O3 levels increased (Shao et al., 2021). We present a detailed characterisation of the spatial distribution and temporal trend of O3 over China based on nationwide hourly O3 observations, and find the following:
-
Maximum O3 concentrations primarily occur during summer in northern China, but during autumn or spring in southern China. Meteorological factors, especially solar radiation and the southwestern monsoon, play key roles in the regional contrast of the seasonal variations.
-
Four O3 metrics (AVGMDA8, 4MDA8, NDGT70, 3MMDA1) increased from 2014 to 2017, and remained relatively stable after 2017. These metrics were generally higher at urban sites than at non-urban sites. The trend of O3 concentrations differed across seasons, especially from 2019 to 2020 when O3 concentrations decreased in summer and increased in winter.
-
Simulations by an observationally constrained box model and previous 3-D model simulations agree that the O3 sensitivity during summer in urban areas of China changed from the VOC-limited regime to a transition regime. This increases our confidence in the reduction of both VOC and NOx emissions as an effective approach to further reducing summertime O3. Box model simulations also indicate that the urban photochemistry is still in the VOC-limited regime in winter during 2020.
Our study provides an improved understanding of the past and future response of O3 to emission reductions in China, and can inform control measures for effective future reductions of O3.
The observational data and model codes used in this study are available from corresponding authors upon request (h.su@mpic.de)
The supplement related to this article is available online at: https://doi.org/10.5194/acp-22-8935-2022-supplement.
HS and WW designed the research. WW and HS prepared the manuscript with contributions from other authors. WW performed data analysis with contributions from DDP, SW, RN, FB and YC. HW, XL and SY collected data.
The contact author has declared that neither they nor their co-authors have any competing interests.
Publisher's note: Copernicus Publications remains neutral with regard to jurisdictional claims in published maps and institutional affiliations.
This article is part of the special issue “Atmospheric ozone and related species in the early 2020s: latest results and trends (ACP/AMT inter-journal SI)”. It is not associated with a conference.
This study is support by the Max Planck Society (MPG). YC thanks the Minerva Programme of MPG.
The article processing charges for this open-access publication were covered by the Max Planck Society.
This paper was edited by Hailong Wang and reviewed by two anonymous referees.
Ainsworth, E. A., Yendrek, C. R., Sitch, S., Collins, W. J., and Emberson, L. D.: The effects of tropospheric ozone on net primary productivity and implications for climate change, Annu. Rev. Plant Biol., 63, 637–661, 2012.
Brown-Steiner, B. and Hess, P.: Asian influence on surface ozone in the United States: A comparison of chemistry, seasonality, and transport mechanisms, J. Geophys. Res.-Atmos., 116, D17, https://doi.org/10.1029/2011JD015846, 2011.
Cheng, J., Su, J., Cui, T., Li, X., Dong, X., Sun, F., Yang, Y., Tong, D., Zheng, Y., Li, Y., Li, J., Zhang, Q., and He, K.: Dominant role of emission reduction in PM2.5 air quality improvement in Beijing during 2013–2017: a model-based decomposition analysis, Atmos. Chem. Phys., 19, 6125–6146, https://doi.org/10.5194/acp-19-6125-2019, 2019.
Cheng, N., Li, Y., Zhang, D., Chen, T., Sun, F., Chen, C., and Meng, F.: Characteristics of Ground Ozone Concentration over Beijing from 2004 to 2015: Trends, Transport, and Effects of Reductions, Atmos. Chem. Phys. Discuss. [preprint], https://doi.org/10.5194/acp-2016-508, 2016.
Chen, X., Jiang, Z., Shen, Y., Li, R., Fu, Y., Liu, J., Han, H., Liao, H., Cheng, X., and Jones, D. B.: Chinese regulations are working – why is surface ozone over industrialized areas still high? Applying lessons from northeast US air quality evolution, Geophys. Res. Lett., 48, e2021GL092816, https://doi.org/10.1029/2021GL092816, 2021.
Chen, Y., Han, H., Zhang, M., Zhao, Y., Huang, Y., Zhou, M., Wang, C., He, G., Huang, R., and Luo, B.: Trends and Variability of Ozone Pollution over the Mountain-Basin Areas in Sichuan Province during 2013–2020: Synoptic Impacts and Formation Regimes, Atmosphere, 12, 1557, https://doi.org/10.3390/atmos12121557, 2021.
China Statistics Press: http://www.stats.gov.cn/tjsj/ndsj/2018/indexeh.htm (last access: 1 August 2021), 45, 1817–1829, 2018.
Cooper, O. R., Parrish, D., Stohl, A., Trainer, M., Nédélec, P., Thouret, V., Cammas, J.-P., Oltmans, S., Johnson, B., and Tarasick, D.: Increasing springtime ozone mixing ratios in the free troposphere over western North America, Nature, 463, 344–348, 2010.
Cooper, O. R., Gao, R. S., Tarasick, D., Leblanc, T., and Sweeney, C.: Long-term ozone trends at rural ozone monitoring sites across the United States, 1990–2010, J. Geophys. Res.-Atmos., 117, D22, https://doi.org/10.1029/2012JD018261, 2012.
Ding, A. J., Wang, T., Thouret, V., Cammas, J.-P., and Nédélec, P.: Tropospheric ozone climatology over Beijing: analysis of aircraft data from the MOZAIC program, Atmos. Chem. Phys., 8, 1–13, https://doi.org/10.5194/acp-8-1-2008, 2008.
Fiore, A. M., Dentener, F., Wild, O., Cuvelier, C., Schultz, M., Hess, P., Textor, C., Schulz, M., Doherty, R., and Horowitz, L.: Multimodel estimates of intercontinental source-receptor relationships for ozone pollution, J. Geophys. Res.-Atmos., 114, D4, https://doi.org/10.1029/2008JD010816, 2009.
Fleming, Z. L., Doherty, R. M., Von Schneidemesser, E., Malley, C. S., Cooper, O. R., Pinto, J. P., Colette, A., Xu, X., Simpson, D., and Schultz, M. G.: Tropospheric Ozone Assessment Report: Present-day ozone distribution and trends relevant to human health, Elem. Sci. Anth., 6, 12, https://doi.org/10.1525/elementa.273, 2018.
Gao, W., Tie, X. X., Xu, J. M., Huang, R. J., Mao, X. Q., Zhou, G. Q., and Chang, L. Y.: Long-term trend of O3 in a mega City (Shanghai), China: Characteristics, causes, and interactions with precursors, Sci. Total Environ., 603, 425–433, https://doi.org/10.1016/j.scitotenv.2017.06.099, 2017.
Gaudel, A., Cooper, O. R., Chang, K.-L., Bourgeois, I., Ziemke, J. R., Strode, S. A., Oman, L. D., Sellitto, P., Nédélec, P., and Blot, R.: Aircraft observations since the 1990s reveal increases of tropospheric ozone at multiple locations across the Northern Hemisphere, Sci. Adv., 6, eaba8272, https://doi.org/10.1126/sciadv.aba8272, 2020.
Han, X., Zhu, L., Wang, S., Meng, X., Zhang, M., and Hu, J.: Modeling study of impacts on surface ozone of regional transport and emissions reductions over North China Plain in summer 2015, Atmos. Chem. Phys., 18, 12207–12221, https://doi.org/10.5194/acp-18-12207-2018, 2018.
He, J., Gong, S., Yu, Y., Yu, L., Wu, L., Mao, H., Song, C., Zhao, S., Liu, H., and Li, X.: Air pollution characteristics and their relation to meteorological conditions during 2014–2015 in major Chinese cities, Environ. Pollut., 223, 484–496, 2017.
Hendrick, F., Müller, J.-F., Clémer, K., Wang, P., De Mazière, M., Fayt, C., Gielen, C., Hermans, C., Ma, J. Z., Pinardi, G., Stavrakou, T., Vlemmix, T., and Van Roozendael, M.: Four years of ground-based MAX-DOAS observations of HONO and NO2 in the Beijing area, Atmos. Chem. Phys., 14, 765–781, https://doi.org/10.5194/acp-14-765-2014, 2014.
Jacob, D. J. and Winner, D. A.: Effect of climate change on air quality, Atmos. Environ., 43, 51–63, 2009.
Jiang, H., Lu, N., Qin, J., and Yao, L.: Surface global and diffuse solar radiation over China acquired from geostationary Multi-functional Transport Satellite data, Earth Syst. Sci. Data Discuss. [preprint], https://doi.org/10.5194/essd-2019-209, 2019.
Jindal, S.: Air quality guidelines: Global update 2005, Particulate matter, ozone, nitrogen dioxide and sulfur dioxide, Indian J. Med. Res., 126, 492–494, 2007.
Kang, M., Zhang, J., Zhang, H., and Ying, Q.: On the Relevancy of Observed Ozone Increase during COVID-19 Lockdown to Summertime Ozone and PM2.5 Control Policies in China, Environ. Sci. Technol. Lett., 8, 289–294, 2021.
Kleinman, L. I.: Low and high NOx tropospheric photochemistry, J. Geophys. Res.-Atmos., 99, 16831–16838, 1994.
Kleinman, L. I.: The dependence of tropospheric ozone production rate on ozone precursors, Atmos. Environ., 39, 575–586, https://doi.org/10.1016/j.atmosenv.2004.08.047, 2005.
Kleinman, L. I., Daum, P. H., Lee, J. H., Lee, Y. N., Nunnermacker, L. J., Springston, S. R., Newman, L., Weinstein-Lloyd, J., and Sillman, S.: Dependence of ozone production on NO and hydrocarbons in the troposphere, Geophys. Res. Lett., 24, 2299–2302, 1997.
Lefohn, A. S., Malley, C. S., Smith, L., Wells, B., Hazucha, M., Simon, H., Naik, V., Mills, G., Schultz, M. G., and Paoletti, E.: Tropospheric ozone assessment report: Global ozone metrics for climate change, human health, and crop/ecosystem research, Elem. Sci. Anth., 6, 28, https://doi.org/10.1525/elementa.279, 2018.
Le, T., Wang, Y., Liu, L., Yang, J., Yung, Y. L., Li, G., and Seinfeld, J. H.: Unexpected air pollution with marked emission reductions during the COVID-19 outbreak in China, Science, 369, 702–706, 2020.
Li, J., Lu, K., Lv, W., Li, J., Zhong, L., Ou, Y., Chen, D., Huang, X., and Zhang, Y.: Fast increasing of surface ozone concentrations in Pearl River Delta characterized by a regional air quality monitoring network during 2006–2011, J. Environ. Sci., 26, 23–36, 2014.
Li, K., Jacob, D. J., Liao, H., Shen, L., Zhang, Q., and Bates, K. H.: Anthropogenic drivers of 2013–2017 trends in summer surface ozone in China, P. Natl. Acad. Sci. USA, 116, 422–427, 2019.
Li, K., Jacob, D. J., Shen, L., Lu, X., De Smedt, I., and Liao, H.: Increases in surface ozone pollution in China from 2013 to 2019: anthropogenic and meteorological influences, Atmos. Chem. Phys., 20, 11423–11433, https://doi.org/10.5194/acp-20-11423-2020, 2020.
Li, K., Jacob, D. J., Liao, H., Qiu, Y., Shen, L., Zhai, S., Bates, K. H., Sulprizio, M. P., Song, S., and Lu, X.: Ozone pollution in the North China Plain spreading into the late-winter haze season, P. Natl. Acad. Sci. USA, 118, e2015797118, https://doi.org/10.1073/pnas.2015797118, 2021.
Li, M., Zhang, Q., Zheng, B., Tong, D., Lei, Y., Liu, F., Hong, C., Kang, S., Yan, L., Zhang, Y., Bo, Y., Su, H., Cheng, Y., and He, K.: Persistent growth of anthropogenic non-methane volatile organic compound (NMVOC) emissions in China during 1990–2017: drivers, speciation and ozone formation potential, Atmos. Chem. Phys., 19, 8897–8913, https://doi.org/10.5194/acp-19-8897-2019, 2019.
Lin, M., Fiore, A. M., Horowitz, L. W., Cooper, O. R., Naik, V., Holloway, J., Johnson, B. J., Middlebrook, A. M., Oltmans, S. J., and Pollack, I. B.: Transport of Asian ozone pollution into surface air over the western United States in spring, J. Geophys. Res.-Atmos., 117, D21, https://doi.org/10.1029/2011JD016961, 2012.
Liu, F., Zhang, Q., Zheng, B., Tong, D., Yan, L., Zheng, Y., and He, K.: Recent reduction in NOx emissions over China: synthesis of satellite observations and emission inventories, Environ. Res. Lett., 11, 114002, https://doi.org/10.1088/1748-9326/11/11/114002, 2016.
Liu, H., Liu, S., Xue, B., Lv, Z., Meng, Z., Yang, X., Xue, T., Yu, Q., and He, K.: Ground-level ozone pollution and its health impacts in China, Atmos. Environ., 173, 223–230, 2018.
Li, X.-B., Yuan, B., Parrish, D. D., Chen, D., Song, Y., Yang, S., Liu, Z., and Shao, M.: Long-term trend of ozone in southern China reveals future mitigation strategy for air pollution, Atmos. Environ., 269, 118869, https://doi.org/10.1016/j.atmosenv.2021.118869, 2022.
Lu, X., Hong, J. Y., Zhang, L., Cooper, O. R., Schultz, M. G., Xu, X. B., Wang, T., Gao, M., Zhao, Y. H., and Zhang, Y. H.: Severe Surface Ozone Pollution in China: A Global Perspective, Environ. Sci. Technol. Lett., 5, 487–494, https://doi.org/10.1021/acs.estlett.8b00366, 2018.
Lu, X., Zhang, L., Wang, X., Gao, M., Li, K., Zhang, Y., Yue, X., and Zhang, Y.: Rapid increases in warm-season surface ozone and resulting health impact in China since 2013, Environ. Sci. Tech. Let., 7, 240–247, 2020.
Malley, C. S., Henze, D. K., Kuylenstierna, J. C., Vallack, H. W., Davila, Y., Anenberg, S. C., Turner, M. C., and Ashmore, M. R.: Updated global estimates of respiratory mortality in adults ≥30 years of age attributable to long-term ozone exposure, Environ. Health Perspect., 125, 087021, https://doi.org/10.1289/EHP1390, 2017.
Ma, Z., Xu, J., Quan, W., Zhang, Z., Lin, W., and Xu, X.: Significant increase of surface ozone at a rural site, north of eastern China, Atmos. Chem. Phys., 16, 3969–3977, https://doi.org/10.5194/acp-16-3969-2016, 2016.
Mihelcic, D., Holland, F., Hofzumahaus, A., Hoppe, L., Konrad, S., Müsgen, P., Pätz, H. W., Schäfer, H. J., Schmitz, T., and Volz-Thomas, A.: Peroxy radicals during BERLIOZ at Pabstthum: Measurements, radical budgets and ozone production, J. Geophys. Res.-Atmos., 108, D4, https://doi.org/10.1029/2001JD001014, 2003.
Mills, G., Pleijel, H., Malley, C. S., Sinha, B., Cooper, O. R., Schultz, M. G., Neufeld, H. S., Simpson, D., Sharps, K., and Feng, Z.: Tropospheric Ozone Assessment Report: Present-day tropospheric ozone distribution and trends relevant to vegetation, Elem. Sci. Anth., 6, 47, https://doi.org/10.1525/elementa.302, 2018.
Monks, P. S., Archibald, A. T., Colette, A., Cooper, O., Coyle, M., Derwent, R., Fowler, D., Granier, C., Law, K. S., Mills, G. E., Stevenson, D. S., Tarasova, O., Thouret, V., von Schneidemesser, E., Sommariva, R., Wild, O., and Williams, M. L.: Tropospheric ozone and its precursors from the urban to the global scale from air quality to short-lived climate forcer, Atmos. Chem. Phys., 15, 8889–8973, https://doi.org/10.5194/acp-15-8889-2015, 2015.
Parrish, D. D., Derwent, R. G., Steinbrecht, W., Stübi, R., Van Malderen, R., Steinbacher, M., Trickl, T., Ries, L., and Xu, X.: Zonal similarity of long-term changes and seasonal cycles of baseline ozone at northern midlatitudes, J. Geophys. Res.-Atmos., 125, e2019JD031908, https://doi.org/10.1029/2019JD031908, 2020.
Qu, K., Wang, X., Yan, Y., Shen, J., Xiao, T., Dong, H., Zeng, L., and Zhang, Y.: A comparative study to reveal the influence of typhoons on the transport, production and accumulation of O3 in the Pearl River Delta, China, Atmos. Chem. Phys., 21, 11593–11612, https://doi.org/10.5194/acp-21-11593-2021, 2021.
Schultz, M. G., Schröder, S., Lyapina, O., Cooper, O. R., Galbally, I., Petropavlovskikh, I., Von Schneidemesser, E., Tanimoto, H., Elshorbany, Y., and Naja, M.: Tropospheric Ozone Assessment Report: Database and metrics data of global surface ozone observations, Elem. Sci. Anth., 5, 58, https://doi.org/10.1525/elementa.244, 2017.
Shah, V., Jacob, D. J., Li, K., Silvern, R. F., Zhai, S., Liu, M., Lin, J., and Zhang, Q.: Effect of changing NOx lifetime on the seasonality and long-term trends of satellite-observed tropospheric NO2 columns over China, Atmos. Chem. Phys., 20, 1483–1495, https://doi.org/10.5194/acp-20-1483-2020, 2020.
Shao, M., Wang, W., Yuan, B., Parrish, D. D., Li, X., Lu, K., Wu, L., Wang, X., Mo, Z., and Yang, S.: Quantifying the role of PM2.5 dropping in variations of ground-level ozone: Inter-comparison between Beijing and Los Angeles, Sci. Total Environ., 788, 147712, https://doi.org/10.1016/j.scitotenv.2021.147712, 2021.
Shen, L., Liu, J., Zhao, T., Xu, X., Han, H., Wang, H., and Shu, Z.: Atmospheric transport drives regional interactions of ozone pollution in China, Sci. Total Environ., 830, 154634, https://doi.org/10.1016/j.scitotenv.2022.154634, 2022.
Stevenson, D., Dentener, F., Schultz, M., Ellingsen, K., Van Noije, T., Wild, O., Zeng, G., Amann, M., Atherton, C., and Bell, N.: Multimodel ensemble simulations of present-day and near-future tropospheric ozone, J. Geophys. Res.-Atmos., 111, D8, https://doi.org/10.1029/2005JD006338, 2006.
Stocker, T. F., Qin, D., Plattner, G.-K., Tignor, M. M., Allen, S. K., Boschung, J., Nauels, A., Xia, Y., Bex, V., and Midgley, P. M.: Climate Change 2013: The physical science basis, Intergovernmental Panel on Climate Change, Cambridge University Press, Cambridge, https://doi.org/10.1017/CBO9781107415324, 2014.
Stohl, A., Bonasoni, P., Cristofanelli, P., Collins, W., Feichter, J., Frank, A., Forster, C., Gerasopoulos, E., Gäggeler, H., and James, P.: Stratosphere-troposphere exchange: A review, and what we have learned from STACCATO, J. Geophys. Res.-Atmos., 108, https://doi.org/10.1029/2002JD002490, 2003.
Sun, J., Wang, Y., Wu, F., Tang, G., Wang, L., Wang, Y., and Yang, Y.: Vertical characteristics of VOCs in the lower troposphere over the North China Plain during pollution periods, Environ. Pollut., 236, 907–915, 2018.
Sun, L., Xue, L., Wang, T., Gao, J., Ding, A., Cooper, O. R., Lin, M., Xu, P., Wang, Z., Wang, X., Wen, L., Zhu, Y., Chen, T., Yang, L., Wang, Y., Chen, J., and Wang, W.: Significant increase of summertime ozone at Mount Tai in Central Eastern China, Atmos. Chem. Phys., 16, 10637–10650, https://doi.org/10.5194/acp-16-10637-2016, 2016.
Tang, G., Li, X., Wang, Y., Xin, J., and Ren, X.: Surface ozone trend details and interpretations in Beijing, 2001–2006, Atmos. Chem. Phys., 9, 8813–8823, https://doi.org/10.5194/acp-9-8813-2009, 2009.
Tang, G., Liu, Y., Zhang, J., Liu, B., Li, Q., Sun, J., Wang, Y., Xuan, Y., Li, Y., and Pan, J.: Bypassing the NOx titration trap in ozone pollution control in Beijing, Atmos. Res., 249, 105333, https://doi.org/10.1016/j.atmosres.2020.105333, 2021.
Trickl, T., Bärtsch-Ritter, N., Eisele, H., Furger, M., Mücke, R., Sprenger, M., and Stohl, A.: High-ozone layers in the middle and upper troposphere above Central Europe: potential import from the stratosphere along the subtropical jet stream, Atmos. Chem. Phys., 11, 9343–9366, https://doi.org/10.5194/acp-11-9343-2011, 2011.
Verstraeten, W. W., Neu, J. L., Williams, J. E., Bowman, K. W., Worden, J. R., and Boersma, K. F.: Rapid increases in tropospheric ozone production and export from China, Nat. Geosci., 8, 690, https://doi.org/10.1038/ngeo2493, 2015.
Wang, B., Shao, M., Lu, S. H., Yuan, B., Zhao, Y., Wang, M., Zhang, S. Q., and Wu, D.: Variation of ambient non-methane hydrocarbons in Beijing city in summer 2008, Atmos. Chem. Phys., 10, 5911–5923, https://doi.org/10.5194/acp-10-5911-2010, 2010.
Wang, M., Zeng, L., Lu, S., Shao, M., Liu, X., Yu, X., Chen, W., Yuan, B., Zhang, Q., and Hu, M.: Development and validation of a cryogen-free automatic gas chromatograph system (GC-MS/FID) for online measurements of volatile organic compounds, Anal. Methods, 6, 9424–9434, 2014.
Wang, P., Yang, Y., Li, H., Chen, L., Dang, R., Xue, D., Li, B., Tang, J., Leung, L. R., and Liao, H.: North China Plain as a hot spot of ozone pollution exacerbated by extreme high temperatures, Atmos. Chem. Phys., 22, 4705–4719, https://doi.org/10.5194/acp-22-4705-2022, 2022.
Wang, T., Wei, X. L., Ding, A. J., Poon, C. N., Lam, K. S., Li, Y. S., Chan, L. Y., and Anson, M.: Increasing surface ozone concentrations in the background atmosphere of Southern China, 1994–2007, Atmos. Chem. Phys., 9, 6217–6227, https://doi.org/10.5194/acp-9-6217-2009, 2009.
Wang, W., Li, X., Shao, M., Hu, M., Zeng, L., Wu, Y., and Tan, T.: The impact of aerosols on photolysis frequencies and ozone production in Beijing during the 4-year period 2012–2015, Atmos. Chem. Phys., 19, 9413–9429, https://doi.org/10.5194/acp-19-9413-2019, 2019.
Wang, W., Parrish, D. D., Li, X., Shao, M., Liu, Y., Mo, Z., Lu, S., Hu, M., Fang, X., Wu, Y., Zeng, L., and Zhang, Y.: Exploring the drivers of the increased ozone production in Beijing in summertime during 2005–2016, Atmos. Chem. Phys., 20, 15617–15633, https://doi.org/10.5194/acp-20-15617-2020, 2020.
Wang, W., Li, X., Kuang, Y., Su, H., Cheng, Y., Hu, M., Zeng, L., Tan, T., and Zhang, Y.: Exploring the Drivers and Photochemical Impact of the Positive Correlation between Single Scattering Albedo and Aerosol Optical Depth in the Troposphere, Environ. Sci. Technol. Lett., 8, 504–510, 2021a.
Wang, W., Qi, J., Zhou, J., Yuan, B., Peng, Y., Wang, S., Yang, S., Williams, J., Sinha, V., and Shao, M.: The improved comparative reactivity method (ICRM): measurements of OH reactivity under high-NOx conditions in ambient air, Atmos. Meas. Tech., 14, 2285–2298, https://doi.org/10.5194/amt-14-2285-2021, 2021b.
Wang, W., van der A, R., Ding, J., van Weele, M., and Cheng, T.: Spatial and temporal changes of the ozone sensitivity in China based on satellite and ground-based observations, Atmos. Chem. Phys., 21, 7253–7269, https://doi.org/10.5194/acp-21-7253-2021, 2021.
Wang, Y., Konopka, P., Liu, Y., Chen, H., Müller, R., Plöger, F., Riese, M., Cai, Z., and Lü, D.: Tropospheric ozone trend over Beijing from 2002–2010: ozonesonde measurements and modeling analysis, Atmos. Chem. Phys., 12, 8389–8399, https://doi.org/10.5194/acp-12-8389-2012, 2012.
Xiao, Z. and Jiang, H.: A study of spatial and temporal dynamics of total ozone over Southwest China with multi-source remote-sensing data, Int. J. Remote Sens., 34, 128–138, 2013.
Xu, J., Ma, J. Z., Zhang, X. L., Xu, X. B., Xu, X. F., Lin, W. L., Wang, Y., Meng, W., and Ma, Z. Q.: Measurements of ozone and its precursors in Beijing during summertime: impact of urban plumes on ozone pollution in downwind rural areas, Atmos. Chem. Phys., 11, 12241–12252, https://doi.org/10.5194/acp-11-12241-2011, 2011.
Xu, J., Tie, X., Gao, W., Lin, Y., and Fu, Q.: Measurement and model analyses of the ozone variation during 2006 to 2015 and its response to emission change in megacity Shanghai, China, Atmos. Chem. Phys., 19, 9017–9035, https://doi.org/10.5194/acp-19-9017-2019, 2019.
Xu, W., Xu, X., Lin, M., Lin, W., Tarasick, D., Tang, J., Ma, J., and Zheng, X.: Long-term trends of surface ozone and its influencing factors at the Mt Waliguan GAW station, China – Part 2: The roles of anthropogenic emissions and climate variability, Atmos. Chem. Phys., 18, 773–798, https://doi.org/10.5194/acp-18-773-2018, 2018.
Xu, X. and Lin, W.: Trends of tropospheric ozone over China based on satellite data (1979–2005), Adv. Clim. Chang. Res., 2, 43–48, 2011.
Xu, X., Lin, W., Xu, W., Jin, J., Wang, Y., Zhang, G., Zhang, X., Ma, Z., Dong, Y., and Ma, Q.: Long-term changes of regional ozone in China: implications for human health and ecosystem impacts, Elem. Sci. Anth., 8, 13, https://doi.org/10.1525/elementa.409, 2020.
Yang, Y., Li, M., Wang, H., Li, H., Wang, P., Li, K., Gao, M., and Liao, H.: ENSO modulation of summertime tropospheric ozone over China, Environ. Res. Lett., 17, 034020, https://doi.org/10.1088/1748-9326/ac54cd, 2022.
Yin, C., Solmon, F., Deng, X., Zou, Y., Deng, T., Wang, N., Li, F., Mai, B., and Liu, L.: Geographical distribution of ozone seasonality over China, Sci. Total Environ., 689, 625–633, 2019.
Young, P. J., Archibald, A. T., Bowman, K. W., Lamarque, J.-F., Naik, V., Stevenson, D. S., Tilmes, S., Voulgarakis, A., Wild, O., Bergmann, D., Cameron-Smith, P., Cionni, I., Collins, W. J., Dalsøren, S. B., Doherty, R. M., Eyring, V., Faluvegi, G., Horowitz, L. W., Josse, B., Lee, Y. H., MacKenzie, I. A., Nagashima, T., Plummer, D. A., Righi, M., Rumbold, S. T., Skeie, R. B., Shindell, D. T., Strode, S. A., Sudo, K., Szopa, S., and Zeng, G.: Pre-industrial to end 21st century projections of tropospheric ozone from the Atmospheric Chemistry and Climate Model Intercomparison Project (ACCMIP), Atmos. Chem. Phys., 13, 2063–2090, https://doi.org/10.5194/acp-13-2063-2013, 2013.
Zhang, J. P., Zhu, T., Zhang, Q. H., Li, C. C., Shu, H. L., Ying, Y., Dai, Z. P., Wang, X., Liu, X. Y., Liang, A. M., Shen, H. X., and Yi, B. Q.: The impact of circulation patterns on regional transport pathways and air quality over Beijing and its surroundings, Atmos. Chem. Phys., 12, 5031–5053, https://doi.org/10.5194/acp-12-5031-2012, 2012.
Zhang, K., Xiu, G., Zhou, L., Bian, Q., Duan, Y., Fei, D., Wang, D., and Fu, Q.: Vertical distribution of volatile organic compounds within the lower troposphere in late spring of Shanghai, Atmos. Environ., 186, 150–157, 2018.
Zhang, Q., Yuan, B., Shao, M., Wang, X., Lu, S., Lu, K., Wang, M., Chen, L., Chang, C.-C., and Liu, S. C.: Variations of ground-level O3 and its precursors in Beijing in summertime between 2005 and 2011, Atmos. Chem. Phys., 14, 6089–6101, https://doi.org/10.5194/acp-14-6089-2014, 2014.
Zheng, B., Zhang, Q., Geng, G., Chen, C., Shi, Q., Cui, M., Lei, Y., and He, K.: Changes in China's anthropogenic emissions and air quality during the COVID-19 pandemic in 2020, Earth Syst. Sci. Data, 13, 2895–2907, https://doi.org/10.5194/essd-13-2895-2021, 2021.