the Creative Commons Attribution 4.0 License.
the Creative Commons Attribution 4.0 License.
 | 07 Jul 2022
Seasonal variations in fire conditions are important drivers in the trend of aerosol optical properties over the south-eastern Atlantic
Michal Segal-Rozenhaimer
Caroline Dang
Paquita Zuidema
Arthur J. Sedlacek III
Xiaoye Zhang
Connor Flynn
From June to October, southern Africa produces one-third of the global biomass burning (BB) emissions by widespread fires. BB aerosols are transported westward over the south-eastern Atlantic with the mid-tropospheric winds, resulting in significant radiative effects. Ascension Island (ASI) is located midway between Africa and South America. From June 2016 to October 2017, a 17-month in situ observation campaign on ASI found a low single-scattering albedo (SSA) as well as a high mass absorption cross-section of black carbon (MACBC), demonstrating the strong absorbing marine boundary layer in the south-eastern Atlantic. Here we investigate the monthly variations of critical optical properties of BB aerosols, i.e. SSA and MACBC, during the BB seasons and the driving factors behind these variations. Both SSA and MACBC increase from June to August and decrease in September and October. The average SSA during the BB seasons is 0.81 at 529 nm wavelength, with the highest mean ∼ 0.85 in October and the lowest ∼ 0.78 in August. The absorption enhancement (Eabs) derived from the MACBC shows similar trends with SSA, with the average during the whole of the BB seasons at ∼ 1.96 and ∼ 2.07 in 2016 and 2017, respectively. As the Eabs is higher than the ∼ 1.5 commonly adopted value by climate models, this result suggests the marine boundary layer in the south-eastern Atlantic is more absorbing than model simulations. We find the enhanced ratio of BC to CO (, equal to as the BC background concentration is considered to be 0) is well correlated with SSA and MACBC, providing a simple way to estimate the aerosol optical characteristics in the south-eastern Atlantic. The exponential function we proposed can approximate SSA and MACBC with , and when is small it can capture the rapid growth of SSA as decreases. is influenced by combustion conditions and aerosol scavenging. From the analysis of the location of BB, the primary source fuel, the water content in the fuel, combined with the mean cloud cover and precipitation in the transport areas of the BB plume, we conclude that the increase in from June to August is likely to be caused by burning becoming more flaming. The reduction in the water content of fuels may be responsible for the change in the burning conditions from June to August. The decrease in in September and October may be caused by two factors, one being a lower proportion of flaming conditions, possibly associated with a decrease in mean surface wind speed in the burning area, and the other being an increase in precipitation in the BB transport pathway, leading to enhanced aerosol scavenging, which ultimately results in an increase in SSA and MACBC.
- Article
(9262 KB) - Full-text XML
-
Supplement
(3518 KB) - BibTeX
- EndNote


Biomass burning (BB) is the largest source of primary carbonaceous aerosols and the second-largest source of reactive trace gases in the atmosphere (Akagi et al., 2011; Andreae, 2019; Andreae and Merlet, 2001; Guenther et al., 2006; van der Werf et al., 2017). Aerosols emitted from BB have profound implications for air quality (Brey et al., 2018; Chen et al., 2017; Reisen et al., 2013), health (Johnston et al., 2012; Naeher et al., 2007; Roberts et al., 2011) and climate (Bond et al., 2013; Che et al., 2021; Freire et al., 2020; Malavelle et al., 2019; Thornhill et al., 2018). From June through October, southern Africa produces around one-third of the global BB emission by widespread fires across the savannah region (Roberts et al., 2009; van der Werf et al., 2017). These BB aerosols are transported westward by mid-tropospheric winds over the coincident south-eastern Atlantic (SEA) stratocumulus clouds (Adebiyi and Zuidema, 2016) and can result in significant radiative effects affecting the regional climate (Chand et al., 2009; Che et al., 2021, 2022b; Gordon et al., 2018; Lu et al., 2018; Sakaeda et al., 2011; Stier et al., 2013; Wilcox, 2012). Despite extensive studies, the radiative forcing associated with BB aerosol in the south-eastern Atlantic remains uncertain (Mallet et al., 2021; Doherty et al., 2022).
Black carbon (BC) emitted from BB is the primary absorbent particle that directly impacts the single-scattering albedo (SSA), resulting in a significant warming effect dominating the direct radiative forcing of BB aerosols (Mallet et al., 2020; Pokhrel et al., 2016). Since SSA is one of the largest sources of uncertainty in estimating the aerosol direct and semi-direct radiative forcings (Jiang et al., 2006; McComiskey et al., 2008), it is critical to constrain models with observed SSA. Previous studies generally consider the SSA of BB aerosol ranging from 0.8 to 0.9 at 550 nm (Wu et al., 2020; Eck et al., 2013; Johnson et al., 2008; Pistone et al., 2019), while an extremely low SSA (∼ 0.75 at 550 nm) was observed on Ascension Island (ASI) by Zuidema et al. (2018b), suggesting a strong absorbing marine boundary layer in the south-eastern Atlantic. These SSA values are lower than flight observations near ASI (Wu et al., 2020) during the CLARIFY (CLoud–Aerosol–Radiation Interactions and Forcing for Year 2017) campaign and represent the lowest values compared to all previously reported observations of African BB aerosols (e.g. Pistone et al., 2019), motivating us to investigate the causes and variations of their occurrence. In addition to SSA, the mass absorption cross section of BC (MACBC) is an essential parameter in quantifying BB aerosol absorbing capacity and is a fundamental input in climate models (Bond et al., 2013). For fresh BC, MACBC falls within a narrow range of 7.5±1.2 m2 g−1 at 550 nm, while with ageing and internal mixing, MACBC can increase by approximately 50 % (Bond et al., 2013). The increased absorption results from coatings on BC particles through the so-called lensing effect and is often represented by an absorption enhancement (Eabs). Observations in different global regions have reported varying Eabs, depending on the coating thickness and mixing states of BC particles (Xu et al., 2018). Zuidema et al. (2018b) demonstrated a high MACBC observed on ASI, suggesting the Eabs can be higher than 2, which is usually observed in heavily polluted areas (Xu et al., 2018). The Eabs observed on ASI is significantly higher than the generally adopted value of ∼ 1.5 by current climate models (Cappa et al., 2012; Bond et al., 2013), indicating that the marine boundary layer in the south-eastern Atlantic is more absorbing than the model simulations. All these aerosol optical properties measured on ASI suggest current models may not be able to simulate well the marine boundary layer in the south-eastern Atlantic, raising questions about the accuracy of climate models in this region.
During the BB season (from June to October), the physical and chemical properties of BB aerosols change with variations in combustion conditions, source fuel and meteorological conditions, resulting in variations in the optical characteristics of BB aerosols (Pokhrel et al., 2021). Although satellite and surface-based sun photometer observations are able to estimate long-term SSA variation, the presence of the extensive clouds makes it difficult to retrieve SSA in the marine boundary layer in the SEA (Haywood et al., 2004; Eswaran et al., 2019). Recent aircraft campaigns conducted in this region have provided information on the optical properties of the African BB aerosols, such as SSA and MACBC (Redemann et al., 2021; Haywood et al., 2021; Pistone et al., 2019). However, these campaigns are of short duration and thus unable to provide a long-term dataset on the variation of optical properties of BB aerosols in the marine boundary layer as the African plume transects to ASI.
From 1 June 2016 to 31 October 2017, the LASIC (Layered Atlantic Smoke Interactions with Clouds) observation campaign was carried out on ASI, which offers, for the first time, the opportunity to collect a long-term dataset on these fundamental aerosol properties (Zuidema et al., 2018b, 2016). The island is midway between Africa and South America, and located within the trade wind shallow cumulus regime with the deepening boundary layer known to entrain free tropospheric plumes during the African BB seasons (Adebiyi and Zuidema, 2016). With the 17 months of continuous observations, LASIC enables a detailed study of the variation of the optical properties of BB aerosols and the factors influencing them. Therefore, here we examine the monthly variations of SSA, MACBC, and Eabs measured on ASI during the 2-year BB seasons, and explore the factors responsible for these variations. The data and method we used are described in Sect. 2, the variations of SSA, MACBC and Eabs are discussed in Sect. 3.1. Then relations between these aerosol optical properties (SSA and MACBC) and (introduced and discussed in Sect. 2) are examined in Sect. 3.2. The potential drivers behind the changes in are further discussed in Sect. 4. Section 5 offers conclusions.
2.1 In situ field observations
The LASIC campaign was carried out at the Atmospheric Radiation Measurement (ARM) Mobile Facility 1 site on ASI, located at the latitude of 7.97∘ S, the longitude of 14.35∘ W, and the altitude of 340.8 m. A more detailed description of the sampling location and instruments can be found in the campaign report (Zuidema et al., 2018a). Here we provide a brief introduction to the instruments and data we used in this paper.
Carbon monoxide (CO) concentration is measured by Los Gatos Model ICOS CO/N2O/H2O Analyzer. The aerosol absorption coefficient is derived from the Particle Soot Absorption Photometer (PSAP, Radiance Research Inc), and the data are corrected as an average of the Virkkula (2010) and Ogren (2010) corrections. The aerosol scattering coefficient is measured by a nephelometer (Neph, TSI Inc). Absorptions are measured at 464, 529, and 648 nm wavelengths, while scatterings are at 450, 550, and 700 nm. The scattering coefficients are then adjusted to the wavelength of the absorptions using the scattering Ångström exponent to derive the SSAs. Only data with absorption coefficients greater than 5 Mm−1 are used to calculate the SSA. Standard temperature and pressure correction (STP) is applied to all data. Note that the aerosol absorption and scattering coefficients are measured at different relative humidity, as PSAP measures dry aerosols with the estimated relative humidity (RH) ≤ 25 %, while the nephelometer measures aerosols with RH spanning 45 %–60 %. Since the scattering measurement is conducted on a sample that is not as dry as the absorption, the SSA observed on ASI probably represents an upper bound to the true SSA. The refractive BC is derived from measurements with the Single Particle Soot Photometer (SP2, Droplet measurement Technologies Inc). The MACBC is calculated as the ratio of absorption coefficient and the BC mass concentration. To minimize instrument accuracy errors in the derived MACBC, only data with BC greater than 70 ng and absorption coefficients greater than 5 Mm−1 are used. The absorption enhancement Eabs is calculated by dividing the MACBC from our observations with that characteristic of fresh uncoated BC (7.5 ± 1.2 m2 g−1 at a wavelength of 550 nm by Bond and Bergstrom, 2006), and assuming the absorption Ångström exponent (AAE) of fresh BC as 1. Recent studies have shown that the AAE of fresh BC can vary from 0.8 to 1.4 (Liu et al., 2018), and thus we further estimated a possible Eabs range based on the variation of the AAE. We also calculated the contribution of brown carbon (BrC) to total absorption at a wavelength of 464 nm, based on the AAE derived from the observations using the following equation:
where the fBrC is the fraction of absorption at 464 nm due to BrC, and MAC464 and MAC529 are the measured MACBC at 464 and 529 nm wavelengths, respectively. AAE529–648 is the absorption Ångström exponent calculated between 529 and 648 nm. This method is similar to the one used by Taylor et al. (2020); however, it may bring uncertainties as the AAE of BC is not always 1 and the MACBC at longer wavelengths might contain contributions from other absorbing materials, such as dust (Lack and Langridge, 2013; Zhang et al., 2022). Note that most of the BC observation for September and October 2017 is unreliable due to issues with the inlet system. Therefore, the MACBC, Eabs, and fBrC for this period are excluded from our analysis.
The enhanced ratio of BC to CO () is often used to indicate the emission conditions of the fire source, as the lifetime of CO is approximately 1 month, and thus the ratio of removes the effect of diffusion. Δ represents the difference between observed and background concentrations. The background concentration of BC is considered to be zero, representing the ideal state where BC aerosols are completely removed and the atmosphere is free from BB impact. Whereas the background concentration of CO is taken as the lowest 5th percentiles of the observations per month in order to approximate the clean state during the BB season. The background CO values range from 50 to 60 ppb (Fig. S1 in the Supplement), consistent with the previous observations in the Southern Hemisphere (Allen et al., 2008, 2011; Shank et al., 2012). Hence, Δ is equal to , and this ratio will be used in the ensuing analysis. Note the CO is converted to the same mass unit as the BC; therefore, is a unitless parameter. Also BC values less than 20 ng m−3 are removed to reduce the effect of instrument noise signals in a clean atmosphere.
2.2 Filter samples
During August 2017, filter samples were collected from FAAM's filter systems on the UK's Bae-146 aircraft near ASI. Samples were deposited on Paella TEM grids, and analysed with a JEOL™ JEM-2010F FEG-TEM with a ThermoNoran™ energy dispersive X-ray detector (EDX); more detailed information is provided by Dang et al. (2021). There are 17 samples collected near ASI, while only two samples are collected inside the marine boundary layer and close to ASI (within 5 km) to represent the composition and mixing of the aerosol measured on ASI. Between these two samples, BB aerosols are collected on just one filter. Therefore, although this sample (sampled on 24 August 2017 09:43–09:49 UTC, at 319.4 m) may provide information on the chemical composition of BB aerosols, it is not statistically representative.
2.3 Satellite data
The fire and land cover data are obtained from the Moderate Resolution Imaging Spectroradiometer (MODIS) sensors onboard the Terra and Aqua satellites. The active fire data are obtained from the MODIS Thermal Anomalies Collection 6.1 (Giglio et al., 2016, p. 6), which provides monthly mean fire radiative power at the centre of a 1 km pixel. To identify the main areas of combustion, the accumulated fire counts are calculated each month with the confidence greater than or equal to nominal for each pixel, and then areas with the fire count >500 are considered the main burning areas. The land cover data are taken from the MODIS version 6, which provides annual land cover types derived from six different classification schemes (Sulla-Menashe et al., 2019). Here we use the Land Cover Type 3 product with the annual leaf area index (LAI) classification, to show the land cover types on the African continent. The normalized difference moisture index (NDMI) is used to determine vegetation moisture content. It is derived from the Landsat 8 Operational Land Imager (OLI)/Thermal Infrared Sensor (TIRS) surface reflectance (Wilson and Sader, 2002), and can be used to monitor fuel levels in fire-prone areas. NDMI values range from −1 to 1, with −1 representing bare soil (low moisture content) and 1 representing total canopy cover, no plant water stress (high moisture content).
2.4 Meteorological data
The monthly averaged surface wind, low-level cloud fraction, and total precipitation data are from the ECMWF ERA5 reanalysis dataset, which is the fifth-generation reanalysis for the global climate and weather (Hersbach et al., 2020). The data are at 0.25∘ × 0.25∘ resolution. The surface wind anomalies are calculated using the monthly deviations from the averages during the BB season (June–October) in 2016 and 2017 combined.
2.5 Trajectories and PSCF analysis
The Hybrid Single-Particle Lagrangian Integrated Trajectory (HYSPLIT) model (Stein et al., 2015) is used to generate 7 d back trajectories. Trajectories are initiated from the coordinate of the sampling location, but at altitudes of 500 and 2000 m, using the Global Data Assimilation System (GDAS) database with 1∘ spatial resolution. One trajectory is generated per hour during the entire BB season in 2016 and 2017. However, airmass trajectories based on HYSPLIT only reflect the large-scale subsidence and cannot capture entrainment, which has a significant contribution to the BB aerosols observed on the ASI (Diamond et al., 2018). Backward trajectories initiated from ASI at an altitude of 500 m are largely distributed over the clean oceanic region in the southeast throughout the BB season and rarely touch the African continent (Fig. S2). Therefore, we only present the trajectories in the free troposphere (initiated at 2000 m) to show potential BB aerosol transport paths prior to entrainment.
The potential source contribution function (PSCF) (Polissar et al., 2001) is widely used to identify the probable location of the emission sources and pathways that affect the receptor site (Koçak et al., 2009; Karaca et al., 2009). We calculate the PSCF with > and ≤ 0.0034, respectively. This threshold is taken as a proxy that represents the different combustion conditions and is discussed in detail in Sect. 4.1. The PSCF in the sub-region ij at each category X is given by the following equation:
where is the number of segment trajectory endpoints in the ijth cell at a certain category X of (> or ≤ 0.0034), and nij is the total number of air masses falling into the ijth cell. The value of the PSCF represents a conditional probability where a specific type of (> or ≤ 0.0034) is related to the passage of the air parcel through the ijth cell. High PSCF cells indicate areas of high potential contributions to the selected , and the trajectories passing over these cells contribute to the major transport pathways at the receptor site. To reduce the uncertainty of PSCF resulting from small nij, an arbitrary weight function Wij is used to multiply by the PSCF, as introduced by Polissar et al. (2001):
where Avg is the average number of endpoints in each cell.
3.1 Monthly variation of optical properties of BB aerosols
Zuidema et al. (2018b) described the seasonal variation of SSA on ASI, and we also show this variation in Fig. 1 to facilitate illustration and comparison. The increase in aerosol absorption coefficients observed on ASI from June to August indicates an increase in BC loading. This most likely reflects an increase in burning, which has a climatological peak in August (Scholes et al., 1996). Upper-level zonal winds are still weak in June and July, and are strongest in September and October (Adebiyi and Zuidema, 2016). During August, the developing heat low over land strengthens the free-tropospheric zonal winds, with a maximum at approximately 700 hPa (Ryoo et al., 2021). This will facilitate the transport of aerosol to the Ascension boundary layer, in addition to the increased burning (see example in Zuidema et al., 2018b). From August to September–October, the aerosol absorption coefficient decreases, in contrast to the continued strengthening of the easterly jet. This may occur in part because the strongest zonal winds are now at a higher altitude (∼ 600 hPa), discouraging entrainment of the aerosol into the boundary layer. The burning on land also diminishes swiftly in October as moist convection moves southward, generating less available aerosol for transport (Ryoo et al., 2021; Adebiyi et al., 2015). SSA and absorption show opposite trends, i.e. from June to August, the aerosol absorption coefficient increases while SSA decreases, and from September to October, it shows the opposite variation. This indicates an increase in the proportion of absorbing aerosols from June to August, which leads to an increase in the aerosol absorption coefficient and a decrease in SSA, and a decrease in the proportion of absorbing aerosols from September to October. As BC is the primary absorbing aerosol, this suggests a variable proportion of BC observed on ASI during BB, signifying potential differences in BB plume for each month. The average SSA during the BB seasons is 0.81 at 529 nm wavelength, with the highest mean ∼ 0.85 in October and the lowest ∼ 0.78 in August. Such low values indicate the presence of pronounced absorption aerosol within the marine boundary layer in the south-eastern Atlantic. MACBC has a similar monthly pattern to SSA, which is particularly noticeable in 2016. This suggests that during the BB season, SSA and MACBC are lower when the proportion of BC in the plume is higher, which can be explained by the change in the coating thickness of BC particles. As more BC aerosols are present in the plume, they compete for condensable material, resulting in a smaller average coating thickness on BC particles, leading to a decrease in SSA and MACBC. The mean MACBC during the BB season in 2016 is 15.4 at 529 nm, with the highest monthly mean values of 19.1 in October and the lowest of 12.9 in August.
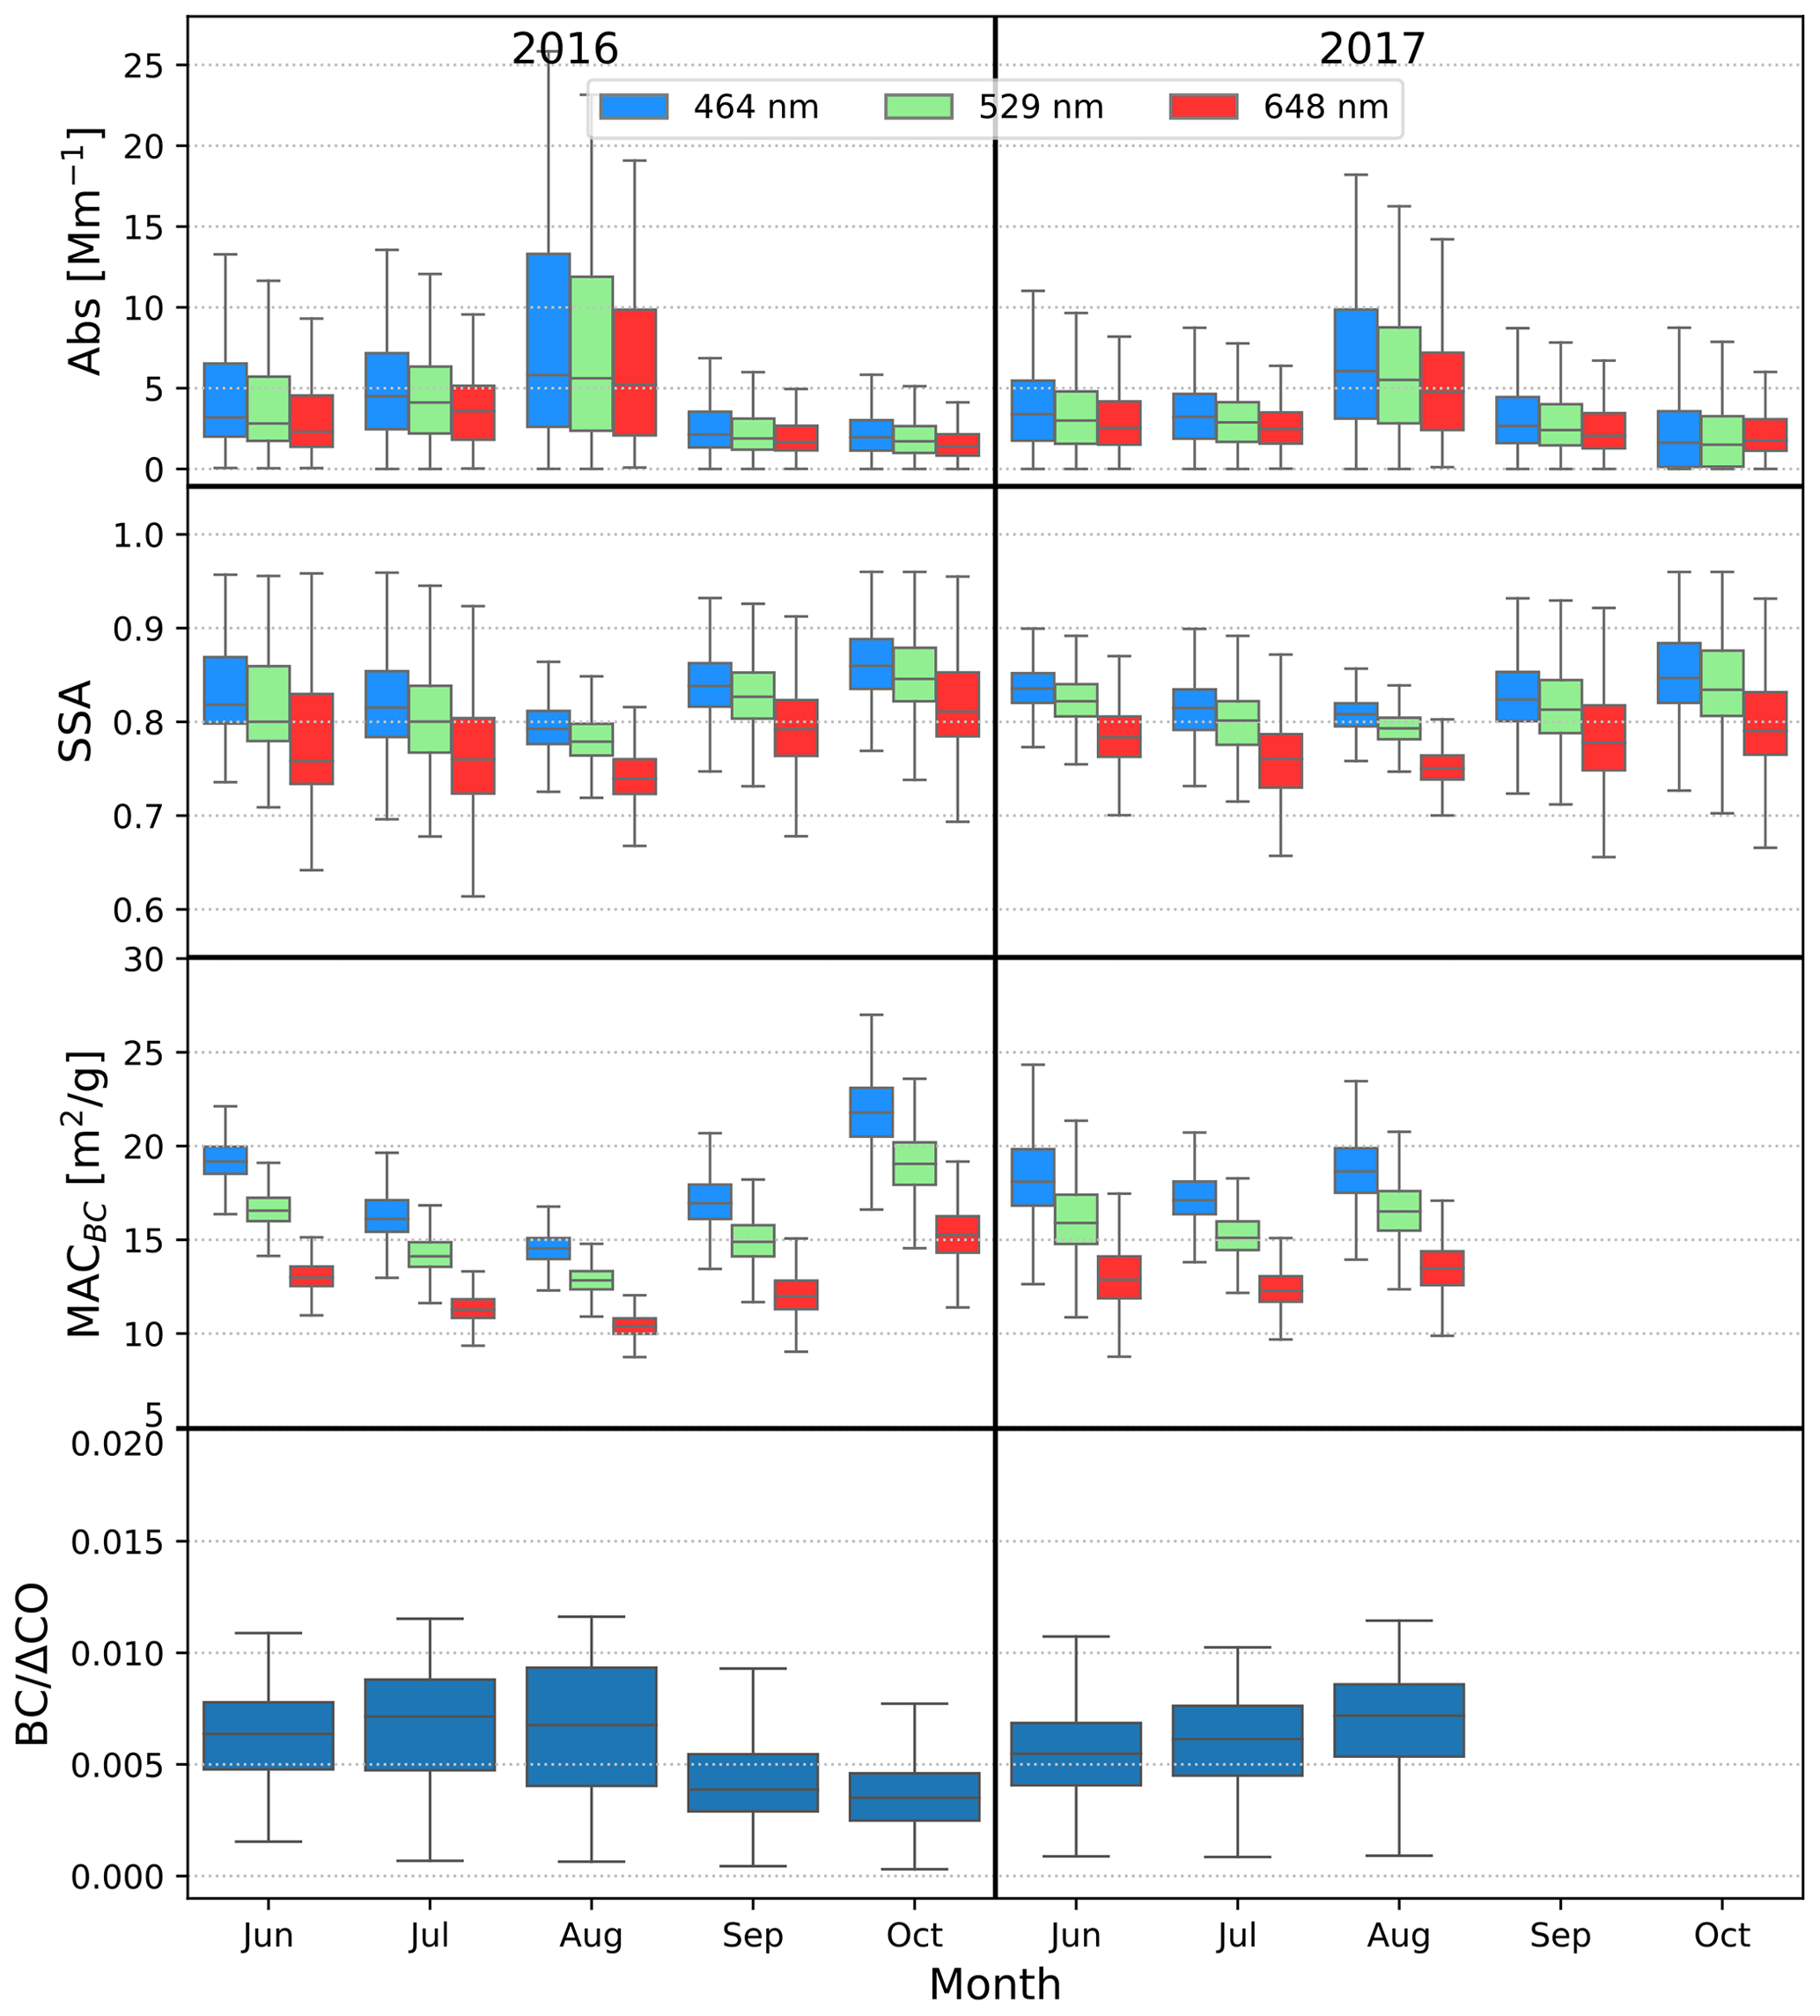
Figure 1Monthly percentiles (10 %, 25 %, 50 %, 75 %, and 90 %) of aerosol absorption coefficient, SSA, MACBC, and as box–whisker plots spanning the fire season in 2016 and 2017. The light blue, green and red colours of absorption, SSA, and MACBC indicate observations at wavelengths of 464, 529, and 648 nm, respectively.
The absorption enhancement Eabs is illustrated in Fig. 2. As Eabs is derived based on MACBC, it has the same trend as MACBC. Eabs at 464 and 648 nm wavelengths shows large fluctuations when assuming the AAE of fresh uncoated BC in the range of 0.8–1.4; however, Eabs at 529 nm is less sensitive to the AAE of fresh BC. Therefore, Eabs at 529 nm will be discussed and compared with observations from other geographical areas. The Eabs values observed for ASI are higher than most of those observed in rural areas worldwide that are affected by BB (Xu et al., 2018), with some months averaging around 2.4. This finding is consistent with that of Denjean et al. (2020), who found that the absorption enhancement could reach 210 % in the SEA. The averaged Eabs at 529 nm wavelength is 1.96 in 2016 and 2.07 in 2017. Taylor et al. (2020) found an average Eabs of 1.85 around ASI (campaign average, including boundary layer and free troposphere), following the airborne measurements during CLARIFY, while they also showed the MACBC is higher in the marine boundary layer than in the free troposphere, supporting our finding of such high Eabs on ASI. Zuidema et al. (2018b) reported the July–September averaged MACBC measured in 2016 on ASI as 13.3 m2 g−1 at 529 nm, which corresponds to Eabs as 1.71. The relatively low value they observed is due to the lower enhancement between July and September, with August having the lowest average Eabs of around 1.64.

Figure 2Monthly percentiles (10 %, 25 %, 50 %, 75 %, and 90 %) of absorption enhancement Eabs, AAE (between 464 and 648 nm), and calculated BrC contribution to total absorption at 464 nm as box–whisker plots spanning the fire season in 2016 and 2017. Eabs is calculated by assuming an AAE of 1 for the fresh BC. The solid black lines in the upper panel indicate the upper and lower boundary of the calculated median Eabs when the AAE is in the range of 0.8–1.4.
The high value of MACBC and Eabs observed on ASI may be attributed to two factors: the high concentration of other absorbing aerosols, such as BrC and dust, or thickly coated BC particles. Figure 2 shows the evaluated contribution from BrC on total absorption at 464 nm is generally around 1 %–2 %, suggesting BrC has a minimal influence on the aerosol absorption measured on ASI. Zhang et al. (2022) found around ∼ 10 % of BrC at 470 nm near the African continent, while Taylor et al. (2020) found ∼ 10 % BrC at a much lower wavelength (405 nm) in the free troposphere near ASI. In contrast to these measurements in the free troposphere, our observed BB plumes are generally considered to have experienced cloud processing, which could further reduce the BrC content (Che et al., 2022a). In addition to considering the contribution to absorption from BrC, Fig. 3 shows the plausible existence of dust particles (Fe bearing) as a contributor to the observed absorption, based on single-particle filter analysis by TEM-EDX (Dang et al., 2021) sampled close to ASI. Fe-bearing particles are suspected of contributing to this large Eabs, since Fe oxides, such as magnetite, have strong and uniform absorption at visible wavelengths (Zhang et al., 2015), which could lead to a high MACBC and an AAE around 1, consistent with our measured AAE (Fig. 2). However, only two samples were collected in the marine boundary layer near ASI, and only one sample includes aerosols from the BB, while the other shows clean sea salt aerosols. For the sample with BB aerosols, out of 50 sampled particles, 11 included Fe. Although this can prove the presence of Fe-bearing aerosols on ASI, the limitations of the sample numbers make it difficult to estimate the proportion of Fe-bearing aerosols and whether they contribute significantly to the observed Eabs. Zhang et al. (2022) noticed a small contribution of Fe-bearing aerosols in the absorption based on an optical closure study with filter samples from the ORACLES aircraft campaign (ObseRvations of Aerosols above CLouds and their intEractionS) near the African continent. However, even considering that a 10 % absorption contribution is from dust, the upper limit, according to their conclusions, is still not enough to explain the high value of Eabs we observed on ASI. Therefore, the high Eabs from ASI is most likely caused by the thickly coated BC particles, i.e. the lensing effect, consistent with the findings of Denjean et al. (2020).
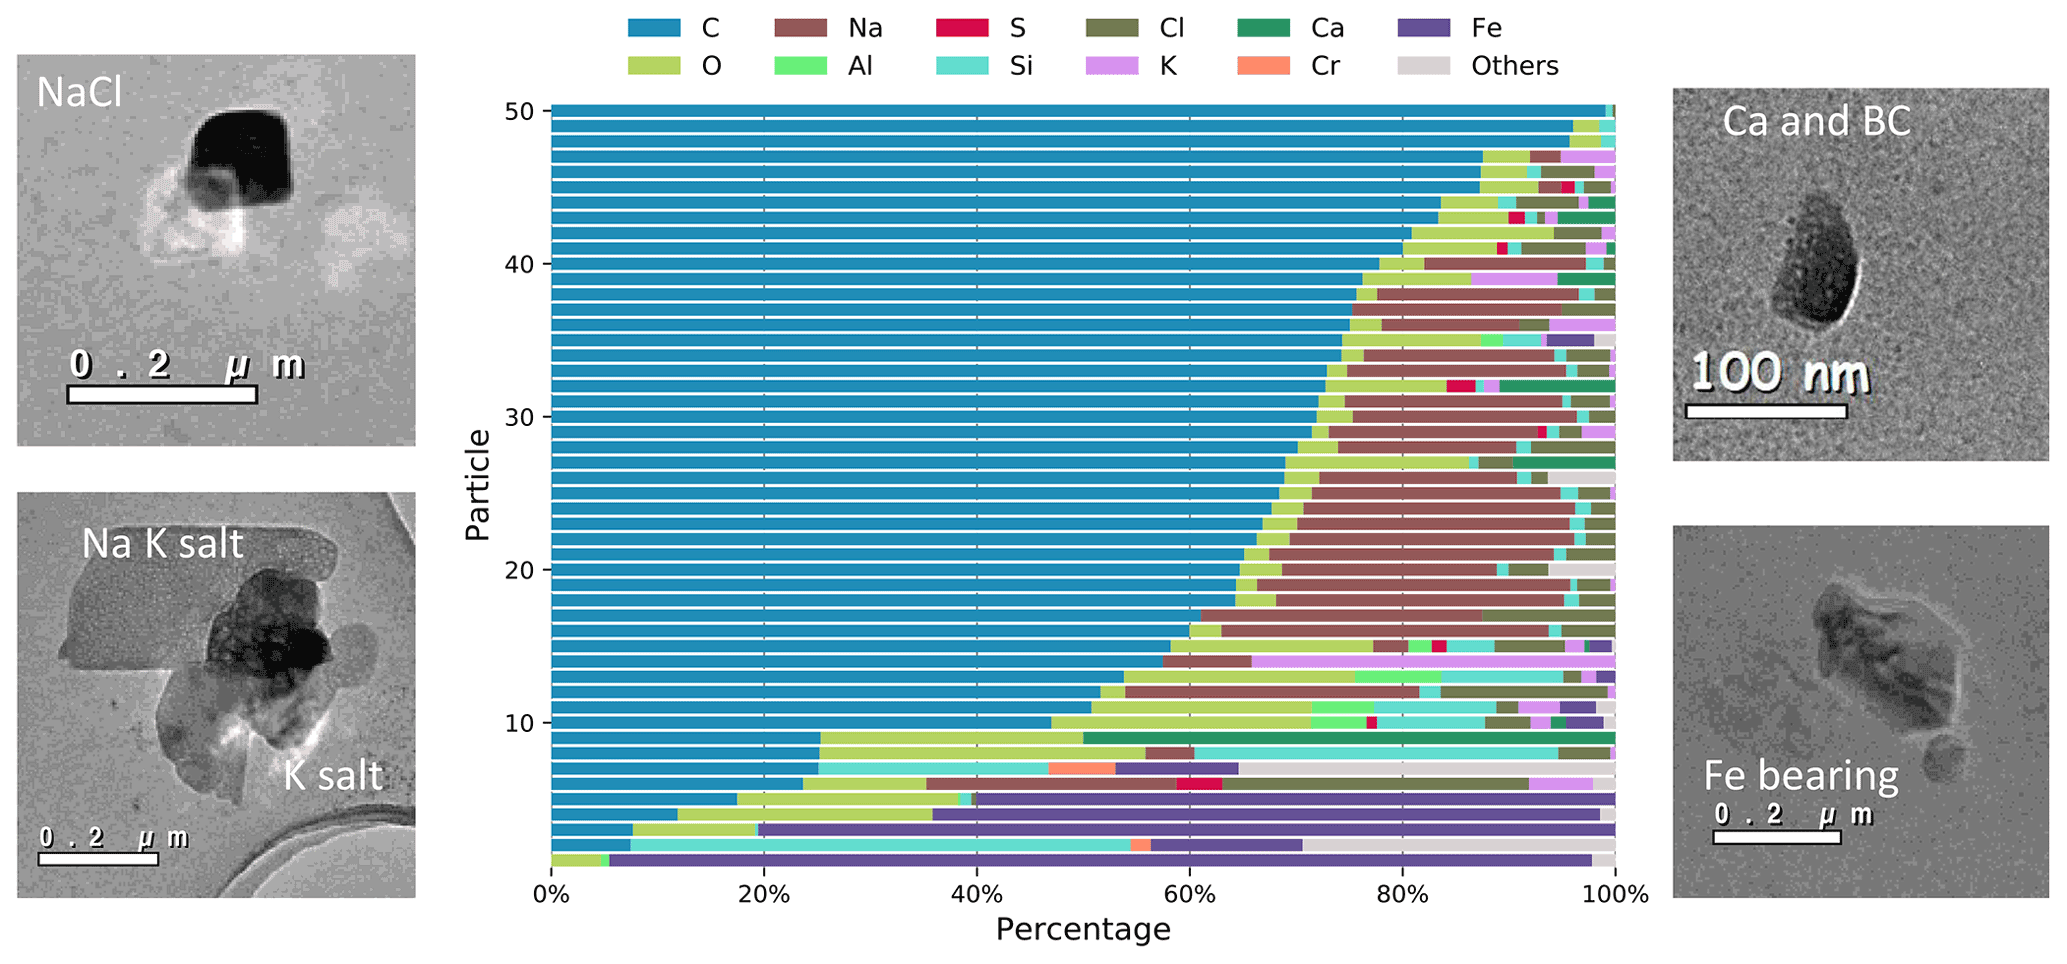
Figure 3Elemental composition (mass percentage) and representative microphysical images of particles from TEM-EDX analysis for the collected sample (sampled on 24 August 2017 09:43–09:49 UTC, at 319.4 m) near ASI.
After emission, BC particles can acquire additional coatings with age through deposition of semivolatile atmospheric species or coagulation with pre-existing particles, resulting in enhanced absorption of sunlight. As the African smoke engulfing ASI is aged for several days (Taylor et al., 2020), it is reasonable to expect the BC particles to have a thick coating. Previous studies have shown that BC particles encapsulated in a core-shell configuration display substantial Eabs (Adachi et al., 2010; Zhang et al., 2017), with values depending strongly on the ratio of coating materials to BC (Cappa et al., 2019; Peng et al., 2016; Liu et al., 2015; Xie et al., 2019; Cross et al., 2010). Chakrabarty and Heinson (2018) further proposed a power-law function to characterize the relation of Eabs and mass ratio of coated particle to BC core (). By applying this relation to our data, we estimate an average of ∼ 7.5 in 2016 and ∼ 8.8 in 2017 during the BB season, suggesting that, on average, the mass of coated materials is ∼ 6.5 and ∼ 7.8 times higher than BC cores during those 2 years. Zhang et al. (2017) theoretically investigated the effect of BC microphysical properties on Eabs using the multiple-sphere T-matrix method. According to their results, we estimate the shell–core ratio (spherical equivalent particle diameter divided by BC core diameter) is ∼ 2.2 on average, suggesting that the coating thickness is 1.2 times the BC core radius. This result is consistent with that of Taylor et al. (2020), who found the shell–core ratio of BC particles to be around 2.3 in the marine boundary layer from the CLARIFY aircraft campaign.
In addition to thick coating, there are other factors that can result in high Eabs, such as the particle morphology (i.e. the physical arrangement of BC with respect to other components within a given particle) and different refractive indices of BC (Zhang et al., 2017). If the particle has an off-centre core–shell structure (BC core is partially encapsulated or attached to the edge of its shell), then the Eabs would be small or close to 1, suggesting the ageing has a minimal effect on absorption with such structures (Cappa et al., 2019). Furthermore, with the increase of the shell–core ratio, the Eabs even decreases for those off-centre core–shell particles (Zhang et al., 2017). Instead, for particles with concentric core–shell structures (BC core located at coating centre), Eabs increases substantially with the coating thickness. Therefore, our results may suggest most of the BC particles on ASI have concentric core–shell structures. The higher refractive index of BC can also lead to larger calculated Eabs, which may be another reason behind the high Eabs observed on ASI. However, the impact of the refractive index on Eabs is relatively small and within 4 % (Zhang et al., 2017). Therefore, we speculate that most of the BC aerosols observed on ASI have a very thick coating and are concentrically structured, consistent with the finding from CLARIFY aircraft observations (Taylor et al., 2016). As most climate models use a fixed value of Eabs∼1.5 (Wang et al., 2014), our results suggest that the absorption in the south-eastern Atlantic may be significantly underestimated.
3.2 and aerosol optical properties
The lowest panel in Fig. 1 shows the monthly variation of the enhanced ratio of BC to CO (, detailed in Methods). increases from June to August and decreases in the following 2 months in both 2016 and 2017, showing an opposite trend to that of SSA, MACBC, and even AAE and Eabs in Fig. 2. As can indicate the emission conditions near the fire source, this finding may suggest the seasonal variation of aerosol properties observed on ASI may be driven by the burning conditions of African fires. However, since ASI is several days away from the burning locations in terms of plume transport, atmospheric ageing can also affect the observed . A more detailed analysis of and the factors behind its variation is presented in the following section. Here we investigate in detail the relationship between and BB aerosol optical properties shown in Fig. 1.
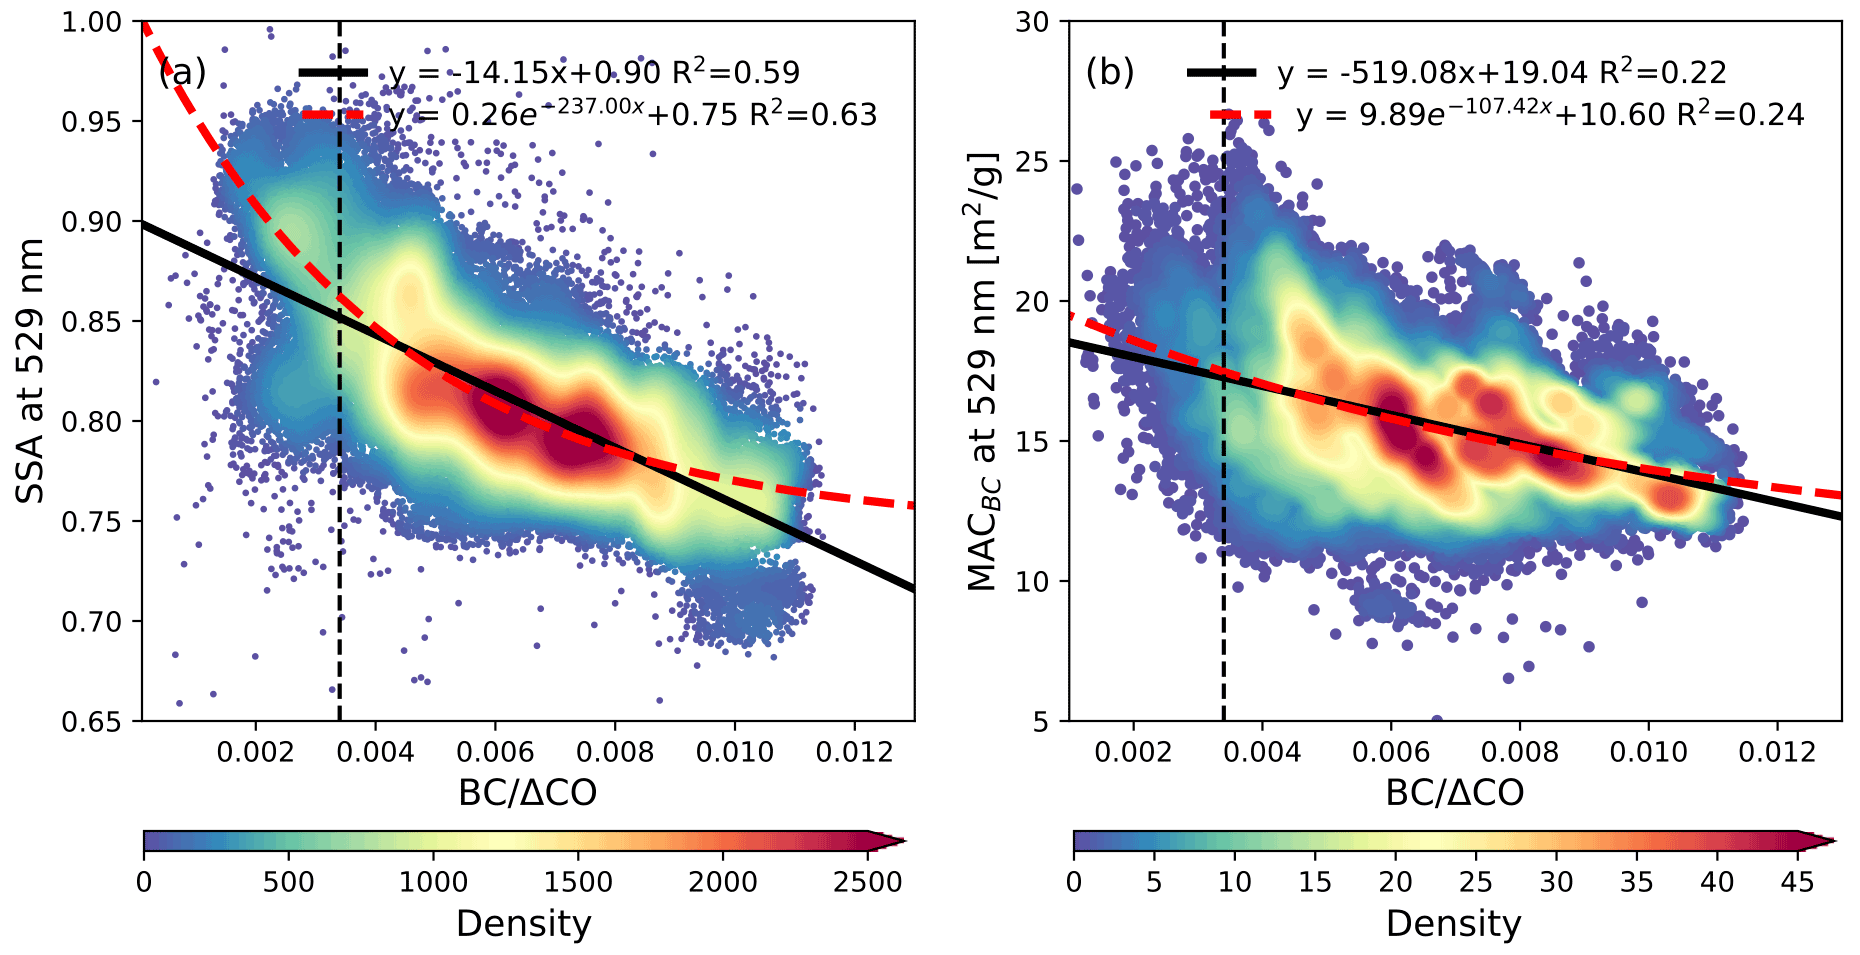
Figure 4Relations of with (a) SSA and (b) MACBC at 529 nm wavelength. The solid black lines represent the linear regressions, and the dashed red lines are the curve fitting with the function displayed in the legend. The colour scale indicates the density of the data in each plot. The vertical dashed black lines in each plot correspond to = 0.0034.
The relationships between and SSA and MACBC at 529 nm wavelength are exhibited in Fig. 4, where the colour scale indicates the density of the data. Overall, there is a tendency for both SSA and MACBC to decrease with the increase in . The decrease of SSA with is more dramatic when is smaller than 0.0034 (left side of the dashed black line). Since higher represents a larger fraction of BC emitted from the combustion (which suggests that combustion becomes more flaming), the trend of decreasing SSA and MACBC with increasing indicates that a higher fraction of flaming combustion can result in a lower SSA and MACBC. This may be due to flaming fires producing more BC particles, which can directly lower the SSA. By contrast, smouldering combustion is characterized by a higher concentration of scattering OA, and therefore a higher SSA. The magnitude of the MACBC depends mainly on the shell–core ratio of BB aerosols, as discussed in the previous section. Microscopy observations have suggested that smouldering-dominated combustion can result in a smaller BC core and thicker coating (Adler et al., 2010; Wang et al., 2017), since smouldering combustion has higher gas-phase organic compound emissions (Yokelson et al., 2009) and can result in a higher SOA formation ratio (Vakkari et al., 2018). Consequently, the shell–core ratio of BC particles is higher in smouldering fires, leading to a higher MACBC. While for flaming fires, a higher number of BC particles compete for coating materials, resulting in a reduction in the average coating thickness on BC aerosols and thus a reduction in MACBC.
In Fig. 4, SSA and MACBC are approximated by linear and exponential functions with , respectively (fitted black and red lines). Despite the scattered SSA and MACBC values, the fitted lines are able to represent the denser data well. The exponential function can represent the relationship between SSA and better than the linear regression with a higher R2 value, especially when < 0.0034, where a rapid increase of SSA is observed as decreases. However, MACBC values are highly scattered when is small (less than 0.04), and thus for MACBC the differences in linearity and curve fittings are not significant. The scatter of MACBC is mainly related to the BC measurements, as MACBC calculated from the absorption and BC mass ratio has a large uncertainty when the BC content is small. Nevertheless, these functions provide us with a simple way to estimate the parameters of the aerosol optical characteristics in the south-eastern Atlantic, and can help to improve the parameterizations used in climate models.
Since shows a good linear relationship with the optical properties of aerosols observed on ASI, factors that affect the value of are examined in this section. The potential drivers of the variation of aerosol optical properties during BB seasons are also discussed. The magnitude of depends primarily on two factors, one being the condition of the combustion, and the other being the scavenging of aerosols during the transport of the plume. Here we discuss the relation between and burning conditions in Sect. 4.1, and explore the reasons behind the monthly variation of in Sects. 4.2 and 4.3. In Sect. 4.2, we mainly discuss the variation in aerosol scavenging, and in Sect. 4.3, we focus on the burning conditions and the factors behind their monthly variation.
4.1 and burning conditions
As discussed earlier, is related to the combustion conditions of the fire. The combustion phase of biomass, i.e. flaming, smouldering, and pyrolysis, is commonly represented by the modified combustion efficiency (MCE). Higher MCE indicates a larger fraction of flaming combustion, and when MCE equals 0.9, it means that the combustion is about half flaming and half smouldering (Akagi et al., 2011). However, calculation of the MCE requires the determination of the background concentrations of CO and CO2, which will introduce uncertainties, especially in aged plumes. can also represent the burning condition, and it was proved to be more reliable than MCE for combustion characterization in diluted plumes by Vakkari et al. (2018), who investigated the secondary organic formation in aged plumes in Africa.
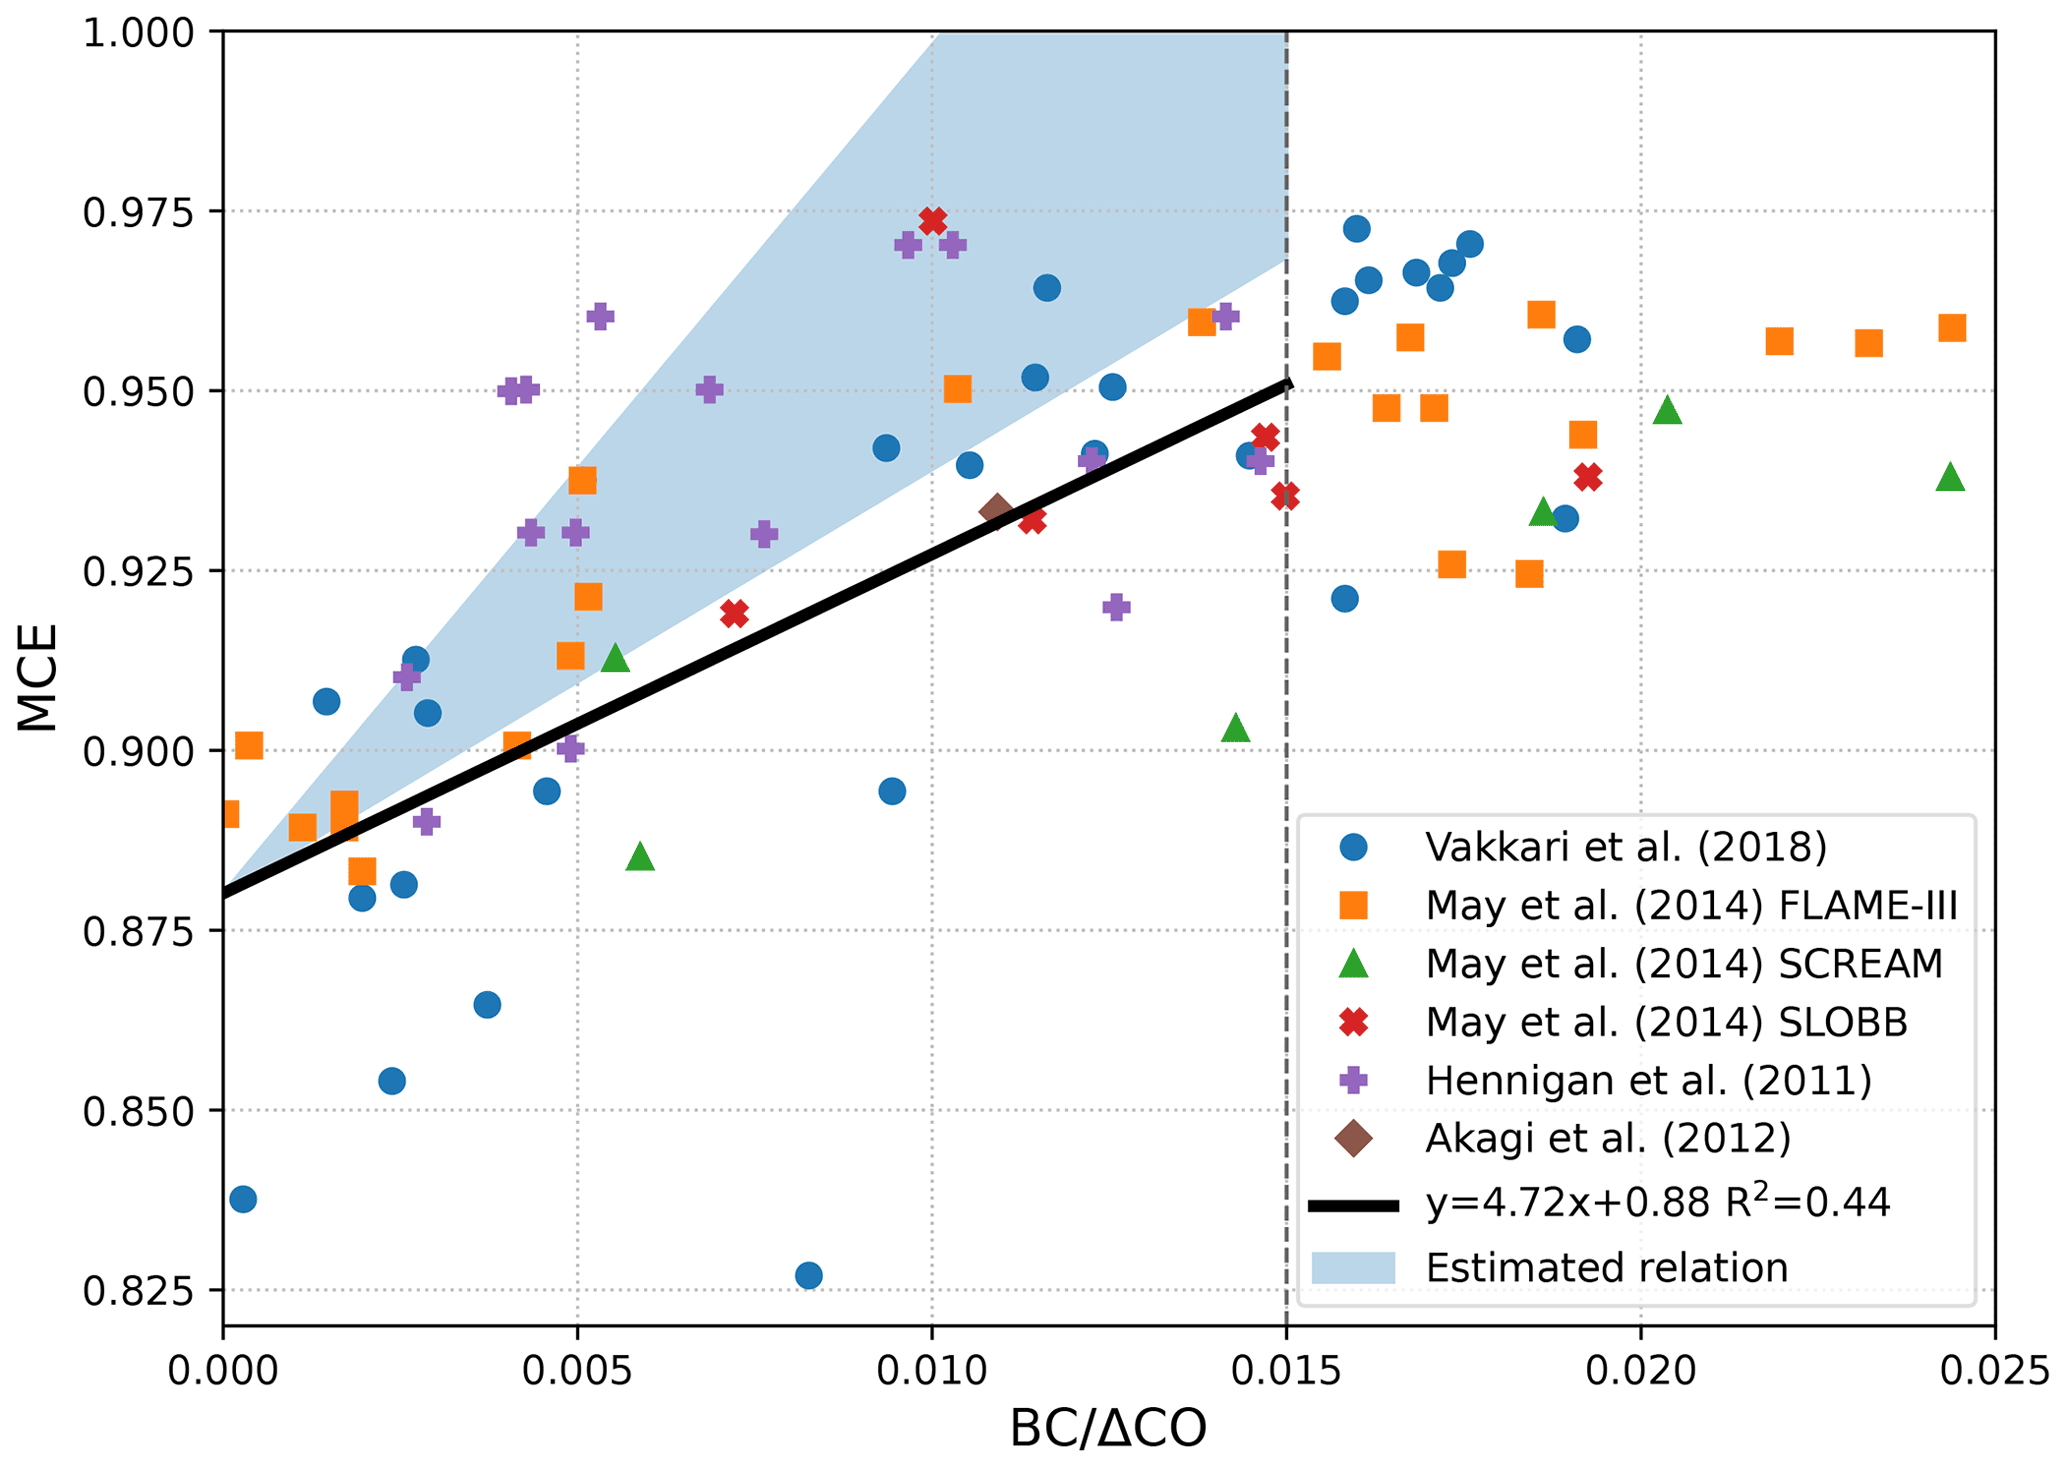
Figure 5Summary of and the corresponding modified combustion efficiency (MCE) from the literature for fresh fires (age < 0.5 h). The solid black line is the linear regression of and MCE values from various investigations (Hennigan et al., 2011; May et al., 2014; Vakkari et al., 2018; Akagi et al., 2012) for < 0.015, and the shaded blue areas indicate the estimated zones for BB aerosol with cloud processing based on Che et al. (2022a).
The relationship between MCE and is clearer for fresh plumes (Vakkari et al., 2018). Figure 5 shows the relation of MCE and for near-source BB plume (age < 0.5 h) from the literature. From the figure, it is shown that MCE increases with , indicating that the higher represents the higher fraction of flaming combustion. However, the relationship between and MCE is not linear across the entire range, as suggested by May et al. (2014), where the growth of MCE becomes much slower for greater than 0.015. Vakkari et al. (2018) found that when is smaller than 0.015, MCE shows a clear near-linear relation with the . Therefore, in the figure, we fitted (solid black line) the available observational data for values less than 0.015. The result shows a reasonable linear relationship between MCE and , with the R2 value = 0.44. Therefore, this result suggests that with the increasing fraction of flaming combustion, also increases. The relationship of MCE with therefore suggests that one of the major factors contributing to the variation in the observed is the change in combustion state from the BB region. Based on this fitted line, we estimate that is around 0.004 when MCE = 0.9. This means for fresh plumes with > 0.004, the burning is dominated by flaming combustion, while when < 0.004, the burning is mainly smouldering. Considering that the plume reaching ASI undergoes atmospheric ageing and scavenging processes for about 1 week, the value of we observed should be lower than the fresh ones. Therefore, our observed corresponding to MCE = 0.9 should be less than 0.004. Owing to the absence of CO2 observations on ASI, we are unable to directly compare the observed with MCE; however, when > 0.004, the plume is likely to be all from flaming combustion.
Since BB aerosols are transported above clouds, the BB aerosols observed on ASI may have undergone cloud removal as they enter the boundary layer. In a previous study (Che et al., 2022a), we found that cloud processing is responsible for ∼ 20 % to ∼ 80 % of the reduction of aerosol mass with the transport of the plume from the African continent, depending on the cloud liquid content and the residence time of the BB aerosol in the cloud layer. Assuming that all BB aerosols observed on the ASI undergo cloud processing and assuming that the cloud processing removes 20 %–80 % of the aerosols, then the linear relationship for our observed and MCE would lie in the shaded blue interval in Fig. 5a. The upper and lower boundaries of the shaded area represent the relationship between and MCE for 20 % and 80 % of aerosol removal, respectively. As a result, our observed corresponding to an MCE equal to 0.9 ranges from 0.0017 to 0.0034. This finding is consistent with the relationship between and SSA, i.e. the rate at which SSA decreases with changes clearly for around 0.0034 (the dashed black line), potentially indicating a shift in combustion state, i.e. from smouldering to flaming. However, the estimated value of our measured corresponding to an MCE of 0.9 has large uncertainties. Our assumption is that all BB aerosols undergo cloud removals, but in reality, there will be BB aerosols that do not pass through the clouds, as the cloud cover is not 100 %, in which case the value corresponding to MCE = 0.9 will be higher than our estimated values, but should not exceed 0.004. However, with regard to the linear relationship between and MCE, the reason for the seasonal variation in , as shown in Fig. 1, may be that there is a change in combustion conditions in each month, i.e. from June to August there is an increase in the proportion of flaming combustion, while from September to October smouldering combustion increases. This finding is consistent with Fig. S3, which shows that burning with higher fire radiative power (FRP) declined in September and October.
4.2 Aerosol scavenging
Cloud processing and rain removal are the two main mechanisms for BB aerosol scavenging (Textor et al., 2006). The monthly variations of the mean low-level cloud fraction and precipitation are illustrated in Figs. 6 and 7. Using the location of ASI as a boundary, we placed a box in the upstream areas of the plume to roughly represent the main paths and areas of the plume transport, which are indicated by a grey box in both figures. The position of this box is approximately consistent with the backward trajectories of the plume (Fig. S2). The mean value inside the box is calculated to roughly to represent the average cloud cover and precipitation during the transport of the plume.
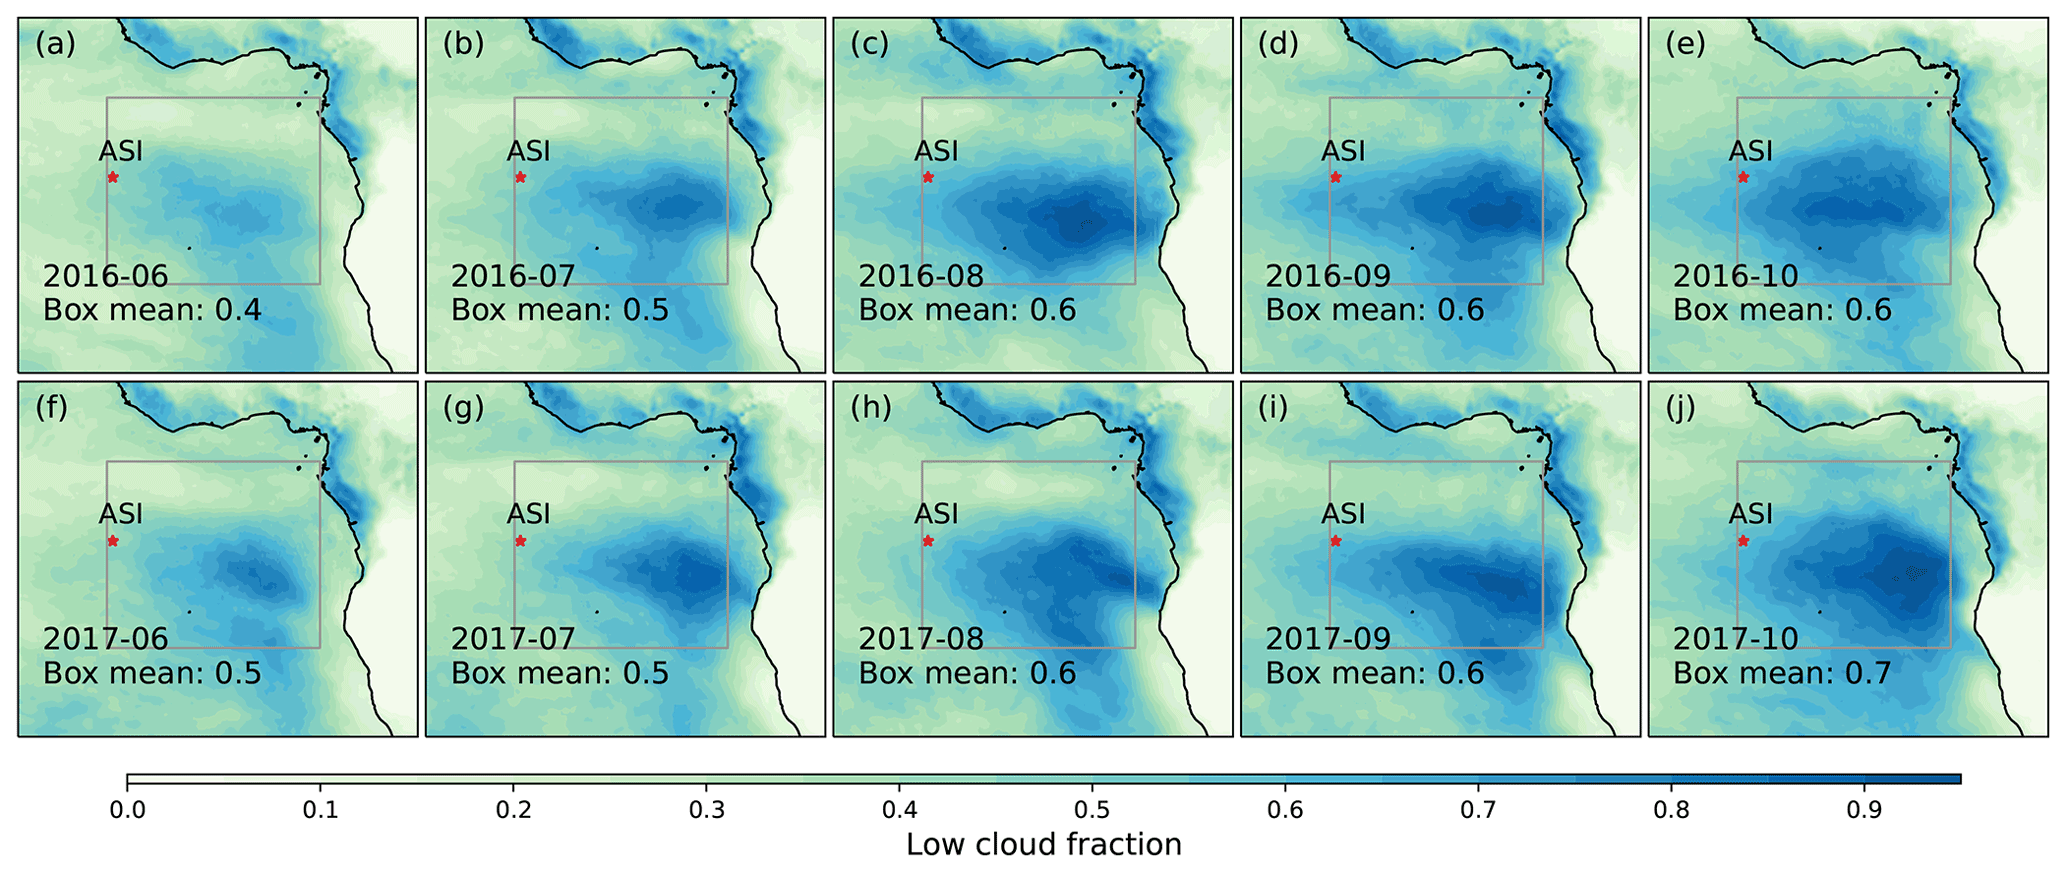
Figure 6Monthly mean low cloud fraction calculated from the ERA5 reanalysis data. The location of ASI is marked with the red star. The grey boxes represent the range of the main transport paths of BB aerosols observed on ASI. The box means are the mean cloud fractions calculated in the grey box region.
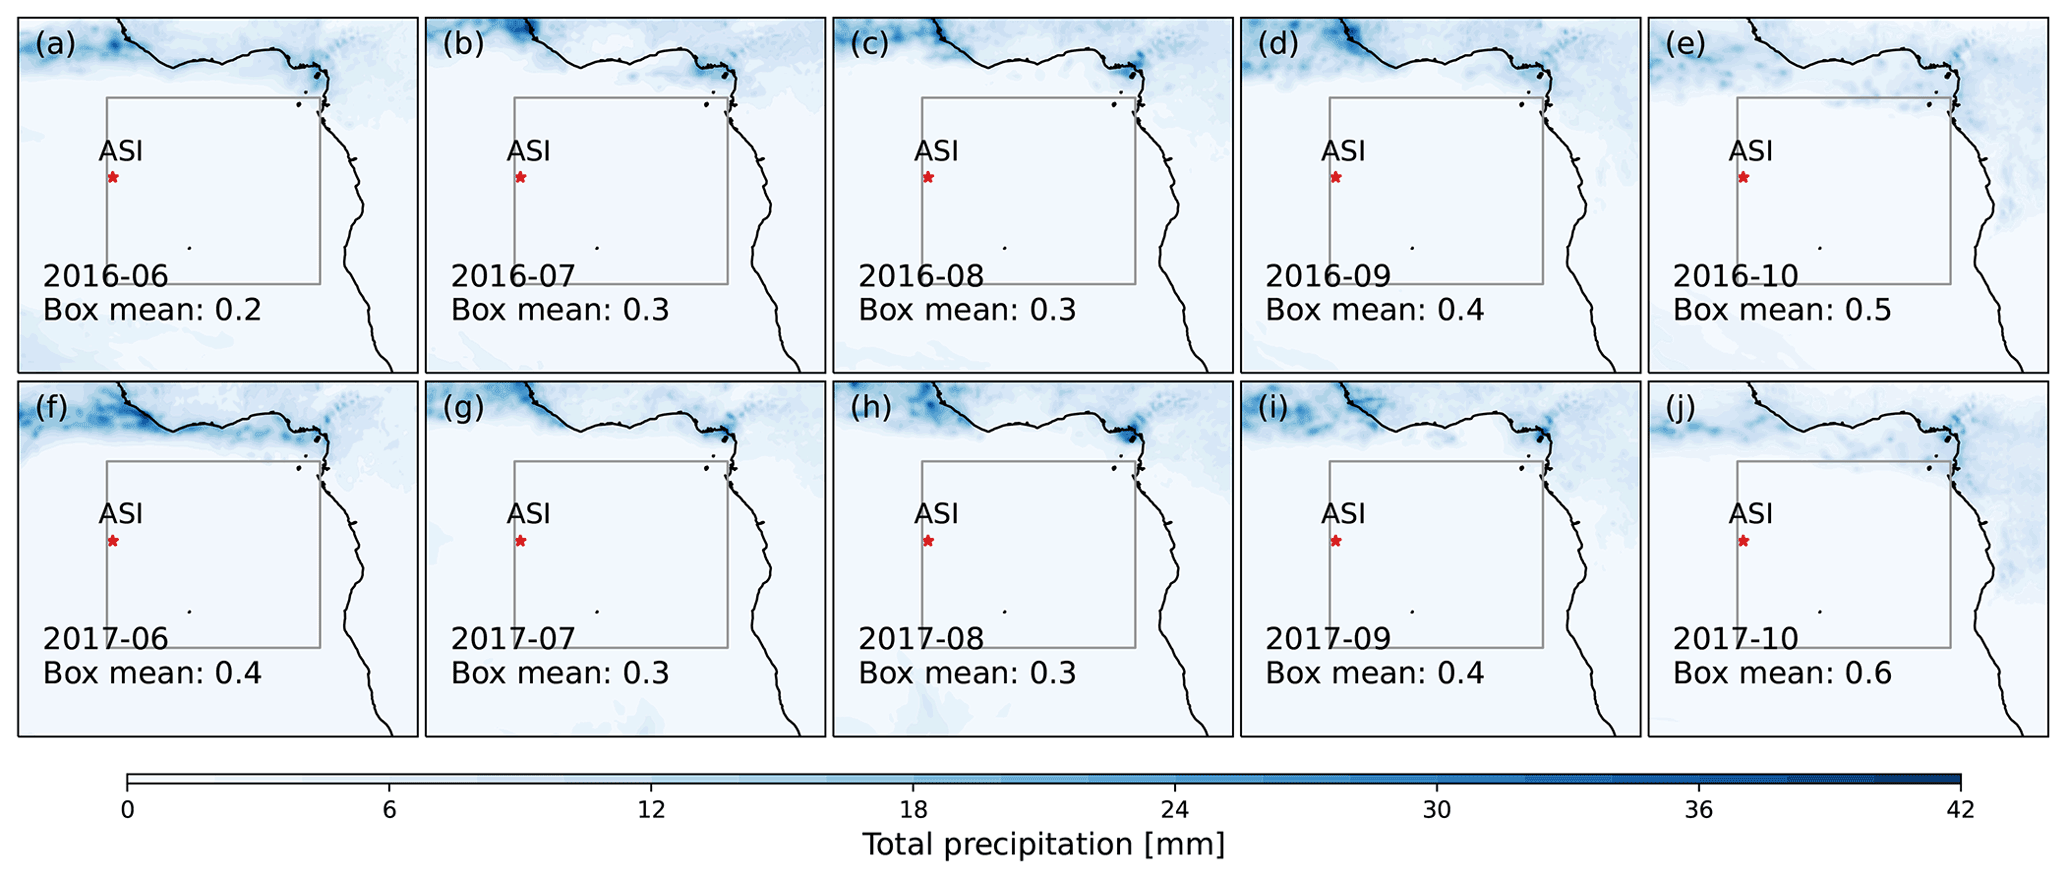
Figure 7Same analysis as in Fig. 6, but with precipitation.
From Fig. 6, it can be seen that in the plume transport region, the proportion of low clouds increases from June to August, indicating the increase of the probability of aerosols undergoing cloud processing, which could result in a decrease in from June to August. Mean precipitation in the grey box remains almost constant from June to August (Fig. 7), indicating that the contribution of rain removal mechanisms to the did not change during these months. Thus, aerosol scavenging should negatively affect from June to August, which is inconsistent with the observed increase in , suggesting that changes in combustion status may be the main reason for the increase in during these months. From August to October, the mean proportion of cloud cover within the grey box generally remained the same, suggesting that cloud processes may not have had much influence on the change in from August to October. However, the mean precipitation in the grey box increases from August to October, suggesting the potential increase of the rain removal of BB aerosols in these months, which can result in a decrease of , consistent with our observations. In general, the increase in from June to August is probably mainly due to changes in combustion conditions, and the effect of aerosol scavenging may not be significant. By contrast, from August to October, rain removal of BB aerosols may have increased, which may, in turn, have contributed to the reduction in during that period.
4.3 Changes in BB conditions
4.3.1 Changes in BB location and fuel types
The variation in burning location on the African continent is illustrated in the Supplement (Fig. S4). During the 2016 and 2017 BB seasons, there is also no significant change in BB locations for the same months, and the number of fires is similar. Therefore, we further compare the changes in fuel sources in different months using 2016 as an example, as shown in Fig. 8. The major burning sites in different months are defined as areas with a cumulative number of fires >500 for that month, and are illustrated in the black contour in the figure. In general, the main burning areas shift eastwards from June to October in 2016 and 2017. From June to August, the main burning areas gradually expanded. By contrast, the smallest burning areas are found in September and October, mainly in south-eastern Africa. For the fuel source, the results indicate that savannah burning is predominant in each month, while the proportion of burning in grasses and/or cereal is higher in September and October. Especially during October, major burning also occurs in the northern grassland areas. Different burning fuels may result in changes in combustion conditions, but their effect is not quantified in this work. The increased burning in grasses/cereal areas may suggest a source of fuel dependence on the observed decrease in in September and October. increases from June to August, but there is no significant change in the fuel source, which suggests that the change in combustion conditions during these periods is not caused by changes in fuel sources. However, more detailed studies will be required to further investigate the relation between fuel source and ratio, especially in terms of seasonal dependence.
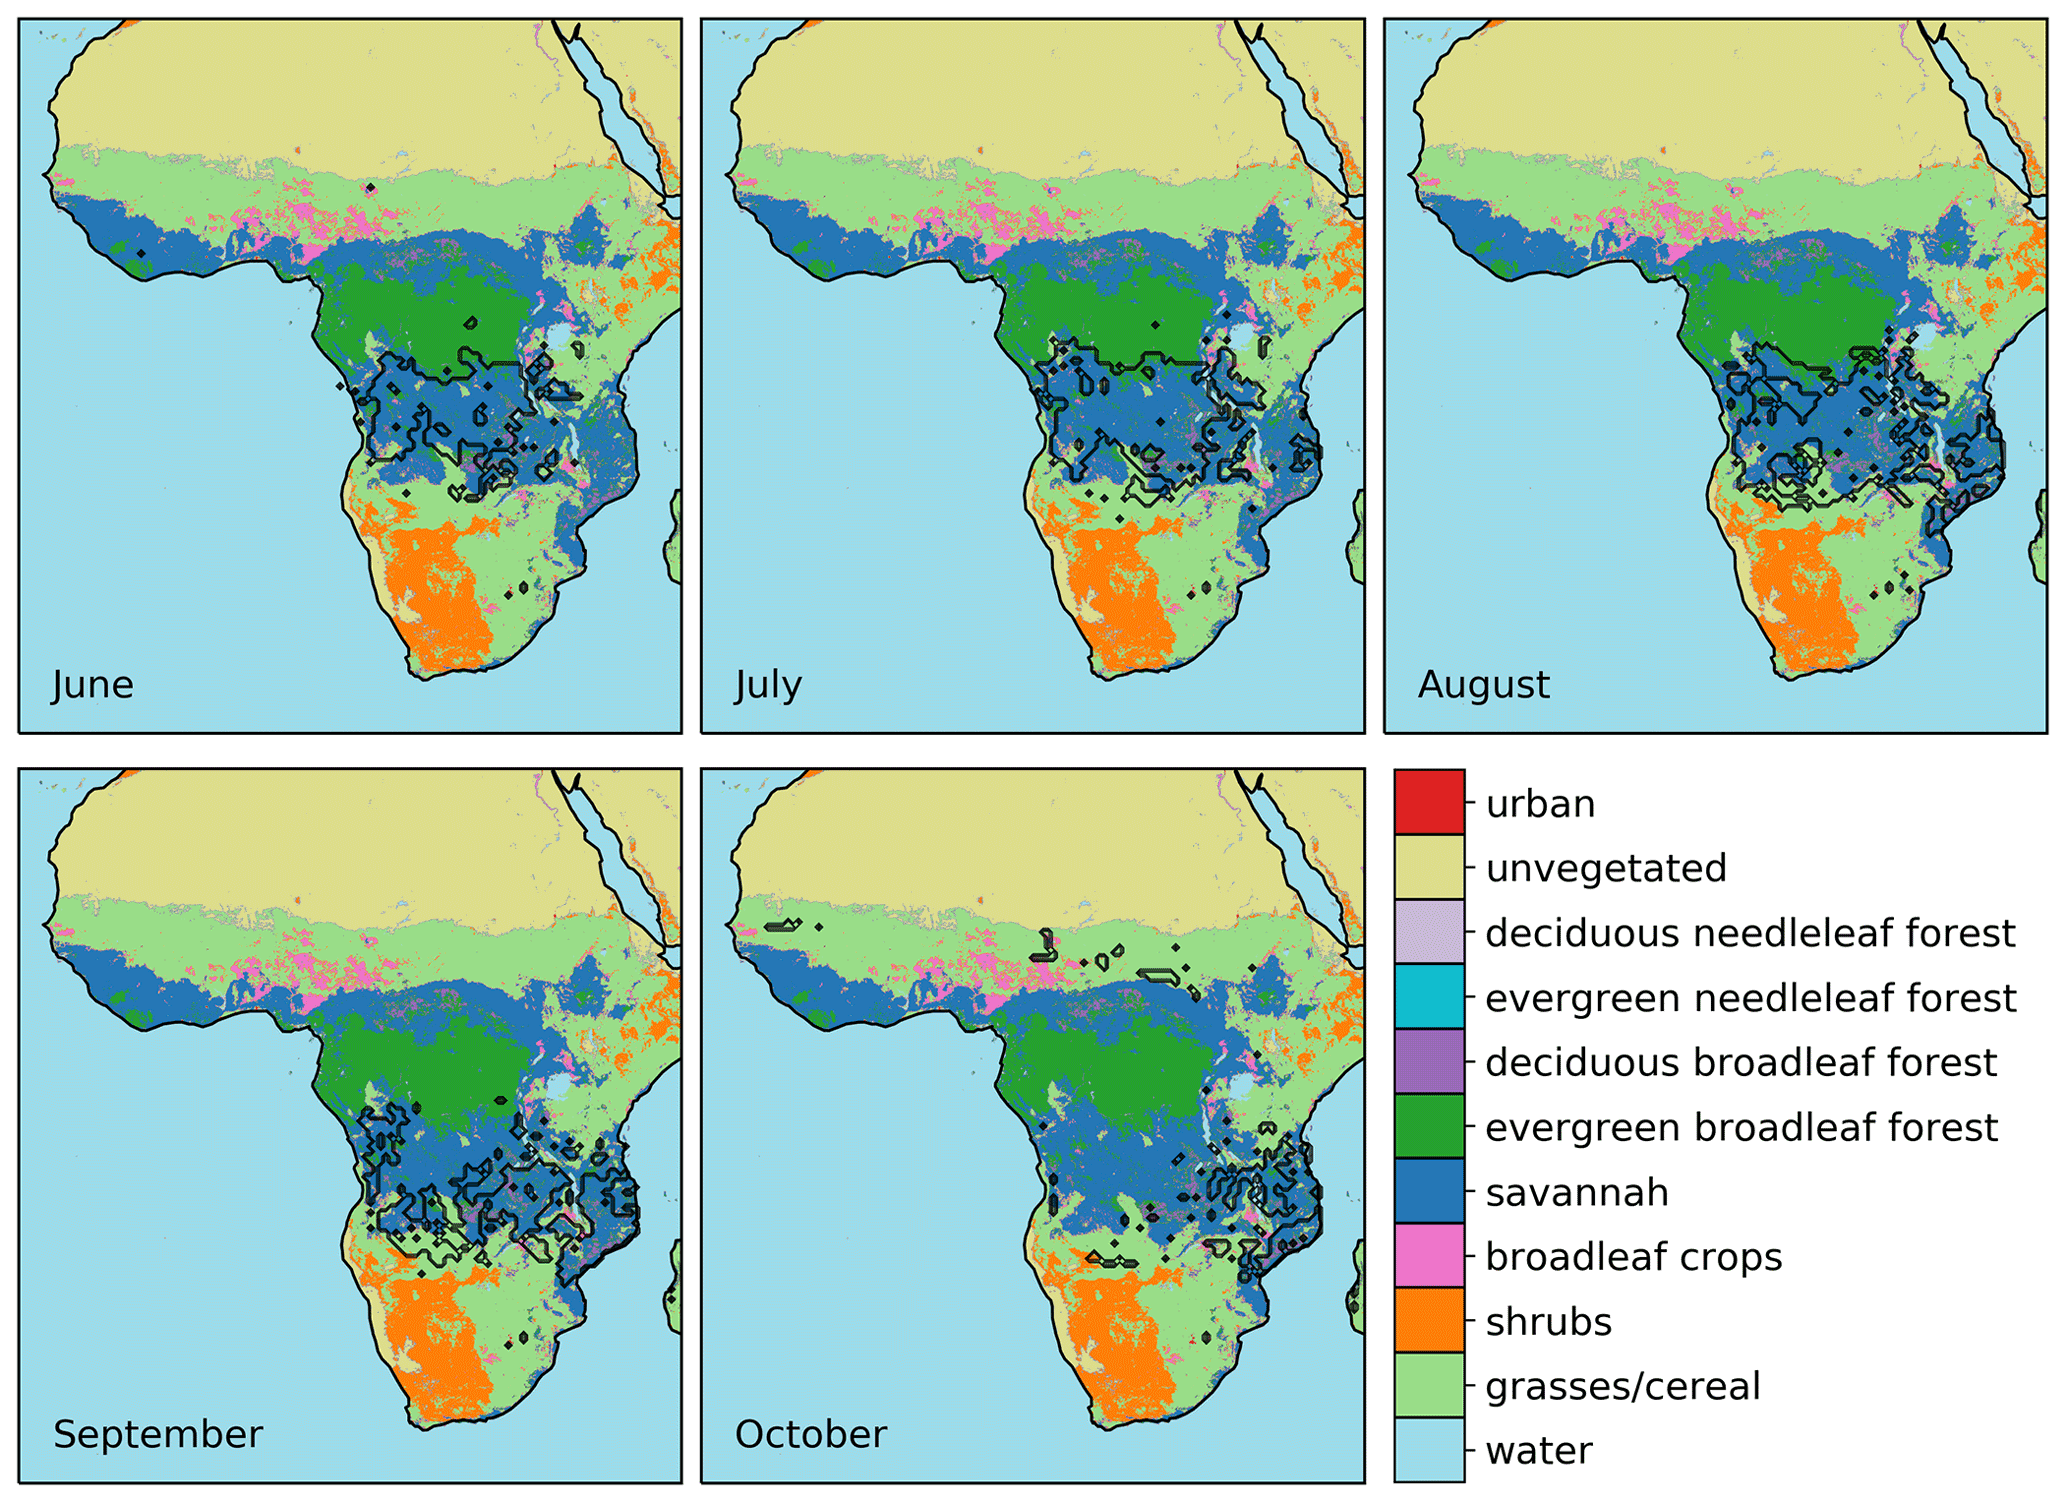
Figure 8Major burning locations and land covers during the BB season in 2016. The different colours on the land indicate different land types. Areas with an accumulated fire count greater than 500 are illustrated in the black contour each month. The land cover data are from the MODIS collection 6 product MCD12Q1 (https://doi.org/10.5067/MODIS/MCD12Q1.006, Friedl and Sulla-Menashe, 2019).
4.3.2 PSCF analysis of
The PSCF results derived from the 7 d backward trajectories initiated at an altitude of 2000 m at the sampling site during the African fire seasons are illustrated in Fig. 9. These trajectories represent the transport of air masses in the free troposphere. A similar analysis but for trajectories initiated at an altitude of 500 m is shown in Fig. S5. These boundary layer airflows generally exhibit a similar pattern for different months, i.e. southeasterlies advecting clean Southern Hemisphere air around the southern Atlantic subtropical anticyclone, as illustrated by Zuidema et al. (2018b). These findings suggest the BB aerosols observed on ASI mainly result from the entrainment of the free troposphere plumes. Therefore, back trajectories in the free troposphere are more relevant for the indication of the BB geographical source fuel.
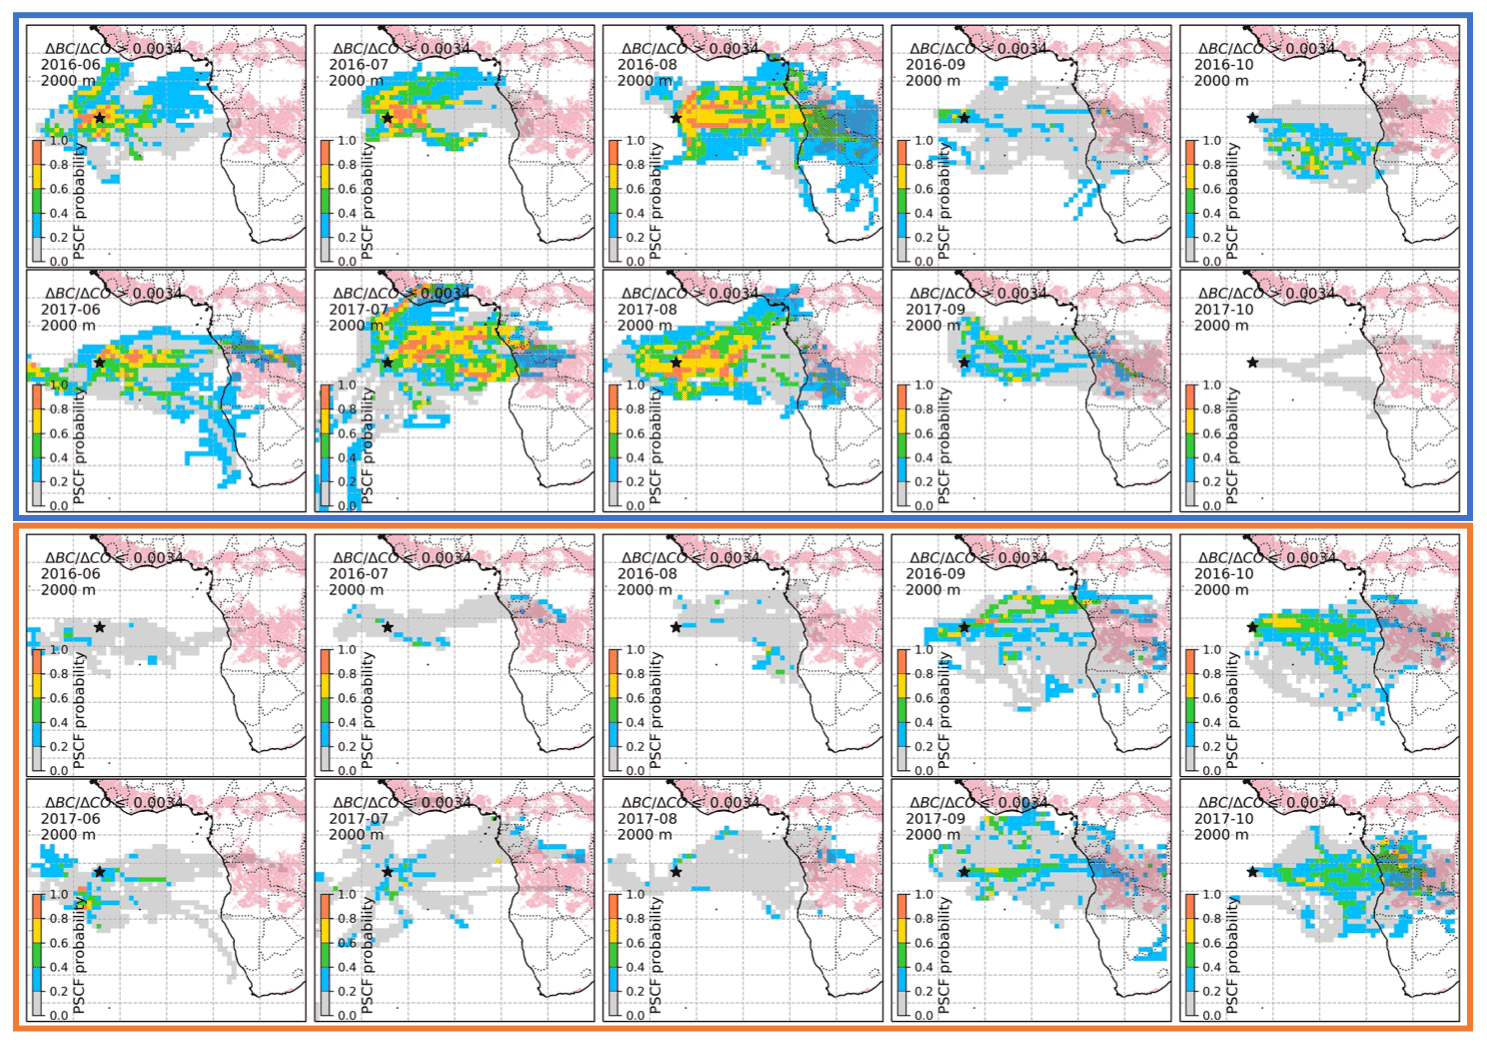
Figure 9The spatial distribution of potential source contribution function (PSCF) during the African fire season in 2016 and 2017. The 7 d backward trajectories in the upper blue and lower orange rectangles indicate air mass flow when > or ≤ 0.0034, respectively. Different colours indicate the probability of different transport paths of the plumes. Note the trajectories are initiated at an altitude of 2000 m at the sampling site (marked by black star) on ASI. The pink areas on the continent indicate savannah, the main burning material in each month.
The trajectories and main pathway of the airmass for > 0.0034 cases, representing potential flaming combustions, are illustrated inside the upper blue rectangle in Fig. 9 for each month. By contrast, the lower orange rectangle shows the trajectories of airmass for potential smouldering-dominated combustions with ≤ 0.0034. Overall, the air mass trajectories do not vary much in the direction from month to month for different values, although a stronger zonal wind in October was documented (Zhang and Zuidema, 2021). For those observations where > 0.0034 (flaming conditions), back trajectories suggest BB aerosols originated from the savannah from June to August. Moreover, trajectories with high values during August have a higher probability of originating from the savannah, while the trajectories with small are more likely to originate from other sources. This may indicate that the difference in fuel source contributes to the change in combustion conditions and results in a change in . During September and October, the probability of trajectories from the savannah but with smaller increases, suggesting that savannah burning became more smouldering during these months. By contrast, savannah burning is dominated by flaming combustion in August. This difference may be attributed to the change in meteorological conditions and water content in the fuel.
4.3.3 Variation of normalized difference moisture index
The NDMI (normalized difference moisture index) is used to describe the water stress level in vegetation, and can be used to monitor fuel levels in fire-prone areas. The monthly mean NDMI within the major burning areas is labelled in Fig. 10. As can be seen, the mean NDMI in the major burning areas decreases from June to August, indicating the fuel becomes drier. The primary fuel from June to August is savannah and without significant change, therefore the change in the burning state is likely to be a result of changes in the water content of the fuel. When the fuel is drier, the more flaming the combustion. This result is consistent with the increase in in these months, suggesting it is likely that the burning that became more flaming from June to August is caused by the drier state of the fuel. The average NDMI values for both September and October are smaller than for August, suggesting that fuel is drier in these 2 months. However, is lower in September and October than in August, meaning that the change in moisture in the fuel is not the main reason for the decrease in between these 2 months. Although the average NDMI in the main burning areas is lower than that in other months, the value of NDMI increases slightly from September to October and is more noticeable in 2017. This indicates an increase in fuel water content in October compared to September, consistent with the observed decrease in . However, as changes in combustion conditions do not depend solely on the water content of the fuel, factors such as surface wind can also have an effect, therefore the change in September/October may also be related to other factors.
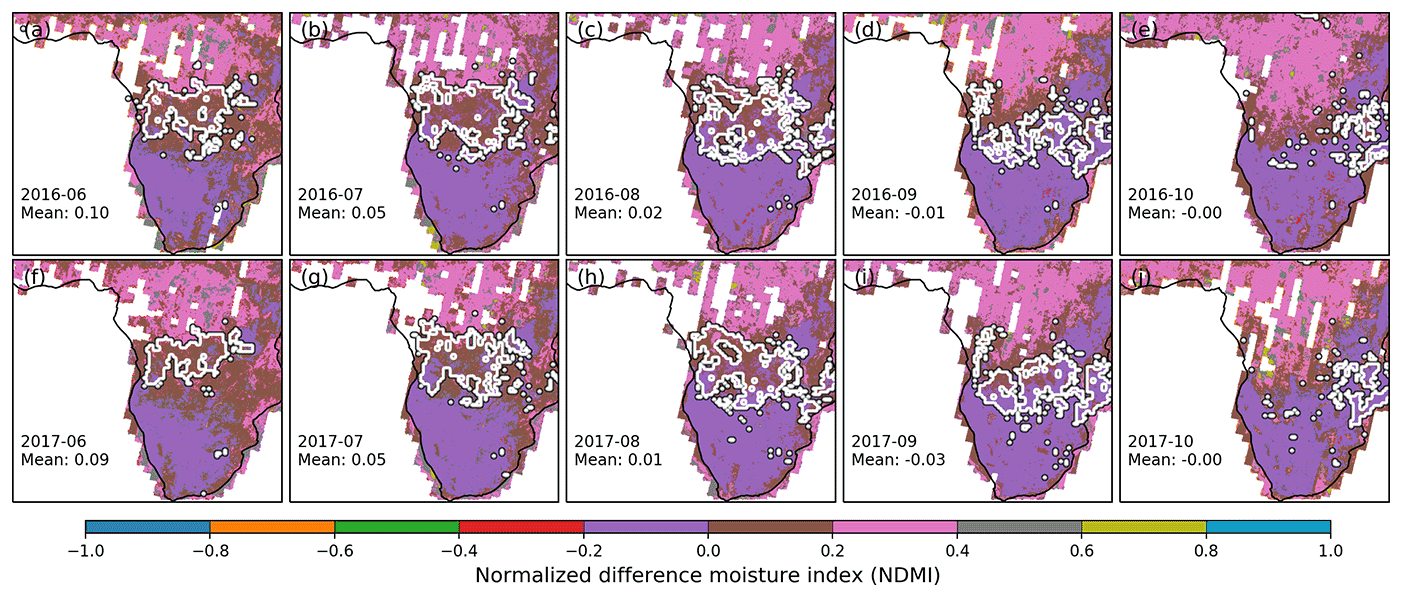
Figure 10Major burning locations and normalized difference moisture index (NDMI) during the BB season in 2016 and 2017. Areas with an accumulated fire count greater than 500 are illustrated in the black contour in each month, and are defined as the major burning areas. The mean values of NDMI in the major burning areas each month are also displayed in the figure.
4.3.4 Impact of meteorological factors on combustion conditions
The current understanding of the mechanisms leading to the changes and transition between smouldering and flaming combustions is poor and mostly limited to experiments (Santoso et al., 2019). In general, previous studies have suggested that wind can exert competing effects, first by increasing the oxygen supply, which will increase the flaming combustion fraction, and second, by simultaneously increasing the effective cooling, thereby suppressing active flaming. The surface wind anomalies in each month during the BB season in 2016 and 2017 are shown in Fig. 11. A distinctive feature is the noticeable lower wind speeds in September and October in the main burning areas. This result may suggest the decrease in wind speed may have led to a reduction in oxygen supply, resulting in the increase of the proportion of smouldering combustion in September and October. Another feature is the change in the direction of the wind during these months. From June to August, a relatively large proportion of winds from the southeast allowed the burning to expand northwards. In September and October, however, the northwest winds begin to increase, causing the burning area to return to the south where it had previously burned and move eastwards. The airflow during September and October is opposing smouldering propagations, which may carry the heat away from the burning zone to the ash layer, diminishing the heat supplied for heating the fuel and resulting in an increased fraction of smouldering combustion (Santoso et al., 2019).

Figure 11Monthly mean surface wind anomaly calculated from the ERA5 reanalysis data. The baseline is an average from June to October in 2016 and 2017 combined. The means are calculated as the average anomalies in the major burning areas (>500 fire counts), which are illustrated in the black counter each month.
A 17-month in situ campaign was conducted on ASI during 2016–2017. The monthly variation of measured aerosol optical properties during the African BB seasons is investigated in this paper. An increase in aerosol absorption coefficient from June to August is observed along with a concomitant reduction in SSA and MACBC. By contrast, during September and October, the aerosol absorption coefficient decreases, with the increases in SSA and MACBC. The highest SSA is observed in October, with a mean value of ∼ 0.85 at 529 nm, while the lowest monthly mean is in August at around 0.78.
The absorption enhancement Eabs also shows similar trends with SSA, and exhibits the same values as observations in heavily polluted areas. The mean Eabs during the whole BB season is ∼ 1.96 in 2016 and ∼ 2.07 in 2017. Our observed Eabs is significantly higher than the value (∼ 1.5) commonly adopted by climate models, suggesting the marine boundary layer in the south-eastern Atlantic is more absorbing than the model simulations. Further analysis indicates the contribution of BrC to absorption is negligible, as BrC calculated from AAE is generally around 1 %–2 % at 464 nm. Although filter samples collected in the boundary layer near the ASI demonstrate the existence of dust aerosols, which can also contribute to the total aerosol absorption, the fraction of dust aerosol is low and unable to explain such high Eabs. Therefore, we conclude that the high Eabs mainly resulted from the thick coating of BC particles, i.e. the lensing effect. By applying the results from the theoretical simulation, we estimated the shell–core ratio (spherical equivalent particle diameter divided by BC core diameter) is ∼ 2.2 on average, suggesting the coating thickness is 1.2 times the BC core radius for the BB aerosols observed on ASI. The monthly variation of SSA and MACBC are found to have a good relationship with , suggesting that the variation in may be responsible for the variation in SSA and MACBC across months during the BB season. In general, both SSA and MACBC decrease with the increase of , and this decrease is more dramatic when is small (<0.0034).
We further analyse the factors affecting and therefore discuss the reasons for the monthly variation in during the BB season. From the analysis of fresh smoke, the combustion state (represented by MCE) and show a linear correlation. Therefore, the change in reflects the change in combustion state, i.e. the more flaming, the higher the . However, due to the long transport time and the extensive clouds underlying the plume layer, we estimate the observed on ASI may be subject to aerosol scavenging processes with the transport of the plume. From June to August, mean cloud cover increases in the BB plume transport region with the mean precipitation remaining constant, suggesting that the removal of BB aerosols by cloud processing may have increased during this period. Therefore, the observed increase in from June to August may be due to changes in combustion conditions, i.e. increasing flaming combustion from June to August. The analysis of the water content of plants shows that the fuel becomes increasingly drier from June to August, which could be the reason for the more flaming combustion. In September and October, mean precipitation increases in the BB aerosol transport region, thus in addition to the changes in burning conditions, aerosol scavenging also contributes to the decrease in observed . For the analysis of burning conditions, these 2 months show an increase in grass burning, along with a decrease in surface wind speed in the burning area during this period, which may have caused their burning to become more smouldering. However, this discussion of combustion remains highly uncertain and future work is required to explore the reasons for the change in combustion state and the effect of aerosol scavenging on the .
Therefore, the correlation of with SSA and MACBC suggests that both SSA and MACBC decrease when the combustion becomes more flaming ( increases). This may be because flaming combustion is characterized by a higher concentration of BC while smouldering is characterized by a higher concentration of scattering OA; hence, the more flaming the combustion, the lower the SSA. For the MACBC, smouldering combustion can result in a smaller BC core and thicker coating, which could lead to a higher shell–core ratio of BC particles and thus a higher MACBC. We further propose SSA and MACBC can be approximated by either linear or exponential functions with . Both functions are able to represent the denser data in general, while the exponential function can capture better the rapid growth of SSA as the decrease of when < 0.003. These functions provide us with a simple way to estimate the parameters of the aerosol optical characteristics in the south-eastern Atlantic, and can help to improve the parameterizations used in climate models.
All LASIC ARM data are publicly available at https://adc.arm.gov/discovery/#/results/site_code::asi/start_date::2016-06-01/end_date::2017-10-31 (ARM, 2022). The ERA5 data are from the ECMWF Climate data store website: https://doi.org/10.24381/cds.f17050d7 (Hersbach et al., 2019). The MODIS data are downloaded from the NASA Earth data website: https://doi.org/10.5067/MODIS/MCD12Q1.006 (Friedl and Sulla-Menashe, 2019) and https://doi.org/10.5067/FIRMS/MODIS/MCD14ML (NASA, 2021). The Landsat 8 data (https://doi.org/10.5066/P975CC9B, USGS, 2020) are from © Google Earth engine: https://earthengine.google.com (last access: 3 July 2022). The filter sample data can be provided upon request.
The supplement related to this article is available online at: https://doi.org/10.5194/acp-22-8767-2022-supplement.
HC and MSR developed the concepts and ideas for the direction of the paper. MSR, CD, PZ, AJS III and CF carried out the observations and provided the data. All authors contributed to the analysis of the results. HC wrote the paper with input and comments from all other authors.
The contact author has declared that neither they nor their co-authors have any competing interests.
Publisher’s note: Copernicus Publications remains neutral with regard to jurisdictional claims in published maps and institutional affiliations.
This article is part of the special issue “New observations and related modelling studies of the aerosol–cloud–climate system in the Southeast Atlantic and southern Africa regions (ACP/AMT inter-journal SI)”. It is not associated with a conference.
This research has been funded by the Department of Energy (DOE) Atmospheric System Research (ASR) grant DE-SC0020084, supporting Michal Segal-Rozenhaimer and Haochi Che. We thank scientists from the LASIC campaign for providing observation data. We acknowledge the use of data and from NASA's Fire Information for Resource Management System (FIRMS) (https://earthdata.nasa.gov/firms, last access: 3 July 2022), part of NASA's Earth Observing System Data and Information System (EOSDIS).
This research has been supported by the U.S. Department of Energy (grant no. DE-SC0020084).
This paper was edited by Lynn M. Russell and reviewed by two anonymous referees.
Adachi, K., Chung, S. H., and Buseck, P. R.: Shapes of soot aerosol particles and implications for their effects on climate, J. Geophys. Res., 115, D15206, https://doi.org/10.1029/2009jd012868, 2010.
Adebiyi, A. A. and Zuidema, P.: The role of the southern African easterly jet in modifying the southeast Atlantic aerosol and cloud environments, Q. J. Roy. Meteor. Soc., 142, 1574–1589, https://doi.org/10.1002/qj.2765, 2016.
Adebiyi, A. A., Zuidema, P., and Abel, S. J.: The Convolution of Dynamics and Moisture with the Presence of Shortwave Absorbing Aerosols over the Southeast Atlantic, J. Climate, 28, 1997–2024, https://doi.org/10.1175/JCLI-D-14-00352.1, 2015.
Adler, G., Riziq, A. A., Erlick, C., and Rudich, Y.: Effect of intrinsic organic carbon on the optical properties of fresh diesel soot, P. Natl. Acad. Sci. USA, 107, 6699–6704, https://doi.org/10.1073/pnas.0903311106, 2010.
Akagi, S. K., Yokelson, R. J., Wiedinmyer, C., Alvarado, M. J., Reid, J. S., Karl, T., Crounse, J. D., and Wennberg, P. O.: Emission factors for open and domestic biomass burning for use in atmospheric models, Atmos. Chem. Phys., 11, 4039–4072, https://doi.org/10.5194/acp-11-4039-2011, 2011.
Akagi, S. K., Craven, J. S., Taylor, J. W., McMeeking, G. R., Yokelson, R. J., Burling, I. R., Urbanski, S. P., Wold, C. E., Seinfeld, J. H., Coe, H., Alvarado, M. J., and Weise, D. R.: Evolution of trace gases and particles emitted by a chaparral fire in California, Atmos. Chem. Phys., 12, 1397–1421, https://doi.org/10.5194/acp-12-1397-2012, 2012.
Allen, G., Vaughan, G., Bower, K. N., Williams, P. I., Crosier, J., Flynn, M., Connolly, P., Hamilton, J. F., Lee, J. D., Saxton, J. E., Watson, N. M., Gallagher, M., Coe, H., Allan, J., Choularton, T. W., and Lewis, A. C.: Aerosol and trace-gas measurements in the Darwin area during the wet season, J. Geophys. Res.-Atmos., 113, D06306, https://doi.org/10.1029/2007JD008706, 2008.
Allen, G., Coe, H., Clarke, A., Bretherton, C., Wood, R., Abel, S. J., Barrett, P., Brown, P., George, R., Freitag, S., McNaughton, C., Howell, S., Shank, L., Kapustin, V., Brekhovskikh, V., Kleinman, L., Lee, Y.-N., Springston, S., Toniazzo, T., Krejci, R., Fochesatto, J., Shaw, G., Krecl, P., Brooks, B., McMeeking, G., Bower, K. N., Williams, P. I., Crosier, J., Crawford, I., Connolly, P., Allan, J. D., Covert, D., Bandy, A. R., Russell, L. M., Trembath, J., Bart, M., McQuaid, J. B., Wang, J., and Chand, D.: South East Pacific atmospheric composition and variability sampled along 20∘ S during VOCALS-REx, Atmos. Chem. Phys., 11, 5237–5262, https://doi.org/10.5194/acp-11-5237-2011, 2011.
Andreae, M. O.: Emission of trace gases and aerosols from biomass burning – an updated assessment, Atmos. Chem. Phys., 19, 8523–8546, https://doi.org/10.5194/acp-19-8523-2019, 2019.
Andreae, M. O. and Merlet, P.: Emission of trace gases and aerosols from biomass burning, Glob. Biogeochem. Cy., 15, 955–966, https://doi.org/10.1029/2000GB001382, 2001.
ARM (Atmospheric Radiation Measurement): LASIC ARM data, ARM [data set], https://adc.arm.gov/discovery/#/results/site_code::asi/start_date::2016-06-01/end_date::2017-10-31, last access: 3 July 2022.
Bond, T. C. and Bergstrom, R. W.: Light Absorption by Carbonaceous Particles: An Investigative Review, Aerosol Sci. Tech., 40, 27–67, https://doi.org/10.1080/02786820500421521, 2006.
Bond, T. C., Doherty, S. J., Fahey, D. W., Forster, P. M., Berntsen, T., DeAngelo, B. J., Flanner, M. G., Ghan, S., Kärcher, B., Koch, D., Kinne, S., Kondo, Y., Quinn, P. K., Sarofim, M. C., Schultz, M. G., Schulz, M., Venkataraman, C., Zhang, H., Zhang, S., Bellouin, N., Guttikunda, S. K., Hopke, P. K., Jacobson, M. Z., Kaiser, J. W., Klimont, Z., Lohmann, U., Schwarz, J. P., Shindell, D., Storelvmo, T., Warren, S. G., and Zender, C. S.: Bounding the role of black carbon in the climate system: A scientific assessment, J. Geophys. Res.-Atmos., 118, 5380–5552, https://doi.org/10.1002/jgrd.50171, 2013.
Brey, S. J., Barnes, E. A., Pierce, J. R., Wiedinmyer, C., and Fischer, E. V.: Environmental Conditions, Ignition Type, and Air Quality Impacts of Wildfires in the Southeastern and Western United States, Earths Future, 6, 1442–1456, https://doi.org/10.1029/2018EF000972, 2018.
Cappa, C. D., Onasch, T. B., Massoli, P., Worsnop, D. R., Bates, T. S., Cross, E. S., Davidovits, P., Hakala, J., Hayden, K. L., Jobson, B. T., Kolesar, K. R., Lack, D. A., Lerner, B. M., Li, S.-M., Mellon, D., Nuaaman, I., Olfert, J. S., Petäjä, T., Quinn, P. K., Song, C., Subramanian, R., Williams, E. J., and Zaveri, R. A.: Radiative Absorption Enhancements Due to the Mixing State of Atmospheric Black Carbon, Science, 337, 1078–1081, https://doi.org/10.1126/science.1223447, 2012.
Cappa, C. D., Zhang, X., Russell, L. M., Collier, S., Lee, A. K. Y., Chen, C.-L., Betha, R., Chen, S., Liu, J., Price, D. J., Sanchez, K. J., McMeeking, G. R., Williams, L. R., Onasch, T. B., Worsnop, D. R., Abbatt, J., and Zhang, Q.: Light Absorption by Ambient Black and Brown Carbon and its Dependence on Black Carbon Coating State for Two California, USA, Cities in Winter and Summer, J. Geophys. Res.-Atmos., 124, 1550–1577, https://doi.org/10.1029/2018JD029501, 2019.
Chakrabarty, R. K. and Heinson, W. R.: Scaling Laws for Light Absorption Enhancement Due to Nonrefractory Coating of Atmospheric Black Carbon Aerosol, Phys. Rev. Lett., 121, 218701, https://doi.org/10.1103/PhysRevLett.121.218701, 2018.
Chand, D., Wood, R., Anderson, T. L., Satheesh, S. K., and Charlson, R. J.: Satellite-derived direct radiative effect of aerosols dependent on cloud cover, Nat. Geosci., 2, 181–184, https://doi.org/10.1038/ngeo437, 2009.
Che, H., Stier, P., Gordon, H., Watson-Parris, D., and Deaconu, L.: Cloud adjustments dominate the overall negative aerosol radiative effects of biomass burning aerosols in UKESM1 climate model simulations over the south-eastern Atlantic, Atmos. Chem. Phys., 21, 17–33, https://doi.org/10.5194/acp-21-17-2021, 2021.
Che, H., Segal-Rozenhaimer, M., Zhang, L., Dang, C., Zuidema, P., Dobracki, A., Sedlacek III, A. J., Coe, H., Wu, H., Taylor, J., Zhang, X., Redemann, J., and Haywood, J.: Cloud processing and weeklong ageing affect biomass burning aerosol properties over the south-eastern Atlantic, Commun. Earth Environ., accepted, 2022a.
Che, H., Stier, P., Watson-Parris, D., Gordon, H., and Deaconu, L.: Source attribution of cloud condensation nuclei and their impact on stratocumulus clouds and radiation in the south-eastern Atlantic, Atmos. Chem. Phys. Discuss. [preprint], https://doi.org/10.5194/acp-2022-43, in review, 2022b.
Chen, J., Li, C., Ristovski, Z., Milic, A., Gu, Y., Islam, M. S., Wang, S., Hao, J., Zhang, H., He, C., Guo, H., Fu, H., Miljevic, B., Morawska, L., Thai, P., Lam, Y. F., Pereira, G., Ding, A., Huang, X., and Dumka, U. C.: A review of biomass burning: Emissions and impacts on air quality, health and climate in China, Sci. Total Environ., 579, 1000–1034, https://doi.org/10.1016/j.scitotenv.2016.11.025, 2017.
Cross, E. S., Onasch, T. B., Ahern, A., Wrobel, W., Slowik, J. G., Olfert, J., Lack, D. A., Massoli, P., Cappa, C. D., Schwarz, J. P., Spackman, J. R., Fahey, D. W., Sedlacek, A., Trimborn, A., Jayne, J. T., Freedman, A., Williams, L. R., Ng, N. L., Mazzoleni, C., Dubey, M., Brem, B., Kok, G., Subramanian, R., Freitag, S., Clarke, A., Thornhill, D., Marr, L. C., Kolb, C. E., Worsnop, D. R., and Davidovits, P.: Soot Particle Studies – Instrument Inter-Comparison – Project Overview, Aerosol Sci. Tech., 44, 592–611, https://doi.org/10.1080/02786826.2010.482113, 2010.
Dang, C., Segal-Rozenhaimer, M., Che, H., Zhang, L., Formenti, P., Taylor, J., Dobracki, A., Purdue, S., Wong, P.-S., Nenes, A., Sedlacek, A., Coe, H., Redemann, J., Zuidema, P., and Haywood, J.: Biomass burning and marine aerosol processing over the southeast Atlantic Ocean: A TEM single particle analysis, Atmos. Chem. Phys. Discuss. [preprint], https://doi.org/10.5194/acp-2021-724, in review, 2021.
Denjean, C., Brito, J., Libois, Q., Mallet, M., Bourrianne, T., Burnet, F., Dupuy, R., Flamant, C., and Knippertz, P.: Unexpected Biomass Burning Aerosol Absorption Enhancement Explained by Black Carbon Mixing State, Geophys. Res. Lett., 47, e2020GL089055, https://doi.org/10.1029/2020GL089055, 2020.
Diamond, M. S., Dobracki, A., Freitag, S., Small Griswold, J. D., Heikkila, A., Howell, S. G., Kacarab, M. E., Podolske, J. R., Saide, P. E., and Wood, R.: Time-dependent entrainment of smoke presents an observational challenge for assessing aerosol–cloud interactions over the southeast Atlantic Ocean, Atmos. Chem. Phys., 18, 14623–14636, https://doi.org/10.5194/acp-18-14623-2018, 2018.
Doherty, S. J., Saide, P. E., Zuidema, P., Shinozuka, Y., Ferrada, G. A., Gordon, H., Mallet, M., Meyer, K., Painemal, D., Howell, S. G., Freitag, S., Dobracki, A., Podolske, J. R., Burton, S. P., Ferrare, R. A., Howes, C., Nabat, P., Carmichael, G. R., da Silva, A., Pistone, K., Chang, I., Gao, L., Wood, R., and Redemann, J.: Modeled and observed properties related to the direct aerosol radiative effect of biomass burning aerosol over the southeastern Atlantic, Atmos. Chem. Phys., 22, 1–46, https://doi.org/10.5194/acp-22-1-2022, 2022.
Eck, T. F., Holben, B. N., Reid, J. S., Mukelabai, M. M., Piketh, S. J., Torres, O., Jethva, H. T., Hyer, E. J., Ward, D. E., Dubovik, O., Sinyuk, A., Schafer, J. S., Giles, D. M., Sorokin, M., Smirnov, A., and Slutsker, I.: A seasonal trend of single scattering albedo in southern African biomass-burning particles: Implications for satellite products and estimates of emissions for the world's largest biomass-burning source, J. Geophys. Res.-Atmos., 118, 6414–6432, https://doi.org/10.1002/jgrd.50500, 2013.
Eswaran, K., Satheesh, S. K., and Srinivasan, J.: Multi-satellite retrieval of single scattering albedo using the OMI–MODIS algorithm, Atmos. Chem. Phys., 19, 3307–3324, https://doi.org/10.5194/acp-19-3307-2019, 2019.
Freire, J. L. M., Longo, K. M., Freitas, S. R., Coelho, C. A. S., Molod, A. M., Marshak, J., da Silva, A., and Ribeiro, B. Z.: To What Extent Biomass Burning Aerosols Impact South America Seasonal Climate Predictions?, Geophys. Res. Lett., 47, e2020GL088096, https://doi.org/10.1029/2020GL088096, 2020.
Friedl, M. and Sulla-Menashe, D.: MCD12Q1 MODIS/Terra+Aqua Land Cover Type Yearly L3 Global 500 m SIN Grid V006, NASA EOSDIS Land Processes DAAC [data set], https://doi.org/10.5067/MODIS/MCD12Q1.006, 2019.
Giglio, L., Schroeder, W., and Justice, C. O.: The collection 6 MODIS active fire detection algorithm and fire products, Remote Sens. Environ., 178, 31–41, https://doi.org/10.1016/j.rse.2016.02.054, 2016.
Gordon, H., Field, P. R., Abel, S. J., Dalvi, M., Grosvenor, D. P., Hill, A. A., Johnson, B. T., Miltenberger, A. K., Yoshioka, M., and Carslaw, K. S.: Large simulated radiative effects of smoke in the south-east Atlantic, Atmos. Chem. Phys., 18, 15261–15289, https://doi.org/10.5194/acp-18-15261-2018, 2018.
Guenther, A., Karl, T., Harley, P., Wiedinmyer, C., Palmer, P. I., and Geron, C.: Estimates of global terrestrial isoprene emissions using MEGAN (Model of Emissions of Gases and Aerosols from Nature), Atmos. Chem. Phys., 6, 3181–3210, https://doi.org/10.5194/acp-6-3181-2006, 2006.
Haywood, J. M., Osborne, S. R., and Abel, S. J.: The effect of overlying absorbing aerosol layers on remote sensing retrievals of cloud effective radius and cloud optical depth, Q. J. Roy. Meteor. Soc., 130, 779–800, https://doi.org/10.1256/qj.03.100, 2004.
Haywood, J. M., Abel, S. J., Barrett, P. A., Bellouin, N., Blyth, A., Bower, K. N., Brooks, M., Carslaw, K., Che, H., Coe, H., Cotterell, M. I., Crawford, I., Cui, Z., Davies, N., Dingley, B., Field, P., Formenti, P., Gordon, H., de Graaf, M., Herbert, R., Johnson, B., Jones, A. C., Langridge, J. M., Malavelle, F., Partridge, D. G., Peers, F., Redemann, J., Stier, P., Szpek, K., Taylor, J. W., Watson-Parris, D., Wood, R., Wu, H., and Zuidema, P.: The CLoud–Aerosol–Radiation Interaction and Forcing: Year 2017 (CLARIFY-2017) measurement campaign, Atmos. Chem. Phys., 21, 1049–1084, https://doi.org/10.5194/acp-21-1049-2021, 2021.
Hennigan, C. J., Miracolo, M. A., Engelhart, G. J., May, A. A., Presto, A. A., Lee, T., Sullivan, A. P., McMeeking, G. R., Coe, H., Wold, C. E., Hao, W.-M., Gilman, J. B., Kuster, W. C., de Gouw, J., Schichtel, B. A., Collett Jr., J. L., Kreidenweis, S. M., and Robinson, A. L.: Chemical and physical transformations of organic aerosol from the photo-oxidation of open biomass burning emissions in an environmental chamber, Atmos. Chem. Phys., 11, 7669–7686, https://doi.org/10.5194/acp-11-7669-2011, 2011.
Hersbach, H., Bell, B., Berrisford, P., Biavati, G., Horányi, A., Muñoz Sabater, J., Nicolas, J., Peubey, C., Radu, R., Rozum, I., Schepers, D., Simmons, A., Soci, C., Dee, D., and Thépaut, J.-N.: ERA5 monthly averaged data on single levels from 1959 to present, Copernicus Climate Change Service (C3S) Climate Data Store (CDS) [data set],https://doi.org/10.24381/cds.f17050d7, 2019.
Hersbach, H., Bell, B., Berrisford, P., Hirahara, S., Horányi, A., Muñoz-Sabater, J., Nicolas, J., Peubey, C., Radu, R., Schepers, D., Simmons, A., Soci, C., Abdalla, S., Abellan, X., Balsamo, G., Bechtold, P., Biavati, G., Bidlot, J., Bonavita, M., Chiara, G. D., Dahlgren, P., Dee, D., Diamantakis, M., Dragani, R., Flemming, J., Forbes, R., Fuentes, M., Geer, A., Haimberger, L., Healy, S., Hogan, R. J., Hólm, E., Janisková, M., Keeley, S., Laloyaux, P., Lopez, P., Lupu, C., Radnoti, G., Rosnay, P. de, Rozum, I., Vamborg, F., Villaume, S., and Thépaut, J.-N.: The ERA5 global reanalysis, Q. J. Roy. Meteor. Soc., 146, 1999–2049, https://doi.org/10.1002/qj.3803, 2020.
Jiang, H., Xue, H., Teller, A., Feingold, G., and Levin, Z.: Aerosol effects on the lifetime of shallow cumulus, Geophys. Res. Lett., 33, L14806, https://doi.org/10.1029/2006GL026024, 2006.
Johnson, B. T., Osborne, S. R., Haywood, J. M., and Harrison, M. A. J.: Aircraft measurements of biomass burning aerosol over West Africa during DABEX, J. Geophys. Res.-Atmos., 113, D00C06, https://doi.org/10.1029/2007JD009451, 2008.
Johnston, F. H., Henderson, S. B., Chen, Y., Randerson, J. T., Marlier, M., Defries, R. S., Kinney, P., Bowman, D. M. J. S., and Brauer, M.: Estimated global mortality attributable to smoke from landscape fires, Environ. Health Persp., 120, 695–701, https://doi.org/10.1289/ehp.1104422, 2012.
Karaca, F., Anil, I., and Alagha, O.: Long-range potential source contributions of episodic aerosol events to PM10 profile of a megacity, Atmos. Environ., 43, 5713–5722, https://doi.org/10.1016/j.atmosenv.2009.08.005, 2009.
Koçak, M., Mihalopoulos, N., and Kubilay, N.: Origin and source regions of PM10 in the Eastern Mediterranean atmosphere, Atmos. Res., 92, 464–474, https://doi.org/10.1016/j.atmosres.2009.01.005, 2009.
Lack, D. A. and Langridge, J. M.: On the attribution of black and brown carbon light absorption using the Ångström exponent, Atmos. Chem. Phys., 13, 10535–10543, https://doi.org/10.5194/acp-13-10535-2013, 2013.
Liu, C., Chung, C. E., Yin, Y., and Schnaiter, M.: The absorption Ångström exponent of black carbon: from numerical aspects, Atmos. Chem. Phys., 18, 6259–6273, https://doi.org/10.5194/acp-18-6259-2018, 2018.
Liu, S., Aiken, A. C., Gorkowski, K., Dubey, M. K., Cappa, C. D., Williams, L. R., Herndon, S. C., Massoli, P., Fortner, E. C., Chhabra, P. S., Brooks, W. A., Onasch, T. B., Jayne, J. T., Worsnop, D. R., China, S., Sharma, N., Mazzoleni, C., Xu, L., Ng, N. L., Liu, D., Allan, J. D., Lee, J. D., Fleming, Z. L., Mohr, C., Zotter, P., Szidat, S., and Prévôt, A. S. H.: Enhanced light absorption by mixed source black and brown carbon particles in UK winter, Nat. Commun., 6, 8435, https://doi.org/10.1038/ncomms9435, 2015.
Lu, Z., Liu, X., Zhang, Z., Zhao, C., Meyer, K., Rajapakshe, C., Wu, C., Yang, Z., and Penner, J. E.: Biomass smoke from southern Africa can significantly enhance the brightness of stratocumulus over the southeastern Atlantic Ocean, P. Natl. Acad. Sci. USA, 115, 2924–2929, https://doi.org/10.1073/pnas.1713703115, 2018.
Malavelle, F. F., Haywood, J. M., Mercado, L. M., Folberth, G. A., Bellouin, N., Sitch, S., and Artaxo, P.: Studying the impact of biomass burning aerosol radiative and climate effects on the Amazon rainforest productivity with an Earth system model, Atmos. Chem. Phys., 19, 1301–1326, https://doi.org/10.5194/acp-19-1301-2019, 2019.
Mallet, M., Solmon, F., Nabat, P., Elguindi, N., Waquet, F., Bouniol, D., Sayer, A. M., Meyer, K., Roehrig, R., Michou, M., Zuidema, P., Flamant, C., Redemann, J., and Formenti, P.: Direct and semi-direct radiative forcing of biomass-burning aerosols over the southeast Atlantic (SEA) and its sensitivity to absorbing properties: a regional climate modeling study, Atmos. Chem. Phys., 20, 13191–13216, https://doi.org/10.5194/acp-20-13191-2020, 2020.
Mallet, M., Nabat, P., Johnson, B., Michou, M., Haywood, J. M., Chen, C., and Dubovik, O.: Climate models generally underrepresent the warming by Central Africa biomass-burning aerosols over the Southeast Atlantic, Sci. Adv., 7, eabg9998, https://doi.org/10.1126/sciadv.abg9998, 2021.
May, A. A., McMeeking, G. R., Lee, T., Taylor, J. W., Craven, J. S., Burling, I., Sullivan, A. P., Akagi, S., Collett, J. L., Flynn, M., Coe, H., Urbanski, S. P., Seinfeld, J. H., Yokelson, R. J., and Kreidenweis, S. M.: Aerosol emissions from prescribed fires in the United States: A synthesis of laboratory and aircraft measurements, J. Geophys. Res.-Atmos., 119, 11826–11849, https://doi.org/10.1002/2014JD021848, 2014.
McComiskey, A., Schwartz, S., Schmid, B., Guan, H., Lewis, E., Ricchiazzi, P., and Ogren, J.: Direct aerosol forcing: Calculation from observables and sensitivities to inputs, J. Geophys. Res., 113, D09202, https://doi.org/10.1029/2007JD009170, 2008.
Naeher, L. P., Brauer, M., Lipsett, M., Zelikoff, J. T., Simpson, C. D., Koenig, J. Q., and Smith, K. R.: Woodsmoke health effects: a review, Inhal. Toxicol., 19, 67–106, https://doi.org/10.1080/08958370600985875, 2007.
NASA: MODIS Collection 6 Hotspot/Active Fire Detections MCD14ML, NASA FIRMS [data set], https://doi.org/10.5067/FIRMS/MODIS/MCD14ML, 2021.
Ogren, J. A.: Comment on “Calibration and Intercomparison of Filter-Based Measurements of Visible Light Absorption by Aerosols”, Aerosol Sci. Tech., 44, 589–591, https://doi.org/10.1080/02786826.2010.482111, 2010.
Peng, J., Hu, M., Guo, S., Du, Z., Zheng, J., Shang, D., Levy Zamora, M., Zeng, L., Shao, M., Wu, Y.-S., Zheng, J., Wang, Y., Glen, C. R., Collins, D. R., Molina, M. J., and Zhang, R.: Markedly enhanced absorption and direct radiative forcing of black carbon under polluted urban environments, P. Natl. Acad. Sci. USA, 113, 4266–4271, https://doi.org/10.1073/pnas.1602310113, 2016.
Pistone, K., Redemann, J., Doherty, S., Zuidema, P., Burton, S., Cairns, B., Cochrane, S., Ferrare, R., Flynn, C., Freitag, S., Howell, S. G., Kacenelenbogen, M., LeBlanc, S., Liu, X., Schmidt, K. S., Sedlacek III, A. J., Segal-Rozenhaimer, M., Shinozuka, Y., Stamnes, S., van Diedenhoven, B., Van Harten, G., and Xu, F.: Intercomparison of biomass burning aerosol optical properties from in situ and remote-sensing instruments in ORACLES-2016, Atmos. Chem. Phys., 19, 9181–9208, https://doi.org/10.5194/acp-19-9181-2019, 2019.
Pokhrel, R. P., Wagner, N. L., Langridge, J. M., Lack, D. A., Jayarathne, T., Stone, E. A., Stockwell, C. E., Yokelson, R. J., and Murphy, S. M.: Parameterization of single-scattering albedo (SSA) and absorption Ångström exponent (AAE) with for aerosol emissions from biomass burning, Atmos. Chem. Phys., 16, 9549–9561, https://doi.org/10.5194/acp-16-9549-2016, 2016.
Pokhrel, R. P., Gordon, J., Fiddler, M. N., and Bililign, S.: Impact of combustion conditions on physical and morphological properties of biomass burning aerosol, Aerosol Sci. Tech., 55, 80–91, https://doi.org/10.1080/02786826.2020.1822512, 2021.
Polissar, A. V., Hopke, P. K., and Harris, J. M.: Source Regions for Atmospheric Aerosol Measured at Barrow, Alaska, Environ. Sci. Technol., 35, 4214–4226, https://doi.org/10.1021/es0107529, 2001.
Redemann, J., Wood, R., Zuidema, P., Doherty, S. J., Luna, B., LeBlanc, S. E., Diamond, M. S., Shinozuka, Y., Chang, I. Y., Ueyama, R., Pfister, L., Ryoo, J.-M., Dobracki, A. N., da Silva, A. M., Longo, K. M., Kacenelenbogen, M. S., Flynn, C. J., Pistone, K., Knox, N. M., Piketh, S. J., Haywood, J. M., Formenti, P., Mallet, M., Stier, P., Ackerman, A. S., Bauer, S. E., Fridlind, A. M., Carmichael, G. R., Saide, P. E., Ferrada, G. A., Howell, S. G., Freitag, S., Cairns, B., Holben, B. N., Knobelspiesse, K. D., Tanelli, S., L'Ecuyer, T. S., Dzambo, A. M., Sy, O. O., McFarquhar, G. M., Poellot, M. R., Gupta, S., O'Brien, J. R., Nenes, A., Kacarab, M., Wong, J. P. S., Small-Griswold, J. D., Thornhill, K. L., Noone, D., Podolske, J. R., Schmidt, K. S., Pilewskie, P., Chen, H., Cochrane, S. P., Sedlacek, A. J., Lang, T. J., Stith, E., Segal-Rozenhaimer, M., Ferrare, R. A., Burton, S. P., Hostetler, C. A., Diner, D. J., Seidel, F. C., Platnick, S. E., Myers, J. S., Meyer, K. G., Spangenberg, D. A., Maring, H., and Gao, L.: An overview of the ORACLES (ObseRvations of Aerosols above CLouds and their intEractionS) project: aerosol–cloud–radiation interactions in the southeast Atlantic basin, Atmos. Chem. Phys., 21, 1507–1563, https://doi.org/10.5194/acp-21-1507-2021, 2021.
Reisen, F., Meyer, C. P., and Keywood, M. D.: Impact of biomass burning sources on seasonal aerosol air quality, Atmos. Environ., 67, 437–447, https://doi.org/10.1016/j.atmosenv.2012.11.004, 2013.
Roberts, G., Wooster, M. J., and Lagoudakis, E.: Annual and diurnal african biomass burning temporal dynamics, Biogeosciences, 6, 849–866, https://doi.org/10.5194/bg-6-849-2009, 2009.
Roberts, J. M., Veres, P. R., Cochran, A. K., Warneke, C., Burling, I. R., Yokelson, R. J., Lerner, B., Gilman, J. B., Kuster, W. C., Fall, R., and de Gouw, J.: Isocyanic acid in the atmosphere and its possible link to smoke-related health effects, P. Natl. Acad. Sci. USA, 108, 8966–8971, https://doi.org/10.1073/pnas.1103352108, 2011.
Ryoo, J.-M., Pfister, L., Ueyama, R., Zuidema, P., Wood, R., Chang, I., and Redemann, J.: A meteorological overview of the ORACLES (ObseRvations of Aerosols above CLouds and their intEractionS) campaign over the southeastern Atlantic during 2016–2018: Part 1 – Climatology, Atmos. Chem. Phys., 21, 16689–16707, https://doi.org/10.5194/acp-21-16689-2021, 2021.
Sakaeda, N., Wood, R., and Rasch, P. J.: Direct and semidirect aerosol effects of southern African biomass burning aerosol, J. Geophys. Res.-Atmos., 116, D12205, https://doi.org/10.1029/2010JD015540, 2011.
Santoso, M. A., Christensen, E. G., Yang, J., and Rein, G.: Review of the Transition From Smouldering to Flaming Combustion in Wildfires, Front. Mech. Eng., 5, 49, https://doi.org/10.3389/fmech.2019.00049, 2019.
Scholes, R. J., Ward, D. E., and Justice, C. O.: Emissions of trace gases and aerosol particles due to vegetation burning in southern hemisphere Africa, J. Geophys. Res.-Atmos., 101, 23677–23682, https://doi.org/10.1029/95JD02049, 1996.
Shank, L. M., Howell, S., Clarke, A. D., Freitag, S., Brekhovskikh, V., Kapustin, V., McNaughton, C., Campos, T., and Wood, R.: Organic matter and non-refractory aerosol over the remote Southeast Pacific: oceanic and combustion sources, Atmos. Chem. Phys., 12, 557–576, https://doi.org/10.5194/acp-12-557-2012, 2012.
Stein, A. F., Draxler, R. R., Rolph, G. D., Stunder, B. J. B., Cohen, M. D., and Ngan, F.: NOAA's HYSPLIT Atmospheric Transport and Dispersion Modeling System, B. Am. Meteorol. Soc., 96, 2059–2077, https://doi.org/10.1175/BAMS-D-14-00110.1, 2015.
Stier, P., Schutgens, N. A. J., Bellouin, N., Bian, H., Boucher, O., Chin, M., Ghan, S., Huneeus, N., Kinne, S., Lin, G., Ma, X., Myhre, G., Penner, J. E., Randles, C. A., Samset, B., Schulz, M., Takemura, T., Yu, F., Yu, H., and Zhou, C.: Host model uncertainties in aerosol radiative forcing estimates: results from the AeroCom Prescribed intercomparison study, Atmos. Chem. Phys., 13, 3245–3270, https://doi.org/10.5194/acp-13-3245-2013, 2013.
Sulla-Menashe, D., Gray, J. M., Abercrombie, S. P., and Friedl, M. A.: Hierarchical mapping of annual global land cover 2001 to present: The MODIS Collection 6 Land Cover product, Remote Sens. Environ., 222, 183–194, https://doi.org/10.1016/j.rse.2018.12.013, 2019.
Taylor, J. W., Choularton, T. W., Blyth, A. M., Flynn, M. J., Williams, P. I., Young, G., Bower, K. N., Crosier, J., Gallagher, M. W., Dorsey, J. R., Liu, Z., and Rosenberg, P. D.: Aerosol measurements during COPE: composition, size, and sources of CCN and INPs at the interface between marine and terrestrial influences, Atmos. Chem. Phys., 16, 11687–11709, https://doi.org/10.5194/acp-16-11687-2016, 2016.
Taylor, J. W., Wu, H., Szpek, K., Bower, K., Crawford, I., Flynn, M. J., Williams, P. I., Dorsey, J., Langridge, J. M., Cotterell, M. I., Fox, C., Davies, N. W., Haywood, J. M., and Coe, H.: Absorption closure in highly aged biomass burning smoke, Atmos. Chem. Phys., 20, 11201–11221, https://doi.org/10.5194/acp-20-11201-2020, 2020.
Textor, C., Schulz, M., Guibert, S., Kinne, S., Balkanski, Y., Bauer, S., Berntsen, T., Berglen, T., Boucher, O., Chin, M., Dentener, F., Diehl, T., Easter, R., Feichter, H., Fillmore, D., Ghan, S., Ginoux, P., Gong, S., Grini, A., Hendricks, J., Horowitz, L., Huang, P., Isaksen, I., Iversen, I., Kloster, S., Koch, D., Kirkevåg, A., Kristjansson, J. E., Krol, M., Lauer, A., Lamarque, J. F., Liu, X., Montanaro, V., Myhre, G., Penner, J., Pitari, G., Reddy, S., Seland, Ø., Stier, P., Takemura, T., and Tie, X.: Analysis and quantification of the diversities of aerosol life cycles within AeroCom, Atmos. Chem. Phys., 6, 1777–1813, https://doi.org/10.5194/acp-6-1777-2006, 2006.
Thornhill, G. D., Ryder, C. L., Highwood, E. J., Shaffrey, L. C., and Johnson, B. T.: The effect of South American biomass burning aerosol emissions on the regional climate, Atmos. Chem. Phys., 18, 5321–5342, https://doi.org/10.5194/acp-18-5321-2018, 2018.
USGS: Landsat Archives – Landsat 8-9 Operational Land Imager and Thermal Infrared Sensor Collection 2 Level-1 Data, USGS EROS Archive [data set], https://doi.org/10.5066/P975CC9B, 2020.
Vakkari, V., Beukes, J. P., Dal Maso, M., Aurela, M., Josipovic, M., and van Zyl, P. G.: Major secondary aerosol formation in southern African open biomass burning plumes, Nat. Geosci., 11, 580–583, https://doi.org/10.1038/s41561-018-0170-0, 2018.
van der Werf, G. R., Randerson, J. T., Giglio, L., van Leeuwen, T. T., Chen, Y., Rogers, B. M., Mu, M., van Marle, M. J. E., Morton, D. C., Collatz, G. J., Yokelson, R. J., and Kasibhatla, P. S.: Global fire emissions estimates during 1997–2016, Earth Syst. Sci. Data, 9, 697–720, https://doi.org/10.5194/essd-9-697-2017, 2017.
Virkkula, A.: Correction of the Calibration of the 3-wavelength Particle Soot Absorption Photometer (3λ PSAP), Aerosol Sci. Tech., 44, 706–712, https://doi.org/10.1080/02786826.2010.482110, 2010.
Wang, Q., Jacob, D. J., Spackman, J. R., Perring, A. E., Schwarz, J. P., Moteki, N., Marais, E. A., Ge, C., Wang, J., and Barrett, S. R. H.: Global budget and radiative forcing of black carbon aerosol: Constraints from pole-to-pole (HIPPO) observations across the Pacific, J. Geophys. Res.-Atmos., 119, 195–206, https://doi.org/10.1002/2013JD020824, 2014.
Wang, Y., Liu, F., He, C., Bi, L., Cheng, T., Wang, Z., Zhang, H., Zhang, X., Shi, Z., and Li, W.: Fractal Dimensions and Mixing Structures of Soot Particles during Atmospheric Processing, Environ. Sci. Tech. Let., 4, 487–493, https://doi.org/10.1021/acs.estlett.7b00418, 2017.
Wilcox, E. M.: Direct and semi-direct radiative forcing of smoke aerosols over clouds, Atmos. Chem. Phys., 12, 139–149, https://doi.org/10.5194/acp-12-139-2012, 2012.
Wilson, E. H. and Sader, S. A.: Detection of forest harvest type using multiple dates of Landsat TM imagery, Remote Sens. Environ., 80, 385–396, https://doi.org/10.1016/S0034-4257(01)00318-2, 2002.
Wu, H., Taylor, J. W., Szpek, K., Langridge, J. M., Williams, P. I., Flynn, M., Allan, J. D., Abel, S. J., Pitt, J., Cotterell, M. I., Fox, C., Davies, N. W., Haywood, J., and Coe, H.: Vertical variability of the properties of highly aged biomass burning aerosol transported over the southeast Atlantic during CLARIFY-2017, Atmos. Chem. Phys., 20, 12697–12719, https://doi.org/10.5194/acp-20-12697-2020, 2020.
Xie, C., Xu, W., Wang, J., Liu, D., Ge, X., Zhang, Q., Wang, Q., Du, W., Zhao, J., Zhou, W., Li, J., Fu, P., Wang, Z., Worsnop, D., and Sun, Y.: Light absorption enhancement of black carbon in urban Beijing in summer, Atmos. Environ., 213, 499–504, https://doi.org/10.1016/j.atmosenv.2019.06.041, 2019.
Xu, X., Zhao, W., Qian, X., Wang, S., Fang, B., Zhang, Q., Zhang, W., Venables, D. S., Chen, W., Huang, Y., Deng, X., Wu, B., Lin, X., Zhao, S., and Tong, Y.: The influence of photochemical aging on light absorption of atmospheric black carbon and aerosol single-scattering albedo, Atmos. Chem. Phys., 18, 16829–16844, https://doi.org/10.5194/acp-18-16829-2018, 2018.
Yokelson, R. J., Crounse, J. D., DeCarlo, P. F., Karl, T., Urbanski, S., Atlas, E., Campos, T., Shinozuka, Y., Kapustin, V., Clarke, A. D., Weinheimer, A., Knapp, D. J., Montzka, D. D., Holloway, J., Weibring, P., Flocke, F., Zheng, W., Toohey, D., Wennberg, P. O., Wiedinmyer, C., Mauldin, L., Fried, A., Richter, D., Walega, J., Jimenez, J. L., Adachi, K., Buseck, P. R., Hall, S. R., and Shetter, R.: Emissions from biomass burning in the Yucatan, Atmos. Chem. Phys., 9, 5785–5812, https://doi.org/10.5194/acp-9-5785-2009, 2009.
Zhang, J. and Zuidema, P.: Sunlight-absorbing aerosol amplifies the seasonal cycle in low-cloud fraction over the southeast Atlantic, Atmos. Chem. Phys., 21, 11179–11199, https://doi.org/10.5194/acp-21-11179-2021, 2021.
Zhang, L., Segal-Rozenhaimer, M., Che, H., Dang, C., Sedlacek III, A. J., Lewis, E. R., Dobracki, A., Wong, J. P. S., Formenti, P., Howell, S. G., and Nenes, A.: Light Absorption by Brown Carbon over the South-East Atlantic Ocean, Atmos. Chem. Phys. Discuss. [preprint], https://doi.org/10.5194/acp-2021-1000, in review, 2022.
Zhang, X., Mao, M., Yin, Y., and Wang, B.: Absorption enhancement of aged black carbon aerosols affected by their microphysics: A numerical investigation, J. Quant. Spectrosc. Ra., 202, 90–97, https://doi.org/10.1016/j.jqsrt.2017.07.025, 2017.
Zhang, X. L., Wu, G. J., Zhang, C. L., Xu, T. L., and Zhou, Q. Q.: What is the real role of iron oxides in the optical properties of dust aerosols?, Atmos. Chem. Phys., 15, 12159–12177, https://doi.org/10.5194/acp-15-12159-2015, 2015.
Zuidema, P., Redemann, J., Haywood, J., Wood, R., Piketh, S., Hipondoka, M., and Formenti, P.: Smoke and Clouds above the Southeast Atlantic: Upcoming Field Campaigns Probe Absorbing Aerosol's Impact on Climate, B. Am. Meteorol. Soc., 97, 1131–1135, https://doi.org/10.1175/BAMS-D-15-00082.1, 2016.
Zuidema, P., Alvarado, M., Chiu, C., DeSzoeke, S., Fairall, C., Feingold, G., Freedman, A., Ghan, S., Haywood, J., Kollias, P., Lewis, E., McFarquhar, G., McComiskey, A., Mechem, D., Onasch, T., Redemann, J., Romps, D., and Turner, D.: Layered Atlantic Smoke Interactions with Clouds (LASIC) Field Campaign Report, 47, https://www.arm.gov/publications/programdocs/doe-sc-arm-18-018.pdf (last access: 3 July 2022), 2018a.
Zuidema, P., Sedlacek, A. J., Flynn, C., Springston, S., Delgadillo, R., Zhang, J., Aiken, A. C., Koontz, A., and Muradyan, P.: The Ascension Island Boundary Layer in the Remote Southeast Atlantic is Often Smoky, Geophys. Res. Lett., 45, 4456–4465, https://doi.org/10.1002/2017GL076926, 2018b.