the Creative Commons Attribution 4.0 License.
the Creative Commons Attribution 4.0 License.
 | 05 Jul 2022
Dramatic changes in atmospheric pollution source contributions for a coastal megacity in northern China from 2011 to 2020
Baoshuang Liu
Yanyang Wang
He Meng
Liuli Diao
Jianhui Wu
Laiyuan Shi
Jing Wang
Yufen Zhang
Understanding the effectiveness of long-term air pollution regulatory measures is important for control policy formulation. Efforts have been made using chemical transport modelling and statistical approaches to evaluate the efficacy of the Clean Air Action Plan (CAAP; 2013–2017) and the Blue Sky Protection Campaign (BSPC; 2018–2020) enacted in China. Changes in air quality due to reduction in emissions can be masked by meteorology, making it highly challenging to reveal the real effects of control measures. A knowledge gap still existed with respect to how sources changed before and after the CAAP and BSPC were implemented, respectively, particularly in coastal areas where anthropogenic emissions mixed with additional natural sources (e.g. marine aerosol). This work applied a machine-learning-based meteorological normalization approach to decouple the meteorological effects from air quality trend in a coastal city in northern China (Qingdao). Secondly, the relative changes in source contributions to ambient PM2.5 with a ∼ 10-year observation interval (2011–2012, 2016, and 2019) were also investigated. We discovered that the largest emission reduction section was likely from coal combustion as the meteorologically normalized SO2 dropped by ∼ 15.5 % yr−1, and the annual average dispersion-normalized decreased by ∼ 41.5 %. Change in the meteorologically normalized NO2 was relatively stable (∼ 1.0 % yr−1), and changed inappreciably in 2016–2019 but was significantly higher than that prior to the CAAP. Crustal dust decreased remarkably after the CAAP began. Industrial emissions, for example, steel-related smelting, decreased after 2016 due to the relocation of steel-making enterprises. Note that vehicle emissions were increased in importance as opposed to the other primary sources. Similar to other megacities, Qingdao is also at risk of increased ozone pollution that in turn facilitates secondary-particle formation in the future. The policy assessment approaches applied in this work also work for other places where air quality management is highly in demand to reduce air pollution.
- Article
(9644 KB) - Full-text XML
-
Supplement
(1297 KB) - BibTeX
- EndNote


Rapid industrial development and energy consumption in China over the past several decades have resulted in severe air pollution (Dai et al., 2021; Huang et al., 2014; Zhang et al., 2012). Fine particulate matter (PM2.5, particles with aerodynamic diameter ≤ 2.5 µm) is the leading health-risk factor for attributable mortality in China (Cohen et al., 2017). It is well documented that exposure to PM2.5 has been associated with increased mortality (Joshi et al., 2021; M. Liu et al., 2017; Vodonos and Schwartz, 2021). The World Health Organization recently set the annual average concentration of PM2.5 to 5 µg m−3. Most countries or regions are facing a great challenge now to meet the guideline since their current PM2.5 levels are well above the latest threshold.
To alleviate the severe impact of air pollution on the living environment and public health, the State Council of China released a 5-year “Air Pollution Prevention and Control Action Plan” in 2013 (hereinafter the “Clear Air Action Plan, CAAP”) (http://www.gov.cn/zwgk/2013-09/12/content_2486773.htm, last access: 29 October 2021). This was followed by the tighter “Three-year Action Plan to the Blue Sky Protection Campaign” (hereinafter the “Blue Sky Protection Campaign, BSPC”) in 2018 (http://www.gov.cn/zhengce/content/2018-07/03/content_5303158.htm, last access: 29 October 2021). The execution of these measures significantly improved air quality (Jiang et al., 2021) and thus has brought about appreciable health benefits (Huang et al., 2018). Vu et al. (2019) demonstrated that the control measures requested by the CAAP have tremendously reduced the emissions in PM2.5, PM10, NO2, SO2, and CO in Beijing from 2013 to 2017 by approximately 34 %, 24 %, 17 %, 68 %, and 33 %, respectively. Xu et al. (2021) found that by 2020, PM2.5 reduction measures avoided 3 561 000 morbidity cases and 24 000 premature deaths in the Beijing–Tianjin–Hebei region.
Evaluation of the effectiveness of air pollution controls is important for control policy formulation to further improve future air quality (Dai et al., 2020). Many studies have been carried out to evaluate the efficacy of control measures around the world. For example, assessments of short-term control measures were made for the 2008 Olympic Games (Schleicher et al., 2012), 2013 Second Asian Youth Games in Nanjing (Qi et al., 2016), 2014 Asia Pacific Economic Cooperation (W. Xu et al., 2019), 2015 Military Parade (Wang et al., 2017), and 2017 Belt and Road Forum for International Cooperation (Ma et al., 2020) as well as the 2020 COVID-19 worldwide lockdown (Beloconi et al., 2021; Y. Chen et al., 2020; Cucciniello et al., 2022; Shi et al., 2021; H. L. Wang et al., 2021). Medium-term (3–5 years) evaluations of the validity of control measures have also been examined (Li et al., 2021b; Yu et al., 2019; Zhang et al., 2019). In contrast, long-term (∼ 10 years) evaluations on controls were rarely reported (Masiol et al., 2019). The majority of such studies have focused primarily on the changes in concentrations of criterion air pollutants to qualitatively deduce the efficacy of source control (Cheng et al., 2019; Lyu et al., 2017; W. J. Li et al., 2020; Wang et al., 2014). For example, Vu et al. (2019) and Liang et al. (2016) applied random forest and non-parametric methods, respectively, to normalize the impact of meteorological factors to evaluate the changes in air pollutant concentrations and the effect of control measures in Beijing and other cities in China over recent time periods. However, quantitative evaluations of source emissions have not been common (Gulia et al., 2018) due to the lack of long-term particle composition monitoring (Hopke et al., 2020), and only a handful of studies quantitatively assessing source contributions smoothed the disturbance of weather conditions.
Qingdao, as an economically developed coastal megacity in northern China, has suffered severe air pollution (Bie et al., 2021; Gao et al., 2020; Li et al., 2017). It has been reported by Li et al. (2021a) that meteorology plays a critical role in the formation of pollution for this coastal region. In addition, based on measures taken in accordance with the CAAP since 2013 and the BSPC since 2018, source interventions such as the relocation and transformation of businesses and industries from the Old Town to port regions (Liu et al., 2021) have been implemented to improve the air quality in Qingdao. Up to now, the air quality in Qingdao has been greatly improved; the annual mean concentrations of PM2.5 and PM10 all decreased by 38 % from 2015 to 2020 based on the air quality monitoring data. Liu et al. (2020a) assessed the changes in O3 concentrations during the Shanghai Cooperation Organization (SCO) summit in Qingdao and analysed the impact of control measures on the emissions reduction in its precursors, and Liu et al. (2020b) also analysed the reasons for the increase in O3 concentration at nighttime during the SCO Summit. However, there is no report to date that has evaluated the effectiveness of these control measures based on a long-term timescale after these control measures were put into practice, especially for quantitating the changes in source contributions by smoothing the influences of weather conditions. In view of this, our work was mainly to evaluate the implementation of control measures utilizing the data of weather-normalized air pollutants, changes in chemical compositions in PM2.5, and source contributions as well as extra source origins from 2011 to 2020. Findings of this work are expected to provide the basis for policy development for a coastal megacity in the future.
2.1 Study region and sampling site
Qingdao is an economically developed coastal megacity of Shandong province, China (Fig. S1 in the Supplement). The variations in local economic and social developments from 2011 to 2019 were counted and are shown in Fig. S2 in the Supplement. During this period, the local resident population continued to rise, reaching 9 499 800 in 2019. The developed area and the possession of civil motor vehicles also showed an upward tendency, attaining 758.2 km2 and 3 062 445 units in 2019, respectively. The total energy consumption had a maximum of 16.891 × 10⁶ t standard coal in 2012 and maintained comparable levels from 2014 to 2019. The industrial coal burning capacity above the designated scale and the volume of liquefied petroleum supply both presented a downward trend with values of 10 965 708 and 30 210 t in 2019, respectively. The emissions of sulfur dioxide, nitrogen oxide, and dust basically showed a downward trend from 2011 to 2019, especially in 2017, and the emissions of these pollutants remained at relatively low levels after 2017, reflecting that the pollution sources for these particular pollutants had been effectively controlled in Qingdao.
In this study, in order to evaluate the effectiveness of control measures targeted for polluted sources in the past decade in Qingdao, ambient PM2.5 samples were collected at urban sites over three time periods during 2011–2012, 2016, and 2019. The 2011–2012 samples were collected before the CAAP was enacted in 2013, and the 2016 samples were collected at the end of the CAAP, while the 2019 samples were collected during the middle of the BSPC policy period. The sampling plan (detailed in the next section) was designed to capture changes in the data during these periods as any changes could reflect changes in the pollution sources during different stages of China's air pollution control measures. The sites of Licang and Shinan were sampled in 2011–2012, while five additional sites (Shibei, Laoshan, Chengyang, Huangdao, and Jiaonan) were sampled in 2016 and 2019 (Fig. S1). All collection sites were situated on building rooftops ∼ 10–15 m above ground level and used to collect ambient PM2.5 samples. Further descriptions of the seven sampling sites are shown in Table S1 in the Supplement.
2.2 Sampling and analysis
The sampling periods covered all seasons per year and lasted 41, 56, and 60 d for 2011–2012, 2016, and 2019, respectively (Table S2 in the Supplement). Particles were gathered simultaneously using polypropylene filters and quartz filters loaded onto sampling instruments. The details of the sampling instruments and filters in the different years are listed in Table S3 in the Supplement. Samples were collected for a duration of 22 h from 11:00 to 09:00 LT of the next day. Field blanks and parallel samples were synchronously collected at each site. Before sampling, to remove some volatile compounds and impurities, the quartz and polypropylene filters were baked in an oven at 500 and 60 ∘C for 2 h, respectively. After sampling, all the filters were stored at 4 ∘C before gravimetric and chemical analyses were conducted.
Before gravimetric analysis, filter equilibration for 48 h was needed under a constant temperature (20 ± 1 ∘C) and humidity (45 %–55 %). All filters were weighed by the microbalances with a resolution of 1 or 10 µg during different sampling periods; detailed information is listed in Table S4 in the Supplement. To ensure the accuracy, static was eliminated before weighting, and all filters were weighed at least twice to meet error requirements (Table S4). For chemical analysis, the elements of Na, Mg, Al, Si, K, Ca, Ti, V, Mn, Fe, Ni, Cu, Zn, and Pb were analysed in different years. For samples collected in 2011–2012 and 2016, inductively coupled plasma mass spectrometry (ICP-MS) was applied to determine these elements. For samples collected in 2019, inductively coupled plasma optical emission spectrometry (ICP-OES) was used to measure all related elements. Water-soluble inorganic ions of , , , and Cl− were determined using the ion chromatographs during different years. The organic carbon (OC) and elemental carbon (EC) of samples during different years were determined using a thermal–optical carbon analyser, based on the IMPROVE (in 2011–2012) and IMPROVE_A (in 2016 and 2019) thermal–optical reflectance protocol. The detailed instrumental information is listed in Table S5 in the Supplement, and analysis procedures and quality controls are described in Text S1 in the Supplement as well as prior works from Liu et al. (2021), Huang et al. (2021), Y. Y. Wang et al. (2021), and Tian et al. (2014).
2.3 Random forest (RF)-based weather normalization
From 1 January 2015 to 31 December 2020, the hourly concentrations of six air pollutants (PM2.5, PM10, SO2, NO2, CO, and O3) at the nine national air quality monitoring stations in Qingdao were collected from the China National Environmental Monitoring Network (CNEM) (http://106.37.208.233:20035, last access: 29 October 2021). Data collected from the nine monitoring stations were averaged to represent the pollution level at city scale. The explanatory variables including the meteorological variables and time variables were used to build the RF model and predict the air pollutant concentrations. Hourly surface meteorological data including wind speed, wind direction, temperature, dew point, relative humidity, and pressure recorded at Qingdao Liuting International Airport were downloaded using the “worldMet” R package (Carslaw, 2017). Time variables included Unix time (number of seconds since 1 January 1970), Gregorian day (day of the year), month, week, weekday, and hour of the day. Data were analysed in RStudio with a series of packages, and the details of the random forest (RF) model and weather normalization using the RF model are provided in Vu et al. (2019). The training data set was comprised of 80 % of the whole data, with the rest as testing data. After the RF predictive model was built for every pollutant, the model was then fed with a new data set comprised of the time variables as the original data set and meteorological variables that were resampled from the whole observation. The prediction process was repeated 500 times to predict the concentration of a pollutant. The 500 predicted concentrations were then averaged to calculate the weather-normalized concentration. The RF-based weather normalization technique has been extensively used to decouple meteorology from the observed concentrations and thus can detect interventions in emissions over time (Grange et al., 2018; Grange and Carslaw, 2019; Hou et al., 2022).
2.4 Theil–Sen regression
The Theil–Sen regression technique has been commonly used to explore the long-term trend of pollutants over years. This approach assumes monotonic linear trends (Masiol et al., 2019). Its principle is to calculate the slopes of all possible pairs of pollutant concentrations, select the median value, and give accurate confidence intervals (Munir et al., 2013; Sen, 1968). In this study, the data of air pollutants obtained from RF modelling with weather normalization was de-seasonalized as the Theil–Sen regression was being performed. The Theil–Sen function is provided by the “openair” R package.
2.5 Dispersion normalization
Although the RF-based weather normalization method can decouple the overall weather effects well, it needs a large quantity of data to train the model well before de-weathering. There is a big difference in the size and time resolution between the routine air quality data and the offline filter-based measured PM2.5 chemical compositional data. However, the meteorological dispersion can be quantified by the ventilation coefficient (VC) (Kleinman et al., 1976; Iyer and Raj, 2013). Although the VC normalization that needs VC data to be known a priori can only decouple the local dispersion, it is relatively simple and useful to decouple the impact of dispersion (Ding et al., 2021). Therefore, this normalized approach is very suitable for the offline data with small size and poor continuity.
In this study, the VC data are obtained from the multiplication of mixed layer height (MLH) and the mean wind speed (WS) within the mixed layer (Eq. 1). Based on a VC at a given time interval i, the normalized concentration can be obtained by Eq. (2):
where VCi (m2 s−1) is the ventilation coefficient during period i; VCmean (m2 s−1) is the mean VC during the whole study period; and Cvc,i (µg m−3) and Ci (µg m−3) are the normalized and observed concentrations, respectively. In this study, the dispersion normalization was conducted for the data of offline PM2.5 and chemical compositions and the resolved source contributions. The surface wind speed at 10 m was replaced with the mean wind speed through MLH because of the absence of wind speed at different heights (Dai et al., 2020; Ding et al., 2021). The 3 h resolution data of MLH and WS were derived from archived meteorology of the National Ocean and Atmospheric Administration (https://www.ready.noaa.gov/READYamet.php, last access: 29 October 2021), and the calculated daily MLH and WS data were used in this study.
2.6 Positive matrix factorization (PMF)
In order to assess the effectiveness of pollution control, source categories and their contributions were estimated by the PMF method. The PMF decomposes a sample composition data set (X) into two matrices including source profiles (F) and source contributions (G) (Paatero and Tapper, 1994). This principle can be refined as follows:
where xij is the concentration (µg m−3) of the jth component from the ith sample, gik means the contribution (µg m−3) of the kth source to the ith sample, fkj represents the source profile (µg µg−1) of the jth component from the kth source, eij is the residual (µg m−3) of the jth component of the ith sample, and p means the number of sources. In this study, US EPA PMF v5.0 was applied to carry out source apportionment, and the details of the treatment of input data and method detection limits of chemical compositions are described in Table S6 and Text S2 in the Supplement, respectively. Bootstrap (BS) and displacement (DISP) analyses were used to investigate the effects of measurement error and rotation ambiguity on the resulting solutions.
2.7 Potential source contribution function (PSCF)
We performed PSCF to further investigate the origin of polluted sources. First, the 72 h backward trajectories were calculated at 6 h intervals every day with a starting height of 100 m above ground level in Qingdao (36.10∘ N, 120.32∘ E), using the Hybrid Single-Particle Lagrangian Integrated Trajectory (HYSPLIT) model in the GIS-based software of TrajStat (Wang et al., 2009). The weather data were acquired from Global Data Assimilation System with a horizontal resolution of 1∘ latitude–longitude (available at http://www.arl.noaa.gov/, last access: 29 October 2021). PSCF was then analysed based on the trajectories added to source concentrations. The study region was divided into equal-sized grid cells; thus the number of endpoints for given specific values in every cell could be obtained. According to a pre-set threshold criterion, the PSCF value was the proportion of the number of endpoints beyond the threshold criterion in each cell. To improve the accuracy of the result, the weighted PSCF was calculated. More details are given in Text S3 in the Supplement.
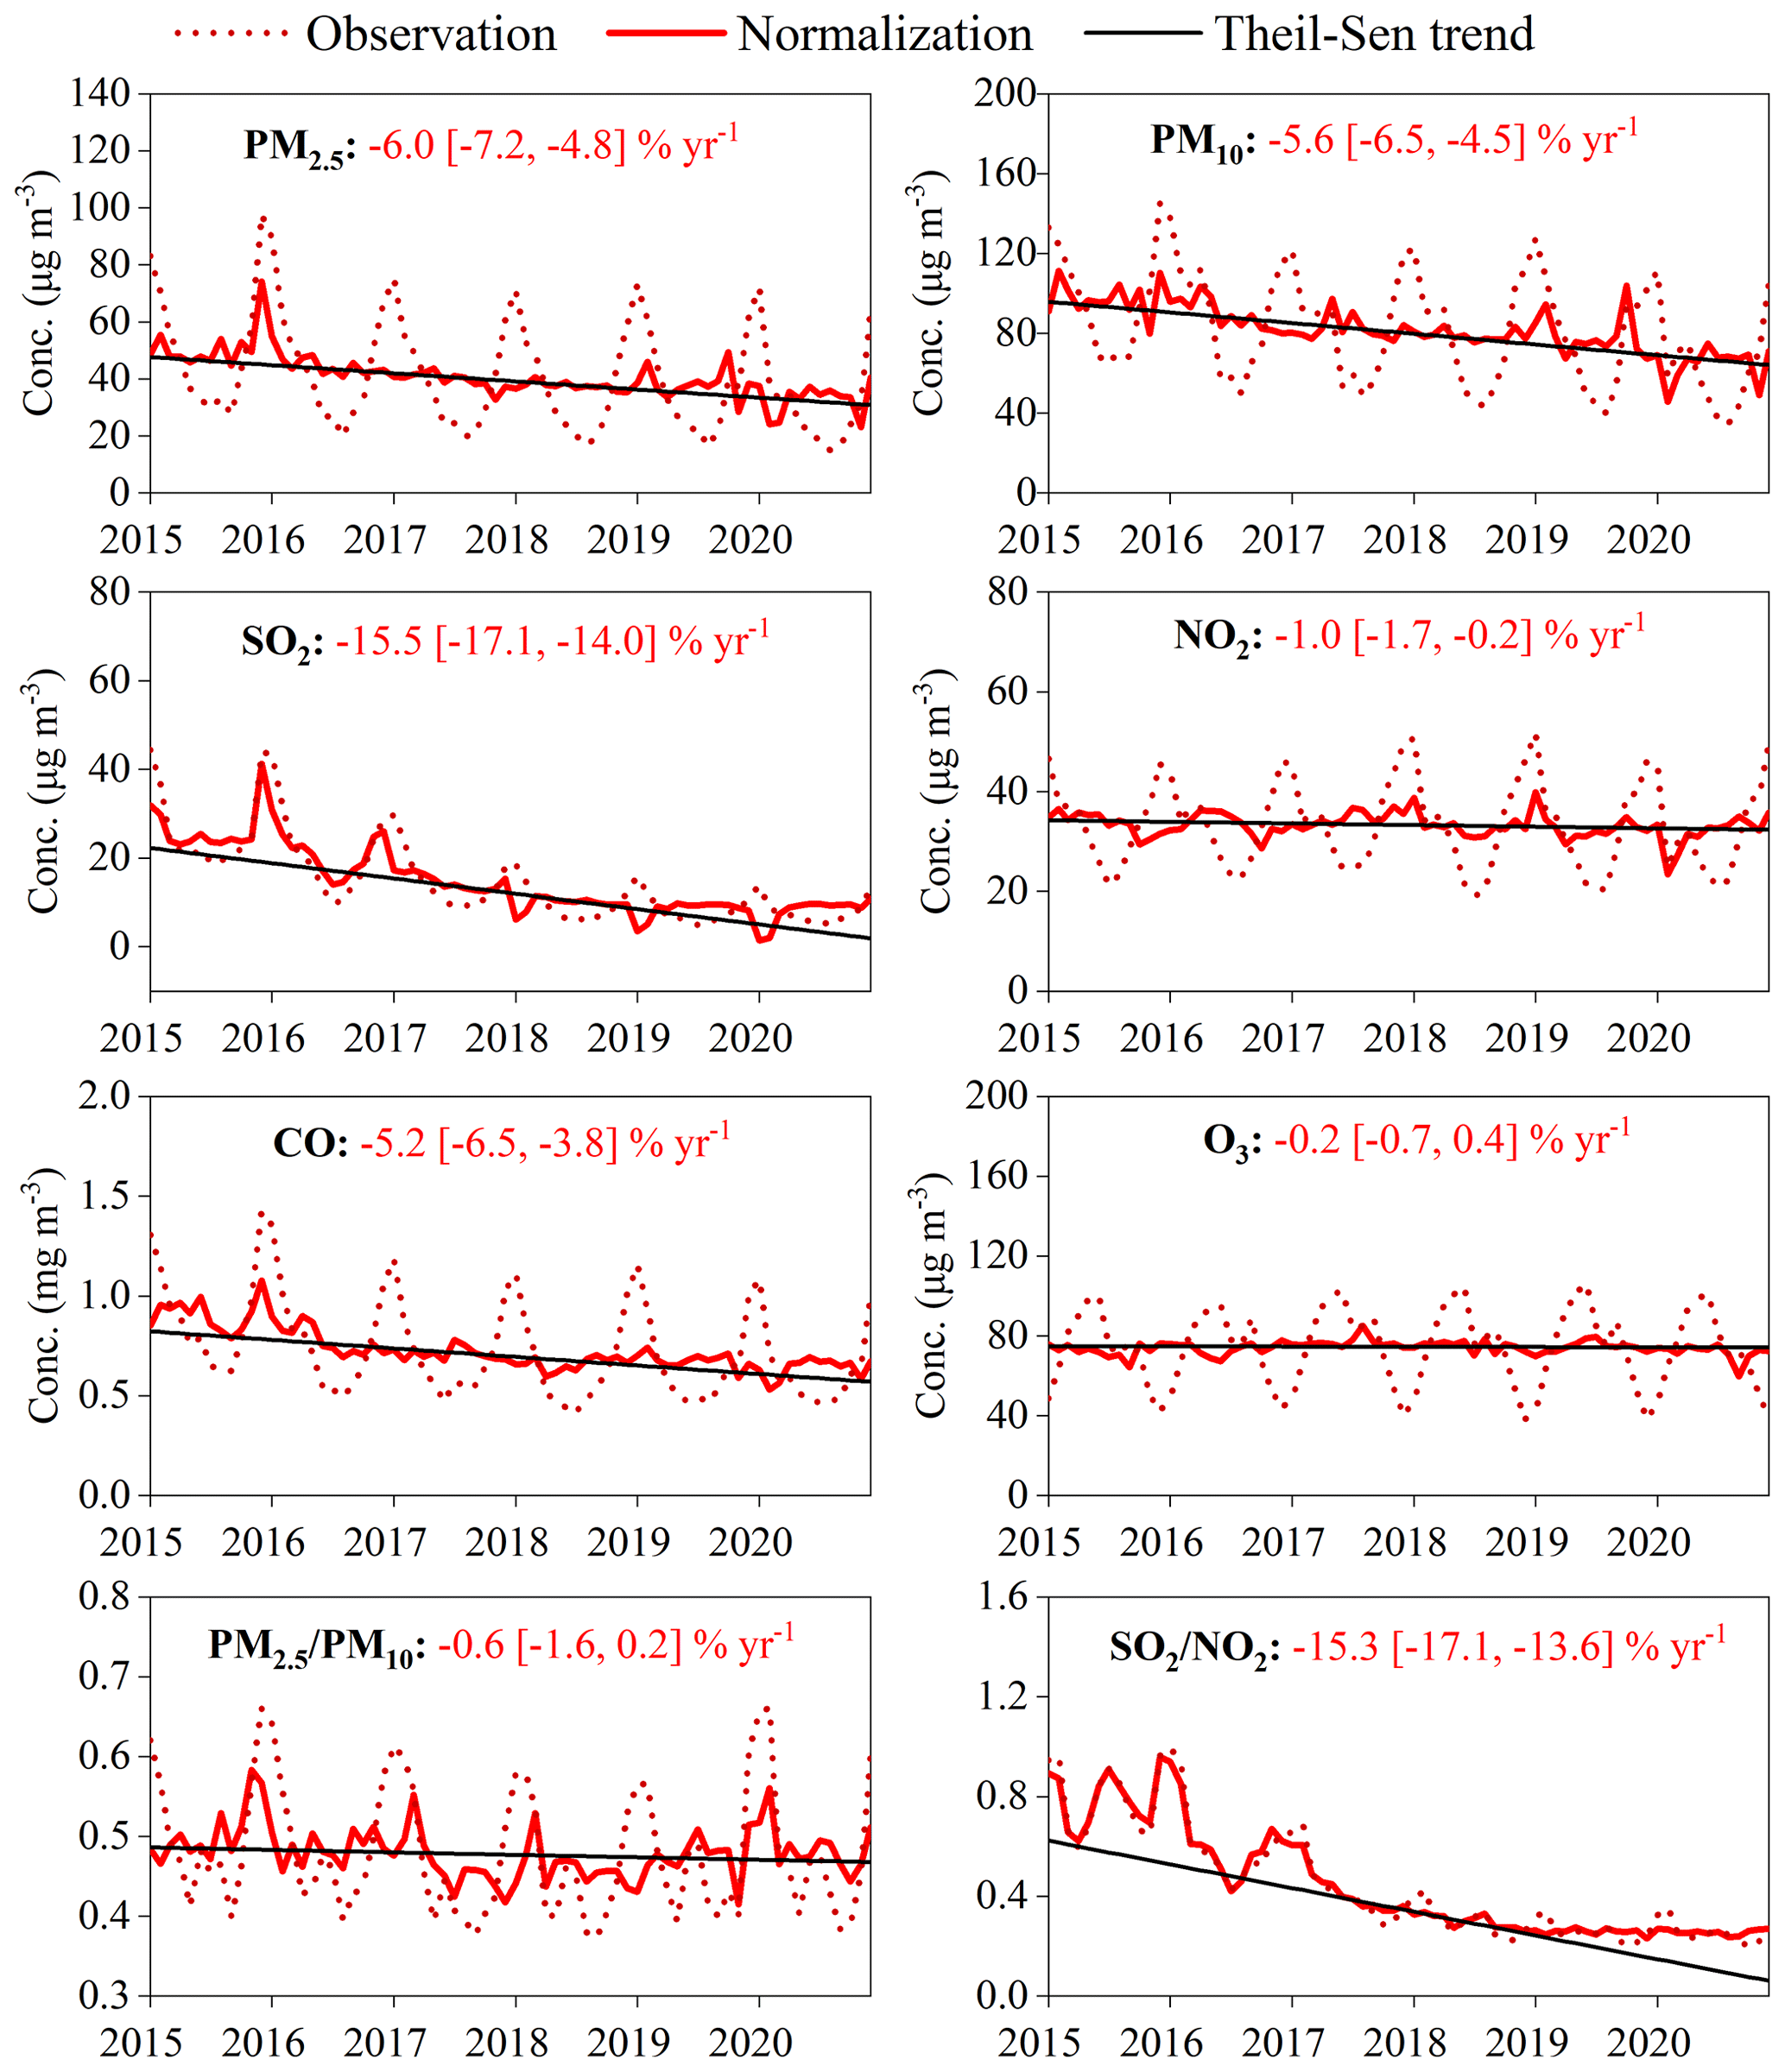
Figure 1Trends of air pollutant concentrations and and from 2015 to 2020. “Observation” represents the observed data, and “normalization” represents the modelled concentrations of air pollutants after weather normalization. The black line shows the Theil–Sen trend after weather normalization.
3.1 Variation characteristics of the air quality
3.1.1 Trend analysis and annual changes
The annual mean concentration of PM2.5 and PM10 in Qingdao decreased by 38 % and 38 % from 51 and 98 µg m−3 in 2015 to 32 and 61 µg m−3 in 2020, respectively. The annual mean was 0.47 ± 0.02, with little change from 2015 to 2020, suggesting a significant impact of coarse-particle sources (e.g. dust) in Qingdao. The annual mean levels of SO2 and NO2 declined by 72 % and 8 % from 27 and 33 µg m−3 in 2015 to 8 and 31 µg m−3 in 2020, respectively. The concentration of SO2 showed a significant downward trend, while that of NO2 changed little, probably indicating that the impact of coal-fired sources was significantly reduced, while the impact of mobile sources might still be obvious. The annual mean level of CO decreased by 32 % from 0.91 mg m−3 in 2015 to 0.62 mg m−3 in 2020, while that of O3 changed little, ranging from 71 to 69 µg m−3.
In order to shield the impact of meteorological dispersion, the normalized air quality parameters were acquired using the RF algorithm under 30-year-average (1990–2020) meteorological conditions. The Theil–Sen trends of air pollutant concentrations after weather normalization by RF modelling are shown in Fig. 1. The decreasing real trend for air pollutants except for O3 was found after the weather normalization (Fig. 1), indicating that the air quality is gradually improving in Qingdao. The trends of the normalized air quality parameters represent the effects of emission control and, in some cases, associated chemical processes (Vu et al., 2019). The Theil–Sen trend analysis of air pollutant concentrations and and after the weather normalization is also shown in Fig. 1. Compared with other air pollutants, the decline rate of SO2 concentration was the highest (15.5 % yr−1), whereas that of O3 concentration was the lowest (0.2 % yr−1). Note that the decline rate of PM2.5 concentration (6.0 % yr−1) was higher than that of PM10 concentration (5.6 % yr−1), which led to a slight downward trend for (0.6 % yr−1), indicating that the impact of coarse-particle sources such as dust might be prominent. The decline rate of SO2 concentration was higher than that of NO2 concentration (1.0 % yr−1), resulting in a higher decline rate of 15.3 % yr−1, indicating that the control effect of stationary sources was better than that of mobile sources (Nirel and Dayan, 2001). It was found that CO concentration also performed an obvious decreasing trend, with the decrease rate reaching 5.2 % yr−1, whereas the downward trend of O3 concentration was not prominent. The normalized medians of PM2.5, PM10, SO2, NO2, CO, and O3 decreased by 2.8, 5.4, 3.4, 0.3, 42.8, and 0.1 , respectively (Table S7 in the Supplement). Similar to this study, Vu et al. (2019) found that primary emission controls required by the CAAP in Beijing have led to substantial reductions in PM2.5, PM10, NO2, SO2, and CO from 2013 to 2017 of approximately 34 %, 24 %, 17 %, 68 %, and 33 %, respectively, after meteorological normalization. Zhai et al. (2019) suggested that the decreased mean PM2.5 across China was 4.6 in the meteorology-corrected data from 2013 to 2018, and the Beijing–Tianjin–Hebei, the Yangtze River Delta, the Pearl River Delta, the Sichuan Basin, and the Fenwei Plain decreased 8.0, 6.3, 2.2, 4.9, and 5.0 , respectively. Overall, the concentrations of most air pollutants (i.e. PM2.5, PM10, SO2, NO2, and CO) in China have shown a decreasing trend in recent years (C. K. Zhao et al., 2021; Fan et al., 2020), while that of O3 has performed an increasing trend (K. Li et al., 2020; Ma et al., 2021), which further facilitated secondary-particle formation (Nøjgaard et al., 2012).
Figure S3 in the Supplement compares the trends of air pollutants before and after normalization from 2015 to 2020, which are largely different depending on meteorological conditions (Vu et al., 2019). The annual average concentrations of PM2.5, PM10, SO2, NO2, CO, and O3 after normalization were higher than the actual observed concentrations. Compared with 2018, the observed concentrations of air pollutants in 2019 showed an increase to varying degrees; however, the increasing values of annual average concentrations for PM2.5, PM10, SO2, CO, and O3 after normalization decreased, and even the NO2 concentration after normalization also decreased. This indicates that the meteorological conditions in 2019 reduced the effect of actual control to some extent. Up to that point, emission control had resulted in reductions in PM2.5, PM10, SO2, NO2, CO, and O3 concentrations by 17.7 %, 31.9 %, 18.4 %, 1.7 %, 0.3 %, and 0.4 % from 2015 to 2020, respectively, highlighting that much work is still needed to ensure the decrease in NO2 and O3 concentrations in the future.
3.1.2 Changes in the air quality in the two control stages
In order to assess the changes in ambient air quality in Qingdao during different policy control periods, this study analysed the changes in air pollutant concentrations during two stages: the CAAP period (stage 1: 2015–2017) and the BSPC period (stage 2: 2018–2020). The observed annual mean concentrations for PM2.5 and PM10 during stage 1 were 45 and 89 µg m−3, respectively (Table S8 in the Supplement), and their annual average decline rates were 11.9 % and 8.0 % after weather normalization, respectively. K. Li et al. (2019) found that PM2.5 decreased by 30 %–40 % across China during 2013–2017 in response to the governmental Clean Air Action. Compared with stage 1, the annual average concentrations of PM2.5 and PM10 observed in stage 2 were 35 and 71 µg m−3, respectively (Table S8), and the decline range after normalization was reduced, with decline rates of 5.3 % and 7.0 %, respectively (Fig. 2). However, ratios during two stages were less than 0.5, suggesting that the impact of dust sources might be obvious in the two stages. Note that the mean observed annual concentration of SO2 was 21 µg m−3 in stage 1 (Table S8), and its annual average decline rate reached 25.0 % after normalization (Fig. 2), which was significantly higher than that of other pollutants. Compared with stage 1, the observed annual average concentration of SO2 in stage 2 was only 8 µg m−3 (Table S8), and the annual decline rate of SO2 concentration after normalization still reached 17.1 % (Fig. 2), indicating that Qingdao had achieved remarkable results in the control of coal combustion during the two stages. The observed annual mean concentrations for NO2 and O3 during stage 1 were 34 and 73 µg m−3, respectively (Table S8), and their annual increase rates after normalization were 1.5 % and 2.8 %, respectively (Fig. 2). A study showed that surface ozone pollution in China worsened over stage 1 (K. Li et al., 2019). The observed annual mean concentrations of NO2 and O3 in stage 2 32 and 71 µg m−3, respectively (Table S8), while their annual decline rates after normalization were only 2.7 % and 2.0 %, respectively (Fig. 2). This indicates that the impact of motor vehicles in Qingdao could be greater than expected. Meanwhile, NO2 and volatile organic compounds emitted from motor vehicles (Tsai et al., 2010) are important precursors for the formation of O3 (Pugliese et al., 2014), which were found to have further enhanced the O3 concentration in Qingdao's atmosphere. The mean observed annual concentrations for CO were 0.80 and 0.64 mg m−3 in stages 1 and 2, respectively (Table S8), and the annual average decline rates were 11.4 % and 3.2 % after normalization, respectively (Fig. 2), suggesting that there might have been a benefit from the significant control effect of coal-fired sources.
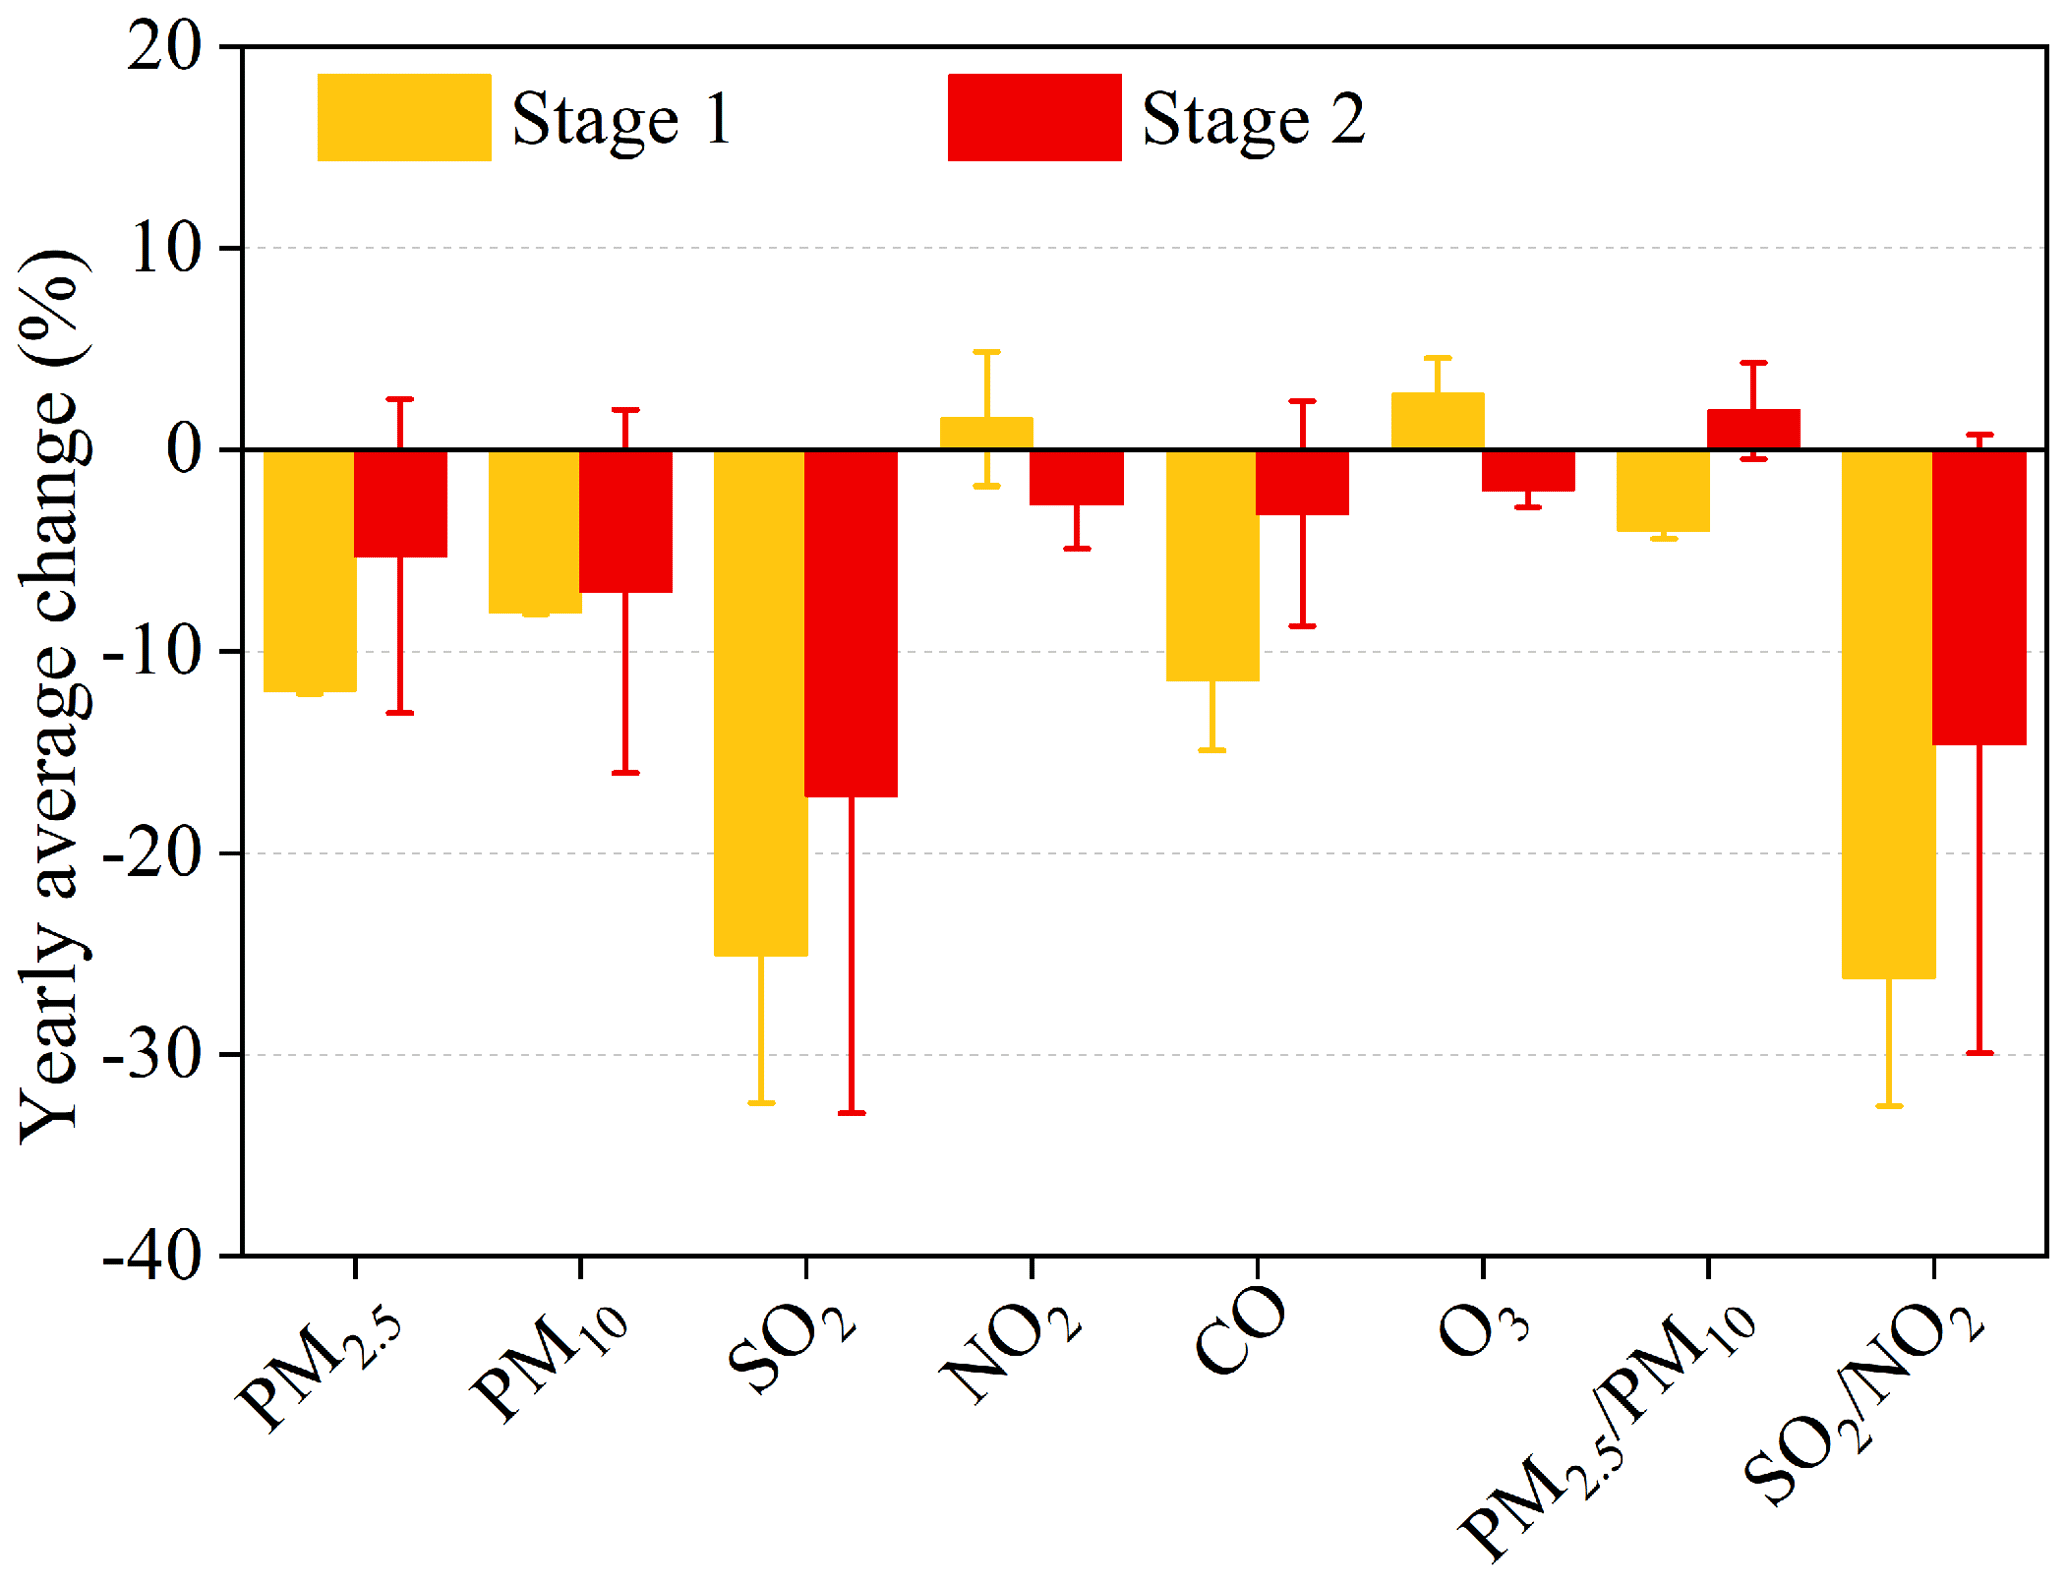
Figure 2Yearly average change in air pollutants and and during different pollution-control stages based on the weather-normalized data.
Diurnal variations in concentrations of air pollutants and and after normalization in the two stages are shown in Fig. S4 in the Supplement. The diurnal variation in PM2.5 concentration in the two stages was basically the same; however, the concentration of PM2.5 in stage 2 was significantly lower than that in stage 1. Diurnal variation in PM10 concentration in the two stages was similar to PM2.5. The daily variations in in the two stages were basically the same, and the between 06:00–20:00 in stage 2 was slightly lower than that in stage 1, probably suggesting that the impact of dust increased slightly during this period. The diurnal variations in SO2 and CO concentrations during stages 1 and 2 were generally consistent, whereas their concentrations in stage 2 were substantially lower than those in stage 1, which might indicate that the control effects of coal combustion in Qingdao in stage 2 was obvious. In contrast, the diurnal variations in NO2 concentrations in stages 1 and 2 were basically consistent with the values at each time, suggesting that the impact of motor vehicles in Qingdao might still be significant, especially the morning and evening peaks and between 21:00 and 23:00 at night. The daily variations in O3 concentrations were highly consistent in the two stages, especially between 14:00 and 17:00, and O3 pollution was still severe. In general, compared with stage 1, the concentrations of PM2.5, PM10, SO2, and CO in stage 2 decreased remarkably at all times, while those of NO2 and O3 remained basically unchanged at all times, indicating that the control effect of coal-fired sources in Qingdao was significant, whereas the impact of motor vehicles and O3 pollution was more obvious.
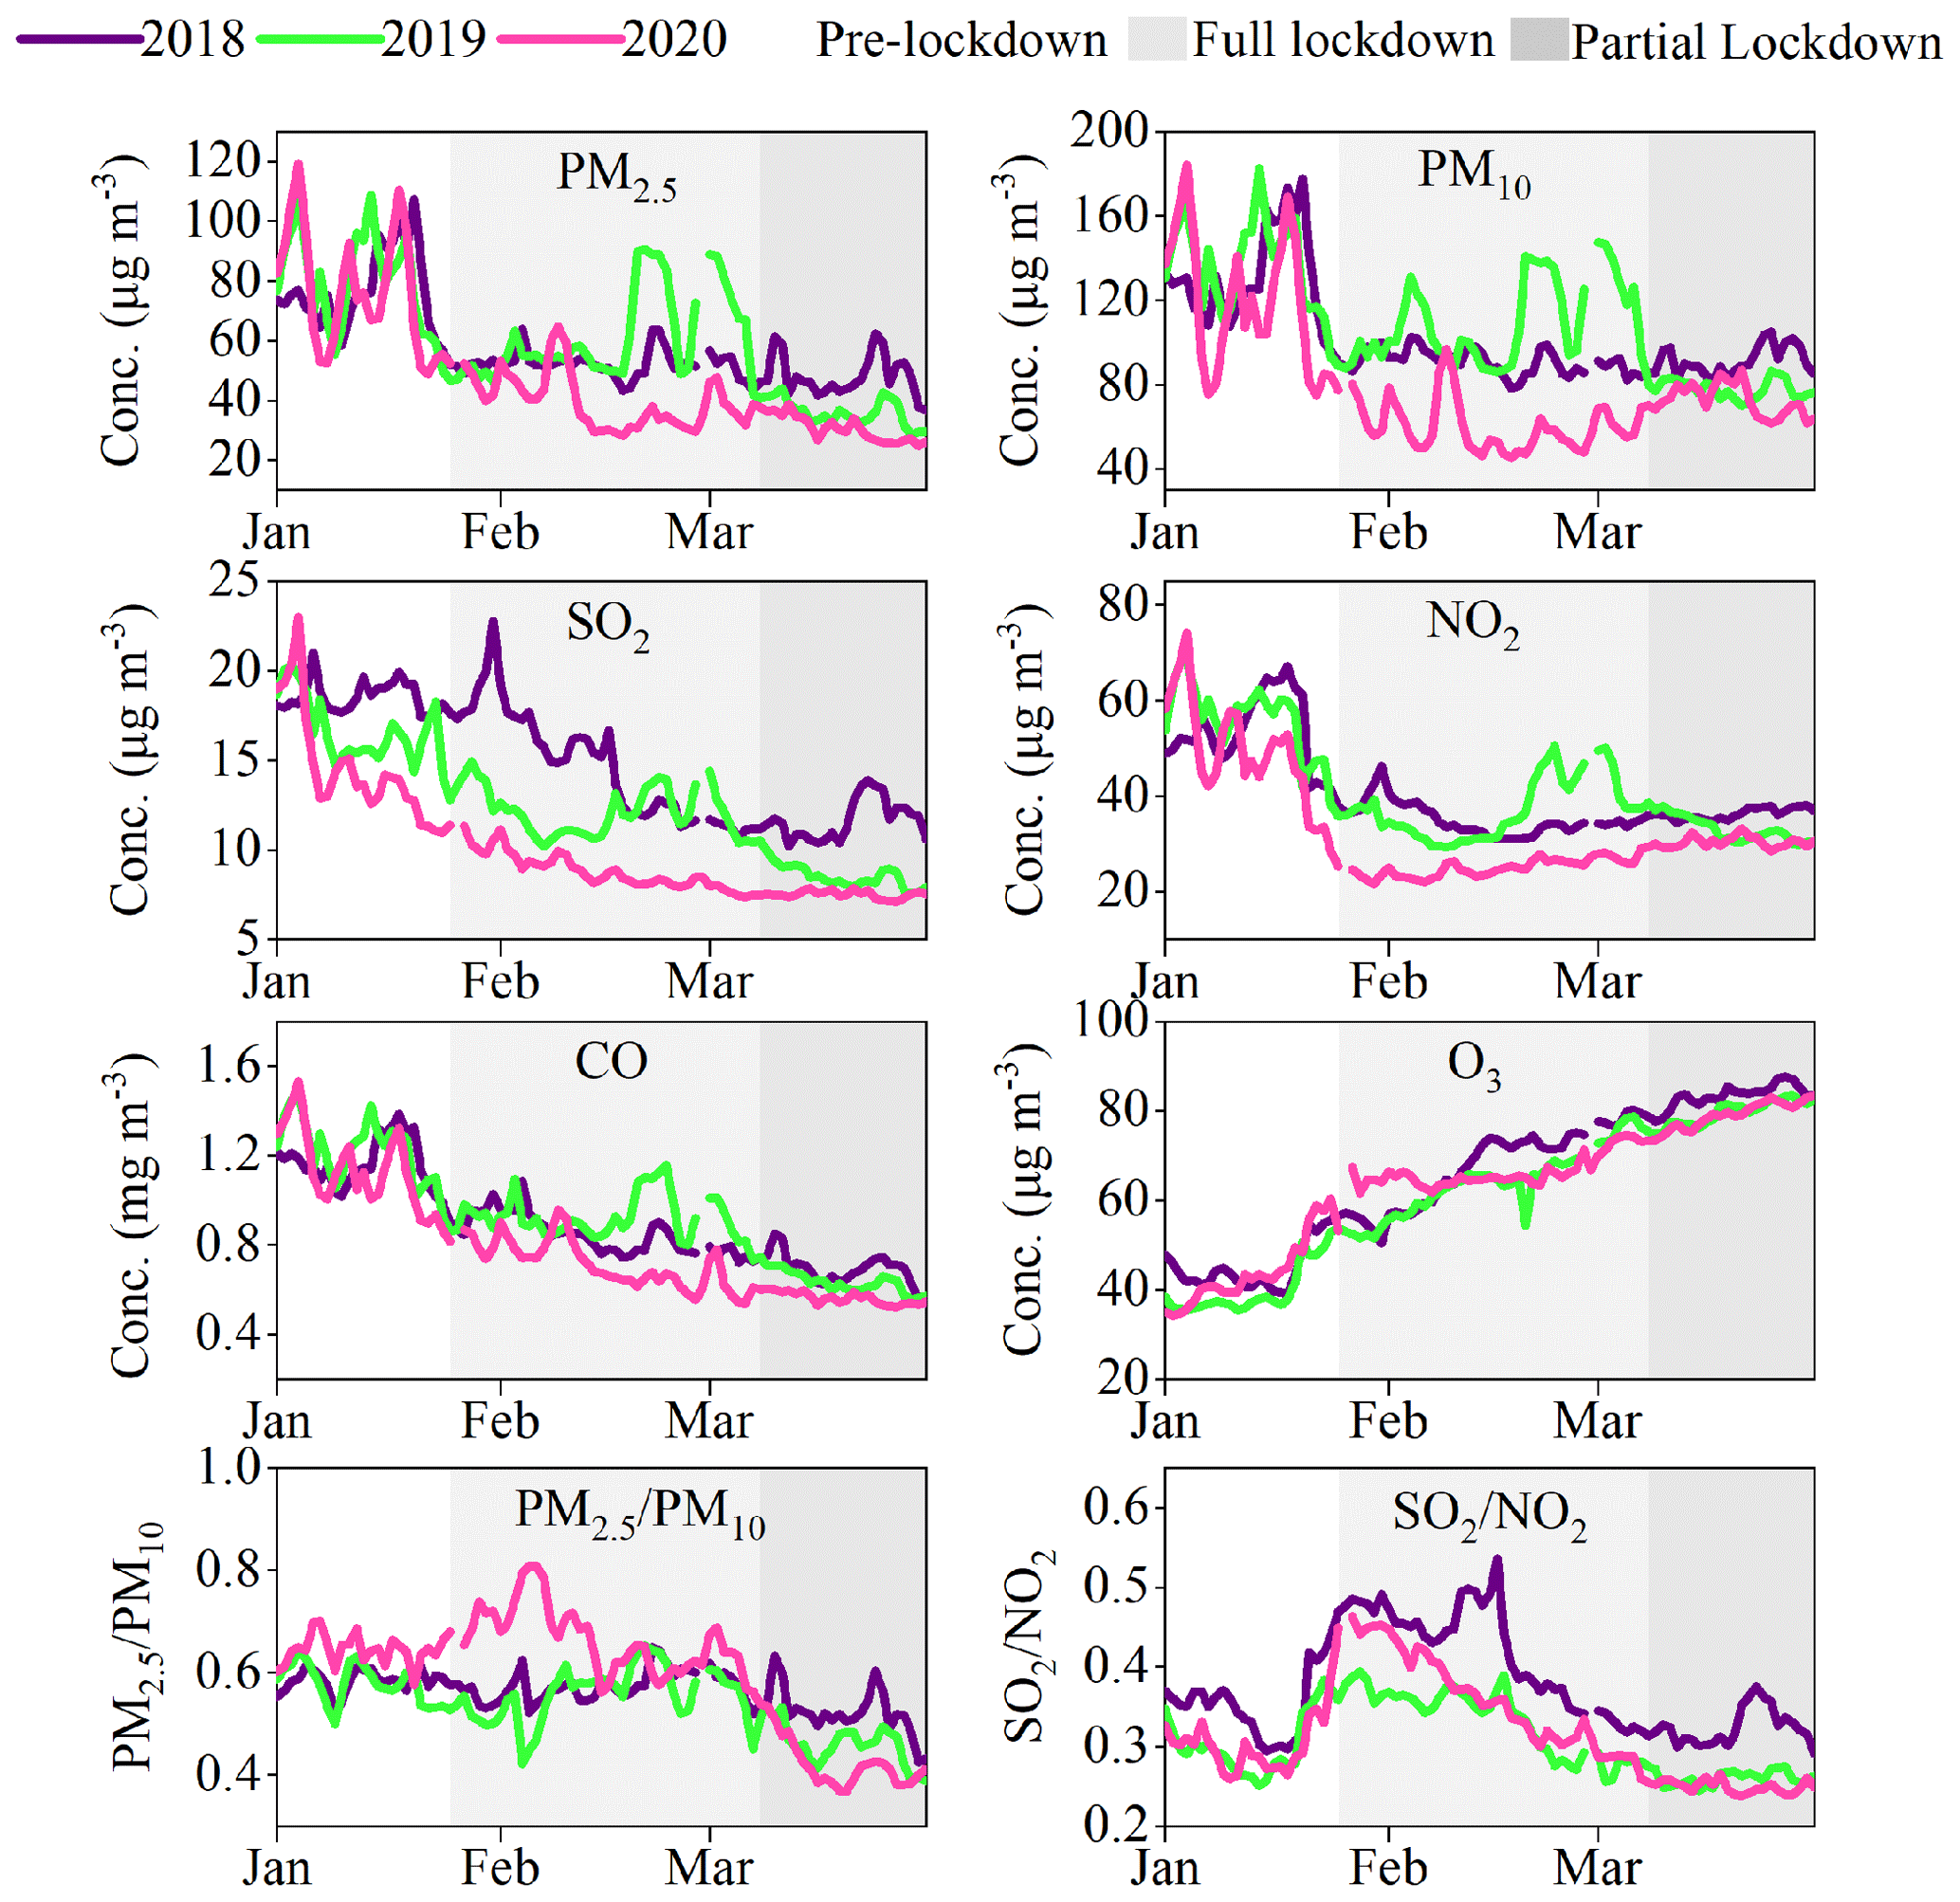
Figure 3Time series of air pollutant concentrations and and during the different stages of COVID-19 lockdown start dates or equivalent in 2020 versus 2018 and 2019 based on the weather normalization data.
3.1.3 Changes in air quality after the COVID-19 lockdown
In response to the COVID-19 outbreak, a series of lockdown measures were implemented in China to curb the virus transmission, resulting in a significant decrease in traffic and industrial activities. These limitations provided an opportunity to investigate critical pollution sources that could potentially be better managed in the future to further improve the air quality. In order to explore the changes in air quality in Qingdao during the COVID-19 lockdown period, combined with the specific lockdown situation of Qingdao (http://wsjkw.shandong.gov.cn/ywdt/xwtt/202001/t20200124_3420319.html (last access: 29 October 2021); http://www.shandong.gov.cn/art/2020/3/7/art_119816_350607.html, last access: 29 October 2021), this study divided the lockdown period into three stages: pre-lockdown (1 to 24 January, 2020), full lockdown (25 January to 7 March, 2020), and partial lockdown (8 to 31 March, 2020). The time series and average values of air pollutant concentrations and and during different lockdown stages and their corresponding periods in 2018 and 2019 are shown in Fig. 3 and Tables S9 and S10 in the Supplement. According to the weather normalization data, compared with those before the lockdown, the concentrations of PM2.5, PM10, SO2, NO2, and CO decreased substantially during the full lockdown, among which the concentrations of PM10 and NO2 decreased the most (49.5 % and 49.0 %, respectively), followed by PM2.5 (47.8 %) (Table S11 in the Supplement), which was closely related to the significant decrease in traffic and construction activities during the full lockdown (Collivignarelli et al., 2021; Hong et al., 2021; H. L. Wang et al., 2021). Note that the O3 concentration increased apparently by 50.8 % during the full lockdown (Table S11), suggesting that the atmospheric oxidation might be enhanced during this period, similar to the study of Chu et al. (2021), Ding et al. (2021), He et al. (2020), and Le et al. (2020). Meanwhile, the marked decrease in NO2 during the full lockdown can also weaken the “NOx titration effect”, further resulting in a higher O3 level during this period. PM10 and NO2 concentrations rebounded significantly during partial lockdown, increasing by 20.3 % and 21.1 % compared with the full lockdown, respectively, likely due to the increased impacts of traffic activities and related road dust. The concentrations of PM2.5, SO2, and CO further decreased during the partial lockdown. The study from Yin et al. (2021) showed that the decrease in PM2.5 concentration might be mainly due to the meteorological conditions.
Compared with the same period in 2018, the concentrations of PM2.5, PM10, SO2, NO2, CO, and O3 decreased obviously during the full lockdown, of which the reduction range of SO2 concentration was the greatest (39.8 %), whereas that of O3 concentration was relatively the lowest (1.8 %) (Table S12 in the Supplement). Compared with the corresponding period in 2019, the concentrations of PM2.5, PM10, SO2, NO2, and CO decreased by 34.5 %, 44.8 %, 27.0 %, 32.6 %, and 22.3 % during the full lockdown, respectively, while that of O3 increased by 3.9 % (Table S12). This shows that the COVID-19 lockdown measures led to the marked decrease in the primary emissions of air pollutants. Meanwhile, the concentrations of particulate matter and NO2 decreased substantially during the full lockdown. Since there are relatively few industrial enterprises in the urban area of Qingdao, NO2 is mainly emitted from motor vehicles. Therefore, this suggested that the control of motor vehicles under normal conditions should play an important role in the improvement of air quality in Qingdao.
3.2 Changes in meteorological conditions and chemical compositions
In this study, the VC in the same period was used to normalize the concentrations of chemical compositions in PM2.5. After decoupling the impacts of meteorological dispersion, the changes in the concentrations of major chemical compositions in the different years were analysed to better reflect the impacts of source emissions (Dai et al., 2020; Ding et al., 2021). In 2011–2012, 2016, and 2019, the annual average MLHs in Qingdao were 399, 383, and 414 m, respectively (Fig. S5 in the Supplement). However, the average wind speed in 2016 was significantly higher than that in other years, reaching 3.3 m s−1. The VC showed an increasing trend year by year, from 1292.7 to 1555.4 m2 s−1 (Fig. S5), suggesting that the atmospheric dispersion conditions in Qingdao were gradually increasing. The average VC of Qingdao in 3 years was 1432.6 m2 s−1, and higher MLH usually corresponds to higher wind speed. Time series of observed concentrations and normalized concentrations of PM2.5 and chemical compositions are shown in Fig. S6 in the Supplement. The observed and VC-normalized concentrations of PM2.5 during the whole study period were 93 and 83 µg m−3, respectively, suggesting that the unfavourable meteorological conditions might increase PM2.5 by approximately 10 µg m−3, which was substantially lower than that reported by the study of Ding et al. (2021) in Tianjin. Zhai et al. (2019) found that the mean PM2.5 in the meteorology-corrected data from 2013 to 2018 was 12 % lower than in the original data, meaning that 12 % of the PM2.5 decrease in the original data was attributable to the meteorology. However, Gong et al. (2022) suggested that the meteorology can explain approximately 20 %–33 % of the PM2.5 variations.
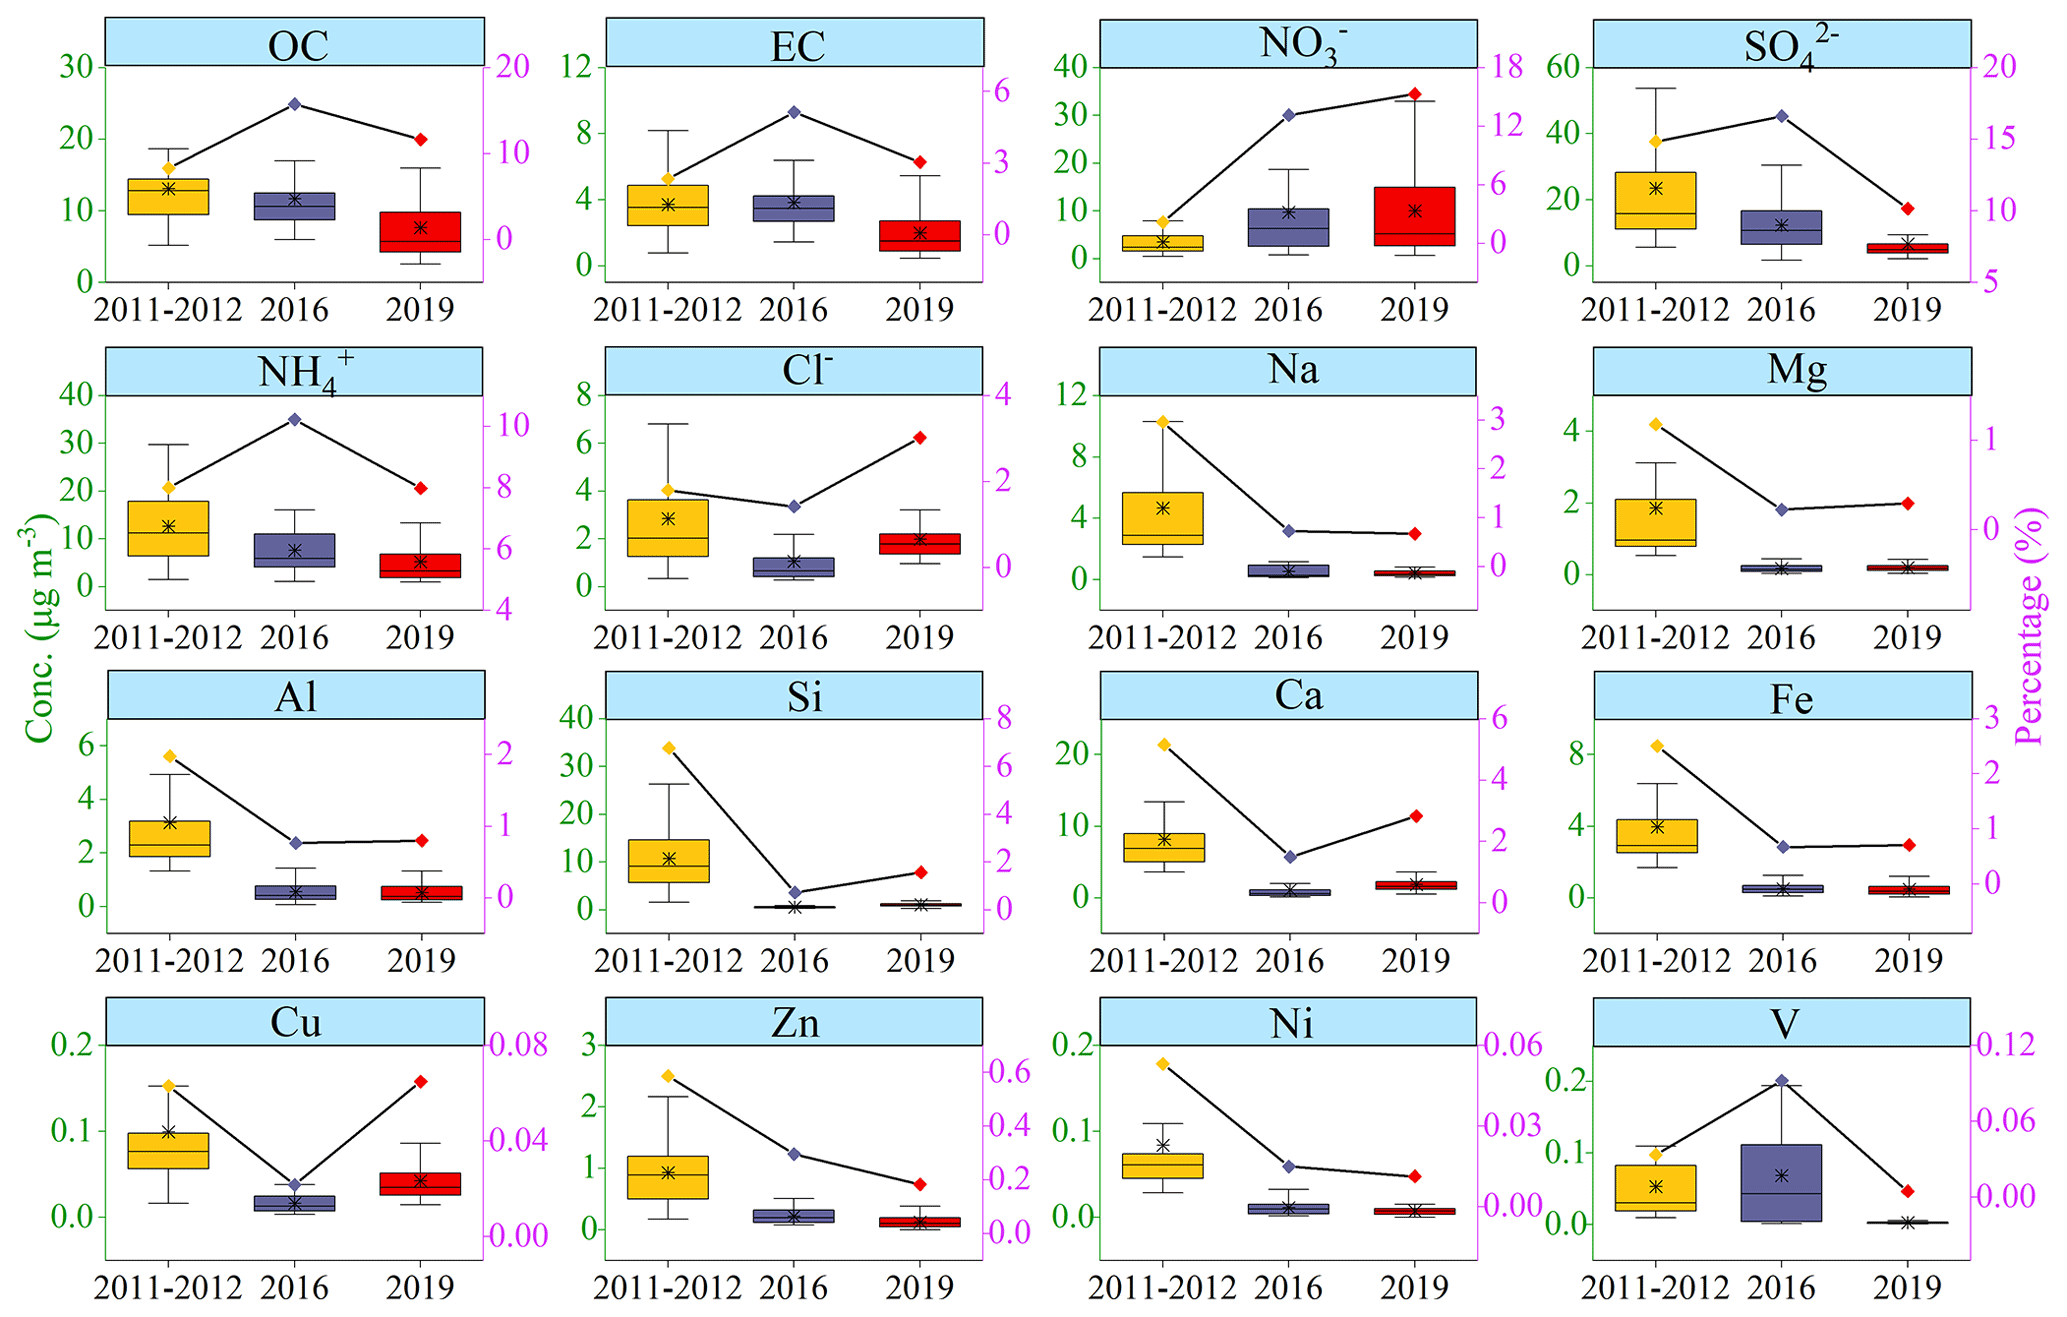
Figure 4Variations in the average concentrations and percentages of major chemical compositions of PM2.5 in 2011–2012, 2016, and 2019. Box charts represent concentrations, and line charts represent percentages.
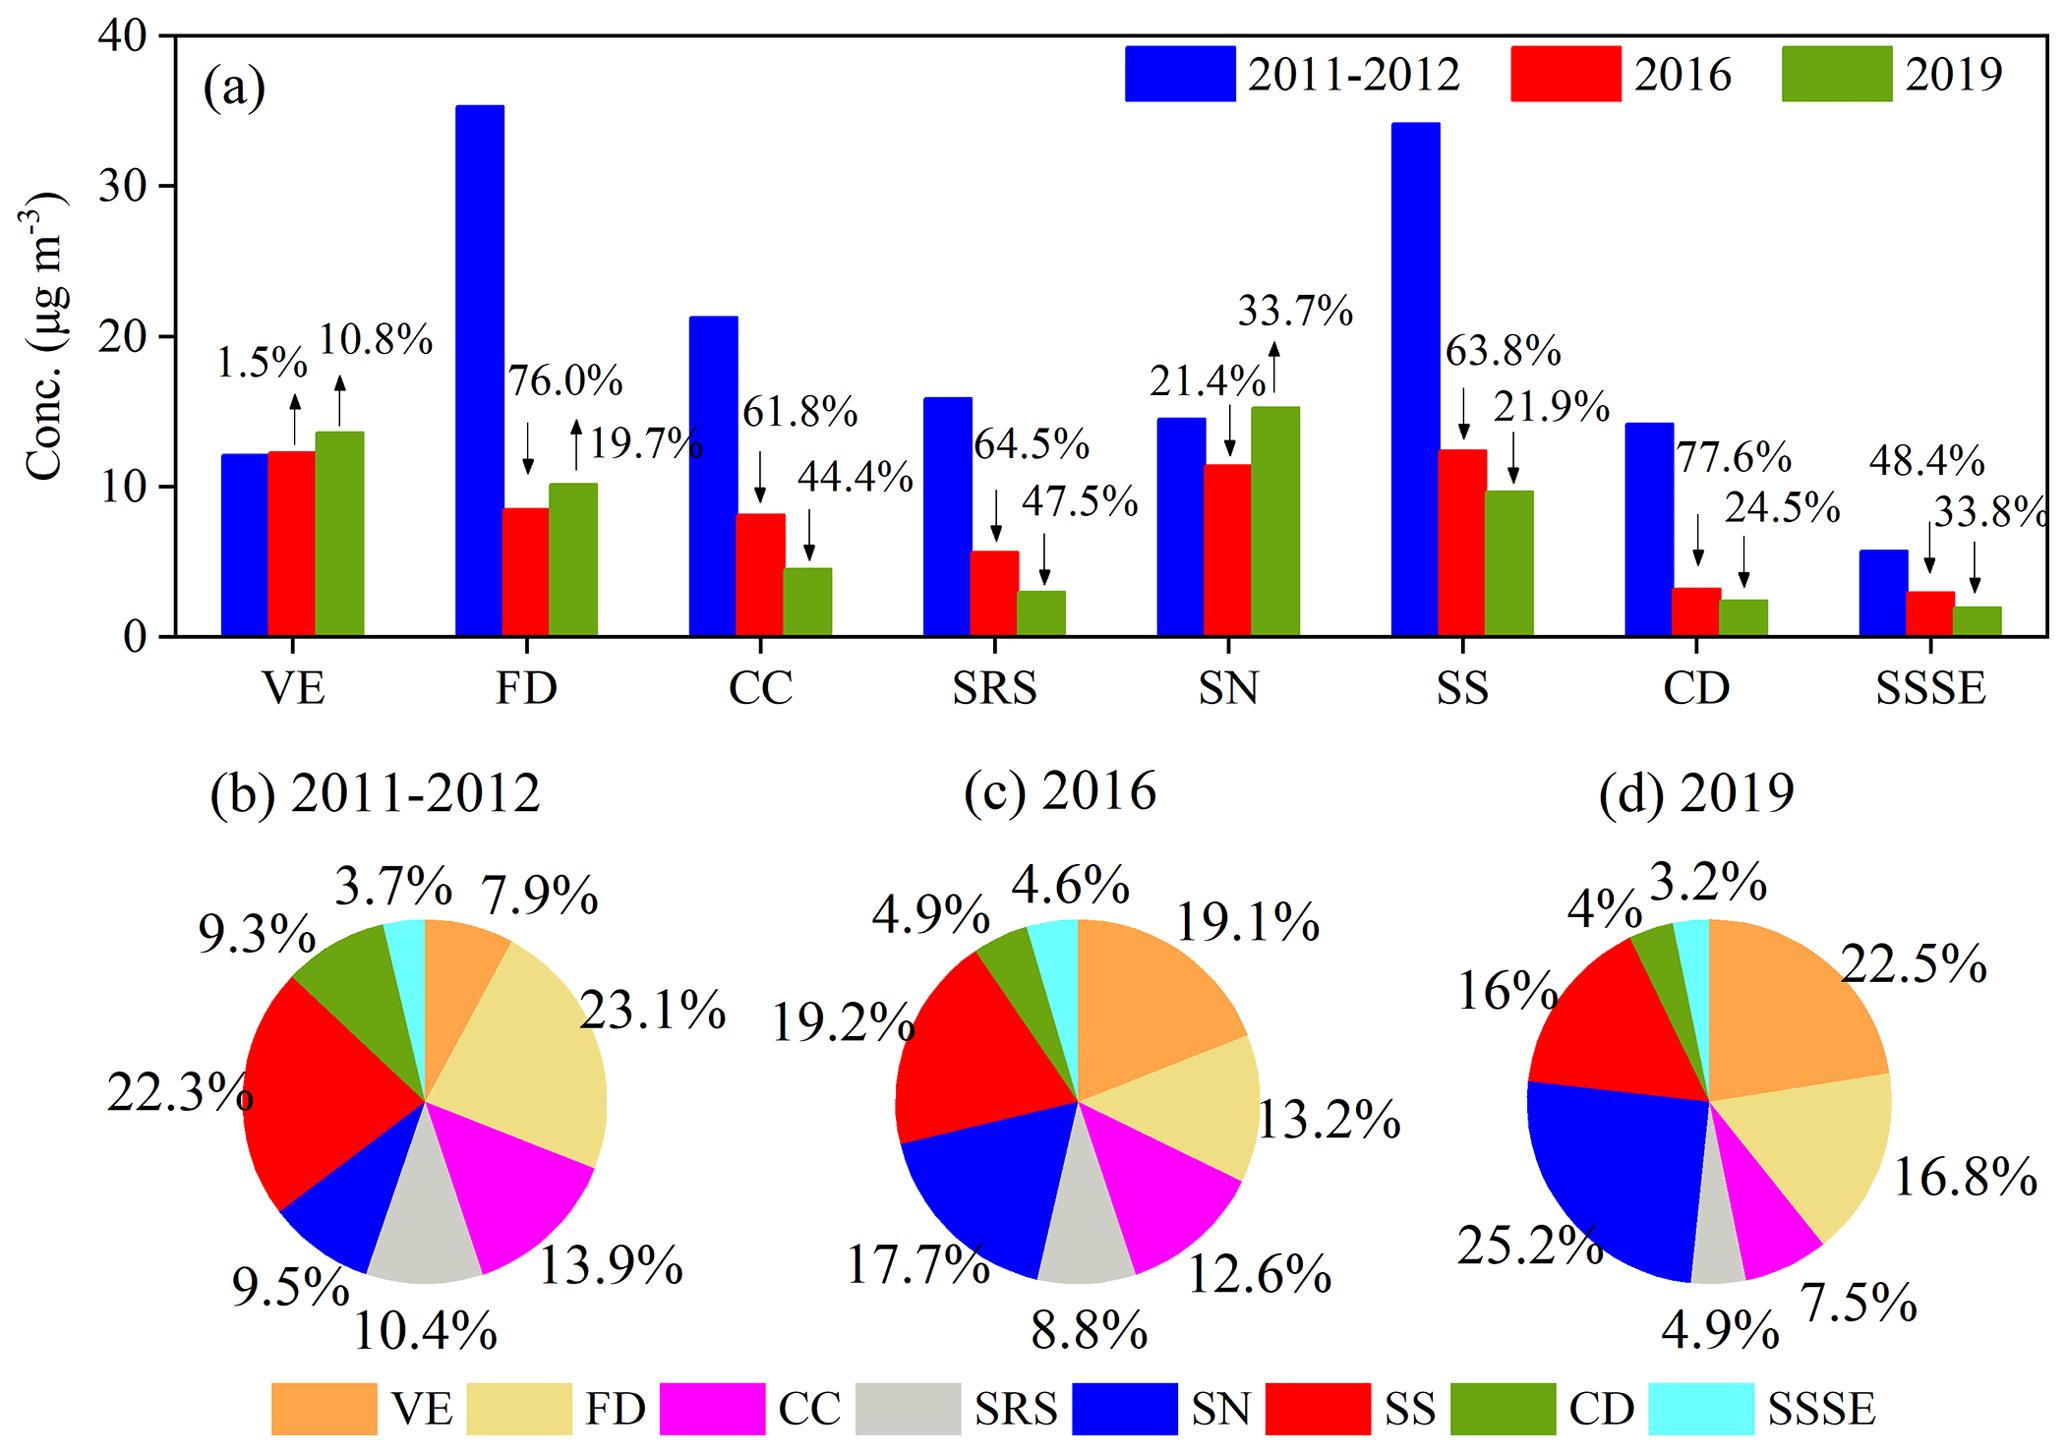
Figure 5Changes in source contributions for 2011–2012, 2016, and 2019. VE represents vehicle emissions, FD represents fugitive dust, CC represents coal combustion, SRS represents steel-related smelting, SN represents secondary nitrate, SS represents secondary sulfate, CD represents construction dust, and SSSE represents sea salt and ship emissions.
The annual changes in the observed and dispersion-normalized concentrations and percentages of main chemical compositions in ambient PM2.5 are shown in Figs. 4 and S7 in the Supplement. From 2011–2012 to 2019, the observed concentrations of showed an obvious downward trend, from 23.5 to 6.7 µg m−3. The trend of concentrations of after dispersion normalization was consistent with the observed concentrations, and the annual average decline rate was approximately 41.5 % (38.1 % in 2016 and 44.8 % in 2019) (Table S13 in the Supplement), probably suggesting that the impacts of coal-fired sources in Qingdao have decreased substantially in recent years. In contrast, the observed concentrations and percentages of increased significantly from 2011–2012 (3.5 µg m−3) to 2019 (10.0 µg m−3), and increased from 0.14 to 1.50. After dispersion normalization, the concentrations and percentages of changed inappreciably in 2016–2019 but were significantly higher than those prior to the CAAP. It has been found that ambient in urban areas mainly originates from the secondary conversion of NOx emitted by motor vehicles (Alexander et al., 2020; F. Liu et al., 2017; Meng et al., 2008), thereby indicating that the impacts of motor vehicles in Qingdao might become increasingly obvious. The observed and normalized concentrations and percentages of OC and EC basically performed a downward trend from 2011 to 2019. The OC concentration decreased significantly, and the observed and normalized concentrations decreased from 13.1 to 7.6 and 12.9 to 7.2 µg m−3, respectively, which might be related to the significant decrease in the impacts of coal-fired sources in Qingdao. Note that the annual variations in observed and normalized concentrations of were consistent with that of but contrary to that of , which might indicate that ammonium mainly existed in the form of ammonium sulfate and ammonia hydrogen sulfate in Qingdao.
Crustal elements (Si, Al, and Mg) decreased remarkably after the CAAP was in place. The observed and normalized concentrations of these elements in 2011–2012 were higher than those in 2016 and 2019, while their concentrations in 2019 were slightly higher than those in 2016. From 2011–2012 to 2019, the observed concentrations of Si, Al, and Mg decreased from 10.7 to 1.0, 3.1 to 0.5, and 1.9 to 0.2 µg m−3, respectively, and the trends of normalized concentrations were consistent with the observed concentrations, likely suggesting that the impact of dust in 2011–2012 was apparently higher than that in 2016 and 2019, and 2019 rebounded compared with 2016. The trends of the observed and normalized concentrations and percentages of Ca were consistent. The concentrations and percentages in 2011–2012 were remarkably higher than those in 2016 and 2019, and the concentration in 2019 rebounds compared with that in 2016, with an increase rate of 77.1 % in terms of normalized data (Table S13). This suggests that the impact of construction activities in 2011–2012 might have been significantly higher than that in 2016 or 2019. The annual trends of observed and normalized concentrations of Fe were also consistent. The observed and normalized concentrations in 2011–2012 were 4.0 and 4.6 µg m−3, respectively. After 2016, the concentrations and percentages of Fe decreased substantially, which might be closely related to the relocation of iron and steel enterprises in Qingdao (Liu et al., 2021). The observed and normalized concentrations and percentages of Ni and V basically showed a downward trend from 2011–2012 to 2019. The concentrations in 2011–2012 were significantly higher than those in 2016 and 2019, which might indicate that the impact from ships in 2011–2012 was more obvious. Of course, it might also be related to the impact of manual dust sources. From 2011–2012 to 2019, the observed and normalized concentrations and percentages of Na showed a downward trend. The concentration and percentage in 2011–2012 were significantly higher than those in 2016 and 2019, suggesting that the impact of sea salt might have decreased in Qingdao in recent years.
3.3 Changes in source contributions
3.3.1 Source identification
Given the differences in source profiles during different periods, PMF analysis was conducted for three data sets corresponding to separate sampling periods (i.e. 2011–2012, 2016, and 2019). The solutions from five to nine factors were examined in terms of scaled residuals, factor interpretability, and displacement acceptability (Brown et al., 2015; Dai et al., 2020). An eight-factor solution was chosen as the optimal fit for each data set. The correlation coefficients (R2) between the observed and calculated concentrations were 0.91, 0.83, and 0.91, respectively (Fig. S8 in the Supplement). There were no DISP swaps, and all BS runs had at least 87 % agreement with the base case values (Table S14 in the Supplement).
The factor profiles estimated from PMF during different periods are shown in Figs. S9–S11 in the Supplement. The first factor was identified as vehicle emissions because OC and EC both had high concentrations and explained variations as well as narrow DISP bounds. It is known that the OC and EC are important tracers for vehicle emissions (Bi et al., 2019; Gao et al., 2016; Ryou et al., 2018; H. Xu et al., 2019). The second factor was characterized by higher concentration and explained variation in Si and high Al concentrations, and they all had narrow DISP ranges. Si and Al were the indicators for fugitive dust (Begum et al., 2011; Jain et al., 2018; S. Zhao et al., 2021). The third factor featured relatively high concentrations and explained variations in OC, , and Cl− with tight DISP intervals. These species were distinctive tracers for coal combustion (Huang et al., 2017; Song et al., 2021).
The fourth factor was characterized by high explained variations in Fe and Mn and relatively high concentrations of Cu and Zn. Dall'Osto et al. (2008) found that Fe and Mn were related to basic oxygen, iron ore sintering, and steel oxidation refining. Querol et al. (2007) and Kuo et al. (2007) have reported that Cu and Zn were released from multiple types of metal smelting. Therefore, this factor was identified as steel-related smelting. The fifth factor was dominated by high concentrations and explained variations in and with small DISP bounds, which was identified as secondary nitrate (Esmaeilirad et al., 2020). It was found that and presented the highest explained variations and concentrations with narrow DISP bounds in the sixth factor. Therefore, this factor was assigned as secondary sulfate (Bove et al., 2016; Jain et al., 2020). The seventh factor featured high concentration and explained variation in Ca with a small DISP bound, which was identified as construction dust (Liu et al., 2016; Zhang et al., 2005). The final factor was characterized by highly explained variations in Na, Ni, and V with narrow DISP intervals. In addition, the concentrations of Mg, , , and Cl− in this factor were also relatively high. Zhang et al. (2021), W. J. Liu et al. (2018), Choi et al. (2013), and Police et al. (2016) have found that sea salt involves high amounts of Na, Mg, , , and Cl−. Meanwhile, Ni and V are the markers of ship emissions (Viana et al., 2008; Xu et al., 2018; Zong et al., 2018). Therefore, this factor was recognized as a mixed source of sea salt and ship emissions.
3.3.2 Change in source contributions
The source apportionment results of ambient PM2.5 in Qingdao from 2011–2012 to 2019 are shown in Figs. 5 and S12–S15 in the Supplement. For vehicle emissions, its contribution showed an increasing trend with each year, from 12.1 (7.9 %) to 13.6 µg m−3 (22.5 %). The contribution of coal combustion performed a significant downward trend, from 21.3 µg m−3 (13.9 %) in 2011–2012 to 4.5 µg m−3 (7.5 %) in 2019. The contribution of fugitive dust in 2011–2012 was up to 35.3 µg m−3 (23.1 %), significantly higher than 8.5 µg m−3 (13.2 %) in 2016 and 10.2 µg m−3 (16.8 %) in 2019, and the contribution in 2019 rebounded compared with 2016. The contribution of construction dust showed a downward trend year after year, from 14.2 µg m−3 (9.3 %) in 2011–2012 to 2.4 µg m−3 (4.0 %) in 2019. The contribution of steel-related smelting also showed a downward trend year by year, from 15.9 µg m−3 (10.4 %) in 2011–2012 to 3.0 µg m−3 (4.9 %) in 2019. The significant decline in the impact of steel-related smelting after 2016 might be closely related to the relocation of iron and steel enterprises in Qingdao (Liu et al., 2021). The contribution of secondary nitrate basically performed a significant upward trend, increasing from 14.5 µg m−3 (9.5 %) in 2011–2012 to 15.2 µg m−3 (25.2 %) in 2019, which might be related to the high concentration of precursors (NO2) (Fig. 1) and the increase in atmospheric oxidation in recent years (X. Chen et al., 2020; Fu et al., 2020). In contrast, the contribution of secondary sulfate showed a significant downward trend, from 34.2 µg m−3 (22.3 %) in 2011–2012 to 9.7 µg m−3 (16.0 %) in 2019, likely due to the significant decrease in the concentration of its precursor (SO2) (Fig. 1). For sea salt and ship emissions, the contribution basically performed a downward trend, from 5.7 µg m−3 (3.7 %) in 2011–2012 to 2.0 µg m−3 (3.2 %) in 2019.
To shield the impact of meteorology on the source apportionment results, this study used Eq. (2) to conduct the treatment of dispersion normalization for the source apportionment results and then analysed the annual changes in the contributions of different source categories, as shown in Fig. S16 in the Supplement. The annual changes in the contributions of multiple sources in Qingdao were basically consistent with the results of direct PMF calculation. The contribution of vehicle emissions was increasing year by year, and the annual average increase rate of contribution concentration was 12.1 %. However, the contribution of coal combustion showed a continuous yearly downward trend, with the average annual decline rate of contribution concentration being 56.8 %. For fugitive dust, compared with 2011–2012, the contribution in 2016 decreased substantially, with a decline rate of contribution concentration of 68.9 %, while it rebounded in 2019, with an increase rate of 25.2 %. The contribution of construction dust performed a continuous yearly downward trend, with the average annual decline rate of contribution concentration being 55.9 %. For the steel-related smelting as well as sea salt and ship emissions, the average annual decline rates of their contribution concentrations were 55.3 % and 46.0 %, respectively. In contrast, the contribution of secondary nitrate showed an increasing trend, and the increase rate of its contribution concentration was 1.7 %, while the contribution proportion increased by more than 70 %. The contribution of secondary sulfate showed a continuous yearly downward trend, and the average annual decline rate of contribution concentration was 38.7 %. Overall, the impacts of coal combustion and steel-related smelting industrial sources in Qingdao decreased substantially over the last decade, suggesting that the controlling effects of these sources were obvious. The impact of motor vehicles was prominent each year. Qingdao is also at risk of increased emissions from the increased vehicular population and ozone pollution that facilitate secondary-particle formation in the future. The impact of fugitive dust had decreased in recent years, whereas its contribution was still obvious. Therefore, the control of motor vehicles and dust should be the focus of pollution source control in Qingdao in the future, while that of coal combustion and industrial sources also should not be ignored.
Furthermore, with the beginning of the heating season in northern cities in China (Liu et al., 2016; H. Li et al., 2019), the atmospheric pollutant emissions increased substantially (J. Y. Chen et al., 2020). Coupled with the adverse meteorological conditions (H. Li et al., 2019), haze episodes occurred frequently during this period (B. Liu et al., 2018; Yang et al., 2020). Therefore, the control effects of pollution sources and key control sources in the specific period can be better highlighted through analysing the changes in the contributions of emission sources during heating seasons over the years. In this study, the heating season in 2011–2012 was defined from 15 to 29 February 2012, that in 2016 was defined from 17 to 20 December 2016, and that in 2019 referred to 12 to 26 January 2019. The contributions of different sources during different heating seasons in Qingdao are shown in Figs. S17 and S18 in the Supplement. Compared with the heating season in 2011–2012, the contribution of coal combustion decreased significantly in the heating seasons of 2016 and 2019, from 50.2 (31.7 %) to 10.9 (6.4 %) and 10.6 µg m−3 (10.8 %). The contribution percentages after dispersion normalization showed a consistent trend. For vehicle emissions, the contribution percentages in the heating season increased continuously each year, from 3.9 % in 2022–2012 to 22.3 % in 2019. The results after normalization had the same trend, suggesting that the impact of motor vehicles in the heating season was gradually prominent. The contribution of fugitive dust in the heating season in 2011–2012 (14.2 µg m−3) was substantially higher than that in 2016 (3.9 µg m−3) and 2019 (12.0 µg m−3). The contribution in the heating season in 2019 rebounded remarkably compared with that in 2016, and the results of dispersion normalization were consistent. The contribution of construction dust in the heating season in 2019 was markedly lower than that in 2011–2012 and 2016. The contribution of steel-related smelting in the heating season showed a continuous yearly downward trend, from 22.6 µg m−3 in the heating season in 2011–2012 to 4.6 µg m−3 in 2019. However, its contribution percentage in the heating season in 2019 was higher than that in the heating season in 2016, which was consistent with the normalized results, indicating that the impact of steel-related smelting in the heating season had increased, though the contribution percentage was low. The contribution of secondary nitrate in the heating season in 2016 was up to 61.3 µg m−3 (36.3 %), which was significantly higher than that of 28.4 µg m−3 (28.9 %) in 2019 and 16.8 µg m−3 (10.6 %) in 2011–2012. This was consistent with the results of the dispersion normalization. It can be seen that although the contribution of secondary nitrate in the heating season in 2019 was reduced, its contribution was significantly higher than that of other sources. Similarly, the contribution of secondary sulfate was also higher in the heating season of 2016 than other years; however, its contribution was clearly lower than that of secondary nitrate. After dispersion normalization, the contributions of secondary sulfate basically showed a continuous yearly downward trend. The contribution of sea salt and ship emissions in the heating season also showed an obvious downward trend, from 10.0 µg m−3 (6.3 %) in 2011–2012 to 1.4 µg m−3 (1.5 %) in 2019, and the results after dispersion normalization were basically consistent. The average decline rate of contribution concentration was approximately 70 %, including 88 % in 2016. From this analysis, the impacts of coal combustion and steel-related smelting in Qingdao were relatively low after the heating season in 2016, while that of vehicle emissions was prominent each year. Although the impact of fugitive dust had rebounded in the heating season in 2019, the contribution was relatively low. The contribution of secondary nitrate in the heating season was substantially higher than that of other sources, and the influence of secondary sulfate decreased each year. The influence of sea salt and ship emissions in the heating season showed a continuous yearly downward trend.
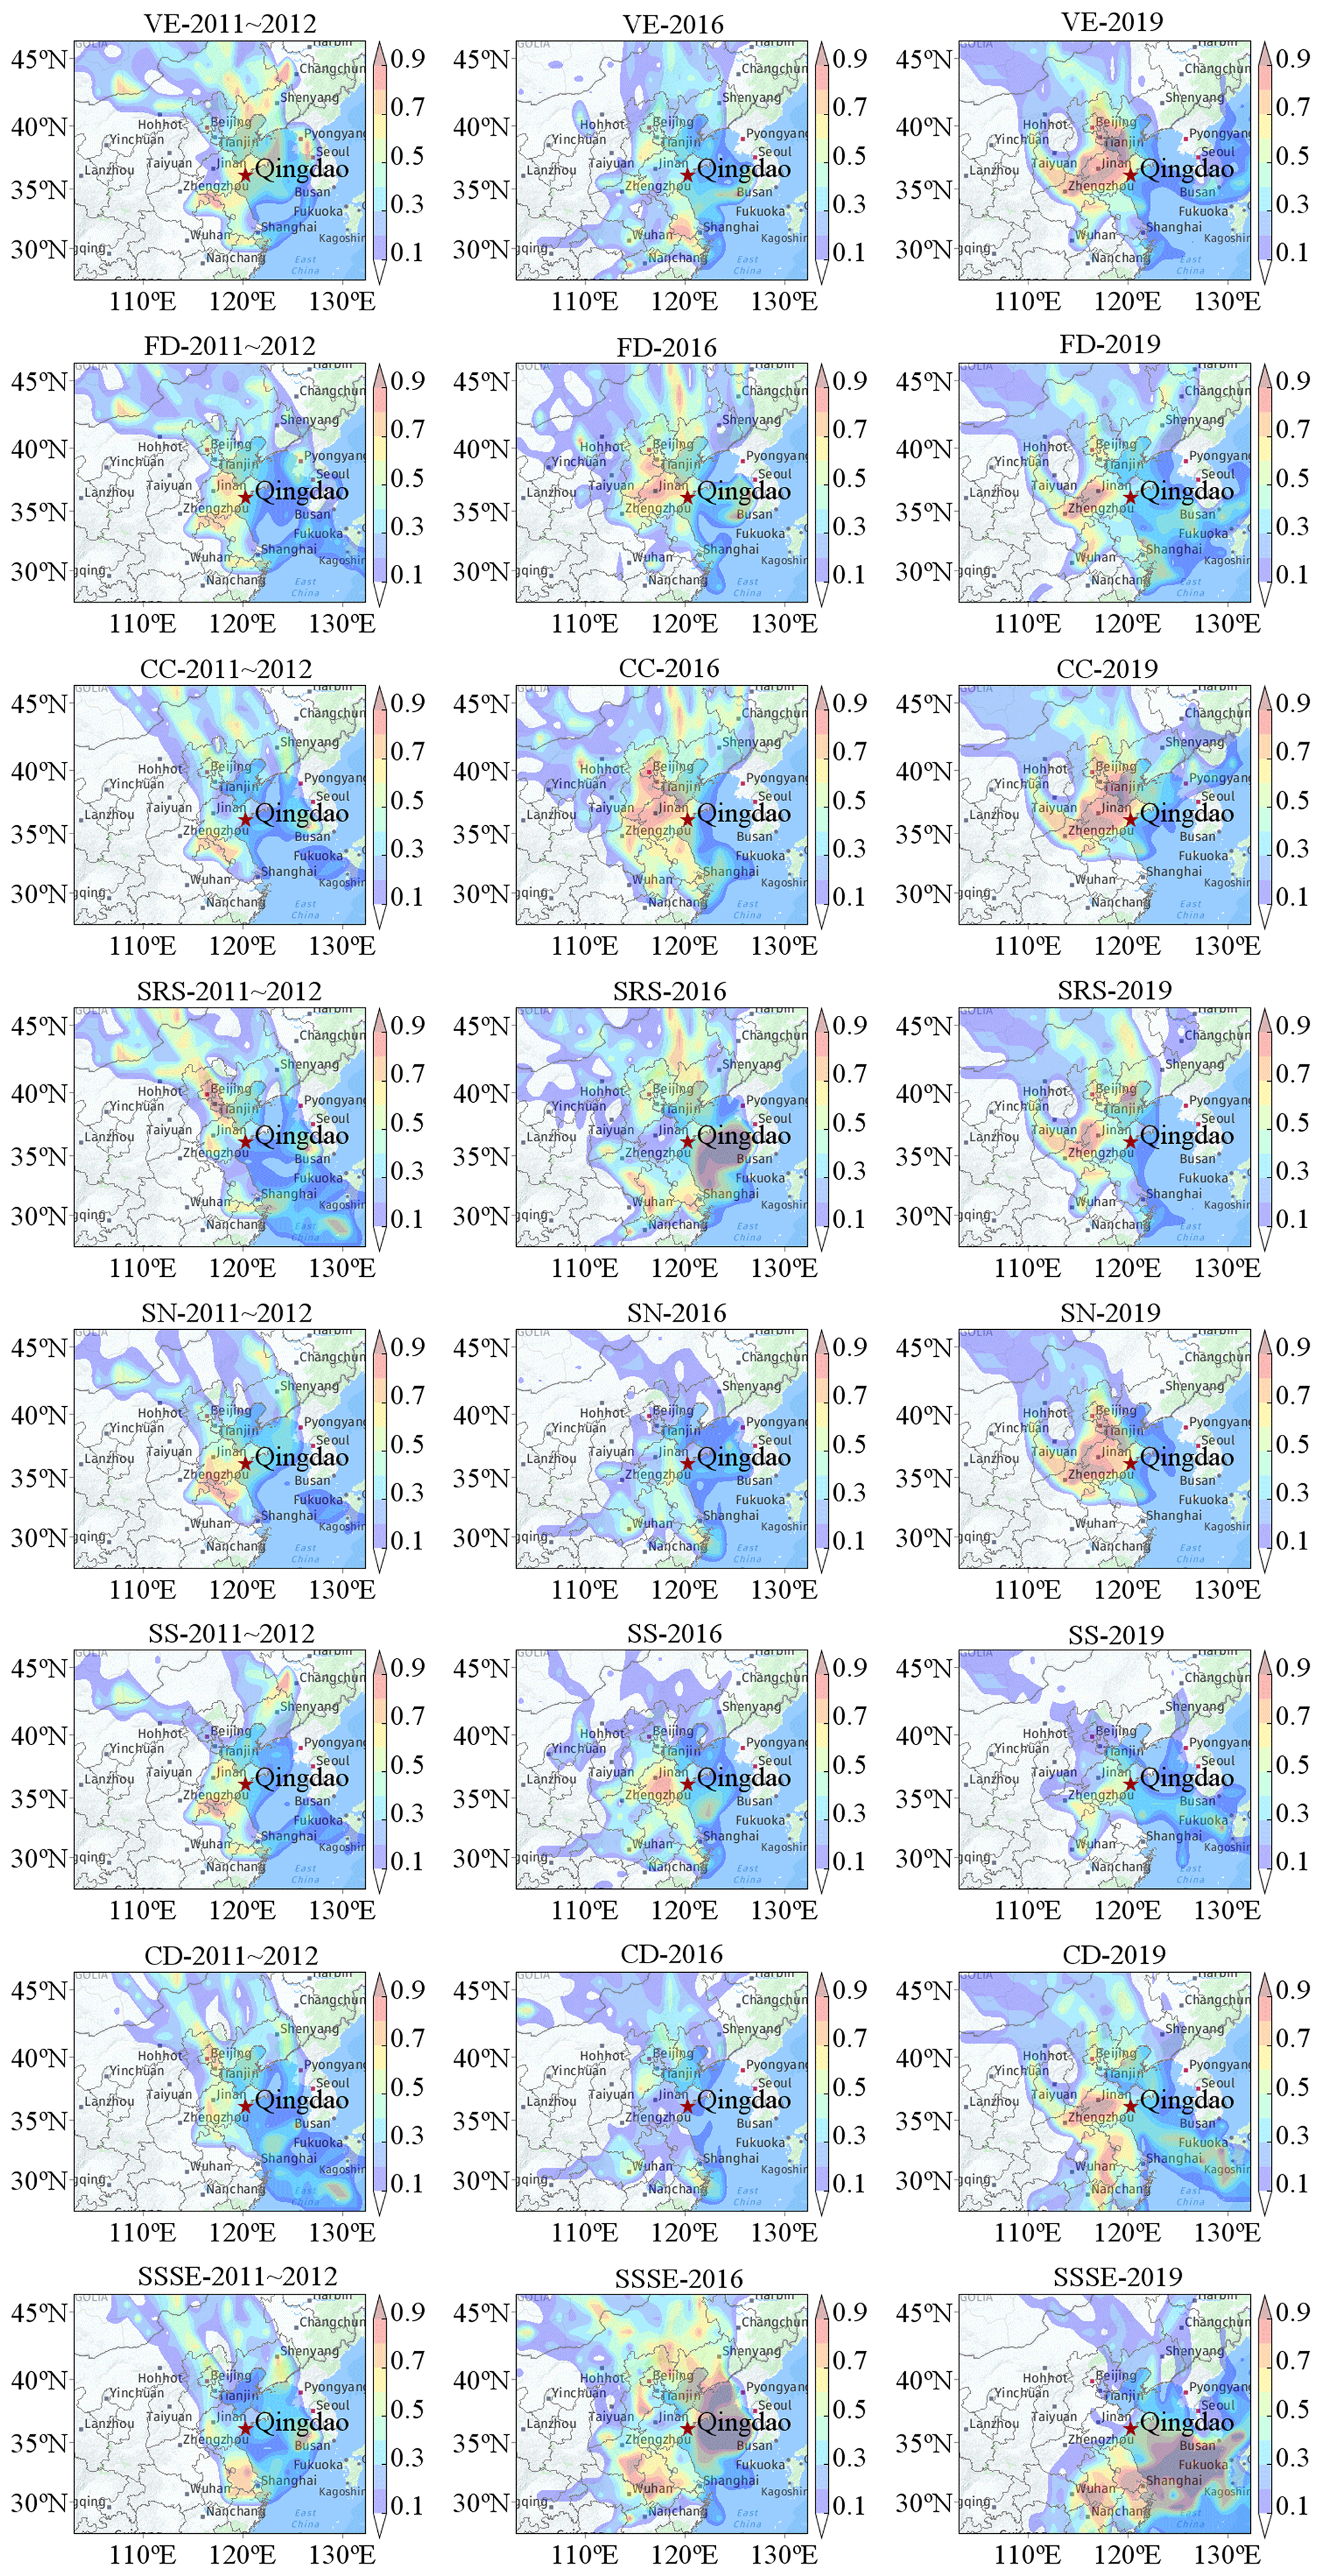
Figure 6Weighted PSCF plots for various emission sources during different periods (base map from Yahoo! Maps). VE represents vehicle emissions, FD represents fugitive dust, CC represents coal combustion, SRS represents steel-related smelting, SN represents secondary nitrate, SS represents secondary sulfate, CD represents construction dust, and SSSE represents sea salt and ship emissions.
3.4 Changes in potential source areas
Similar to the studies of Liu et al. (2021) and Dai et al. (2020), according to the source apportionment results, this study used the PSCF method to analyse the changes in the potential impact areas of emission sources in Qingdao from 2011–2012 to 2019, and the results are shown in Fig. 6. For vehicle emissions, the potential impact areas changed greatly from 2011–2012 to 2019. The potential impact areas in 2011–2012 were located at the junction of Shandong, Henan, Anhui, and Jiangsu provinces, and the potential impact areas were mainly located in the southern part of Jiangsu in 2016, while in 2019, Tianjin and the north-western part of Shandong were important impact areas. The potential impact areas for fugitive dust showed a trend of westward migration from 2011–2012 to 2019. For 2011–2012, the potential impact areas were located at the junction of Shandong, Henan, Anhui, and Jiangsu as well as in the northern part of Shandong. The potential impact areas were located in the north-western part of Shandong in 2016, while they were at the junction of Shandong and Henan in 2019. For coal combustion, the potential impact areas for 2011–2012 were located at the junction of Shandong, Henan, Anhui, and Jiangsu. In 2016, they moved to the north-west of Shandong Province and the Beijing–Tianjin–Hebei region, and the north-west of Shandong was an important impact area in 2019. For steel-related smelting, Beijing and Tianjin were the potential impact areas for 2011–2012, while the potential impact area was located in the Yellow Sea in 2016, which might be related to the relocation of iron and steel enterprises to a port area in the south of Qingdao (Liu et al., 2021). This suggests that the air mass transport in the coastal area could lead the nearby sea areas to become potential impact areas. The potential impact area in 2019 was mainly located at the junction of Hebei, Henan, and Shandong.
For secondary nitrate, the potential impact area for 2011–2012 was the junction of Shandong, Henan, Jiangsu, and Anhui provinces. The potential impact area was mainly located in the central and southern parts of Shandong in 2016, while two areas were located in Beijing; Tianjin; and the junction of Hebei, Henan, and Shandong provinces in 2019. For secondary sulfate, the main potential impact areas for 2011–2012 were located at the junction of Shandong, Henan, Jiangsu, and Anhui provinces and the western part of Jilin Province. The impact of the east-central region of Shandong Province was more obvious in 2016, while the impact was greater in the southern part of Shandong Province and the junction of Henan and Jiangsu provinces in 2019. For construction dust, the main potential impact areas for 2011–2012 were Beijing, Tianjin, the western part of Shandong Province, the south-eastern part of Hebei Province, Shanghai, and the eastern part of Hubei Province in 2016, while the central and western parts of Shandong Province, the junction of Henan and Shandong provinces, and the central and southern parts of Anhui Province were the main impact areas in 2019. For sea salt and ship emissions, the potential impact areas for 2011–2012 were mainly located in coastal areas of Jiangsu and Shanghai, which were closely related to the impacts of ship emissions from ports and sea salt in these cities. The Yellow Sea was the main impact area in 2016 and 2019, and the impact areas in 2019 moved to the south. Bie et al. (2021) also analysed the potential impact areas of ship emissions in Qingdao Port from 2018 to 2019 using the PSCF method and found that they were mainly located in the Bohai Bay, Yellow Sea, and Yangtze River Delta. Overall, from 2011–2012 to 2019, the potential impact areas of different emission sources in Qingdao have changed markedly. In 2019, the potential impact areas for most of the emission sources were mainly located in Shandong Province and along the border areas between the western or south-western parts of Shandong and other provinces, while sea salt and ship emissions were mainly affected by transport on the Yellow Sea.
A machine-learning-based meteorological normalization and a dispersion normalization based on ventilation coefficient approaches were applied to decouple the meteorologically deduced variations in air quality time series and multiple source contributions of a coastal city in northern China (Qingdao), respectively. The concentrations of air pollutants other than ozone in Qingdao decreased substantially, and the air quality improved continuously after the CAAP period, indicating that the control strategies of air pollution in Qingdao over the years have been proper. The largest emission reduction sections were likely from coal combustion and industrial emissions from 2011–2012 to 2019 and the decrease in steel-related smelting after 2016 due to the relocation of iron and steel enterprises. The contribution of dust in Qingdao decreased remarkably after the CAAP, but the impact was still outstanding until 2019. Vehicle emissions were increased in importance as opposed to the other primary sources. Qingdao is at risk of increased emissions from the increased vehicular population and ozone pollution that facilitate secondary-particle formation in the future. In addition, the influence of ship emissions should be gradually reduced. The control of motor vehicles and dust should be the focus of pollution source control in Qingdao in the future, while that of coal combustion and industrial sources cannot be ignored. In addition, the potential impact areas of different emission sources in Qingdao have changed markedly from 2011–2012 to 2019. The potential impact areas for most emission sources were mainly located in Shandong and the border areas between western or south-western Shandong and other provinces in 2019, while sea salt and ship emissions were mainly affected by the transport over the Yellow Sea.
RF code is available at https://github.com/tuanvvu/Air_Quality_Trend_Analysis (last access: 29 October 2021, Vu et al., 2019).
The data in this study are available from the corresponding authors upon request (zhafox@nankai.edu.cn, fengyc@nankai.edu.cn).
The supplement related to this article is available online at: https://doi.org/10.5194/acp-22-8597-2022-supplement.
BL drafted and reviewed the paper. YW and LD conducted the data collection and curation and model operation. HM collected the data. QD, JW, LS, and JW reviewed the paper. BL, YZ, and YF designed the research. All authors revised the paper and approved the final version for publication.
The contact author has declared that neither they nor their co-authors have any competing interests.
Publishers note: Copernicus Publications remains neutral with regard to jurisdictional claims in published maps and institutional affiliations.
The authors are grateful to the Qingdao Eco-environment Monitoring Center of Shandong Province for collection of particulate matter samples in this study.
This study was financially supported by the National Research Program for Key Issues in Air Pollution Control (no. DQGG2021301), the Tianjin Science and Technology Plan Project (no. PTZWHZ00120), and the Fundamental Research Funds for the Central Universities: Nankai University (no. 63211074).
This paper was edited by Qiang Zhang and reviewed by two anonymous referees.
Alexander, B., Sherwen, T., Holmes, C. D., Fisher, J. A., Chen, Q., Evans, M. J., and Kasibhatla, P.: Global inorganic nitrate production mechanisms: comparison of a global model with nitrate isotope observations, Atmos. Chem. Phys., 20, 3859–3877, https://doi.org/10.5194/acp-20-3859-2020, 2020.
Begum, B. A., Biswas, S. K., and Hopke, P. K.: Key issues in controlling air pollutants in Dhaka, Bangladesh, Atmos. Environ., 45, 7705–7713, https://doi.org/10.1016/j.atmosenv.2010.10.022, 2011.
Beloconi, A., Probst-Hensch, N. M., and Vounatsou, P.: Spatio-temporal modelling of changes in air pollution exposure associated to the COVID-19 lockdown measures across Europe, Sci. Total Environ., 787, 147607, https://doi.org/10.1016/j.scitotenv.2021.147607, 2021.
Bi, X., Dai, Q., Wu, J., Zhang, Q., Zhang, W., Luo, R., Cheng, Y., Zhang, J., Wang, L., Yu, Z., Zhang, Y., Tian, Y., and Feng, Y.: Characteristics of the main primary source profiles of particulate matter across China from 1987 to 2017, Atmos. Chem. Phys., 19, 3223–3243, https://doi.org/10.5194/acp-19-3223-2019, 2019.
Bie, S. J., Yang, L. X., Zhang, Y., Huang, Q., Li, J. S., Zhao, T., Zhang, X. F., Wang, P. C., and Wang, W. X.: Source appointment of PM2.5 in Qingdao Port, East of China, Sci. Total Environ., 755, 142456, https://doi.org/10.1016/j.scitotenv.2020.142456, 2021.
Bove, M. C., Brotto, P., Calzolai, G., Cassola, F., Cavalli, F., Fermo, P., Hjorth, J., Massabò, D., Nava, S., Piazzalunga, A., Schembari, C., and Prati, P.: PM10 source apportionment applying PMF and chemical tracer analysis to ship-borne measurements in the Western Mediterranean, Atmos. Environ., 125, 140–151, https://doi.org/10.1016/j.atmosenv.2015.11.009, 2016.
Brown, S. G., Eberly, S., Paatero, P., and Norris, G. A.: Methods for estimating uncertainty in PMF solutions: Examples with ambient air and water quality data and guidance on reporting PMF results, Sci. Total Environ., 518, 626–635, https://doi.org/10.1016/j.scitotenv.2015.01.022, 2015.
Carslaw, D. C.: Worldmet: Import Surface Meteorological Data from NOAA Integrated Surface Database (ISD), http://github.com/davidcarslaw/ (last access: 5 September 2018), 2017.
Chen, J. Y., Shan, M., Xia, J. J., and Jiang, Y.: Effects of space heating on the pollutant emission intensities in “2 + 26” cities, Building Environ., 175, 106817, https://doi.org/10.1016/j.buildenv.2020.106817, 2020.
Chen, Y., Zhang, S. M., Peng, C., Shi, G. M., Tian, M., Huang, R. J., Guo, D. M., Wang, H. B., Yao, X. J., and Yang, F. M.: Impact of the COVID-19 pandemic and control measures on air quality and aerosol light absorption in Southwestern China, Sci. Total Environ., 749, 141419, https://doi.org/10.1016/j.scitotenv.2020.141419, 2020.
Chen, X., Wang, H., Lu, K., Li, C., Zhai, T., Tan, Z., Ma, X., Yang, X., Liu, Y., Chen, S., Dong, H., Li, X., Wu, Z., Hu, M., Zeng, L., and Zhang, Y.: Field Determination of Nitrate Formation Pathway in Winter Beijing, Environ. Sci. Technol., 54, 9243–9253, https://doi.org/10.1021/acs.est.0c00972, 2020.
Cheng, N. L., Cheng, B. F., Li, S. S., and Ning, T. Z.: Effects of meteorology and emission reduction measures on air pollution in Beijing during heating seasons, Atmos. Pollut. Res., 10, 971–979, https://doi.org/10.1016/j.apr.2019.01.005, 2019.
Choi, J.-K., Heo, J.-B., Ban, S.-J., Yi, S.-M., and Zoh, K.-D.: Source apportionment of PM2.5 at the coastal area in Korea, Sci. Total Environ., 447, 370–380, https://doi.org/10.1016/j.scitotenv.2012.12.047, 2013.
Chu, B. W., Zhang, S. P., Liu, J., Ma, Q. X., and He, H.: Significant concurrent decrease in PM2.5 and NO2 concentrations in China during COVID-19 epidemic, J. Environ. Sci., 99, 346–353, https://doi.org/10.1016/j.jes.2020.06.031, 2021.
Cohen, A. J., Brauer, M., Burnett, R., Anderson, H. R., Frostad, J., Estep, K., Balakrishnan, K., Brunekreef, B., Dandona, L., Dandona, R., Feigin, V., Freedman, G., Hubbell, B., Jobling, A., Kan, H., Knibbs, L., Liu, Y., Martin, R., Morawska, L., Pope, C. A., Shin, H., Straif, K., Shaddick, G., Thomas, M., van Dingenen, R., van Donkelaar, A., Vos, T., Murray, C. J. L., and Forouzanfar, M. H.: Estimates and 25-year trends of the global burden of disease attributable to ambient air pollution: an analysis of data from the Global Burden of Diseases Study 2015, Lancet, 389, 1907–1918, https://doi.org/10.1016/S0140-6736(17)30505-6, 2017.
Collivignarelli, M. C., De Rose, C., Abbà, A., Baldi, M., Bertanza, G., Pedrazzani, R., Sorlini, S., and Carnevale Miino, M.: Analysis of lockdown for COVID-19 impact on NO2 in London, Milan and Paris: What lesson can be learnt?, Process Saf. Environ., 146, 952–960, https://doi.org/10.1016/j.psep.2020.12.029, 2021.
Cucciniello, R., Raia, L., and Vasca, E.: Air quality evaluation during COVID-19 in Southern Italy: the case study of Avellino city, Environ. Res., 203, 111803, https://doi.org/10.1016/j.envres.2021.111803, 2022.
Dall'Osto, M., Booth, M. J., Smith, W., Fisher, R., and Harrison, R. M.: A study of the size distributions and the chemical characterization of airborne particles in the vicinity of a large integrated steelworks, Aerosol Sci. Technol., 42, 981–991, https://doi.org/10.1080/02786820802339587, 2008.
Dai, Q. L., Liu, B. S., Bi, X. H., Wu, J. H., Liang, D. N., Zhang, Y. F., Feng, Y. C., and Hopke, P. K.: Dispersion Normalized PMF Provides Insights into the Significant Changes in Source Contributions to PM2.5 after the COVID-19 Outbreak, Environ. Sci. Technol., 54, 9917–9927, https://doi.org/10.1021/acs.est.0c02776, 2020.
Dai, Q. L., Ding, J., Hou, L. L., Li, L. X., Cai, Z. Y., Liu, B. S., Song, C. B., Bi, X. H., Wu, J. H., Zhang, Y. F., Feng, Y. C., and Hopke, P. K.: Haze episodes before and during the COVID-19 shutdown in Tianjin, China: Contribution of fireworks and residential burning, Environ. Pollut., 286, 117252, https://doi.org/10.1016/j.envpol.2021.117252, 2021.
Ding, J., Dai, Q. L., Li, Y. F., Han, S. Q., Zhang, Y. F., and Feng, Y. C.: Impact of meteorological condition changes on air quality and particulate chemical composition during the COVID-19 lockdown, J. Environ. Sci., 109, 45–56, https://doi.org/10.1016/j.jes.2021.02.022, 2021.
Esmaeilirad, S., Lai, A., Abbaszade, G., Schnelle-Kreis, J., Zimmermann, R., Uzu, G., Daellenbach, K., Canonaco, F., Hassankhany, H., Arhami, M., Baltensperger, U., Prévôt, A. S. H., Schauer, J. J., Jaffrezo, J.-L., Hosseini, V., and El Haddad, I.: Source apportionment of fine particulate matter in a Middle Eastern Metropolis, Tehran-Iran, using PMF with organic and inorganic markers, Sci. Total Environ., 705, 135330, https://doi.org/10.1016/j.scitotenv.2019.135330, 2020.
Fan, H., Zhao, C. F., and Yang, Y. K.: A comprehensive analysis of the spatio-temporal variation of urban air pollution in China during 2014–2018, Atmos. Environ., 220, 117066, https://doi.org/10.1016/j.atmosenv.2019.117066, 2020.
Fu, X., Wang, T., Gao, J., Wang, P., Liu, Y. M., Wang, S. X., Zhao, B., and Xue, L. K.: Persistent Heavy Winter Nitrate Pollution Driven by Increased Photochemical Oxidants in Northern China, Environ. Sci. Technol., 54, 3881–3889, https://doi.org/10.1021/acs.est.9b07248, 2020.
Gao, J., Peng, X., Chen, G., Xu, J., Shi, G. L., Zhang, Y. C., and Feng, Y. C.: Insights into the chemical characterization and sources of PM2.5 in Beijing at a 1-h time resolution, Sci. Total Environ., 542, 162–171, https://doi.org/10.1016/j.scitotenv.2015.10.082, 2016.
Gao, Y., Shan, H. Y., Zhang, S. Q., Sheng, L. F., Li, J. P., Zhang, J. X., Ma, M. C., Meng, H., Luo, K., Gao, H. W., and Yao, X. H.: Characteristics and sources of PM2.5 with focus on two severe pollution events in a coastal city of Qingdao, China, Chemosphere, 247, 125861, https://doi.org/10.1016/j.chemosphere.2020.125861, 2020.
Grange, S. K. and Carslaw, D. C.: Using meteorological normalization to detect interventions in air quality time series, Sci. Total Environ., 653, 578–588, https://doi.org/10.1016/j.scitotenv.2018.10.344, 2019.
Grange, S. K., Carslaw, D. C., Lewis, A. C., Boleti, E., and Hueglin, C.: Random forest meteorological normalisation models for Swiss PM10 trend analysis, Atmos. Chem. Phys., 18, 6223–6239, https://doi.org/10.5194/acp-18-6223-2018, 2018.
Gong, S. L., Zhang, L., Liu, C., Lu, S. H., Pan, W. J., and Zhang, Y. H.: Multi-scale analysis of the impacts of meteorology and emissions on PM2.5 and O3 trends at various regions in China from 2013 to 2020 2. Key weather elements and emissions, Sci. Total Environ., 824, 153847, https://doi.org/10.1016/j.scitotenv.2022.153847, 2022.
Gulia, S., Mittal, A., and Khare, M.: Quantitative evaluation of source interventions for urban air quality improvement – A case study of Delhi city, Atmos. Pollut. Res., 9, 577–583, https://doi.org/10.1016/j.apr.2017.12.003, 2018.
He, G. J., Pan, Y. H., and Tanaka, T.: The short-term impacts of COVID-19 lockdown on urban air pollution in China, Nat. Sustainability, 3, 1005–1011, https://doi.org/10.1038/s41893-020-0581-y, 2020.
Hong, Y. W., Xu, X. B., Liao, D., Zheng, R. H., Ji, X. T., Chen, Y. T., Xu, L. L., Li, M. R., Wang, H., Xiao, H., Choi, S. D., and Chen, J. S.: Source apportionment of PM2.5 and sulfate formation during the COVID-19 lockdown in a coastal city of southeast China, Environ. Pollut., 286, 117577, https://doi.org/10.1016/j.envpol.2021.117577, 2021.
Hopke, P. K., Dai, Q. L., Li, L. X., and Feng, Y. C.: Global review of recent source apportionments for airborne particulate matter, Sci. Total Environ., 740, 140091, https://doi.org/10.1016/j.scitotenv.2020.140091, 2020.
Hou, L. L., Dai, Q. L., Song, C. B., Liu, B., Guo, F. Z., Dai, T. J., Li, L. X., Liu, B. S., Bi, X. H., Zhang, Y. F., and Feng, Y. C.: Revealing drivers of haze pollution by explainable machine learning, Environ. Sci. Tech. Let., 9, 112–119, https://doi.org/10.1021/acs.estlett.1c00865, 2022.
Huang, H. Y., Liu, B. S., Li, S., Choe, T.-H., Dai, Q. L., Gu, Y., Diao, L. L., Zhang, S. F., Bi, X. H., Luo, Z. W., Lu, M. M., Zhang, Y. F., and Feng, Y. C.: An estimation method for regional transport contributions from emission sources based on a high-mountain site: a case study in Zhumadian, China, Atmos. Environ., 263, 118664, https://doi.org/10.1016/j.atmosenv.2021.118664, 2021.
Huang, J., Pan, X. C., Guo, X. B., and Li, G. X.: 2018. Health impact of China's Air Pollution Prevention and Control Action Plan: an analysis of national air quality monitoring and mortality data, Lancet Planetary Health, 2, e313–e323, https://doi.org/10.1016/S2542-5196(18)30141-4, 2018.
Huang, R. J., Zhang, Y. L., Bozzetti, C., Ho, K. F., Cao, J. J., Han, Y. M., Daellenbach, K. R., Slowik, J. G., Platt, S. M., Canonaco, F., Zotter, P., Wolf, R., Pieber, S. M., Bruns, E. A., Crippa, M., Ciarelli, G., Piazzalunga, A., Schwikowski, M., Abbaszade, G., Schnelle-Kreis, J., Zimmermann, R., An, Z. S., Szidat, S., Baltensperger, U., El Haddad, I., and Prevot, A. S. H.: High secondary aerosol contribution to particulate pollution during haze events in China, Nature, 514, 218–222, https://doi.org/10.1038/nature13774, 2014.
Huang, X., Liu, Z., Liu, J., Hu, B., Wen, T., Tang, G., Zhang, J., Wu, F., Ji, D., Wang, L., and Wang, Y.: Chemical characterization and source identification of PM2.5 at multiple sites in the Beijing–Tianjin–Hebei region, China, Atmos. Chem. Phys., 17, 12941–12962, https://doi.org/10.5194/acp-17-12941-2017, 2017.
Iyer, U. S. and Raj, P. E.: Ventilation coefficient trends in the recent decades over four major Indian metropolitan cities, J. Earth Syst. Sci., 122, 537–549, https://doi.org/10.1007/s12040-013-0270-6, 2013.
Jain, S., Sharma, S. K., Mandal, T. K., and Saxena, M.: Source apportionment of PM10 in Delhi, India using PCA/APCS, UNMIX and PMF, Particuology, 37, 107–118, https://doi.org/10.1016/j.partic.2017.05.009, 2018.
Jain, S., Sharma, S. K., Vijayan, N., and Mandal, T. K.: Seasonal characteristics of aerosols (PM2.5 and PM10) and their source apportionment using PMF: A four year study over Delhi, India, Environ. Pollut., 262, 114337, https://doi.org/10.1016/j.envpol.2020.114337, 2020.
Jiang, X., Li, G. L., and Fu, W.: Government environmental governance, structural adjustment and air quality: A quasi-natural experiment based on the Three-year Action Plan to Win the Blue Sky Defense War, J. Environ. Manage., 277, 111470, https://doi.org/10.1016/j.jenvman.2020.111470, 2021.
Joshi, P., Ghosh, S., Dey, S., Dixit, K., Choudhary, R. K., Salve, H. R., and Balakrishnan, K.: Impact of acute exposure to ambient PM2.5 on non-trauma all-cause mortality in the megacity Delhi, Atmos. Environ., 259, 118548, https://doi.org/10.1016/j.atmosenv.2021.118548, 2021.
Kleinman, M. T., Kneip, T. J., and Eisenbud, M.: Seasonal patterns of airborne particulate concentrations in New York City, Atmos. Environ. (1967), 10, 9–11, https://doi.org/10.1016/0004-6981(76)90252-3, 1976.
Kuo, S.-C., Hsieh, L.-Y., Tsai, C.-H., and Tsai, Y. I.: Characterization of PM2.5 fugitive metal in the workplaces and the surrounding environment of a secondary aluminum smelter, Atmos. Environ., 41, 6884–6900, https://doi.org/10.1016/j.atmosenv.2007.04.038, 2007.
Le, T. H., Wang, Y., Liu, L., Yang, J. N., Yung, Y. L., Li, G. H., and Seinfeld, J. H.: Unexpected air pollution with marked emission reductions during the COVID-19 outbreak in China, Science, 369, 702, https://doi.org/10.1126/science.abb7431, 2020.
Li, H., You, S. J., Zhang, H., Zheng, W. D., and Zou, L. J.: Analysis of the impacts of heating emissions on the environment and human health in North China, J. Clean Prod., 207, 728–742, https://doi.org/10.1016/j.jclepro.2018.10.013, 2019.
Li, K., Jacob, D. J., Liao, H., Zhu, J., Shah, V., Shen, L., Bates, K. H., Zhang, Q., and Zhai, S. X.: A two-pollutant strategy for improving ozone and particulate air quality in China, Nat. Geosci., 12, 906–910, https://doi.org/10.1038/s41561-019-0464-x, 2019.
Li, K., Jacob, D. J., Shen, L., Lu, X., De Smedt, I., and Liao, H.: Increases in surface ozone pollution in China from 2013 to 2019: anthropogenic and meteorological influences, Atmos. Chem. Phys., 20, 11423–11433, https://doi.org/10.5194/acp-20-11423-2020, 2020.
Li, L. Y., Yan, D. Y., Xu, S. H., Huang, M. L., Wang, X. X., and Xie, S. D.: Characteristics and source distribution of air pollution in winter in Qingdao, eastern China, Environ. Pollut., 224, 44–53, https://doi.org/10.1016/j.envpol.2016.12.037, 2017.
Li, W. J., Shao, L. Y., Wang, W. H., Li, H., Wang, X. M., Li, Y. W., Li, W. J., Jones, T., and Zhang, D. Z.: Air quality improvement in response to intensified control strategies in Beijing during 2013–2019, Sci. Total Environ., 744, 140776, https://doi.org/10.1016/j.scitotenv.2020.140776, 2020.
Li, Y., Miao, Y. C., Che, H. Z., and Liu, S. H.: On the heavy aerosol pollution and its meteorological dependence in Shandong province, China, Atmos. Res., 256, 105572, https://doi.org/10.1016/j.atmosres.2021.105572, 2021a.
Li, Y., Xu, H. X., Tang, K. Y., Lau, A. K. H., Fung, J. C. H., and Zhang, X. G.: An ensemble assessment of the effectiveness of vehicular emission control programs for air quality improvement in Hong Kong, Atmos. Environ., 262, 118571, https://doi.org/10.1016/j.atmosenv.2021.118571, 2021b.
Liang, X., Li, S., Zhang, S. Y., Huang, H., and Chen, S. X.: PM2.5 data reliability, consistency, and air quality assessment in five Chinese cities, J. Geophys. Res.-Atmos., 121, 10220–10236, https://doi.org/10.1002/2016JD024877, 2016.
Liu, B. S., Song, N., Dai, Q. L., Mei, R. B., Sui, B. H., Bi, X. H., and Feng, Y. C.: Chemical composition and source apportionment of ambient PM2.5 during the non-heating period in Taian, China, Atmos. Res., 170, 23–33, https://doi.org/10.1016/j.atmosres.2015.11.002, 2016.
Liu, B., Cheng, Y., Zhou, M., Liang, D., Dai, Q., Wang, L., Jin, W., Zhang, L., Ren, Y., Zhou, J., Dai, C., Xu, J., Wang, J., Feng, Y., and Zhang, Y.: Effectiveness evaluation of temporary emission control action in 2016 in winter in Shijiazhuang, China, Atmos. Chem. Phys., 18, 7019–7039, https://doi.org/10.5194/acp-18-7019-2018, 2018.
Liu, B. S., Wu, J. H., Wang, J., Shi, L. Y., Meng, H., Dai, Q. L., Wang, J., Song, C. B., Zhang, Y. F., Feng, Y. C., and Hopke, P. K.: Chemical characteristics and sources of ambient PM2.5 in a harbor area: Quantification of health risks to workers from source-specific selected toxic elements, Environ. Pollut., 268, 115926, https://doi.org/10.1016/j.envpol.2020.115926, 2021.
Liu, C., Xu, R., Zhang, T. H., Zhang, H. D., Zhang, B. H., Cong, C. H., and Wu, J. Y.: Analysis of Ozone Pollution Characteristics and Its Sources During the Shanghai Cooperation Organization Summit in Qingdao, Meteor. Environ. Sci., 43, 51–58, https://doi.org/10.16765/j.cnki.1673-7148.2020.03.007, 2020a (in Chinese).
Liu, C., Zhang, H. D., Zhang, T. H., Xu, R., Zhang, B. H., Lu, M. Y., and Li, G. H.: The causes of ozone concentration growth in the night during the “Shanghai Cooperation Organization Summit” in Qingdao, China Environ. Sci., 40, 3332–3341, https://doi.org/10.19674/j.cnki.issn1000-6923.2020.0372, 2020b (in Chinese).
Liu, F., Beirle, S., Zhang, Q., van der A, R. J., Zheng, B., Tong, D., and He, K.: NOx emission trends over Chinese cities estimated from OMI observations during 2005 to 2015, Atmos. Chem. Phys., 17, 9261–9275, https://doi.org/10.5194/acp-17-9261-2017, 2017.
Liu, M., Huang, Y., Ma, Z., Jin, Z., Liu, X., Wang, H., Liu, Y., Wang, J., Jantunen, M., Bi, J. and Kinney, P. L.: Spatial and temporal trends in the mortality burden of air pollution in China: 2004–2012, Environ. Int., 98, 75–81, https://doi.org/10.1016/j.envint.2016.10.003, 2017.
Liu, W. J., Xu, Y. S., Liu, W. X., Liu, Q. Y., Yu, S. Y., Liu, Y., Wang, X., and Tao, S.: Oxidative potential of ambient PM2.5 in the coastal cities of the Bohai Sea, northern China: Seasonal variation and source apportionment, Environ. Pollut., 236, 514–528, https://doi.org/10.1016/j.envpol.2018.01.116, 2018.
Lyu, X. P., Zeng, L. W., Guo, H., Simpson, I. J., Ling, Z. H., Wang, Y., Murray, F., Louie, P. K. K., Saunders, S. M., Lam, S. H. M., and Blake, D. R.: Evaluation of the effectiveness of air pollution control measures in Hong Kong, Environ. Pollut., 220, 87–94, https://doi.org/10.1016/j.envpol.2016.09.025, 2017.
Ma, X. W., Li, C. D., Dong, X. Y., and Liao, H.: Empirical analysis on the effectiveness of air quality control measures during mega events: Evidence from Beijing, China, J. Clean Prod., 271, 122536, https://doi.org/10.1016/j.jclepro.2020.122536, 2020.
Ma, X., Huang, J., Zhao, T., Liu, C., Zhao, K., Xing, J., and Xiao, W.: Rapid increase in summer surface ozone over the North China Plain during 2013–2019: a side effect of particulate matter reduction control?, Atmos. Chem. Phys., 21, 1–16, https://doi.org/10.5194/acp-21-1-2021, 2021.
Masiol, M., Squizzato, S., Rich, D. Q., and Hopke, P. K.: Long-term trends (2005–2016) of source apportioned PM2.5 across New York State, Atmos. Environ., 201, 110–120, https://doi.org/10.1016/j.atmosenv.2018.12.038, 2019.
Meng, Z. Y., Ding, G. A., Xu, X. B., Xu, X. D., Yu, H. Q., and Wang, S. F.: Vertical distributions of SO2 and NO2 in the lower atmosphere in Beijing urban areas, China, Sci. Total Environ., 390, 456–465, https://doi.org/10.1016/j.scitotenv.2007.10.012, 2008.
Munir, S., Chen, H. B., and Ropkins, K.: Quantifying temporal trends in ground level ozone concentration in the UK, Sci. Total Environ., 458–460, 217–227, https://doi.org/10.1016/j.scitotenv.2013.04.045, 2013.
Nøjgaard, J. K., Nguyen, Q. T., Glasius, M., and Sørensen, L. L.: Nucleation and Aitken mode atmospheric particles in relation to O3 and NOx at semirural background in Denmark, Atmos. Environ., 49, 275–283, https://doi.org/10.1016/j.atmosenv.2011.11.040, 2012.
Nirel, R. and Dayan, U.: On the Ratio of Sulfur Dioxide to Nitrogen Oxides as an Indicator of Air Pollution Sources, J. Appl. Meteorol., 40, 1209–1222, https://doi.org/10.1175/1520-0450(2001)040<1209:OTROSD>2.0.CO;2, 2001.
Paatero, P. and Tapper, U.: Positive matrix factorization: A non-negative factor model with optimal utilization of error estimates of data values, Environmetrics, 5, 111–126, https://doi.org/10.1002/env.3170050203, 1994.
Police, S., Sahu, S. K., and Pandit, G. G.: Chemical characterization of atmospheric particulate matter and their source apportionment at an emerging industrial coastal city, Visakhapatnam, India, Atmos. Pollut. Res., 7, 725–733, https://doi.org/10.1016/j.apr.2016.03.007, 2016.
Pugliese, S. C., Murphy, J. G., Geddes, J. A., and Wang, J. M.: The impacts of precursor reduction and meteorology on ground-level ozone in the Greater Toronto Area, Atmos. Chem. Phys., 14, 8197–8207, https://doi.org/10.5194/acp-14-8197-2014, 2014.
Qi, L., Zhang, Y. F., Ma, Y. H., Chen, M. D., Ge, X. L., Ma, Y., Zheng, J., Wang, Z., and Li, S. Z.: Source identification of trace elements in the atmosphere during the second Asian Youth Games in Nanjing, China: Influence of control measures on air quality, Atmos. Pollut. Res., 7, 547–556, https://doi.org/10.1016/j.apr.2016.01.003, 2016.
Querol, X., Viana, M., Alastuey, A., Amato, F., Moreno, T., Castillo, S., Pey, J., de la Rosa, J., Sánchez de la Campa, A., Artíñano, B., Salvador, P., García Dos Santos, S., Fernández-Patier, R., Moreno-Grau, S., Negral, L., Minguillón, M. C., Monfort, E., Gil, J. I., Inza, A., Ortega, L. A., Santamaría, J. M., and Zabalza, J.: Source origin of trace elements in PM from regional background, urban and industrial sites of Spain, Atmos. Environ., 41, 7219–7231, https://doi.org/10.1016/j.atmosenv.2007.05.022, 2007.
Ryou, H. G., Heo, J., and Kim, S. Y.: Source apportionment of PM10 and PM2.5 air pollution, and possible impacts of study characteristics in South Korea, Environ. Pollut., 240, 963–972, https://doi.org/10.1016/j.envpol.2018.03.066, 2018.
Sen, P. K.: Estimates of the Regression Coefficient Based on Kendall's Tau AU – Sen, Pranab Kumar, J. Am. Stat. Assoc., 63, 1379–1389, https://doi.org/10.1080/01621459.1968.10480934, 1968.
Schleicher, N., Norra, S., Chen, Y., Chai, F., and Wang, S.: Efficiency of mitigation measures to reduce particulate air pollution—A case study during the Olympic Summer Games 2008 in Beijing, China, Sci. Total Environ., 427–428, 146–158, https://doi.org/10.1016/j.scitotenv.2012.04.004, 2012.
Shi, Z. B., Song, C. B., Liu, B. W., Lu, G. D., Xu, J. S., Vu, T. V., Elliott, R. J. R., Li, W. J., Bloss, W. J., and Harrison, R. M.: Abrupt but smaller than expected changes in surface air quality attributable to COVID-19 lockdowns, Sci Adv., 7, eabd6696, https://doi.org/10.1126/sciadv.abd6696, 2021.
Song, L. L., Dai, Q. L., Feng, Y. C., and Hopke, P. K.: Estimating uncertainties of source contributions to PM2.5 using moving window evolving dispersion normalized PMF, Environ. Pollut., 286, 117576, https://doi.org/10.1016/j.envpol.2021.117576, 2021.
Tian, Y. Z., Wang, J., Peng, X., Shi, G. L., and Feng, Y. C.: Estimation of the direct and indirect impacts of fireworks on the physicochemical characteristics of atmospheric PM10 and PM2.5, Atmos. Chem. Phys., 14, 9469–9479, https://doi.org/10.5194/acp-14-9469-2014, 2014.
Tsai, D. H., Wang, J. L., Chuang, K. J., and Chan, C. C.: Traffic-related air pollution and cardiovascular mortality in central Taiwan, Sci. Total Environ., 408, 1818–1823, https://doi.org/10.1016/j.scitotenv.2010.01.044, 2010.
Viana, M., Kuhlbusch, T. A. J., Querol, X., Alastuey, A., Harrison, R. M., Hopke, P. K., Winiwarter, W., Vallius, M., Szidat, S., Prévôt, A. S. H., Hueglin, C., Bloemen, H., Wåhlin, P., Vecchi, R., Miranda, A. I., Kasper-Giebl, A., Maenhaut, W., and Hitzenberger, R.: Source apportionment of particulate matter in Europe: A review of methods and results, J. Aerosol Sci., 39, 827–849, https://doi.org/10.1016/j.jaerosci.2008.05.007, 2008.
Vodonos, A. and Schwartz, J.: Estimation of excess mortality due to long-term exposure to PM2.5 in continental United States using a high-spatiotemporal resolution model, Environ. Res., 196, 110904, https://doi.org/10.1016/j.envres.2021.110904, 2021.
Vu, T. V., Shi, Z., Cheng, J., Zhang, Q., He, K., Wang, S., and Harrison, R. M.: Assessing the impact of clean air action on air quality trends in Beijing using a machine learning technique, Atmos. Chem. Phys., 19, 11303–11314, https://doi.org/10.5194/acp-19-11303-2019, 2019.
Wang, H. L., Miao, Q., Shen, L. J., Yang, Q., Wu, Y. Z., and Wei, H.: Air pollutant variations in Suzhou during the 2019 novel coronavirus (COVID-19) lockdown of 2020: High time-resolution measurements of aerosol chemical compositions and source apportionment, Environ. Pollut., 271, 116298, https://doi.org/10.1016/j.envpol.2020.116298, 2021.
Wang, S. X., Xing, J., Zhao, B., Jang, C., and Hao, J. M.: Effectiveness of national air pollution control policies on the air quality in metropolitan areas of China, J. Environ. Sci., 26, 13–22, https://doi.org/10.1016/S1001-0742(13)60381-2, 2014.
Wang, Y., Xue, Y. F., Tian, H. Z., Gao, J., Chen, Y., Zhu, C. Y., Liu, H. J., Wang, K., Hua, S. B., Liu, S. H., and Shao, P. Y.: Effectiveness of temporary control measures for lowering PM2.5 pollution in Beijing and the implications, Atmos. Environ., 157, 75–83, https://doi.org/10.1016/j.atmosenv.2017.03.017, 2017.
Wang, Y. Q., Zhang, X. Y., and Draxler, R.: TrajStat: GIS-based software that uses various trajectory statistical analysis methods to identify potential sources from long-term air pollution measurement data, Environ. Model. Softw., 24, 938–939, https://doi.org/10.1016/j.envsoft.2009.01.004, 2009.
Wang, Y. Y., Liu, B. S., Zhang, Y. F., Dai, Q. L., Song, C. B., Duan, L. Q., Guo, L. L., Zhao, J., Xue, Z. G., Bi, X. H., and Feng, Y. C.: Potential health risks of inhaled toxic elements and risk sources during different COVID-19 lockdown stages in Linfen, China, Environ. Pollut., 284, 117454, https://doi.org/10.1016/j.envpol.2021.117454, 2021.
Xu, H., Xiao, Z. M., Chen, K., Tang, M., Zheng, N. Y., Li, P., Yang, N., Yang, W., and Deng, X. W.: Spatial and temporal distribution, chemical characteristics, and sources of ambient particulate matter in the Beijing–Tianjin–Hebei region, Sci. Total Environ., 658, 280–293, https://doi.org/10.1016/j.scitotenv.2018.12.164, 2019.
Xu, L. L., Jiao, L., Hong, Z. Y., Zhang, Y. R., Du, W. J., Wu, X., Chen, Y. T., Deng, J. J., Hong, Y. W., and Chen, J. S.: Source identification of PM2.5 at a port and an adjacent urban site in a coastal city of China: Impact of ship emissions and port activities, Sci. Total Environ., 634, 1205–1213, https://doi.org/10.1016/j.scitotenv.2018.04.087, 2018.
Xu, M., Qin, Z. F., Zhang, S. H., and Xie, Y.: Health and economic benefits of clean air policies in China: A case study for Beijing–Tianjin–Hebei region, Environ. Pollut., 285, 117525, https://doi.org/10.1016/j.envpol.2021.117525, 2021.
Xu, W., Liu, X. J., Liu, L., Dore, A. J., Tang, A., Lu, L., Wu, Q. H., Zhang, Y. Y., Hao, T. X., Pan, Y. P., Chen, J. M., and Zhang, F. S.: Impact of emission controls on air quality in Beijing during APEC 2014: Implications from water-soluble ions and carbonaceous aerosol in PM2.5 and their precursors, Atmos. Environ., 210, 241–252, https://doi.org/10.1016/j.atmosenv.2019.04.050, 2019.
Yin, H., Liu, C., Hu, Q. H., Liu, T., Wang, S., Gao, M., Xu, S. Q., Zhang, C. X., and Su, W. J.: Opposite impact of emission reduction during the COVID-19 lockdown period on the surface concentrations of PM2.5 and O3 in Wuhan, China, Environ. Pollut., 289, 117899, https://doi.org/10.1016/j.envpol.2021.117899, 2021.
Yang, S., Duan, F., Ma, Y., Li, H., Ma, T., Zhu, L., Huang, T., Kimoto, T., and He, K.: Mixed and intensive haze pollution during the transition period between autumn and winter in Beijing, China, Sci. Total Environ., 711, 134745, https://doi.org/10.1016/j.scitotenv.2019.134745, 2020.
Yu, M. F., Zhu, Y., Lin, C. J., Wang, S. X., Xing, J., Jang, C., Huang, J. Z., Huang, J. Y., Jin, J. B., and Yu, L.: Effects of air pollution control measures on air quality improvement in Guangzhou, China, J. Environ. Manage., 244, 127–137, https://doi.org/10.1016/j.jenvman.2019.05.046, 2019.
Zhai, S., Jacob, D. J., Wang, X., Shen, L., Li, K., Zhang, Y., Gui, K., Zhao, T., and Liao, H.: Fine particulate matter (PM2.5) trends in China, 2013–2018: separating contributions from anthropogenic emissions and meteorology, Atmos. Chem. Phys., 19, 11031–11041, https://doi.org/10.5194/acp-19-11031-2019, 2019.
Zhang, D. Z., Shi, G. Y., Iwasaka, Y., Hu, M., and Zang, J. Y.: Anthropogenic Calcium Particles Observed in Beijing and Qingdao, China, Water Air Soil Poll.: Focus, 5, 261–276, https://doi.org/10.1007/s11267-005-0743-y, 2005.
Zhang, Q., He, K. B., and Huo, H.: Cleaning China's air, Nature, 484, 161–162, https://doi.org/10.1038/484161a, 2012.
Zhang, Q., Zheng, Y. X., Tong, D., Shao, M., Wang, S. X., Zhang, Y. H., Xu, X. D., Wang, J. N., He, H., Liu, W. Q., Ding, Y. H., Lei, Y., Li, J. H., Wang, Z. F., Zhang, X. Y., Wang, Y. S., Cheng, J., Liu, Y., Shi, Q. R., Yan, L., Geng, G. N., Hong, C. P., Li, M., Liu, F., Zheng, B., Cao, J. J., Ding, A. J., Gao, J., Fu, Q. Y., Huo, J. T., Liu, B. X., Liu, Z. R., Yang, F. M., He, K. B., and Hao, J. M.: Drivers of improved PM2.5 air quality in China from 2013 to 2017, P. Natl. Acad. Sci USA, 116, 24463–24469, https://doi.org/10.1073/pnas.1907956116, 2019.
Zhang, Y., Yang, L. X., Bie, S. J., Zhao, T., Huang, Q., Li, J. S., Wang, P. C., Wang, Y. M., and Wang, W. X.: Chemical compositions and the impact of sea salt in atmospheric PM1 and PM2.5 in the coastal area, Atmos. Res., 250, 105323, https://doi.org/10.1016/j.atmosres.2020.105323, 2021.
Zhao, C. K., Sun, Y., Zhong, Y. P., Xu, S. H., Liang, Y., Liu, S., He, X. D., Zhu, J. H., Shibamoto, T., and He, M.: Spatio-temporal analysis of urban air pollutants throughout China during 2014–2019, Air Qual. Atmos. Hlth., 14, 1619–1632, https://doi.org/10.1007/s11869-021-01043-5, 2021.
Zhao, S., Tian, H. Z., Luo, L. N., Liu, H. J., Wu, B. B., Liu, S. H., Bai, X. X., Liu, W., Liu, X. Y., Wu, Y. M., Lin, S. M., Guo, Z. H., Lv, Y. Q., and Xue, Y. F.: Temporal variation characteristics and source apportionment of metal elements in PM2.5 in urban Beijing during 2018–2019, Environ. Pollut., 268, 115856, https://doi.org/10.1016/j.envpol.2020.115856, 2021.
Zong, Z., Wang, X. P., Tian, C. G., Chen, Y. J., Fu, S. F., Qu, L., Ji, L., Li, J., and Zhang, G.: PMF and PSCF based source apportionment of PM2.5 at a regional background site in North China, Atmos. Res., 203, 207–215, https://doi.org/10.1016/j.atmosres.2017.12.013, 2018.