the Creative Commons Attribution 4.0 License.
the Creative Commons Attribution 4.0 License.
 | 01 Jul 2022
Investigation of new particle formation mechanisms and aerosol processes at Marambio Station, Antarctic Peninsula
Lauriane L. J. Quéléver
Lubna Dada
Eija Asmi
Janne Lampilahti
Tommy Chan
Jonathan E. Ferrara
Gustavo E. Copes
German Pérez-Fogwill
Luis Barreira
Minna Aurela
Douglas R. Worsnop
Tuija Jokinen
Mikko Sipilä
Understanding chemical processes leading to the formation of atmospheric aerosol particles is crucial to improve our capabilities in predicting the future climate. However, those mechanisms are still inadequately characterized, especially in polar regions. In this study, we report observations of neutral and charged aerosol precursor molecules and chemical cluster composition (qualitatively and quantitatively), as well as air ions and aerosol particle number concentrations and size distributions from the Marambio research station (64∘15′ S, 56∘38′ W), located north of the Antarctic Peninsula. We conducted measurements during the austral summer, between 15 January and 25 February 2018. The scope of this study is to characterize new particle formation (NPF) event parameters and connect our observations of gas-phase compounds with the formation of secondary aerosols to resolve the nucleation mechanisms at the molecular scale. NPF occurred on 40 % of measurement days. All NPF events were observed during days with high solar radiation, mostly with above-freezing temperatures and with low relative humidity. The averaged formation rate for 3 nm particles (J3) was 0.686 cm−3 s−1, and the average particle growth rate (GR3.8–12 nm) was 4.2 nm h−1. Analysis of neutral aerosol precursor molecules showed measurable concentrations of iodic acid (IA), sulfuric acid (SA), and methane sulfonic acid (MSA) throughout the entire measurement period with significant increase in MSA and SA concentrations during NPF events. We highlight SA as a key contributor to NPF processes, while IA and MSA likely only contribute to particle growth. Mechanistically, anion clusters containing ammonia and/or dimethylamine (DMA) and SA were identified, suggesting significant concentration of ammonia and DMA as well. Those species are likely contributing to NPF events since SA alone is not sufficient to explain observed nucleation rates. Here, we provide evidence of the marine origin of the measured chemical precursors and discuss their potential contribution to the aerosol phase.
- Article
(7738 KB) - Full-text XML
-
Supplement
(6086 KB) - BibTeX
- EndNote


Atmospheric aerosol particles impact the planetary energy budget and radiation balance by influencing cloud optical properties and cloud lifetime (IPCC, 2013). Even though they are crucial for regulating the climate, aerosol particles remain insufficiently characterized, especially in remote regions (Schmale et al., 2019). Understanding the atmospheric processes in places where anthropogenic influence is minimal, such as polar regions, is important for characterizing the pre-industrial-like atmosphere. At the same time, polar environments are significantly impacted by human-induced climate change and are warming twice as fast as the global average (Stuecker et al., 2018). Additionally, polar ecosystems and landscapes are being disturbed more and more by increasing average temperatures that further affect emissions of trace gases into the atmosphere.
Aerosol particles have been observed and characterized in many places in the Arctic and Antarctica (Shaw, 1979, 1988; Asmi et al., 2010; Kerminen et al., 2018; Sipilä et al., 2016; Dall'Osto et al., 2017; Jokinen et al., 2018; Dall'Osto et al., 2018; Herenz et al., 2019; Baccarini et al., 2020; Dall'Osto et al., 2019; Beck et al., 2021; Brean et al., 2021). Antarctic primary particles, mainly originating from sea spray or blowing snow, only weakly contribute to total particle number concentration (Lachlan-Cope et al., 2020). Modeling studies have estimated that primary particles only contribute to ∼ 2 % of the total particle count at the ground level in Antarctica (Merikanto et al., 2009). Secondary formation of aerosol particles, on the other hand, is believed to be the principal contributor to cloud condensation nuclei (CCN), especially on the Antarctic Peninsula where models showed contributions varying from 75 % to 100 % (Jokinen et al., 2018; Kerminen et al., 2018; Merikanto et al., 2009). These secondary aerosols originate from nucleation of gas-phase molecules, typically condensing oxidation products of locally or regionally emitted vapors. Once formed, neutral or charged molecular clusters can grow by condensation of gases to sizes where they can act as CCN. The process of aerosol nucleation followed by subsequent growth is called new particle formation (NPF). Only a few studies have observed nucleation mode particles (sub-10 nm) from Antarctica – including oceanic, coastal, and continental areas (Asmi et al., 2010; Virkkula et al., 2009; Järvinen et al., 2013; Kyrö et al., 2013; Weller et al., 2015; Jokinen et al., 2018; Kerminen et al., 2018; Lachlan-Cope et al., 2020; Brean et al., 2021) – and only two of those report molecular clusters forming from precursor gases in coastal sites (Jokinen et al., 2018; Brean et al., 2021).
Previously identified aerosol precursor vapors include sulfuric acid (SA – H2SO4; e.g., Kulmala et al., 2013; Sipilä et al., 2010), iodic acid (IA – HIO3; Sipilä et al., 2016; Baccarini et al., 2020), and iodous acid (HIO2; He et al., 2021) or highly oxygenated organic molecules (HOMs; e.g., Ehn et al., 2014; Bianchi et al., 2019; Kirkby et al., 2016). On the other hand, nucleating ion clusters such as bisulfate ions with SA and ammonia (e.g., Kirkby et al., 2011; Yan et al., 2018; Jokinen et al., 2018; Beck et al., 2021) and bisulfate ions and neutral SA with dimethylamine (DMA – (CH3)2NH; Kürten et al., 2014) were previously identified as participating in aerosol formation processes.
At the Marambio, Aboa, and Princess Elisabeth coastal Antarctic stations, air mass trajectories during NPF events have indicated a dominant role of the Southern Ocean as a source of aerosol particles, which chemical aerosol composition analysis confirmed by the abundance of, e.g., marine-origin sulfates (Asmi et al., 2010; Herenz et al., 2019; Jokinen et al., 2018). These studies suggest that NPF is linked to sulfur-containing compounds originating from dimethyl sulfide (DMS – (CH3)2S). At the Antarctic coast, oceanic DMS concentrations are the highest during December to January (i.e., austral summer) with concentration that can exceed 15 nM within the upper 10 m layer of the ocean around the peninsula compared to a yearly average of ∼ 5 nM (Lana et al., 2011). DMS has two well-known oxidation products formed from gas-phase reaction with OH radicals: SA (formed via sulfur dioxide, SO2) and methane sulfonic acid (MSA – CH3SO3H), which can then initiate particle formation and subsequent particle growth (Barnes et al., 2006; Mardyukov and Schreiner, 2018).
IA was also found to significantly contribute to NPF in marine and polar environments (Sipilä et al., 2016; Baccarini et al., 2020; He et al., 2021). Although the chemical production of IA is not fully resolved, IA results from the oxidation of reactive iodine (in the form of I2, HIO, or intermediate I; He et al., 2021), sourced from algae and phytoplankton emissions contained within the seawater, ice, and/or snow and exchanged into the atmosphere (Saiz-Lopez and von Glasow, 2012). At the Antarctic Peninsula, the Weddell Sea – which undergoes consistent and recurrent phytoplankton bloom episodes every early spring – is a potential reservoir for iodic acid emissions, especially due to slower ice retreat during the austral summer and colder sea surface temperature than the Southern Ocean or than the Bellingshausen Sea, on the north and west sides of the peninsula, respectively (Atkinson et al., 2012; Von Berg et al., 2020).
This work aims at characterizing the gas-phase aerosol precursors naturally emitted from the marine and ice ecosystem and from the Antarctic continent with comprehensive gas-phase and aerosol measurements performed at the Marambio research station, Antarctica. We present our results characterizing atmospheric NPF events observed on the Antarctic Peninsula (in Sect. 3.2). We provide an extensive analysis of number size distributions of atmospheric aerosols and naturally charged ions, from ∼ 1 to 800 nm. We also report the formation rates (J) and growth rates (GRs) of the observed particle formation events. Our core analysis (in Sect. 3.3) describes gas-phase composition and NPF precursors by mass spectrometry measurements of the concentration of SA, MSA, and IA (see Sect. 3.3.1) and by identifying the composition of ambient ions present during NPF events (see Sect. 3.3.2). Finally, in Sect. 4, we combine our results for the chemical composition of both gas and aerosol phases to discuss sources of precursor vapors producing secondary aerosol on the Antarctic Peninsula.
2.1 Measurement site
In situ atmospheric gas- and particle-phase measurements were performed at the Argentinian Antarctic station Marambio (64∘15′ S, 56∘38′ W) located on Seymour Island in the northeasternmost part of the Antarctic Peninsula. Geographically (see Fig. 1), the island is on the north edge of the Weddell Sea. The station is operated year-round, with extensive scientific and logistic activities during the austral summer. The campaign instrumentation was located inside a laboratory container, specifically designed for continuous atmospheric composition measurements, sufficiently far (approx. 800 m) from the station main buildings and ideally placed upstream of the airstrip to avoid interfering contamination signals in our measurements. Comprehensive measurements of atmospheric composition and meteorology have been carried out at this location since 2013. A description of the Marambio Station surroundings, the measurement container, and some previous results can be found in earlier publications, e.g., Asmi et al. (2018).
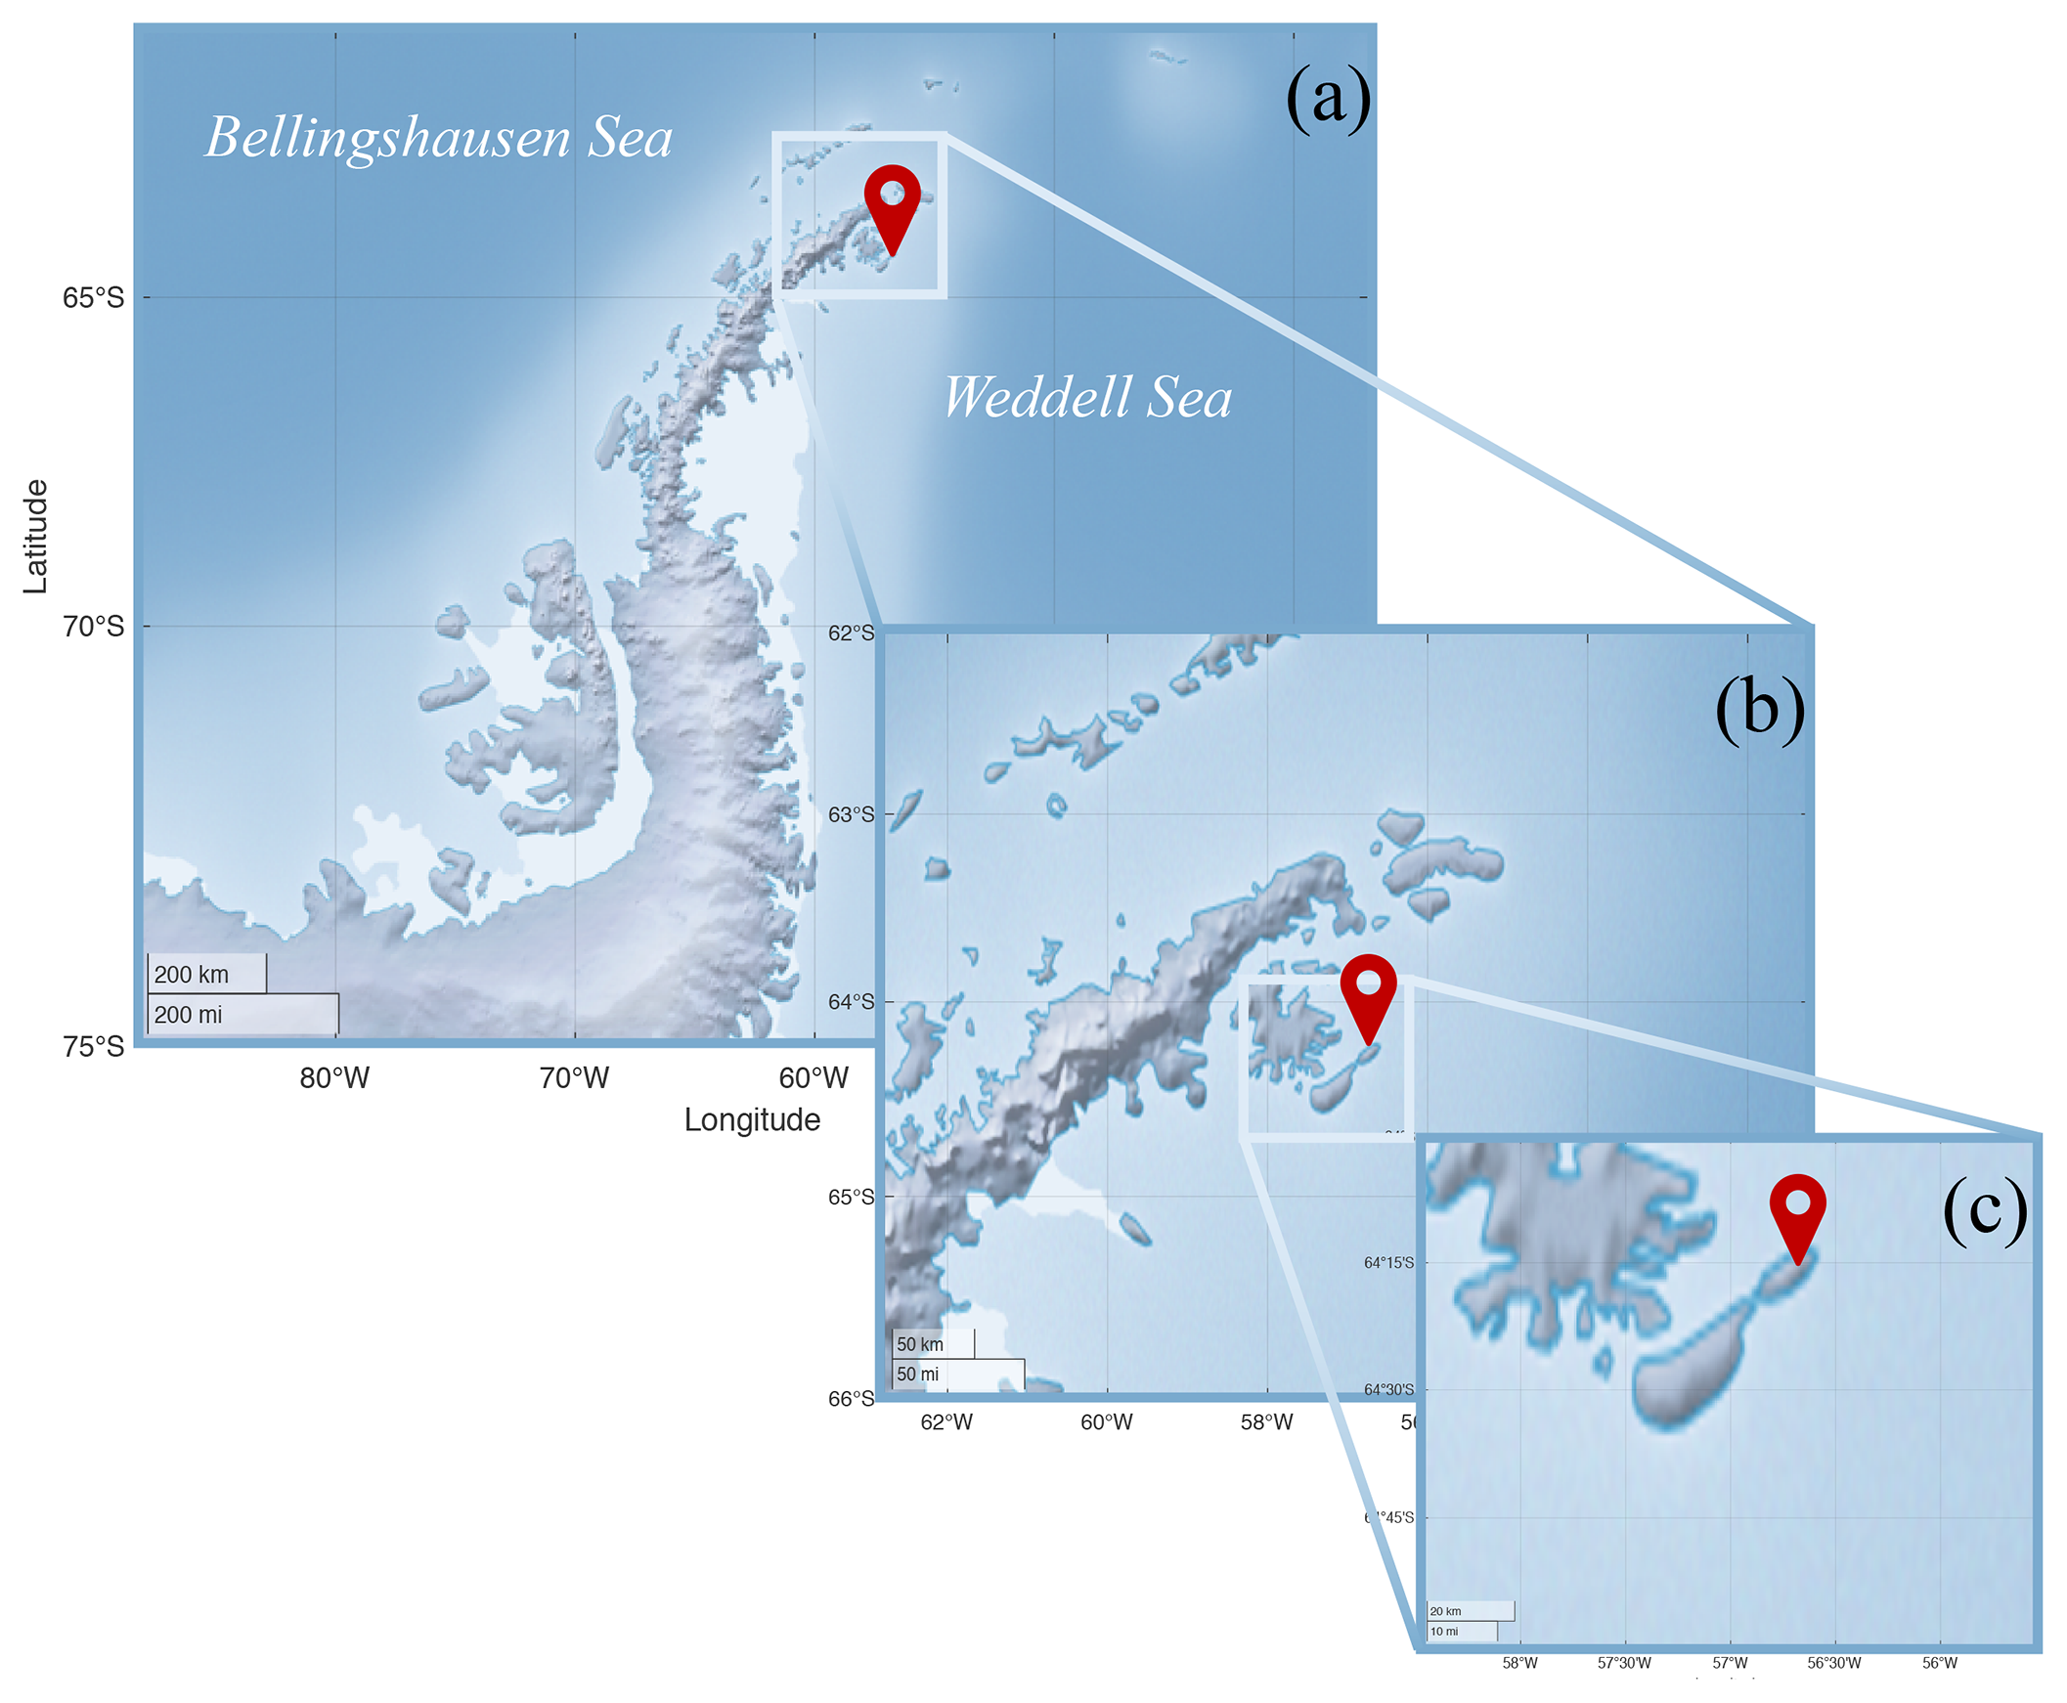
Figure 1Map of the Antarctic Peninsula (a), with zoomed-in view of the north sector (b) and of Seymour Island with Marambio Station (c). The measurement location is indicated by the red pin in every panel.
2.2 Austral summer campaign 2018
The austral summer campaign 2018 for measuring the precursors contributing to NPF at Marambio Station was planned for the warm season, when the probability of NPF occurrence is high (Fiebig et al., 2014; Kerminen et al., 2018). The aim was to characterize NPF events, formation, and growth parameters and resolve the aerosol chemical precursors from their source to their chemical pathways leading to nucleation. We measured concentrations of size-segregated aerosol particles (∼ 1–800 nm diameter) from 19 January to 23 February and chemical information of possible gas-phase precursors from 30 January to 20 February, continuously (whenever possible).
2.3 Instrumentation
2.3.1 Measurements of aerosols and their gas-phase precursors
We deployed a large suite of instruments, briefly described below. Instrument principles and operations are given in detail in the Supplement.
-
The chemical composition and concentration of neutral molecules were measured by a nitrate-based chemical ionization atmospheric pressure interface time-of-flight mass spectrometer (CI-APi-TOF, Tofwerk A.G.) (Jokinen et al., 2012). Its high-resolution analysis identifies and quantifies potential ambient gas-phase aerosol precursors, such as SA, MSA, IA, or HOMs. In some instances, we used the APi-TOF to directly measure atmospheric ions (i.e., naturally charged anions or cations), allowing only atmospheric ions to enter the instruments (i.e., with no added chemical ionization) (see Supplement).
-
A nano condensation nucleus counter (nCNC) combining a particle size magnifier (PSM, Airmodus Ltd.) with a condensation particle counter (CPC, Airmodus Ltd.) was employed to measure nano-particle concentration in the diameter range from 1 to 3 nm. The instrumentation and data inversions are extensively described in Vanhanen et al. (2011), Kangasluoma et al. (2016), Chan et al. (2020), and Lehtipalo et al. (2022) (see Supplement).
-
A neutral cluster and air ion spectrometer (NAIS, Airel Ltd.; Mirme and Mirme, 2013) provided number size distributions of neutral particles and naturally charged atmospheric clusters in the size ranges from 2 to 42 nm and from 0.8 to 42 nm, respectively. The NAIS is well described in the literature and was operated according to the instructions of Manninen et al. (2016) (see Supplement).
-
Aerosol particle size distributions were measured with a differential mobility particle sizer (DMPS): a Vienna-type differential mobility analyzer for particle size separation (Wiedensohler et al., 2012), followed by a condensation particle counter (CPC; TSI model 3772) for particle counting. The particle size distribution was measured in 25 separate size bins at a 6 min time resolution. This measurement has been carried out continuously since the year 2013, but only data measured during the summer 2018 campaign are presented here (see Supplement).
The CI-APi-TOF, nCNC, and NAIS were operated with individual (horizontal) inlet lines with a minimum length (1, 0.8, and 0.9 m, respectively) to minimize losses of nano-particles. The DMPS was operated in the station's common inlet (PM10; Asmi et al., 2018) and equipped with an additional PM1 cyclone to prevent super-micrometer particles from entering the setup.
2.3.2 Ancillary measurements
Meteorological parameters have been measured on the roof of the measurement container and recorded on a data logger (QML201L, Vaisala Ltd.) since 2013. Measured parameters include temperature and relative humidity (HMP155, Vaisala Ltd.), atmospheric pressure (PTB220, Vaisala Ltd.), wind speed and wind direction (ultrasonic anemometer, Thies 2D, Thies Clima), and radiation (pyranometer, CMP11, Kipp & Zonen).
2.3.3 Chemical composition of the aerosol phase
Aerosol samples for chemical analysis were collected using a virtual impactor (VI; Loo and Cork, 1988), in which particles were divided into two size fractions: fine (Dp<2.5 µm) and coarse (2.5 µm <Dp<10 µm). The flow rate of the VI was 16.7 L min−1, of which 15 L min−1 is used to collect the fine particles and the remaining 1.7 L min−1 is used for collection of the coarse particles. Particles were collected on 47 mm Teflon filters. The sampling time was 1 week. Collected filters were stored on petri slides and kept in a freezer (−18 ∘C) until analysis.
The mass concentrations of sodium (Na+), ammonium (NH), potassium (K+), magnesium (Mg2+), calcium (Ca2+), chloride (Cl−), nitrate (NO), sulfate (SO), MSA, and oxalate (C2O) were determined from the filter substrates. Cation and anion analyses were performed simultaneously with two ion chromatography systems (Dionex, ICS-2000). Filters were extracted in 10 mL of Milli-Q water with 10 min gentle rotation just before chemical analysis. The uncertainty in the ion chromatography analysis was estimated according to the analysis of standards as 5 % to 10 %, depending on the ion analyzed. In this study chemical composition of only the fine particles is presented.
2.4 Characteristics of new particle formation events
NPF events were identified based on the appearance of particles in the nucleation mode (3–25 nm) showing signs of growth (e.g., particles reaching >10 nm). A classification method was originally proposed by Dal Maso et al. (2005) based on DMPS data. In this study, we combined both DMPS and NAIS data to extend our observations to smaller sizes (Dada et al., 2018).
The condensation sink (CS, s−1), which is a measure of how rapidly precursor vapor concentrations are lost to pre-existing particles, was calculated using the particle number size distribution measured by the DMPS following the method proposed by Kulmala et al. (2012).
Growth rates (GRs) of particles between 3.8 and 12 nm were calculated using the 50 % appearance time method (Lehtipalo et al., 2014; Dada et al., 2020). Formation rates (J1.5, J3, J5, and J10) were calculated using the balance equation where the change in concentration of particles inside a size bin is equivalent to the sources () minus the available sinks (FCoag+FGrowth), as in Kulmala et al. (2012).
where Dp represents the lower diameter of the bin, is the particle number concentration inside the size bin, and GR is the growth rate of particles outside of the bin. is the difference between the upper and lower ends of the size bin of interest.
The coagulation sink (CoagS) is a measure of how rapidly freshly formed particles of diameter Dp are lost to pre-existing particles by collision or coalescence and is calculated as follows:
where ) is the coagulation coefficient of particle sizes Dp and , those inside the bin of and those of pre-existing particles, respectively. is the number concentration of the pre-existing particles.
In this work, the formation rates of 1.5 nm particles (J1.5) were calculated using nCNC data in the size range of 1.5 to 3 nm. Formation rates J3, J5, and J10 were calculated using NAIS data (total particle mode – using the differential mobility analyzer of negative voltage) at the size ranges of 3–7, 5–9, and 10–14 nm, respectively. During events when the GR could not be calculated (i.e., four events in total) – due to the absence of continuous growth within the size ranges – a median growth rate calculated of all the events occurring in the same month was used to estimate the formation rate as described by Kulmala et al. (2022).
In addition, the charged particle formation rates ( and ) were calculated using the ion number concentration measured by the NAIS in both polarities, whenever possible, to determine the contribution of ion-induced nucleation to the overall formation rate, according to the following equation:
where is the concentration of ion in a given size range with a lower limit of 1.5 or 2 nm (depending on the J-associated size range) and the upper limit ΔDp being larger than that. The coefficient α is the ion–ion recombination coefficient, and χ is the ion–aerosol attachment coefficient. α and χ were 1.6 × 10⁶ and 0.01 × 106 cm−3 s−1, respectively (Kulmala et al., 2012).
3.1 Ambient conditions – meteorological parameters
Ambient meteorological conditions during the campaign are presented in Fig. 2. Many sunny days are observed, occurring with ambient temperatures above 0 ∘C, high radiation, and relative humidity below 75 %. Even though the measurement site belongs to the Antarctic continent, its position – at a relatively high latitude (64∘15′ S) – gives daily solar cycles with zero radiation during the short summer nighttime periods (see Fig. 2b). During the daytime, higher radiation enhances photo-active emissions from the sea and land ecosystems and promotes atmospheric photochemistry. This is expected to lead to daytime appearance of gas-phase molecules and/or molecular clusters of condensing vapors that can lead to new particle formation and/or aerosol growth. Furthermore, since temperatures above freezing also lead to ice melting (especially in the Weddell Sea area), they are likely to enhance chemical fluxes between thinning ice, ocean, and air (Notz, 2009). These clear-sky, warm, sunny days during summertime are known to be optimal weather conditions for NPF to occur in the mid-latitude regions (Dada et al., 2017) and in the Arctic (e.g., Beck et al., 2021) and Antarctic regions (Weller et al., 2015; Jokinen et al., 2018; Baccarini et al., 2020; Brean et al., 2021). Analysis of winds (see Fig. 2e) revealed that periods of the highest temperature are seen when wind is blowing from the north, bringing warmer air across from the Southern Ocean. Predominant winds were seen from the north-northwest and south-southwest sectors. The strongest winds were recorded from the south (180∘), also driving primarily cold air from the continental plateau, agreeing with Asmi et al. (2018).

Figure 2Time series of meteorological parameters: (a) temperature (dark blue) and dew point (light blue), (b) global radiation (orange), (c) relative humidity (light green), (d) atmospheric pressure (blue green), and (e) wind direction (dark blue bars) and wind speed (medium blue line). The data are presented with a 10 min resolution and reference time set as the local standard, UTC−3.
3.2 Observation and characterization of NPF events
A total of 13 NPF events (occurring on 12 d) were observed during the 35 d austral summer campaign. Figure 3a shows the continuous size distribution series over the total measurement period from NAIS measurement (size range 1.8–42 nm), and Fig. 3b combines the data from the nCNC (size shown 1.2–2.7 nm), the NAIS (2.7–12 nm), and the DMPS (12–800 nm). Daily number size distribution plots are shown for the 12 event days separately in the Supplement (Fig. S3) as well as continuous size distribution series for the ion mode (Fig. S4).
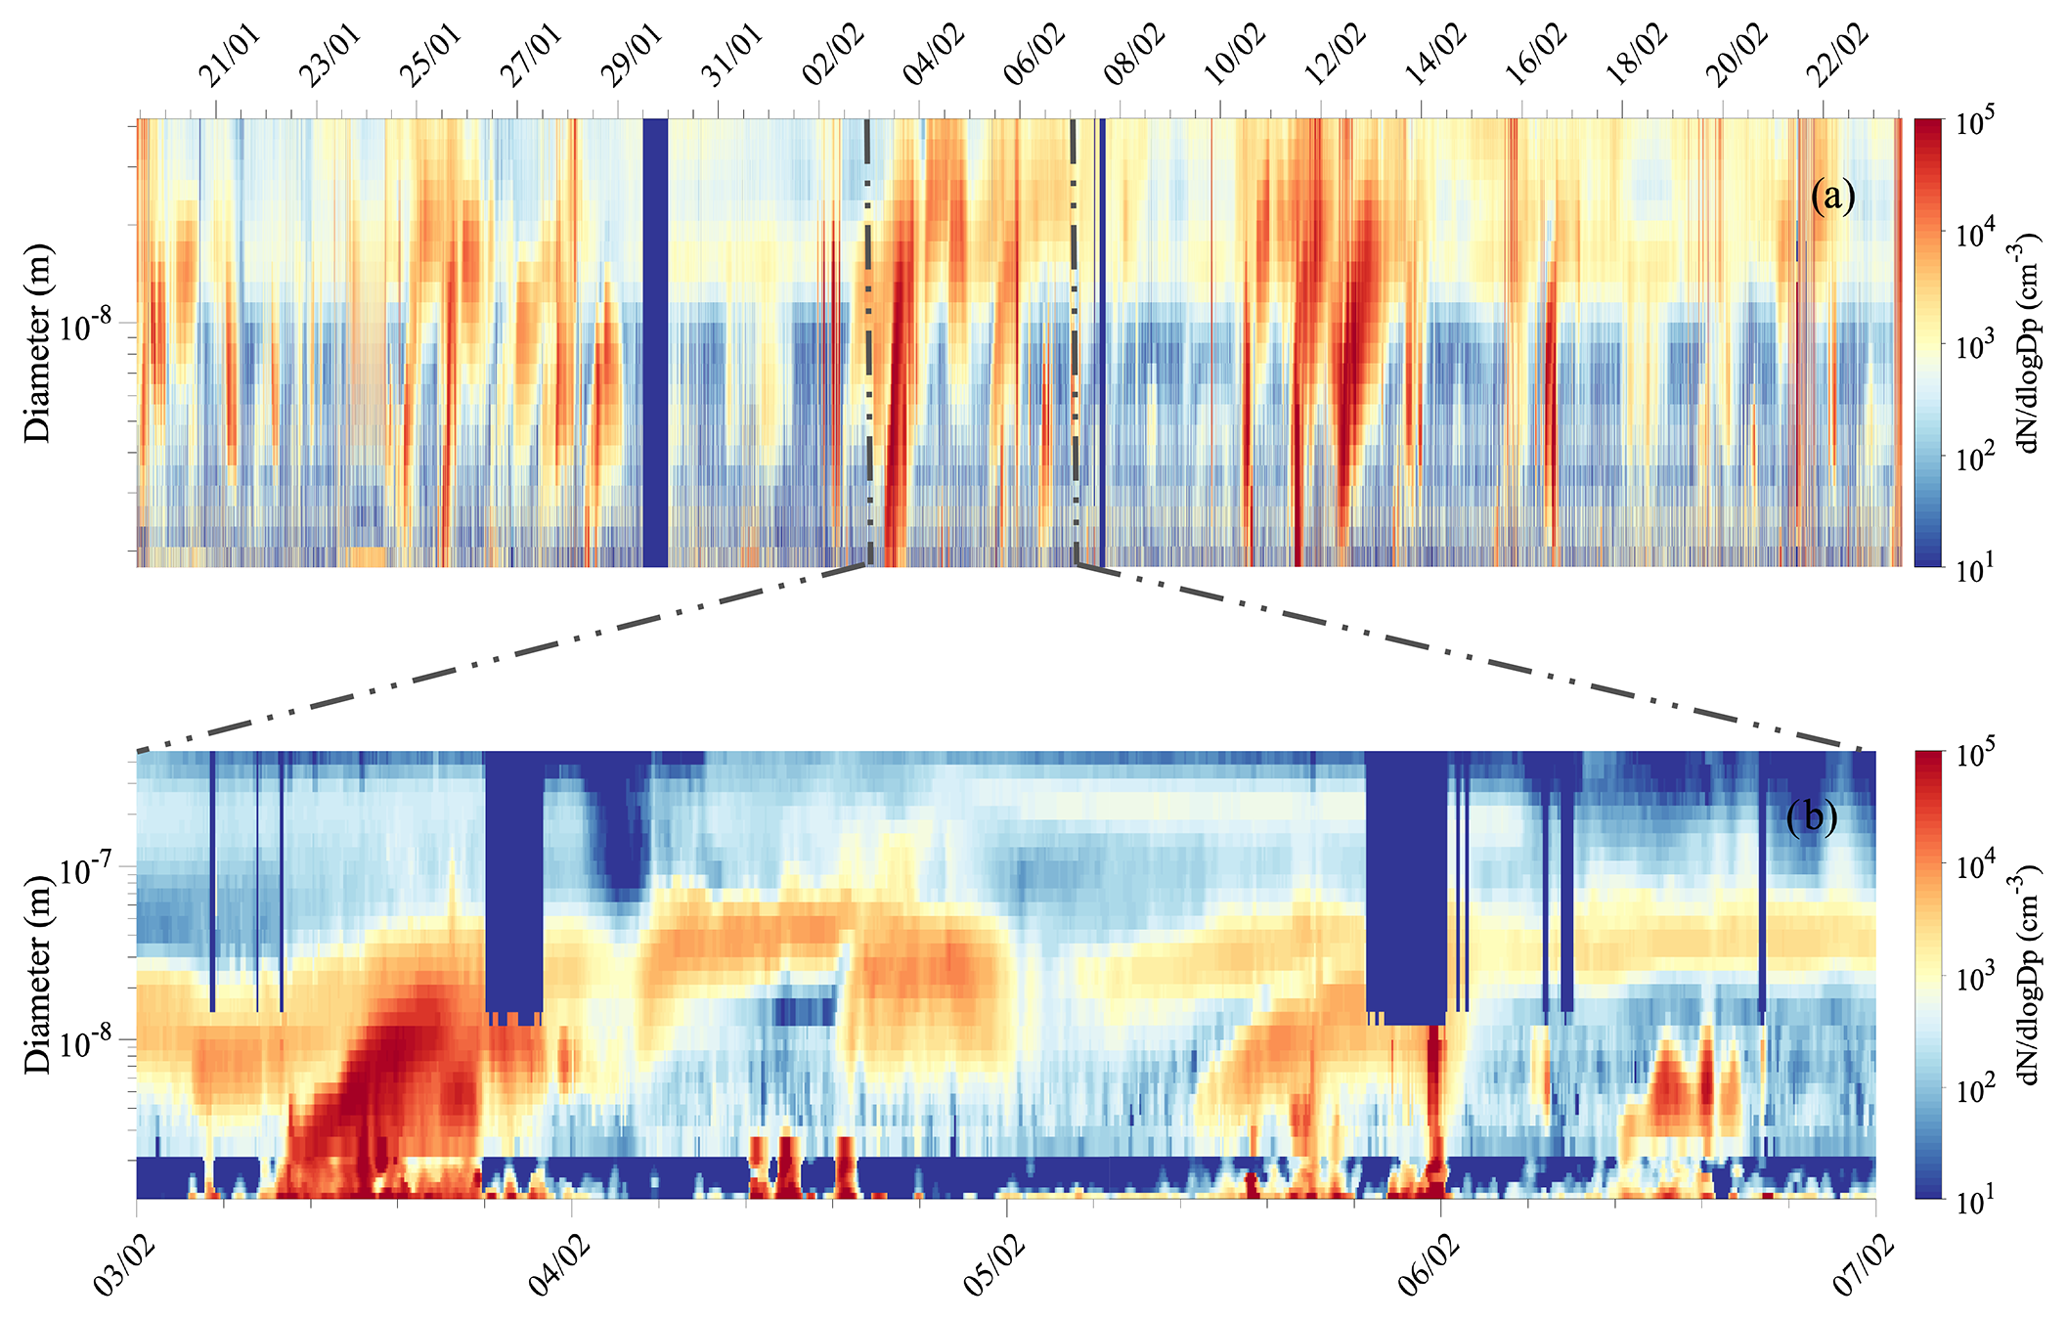
Figure 3(a) Number size distribution from NAIS measurement from 1.8 to 42 nm over the whole measurement campaign and (b) combined size distribution of aerosol particles from 1.2 to 800 nm for 3–7 February 2018. The last surface plot combines data from the nCNC (1.2–2.7 nm), NAIS (particle mode, 2.7–12 nm), and DMPS (12–800 nm), whenever the data are available and according to DMPS data flagging (only unpolluted data are shown from the DMPS measurements).
For each of the NPF events observed during the campaign, high populations of sub-3 nm aerosol particles were seen with concentration larger than 104 cm−3. The particles were observed to grow to the Aitken mode size range (25–100 nm) but rarely reached accumulation mode sizes (i.e., >100 nm) (see Fig. 3b).
Strong NPF events were identified before midday local time (66 % of events), lasting longer than events occurring later in the afternoon. Afternoon events (33 % of the total events) never lasted longer than 2.5 h. NPF events did vary from day to day: on certain days, growth of the particles was interrupted by abrupt changes in wind direction – resulting in an inability to retrieve a growth or a formation rate within reasonable uncertainty (e.g., 28 January); on other days multiple NPF events were observed (e.g., 16 February) or NPF events appeared to have a bumped shape, appearing sporadically – resembling those observed in the Arctic by Beck et al. (2021) – such as the events observed on 28 January and 6 February.
Formation rates were calculated for particle sizes of 1.5, 2, 3, 5, and 10 nm particles, as summarized in Table 1. These formation rates were calculated not only for the smallest possible particles but also for bigger sizes to ease comparison with the literature.
Formation rates of 1.5 nm particles (i.e., J1.5) were surprisingly high, reaching the maximum rates of 9.2, 10.0, and even 19 cm−3 s−1, on 11, 10, and 3 February, respectively. These significantly high values are comparable to those calculated for highly vegetated rural locations or even urban areas (e.g., Deng et al., 2020; Kontkanen et al., 2016; Yu et al., 2014), which is surprising due to the remote nature of the environment at our measurement site. For example, formation rates for 1.5 nm particles on the order of 0.030–0.013 cm−3 s−1 were estimated for the Aboa research station – on the other side of the Weddell Sea in East Antarctica (Jokinen et al., 2018). A recent study observing nucleation phenomena at the peninsula close to our measurement location (Brean et al., 2021) found a remarkably high J1.7 value reaching up to 3.07 cm−3 s−1 but was still lower than our observed values. Although the formation rates at 1.5 nm are higher than those reported previously, the rates for larger particles (i.e., ) are comparable with the previously reported studies. This discrepancy between formations rates of 1.5 nm particles and of bigger particles could be attributed to favorable nucleation conditions (i.e., sufficient nucleating vapors) but a lack of condensable vapors contributing to particle growth, which, in all, reduces the probability of particle survival.
The nucleation rates for 3 nm particles in our study ranged from 0.13 to 3 cm−3 s−1, which were, on average, also significantly higher than, e.g., 0.03 cm−3 s−1<J3<0.14 cm−3 s−1 reported in the Jokinen et al. (2018) study or in Kecorius et al. (2019), who showed J3 values from 0.080 to 0.319 cm−3 s−1 during a polar cruise in the Arctic. On the other hand, our observation agrees with the J10 reported by Kyrö et al. (2013) ranging from 0.003 to 0.3 cm−3 s−1, with 0.006 cm−3 s−1<J10<0.37 cm−3 s−1 in our case.

Figure 4High-resolution time series of H2SO4 (SA, red), CH4SO3 (MSA, orange), and HIO3 (IA, green). Numbers specified at the top of the figure refer to the event number as introduced into the NPF analysis (see Table 1). The data are averaged to 10 min with local time (UTC−3). Note that the missing points are due to a switch in the measurement mode and/or data availability.
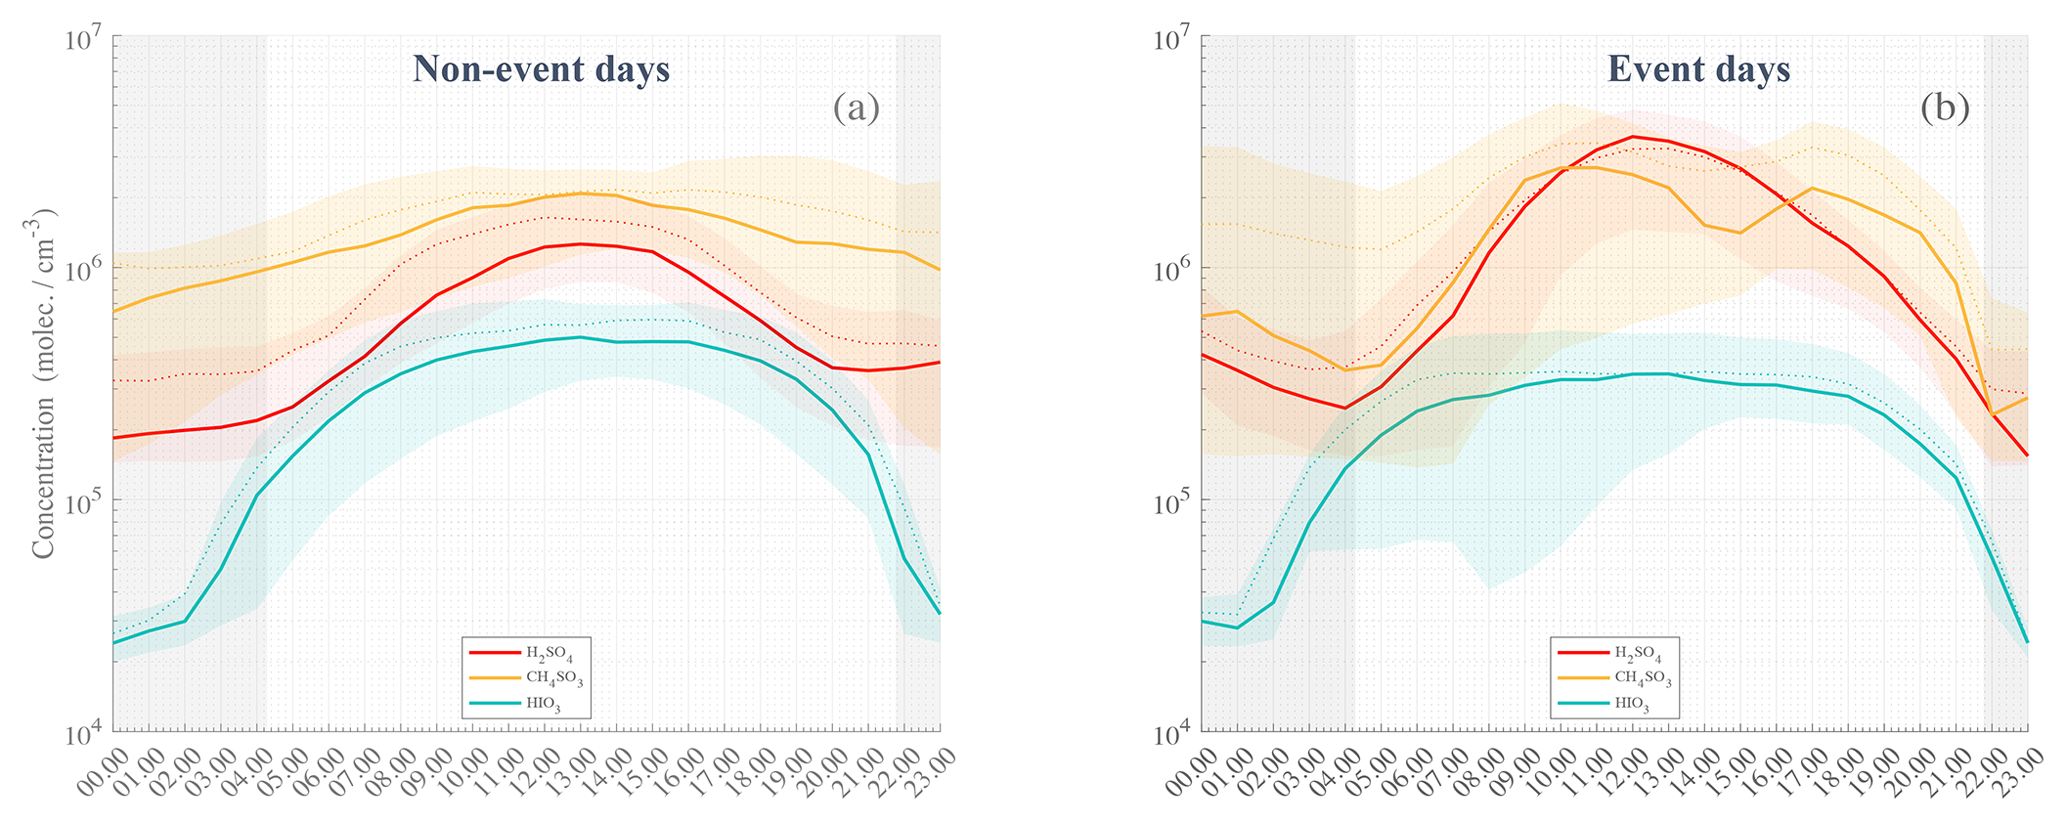
Figure 5Statistical diurnal time series of H2SO4 (SA, red), CH4SO3 (MSA, orange), and HIO3 (IA, green) observed during non-event days (a) and event days (b). The solid lines represent the median hourly average concentrations; the dotted lines are the concentration means; the colored shaded areas show data points within the 25th and the 75th percentiles. Nighttime is represented by the gray-shaded area with median theoretical sunsets and sunrises occurring during the campaign. The actual sunset and sunrise values could vary by approx. ±1.25 h from the beginning to the end of the campaign.
Additionally, to account for ion-induced nucleation, we calculated the formation rates for charged ions of 1.5 nm () separately using the ion concentrations measured with the (N)AIS in ion mode. The formation rates for positive 1.5 nm ions, , ranged from 3.6 × 10⁻⁴ to 8.3 × 10⁻² cm−3 s−1, and was from 2.2 × 10⁻³ to 5.4 × 10⁻² cm−3 s−1. Our results are significantly lower than the maximum of 0.33 cm−3 s−1 reported in Beck et al. (2021) or that in Kyrö et al. (2013), who showed 0.02 cm−3 s cm−3 s−1 in two coastal Antarctic sites, but they are in the range reported from the Arctic Ocean by, e.g., Kecorius et al. (2019; 0.026 cm−3 s cm−3 s−1). In comparison to 1.5 nm neutral particle formation rates, the ion formation rates do not represent a major contribution (ratio ∼ 103), implying that the relatively high neutral nucleation rates are not primarily due to ion-mediated nucleation.
Particle growth rates were calculated for a 3.8 to 12 nm diameter size or alternatively up to 11 and 8 nm for event no. 1 and event no. 13, respectively, whenever the shape of the number size distribution was continuously increasing. Averages for each event are also presented in Table 1. Similarly to formation rates of the smallest particles, the growth rates were remarkably higher (1.2 nm h−1< GR <10.9 nm h−1) than previously reported for other Antarctic sites. In comparison, Weller et al. (2015) reported growth rates for 3 to 25 nm particles ranging from 0.06 to 0.9 nm h−1 at Neumayer Station III, Jokinen et al. (2018) showed 0.26 nm h−1< GR <1.30 nm h−1 at Aboa, and Brean et al. (2021) published growth rates for 4.5–10 nm particles of 0.41 to 0.58 nm h−1 measured at the peninsula. Additionally, Kerminen et al. (2018) reviewed aerosol characterization from many different field studies and indicated an upper growth rate estimation of 5.5 nm h−1 (as the 95th percentile) in Antarctic sites versus 4.1 nm h−1 in Arctic environments. A recent Arctic study by Kecorius et al. (2019) reported 0.62 nm h−1< GR(3–7 nm)<4.25 nm h−1, while Collins et al. (2017) reported averaged growth rates of 4.3±4.1 nm h−1.
Table 1Summary of NPF event classification, formation, and growth parameters calculated during the Marambio austral summer campaign. The pollution flag is determined based on DMPS data according to NILU EBAS format classification at the start time of the event (when data are available, 000 – clean data, 189 – data coming from a possibly polluted sector (e.g., station main buildings), 599 – suspected pollution from unknown source). All formation rates are averaged between the start and end of the characterized events.
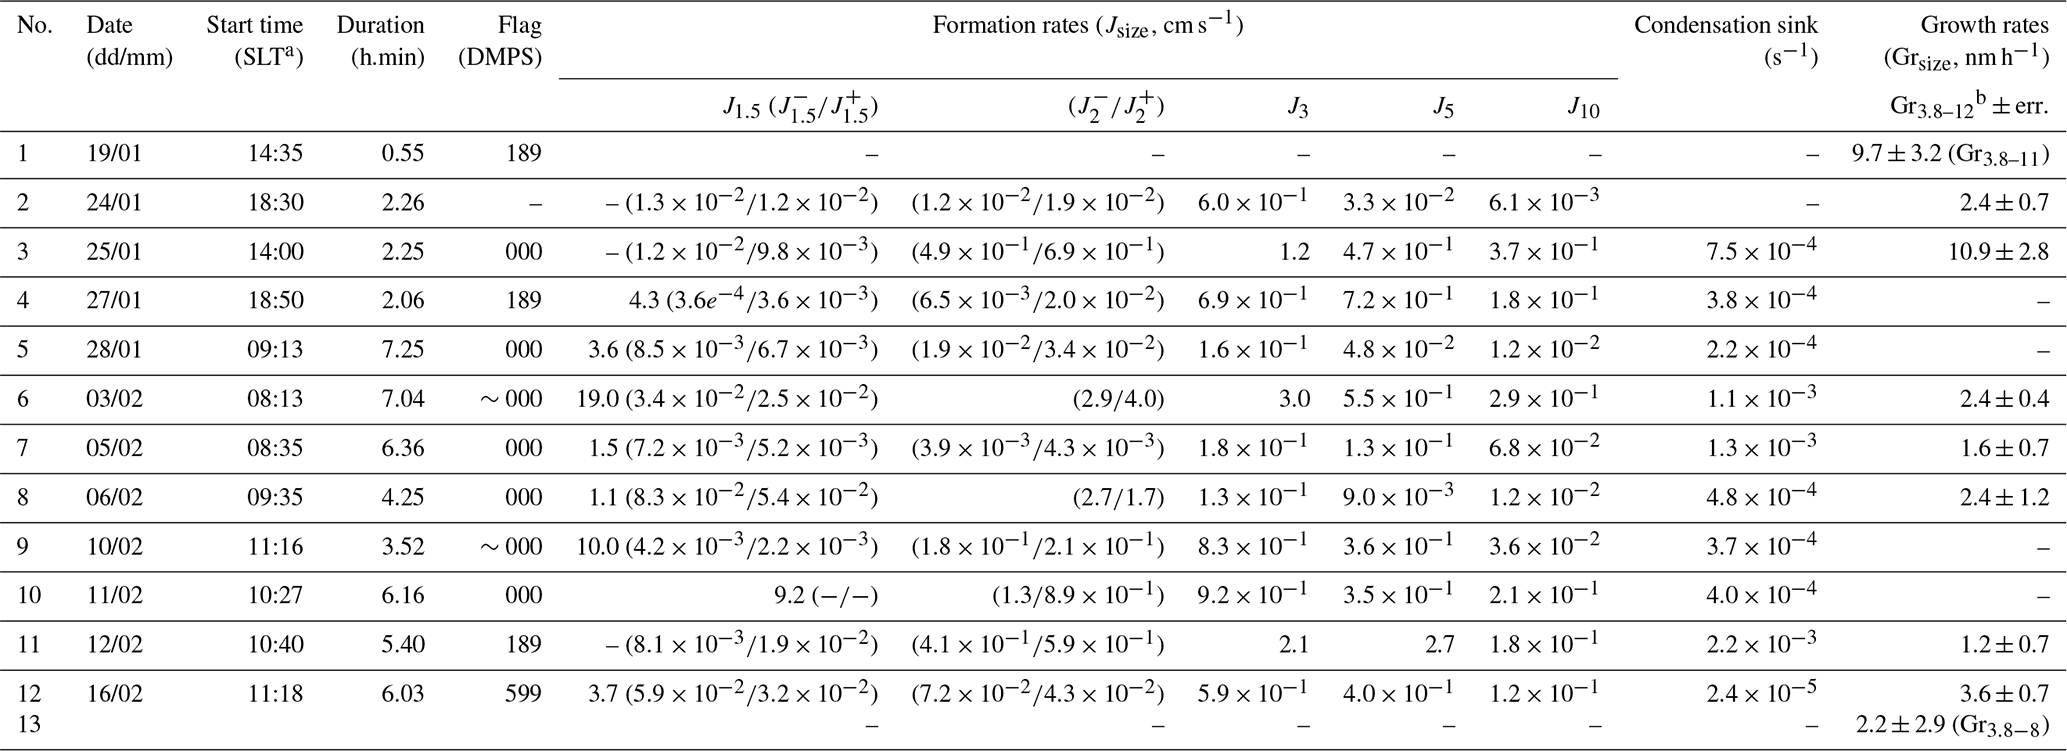
a Standard local time, UTC−3. b Growth rates were calculated ideally from 3.8 to 12 nm. If the growth in that range could not be determined, the specific range is indicated in subscript as Grx−x.
3.3 Chemical composition of the gas-phase precursor molecules
3.3.1 Gas-phase contribution to NPF
Measurements utilizing nitrate-based chemical ionization mass spectrometry (with the CI-APi-TOF) detected gas-phase molecules and molecular clusters that have affinity for proton transfer with nitrate reagent ions. These included SA, MSA, and IA – detected as HSO and HNO3HSO ( 96.9601 and 159.9557 Th), CH3SO and HNO3CH3SO ( 94.9808 and 157.9765 Th), and IO and HNO3IO ( 174.8898 and 237.8854 Th), respectively. Concentrations were calculated from high-resolution peak fitting and are reported below. The time series of those compounds during the whole campaign, according to the data availability of the CI operation, are shown in Fig. 4.
The measured gas-phase concentrations of the species of interest showed maxima of ∼ 2.6 × 10⁷, ∼ 2.3 × 10⁷, and ∼ 3.6 × 10⁶ molecules cm−3 for the total SA, MSA, and IA concentrations, respectively. The three gas-phase compounds seemed to evolve with roughly similar behavior, likely due to favorable weather conditions promoting atmospheric chemical reactions and especially enhancing photochemical oxidation reactions within a stable boundary layer. A significant and simultaneous increase in SA, MSA, and IA concentrations was observed during peak radiation time close to noontime – coinciding with local zenith time, i.e., solar noon that is slightly later than midday – and prior to many NPF events, though to a smaller extent for IA. This clearly demonstrates the diurnal nature of the emission of those species and their transport – especially for SA and IA – as shown in Fig. 5. Additionally, it is worth mentioning that even though the MSA concentrations were on average higher than those of SA, event days correlated strongly with peak SA concentration (then becoming higher than MSA concentration), while IA – whose concentration remained unchanged independently of NPF occurrence – was significantly lower than SA or MSA concentrations.
Figure 5 shows the diurnal variations in SA, MSA, and IA for event days (panel b) and non-event days (panel a), separately. In both panels, we can see a clear rise in concentrations of SA, MSA, and IA throughout the day, with maxima observed at midday.
While both MSA and SA concentrations on average increase after sunrise, IA concentration starts to increase already during the nighttime, shortly after 01:00 standard local time (SLT, i.e., UTC−3, applies to all times given in the text), suggesting that strong photochemistry conditions (i.e., direct solar radiation) might not be necessary to produce the observed IA, agreeing with He et al. (2021). Earlier studies have shown that IA is even anticorrelated with (still omnipresent) solar radiation in more continental Antarctica (Jokinen et al., 2018). It is likely that even very low levels of solar radiation would be sufficient to saturate the iodic acid production (Beck et al., 2021). Distinctively, a clear difference in the statistical series can be seen between event and non-event days, with more than doubled SA concentrations at zenith time (a factor of 2.25). MSA concentrations are only slightly higher in the morning and afternoon – with an apparent drop occurring from 14:00 to 16:00 – although the starting concentrations at sunrise and sunset are also smaller, depicting strong concentration variability as compared to non-event days. On the other hand, IA is on average lower during event days – e.g., from ∼ 4.5 × 10⁵ molecules cm−3 vs. ∼ 3 × 10⁵ molecules cm−3 – and is a factor of 1.5 smaller at zenith time. This last observation indicates that IA is likely not a key contributor to particle formation, while the duo SA–MSA could influence the aerosol phase as already suggested by Beck et al. (2021), Hodshire et al. (2019), and Willis et al. (2016).
3.3.2 Molecular characterization of aerosol and ion precursors – study case on 16 February 2018
The aerosol event observed on 16 February was particularly interesting due to the occurrence of two consecutive NPF events within the same day. An overview of both aerosol concentrations and other aerosol parameters and reactive trace gas concentrations for 16 February is shown in Fig. 6 with (panel a) the particle number size distribution series from NAIS measurement; (panel b) time series of total particle concentration within several size modes (i.e., cluster, nucleation, Aitken, and accumulation); (panel c) estimated J rates for 1.5, 3, 5, and 10 nm particles; and (panel d) time series for SA, MSA, and IA.

Figure 6Overview of aerosol formation event on 16 February 2018: (a) number size distribution from NAIS measurements (particle mode). (b) Concentrations of particle modes (cluster: sub-3 nm – medium light blue; nucleation: 3–25 nm – light blue; Aitken: 25–100 nm – medium dark blue; accumulation: 100–1000 nm – dark blue). Note that the missing points for Aitken and accumulation modes are due to data filtering from suspected pollution from the DMPS data set. (c) Formation rate estimation for J1.5 (neutral – light blue, negative (−) – blue green, positive (+) – green), J2 (negative (−) – orange, positive (+) – yellow), J3 (medium light blue), J5 (medium dark blue), and J10 (dark blue). Note that the formation rate calculation depends on the condensation and coagulation sinks calculated from the DMPS data. (d) High-resolution time series of H2SO4 (red), CH4SO3 (orange), and HIO3 (green). Note that the data gap is due to the ion mode of APi measurement. All data are averaged and estimated with a 10 min time resolution, with standard local time (UTC−3) as the clock reference.
A clear NPF episode occurred from about 11:15 in the morning until sunset with a net increase in cluster and nucleation mode particle concentrations. Close to noontime all trace gases of interest were significantly increasing (Fig. 6d). MSA increased by almost a factor of 10 by 13:00 ([MSA] × 106 molecules cm−3) and by more than 2 orders of magnitude at 16:00 ([MSA] × 106 molecules cm−3) as compared to the minimum baseline of ∼ 2 × 10⁵ molecules cm−3 for both MSA and SA. SA maximum concentration was 6.5 × 10⁶ molecules cm−3, also observed at 13:00.
IA concentrations fluctuated throughout the day with maximum concentrations of ∼ 2.05 × 10⁵ and ∼ 2.35 × 10⁵ molecules cm−3, at around 05:30–06:30 and shortly after 13:00, respectively. The net increase in all these gas-phase species occurred quasi-simultaneously with the increase in the formation rate of the smallest particles and ions (Fig. 6c), occurring around noon. Interestingly, several sudden, short-lasting increases for all SA, MSA, and IA concentrations were seen even before 13:00, matching bumps in nucleation mode particles at around 09:00 and 11:00 and an increase of 1 to 2 orders of magnitude in cluster mode particles at 11:00. The high concentrations of SA and MSA (and possibly IA) likely trigger the observed aerosol processes (i.e., nucleation and/or growth of particles).
We investigated the mass spectrum further and show a complementary mass spectrum in Fig. S2. Any HOM (Bianchi et al., 2019; Ehn et al., 2014) could be reliably resolved from the mass spectra analysis. We estimate that the total oxidized organic contribution, possibly condensable HOMs, could not exceed 5.5 × 10⁶ molecules cm−3, between 16:30 and 17:30, assuming mass spectral peaks found above 200 Th with a positive mass defect could be HOMs (see Supplement). However, the actual HOM contribution is likely to be only a fraction of this estimation. Therefore, it is unlikely that HOMs significantly contributed to nucleation or growth of newly formed particles.
Specifically for this event, we complemented the CI-APi-TOF measurement with the negative APi-TOF ambient measurement mode, from 14:52 to 15:53, as reported in Table S1. By showing the divergence of the exact molecular mass of a detected ion in high resolution from its integer mass (i.e., defined as a mass defect), a mass defect plot illustrates the mass defect of selected ions (on the y axis) over a studied mass range (on the x axis). Compared to a typical mass spectrum, this has the advantage of showing the most significant ion population at once, rather independently of signal intensity, which is then scaled by the marker size, easing the identification of, e.g., clustering mechanisms as further discussed. Each point of the mass defect plot corresponds to a unique atomic composition. An example of such a representation is shown in Fig. 6, for the study case of 16 February.
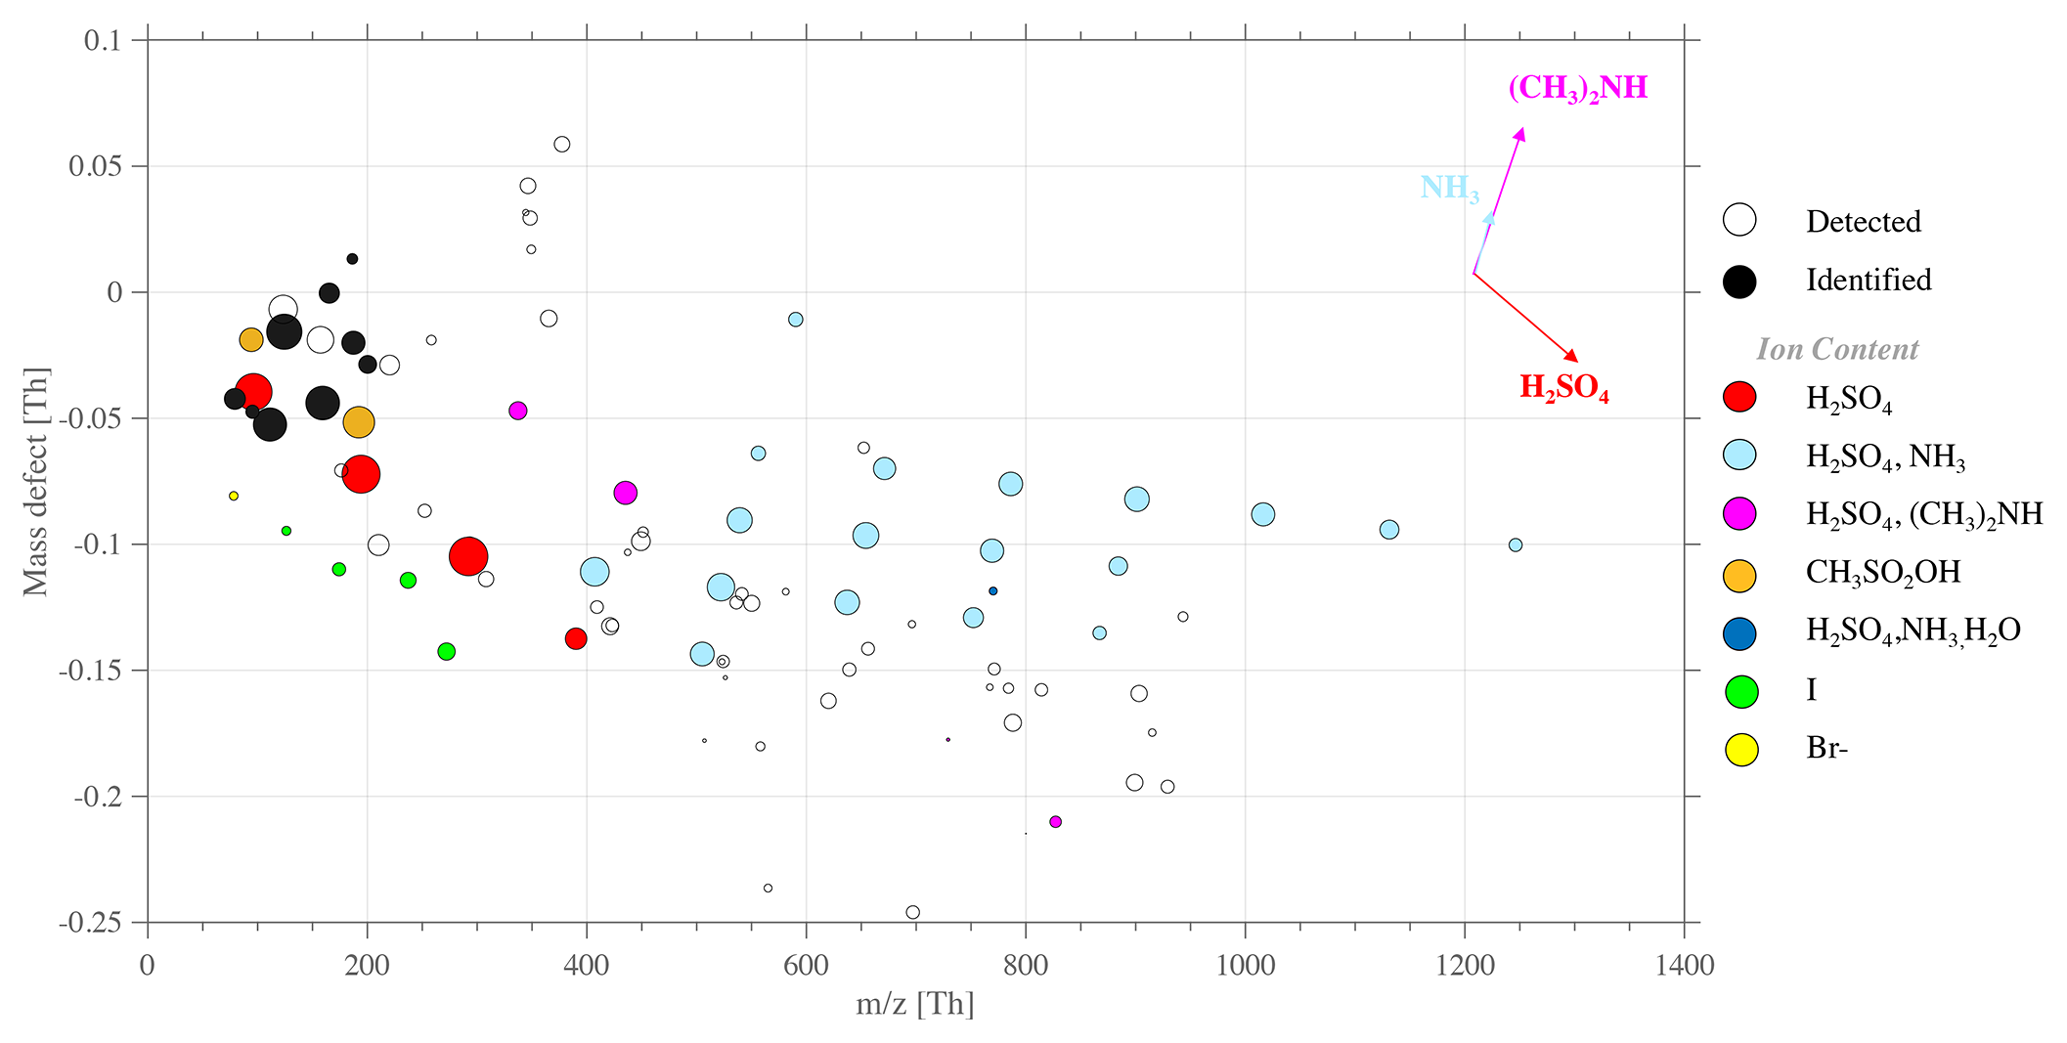
Figure 7Mass defect plot for negative (−) APi-TOF measurements, on 16 February from 14:52 to 15:52. The figure type represents the deviation of high-resolution fitted peaks' exact mass normalized to the unit mass detected for each peak y axis – e.g., Br, Br, and Br – while the x axis represents the mass range (). The data average is 1 h for each spectrum to improve the signal-to-noise ratio and the peak shape statistics.
The APi-TOF ion mode showed total ion count (TIC) maximum values at around 50 ions s−1, detecting only ions that are naturally charged. The highest signals (i.e., intensity shown by marker sizes; see Fig. 7) are bisulfate and its multimers (H2SO4)0−4HSO at 96.9601, 194.9275, 292.8949, and 390.8622, respectively. Along with SA multimers, successive addition of sulfuric acid and ammonia NH3 formed clusters represented with the light blue dots, within the mass range 400–1250 Th. These sulfuric acid (bisulfate)–ammonia clusters were found with up to 10 additions of H2SO4 and 9 of NH3 on top of the HSO core ion. In line with previous field observations (e.g., Schobesberger et al., 2015; Bianchi et al., 2016; Jokinen et al., 2018; Yan et al., 2018; Beck et al., 2021; Sipilä et al., 2021) and laboratory studies (e.g., Kirkby et al., 2011; Schobesberger et al., 2015), we showed that ammonia is detected only in clusters with 3 or more H2SO4 molecules around the HSO core.
The numerous clusters containing both SA and ammonia, as well as the high intensity of the respective cluster signal (depicted by the marker size in Fig. 6), suggest a high concentration of such an ion group in the gas phase, which could also indicate an ion-induced nucleation driven by the ternary system SA–ammonia(–water) – similar to observations made by Jokinen et al. (2018) in East Antarctica as well as measured in multiple other locations around the globe (e.g., Bianchi et al., 2016; Yan et al., 2018; Beck et al., 2021; Sipilä et al., 2021).
Additional clusters containing SA and DMA (principally as (H2SO4)2 ⋅ (CH3)2NH ⋅ HSO ( 337.9527) and as (H2SO4)3 ⋅ (CH3)2NH ⋅ HSO ( 435.9210) but also one larger cluster, (H2SO4)7 ⋅ (CH3)2NH ⋅ HSO ( 827.7893)) were identified. Similarly to the finding of Brean et al. (2021), who detected various SA–amine clusters around the peninsula, SA–DMA–H2O-driven nucleation could also occur, leading to formation rates significantly higher than those observed in the SA–NH3–H2O system (Kürten et al., 2014; Almeida et al., 2013). Furthermore, laboratory studies (e.g., Schobesberger et al., 2013) have shown that (negative) ion composition from APi-TOF analysis can match the cluster composition of the neutral clusters involved in NPF. Therein, the appearance of DMA in the SA dimer and trimer suggests sufficient DMA to trigger nucleation. On the other hand, the large clusters containing NH3 are consistent with high NH3 gas concentrations that can dominate nano-particle growth. This highlights that DMA is 1000 times more effective than NH3 for nucleation, so sub-ppt (parts-per-trillion) DMA and 100–1000 ppt levels (and above) of NH3 could explain the ion cluster distribution observed in Fig. 7.
MSA-containing ions can be identified (see Fig. 7, orange dots) at 94.9808 and 192.9482, respectively. Several studies have shown MSA can be involved in atmospheric nucleation (Hodshire et al., 2019) – especially with clusters containing MSA, SA, and DMA (Bork et al., 2014). However, in our case, MSA-containing clusters were only found as CH3SO or as CH3SO3H ⋅ HSO. MSA was not observed in large clusters that would contain altogether SA, NH3, and/or DMA. Therefore it is unlikely that MSA would contribute to the nucleation observed in this case study (at least not through the negative ion pathway).
Finally, we identified the presence of halogen compounds (see Fig. 7, yellow and green dots), such as Br− ( 78.9189), I− ( 126.9050), IO ( 174.8898), HIO3NO ( 237.8854), and HIO3HSO ( 272.8571). The presence of halogenated species as natural ions could also indicate that these compounds contribute to aerosol processes. However, these ions were only identified as small halogen clusters of low molecular weight and with only low signal intensity. Considering previous observations in the Arctic and coastal environment, Sipilä et al. (2016) only show iodine-related nucleation as successive addition of multiple iodic acid and water groups, and it is unlikely that IA promotes nucleation through either neutral or ion-induced mechanisms at this Antarctic site.
3.3.3 Chemical composition of the aerosol phase
Asmi et al. (2018) reported aerosol chemical composition from weekly filter analysis containing marine-origin sea salt aerosols and the presence of ammonium, sulfate, nitrate, and mesylate (CH3SO). Here, we performed an identical analysis, which agrees with the previously reported results.
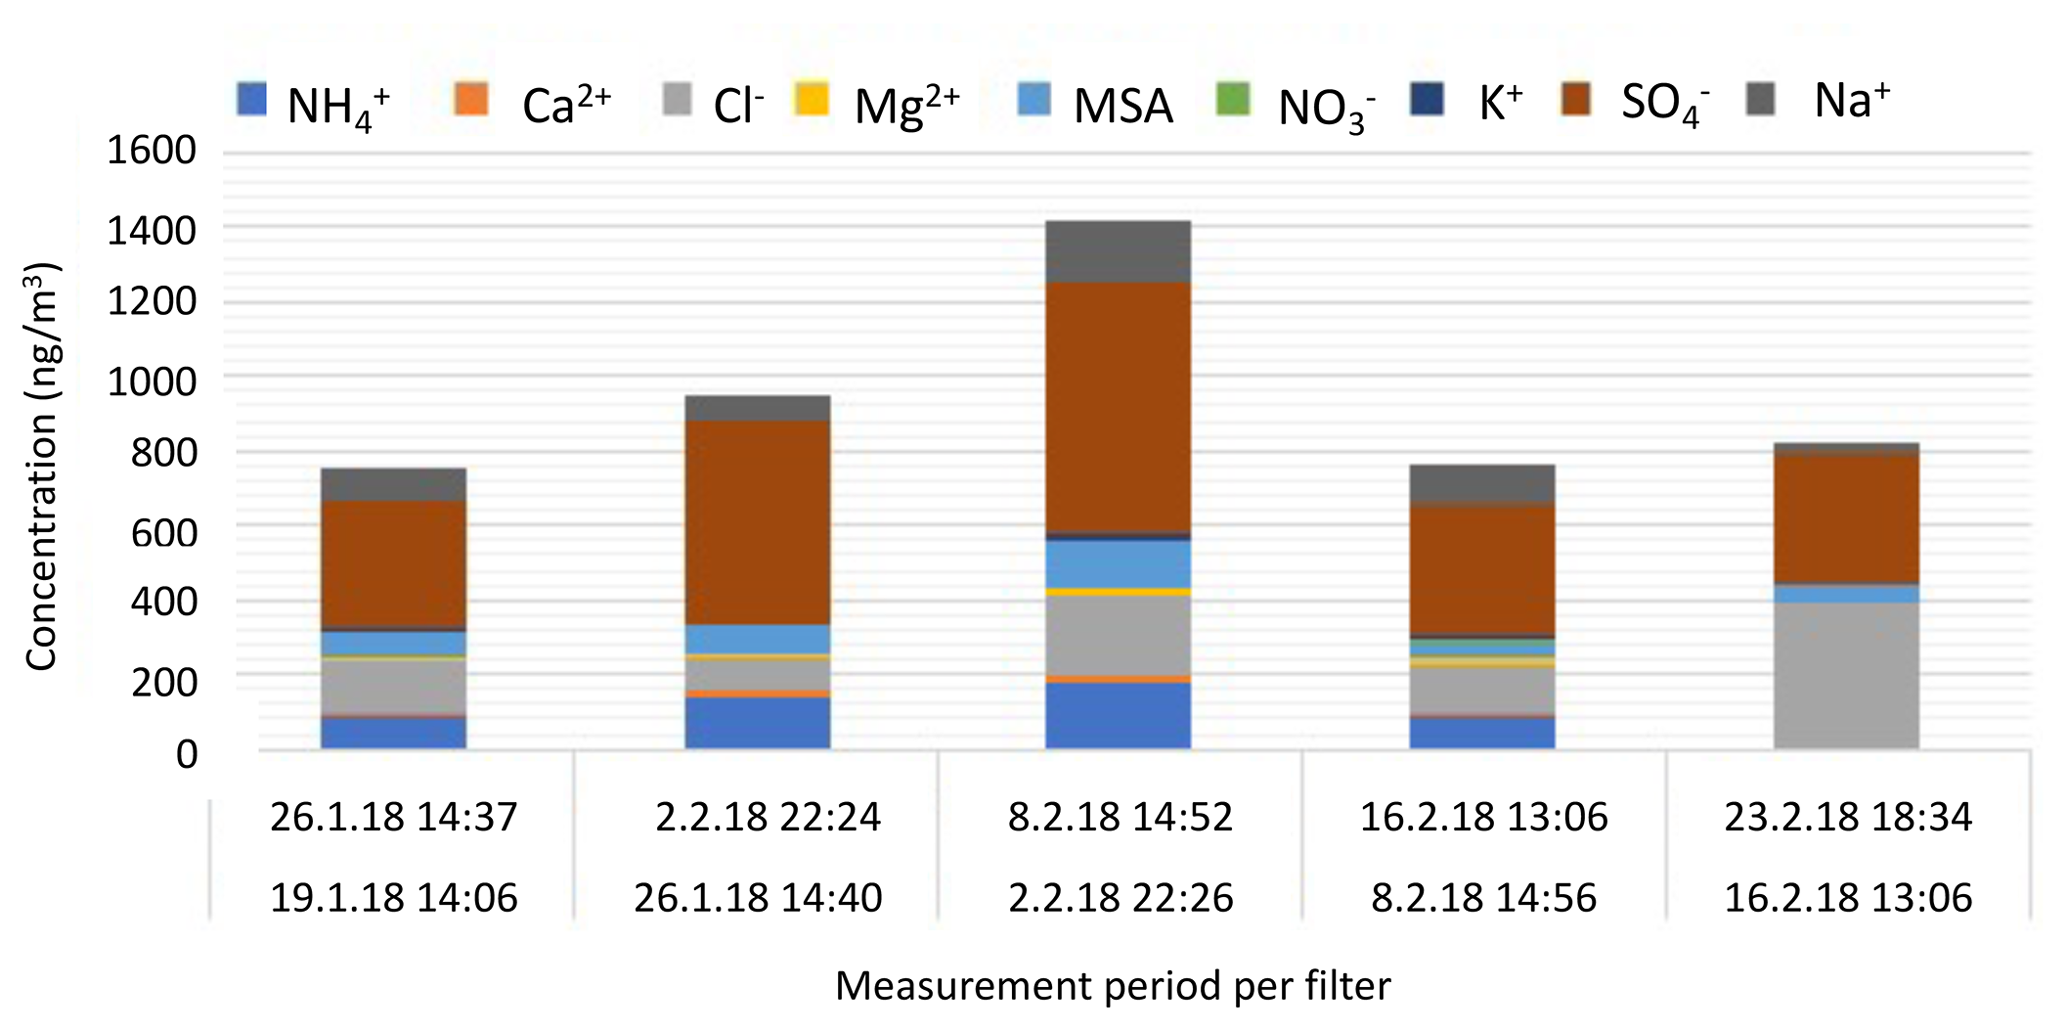
Figure 8Chemical composition of water-soluble ions from weekly fine-aerosol samples (PM2.5).
Until 16 February, the fine-aerosol composition remains rather constant with high amounts of non-sea-salt sulfate (nss sulfate, i.e., sulfate – 0.246 × sodium – in mass concentration; Brewer, 1975), which is partly neutralized by ammonia, and a significant contribution from secondary marine MSA. The presence of Na+, Cl−, and Ca2+ ions also indicates contribution from primary marine sea salt and continental soil minerals. Aerosol composition and mass concentrations are very similar to those found in Asmi et al. (2018) for Marambio summer aerosol. The highest concentrations of ions are measured during the active nucleation period at the beginning of February. By the end of the month, the concentrations of MSA, ammonium, and calcium ions decrease. No indication of anthropogenic contamination is found in the samples.
The bulk aerosol chemical composition (Fig. 8) reflects rather well the observed cycle of the secondary particle formation and provides further evidence of the important role of sulfate and/or SA, methane sulfonate, and ammonia in the production and especially in the growth of Antarctic secondary aerosol. The qualitative agreement of gas-phase and particle-phase compositions indicates that it is likely possible that these compounds originate from similar marine/coastal sources.
3.3.4 Source of gas-phase precursors
Backward trajectories from sampled air masses (Fig. 9) were analyzed and seen to originate mostly from the west sector passing through the Southern Ocean before surrounding the peninsula from its northwest side – coinciding with the observed wind directions. The observed trajectories could explain the low concentration of IA, whose variability was independent of NPF occurrence due to (1) the absence of travel over the Weddell littoral seaside prior to the NPF or (2) the algae bloom on the melting sea ice – possibly responsible for an increase in reactive iodine of organic origin – having already occurred earlier in the season. On the other hand, the air is clearly enriched in MSA and SA when passing over the ocean that has the highest DMS concentration over the December–February months (Lana et al., 2011). In some instances, air mass trajectories are seen to turn over the north of the peninsula, which can indicate a possible enrichment of gas produced by the fauna on the land or at the shore (e.g., a local source of ammonia and amines from a penguin colony established approx. 8 km south of the sampling site during the summertime). With a majority of trajectories originating from the Bellingshausen Sea, NH3 and various types of amine likely originate from the (melting) ocean as discussed in Dall'Osto et al. (2017).
Figure 9c also shows the air mass trajectories' altitudes versus time. While Kerminen et al. (2018) found that Antarctic NPF could easily take place within the free troposphere, both the number size distribution and the indicated altitude flight path point toward nucleation processes occurring at the surface layer considering the lifetime (λ) of key gas-phase precursors (e.g., λSA<0.5 h; Fiedler et al., 2005). Similar back trajectories were calculated for non-event days, separately for days with high SA concentrations (i.e., [SA] >2 × 10⁶ molecules cm−3) and for days with lower SA (Figs. S5a–c and 5a′–c′, respectively). The results of the analysis as well as the model characteristics are shown in the Supplement.

Figure 9Backward trajectories for recorded NPF events (a) (numbering according to classification in Table 1). Panel (b) shows a zoomed-in view over the Antarctic Peninsula, and panel (c) shows the trajectory altitudes colored by formation rate J3 values. In panels (a) and (b) the black and gray lines delimit the sea ice extent as an average for January and February 2018, respectively. Sea ice data are from ftp://sidads.colorado.edu/DATASETS/NOAA/G02135/south/monthly/ (last access: 5 August 2021; Fetterer et al., 2017).
Local wind analysis (Fig. S6) was performed to determine possible local emission sources. In essence, no prevalent wind direction was found specifically for NPF days. However, in some instances, moderate to strong winds were seen to originate from the south/southwest sector where strong emission from the fauna is likely to occur by the shore in this season. On those days, 25 January (event no. 3) had among the highest growth rates (GR3.8–12=10 nm h−1) and 10 February (event no. 9) and 11 February (event no. 10) were found to have the highest formation rates (J1.5=10 cm−3 s−1 and J1.5=9.2 cm−3 s−1, respectively), which agrees with our hypothesis attributing high emissions of, e.g., ammonia or amines, from the bird colony. On the other hand, event no. 12 has a different trajectory and prevalent wind direction away from the south sector. Given the fact that the anion mass defect (Fig. 7) suggests significant presence of ammonia and possibly DMA during this event, specifically, nitrogen-containing base compounds' origin can also be explained by bio-mechanisms from the zoo- and/or phytoplankton in the Antarctic Ocean.
We observed the presence of many chemical constituents with significant measurable concentrations especially during aerosol formation events:
-
IA daily maximum concentrations showed low variability, independently of NPF occurrence. Its concentration – only rarely over 106 molecules cm−3 – was unlikely sufficient to initiate NPF alone as compared with previously reported concentrations of 108 molecules cm−3 and (>) 8 × 10⁶ molecules cm−3 for Arctic and coastal studies (Sipilä et al., 2016; Baccarini et al., 2020; Beck et al., 2021). Iodine emissions have been connected to sea ice conditions and photolabile iodine compounds that are rapidly oxidized (Saiz-Lopez et al., 2015; He et al., 2021). The colder Weddell Sea provides high potential for the emission of iodine and thus iodic acid in the atmosphere. However, the temporality is a key factor governing such emissions. In fact, many studies have shown that IA concentration in polar marine environments usually peaks in early spring – already before the sea ice melt onset (Saiz-Lopez et al., 2007) – and during the refreezing transition period (Baccarini et al., 2020), strongly linking IA emissions with the sea ice state. This alternatively implies that our measurement period was then not optimum to catch iodine-related vapor maxima since the neighboring sea ice – the key surface emission medium – had already melted around Seymour Island. We do not exclude the possibility that IA could contribute to NPF in other seasons, but our data set shows that during the austral summer period, from mid-January until the end of February, IA is likely not substantial.
The high concentrations of SA suggest that SA plays a key role in nucleation similarly to earlier observations from Antarctica (Jokinen et al., 2018) and from the Arctic (Beck et al., 2021). The significantly higher nucleation rates, with similar concentrations of SA, contrast with those studies that concluded that SA–ammonia ion-induced nucleation was the primary pathway to new particle formation. The reported new particle formation rates were systematically below 1 cm−3 s−1, typically ca. 2 orders of magnitude lower than observed in our study despite comparable air temperatures.
Taking the case study of 16 February as an example, we found sulfuric acid–ammonia complexes with high abundance from the analysis of natural ion chemical composition (Fig. 7). That would indicate that at least the negative ion-induced nucleation pathway proceeds with sequential addition of SA and NH3. However, the total nucleation rate was 3.6 cm−3 s−1 on this day, much larger than the negative ion-induced nucleation rate of 0.06 cm−3 s−1. This would lead to the conclusion that a neutral nucleation mechanism could dominate the process in our case.
Outside the case study, nucleation rates are still remarkably high, often exceeding the ion-induced nucleation rate limit set by the ion production rate of ca. 2 ion pairs cm−3 s−1 by galactic cosmic radiation. While the exact nature of the neutral mechanism is not directly detected, the parameterization experiments performed in the CERN CLOUD chamber (Dunne et al., 2016; Kürten, 2019) indicate that very high concentrations of ammonia would be needed to explain the observed nucleation rates – above parts-per-billion (ppb) levels, under the assumption that the ternary SA–NH3–H2O mechanism was solely responsible for initial nucleation.
-
Another possibility is that dimethylamine – as detected in negative ion spectra (see Fig. 7) – efficiently nucleates with sulfuric acid and could be primarily responsible for the neutral new particle SA–H2O–DMA formation pathway, as discussed in several studies (Kürten et al., 2014; Brean et al., 2021). Unfortunately, the deployed instrumentation does not allow the determination of DMA concentrations to assess the exact contribution of DMA to nucleation. Yet, our observation shows significantly higher nucleation rates than the reported values of both studies, and, considering the range of measured SA concentrations, this conjecture is not likely to happen alone but rather as a possible synergetic effect of both amines and ammonia in the nucleation with sulfuric acid and water at the encountered temperatures.
-
In addition to the high quantity of SA and MSA measured in CI mode, MSA was observed in ion clusters in the form of CH3SO and in MSA clusters with bisulfate ion but not in any larger nucleating cluster. Its contribution to a possible ion-induced nucleation mechanism is therefore unlikely in our case. However, we still cannot exclude the possibility that MSA would be weakly bounded to ion clusters and then evaporated inside the mass spectrometer vacuum chambers and lost in semi-energetic collisions within the electric fields used to focus ions inside the system. Additionally, mesylate (i.e., the MSA fragments – CH3SO) was observed in a significant fraction in the chemical speciation of the aerosol phase, which indicates its involvement in particle growth.
-
The missing link is the (high) concentration of ammonia and amines required to follow the proposed SA–(NH3 and/or DMA)–H2O nucleation scheme, likely on the order of ppb levels for ammonia and ppt levels for DMA. Without direct measurement of either NH3 or DMA, we can only speculate that our observations point toward a strong source, possibly land-based (e.g., from a high penguin population during the summertime) or marine-based (e.g., emissions from plankton's biological activity in the (melting) ocean). In fact, predominant wind possibly passing over a penguin colony at the shore is seen from the wind roses proposed in Fig. S6 for events 3, 4, 7, 9, and 10 and confirmed by the air mass trajectory analysis (Fig. 9). Yet, for our case study (event no. 12) – proving significant contribution of ammonia and DMA in the detected ion clusters' spectra – neither the wind analysis nor the backward trajectory analysis points toward emission sourcing from the bird colony. We do not exclude the possibility of additional influence from the local fauna, further away from the island; however this nitrogen-containing species could also be marine-sourced, especially by emission from the metabolic activity of plankton and accumulation of precursors (e.g., proteins) in the melting sea ice (Dall'Osto et al., 2017). Ammonia and amine concentrations are key parameters that need to be assessed to fully understand the nucleation mechanism that our analysis suggests.
-
MSA, together with DMA, NH3, and SA, could potentially nucleate via a neutral, yet unidentified, mechanism. However, this potential mechanism does not manifest itself in the chemical composition of negative ion clusters and potentially would only occur as neutral. It is also important to consider that our measurement relies on clusters that are stable enough to be analyzed in the very low-pressure chamber of the TOF and thus might not be detectable with all species or molecular clusters possibly present in the real atmosphere. Further investigations of nucleation potential of MSA including the aforementioned compounds as a mixture are required before MSA can be attributed to being responsible for our high nucleation rates that we observe at Marambio.
-
In addition to this remains the question of organics; our data set does not show substantial presence of HOMs (as characterized in forest environments), and possible detected compounds entering our estimation – yet unidentified chemically and which could also represent instrumental chemical background – could be low-volatility organic compounds originating from marine environments that may contribute to growth to some extent (Weller et al., 2015; Kecorius et al., 2019).
-
A possible explanation for our observations of higher-than-expected nucleation and growth rates is that particle formation and growth could occur primarily at colder temperatures at higher altitudes, which would enhance both SA–NH3 and SA–DMA nucleation. Nucleated particles would then be transported to lower altitudes, resulting in apparently higher nucleation and growth rates. This in turn suggests more regional emission sources rather than local emissions of SA, NH3, or DMA as our analysis points toward. However, further investigations on vertical mixing would have been needed to confirm a vertical distribution of nucleation and growth rates.
The Austral summer campaign in 2018 at the Marambio Antarctic research station revealed very active aerosol processes and a frequency of new particle formation events of ∼ 40 %. Out of 35 d of active measurement, a total of 13 NPF events were identified and characterized. In Marambio, NPF was promoted by key meteorological factors: high radiation (clear-sky conditions), low-humidity conditions (including the absence of precipitation), and high temperature – close to 0 ∘C or above. We retrieved formation and growth rates for neutral and charged particles measured within a size range of 1.5 to 800 nm – combining nCNC, NAIS, and DMPS instrumentation. As a reference, the formation rate of 3 nm (neutral) particles (J3) during NPF was on average 0.6863 cm−3 s−1 and the growth rate (GR 4–12 nm) was on average 4.2 nm h−1. Those values are particularly high in comparison with the literature; the comparison remains even more surprising considering the most active NPF day when J1.5 reached 19 cm−3 s−1 and GR4–12 nm was 10.9 nm h−1. The chemical analysis of gas-phase aerosol precursors with the CI-APi-TOF showed high concentrations of SA and MSA – on average 5.17× 10⁵ and 1.18 × 10⁶ molecules cm−3, respectively – but quite low concentration of IA (on average 2.06 × 10⁵ molecules cm−3). All chemical species reached their maxima at midday (e.g., with maximum concentration of 2.56 × 10⁷ and 2.32 × 10⁷ molecules cm−3 for SA and MSA, respectively, during aerosol formation events). The ubiquitously high SA concentration (peaking at almost 107 molecules cm−3 during many events) and the high abundance of SA-associated ion clusters leaves no doubt about the involvement of SA in NPF. The speciation of negative ion spectra revealed clusters of dimethylamine–sulfuric acid–bisulfate ions, as well as various clusters of sulfuric acid–ammonia–bisulfate ions – consistent with previously reported studies. However, the systematically high formation and growth rates cannot be quantitatively explained by SA–(DMA and/or NH3)–H2O NPF pathways without direct measurement of DMA and NH3 gas-phase concentrations. Additionally, consistently high concentrations of MSA during the daytime suggest a possible role of MSA in growth, along with SA and ammonia – as confirmed by the bulk aerosol chemical composition. Herein, the mechanism of forming secondary aerosol on the peninsula involves a combination of SA, DMA, NH3, and MSA (and only a relatively low contribution of IA, at least at this time of the year). Better understanding the synergetic effect of NH3 and DMA at these temperatures and environments requires more field measurements and simulated experiments, specifically including direct measurement of DMA and NH3 concentrations.
The key data sets for both aerosol characterization and gas-phase composition are publicly available on the Zenodo data repository platform: https://doi.org/10.5281/zenodo.6560413 (Quéléver et al., 2022).
For further information please contact Lauriane L. J. Quéléver (lauriane.quelever@helsinki.fi).
The supplement related to this article is available online at: https://doi.org/10.5194/acp-22-8417-2022-supplement.
EA and MS supervised the project. EA initiated the measurement container deployment and is responsible for the large-size aerosol and auxiliary measurement data from the measurement container. LLJQ co-organized the project; prepared, set up, and performed the measurements; analyzed the data; and wrote the manuscript. LLJQ operated the instrumentation with the help of EA, JEF, and GEC. EA, MS, and TJ supervised the analysis and contributed to the scientific discussion in collaboration with DRW. LLJQ analyzed the gas-phase measurements and produced most of the figures. LD processed, analyzed, and discussed the aerosol-phase data, prepared by TC, JL, GPF, and EA. LB and MA analyzed the chemical composition of bulk aerosols. EA performed the backward trajectory analysis and created its relevant figures. All co-authors contributed to the scientific discussion on, commenting on, and revision of the manuscript.
The contact author has declared that neither they nor their co-authors have any competing interests.
Publisher’s note: Copernicus Publications remains neutral with regard to jurisdictional claims in published maps and institutional affiliations.
We acknowledge the generous help from the Servicio Meteorológico Nacional – SMN, the Fuerza Aérea Argentina – FAA, and the Finnish Antarctic Research Program – FINNARP. We are thankful to the technical personnel of the Marambio base for their support in cooperation, logistics, and mea- surements. We thank TofTools for providing the mass spectrometry analysis tool package for MATLAB.
This research has been supported by the
European Research Council, H2020 European Research Council
(GASPARCON (grant no. 714621) and COALA (grant
no. 638703)), the EMME-CARE project
(grant no. 856612), the Academy of Finland (grant nos. 296628,
328290, 335845, and 337552), and the Finnish Centre of Excellence Programme
(projects nos. 307331 and 334514).
Open-access funding was provided by the Helsinki University Library.
This paper was edited by Farahnaz Khosrawi and reviewed by Farahnaz Khosrawi and two anonymous referees.
Almeida, J., Schobesberger, S., Kürten, A., Ortega, I. K., Kupiainen-Määttä, O., Praplan, A. P., Adamov, A., Amorim, A., Bianchi, F., Breitenlechner, M., David, A., Dommen, J., Donahue, N. M., Downard, A., Dunne, E., Duplissy, J., Ehrhart, S., Flagan, R. C., Franchin, A., Guida, R., Hakala, J., Hansel, A., Heinritzi, M., Henschel, H., Jokinen, T., Junninen, H., Kajos, M., Kangasluoma, J., Keskinen, H., Kupc, A., Kurtén, T., Kvashin, A. N., Laaksonen, A., Lehtipalo, K., Leiminger, M., Leppä, J., Loukonen, V., Makhmutov, V., Mathot, S., McGrath, M. J., Nieminen, T., Olenius, T., Onnela, A., Petäjä, T., Riccobono, F., Riipinen, I., Rissanen, M., Rondo, L., Ruuskanen, T., Santos, F. D., Sarnela, N., Schallhart, S., Schnitzhofer, R., Seinfeld, J. H., Simon, M., Sipilä, M., Stozhkov, Y., Stratmann, F., Tomé, A., Tröstl, J., Tsagkogeorgas, G., Vaattovaara, P., Viisanen, Y., Virtanen, A., Vrtala, A., Wagner, P. E., Weingartner, E., Wex, H., Williamson, C., Wimmer, D., Ye, P., Yli-Juuti, T., Carslaw, K. S., Kulmala, M., Curtius, J., Baltensperger, U., Worsnop, D. R., Vehkamäki, H., and Kirkby, J.: Molecular understanding of sulphuric acid–amine particle nucleation in the atmosphere, Nature, 502, 359–363, https://doi.org/10.1038/nature12663, 2013.
Asmi, E., Frey, A., Virkkula, A., Ehn, M., Manninen, H. E., Timonen, H., Tolonen-Kivimäki, O., Aurela, M., Hillamo, R., and Kulmala, M.: Hygroscopicity and chemical composition of Antarctic sub-micrometre aerosol particles and observations of new particle formation, Atmos. Chem. Phys., 10, 4253–4271, https://doi.org/10.5194/acp-10-4253-2010, 2010.
Asmi, E., Neitola, K., Teinilä, K., Rodriguez, E., Virkkula, A., Backman, J., Bloss, M., Jokela, J., Lihavainen, H., de Leeuw, G., Paatero, J., Aaltonen, V., Mei, M., Gambarte, G., Copes, G., Albertini, M., Fogwill, G. P., Ferrara, J., Barlasina, M. E., and Sánchez, R.: Primary sources control the variability of aerosol optical properties in the Antarctic Peninsula, Tellus B, 70, 1–16, https://doi.org/10.1080/16000889.2017.1414571, 2018.
Atkinson, H. M., Huang, R.-J., Chance, R., Roscoe, H. K., Hughes, C., Davison, B., Schönhardt, A., Mahajan, A. S., Saiz-Lopez, A., Hoffmann, T., and Liss, P. S.: Iodine emissions from the sea ice of the Weddell Sea, Atmos. Chem. Phys., 12, 11229–11244, https://doi.org/10.5194/acp-12-11229-2012, 2012.
Baccarini, A., Karlsson, L., Dommen, J., Duplessis, P., Vüllers, J., Brooks, I. M., Saiz-Lopez, A., Salter, M., Tjernström, M., Baltensperger, U., Zieger, P., and Schmale, J.: Frequent new particle formation over the high Arctic pack ice by enhanced iodine emissions, Nat. Commun., 11, 4924, https://doi.org/10.1038/s41467-020-18551-0, 2020.
Barnes, I., Hjorth, J., and Mihalopoulos, N.: Dimethyl Sulfide and Dimethyl Sulfoxide and Their Oxidation in the Atmosphere, Chem. Rev., 106, 940–975, https://doi.org/10.1021/cr020529+, 2006.
Beck, L. J., Sarnela, N., Junninen, H., Hoppe, C. J. M., Garmash, O., Bianchi, F., Riva, M., Rose, C., Peräkylä, O., Wimmer, D., Kausiala, O., Jokinen, T., Ahonen, L., Mikkilä, J., Hakala, J., He, X.-C., Kontkanen, J., Wolf, K. K. E., Cappelletti, D., Mazzola, M., Traversi, R., Petroselli, C., Viola, A. P., Vitale, V., Lange, R., Massling, A., Nøjgaard, J. K., Krejci, R., Karlsson, L., Zieger, P., Jang, S., Lee, K., Vakkari, V., Lampilahti, J., Thakur, R. C., Leino, K., Kangasluoma, J., Duplissy, E.-M., Siivola, E., Marbouti, M., Tham, Y. J., Saiz-Lopez, A., Petäjä, T., Ehn, M., Worsnop, D. R., Skov, H., Kulmala, M., Kerminen, V.-M., and Sipilä, M.: Differing Mechanisms of New Particle Formation at Two Arctic Sites, Geophys. Res. Lett., 48, e2020GL091334, https://doi.org/10.1029/2020GL091334, 2021.
Bianchi, F., Tröstl, J., Junninen, H., Frege, C., Henne, S., Hoyle, C. R., Molteni, U., Herrmann, E., Adamov, A., Bukowiecki, N., Chen, X., Duplissy, J., Gysel, M., Hutterli, M., Kangasluoma, J., Kontkanen, J., Kürten, A., Manninen, H. E., Münch, S., Peräkylä, O., Petäjä, T., Rondo, L., Williamson, C., Weingartner, E., Curtius, J., Worsnop, D. R., Kulmala, M., Dommen, J., and Baltensperger, U.: New particle formation in the free troposphere: A question of chemistry and timing, Science, 352, 1109–1112, https://doi.org/10.1126/science.aad5456, 2016.
Bianchi, F., Kurtén, T., Riva, M., Mohr, C., Rissanen, M. P., Roldin, P., Berndt, T., Crounse, J. D., Wennberg, P. O., Mentel, T. F., Wildt, J., Junninen, H., Jokinen, T., Kulmala, M., Worsnop, D. R., Thornton, J. A., Donahue, N., Kjaergaard, H. G., and Ehn, M.: Highly Oxygenated Organic Molecules (HOM) from Gas-Phase Autoxidation Involving Peroxy Radicals: A Key Contributor to Atmospheric Aerosol, Chem. Rev., 119, 3472–3509, https://doi.org/10.1021/acs.chemrev.8b00395, 2019.
Bork, N., Elm, J., Olenius, T., and Vehkamäki, H.: Methane sulfonic acid-enhanced formation of molecular clusters of sulfuric acid and dimethyl amine, Atmos. Chem. Phys., 14, 12023–12030, https://doi.org/10.5194/acp-14-12023-2014, 2014.
Brean, J., Dall'Osto, M., Simó, R., Shi, Z., Beddows, D. C. S., and Harrison, R. M.: Open ocean and coastal new particle formation from sulfuric acid and amines around the Antarctic Peninsula, Nat. Geosci., 14, 383–388, https://doi.org/10.1038/s41561-021-00751-y, 2021.
Brewer, G. P.: Minor elements in seawater, Chemical Oceanography, 1, 415–496, 1975.
Chan, T., Cai, R., Ahonen, L. R., Liu, Y., Zhou, Y., Vanhanen, J., Dada, L., Chao, Y., Liu, Y., Wang, L., Kulmala, M., and Kangasluoma, J.: Assessment of particle size magnifier inversion methods to obtain the particle size distribution from atmospheric measurements, Atmos. Meas. Tech., 13, 4885–4898, https://doi.org/10.5194/amt-13-4885-2020, 2020.
Collins, D. B., Burkart, J., Chang, R. Y.-W., Lizotte, M., Boivin-Rioux, A., Blais, M., Mungall, E. L., Boyer, M., Irish, V. E., Massé, G., Kunkel, D., Tremblay, J.-É., Papakyriakou, T., Bertram, A. K., Bozem, H., Gosselin, M., Levasseur, M., and Abbatt, J. P. D.: Frequent ultrafine particle formation and growth in Canadian Arctic marine and coastal environments, Atmos. Chem. Phys., 17, 13119–13138, https://doi.org/10.5194/acp-17-13119-2017, 2017.
Dada, L., Paasonen, P., Nieminen, T., Buenrostro Mazon, S., Kontkanen, J., Peräkylä, O., Lehtipalo, K., Hussein, T., Petäjä, T., Kerminen, V.-M., Bäck, J., and Kulmala, M.: Long-term analysis of clear-sky new particle formation events and nonevents in Hyytiälä, Atmos. Chem. Phys., 17, 6227–6241, https://doi.org/10.5194/acp-17-6227-2017, 2017.
Dada, L., Chellapermal, R., Buenrostro Mazon, S., Paasonen, P., Lampilahti, J., Manninen, H. E., Junninen, H., Petäjä, T., Kerminen, V.-M., and Kulmala, M.: Refined classification and characterization of atmospheric new-particle formation events using air ions, Atmos. Chem. Phys., 18, 17883–17893, https://doi.org/10.5194/acp-18-17883-2018, 2018.
Dada, L., Lehtipalo, K., Kontkanen, J., Nieminen, T., Baalbaki, R., Ahonen, L., Duplissy, J., Yan, C., Chu, B., Petäjä, T., Lehtinen, K., Kerminen, V.-M., Kulmala, M., and Kangasluoma, J.: Formation and growth of sub-3-nm aerosol particles in experimental chambers, Nat. Protoc., 15, 1013–1040, https://doi.org/10.1038/s41596-019-0274-z, 2020.
Dall'Osto, M., Beddows, D. C. S., Tunved, P., Krejci, R., Ström, J., Hansson, H. C., Yoon, Y. J., Park, K.-T., Becagli, S., Udisti, R., Onasch, T., O'Dowd, C. D., Simó, R., and Harrison, R. M.: Arctic sea ice melt leads to atmospheric new particle formation, Scientific Reports, 7, 3318, https://doi.org/10.1038/s41598-017-03328-1, 2017.
Dall'Osto, M., Geels, C., Beddows, D. C. S., Boertmann, D., Lange, R., Nøjgaard, J. K., Harrison, R. M., Simo, R., Skov, H., and Massling, A.: Regions of open water and melting sea ice drive new particle formation in North East Greenland, Scientific Reports, 8, 6109, https://doi.org/10.1038/s41598-018-24426-8, 2018.
Dall'Osto, M., Beddows, D. C. S., Tunved, P., Harrison, R. M., Lupi, A., Vitale, V., Becagli, S., Traversi, R., Park, K.-T., Yoon, Y. J., Massling, A., Skov, H., Lange, R., Strom, J., and Krejci, R.: Simultaneous measurements of aerosol size distributions at three sites in the European high Arctic, Atmos. Chem. Phys., 19, 7377–7395, https://doi.org/10.5194/acp-19-7377-2019, 2019.
Dal Maso, M., Kulmala, M., Riipinen, I., Wagner, R., Hussein, T., Aalto, P. P., and Lehtinen, K. E.: Formation and growth of fresh atmospheric aerosols: eight years of aerosol size distribution data from SMEAR II, Hyytiala, Finland, Boreal Environ. Res., 10, 323–336, 2005.
Deng, C., Fu, Y., Dada, L., Yan, C., Cai, R., Yang, D., Zhou, Y., Yin, R., Lu, Y., Li, X., Qiao, X., Fan, X., Nie, W., Kontkanen, J., Kangasluoma, J., Chu, B., Ding, A., Kerminen, V.-M., Paasonen, P., Worsnop, D. R., Bianchi, F., Liu, Y., Zheng, J., Wang, L., Kulmala, M., and Jiang, J.: Seasonal Characteristics of New Particle Formation and Growth in Urban Beijing, Environ. Sci. Technol., 54, 8547–8557, https://doi.org/10.1021/acs.est.0c00808, 2020.
Dunne, E. M., Gordon, H., Kürten, A., Almeida, J., Duplissy, J., Williamson, C., Ortega, I. K., Pringle, K. J., Adamov, A., Baltensperger, U., Barmet, P., Benduhn, F., Bianchi, F., Breitenlechner, M., Clarke, A., Curtius, J., Dommen, J., Donahue, N. M., Ehrhart, S., Flagan, R. C., Franchin, A., Guida, R., Hakala, J., Hansel, A., Heinritzi, M., Jokinen, T., Kangasluoma, J., Kirkby, J., Kulmala, M., Kupc, A., Lawler, M. J., Lehtipalo, K., Makhmutov, V., Mann, G., Mathot, S., Merikanto, J., Miettinen, P., Nenes, A., Onnela, A., Rap, A., Reddington, C. L., Riccobono, F., Richards, N. A., Rissanen, M. P., Rondo, L., Sarnela, N., Schobesberger, S., Sengupta, K., Simon, M., Sipilä, M., Smith, J. N., Stozkhov, Y., Tomé, A., Tröstl, J., Wagner, P. E., Wimmer, D., Winkler, P. M., Worsnop, D. R., and Carslaw, K. S.: Global atmospheric particle formation from CERN CLOUD measurements, Science, 354, 1119–1124, https://doi.org/10.1126/science.aaf2649, 2016.
Ehn, M., Thornton, J. A., Kleist, E., Sipilä, M., Junninen, H., Pullinen, I., Springer, M., Rubach, F., Tillmann, R., Lee, B., Lopez-Hilfiker, F., Andres, S., Acir, I.-H., Rissanen, M., Jokinen, T., Schobesberger, S., Kangasluoma, J., Kontkanen, J., Nieminen, T., Kurtén, T., Nielsen, L. B., Jørgensen, S., Kjaergaard, H. G., Canagaratna, M., Maso, M. D., Berndt, T., Petäjä, T., Wahner, A., Kerminen, V.-M., Kulmala, M., Worsnop, D. R., Wildt, J., and Mentel, T. F.: A large source of low-volatility secondary organic aerosol, Nature, 506, 476–479, https://doi.org/10.1038/nature13032, 2014.
Fetterer, F., Knowles, K., Meier, W. N., Savoie, M., and Windnagel, A. K.: Sea Ice Index, Version 3, NSIDC: National Snow and Ice Data Center, Boulder, Colorado USA [data set], ftp://sidads.colorado.edu/DATASETS/NOAA/G02135/south/monthly/ (last access: 5 August 2021), https://doi.org/10.7265/N5K072F8, 2017.
Fiebig, M., Hirdman, D., Lunder, C. R., Ogren, J. A., Solberg, S., Stohl, A., and Thompson, R. L.: Annual cycle of Antarctic baseline aerosol: controlled by photooxidation-limited aerosol formation, Atmos. Chem. Phys., 14, 3083–3093, https://doi.org/10.5194/acp-14-3083-2014, 2014.
Fiedler, V., Dal Maso, M., Boy, M., Aufmhoff, H., Hoffmann, J., Schuck, T., Birmili, W., Hanke, M., Uecker, J., Arnold, F., and Kulmala, M.: The contribution of sulphuric acid to atmospheric particle formation and growth: a comparison between boundary layers in Northern and Central Europe, Atmos. Chem. Phys., 5, 1773–1785, https://doi.org/10.5194/acp-5-1773-2005, 2005.
He, X.-C., Tham, Y. J., Dada, L., Wang, M., Finkenzeller, H., Stolzenburg, D., Iyer, S., Simon, M., Kürten, A., Shen, J., Rörup, B., Rissanen, M., Schobesberger, S., Baalbaki, R., Wang, D. S., Koenig, T. K., Jokinen, T., Sarnela, N., Beck, L. J., Almeida, J., Amanatidis, S., Amorim, A., Ataei, F., Baccarini, A., Bertozzi, B., Bianchi, F., Brilke, S., Caudillo, L., Chen, D., Chiu, R., Chu, B., Dias, A., Ding, A., Dommen, J., Duplissy, J., El Haddad, I., Gonzalez Carracedo, L., Granzin, M., Hansel, A., Heinritzi, M., Hofbauer, V., Junninen, H., Kangasluoma, J., Kemppainen, D., Kim, C., Kong, W., Krechmer, J. E., Kvashin, A., Laitinen, T., Lamkaddam, H., Lee, C. P., Lehtipalo, K., Leiminger, M., Li, Z., Makhmutov, V., Manninen, H. E., Marie, G., Marten, R., Mathot, S., Mauldin, R. L., Mentler, B., Möhler, O., Müller, T., Nie, W., Onnela, A., Petäjä, T., Pfeifer, J., Philippov, M., Ranjithkumar, A., Saiz-Lopez, A., Salma, I., Scholz, W., Schuchmann, S., Schulze, B., Steiner, G., Stozhkov, Y., Tauber, C., Tomé, A., Thakur, R. C., Väisänen, O., Vazquez-Pufleau, M., Wagner, A. C., Wang, Y., Weber, S. K., Winkler, P. M., Wu, Y., Xiao, M., Yan, C., Ye, Q., Ylisirniö, A., Zauner-Wieczorek, M., Zha, Q., Zhou, P., Flagan, R. C., Curtius, J., Baltensperger, U., Kulmala, M., Kerminen, V.-M., Kurtén, T., Donahue, N. M., Volkamer, R., Kirkby, J., Worsnop, D. R., and Sipilä, M.: Role of iodine oxoacids in atmospheric aerosol nucleation, Science, 371, 589–595, https://doi.org/10.1126/science.abe0298, 2021.
Herenz, P., Wex, H., Mangold, A., Laffineur, Q., Gorodetskaya, I. V., Fleming, Z. L., Panagi, M., and Stratmann, F.: CCN measurements at the Princess Elisabeth Antarctica research station during three austral summers, Atmos. Chem. Phys., 19, 275–294, https://doi.org/10.5194/acp-19-275-2019, 2019.
Hodshire, A. L., Campuzano-Jost, P., Kodros, J. K., Croft, B., Nault, B. A., Schroder, J. C., Jimenez, J. L., and Pierce, J. R.: The potential role of methanesulfonic acid (MSA) in aerosol formation and growth and the associated radiative forcings, Atmos. Chem. Phys., 19, 3137–3160, https://doi.org/10.5194/acp-19-3137-2019, 2019.
IPCC: Climate Change 2013: The Physical Science Basis. Contribution of Working Group I to the Fifth Assessment Report of the Intergovernmental Panel on Climate Change, edited by: Stocker, T. F., Qin, D., Plattner, G.-K., Tignor, M., Allen, S. K., Boschung, J., Nauels, A., Xia, Y., Bex, V., and Midgley, P. M., Cambridge University Press, Cambridge, United Kingdom and New York, NY, USA, 1535 pp., https://doi.org/10.1017/CBO9781107415324, 2013.
Järvinen, E., Virkkula, A., Nieminen, T., Aalto, P. P., Asmi, E., Lanconelli, C., Busetto, M., Lupi, A., Schioppo, R., Vitale, V., Mazzola, M., Petäjä, T., Kerminen, V.-M., and Kulmala, M.: Seasonal cycle and modal structure of particle number size distribution at Dome C, Antarctica, Atmos. Chem. Phys., 13, 7473–7487, https://doi.org/10.5194/acp-13-7473-2013, 2013.
Jokinen, T., Sipilä, M., Junninen, H., Ehn, M., Lönn, G., Hakala, J., Petäjä, T., Mauldin III, R. L., Kulmala, M., and Worsnop, D. R.: Atmospheric sulphuric acid and neutral cluster measurements using CI-APi-TOF, Atmos. Chem. Phys., 12, 4117–4125, https://doi.org/10.5194/acp-12-4117-2012, 2012.
Jokinen, T., Sipilä, M., Kontkanen, J., Vakkari, V., Tisler, P., Duplissy, E. M., Junninen, H., Kangasluoma, J., Manninen, H. E., Petäjä, T., Kulmala, M., Worsnop, D. R., Kirkby, J., Virkkula, A., and Kerminen, V. M.: Ion-induced sulfuric acid–ammonia nucleation drives particle formation in coastal Antarctica, Science Advances, 4, eaat9744, https://doi.org/10.1126/sciadv.aat9744, 2018.
Kangasluoma, J., Franchin, A., Duplissy, J., Ahonen, L., Korhonen, F., Attoui, M., Mikkilä, J., Lehtipalo, K., Vanhanen, J., Kulmala, M., and Petäjä, T.: Operation of the Airmodus A11 nano Condensation Nucleus Counter at various inlet pressures and various operation temperatures, and design of a new inlet system, Atmos. Meas. Tech., 9, 2977–2988, https://doi.org/10.5194/amt-9-2977-2016, 2016.
Kecorius, S., Vogl, T., Paasonen, P., Lampilahti, J., Rothenberg, D., Wex, H., Zeppenfeld, S., van Pinxteren, M., Hartmann, M., Henning, S., Gong, X., Welti, A., Kulmala, M., Stratmann, F., Herrmann, H., and Wiedensohler, A.: New particle formation and its effect on cloud condensation nuclei abundance in the summer Arctic: a case study in the Fram Strait and Barents Sea, Atmos. Chem. Phys., 19, 14339–14364, https://doi.org/10.5194/acp-19-14339-2019, 2019.
Kerminen, V.-M., Chen, X., Vakkari, V., Petäjä, T., Kulmala, M., and Bianchi, F.: Atmospheric new particle formation and growth: review of field observations, Environ. Res. Lett., 13, 103003, https://doi.org/10.1088/1748-9326/aadf3c, 2018.
Kirkby, J., Curtius, J., Almeida, J., Dunne, E., Duplissy, J., Ehrhart, S., Franchin, A., Gagné, S., Ickes, L., Kürten, A., Kupc, A., Metzger, A., Riccobono, F., Rondo, L., Schobesberger, S., Tsagkogeorgas, G., Wimmer, D., Amorim, A., Bianchi, F., Breitenlechner, M., David, A., Dommen, J., Downard, A., Ehn, M., Flagan, R. C., Haider, S., Hansel, A., Hauser, D., Jud, W., Junninen, H., Kreissl, F., Kvashin, A., Laaksonen, A., Lehtipalo, K., Lima, J., Lovejoy, E. R., Makhmutov, V., Mathot, S., Mikkilä, J., Minginette, P., Mogo, S., Nieminen, T., Onnela, A., Pereira, P., Petäjä, T., Schnitzhofer, R., Seinfeld, J. H., Sipilä, M., Stozhkov, Y., Stratmann, F., Tomé, A., Vanhanen, J., Viisanen, Y., Vrtala, A., Wagner, P. E., Walther, H., Weingartner, E., Wex, H., Winkler, P. M., Carslaw, K. S., Worsnop, D. R., Baltensperger, U., and Kulmala, M.: Role of sulphuric acid, ammonia and galactic cosmic rays in atmospheric aerosol nucleation, Nature, 476, 429–433, https://doi.org/10.1038/nature10343, 2011.
Kirkby, J., Duplissy, J., Sengupta, K., Frege, C., Gordon, H., Williamson, C., Heinritzi, M., Simon, M., Yan, C., Almeida, J., Tröstl, J., Nieminen, T., Ortega, I. K., Wagner, R., Adamov, A., Amorim, A., Bernhammer, A.-K., Bianchi, F., Breitenlechner, M., Brilke, S., Chen, X., Craven, J., Dias, A., Ehrhart, S., Flagan, R. C., Franchin, A., Fuchs, C., Guida, R., Hakala, J., Hoyle, C. R., Jokinen, T., Junninen, H., Kangasluoma, J., Kim, J., Krapf, M., Kürten, A., Laaksonen, A., Lehtipalo, K., Makhmutov, V., Mathot, S., Molteni, U., Onnela, A., Peräkylä, O., Piel, F., Petäjä, T., Praplan, A. P., Pringle, K., Rap, A., Richards, N. A. D., Riipinen, I., Rissanen, M. P., Rondo, L., Sarnela, N., Schobesberger, S., Scott, C. E., Seinfeld, J. H., Sipilä, M., Steiner, G., Stozhkov, Y., Stratmann, F., Tomé, A., Virtanen, A., Vogel, A. L., Wagner, A. C., Wagner, P. E., Weingartner, E., Wimmer, D., Winkler, P. M., Ye, P., Zhang, X., Hansel, A., Dommen, J., Donahue, N. M., Worsnop, D. R., Baltensperger, U., Kulmala, M., Carslaw, K. S., and Curtius, J.: Ion-induced nucleation of pure biogenic particles, Nature, 533, 521–526, https://doi.org/10.1038/nature17953, 2016.
Kontkanen, J., Järvinen, E., Manninen, H. E., Lehtipalo, K., Kangasluoma, J., Decesari, S., Gobbi, G. P., Laaksonen, A., Petäjä, T., and Kulmala, M.: High concentrations of sub-3 nm clusters and frequent new particle formation observed in the Po Valley, Italy, during the PEGASOS 2012 campaign, Atmos. Chem. Phys., 16, 1919–1935, https://doi.org/10.5194/acp-16-1919-2016, 2016.
Kulmala, M., Petäjä, T., Nieminen, T., Sipilä, M., Manninen, H. E., Lehtipalo, K., Dal Maso, M., Aalto, P. P., Junninen, H., Paasonen, P., Riipinen, I., Lehtinen, K. E. J., Laaksonen, A., and Kerminen, V.-M.: Measurement of the nucleation of atmospheric aerosol particles, Nat. Protoc., 7, 1651–1667, https://doi.org/10.1038/nprot.2012.091, 2012.
Kulmala, M., Kontkanen, J., Junninen, H., Lehtipalo, K., Manninen, H. E., Nieminen, T., Petäjä, T., Sipilä, M., Schobesberger, S., and Rantala, P.: Direct observations of atmospheric aerosol nucleation, Science, 339, 943–946, https://doi.org/10.1126/science.1227385, 2013.
Kulmala, M., Stolzenburg, D., Dada, L., Cai, R., Kontkanen, J., Yan, C., Kangasluoma, J., Ahonen, L. R., Gonzalez-Carracedo, L., Sulo, J., Tuovinen, S., Deng, C., Li, Y., Lehtipalo, K., Lehtinen, K. E. J., Petäjä, T., Winkler, P. M., Jiang, J., and Kerminen, V.-M.: Towards a concentration closure of sub-6 nm aerosol particles and sub-3 nm atmospheric clusters, J. Aerosol Sci., 159, 105878, https://doi.org/10.1016/j.jaerosci.2021.105878, 2022.
Kürten, A., Jokinen, T., Simon, M., Sipilä, M., Sarnela, N., Junninen, H., Adamov, A., Almeida, J., Amorim, A., Bianchi, F., Breitenlechner, M., Dommen, J., Donahue, N. M., Duplissy, J., Ehrhart, S., Flagan, R. C., Franchin, A., Hakala, J., Hansel, A., Heinritzi, M., Hutterli, M., Kangasluoma, J., Kirkby, J., Laaksonen, A., Lehtipalo, K., Leiminger, M., Makhmutov, V., Mathot, S., Onnela, A., Petäjä, T., Praplan, A. P., Riccobono, F., Rissanen, M. P., Rondo, L., Schobesberger, S., Seinfeld, J. H., Steiner, G., Tomé, A., Tröstl, J., Winkler, P. M., Williamson, C., Wimmer, D., Ye, P., Baltensperger, U., Carslaw, K. S., Kulmala, M., Worsnop, D. R., and Curtius, J.: Neutral molecular cluster formation of sulfuric acid–dimethylamine observed in real time under atmospheric conditions, P. Natl. Acad. Sci. USA, 111, 15019–15024, https://doi.org/10.1073/pnas.1404853111, 2014.
Kürten, A.: New particle formation from sulfuric acid and ammonia: nucleation and growth model based on thermodynamics derived from CLOUD measurements for a wide range of conditions, Atmos. Chem. Phys., 19, 5033–5050, https://doi.org/10.5194/acp-19-5033-2019, 2019.
Kyrö, E.-M., Kerminen, V.-M., Virkkula, A., Dal Maso, M., Parshintsev, J., Ruíz-Jimenez, J., Forsström, L., Manninen, H. E., Riekkola, M.-L., Heinonen, P., and Kulmala, M.: Antarctic new particle formation from continental biogenic precursors, Atmos. Chem. Phys., 13, 3527–3546, https://doi.org/10.5194/acp-13-3527-2013, 2013.
Lachlan-Cope, T., Beddows, D. C. S., Brough, N., Jones, A. E., Harrison, R. M., Lupi, A., Yoon, Y. J., Virkkula, A., and Dall'Osto, M.: On the annual variability of Antarctic aerosol size distributions at Halley Research Station, Atmos. Chem. Phys., 20, 4461–4476, https://doi.org/10.5194/acp-20-4461-2020, 2020.
Lana, A., Bell, T. G., Simó, R., Vallina, S. M., Ballabrera-Poy, J., Kettle, A. J., Dachs, J., Bopp, L., Saltzman, E. S., Stefels, J., Johnson, J. E., and Liss, P. S.: An updated climatology of surface dimethlysulfide concentrations and emission fluxes in the global ocean, Global Biogeochem. Cy., 25, GB1004, https://doi.org/10.1029/2010GB003850, 2011.
Lehtipalo, K., Leppa, J., Kontkanen, J., Kangasluoma, J., Franchin, A., Wimnner, D., Schobesberger, S., Junninen, H., Petaja, T., and Sipila, M.: Methods for determining particle size distribution and growth rates between 1 and 3 nm using the Particle Size Magnifier, Boreal Environ. Res., 19, 215–236, 2014.
Lehtipalo, K., Ahonen, L. R., Baalbaki, R., Sulo, J., Chan, T., Laurila, T., Dada, L., Duplissy, J., Miettinen, E., Vanhanen, J., Kangasluoma, J., Kulmala, M., Petäjä, T., and Jokinen, T.: The standard operating procedure for Airmodus Particle Size Magnifier and nano-Condensation Nucleus Counter, J. Aerosol Sci., 159, 105896, https://doi.org/10.1016/j.jaerosci.2021.105896, 2022.
Loo, B. W. and Cork, C. P.: Development of High Efficiency Virtual Impactors, Aerosol Sci. Tech., 9, 167–176, https://doi.org/10.1080/02786828808959205, 1988.
Manninen, H. E., Mirme, S., Mirme, A., Petäjä, T., and Kulmala, M.: How to reliably detect molecular clusters and nucleation mode particles with Neutral cluster and Air Ion Spectrometer (NAIS), Atmos. Meas. Tech., 9, 3577–3605, https://doi.org/10.5194/amt-9-3577-2016, 2016.
Mardyukov, A. and Schreiner, P. R.: Atmospherically Relevant Radicals Derived from the Oxidation of Dimethyl Sulfide, Accounts Chem. Res., 51, 475–483, https://doi.org/10.1021/acs.accounts.7b00536, 2018.
Merikanto, J., Spracklen, D. V., Mann, G. W., Pickering, S. J., and Carslaw, K. S.: Impact of nucleation on global CCN, Atmos. Chem. Phys., 9, 8601–8616, https://doi.org/10.5194/acp-9-8601-2009, 2009.
Mirme, S. and Mirme, A.: The mathematical principles and design of the NAIS – a spectrometer for the measurement of cluster ion and nanometer aerosol size distributions, Atmos. Meas. Tech., 6, 1061–1071, https://doi.org/10.5194/amt-6-1061-2013, 2013.
Notz, D.: The future of ice sheets and sea ice: Between reversible retreat and unstoppable loss, P. Natl. Acad. Sci. USA, 106, 20590–20595, https://doi.org/10.1073/pnas.0902356106, 2009.
Quéléver, L. L. J., Dada, L., Asmi, E., Lampilahti, J., Chan, T., Ferrara, J., Copes, G., Pérez-Fogwill, G., Barreira, L., Aurela, M., Worsnop, D., Jokinen, T., and Sipilä, M.: Investigation of New Particle Formation mechanisms and aerosol processes at the Marambio Station, Antarctic Peninsula, Zenodo [data set], https://doi.org/10.5281/zenodo.6560413, 2022.
Saiz-Lopez, A. and von Glasow, R.: Reactive halogen chemistry in the troposphere, Chem. Soc. Rev., 41, 6448–6472, https://doi.org/10.1039/C2CS35208G, 2012.
Saiz-Lopez, A., Mahajan, A. S., Salmon, R. A., Bauguitte, S. J. B., Jones, A. E., Roscoe, H. K., and Plane, J. M. C.: Boundary Layer Halogens in Coastal Antarctica, Science, 317, 348–351, https://doi.org/10.1126/science.1141408, 2007.
Saiz-Lopez, A., Blaszczak-Boxe, C. S., and Carpenter, L. J.: A mechanism for biologically induced iodine emissions from sea ice, Atmos. Chem. Phys., 15, 9731–9746, https://doi.org/10.5194/acp-15-9731-2015, 2015.
Schmale, J., Baccarini, A., Thurnherr, I., Henning, S., Efraim, A., Regayre, L., Bolas, C., Hartmann, M., Welti, A., Lehtipalo, K., Aemisegger, F., Tatzelt, C., Landwehr, S., Modini, R. L., Tummon, F., Johnson, J. S., Harris, N., Schnaiter, M., Toffoli, A., Derkani, M., Bukowiecki, N., Stratmann, F., Dommen, J., Baltensperger, U., Wernli, H., Rosenfeld, D., Gysel-Beer, M., and Carslaw, K. S.: Overview of the Antarctic Circumnavigation Expedition: Study of Preindustrial-like Aerosols and Their Climate Effects (ACE-SPACE), B. Am. Meteorol. Soc., 100, 2260–2283, https://doi.org/10.1175/BAMS-D-18-0187.1, 2019.
Schobesberger, S., Junninen, H., Bianchi, F., Lönn, G., Ehn, M., Lehtipalo, K., Dommen, J., Ehrhart, S., Ortega, I., Franchin, A., Nieminen, T., Riccobono, F., Hutterli, M., Duplissy, J., Almeida, J., Amorim, A., Breitenlechner, M., Downard, A., Dunne, E., and Worsnop, D.: Molecular understanding of atmospheric particle formation from sulfuric acid and large oxidized organic molecules, P. Natl. Acad. Sci. USA, 43, 17223–17228, https://doi.org/10.1073/pnas.1306973110, 2013.
Schobesberger, S., Franchin, A., Bianchi, F., Rondo, L., Duplissy, J., Kürten, A., Ortega, I. K., Metzger, A., Schnitzhofer, R., Almeida, J., Amorim, A., Dommen, J., Dunne, E. M., Ehn, M., Gagné, S., Ickes, L., Junninen, H., Hansel, A., Kerminen, V.-M., Kirkby, J., Kupc, A., Laaksonen, A., Lehtipalo, K., Mathot, S., Onnela, A., Petäjä, T., Riccobono, F., Santos, F. D., Sipilä, M., Tomé, A., Tsagkogeorgas, G., Viisanen, Y., Wagner, P. E., Wimmer, D., Curtius, J., Donahue, N. M., Baltensperger, U., Kulmala, M., and Worsnop, D. R.: On the composition of ammonia–sulfuric-acid ion clusters during aerosol particle formation, Atmos. Chem. Phys., 15, 55–78, https://doi.org/10.5194/acp-15-55-2015, 2015.
Shaw, G. E.: Considerations on the origin and properties of the Antarctic aerosol, Rev. Geophys., 17, 1983–1998, https://doi.org/10.1029/RG017i008p01983, 1979.
Shaw, G. E.: Antarctic aerosols: A review, Rev. Geophys., 26, 89–112, https://doi.org/10.1029/RG026i001p00089, 1988.
Sipilä, M., Berndt, T., Petäjä, T., Brus, D., Vanhanen, J., Stratmann, F., Patokoski, J., Mauldin, R. L., Hyvärinen, A.-P., Lihavainen, H., and Kulmala, M.: The Role of Sulfuric Acid in Atmospheric Nucleation, Science, 327, 1243–1246, https://doi.org/10.1126/science.1180315, 2010.
Sipilä, M., Sarnela, N., Jokinen, T., Henschel, H., Junninen, H., Kontkanen, J., Richters, S., Kangasluoma, J., Franchin, A., Peräkylä, O., Rissanen, M. P., Ehn, M., Vehkamäki, H., Kurten, T., Berndt, T., Petäjä, T., Worsnop, D., Ceburnis, D., Kerminen, V.-M., Kulmala, M., and O'Dowd, C.: Molecular-scale evidence of aerosol particle formation via sequential addition of HIO3, Nature, 537, 532–534, https://doi.org/10.1038/nature19314, 2016.
Sipilä, M., Sarnela, N., Neitola, K., Laitinen, T., Kemppainen, D., Beck, L., Duplissy, E.-M., Kuittinen, S., Lehmusjärvi, T., Lampilahti, J., Kerminen, V.-M., Lehtipalo, K., Aalto, P. P., Keronen, P., Siivola, E., Rantala, P. A., Worsnop, D. R., Kulmala, M., Jokinen, T., and Petäjä, T.: Wintertime subarctic new particle formation from Kola Peninsula sulfur emissions, Atmos. Chem. Phys., 21, 17559–17576, https://doi.org/10.5194/acp-21-17559-2021, 2021.
Stuecker, M. F., Bitz, C. M., Armour, K. C., Proistosescu, C., Kang, S. M., Xie, S.-P., Kim, D., McGregor, S., Zhang, W., Zhao, S., Cai, W., Dong, Y., and Jin, F.-F.: Polar amplification dominated by local forcing and feedbacks, Nat. Clim. Change, 8, 1076–1081, https://doi.org/10.1038/s41558-018-0339-y, 2018.
Vanhanen, J., Mikkilä, J., Lehtipalo, K., Sipilä, M., Manninen, H. E., Siivola, E., Petäjä, T., and Kulmala, M.: Particle Size Magnifier for Nano-CN Detection, Aerosol Sci. Tech., 45, 533–542, https://doi.org/10.1080/02786826.2010.547889, 2011.
Virkkula, A., Asmi, E., Teinilä, K., Frey, A., Aurela, M., Timonen, H., Mäkelä, T., Samuli, A., Hillamo, R., Aalto, P., Kirkwood, S., and Kulmala, M.: Review of Aerosol Research at the Finnish Antarctic Research Station Aboa and its Surroundings in Queen Maud Land, Antarctica, Geophysica, 45, 163–181, 2009.
Von Berg, L., Prend, C. J., Campbell, E. C., Mazloff, M. R., Talley, L. D., and Gille, S. T.: Weddell Sea Phytoplankton Blooms Modulated by Sea Ice Variability and Polynya Formation, Geophys. Res. Lett., 47, e2020GL087954, https://doi.org/10.1029/2020GL087954, 2020.
Weller, R., Schmidt, K., Teinilä, K., and Hillamo, R.: Natural new particle formation at the coastal Antarctic site Neumayer, Atmos. Chem. Phys., 15, 11399–11410, https://doi.org/10.5194/acp-15-11399-2015, 2015.
Wiedensohler, A., Birmili, W., Nowak, A., Sonntag, A., Weinhold, K., Merkel, M., Wehner, B., Tuch, T., Pfeifer, S., Fiebig, M., Fjäraa, A. M., Asmi, E., Sellegri, K., Depuy, R., Venzac, H., Villani, P., Laj, P., Aalto, P., Ogren, J. A., Swietlicki, E., Williams, P., Roldin, P., Quincey, P., Hüglin, C., Fierz-Schmidhauser, R., Gysel, M., Weingartner, E., Riccobono, F., Santos, S., Grüning, C., Faloon, K., Beddows, D., Harrison, R., Monahan, C., Jennings, S. G., O'Dowd, C. D., Marinoni, A., Horn, H.-G., Keck, L., Jiang, J., Scheckman, J., McMurry, P. H., Deng, Z., Zhao, C. S., Moerman, M., Henzing, B., de Leeuw, G., Löschau, G., and Bastian, S.: Mobility particle size spectrometers: harmonization of technical standards and data structure to facilitate high quality long-term observations of atmospheric particle number size distributions, Atmos. Meas. Tech., 5, 657–685, https://doi.org/10.5194/amt-5-657-2012, 2012.
Willis, M. D., Burkart, J., Thomas, J. L., Köllner, F., Schneider, J., Bozem, H., Hoor, P. M., Aliabadi, A. A., Schulz, H., Herber, A. B., Leaitch, W. R., and Abbatt, J. P. D.: Growth of nucleation mode particles in the summertime Arctic: a case study, Atmos. Chem. Phys., 16, 7663–7679, https://doi.org/10.5194/acp-16-7663-2016, 2016.
Yan, C., Dada, L., Rose, C., Jokinen, T., Nie, W., Schobesberger, S., Junninen, H., Lehtipalo, K., Sarnela, N., Makkonen, U., Garmash, O., Wang, Y., Zha, Q., Paasonen, P., Bianchi, F., Sipilä, M., Ehn, M., Petäjä, T., Kerminen, V.-M., Worsnop, D. R., and Kulmala, M.: The role of H2SO4-NH3 anion clusters in ion-induced aerosol nucleation mechanisms in the boreal forest, Atmos. Chem. Phys., 18, 13231–13243, https://doi.org/10.5194/acp-18-13231-2018, 2018.
Yu, H., Ortega, J., Smith, J. N., Guenther, A. B., Kanawade, V. P., You, Y., Liu, Y., Hosman, K., Karl, T., Seco, R., Geron, C., Pallardy, S. G., Gu, L., Mikkilä, J., and Lee, S.-H.: New Particle Formation and Growth in an Isoprene-Dominated Ozark Forest: From Sub-5 nm to CCN-Active Sizes, Aerosol Sci. Tech., 48, 1285–1298, https://doi.org/10.1080/02786826.2014.984801, 2014.