the Creative Commons Attribution 4.0 License.
the Creative Commons Attribution 4.0 License.
 | 29 Jun 2022
Measurement report: The importance of biomass burning in light extinction and direct radiative effect of urban aerosol during the COVID-19 lockdown in Xi'an, China
Jie Tian
Qiyuan Wang
Huikun Liu
Yongyong Ma
Suixin Liu
Yong Zhang
Weikang Ran
Yongming Han
Junji Cao
Due to the complexity of emission sources, a better understanding of aerosol optical properties is required to mitigate climate change in China. Here, an intensive real-time measurement campaign was conducted in an urban area of China before and during the COVID-19 lockdown in order to explore the impacts of anthropogenic activities on aerosol light extinction and the direct radiative effect (DRE). The mean light extinction coefficient (bext) decreased from 774.7 ± 298.1 Mm−1 during the normal period to 544.3 ± 179.4 Mm−1 during the lockdown period. A generalised additive model analysis indicated that the large decline in bext (29.7 %) was due to sharp reductions in anthropogenic emissions. Chemical calculation of bext based on a ridge regression analysis showed that organic aerosol (OA) was the largest contributor to bext in both periods (45.1 %–61.4 %), and the contributions of two oxygenated OAs to bext increased by 3.0 %–14.6 % during the lockdown. A hybrid environmental receptor model combined with chemical and optical variables identified six sources of bext. It was found that bext from traffic-related emissions, coal combustion, fugitive dust, the nitrate and secondary OA (SOA) source, and the sulfate and SOA source decreased by 21.4 %–97.9 % in the lockdown, whereas bext from biomass burning increased by 27.1 %, mainly driven by the undiminished need for residential cooking and heating. An atmospheric radiative transfer model was further used to illustrate that biomass burning, rather than traffic-related emissions, became the largest positive effect (10.0 ± 10.9 W m−2) on aerosol DRE in the atmosphere during the lockdown. Our study provides insights into aerosol bext and DRE from anthropogenic sources, and the results imply the importance of controlling biomass burning for tackling climate change in China in the future.
- Article
(3373 KB) - Full-text XML
-
Supplement
(1291 KB) - BibTeX
- EndNote


The abrupt outbreak of COVID-19 caused unprecedented economic and social disruption (Yao et al., 2020). Most countries implemented city lockdowns to curb the virus spread among humans, providing a rare opportunity to investigate the impacts of anthropogenic activities on air quality (Ibrahim et al., 2021; Kumar et al., 2021; Sanap, 2021; Weber et al., 2020). The Chinese government also enforced a series of strict restrictions on travel, transport, manufacture, and construction activities during the lockdown. Recent studies on the aerosols in China that were conducted during the lockdown period have focused on primary emissions and secondary formation, and most of them have revealed changes in aerosol compositions, sources, and processes under a variety of emission control measures (Le et al., 2020; Li et al., 2020; P. F. Wang et al., 2020; Y. C. Wang et al., 2020; Zhao et al., 2020; Zheng et al., 2020). However, only a few studies have been conducted to explore the link between the chemical constituents in aerosol and light absorption during the lockdown (Chen et al., 2020; Lin et al., 2021; L. Xu et al., 2020). Thus, the influence of reduced anthropogenic activities on variations in aerosol optical properties and the direct radiative effect (DRE) are less understood.
Atmospheric aerosols alter the radiative energy budget by directly scattering and absorbing solar and terrestrial radiation, thereby affecting global climate change (Bellouin et al., 2013; Yao et al., 2017). The spatio-temporal variations in aerosol optical properties (e.g. light scattering coefficient, bscat; light absorption coefficient, babs; light extinction coefficient, bext; and single-scattering albedo, SSA) are highly dependent on their chemical compositions and sources (Malm and Hand, 2007; Tao et al., 2014; Yao et al., 2021), which can elevate uncertainties in estimating the aerosol DRE (IPCC, 2013; Ma et al., 2012). Therefore, distinguishing chemical-composition- and source-specific aerosol optical properties from a mixture of aerosols in the atmosphere would make for a better understanding of the climate change observed during the COVID-19 lockdown.
The relationship between aerosol optical coefficients and chemical compositions can be built using the Interagency Monitoring of Protected Visual Environments algorithm and multiple linear regression (MLR) (Deng et al., 2016; Malm and Hand, 2007; Shen et al., 2014; Tao et al., 2014, 2015). However, previous studies have often regarded organic aerosol (OA) as a whole light scattering component only. In reality, some OA components can absorb light, which is collectively termed brown carbon (BrC) (Andreae and Gelencsér, 2006). The DRE caused by BrC has been reported to be non-negligible (e.g. 0.04 to 0.57 W m−2) (Feng et al., 2013; Lin et al., 2014; Wang et al., 2014). Furthermore, the optical properties of OA can vary widely due to the complexity of the OA components associated with primary sources, formation pathways, and ageing processes (Laskin et al., 2015). For instance, primary OA (POA) from anthropogenic sources (e.g. biomass burning and coal combustion) usually has different mass scattering efficiency and mass absorption efficiency (MSE and MAE respectively) in the atmosphere compared with secondary OA (SOA) formed though photochemical or aqueous-phase oxidations (Han et al., 2015; Qin et al., 2018). Therefore, investigating the POA and SOA contributions to aerosol light scattering and absorption would reduce uncertainties in the chemical apportionment of aerosol optical properties.
Previous studies have been conducted on aerosol optical source apportionment. According to multi-wavelength Aethalometer measurement, the source of aerosol babs can be investigated by exploiting the differences in the absorption spectra of light-absorbing materials (Herich et al., 2011; Sandradewi et al., 2008; Zotter et al., 2017). In this method, the aerosol absorption in the near-ultraviolet and short-visible regions of the spectrum from biomass burning are assumed to be enhanced due to the emission of BrC, compared with that from fossil fuel combustion (Kirchstetter et al., 2004; Tian et al., 2019). This makes it possible to derive their contributions to light absorption by using the specific source absorption Ångström exponent (AAE); however, the so-called “Aethalometer model” could not distinguish as many sources as resolved by receptor models due to the similar optical properties of the aerosol sources (Saarikoski et al., 2021). In contrast, receptor models can be utilised to conduct multiple optical source apportionment of aerosol. Several studies have used a combination of the receptor model and MLR to indirectly identify sources of aerosol bscat, babs, and bext (Cao et al., 2012; Tian et al., 2020; Zhou et al., 2017). For example, Zhou et al. (2017) first used positive matrix factorisation analysis to quantify the mass contributions of aerosol from secondary aerosol, biomass burning, traffic-related emissions, and coal combustion based on the sole chemical species, and MLR was then used to apportion the contribution of each source to bscat and babs. In addition, recent studies have attempted to conduct direct optical source apportionment by combining aerosol chemical species with optical coefficients in one receptor model (Forello et al., 2019; Q. Wang et al., 2020; Xie et al., 2019). This promising method can provide both chemical and optical profiles in each source to improve the performance of source identification, and it may eliminate potential uncertainties caused by the indirect approach.
The Fenwei Plain was designated as the key region of pollution treatment in the “Three-year action plan for cleaner air” implemented by the Chinese State Council in 2018. As one of the megacities on the Fenwei Plain, Xi'an has been facing a severe air pollution problem, especially in winter (Niu et al., 2016; Wang et al., 2015). Here, we conducted high-time-resolution aerosol bscat and babs measurements in Xi'an, China, before and during the city lockdown. The main objectives were to (1) characterise the changes in aerosol optical properties due to the COVID-19 lockdown, (2) quantify the contributions of individual chemical components and the contributions of specific sources to bext, and (3) evaluate the source-specific aerosol DRE based on a radiative transfer model. This study provides insights into the response of aerosol bext and DRE to anthropogenic emission sources and acts as a scientific basis to establish future emission control policies to deal with climate change in China.
2.1 Sampling site and period
Intensive measurements of aerosol optical properties were conducted at an urban sampling site of the National Observation and Research Station of Regional Ecological Environment Change and Comprehensive Management in the Guanzhong Plain, southwest of downtown Xi'an (34∘13′ N, 108∘52′ E; Fig. S1 in the Supplement). All instruments were placed on the rooftop of an office building (∼ 10 m above the ground), approximately 30 m from the nearest road used by vehicular traffic. A detailed description of the sampling site can be found in Tian et al. (2021). In this study, the sampling campaign consisted of two distinct periods: the normal period (1 to 23 January 2020) and the COVID-19 lockdown period (27 January to 7 February 2020). A total of 3 d, from 24 to 26 January 2020, were excluded due to the intensive influence of fireworks during the Chinese New Year celebration.
2.2 Measurements
2.2.1 Real-time measurements of bscat and babs
A single-wavelength integrating nephelometer (Aurora 1000, Ecotech, Melbourne, Australia) was used to measure aerosol bscat at a wavelength of 525 nm with a 5 min time resolution. In the measurement volume, the ambient air, sampled at a flow rate of 5 L min−1, was illuminated by the light source so that only light scattered at scattering angles between 10 and 170∘ could reach the photomultiplier tube. Thereafter, bscat was calculated by the proportion of the electrical signals produced by the photomultiplier tube. Span calibration was done using CO2 to ensure the accuracy of the instrument before sampling, and zero calibration was performed twice each day using particle-free air to subtract the Rayleigh scattering. More detailed principles of the Aurora 1000 have been described elsewhere (Chamberlain-Ward and Sharp, 2011).
Aerosol babs values at wavelengths of 370, 470, 520, 590, 660, and 880 nm were measured by a newly developed Aethalometer (Model AE33, Magee Scientific, Berkeley, CA, USA) with a 1 min time resolution. Briefly, the Model AE33 is a filter-based absorption photometer that simultaneously measures the light attenuation transmitted through two parallel spots of the aerosol filter at 3.85 and 1.15 L min−1 respectively. Based on “dual-spot” measurements, it used a real-time loading effect compensation algorithm to eliminate the nonlinear loading effect by increasing the deposition amount of aerosol on the filter. Additionally, a factor of 2.14 was used in the Model AE33 to automatically modify the quartz filter matrix scattering effect. A detailed description of this instrument can be found in Drinovec et al. (2015).
Both the Aurora 1000 and Model AE33 instruments were equipped with a PM2.5 (particulate matter with an aerodynamic diameter ≤2.5 µm) cyclone separator in the sampling inlet to remove particles larger than 2.5 µm as well as a Nafion® dryer (MD-700-24S, Perma Pure, Inc., Lakewood, NJ, USA) to retain particles (relative humidity <40 %) before entering these instruments. Considering the fact that the relative error (1.5 % ± 0.1 %) between babs at 520 and 525 nm is negligible, the amount of bext in this study was defined as the sum of bscat at 525 nm and babs at 520 nm.
2.2.2 Complementary data
A quadrupole aerosol chemical speciation monitor (Q-ACSM, Aerodyne Research Inc., Billerica, Massachusetts, USA) and an Xact 625i ambient metals monitor (Xact 625i, Cooper Environmental Services, Beaverton, OR, USA) were operated to obtain chemical composition characteristics (Furger et al., 2020; Ng et al., 2011). The Q-ACSM measured concentrations of non-refractory species in PM1 (NO, SO, NH, Cl−, and OA), and OA was further resolved into POA as well as less-oxidised and more-oxidised oxygenated OA (LO-OOA and MO-OOA respectively). Detailed information on the Q-ACSM data process and source apportionment of OA can be found in our previous paper (Tian et al., 2021). The Xact 625i quantified hourly element concentrations in PM2.5 through X-ray fluorescence analysis, including Si, K, Ca, Cr, Mn, Fe, Zn, As, Se, Ba, Hg, and Pb. Additionally, the black carbon (BC) concentration was calculated using babs at 880 nm (Kirchstetter et al., 2004). Online PM2.5 and NOx concentrations were obtained from the Department of Ecology and Environment of Shaanxi Province. More detailed descriptions of these complementary data can be found in Table S1 in the Supplement.
2.3 Meteorological condition separation
A generalised additive model (GAM) combined with integrated smoothness estimation was used to establish the relationship between bext and several meteorological parameters as follows (Wood, 2004):
where bext(i) is the bext (in Mm−1) averaged over the ith hour; MPj represents the jth meteorological parameter, such as wind speed, wind direction, temperature, pressure, dew point, and planetary boundary layer height (for which the data sources can be found in Table S1); f corresponds to the smooth function describing the association between bext and meteorological parameters; β0 is the model intercept; and ei is the regression residuals which are assumed to be normally distributed.
Based on the “mgcv” R package (Wood, 2017), the whole campaign dataset was divided into three parts: model data (80 % of data during the normal period) for establishing the bext GAM, test data (20 % of data during the normal period) for verifying the accuracy of the model, and forecast data (100 % of data during the lockdown period) for estimating the contributions of meteorological conditions and emissions to bext reduction.
2.4 Chemical calculation of bscat and babs
Due to the fact that POA and SOA have non-negligible light scattering and absorbing abilities, the amount of bscat and babs associated with individual chemical species can be estimated statistically using the ridge regression method:
Here, bscat and babs are given in inverse megametres (Mm−1); the bracket notation [ ] represents the specific chemical species concentration in micrograms per cubic metre (µg m−3); ai and bi (i = 1–6) describe the MSE and MAE of each chemical species in square metres per gram (m2 g−1) respectively; and ci (i = 1 or 2) is a constant. In Eq. (2), the concentrations of [NH4NO3], [(NH4)2SO4], and [fine soil] were calculated using , , and respectively (Chow et al., 2015; CNEMC, 1990). In Eq. (3), b1 was calculated by the absorption Ångström exponent method, and a detailed description can be seen in Text S1 in the Supplement. The reconstructed [PM] () is strongly correlated with the measured [PM2.5] (R2=0.86), with a slope of 0.79 (Fig. S2). Hence, the reconstructed [PM] accounted for ∼ 79 % of the measured [PM2.5]. The NH4NO3, (NH4)2SO4, POA, LO-OOA, and MO-OOA in PM1–2.5 are not included in the calculation (Eqs. 2, 3). A sensitivity analysis concludes that if their concentrations increase by 21 % to match the measured PM2.5, the estimated MSEs and MAEs will correspondingly decrease by 21 %.
2.5 Hybrid environmental receptor model (HERM) for source apportionment
The source apportionment of bext was performed with HERM, which is a newly developed bilinear model (Chen and Cao, 2018). Briefly, HERM solves non-negative matrices of unknown factor profiles and contributions with a pre-set number of factors K by iteratively minimising the object function Q, which is defined as follows:
Here, I, J, and K are the number of samples, aerosol variables, and factors respectively; the indices of i, j, and k represent the sample, aerosol variable, and factor respectively; xij is the measured ambient data spectral matrix; fkj is the factor profile matrix; gik is the factor contribution matrix; and represent the error in the measured ambient data and the variability in the constrained factor profile respectively; δik is set to zero or one depending on whether the kth factor profile is constrained or unconstrained respectively.
In this study, both chemical species (PM2.5, NO, SO, NH, Cl−, BC, POA, LO-OOA, MO-OOA, Si, K, Ca, Cr, Mn, Fe, Zn, As, Se, Ba, Hg, and Pb – in µg m−3) and optical variables (bscat and babs – in Mm−1) were used as input data for the HERM analysis. The uncertainties in hourly ambient data except elements were introduced by the standard deviation of samples with higher time resolution (<1 h); the uncertainties in elements were estimated using their concentration, the default analytical relative error (10 %) (Rai et al., 2020), and the method detection limit (MDL) (Norris et al., 2014) (Text S2). All input variables were classified as strong due to the high signal-to-noise ratio (SNR > 2). Here, HERM had the following predetermined settings: (1) the ith sample was excluded from source apportionment when missing values occurred in variables, and (2) the PM2.5 value in the factor profile was set to unity as a reference standard for both chemical and optical variables.
A range of factor numbers from two to eight was selected to run in the HERM software with completely unconstrained factor profiles, and diagnostic plots are detailed in the Supplement (Text S3, Figs. S3–S8). The six-factor solution without mixed sources was found to be the optimal solution based on multiple criteria including the following: (1) variations in that can be used as a metric for choosing the best number of resolved factors (Ulbrich et al., 2009), (2) physical meaningfulness of distinct factor profiles and explained variation (EV) values of variables, (3) agreement between the measured and modelled values, and (4) good correlations with external and internal tracers. Detailed information on the final selected factor profiles and contributions are presented in Sect. 3.4.
2.6 DRE calculations
The Santa Barbara DISORT (Discrete Ordinate Radiative Transfer) Atmospheric Radiative Transfer (SBDART) code developed by the Institute for Computational Earth System Science, University of California, was utilised to estimate the source-specific aerosol DRE. It can calculate the downwelling and upwelling radiative flux (Fdown and Fup respectively), in which the difference indicates the net radiative flux (). A detailed description of SBDART can be found in Ricchiazzi et al. (1998). Based on the optical source apportionment results, the SBDART model input values for aerosol optical depth, SSA, the asymmetry factor, and the optical coefficients were retrieved using the Optical Properties of Aerosol and Cloud (OPAC) model (Hess et al., 1998). The aerosol DRE can be calculated as follows:
Here, the indices “atmosphere”, “top”, and “surface” indicate the DRE in the atmosphere, at the top of the atmosphere, and at the Earth's surface respectively; ΔF (with aerosol) and ΔF (without aerosol) represent the net radiative flux with and without aerosol respectively.
3.1 General descriptions of aerosol optical properties
The temporal variations in hourly mean bscat, babs, bext, and SSA as well as the PM2.5 mass concentrations for the entire sampling period are depicted in Fig. 1, and a statistical summary of the optical and chemical parameters during the normal and COVID-19 lockdown periods is shown in Table 1. The optical coefficients decreased dramatically in accordance with the significant decrease in PM2.5 when stringent control measures on emission sources were implemented during the lockdown period (Tian et al., 2021; Zheng et al., 2020). The mean values of bscat, babs, and bext during the normal period were 688.1 ± 261.4, 86.6 ± 43.0, and 774.7 ± 298.1 Mm−1 respectively, which are consistent with the values (657.4 ± 436.9, 104.0 ± 69.6, and 761.4 ± 506.5 Mm−1 respectively) reported previously in winter of 2009 in Xi'an (Cao et al., 2012), although a series of nationwide air quality standards and long-term pollution control policies have been implemented in the 74 major Chinese cities since 2013 (W. Y. Xu et al., 2020; Zheng et al., 2018). Comparatively, the control measures aiming to curb the outbreaks did not last long, but they were the strictest measures that have been enforced in China to date. The large decreases (27.6 %–47.0 %) found in bscat, babs, and bext during the lockdown (498.4 ± 159.0, 45.9 ± 22.9, and 544.3 ± 179.4 Mm−1 respectively) provide insights into the effect of anthropogenic emissions on aerosol optical properties.

Figure 1Hourly variations in light scattering (bscat), absorption (babs), and extinction (bext) coefficients; single-scattering albedo (SSA); and PM2.5 mass concentrations in Xi'an during the normal (1 to 23 January 2020) and COVID-19 lockdown (27 January to 7 February 2020) periods. The x axis shows the date (mm-dd) in 2020.
Table 1Summary of optical coefficients and chemical species in Xi'an observed during the entire campaign, the normal period (1 to 23 January 2020), and the COVID-19 lockdown period (27 January to 7 February 2020).
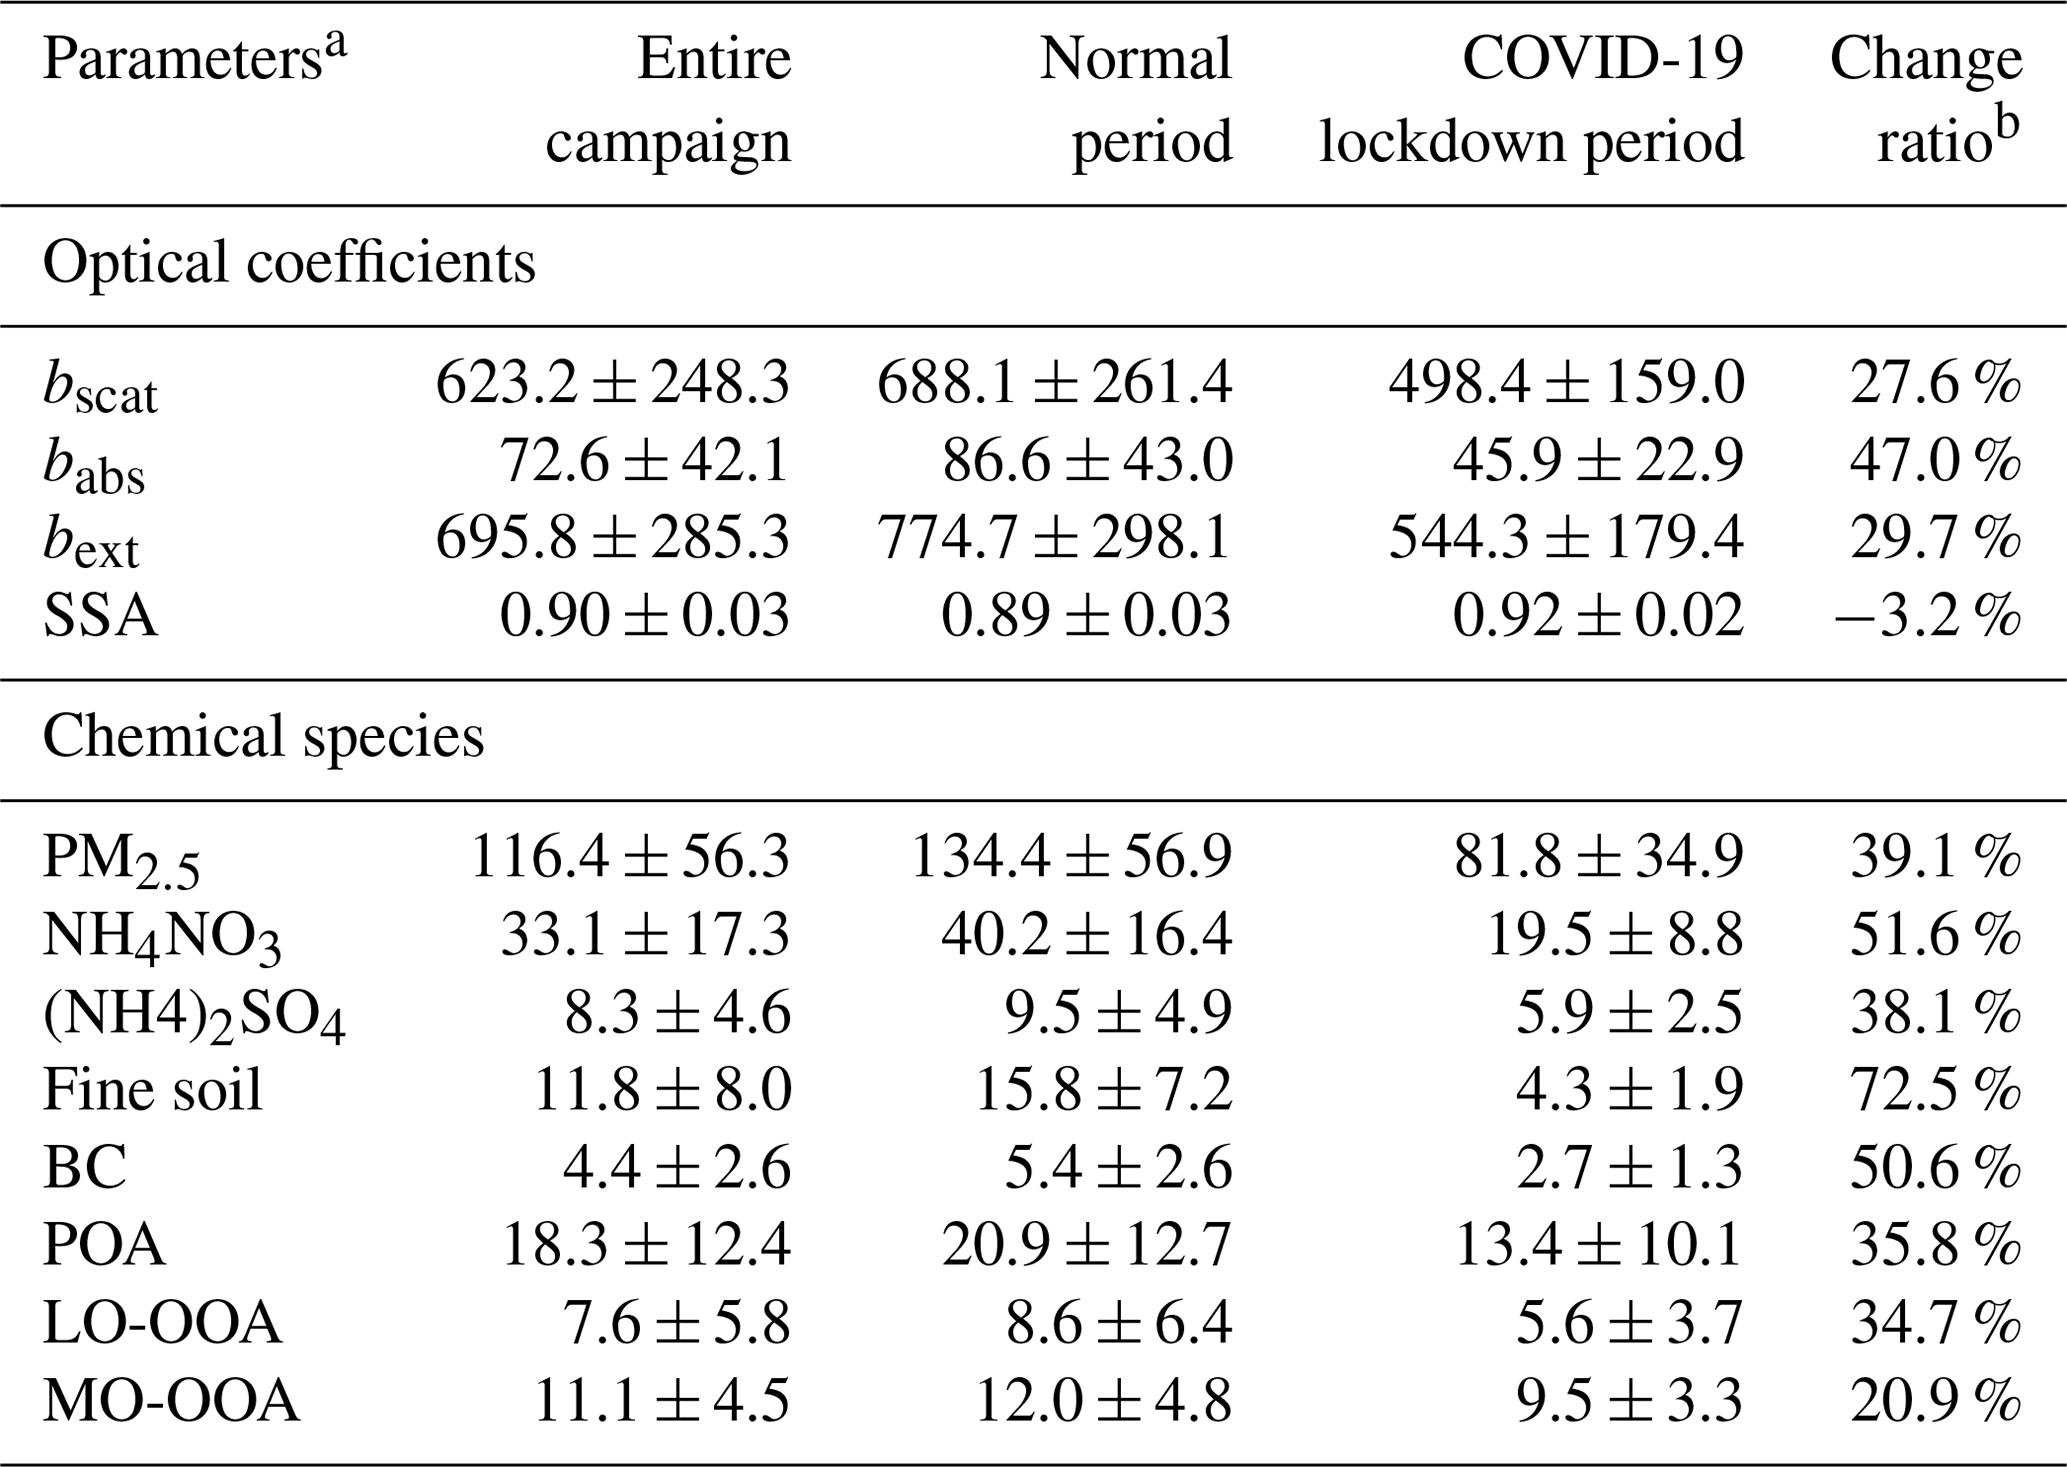
a The units for bscat, babs, and bext are inverse megametres (Mm−1); SSA is dimensionless; and the units of chemical species are micrograms per cubic metre (µg m−3). b Change ratio = ([Normal period] − [COVID-19 lockdown period])[Normal period] × 100 %.
The SSA, defined as the ratio of bscat to bext, increased from 0.89 ± 0.03 during the normal period to 0.92 ± 0.02 during the lockdown period. As presented in Fig. 2a and b, SSA showed linear increases with the mass fractions of secondary inorganic aerosol (SIA = NH4NO3+(NH4)2SO4) to PM2.5 (R2 = 0.83–0.84) and SOA (SOA = LO-OOA + MO-OOA) to OA (R2 = 0.94–0.99), indicating an enhanced role of secondary formation during the lockdown. In addition, the correlations of SSA and the ratio of LO-OOA to MO-OOA were established to reveal a more complex influence of SOA on SSA (Fig. 2c), which showed negative relationships (R2 = 0.69–0.79). This indicated that SSA can be impacted by the degree of oxidation on aerosol, and higher scattering and lower absorption abilities are usually found for more oxidised OA (Han et al., 2015; Lee et al., 2014).
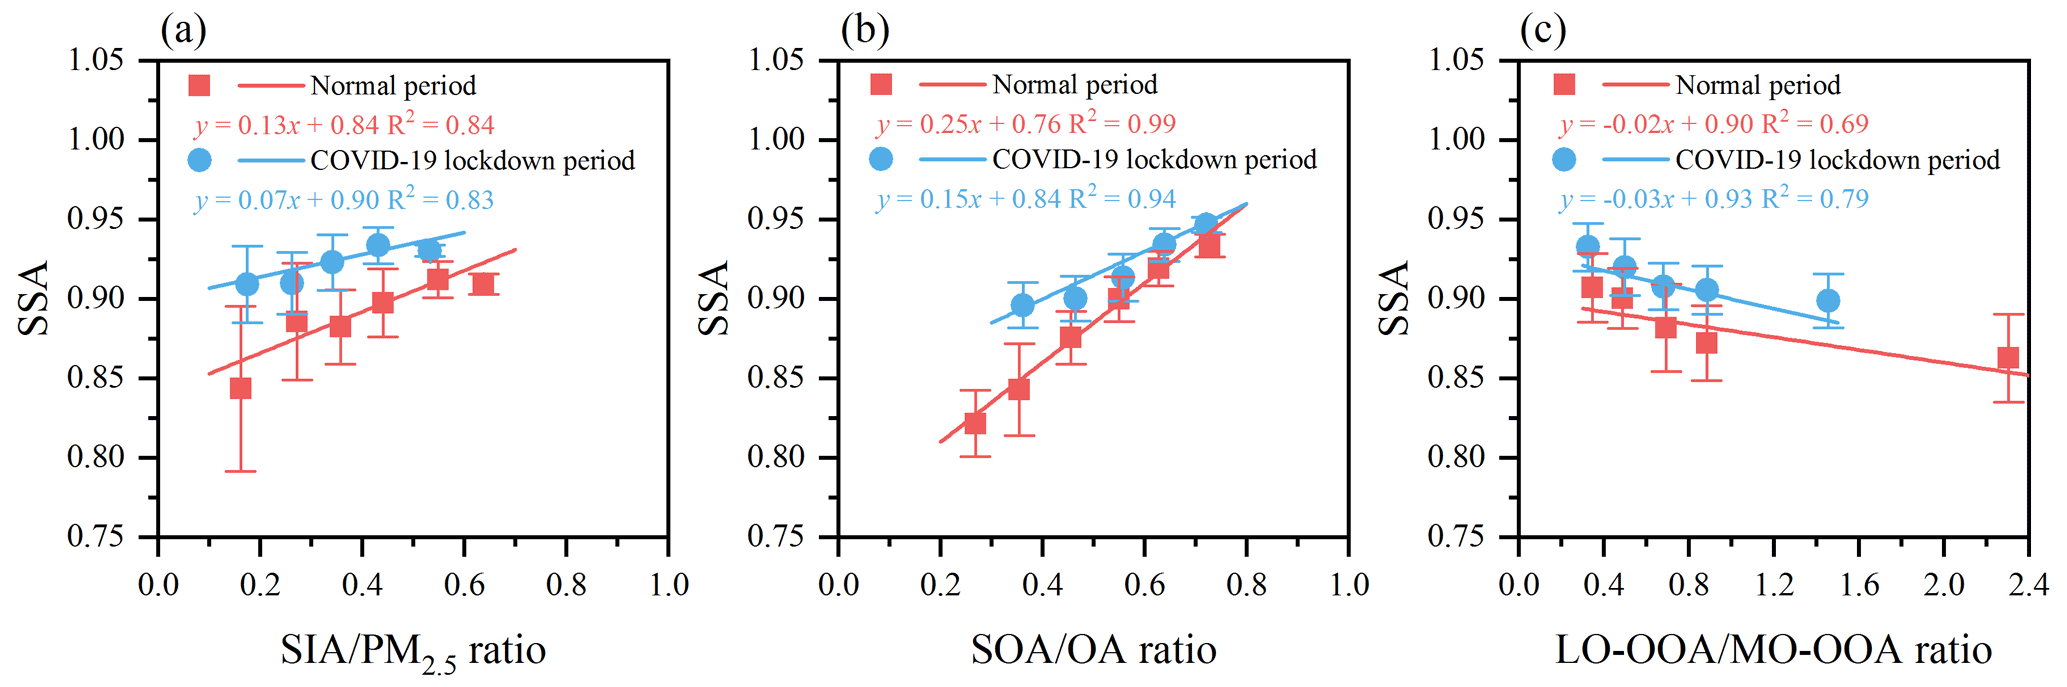
Figure 2Variations in single-scattering albedo (SSA) as a function of (a) the secondary inorganic aerosol (SIA = NH4NO3 + (NH4)2SO4)PM2.5, (b) the secondary organic aerosol (SOA = LO-OOA + MO-OOA)OA, and (c) the LO-OOA MO-OOA ratios during the normal and COVID-19 lockdown periods.
3.2 Effects of emission reduction and meteorological conditions on reduced bext
Figure 3 shows the time series of the measured and GAM-predicted bext for the model data, test data, and forecast data. As shown in Tables S2 and S3, the constructed GAM with an adjusted R2 value (0.54) can explain 54 % of the variation in bext after incorporating the nonlinear relationships between optical and meteorological parameters. Independent smoothed meteorological variables of the model were statistically significant according to p values (<0.05) from an F test. Concurvity indices between each independent smoothed parameter were within 0.5, indicating that there was no serious multicollinearity (Schimek, 2009).
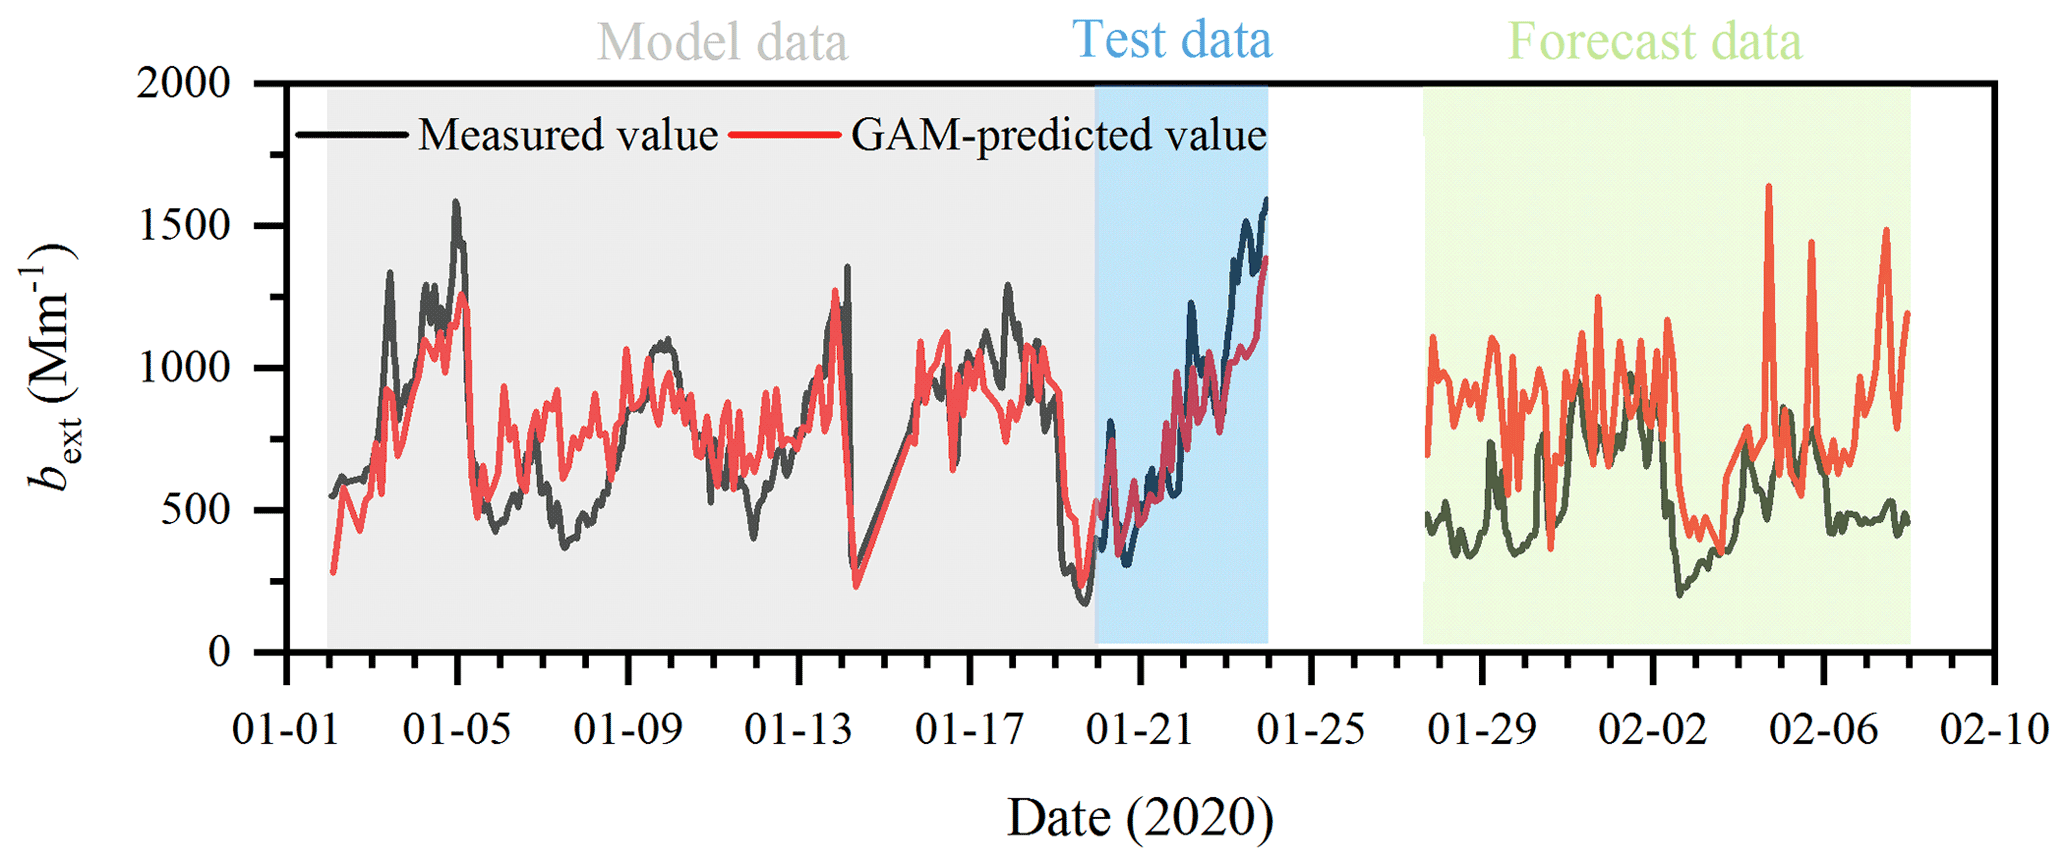
Figure 3Time series of the measured and GAM-predicted light extinction coefficient (bext) values for the model data, test data, and forecast data.
Before applying the constructed GAM to predict the bext during the lockdown period, a cross-validation test was used to evaluate the model. For the test data (20 % of data during the normal period), the R2 value of the linear regression and the index of agreement (IOA) (Wu et al., 2018) between the measured and GAM-predicted bext were 0.83 and 0.92 respectively, suggesting good performance of the constructed GAM. The difference between the measured and GAM-predicted bext during the lockdown can be attributed to emission reduction through the implementation of stringent control measures on emission sources. Emission reduction decreased bext by 299.2 Mm−1 during the lockdown period, which is higher than the decline in measured bext (230.4 Mm−1) from the normal period to the lockdown period. It is indicated that the meteorological conditions enhanced bext by 68.8 Mm−1 during the lockdown period, further reflecting the effective control of anthropogenic emissions.
3.3 Contribution of chemical components to bext
Table 2 presents the estimated MSE and MAE of individual chemical components during the normal and lockdown periods. NH4NO3 and (NH4)2SO4 had different MSEs, probably due to their different size distributions (Hu et al., 2017; Y. M. Zhang et al., 2013; Zhu et al., 2021). The MSEs of NH4NO3 (3.74 ± 0.18 m2 g−1) and (NH4)2SO4 (7.35 ± 0.25 m2 g−1) during the normal period were higher than those (3.23 ± 0.18 and 4.78 ± 0.35 m2 g−1 respectively) during the lockdown period. This may be explained by the higher mass loadings and peak diameters of aerosol without control measures (Cheng et al., 2015; Tao et al., 2015). The MAE of BC decreased from 15.00 to 13.27 m2 g−1 and was related to the decline in the AAE of BC (Text S1). The MSEs and MAEs of OA factors varied widely, from 3.48 to 12.89 m2 g−1 and from 0.25 to 0.59 m2 g−1 respectively, due to the complex chemical variability of OA constituents (Hallquist et al., 2009; Moise et al., 2015). The MSEs of OA increased with oxidation level from POA to MO-OOA. This could be explained by the increased mass diameter of OA with increasing OA oxidation level (Wang et al., 2021; Xu et al., 2015). The MSE of MO-OOA was larger during the lockdown period than that during the normal period, probably related to the enhanced atmospheric oxidation capacity during the lockdown period (Tian et al., 2021), which is found to result in a higher ageing state of OA with larger diameter (Hu et al., 2016; Zhu et al., 2021). The dependence of OA MAEs on the oxidation level presented a more complex trend. LO-OOA had higher MAE values than those of POA, indicating more BrC chromophores with a stronger light-absorbing capacity formed under less-oxidised conditions (Zhang et al., 2020). Additionally, the effect of photobleaching in the atmosphere that can weaken the light absorption ability of BrC resulted in the reduction of MO-OOA MAEs (Wang et al., 2021).
Table 2Estimated MSEs and MAEs (m2 g−1) of individual chemical components during the normal and COVID-19 lockdown periods.
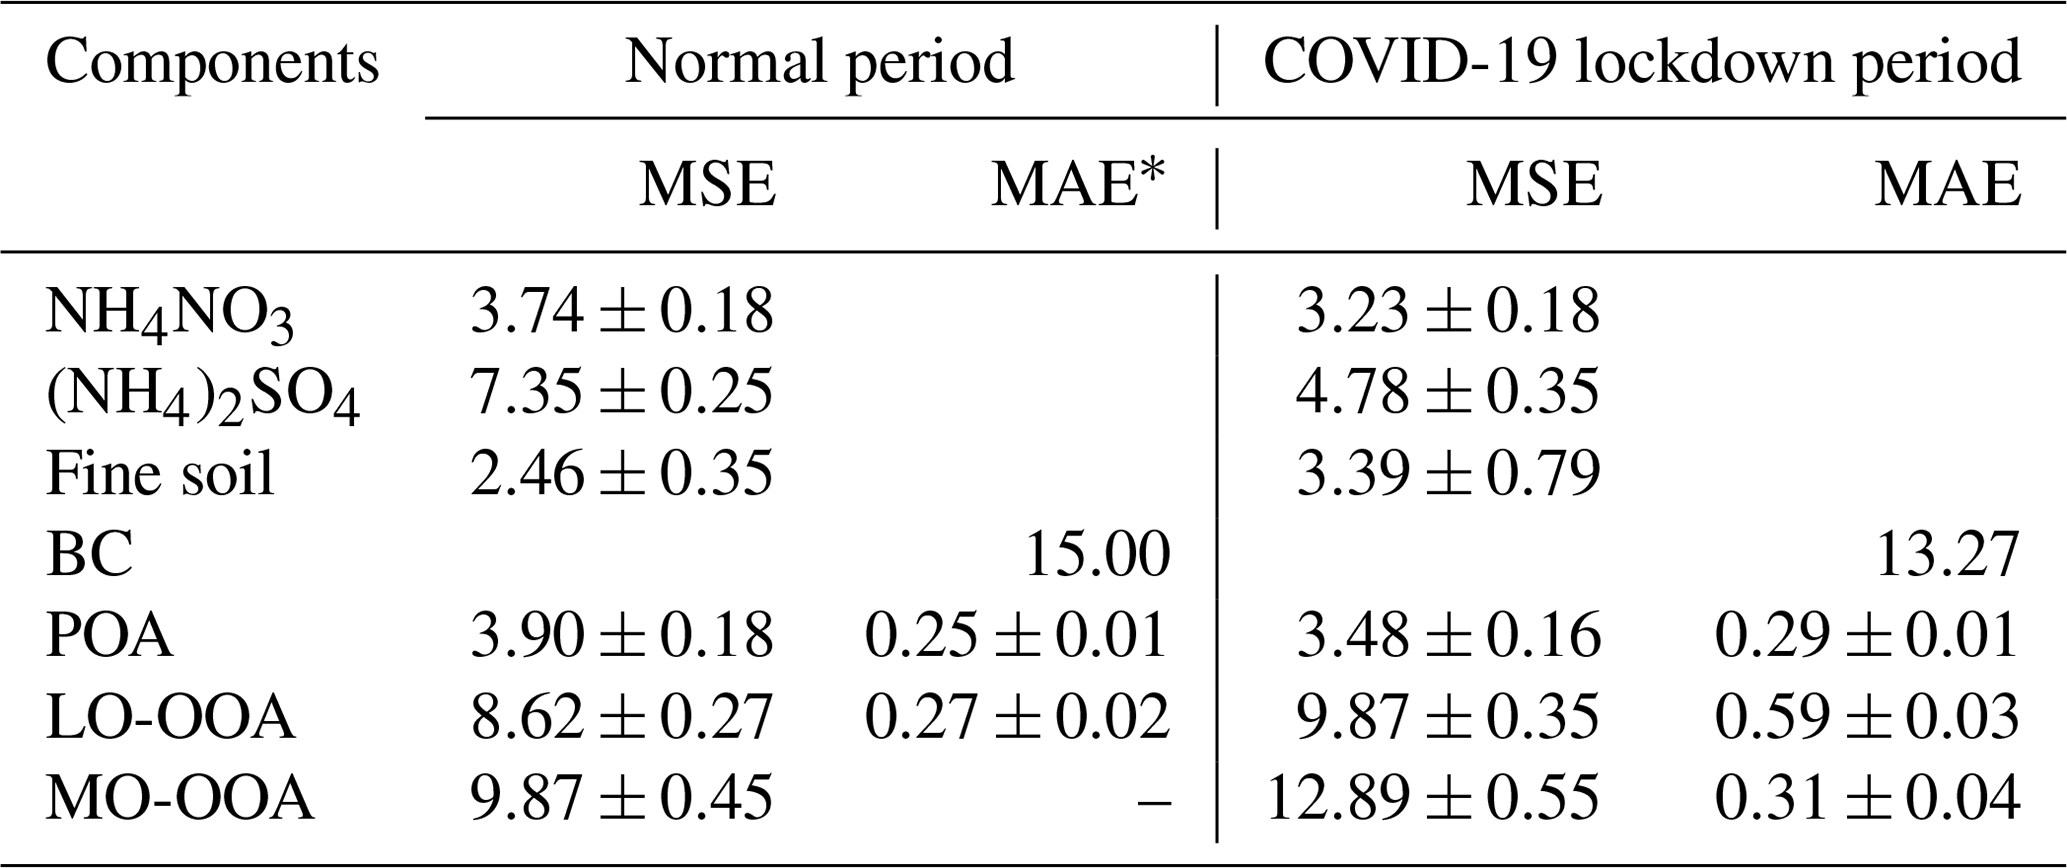
∗ The MAE of MO-OOA during the normal period was negative (near zero) and is not listed in the table.
The bext reconstructed using chemical compositions was strongly correlated with the measured optical bext (R2=0.94), with a slope of 0.78 (Fig. S9). As shown in Fig. 4, OA (POA + LO-OOA + MO-OOA) was the largest contributor to bext in both periods, accounting for 45.1 %–61.4 %, followed by NH4NO3 (16.5 %–24.1 %), BC (9.3 %–13.1 %), (NH4)2SO4 (7.9 %–11.2 %), and fine soil (4.9 %–6.5 %). This result was different from previous findings that SIA was often the largest contributor to bext in Chinese cities, such as Beijing (46 %–54 %) (Han et al., 2015), Chengdu (43 %) (Tao et al., 2014), Nanjing (53 %) (Shen et al., 2014), and Xi'an (63 %) (Cao et al., 2012), highlighting the dominant role of organic matter in aerosol light extinction in Xi'an today. Compared with the normal period, the contributions of NH4NO3, (NH4)2SO4, fine soil, BC, and POA to bext decreased by 1.3 %–7.6 % during the lockdown, whereas the contributions of two SOAs to bext increased by 3.0 %–14.6 %. On the one hand, the mass concentrations of LO-OOA and MO-OOA decreased by 20.9 %–34.7 % from the normal period to the lockdown period, lower than those of other chemical species (35.8 %–72.5 %); on the other hand, both of the SOAs' MSEs and MAEs showed higher values during the lockdown period, especially MO-OOA. This combination of effects eventually led to an enhanced role of SOA in light extinction during the lockdown.
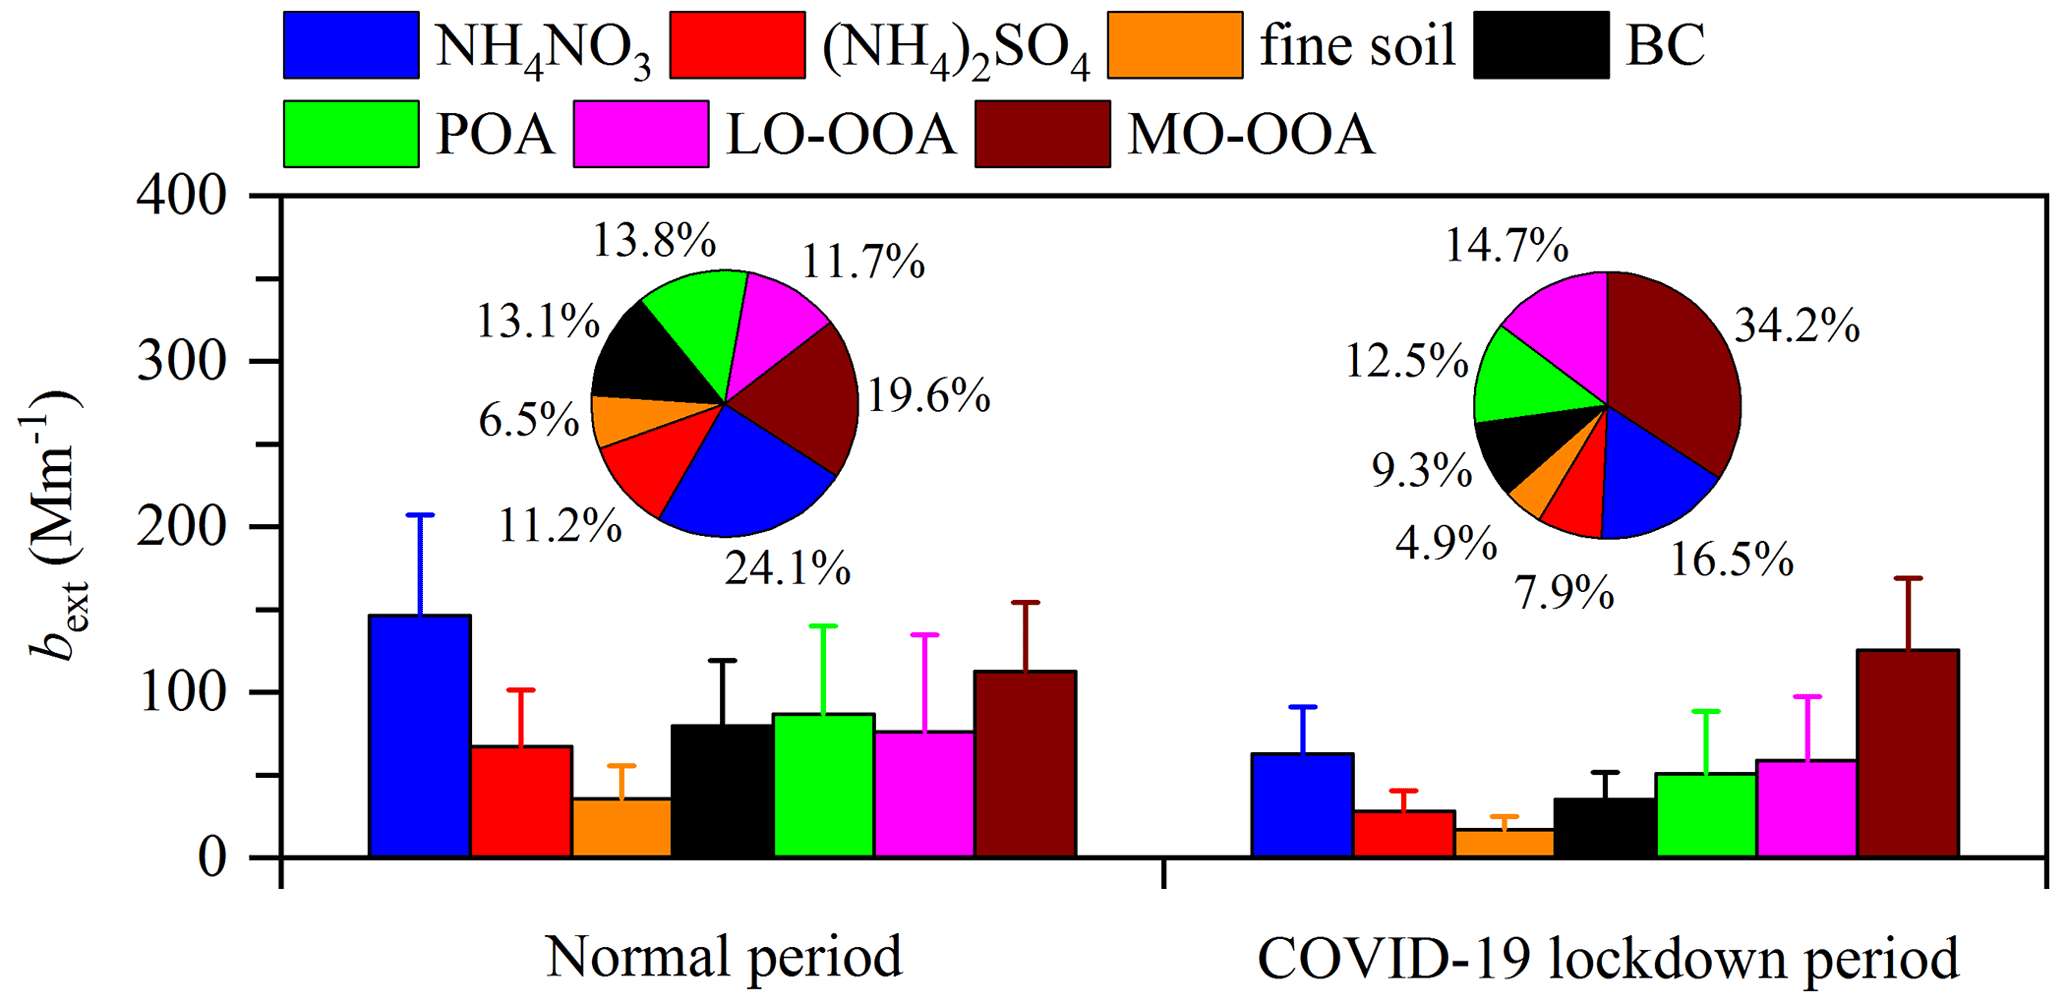
Figure 4Contributions of NH4NO3, (NH4)2SO4, fine soil, BC, POA, LO-OOA, and MO-OOA to the reconstructed chemical light extinction coefficient (bext) during the normal and COVID-19 lockdown periods.
3.4 Contribution of sources to bext
The six-factor solution was selected to be the optimal solution, which can adequately account for the variability in PM2.5 concentration and optical coefficients (Figs. S10, S11). Six sources were determined by the HERM analysis, consisting of traffic-related emissions, biomass burning, coal combustion, fugitive dust, the nitrate and SOA source, and the sulfate and SOA source. Details about their characteristics are presented in Fig. 5. The first source, identified as traffic-related emissions, was characterised by high EV values of Cr (77 %), Mn (53 %), Fe (36 %), and Zn (39 %), which can be released from lubricating oils, fuel additives, and brake and tyre wear (Ålander et al., 2005; Geivanidis et al., 2003; Tao et al., 2017; R. Zhang et al., 2013). Moderate contributions of POA (26 %) and BC (28 %) were commonly regarded as species of diesel and gasoline engine exhaust (Chow et al., 2004; Liu et al., 2017). Additionally, the temporal variations in bext from this source correlated well with NOx (R2=0.72), suggesting an association with motor vehicle emissions (Huang et al., 2017; H. Li et al., 2017). The second source with high EV values of POA (45 %), LO-OOA (41 %), BC (32 %), Cl (34 %), and K (41 %) was judged to be biomass burning. K was regarded as an excellent tracer of biomass burning (Li et al., 2007; Ni et al., 2017), and good correlations were also found between bext from biomass burning and K (R2=0.64). Previous studies have shown that POA from biomass burning can be rapidly oxidised in the atmosphere (Cubison et al., 2011); therefore, the abundant LO-OOA observed in this source might be indicative of aged biomass burning aerosol (Crippa et al., 2013; Kim et al., 2017; Xu et al., 2015). The third source, coal combustion, was characterised by high EV values of Cl (42 %), As (38 %), Se (46 %), and Pb (25 %). Of these elements, As and Se were enriched in coals (Tian et al., 2013), which were reliable indicators of coal combustion (Tan et al., 2017; Yu et al., 2019), and Pb was found to possibly be emitted from coal combustion in Xi'an (Xu et al., 2012). The fourth source was defined as fugitive dust due to significant EV values of Si (92 %), Ca (63 %), and Fe (31 %), which were the dominant chemical species in natural and construction dust profiles (Liu et al., 2017; Zhao et al., 2006). Two secondary sources were resolved in our study as the nitrate and SOA source, with high EV values of NO (42 %), NH (33 %), and MO-OOA (34 %), and the sulfate and SOA source, with high EV values of SO (58 %) and MO-OOA (39 %) respectively. As SO2 oxidation to sulfate requires a long time (e.g. 1 week) at the typical atmospheric level of OH radicals, SO was likely associated with a regional source, whereas NO was often formed more locally due to the intense NOx emissions in China (Zhang et al., 2015; Zheng et al., 2014). The defined nitrate and SOA and sulfate and SOA sources appeared to have stronger associations with local and regional processes respectively.
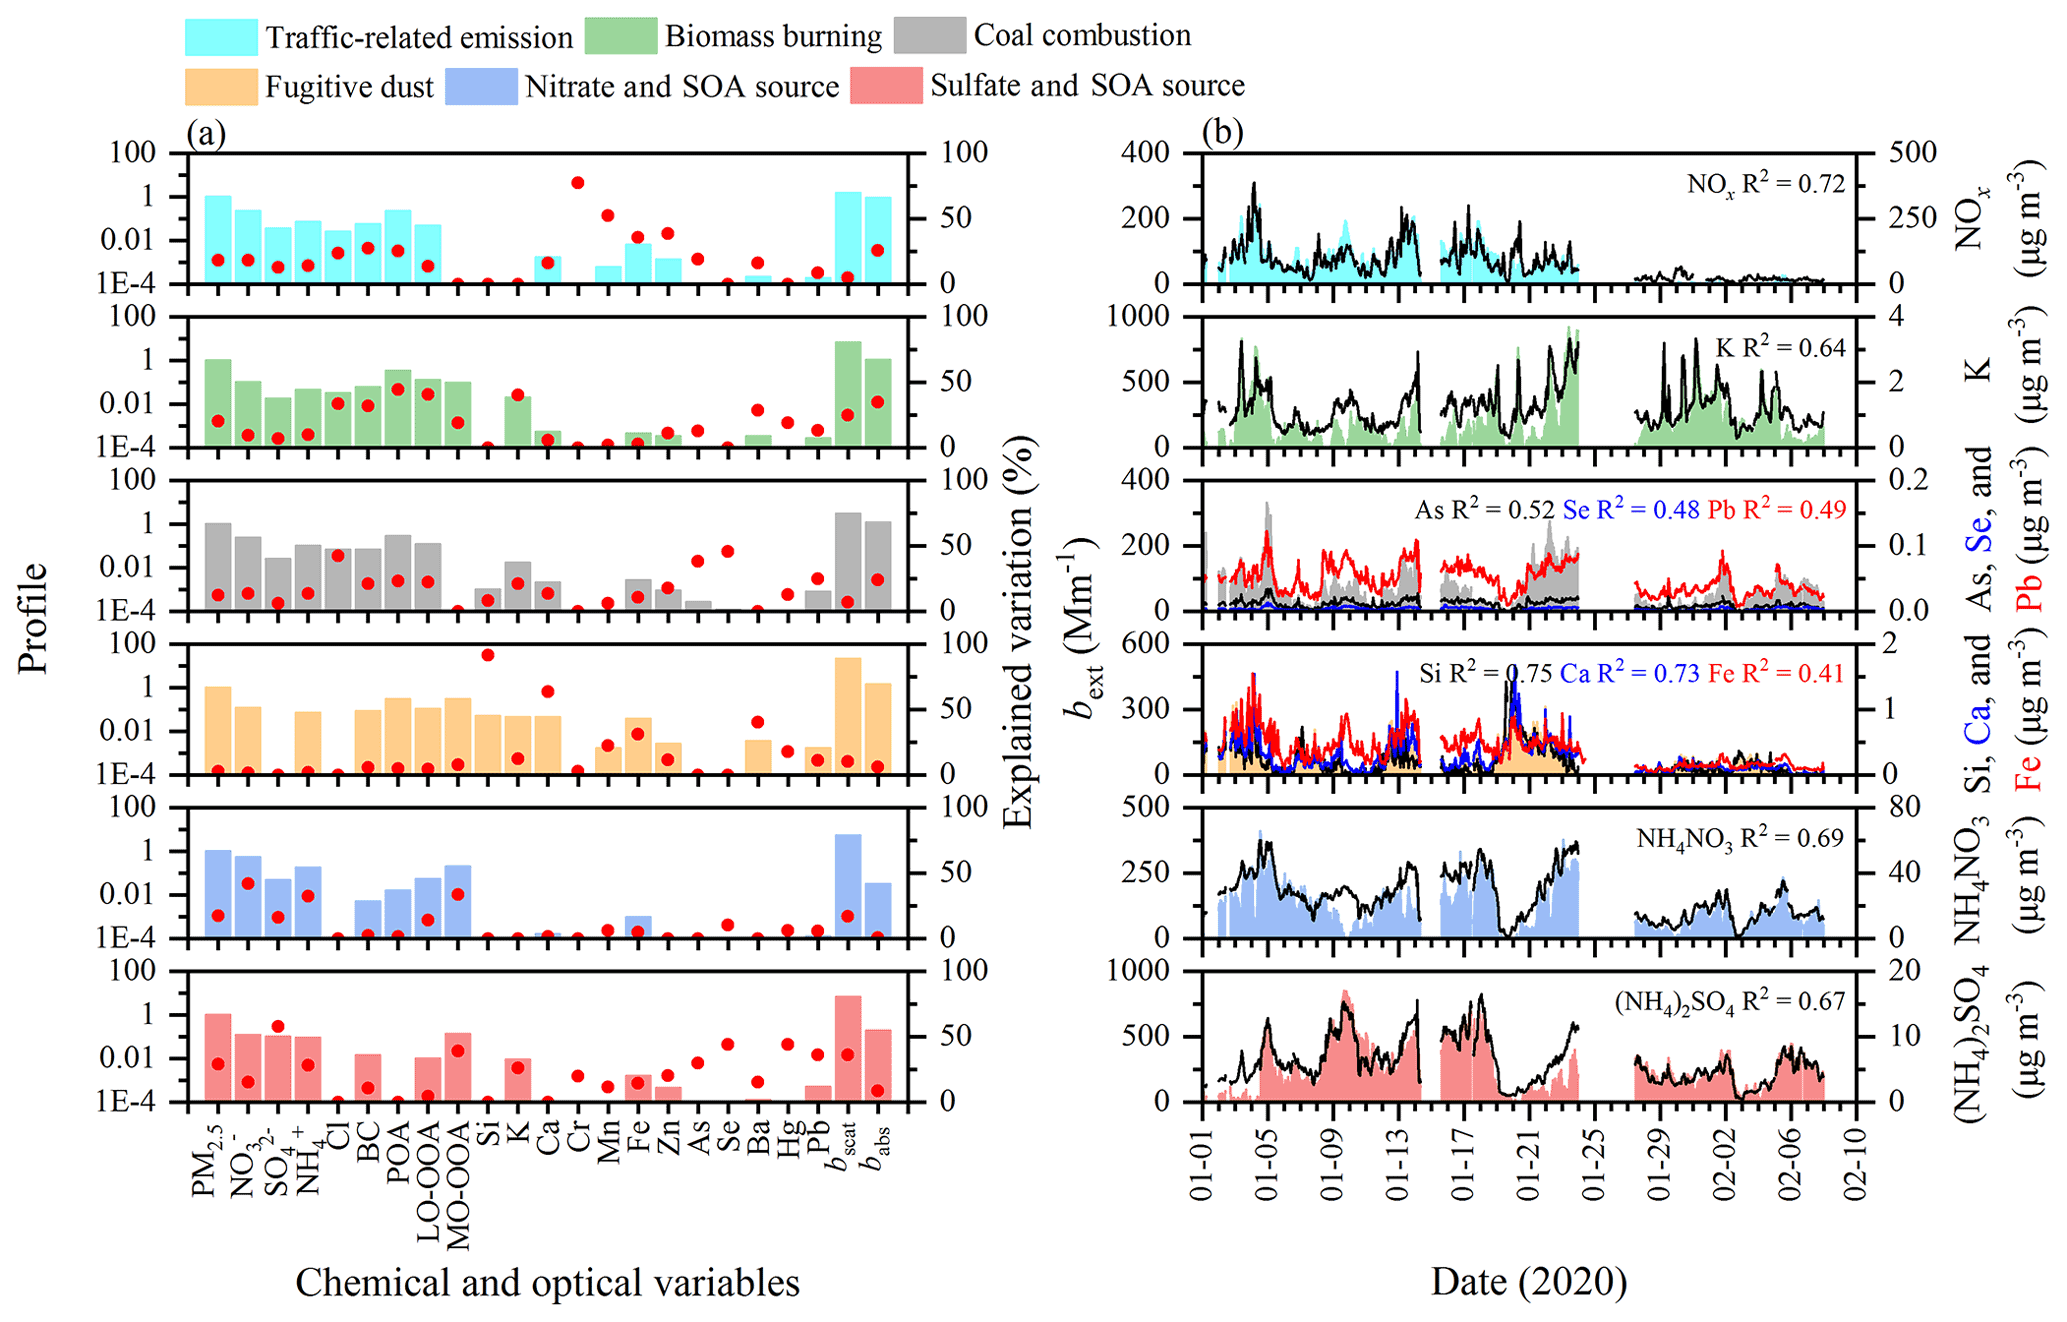
Figure 5(a) Profiles and (b) time series plots of the resolved source factors in the six-factor solution, including traffic-related emissions, biomass burning, coal combustion, fugitive dust, the nitrate and SOA source, and the sulfate and SOA source. The columns in each factor are the profile that displays the relative relation of the absolute values of variables. The red dot represents the explained variation in species for different factors. The corresponding time trends of chemical tracers are also shown.
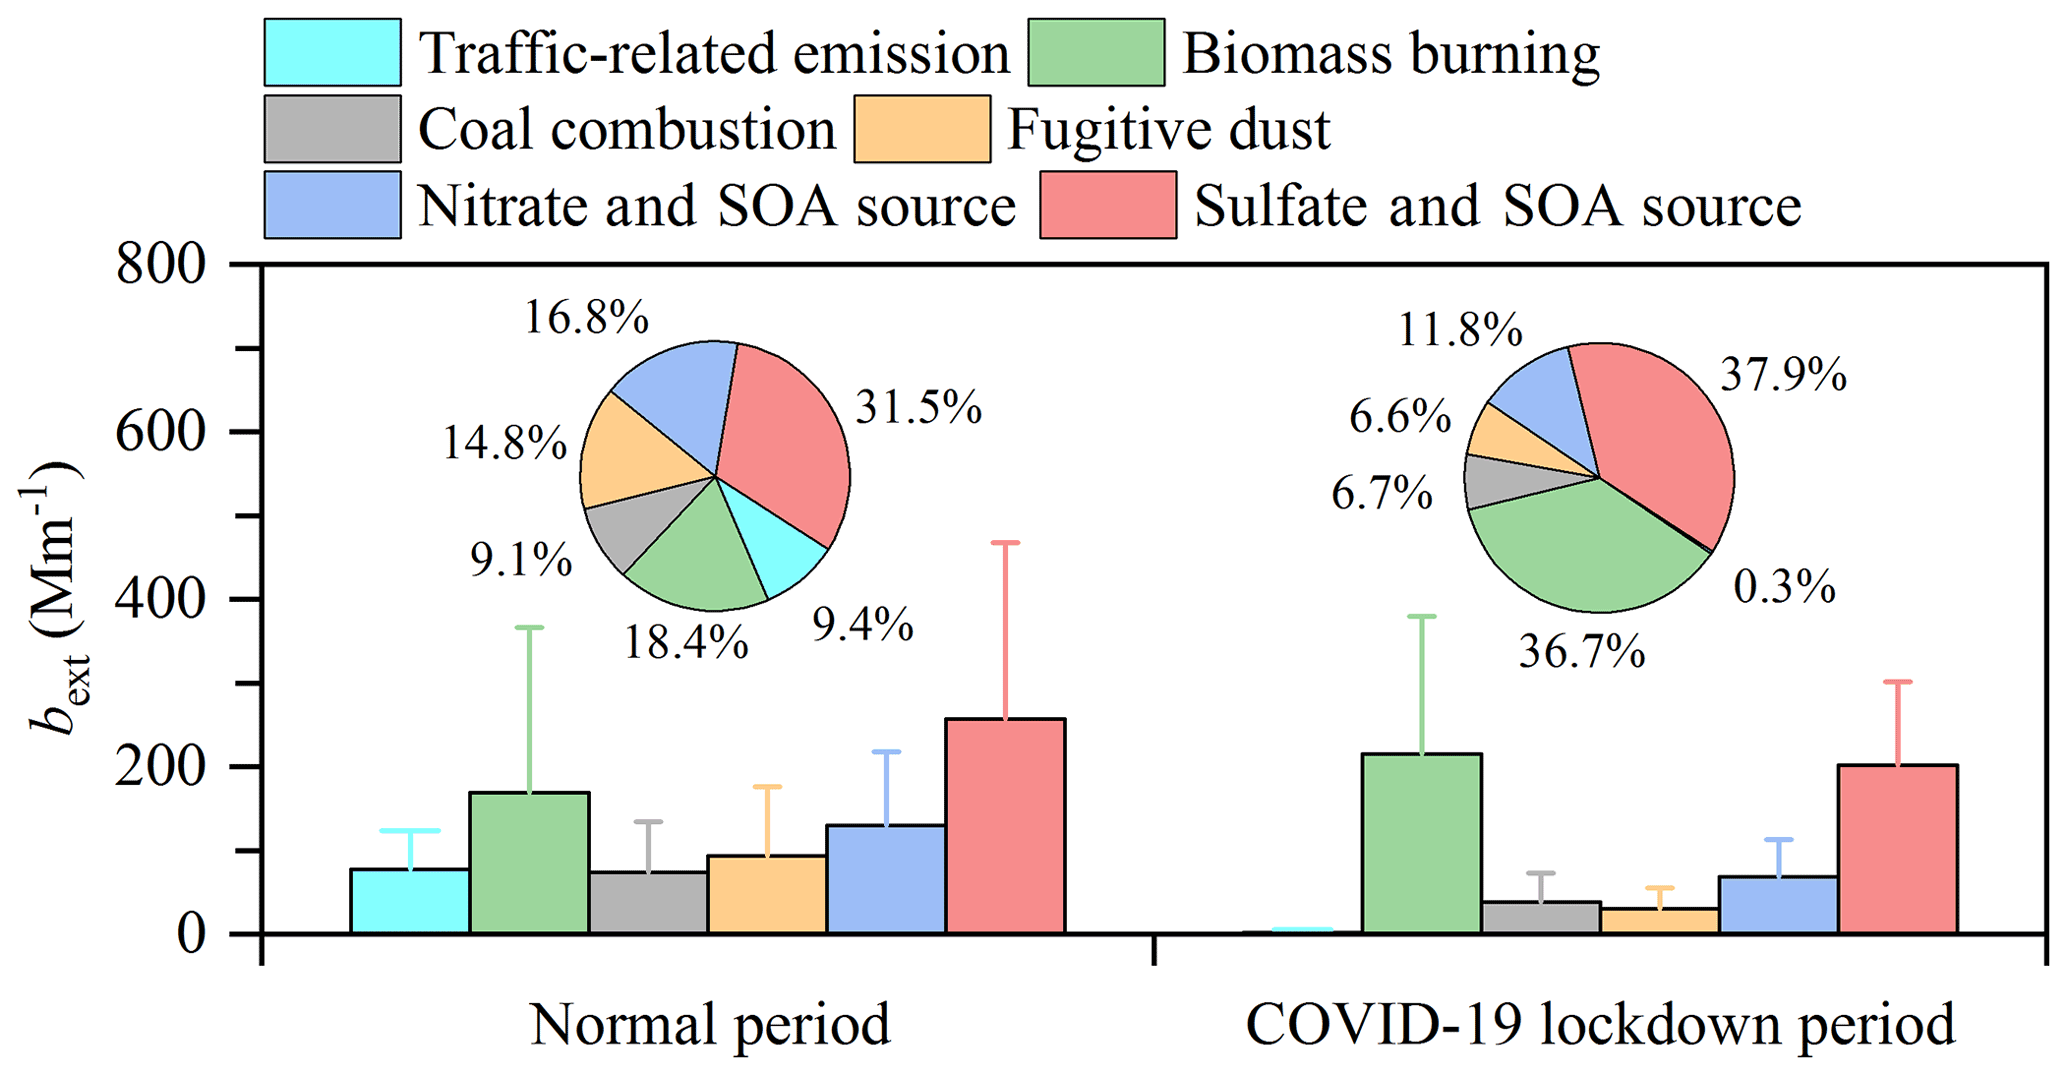
Figure 6Contributions of six resolved sources to the modelled source light extinction coefficient (bext) during the normal and COVID-19 lockdown periods, including traffic-related emissions, biomass burning, coal combustion, fugitive dust, the nitrate and SOA source, and the sulfate and SOA source.
As shown in Fig. 6, the average bext from traffic-related emissions, coal combustion, and fugitive dust decreased from 77.3 ± 46.8, 73.6 ± 60.9, and 93.3 ± 82.7 Mm−1 during the normal period to 1.7 ± 4.0, 38.5 ± 34.5, and 30.8 ± 24.4 Mm−1 during the lockdown period respectively, which can be explained by traffic restriction, the closure of industry, and the cessation of construction activities. The fact that bext from traffic-related emissions showed the largest reduction (97.9 %) emphasised the effectiveness of controlling private gasoline cars and commercial and construction diesel trucks during the lockdown (Y. C. Wang et al., 2020). For the two secondary sources, although previous studies have reported an enhancement of secondary aerosol formation efficiencies due to an increase in the atmospheric oxidation capacity during the lockdown (Huang et al., 2020; Le et al., 2020; Tian et al., 2021), the decreases in gas and organic precursors (e.g. NO2, SO2, and volatile organic compounds) led to 47.5 % and 21.4 % reductions in bext from the nitrate and SOA and the sulfate and SOA sources respectively. Hence, the enhanced secondary aerosol cannot offset the primary emission reduction in Xi'an, thereby confirming that reducing anthropogenic primary emissions is still the most effective treatment of aerosol pollution.
By contrast, the average bext from biomass burning during the lockdown period (215.4 ± 163.9 Mm−1) was higher than that during the normal period (169.4 ± 196.9 Mm−1). The government did not strengthen the existing control policies that forbade biomass burning during the lockdown. Moreover, strict controls were enforced on the movements of people, even in the countryside, possibly resulting in a higher consumption of biomass for cooking and heating. As shown in Fig. 7, the rising stages of PM2.5 during the lockdown period were all accompanied by an increase in bext from biomass burning, accounting for 46.4 %–55.6 % of the total bext. Using the rising stage of PM2.5 from 13:00 CST on 30 January to 07:00 CST on 31 January as an example, bext from POA and LO-OOA increased rapidly at rates of 8.6 and 8.2 Mm−1 h−1 respectively. Correspondingly, bext from biomass burning showed the fastest rise (26.0 Mm−1 h−1) of all primary sources, which led to biomass burning becoming the most important source of bext (36.7 %) during the lockdown (Fig. 6). Hence, additional actions and investigations with respect to biomass burning emissions should be taken into consideration.
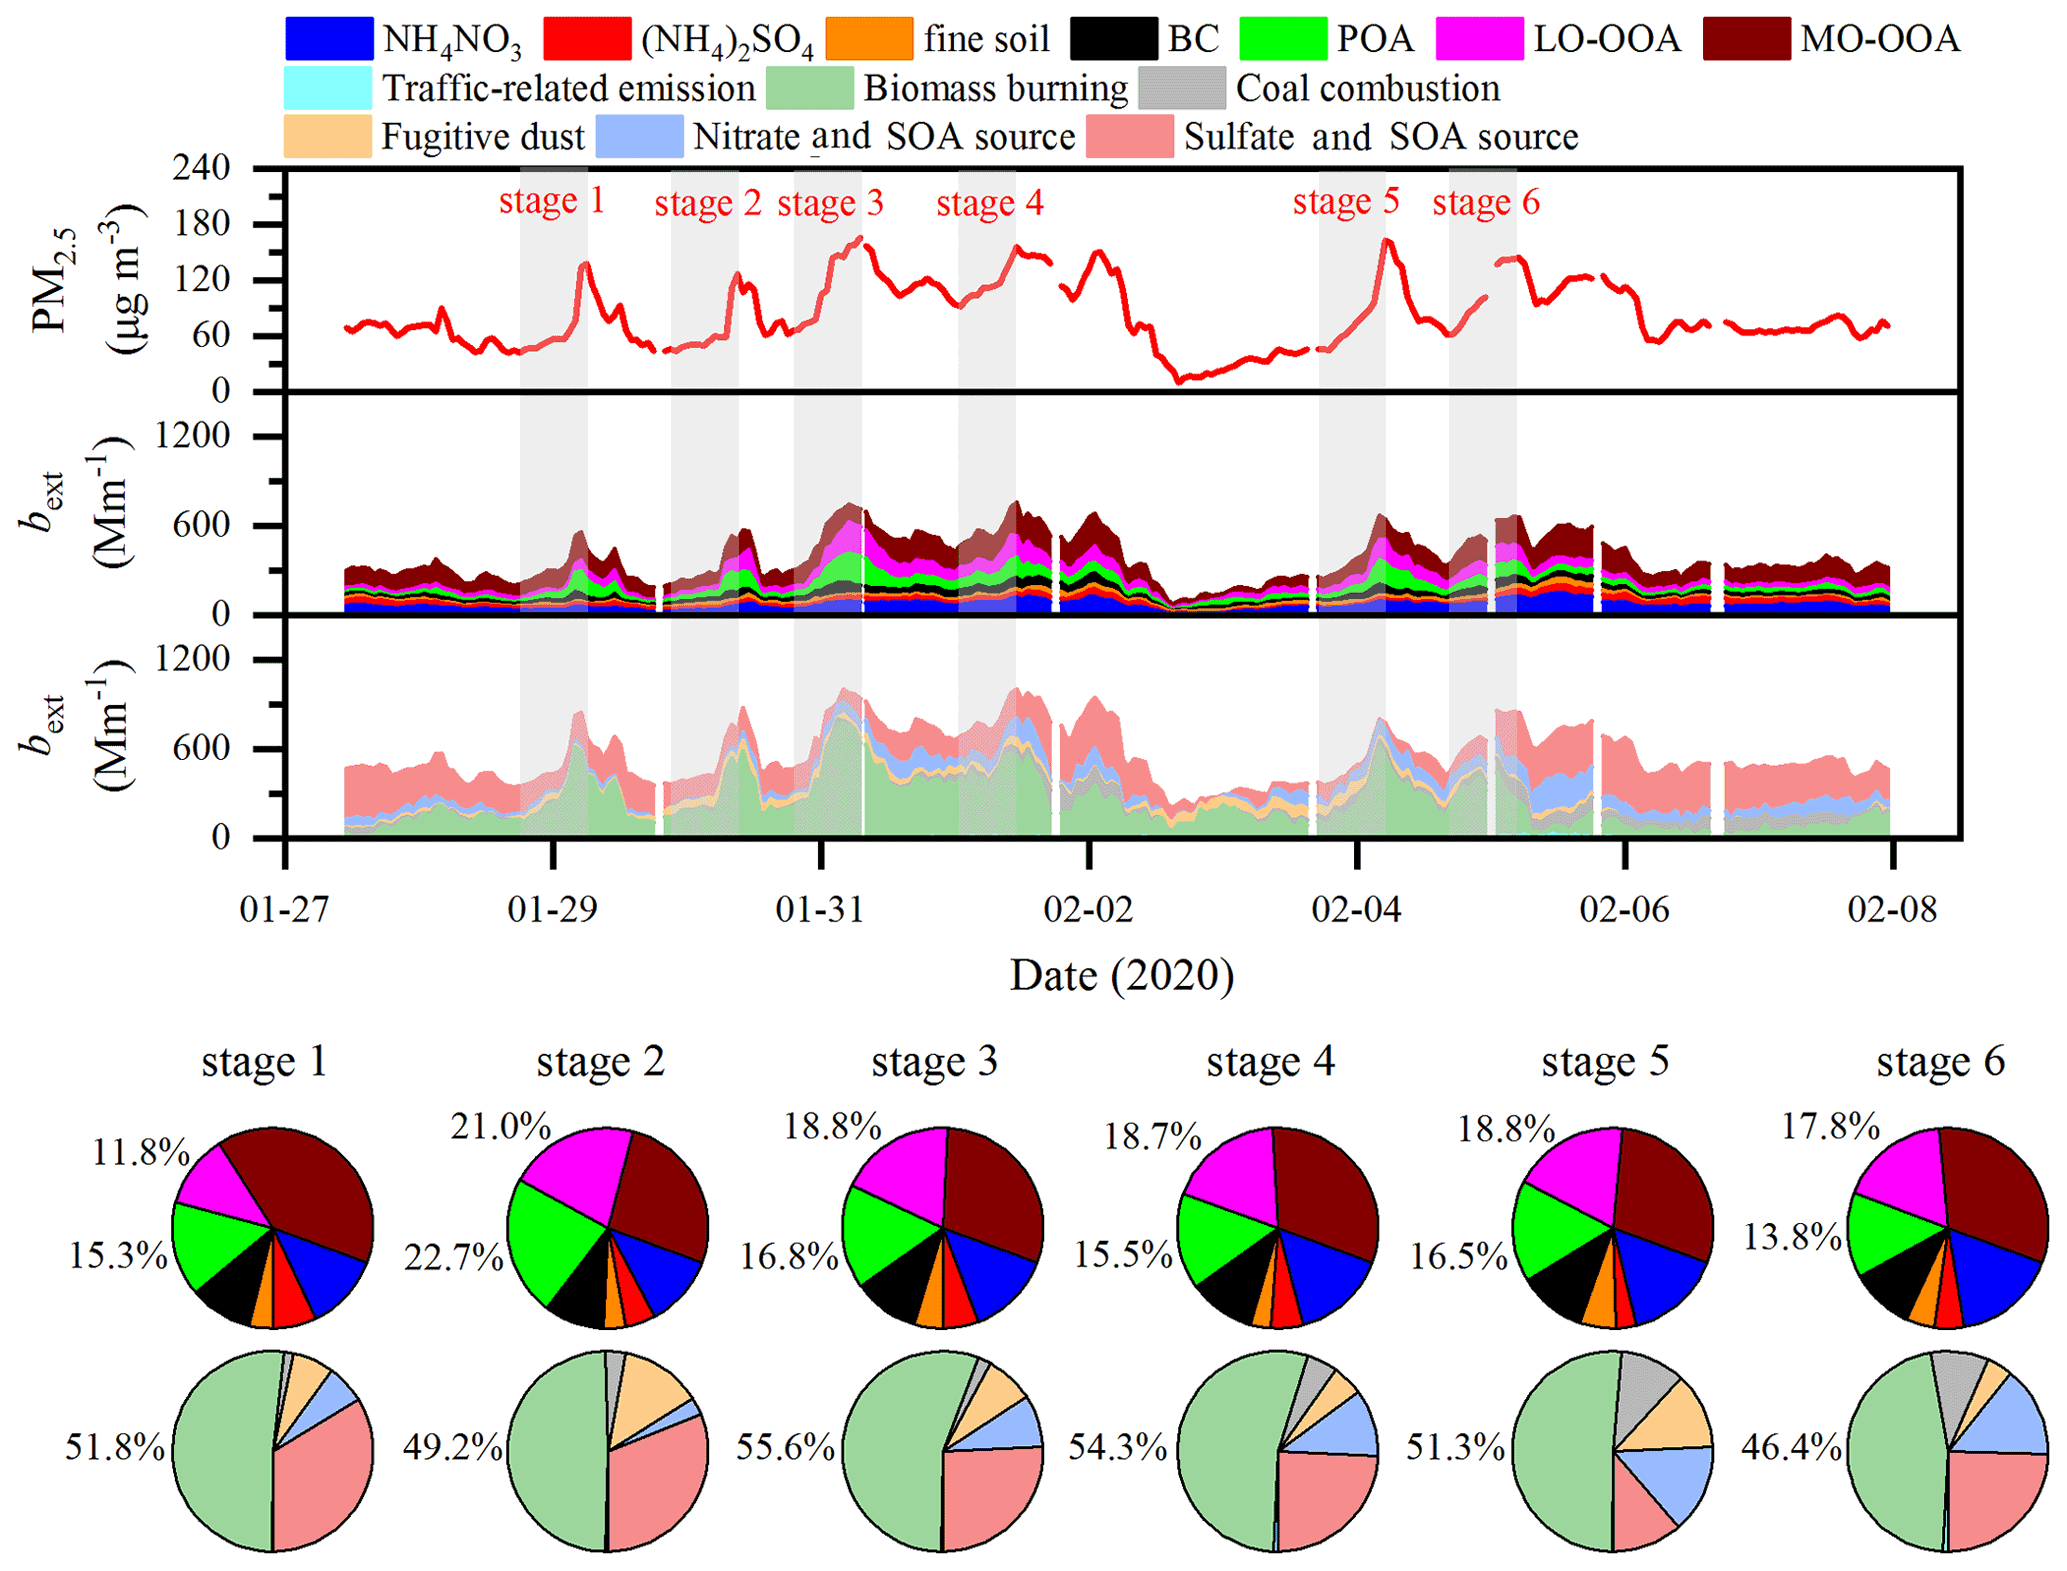
Figure 7Time series of the PM2.5 mass concentration, the light extinction coefficient (bext) of chemical species, and the bext from six resolved sources during the lockdown period. The pie charts depict the average fractional contributions of chemical species and sources to bext during the PM2.5 rising stages, which are marked in light grey in the time series.
3.5 Impacts of the COVID-19 lockdown on aerosol DRE
Figure 8 shows the range of source-specific aerosol DREtop, DREsurface, and DREatmosphere during the normal and lockdown periods. For all sources, the aerosol DREatmosphere values in both periods were positive, producing net warming effects in the atmosphere. The mean aerosol DREatmosphere decreased from 31.0 ± 23.2 W m−2 before the lockdown to 14.1 ± 11.5 W m−2 during the lockdown, with a reduction of 54.5 %. This can be explained by the reduced aerosol concentration and increased SSA (Liu et al., 2020).
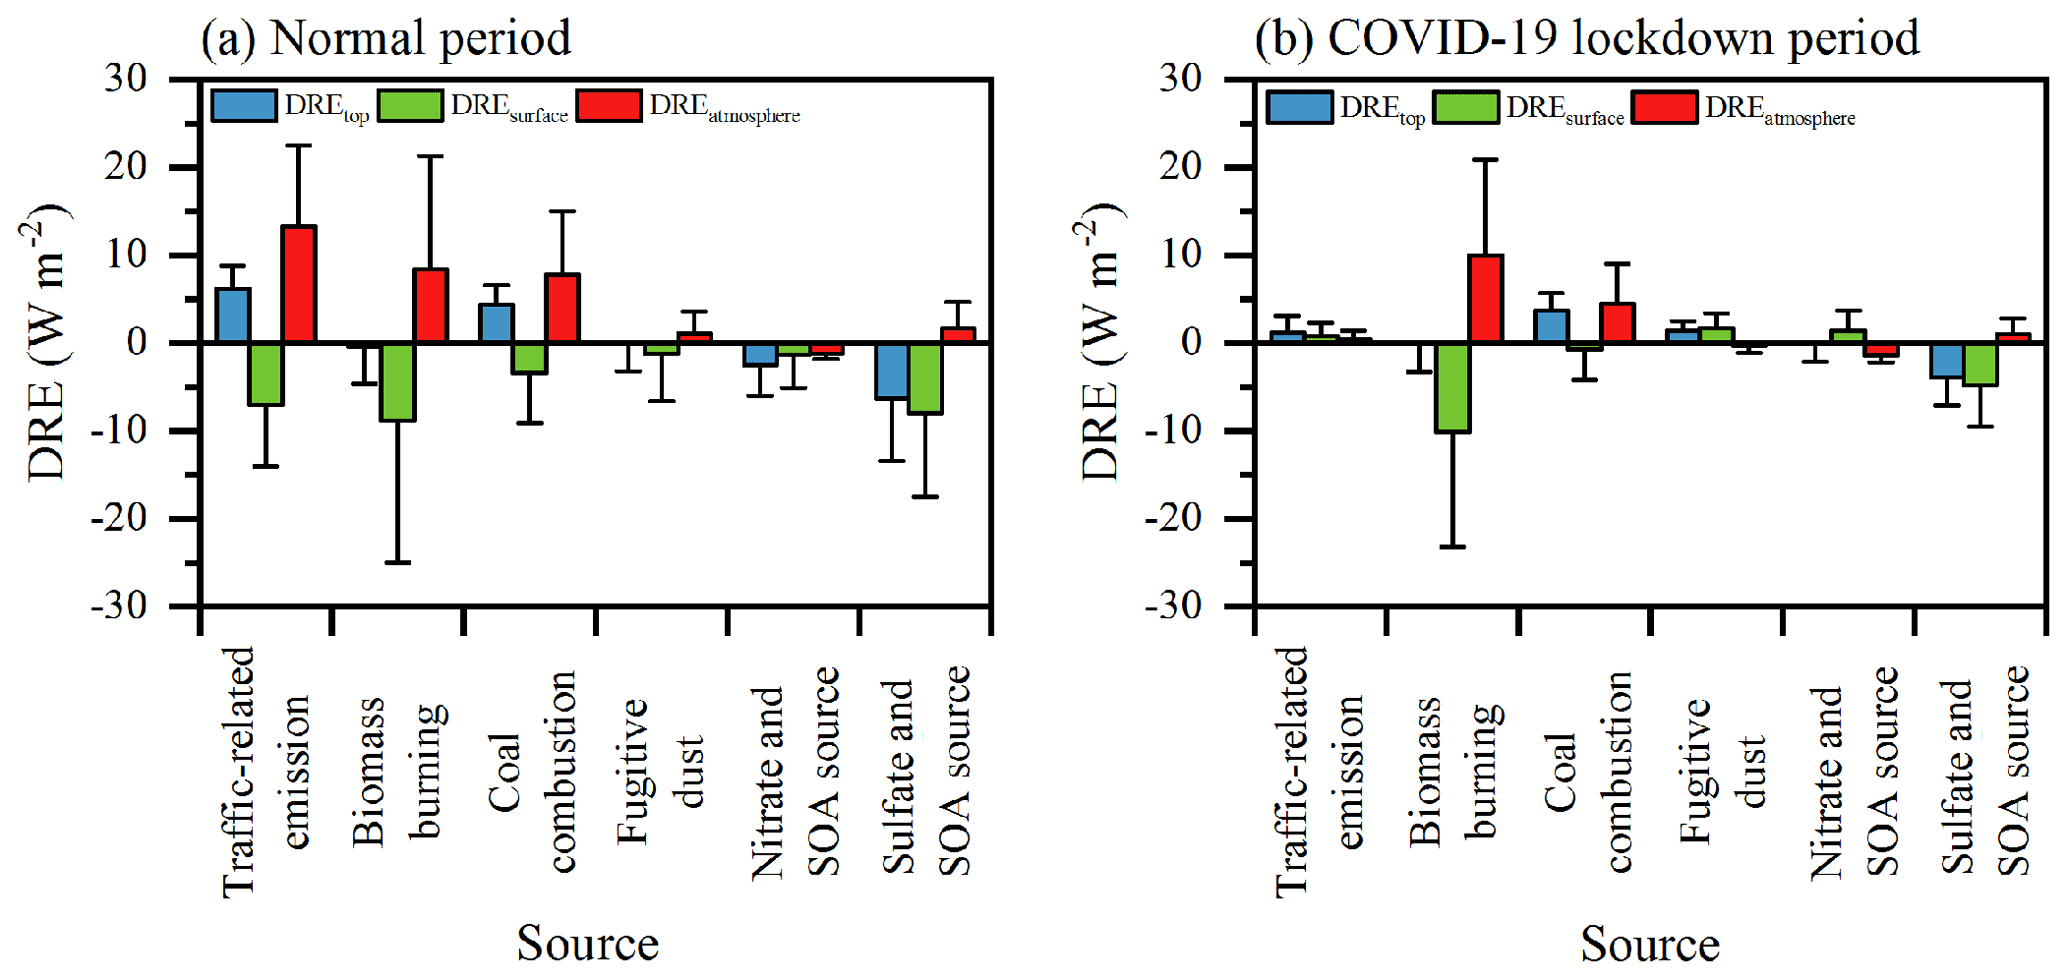
Figure 8Direct radiative effect (DRE) of aerosol from traffic-related emissions, biomass burning, coal combustion, fugitive dust, the nitrate and SOA source, and the sulfate and SOA source at the Earth's surface, the top of the atmosphere, and in the atmosphere during the normal (a) and COVID-19 lockdown (b) periods.
With respect to the contributions of specific sources to the DREatmosphere, traffic-related emissions had the largest positive effect on DREatmosphere during the normal period, with a value of 13.3±9.2 W m−2, followed by biomass burning (8.4 ± 13.0 W m−2), coal combustion (7.8 ± 7.2 W m−2), the sulfate and SOA source (1.7 ± 3.0 W m−2), and fugitive dust (1.1 ± 2.4 W m−2). The nitrate and SOA source presented a negative DREatmosphere value (−1.2 ± 0.7 W m−2), suggesting a cooling effect in the atmosphere. Due to the strictest traffic restrictions implemented, the DREatmosphere from traffic-related emissions (0.4 ± 1.0 W m−2) showed a significant reduction (97.0 %) in the lockdown. However, the DREatmosphere from biomass burning increased to 10.0 ± 10.9 W m−2, indicating that biomass burning was not effectively controlled during the lockdown period. The other four sources contributed relatively small amounts of DREatmosphere: 4.5 ± 4.5 W m−2 for coal combustion, −0.3 ± 0.8 W m−2 for fugitive dust, −1.4 ± 0.8 W m−2 for the nitrate and SOA source, and 1.0 ± 1.8 W m−2 for the sulfate and SOA source. Similar to Xi'an city, the pollution sources of traffic and biomass burning were the two most significant anthropogenic sources of aerosol in most Chinese cities, such as Chengdu, Guangzhou, Jinan, and Tianjin. (Cheng et al., 2021; Huang et al., 2018; Khan et al., 2021; L. L. Li et al., 2017). The results in this study indicated that the control measures on traffic during the lockdown were highly effective for mitigating the effects of climate change in the short term, while future emission control policies should consider the importance of biomass burning to tackle climate change in China.
This study conducted an intensive real-time measurement campaign in an urban city in China before and during the COVID-19 lockdown in order to investigate the impacts of anthropogenic emissions on aerosol optical properties and the direct radiative effect (DRE). Decreases in the light scattering coefficient (bscat), light absorption coefficient (babs), and light extinction coefficient (bext) were observed during the lockdown, with reductions of 27.6 %–47.0 %, in accordance with the decline in PM2.5 due to strict emission control measures. Single-scattering albedo during the lockdown period (0.92 ± 0.02) was higher than that during the normal period (0.89 ± 0.03), suggesting an enhanced role of secondary formation during the lockdown. A generalised additive model analysis showed that meteorological conditions enhanced bext by 68.8 Mm−1 during the lockdown period; thus, the dramatic reduction of bext was credited to anthropogenic emission reductions.
The relationship between bext and chemical components was established based on a ridge regression analysis. Using the estimated mass scattering and absorption efficiencies (MSEs and MAEs respectively) of chemical components, OA (including primary OA as well as less- and more-oxidised oxygenated OA) was found to be the largest contributor (45.1 %–61.4 %) to bext before and during the lockdown period, followed by NH4NO3 (16.5 %–24.1 %), BC (9.3 %–13.1 %), (NH4)2SO4 (7.9 %–11.2 %), and fine soil (4.9 %–6.5 %). Particularly, secondary OA played an increasingly important role in light extinction during the lockdown, as the contributions of two oxygenated OAs to bext increased by 3.0 %–14.6 % during this time.
A hybrid environmental receptor model coupled with chemical and optical variables was utilised to carry out optical source apportionment. Six sources of bext were resolved, including traffic-related emissions, biomass burning, coal combustion, fugitive dust, the nitrate and SOA source, and the sulfate and SOA source. Most sources showed reductions in bext (21.4 %–97.9 %) during the lockdown, confirming the effectiveness of reducing anthropogenic primary emissions for treating aerosol pollution. bext from traffic-related emissions had the most evident decrement (97.9 %), whereas that from biomass burning increased by 27.1 % during the lockdown due to the undiminished need for residential cooking and heating in winter.
The atmospheric radiative transfer further illustrated that aerosol produced net warming effects (14.1–31.0 W m−2) in the atmosphere during the normal and lockdown periods. Biomass burning, rather than traffic-related emissions, became the largest positive effect (10.0 ± 10.9 W m−2) on aerosol DRE in the atmosphere during the lockdown. The results imply that reducing biomass burning would be another direct and effective way of mitigating climate change, besides traffic restriction; therefore, the Chinese government should further tighten the policy on biomass burning in the future.
The data used to support the findings of this study are archived at the Institute of Earth Environment, Chinese Academy of Sciences: https://doi.org/10.5281/zenodo.6457841 (Tian et al., 2022).
The supplement related to this article is available online at: https://doi.org/10.5194/acp-22-8369-2022-supplement.
QW, YH, and JC designed the campaign; SL, YZ, and WR conducted field measurements; JT, HL, and YM carried out the data analysis and interpretation; and JT wrote the paper with contributions from all co-authors.
The contact author has declared that none of the authors has any competing interests.
Publisher's note: Copernicus Publications remains neutral with regard to jurisdictional claims in published maps and institutional affiliations.
The authors are grateful to the staff of the National Observation and Research Station of Regional Ecological Environment Change and Comprehensive Management in the Guanzhong Plain, Shaanxi, for their assistance with field sampling.
This research was jointly supported by the Key Research and Development Program of Shaanxi Province (grant no. 2018-ZDXM3-01), the Strategic Priority Research Program of Chinese Academy of Sciences (grant no. XDB40000000), the West Light Foundation of the Chinese Academy of Sciences (grant no. XAB2019B05), the Sino-Swiss Cooperation on Air Pollution Source Apportionment for Better Air (grant no. 7F-09802.01.02), and the Youth Innovation Promotion Association of the Chinese Academy of Sciences (grant nos. 2019402 and 2022416).
This paper was edited by Eduardo Landulfo and reviewed by Tiantao Cheng and three anonymous referees.
Ålander, T., Antikainen, E., Raunemaa, T., Elonen, E., Rautiola, A., and Torkkell, K.: Particle emissions from a small two-stroke engine: Effects of fuel, lubricating oil, and exhaust aftertreatment on particle characteristics, Aerosol Sci. Tech., 39, 151–161, https://doi.org/10.1080/027868290910224, 2005.
Andreae, M. O. and Gelencsér, A.: Black carbon or brown carbon? The nature of light-absorbing carbonaceous aerosols, Atmos. Chem. Phys., 6, 3131–3148, https://doi.org/10.5194/acp-6-3131-2006, 2006.
Bellouin, N., Quaas, J., Morcrette, J.-J., and Boucher, O.: Estimates of aerosol radiative forcing from the MACC re-analysis, Atmos. Chem. Phys., 13, 2045–2062, https://doi.org/10.5194/acp-13-2045-2013, 2013.
Cao, J. J., Wang, Q. Y., Chow, J. C., Watson, J. G., Tie, X. X., Shen, Z. X., Wang, P., and An, Z. S.: Impacts of aerosol compositions on visibility impairment in Xi'an, China, Atmos. Environ., 59, 559–566, https://doi.org/10.1016/j.atmosenv.2012.05.036, 2012.
Chamberlain-Ward, S. and Sharp, F.: Advances in Nephelometry through the Ecotech Aurora Nephelometer, Sci. World J., 11, 2530–2535, https://doi.org/10.1100/2011/310769, 2011.
Chen, L. W. and Cao, J.: PM2.5 source apportionment using a Hybrid Environmental Receptor Model, Environ. Sci. Technol., 52, 6357–6369, https://doi.org/10.1021/acs.est.8b00131, 2018.
Chen, Y., Zhang, S. M., Peng, C., Shi, G. M., Tian, M., Huang, R. J., Guo, D. M., Wang, H. B., Yao, X. J., and Yang, F. M.: Impact of the COVID-19 pandemic and control measures on air quality and aerosol light absorption in southwestern China, Sci. Total Environ., 749, 141419, https://doi.org/10.1016/j.scitotenv.2020.141419, 2020.
Cheng, M. T., Tang, G. Q., Lv, B., Li, X. R., Wu, X. R., Wang, Y. M., and Wang, Y. S.: Source apportionment of PM2.5 and visibility in Jinan, China, J. Environ. Sci., 102, 207–215, https://doi.org/10.1016/j.jes.2020.09.012, 2021.
Cheng, Z., Jiang, J. K., Chen, C. H., Gao, J., Wang, S. X., Watson, J. G., Wang, H. L., Deng, J. G., Wang, B. Y., Zhou, M., Chow, J. C., Pitchford, M. L., and Hao, J. M.: Estimation of aerosol mass scattering efficiencies under high mass loading: Case study for the megacity of Shanghai, China, Environ. Sci. Technol., 49, 831–838, https://doi.org/10.1021/es504567q, 2015.
Chow, J. C., Watson, J. G., Kuhns, H., Etyemezian, V., Lowenthal, D. H., Crow, D., Kohl, S. D., Engelbrecht, J. P., and Green, M. C.: Source profiles for industrial, mobile, and area sources in the Big Bend Regional Aerosol Visibility and Observational study, Chemosphere, 54, 185–208, https://doi.org/10.1016/j.chemosphere.2003.07.004, 2004.
Chow, J. C., Lowenthal, D. H., Chen, L. W. A., Wang, X. L., and Watson, J. G.: Mass reconstruction methods for PM2.5: a review, Air Qual. Atmos. Hlth., 8, 243–263, https://doi.org/10.1007/s11869-015-0338-3, 2015.
CNEMC (China National Environmental Monitoring Centre): Background values of soil elements in China, edited by: Wu, S. D., Chinese Environmental Press, Beijing, ISBN 7-80010-772-8/X⋅417, 1990 (in Chinese).
Crippa, M., DeCarlo, P. F., Slowik, J. G., Mohr, C., Heringa, M. F., Chirico, R., Poulain, L., Freutel, F., Sciare, J., Cozic, J., Di Marco, C. F., Elsasser, M., Nicolas, J. B., Marchand, N., Abidi, E., Wiedensohler, A., Drewnick, F., Schneider, J., Borrmann, S., Nemitz, E., Zimmermann, R., Jaffrezo, J.-L., Prévôt, A. S. H., and Baltensperger, U.: Wintertime aerosol chemical composition and source apportionment of the organic fraction in the metropolitan area of Paris, Atmos. Chem. Phys., 13, 961–981, https://doi.org/10.5194/acp-13-961-2013, 2013.
Cubison, M. J., Ortega, A. M., Hayes, P. L., Farmer, D. K., Day, D., Lechner, M. J., Brune, W. H., Apel, E., Diskin, G. S., Fisher, J. A., Fuelberg, H. E., Hecobian, A., Knapp, D. J., Mikoviny, T., Riemer, D., Sachse, G. W., Sessions, W., Weber, R. J., Weinheimer, A. J., Wisthaler, A., and Jimenez, J. L.: Effects of aging on organic aerosol from open biomass burning smoke in aircraft and laboratory studies, Atmos. Chem. Phys., 11, 12049–12064, https://doi.org/10.5194/acp-11-12049-2011, 2011.
Deng, J. J., Zhang, Y. R., Hong, Y. W., Xu, L. L., Chen, Y. T., Du, W. J., and Chen, J. S.: Optical properties of PM2.5 and the impacts of chemical compositions in the coastal city Xiamen in China, Sci. Total Environ., 557–558, 665–675, https://doi.org/10.1016/j.scitotenv.2016.03.143, 2016.
Drinovec, L., Močnik, G., Zotter, P., Prévôt, A. S. H., Ruckstuhl, C., Coz, E., Rupakheti, M., Sciare, J., Müller, T., Wiedensohler, A., and Hansen, A. D. A.: The “dual-spot” Aethalometer: an improved measurement of aerosol black carbon with real-time loading compensation, Atmos. Meas. Tech., 8, 1965–1979, https://doi.org/10.5194/amt-8-1965-2015, 2015.
Feng, Y., Ramanathan, V., and Kotamarthi, V. R.: Brown carbon: a significant atmospheric absorber of solar radiation?, Atmos. Chem. Phys., 13, 8607–8621, https://doi.org/10.5194/acp-13-8607-2013, 2013.
Forello, A. C., Bernardoni, V., Calzolai, G., Lucarelli, F., Massabò, D., Nava, S., Pileci, R. E., Prati, P., Valentini, S., Valli, G., and Vecchi, R.: Exploiting multi-wavelength aerosol absorption coefficients in a multi-time resolution source apportionment study to retrieve source-dependent absorption parameters, Atmos. Chem. Phys., 19, 11235–11252, https://doi.org/10.5194/acp-19-11235-2019, 2019.
Furger, M., Rai, P., Slowik, J. G., Cao, J. J., Visser, S., Baltensperger, U., and Prévôt, A. S. H.: Automated alternating sampling of PM10 and PM2.5 with an online XRF spectrometer, Atmos. Environ. X, 5, 100065, https://doi.org/10.1016/j.aeaoa.2020.100065, 2020.
Geivanidis, S., Pistikopoulos, P., and Samaras, Z.: Effect on exhaust emissions by the use of methylcyclopentadienyl manganese tricarbonyl (MMT) fuel additive and other lead replacement gasolines, Sci. Total Environ., 305, 129–141, https://doi.org/10.1016/S0048-9697(02)00476-X, 2003.
Hallquist, M., Wenger, J. C., Baltensperger, U., Rudich, Y., Simpson, D., Claeys, M., Dommen, J., Donahue, N. M., George, C., Goldstein, A. H., Hamilton, J. F., Herrmann, H., Hoffmann, T., Iinuma, Y., Jang, M., Jenkin, M. E., Jimenez, J. L., Kiendler-Scharr, A., Maenhaut, W., McFiggans, G., Mentel, Th. F., Monod, A., Prévôt, A. S. H., Seinfeld, J. H., Surratt, J. D., Szmigielski, R., and Wildt, J.: The formation, properties and impact of secondary organic aerosol: current and emerging issues, Atmos. Chem. Phys., 9, 5155–5236, https://doi.org/10.5194/acp-9-5155-2009, 2009.
Han, T. T., Xu, W. Q., Chen, C., Liu, X. G., Wang, Q. Q., Li, J., Zhao, X. J., Du, W., Wang, Z. F., and Sun, Y. L.: Chemical apportionment of aerosol optical properties during the Asia-Pacific Economic Cooperation summit in Beijing, China, J. Geophys. Res.-Atmos., 120, 12281–12295, https://doi.org/10.1002/2015JD023918, 2015.
Herich, H., Hueglin, C., and Buchmann, B.: A 2.5 year's source apportionment study of black carbon from wood burning and fossil fuel combustion at urban and rural sites in Switzerland, Atmos. Meas. Tech., 4, 1409–1420, https://doi.org/10.5194/amt-4-1409-2011, 2011.
Hess, M., Koepke, P., and Schult, I.: Optical properties of aerosols and clouds: The software package OPAC, B. Am. Meteorol. Soc., 79, 831–844, https://doi.org/10.1175/1520-0477(1998)079<0831:OPOAAC>2.0.CO;2, 1998.
Hu, W., Hu, M., Hu, W.-W., Zheng, J., Chen, C., Wu, Y., and Guo, S.: Seasonal variations in high time-resolved chemical compositions, sources, and evolution of atmospheric submicron aerosols in the megacity Beijing, Atmos. Chem. Phys., 17, 9979–10000, https://doi.org/10.5194/acp-17-9979-2017, 2017.
Hu, W. W., Hu, M., Hu, W., Jimenez, J. L., Yuan, B., Chen, W. T., Wang, M., Wu, Y. S., Chen, C., Wang, Z. B., Peng, J. F., Zeng, L. M., and Shao, M.: Chemical composition, sources, and aging process of submicron aerosols in Beijing: Contrast between summer and winter, J. Geophys. Res.-Atmos., 121, 1955–1977, https://doi.org/10.1002/2015JD024020, 2016.
Huang, X., Liu, Z., Liu, J., Hu, B., Wen, T., Tang, G., Zhang, J., Wu, F., Ji, D., Wang, L., and Wang, Y.: Chemical characterization and source identification of PM2.5 at multiple sites in the Beijing–Tianjin–Hebei region, China, Atmos. Chem. Phys., 17, 12941–12962, https://doi.org/10.5194/acp-17-12941-2017, 2017.
Huang, X., Ding, A. J., Gao, J., Zheng, B., Zhou, D. R., Qi, X. M., Tang, R., Wang, J. P., Ren, C. H., Nie, W., Chi, X. G., Xu, Z., Chen, L. D., Li, Y. Y., Che, F., Pang, N. N., Wang, H. K., Tong, D., Qin, W., Cheng, W., Liu, W. J., Fu, Q. Y., Liu, B. X., Chai, F., Davis, J. S., Zhang, Q., and He, K. B.: Enhanced secondary pollution offset reduction of primary emissions during COVID-19 lockdown in China, Natl. Sci. Rev., 8, nwaa137, https://doi.org/10.1093/nsr/nwaa137, 2020.
Huang, X.-F., Zou, B.-B., He, L.-Y., Hu, M., Prévôt, A. S. H., and Zhang, Y.-H.: Exploration of PM2.5 sources on the regional scale in the Pearl River Delta based on ME-2 modeling, Atmos. Chem. Phys., 18, 11563–11580, https://doi.org/10.5194/acp-18-11563-2018, 2018.
Ibrahim, S., Landa, M., Pešek, O., Pavelka, K., and Halounova, L.: Space-time machine learning models to analyze COVID-19 pandemic lockdown effects on aerosol optical depth over Europe, Remote Sens., 13, 3027, https://doi.org/10.3390/rs13153027, 2021.
IPCC: Climate change 2013: The physical science basis. Contribution of working group I to the fifth assessment report of the intergovernmental panel on climate change, edited by: Stocker, T. F., Qin, D., Plattner, G.-K., Tignor, M., Allen, S. K., Boschung, J., Nauels, A., Xia, Y., Bex, V., and Midgley, P. M., Cambridge University Press, Cambridge, United Kingdom and New York, NY, USA, 1535 pp., ISBN 978-1-107-66182-0, 2013.
Khan, J. Z., Sun, L., Tian, Y. Z., Shi, G. L., and Feng, Y. C.: Chemical characterization and source apportionment of PM1 and PM2.5 in Tianjin, China: Impacts of biomass burning and primary biogenic sources, J. Environ. Sci., 99, 196–209, https://doi.org/10.1016/j.jes.2020.06.027, 2021.
Kim, H., Zhang, Q., Bae, G.-N., Kim, J. Y., and Lee, S. B.: Sources and atmospheric processing of winter aerosols in Seoul, Korea: insights from real-time measurements using a high-resolution aerosol mass spectrometer, Atmos. Chem. Phys., 17, 2009–2033, https://doi.org/10.5194/acp-17-2009-2017, 2017.
Kirchstetter, T. W., Novakov, T., and Hobbs, P. V.: Evidence that the spectral dependence of light absorption by aerosols is affected by organic carbon, J. Geophys. Res.-Atmos., 109, D21208, https://doi.org/10.1029/2004JD004999, 2004.
Kumar, D., Singh, A. K., Kumar, V., Poyoja, R., Ghosh, A., and Singh, B.: COVID-19 driven changes in the air quality; a study of major cities in the Indian state of Uttar Pradesh, Environ. Pollut., 274, 116512, https://doi.org/10.1016/j.envpol.2021.116512, 2021.
Laskin, A., Laskin, J., and Nizkorodov, S. A.: Chemistry of atmospheric brown carbon, Chem. Rev., 115, 10, 4335–4382, https://doi.org/10.1021/cr5006167, 2015.
Le, T. H., Wang, Y., Liu, L., Yang, J. N., Yung, Y., Li, G. H., and Seinfeld, J. H.: Unexpected air pollution with marked emission reductions during the COVID-19 outbreak in China, Science, 369, 702–706, https://doi.org/10.1126/science.abb7431, 2020.
Lee, H. J., Aiona, P. K., Laskin, A., Laskin, J., and Nizkorodov, S. A.: Effect of solar radiation on the optical properties and molecular composition of laboratory proxies of atmospheric brown carbon, Environ. Sci. Technol., 48, 10217–10226, https://doi.org/10.1021/es502515r, 2014.
Li, H., Zhang, Q., Zhang, Q., Chen, C., Wang, L., Wei, Z., Zhou, S., Parworth, C., Zheng, B., Canonaco, F., Prévôt, A. S. H., Chen, P., Zhang, H., Wallington, T. J., and He, K.: Wintertime aerosol chemistry and haze evolution in an extremely polluted city of the North China Plain: significant contribution from coal and biomass combustion, Atmos. Chem. Phys., 17, 4751–4768, https://doi.org/10.5194/acp-17-4751-2017, 2017.
Li, L., Li, Q., Huang, L., Wang, Q., Zhu, A. S., Xu, J., Liu, Z. Y., Li, H. L., Shi, L. S., Li, R., Azari, M., Wang, Y. J., Zhang, X. J., Liu, Z. Q., Zhu, Y. H., Zhang, K., Xue, S. H., Ooi, M. C. G., Zhang, D. P., and Chan, A.: Air quality changes during the COVID-19 lockdown over the Yangtze River Delta Region: An insight into the impact of human activity pattern changes on air pollution variation, Sci. Total Environ., 732, 139282, https://doi.org/10.1016/j.scitotenv.2020.139282, 2020.
Li, L. L, Tan, Q. W., Zhang, Y. H., Feng, M., Qu, Y., An, J. L., and Liu, X. G.: Characteristics and source apportionment of PM2.5 during persistent extreme haze events in Chengdu, southwest China, Environ. Pollut., 230, 718–729, https://doi.org/10.1016/j.envpol.2017.07.029, 2017.
Li, X. H., Wang, S. X., Duan, L., Hao, J. M., Li, C., Chen, Y. S., and Yang, L.: Particulate and trace gas emissions from open burning of wheat straw and corn stover in China, Environ. Sci. Technol., 41, 6052–6058, https://doi.org/10.1021/es0705137, 2007.
Lin, G. X., Penner, J. E., Flanner, M. G., Sillman, S., Xu, L., and Zhou, C.: Radiative forcing of organic aerosol in the atmosphere and on snow: Effects of SOA and brown carbon, J. Geophys. Res.-Atmos., 119, 7453–7476, https://doi.org/10.1002/2013JD021186, 2014.
Lin, Y. C., Zhang, Y. L., Xie, F., Fan, M. Y., and Liu, X.: Substantial decreases of light absorption, concentrations and relative contributions of fossil fuel to light-absorbing carbonaceous aerosols attributed to the COVID-19 lockdown in east China, Environ. Pollut., 275, 116615, https://doi.org/10.1016/j.envpol.2021.116615, 2021.
Liu, B. S., Wu, J. H., Zhang, J. Y., Wang, L., Yang, J. M., Liang, D. N., Dai, Q. L., Bi, X. H., Feng, Y. C., Zhang, Y. F., and Zhang, Q. X.: Characterization and source apportionment of PM2.5 based on error estimation from EPA PMF 5.0 model at a medium city in China, Environ. Pollut., 222, 10–22, https://doi.org/10.1016/j.envpol.2017.01.005, 2017.
Liu, D. T., Hu, K., Zhao, D. L., Ding, S., Wu, Y. F., Zhou, C., Yu, C. J., Tian, P., Liu, Q., Bi, K., Wu, Y. Z., Hu, B., Ji, D. S., Kong, S. F., Ouyang, B., He, H., Huang, M. Y., and Ding, D. P.: Efficient vertical transport of black carbon in the planetary boundary layer, Geophys. Res. Lett., 47, e2020GL088858, https://doi.org/10.1029/2020GL088858, 2020.
Ma, X., Yu, F., and Luo, G.: Aerosol direct radiative forcing based on GEOS-Chem-APM and uncertainties, Atmos. Chem. Phys., 12, 5563–5581, https://doi.org/10.5194/acp-12-5563-2012, 2012.
Malm, W. C. and Hand, J. L.: An examination of the physical and optical properties of aerosols collected in the IMPROVE program, Atmos. Environ., 41, 3407–3427, https://doi.org/10.1016/j.atmosenv.2006.12.012, 2007.
Moise, T., Flores, J. M., and Rudich, Y.: Optical properties of secondary organic aerosols and their changes by chemical processes, Chem. Rev., 115, 4400–4439, https://doi.org/10.1021/cr5005259, 2015.
Ng, N. L., Herndon, S. C., Trimborn, A., Canagaratna, M. R., Croteau, P. L., Onasch, T. B., Sueper, D., Worsnop, D. R., Zhang, Q., Sun, Y. L., and Jayne, J. T.: An aerosol chemical speciation monitor (ACSM) for routine monitoring of the composition and mass concentrations of ambient aerosol, Aerosol Sci. Tech., 45, 780–794, https://doi.org/10.1080/02786826.2011.560211, 2011.
Ni, H. Y., Tian, J., Wang, X. L., Wang, Q. Y., Han, Y. M., Cao, J. J., Long, X., Chen, L.-W. A., Chow, J. C., and Watson, J. G.: PM2.5 emissions and source profiles from open burning of crop residues, Atmos. Environ., 169, 229–237, https://doi.org/10.1016/j.atmosenv.2017.08.063, 2017.
Niu, X. Y., Cao, J. J., Shen, Z. X., Ho, S. S. H., Tie, X. X., Zhao, S. Y., Xu, H. M., Zhang, T., and Huang, R. J.: PM2.5 from the Guanzhong Plain: Chemical composition and implications for emission reductions, Atmos. Environ., 147, 458–469, https://doi.org/10.1016/j.atmosenv.2016.10.029, 2016.
Norris, G., Duvall, R., Brown, S., and Bai, S.: EPA positive matrix factorization (PMF) 5.0 fundamentals and user guide, U.S. Environmental Protection Agency, Washington, DC, EPA/600/R-14/108 (NTIS PB 2015-105147), https://cfpub.epa.gov/si/si_public_record_report.cfm?Lab=NERL&direntryid=308292 (last access: 26 June 2022), 2014.
Qin, Y. M., Tan, H. B., Li, Y. J., Li, Z. J., Schurman, M. I., Liu, L., Wu, C., and Chan, C. K.: Chemical characteristics of brown carbon in atmospheric particles at a suburban site near Guangzhou, China, Atmos. Chem. Phys., 18, 16409–16418, https://doi.org/10.5194/acp-18-16409-2018, 2018.
Rai, P., Furger, M., Slowik, J. G., Canonaco, F., Fröhlich, R., Hüglin, C., Minguillón, M. C., Petterson, K., Baltensperger, U., and Prévôt, A. S. H.: Source apportionment of highly time-resolved elements during a firework episode from a rural freeway site in Switzerland, Atmos. Chem. Phys., 20, 1657–1674, https://doi.org/10.5194/acp-20-1657-2020, 2020.
Ricchiazzi, P., Yang, S. R., Gautier, C., and Sowle, D.: SBDART: A research and teaching software tool for Plane-parallel radiative transfer in the Earth's atmosphere, B. Am. Meteorol. Soc., 79, 2101–2114, https://doi.org/10.1175/1520-0477(1998)079<2101:SARATS>2.0.CO;2, 1998.
Saarikoski, S., Niemi, J. V., Aurela, M., Pirjola, L., Kousa, A., Rönkkö, T., and Timonen, H.: Sources of black carbon at residential and traffic environments obtained by two source apportionment methods, Atmos. Chem. Phys., 21, 14851–14869, https://doi.org/10.5194/acp-21-14851-2021, 2021.
Sanap, S. D.: Global and regional variations in aerosol loading during COVID-19 imposed lockdown, Atmos. Environ., 246, 118132, https://doi.org/10.1016/j.atmosenv.2020.118132, 2021.
Sandradewi, J., Prévôt, A. S. H., Szidat, S., Perron, N., Alfarra, M. R., Lanz, V. A., Weingartner, E., and Baltensperger, U.: Using aerosol light absorption measurements for the quantitative determination of wood burning and traffic emission contributions to particulate matter, Environ. Sci. Technol., 42, 3316–3323, https://doi.org/10.1021/es702253m, 2008.
Schimek, M. G.: Semiparametric penalized generalized additive models for environmental research and epidemiology, Environmetrics, 20, 699–717, https://doi.org/10.1002/env.972, 2009.
Shen, G. F., Xue, M., Yuan, S. Y., Zhang, J., Zhao, Q. Y., Li, B., Wu, H. S., and Ding, A. J.: Chemical compositions and reconstructed light extinction coefficients of particulate matter in a mega-city in the western Yangtze River Delta, China, Atmos. Environ., 83, 14–20, https://doi.org/10.1016/j.atmosenv.2013.10.055, 2014.
Tan, J. H., Zhang, L. M., Zhou, X. M., Duan, J. C., Li, Y., Hu, J. N., and He, K. B.: Chemical characteristics and source apportionment of PM2.5 in Lanzhou, China, Sci. Total Environ., 601–602, 1743–1752, https://doi.org/10.1016/j.scitotenv.2017.06.050, 2017.
Tao, J., Zhang, L. M., Cao, J., Hsu, S. C., Xia, X. G., Zhang, Z. S., Lin, Z. J., Cheng, T. T., and Zhang, R. J.: Characterization and source apportionment of aerosol light extinction in Chengdu, southwest China, Atmos. Environ., 95, 552–562, https://doi.org/10.1016/j.atmosenv.2014.07.017, 2014.
Tao, J., Zhang, L. M., Gao, J., Wang, H., Chai, F. H., and Wang, S. L: Aerosol chemical composition and light scattering during a winter season in Beijing, Atmos. Environ., 110, 36–44, https://doi.org/10.1016/j.atmosenv.2015.03.037, 2015.
Tao, J., Zhang, L. M., Cao, J. J., Zhong, L. J., Chen, D. S., Yang, Y. H., Chen, D. H., Chen, L. G., Zhang, Z. S., Wu, Y., Xia, Y. J., Ye, S. Q., and Zhang, R. J.: Source apportionment of PM2.5 at urban and suburban areas of the Pearl River Delta region, south China – With emphasis on ship emissions, Sci. Total Environ., 574, 1559–1570, https://doi.org/10.1016/j.scitotenv.2016.08.175, 2017.
Tian, H. Z., Lu, L., Hao, J. M., Gao, J. J., Cheng, K., Liu, K. Y., Qiu, P. P., and Zhu, C. Y.: A review of key hazardous trace elements in Chinese coals: Abundance, occurrence, behavior during coal combustion and their environmental impacts, Energ. Fuel., 27, 601–614, https://doi.org/10.1021/ef3017305, 2013.
Tian, J., Wang, Q. Y., Ni, H. Y., Wang, M., Zhou, Y. Q., Han, Y. M., Shen, Z. X., Pongpiachan, S., Zhang, N. N., Zhao, Z. Z., Zhang, Q., Zhang, Y., Long, X., and Cao, J. J.: Emission characteristics of primary brown carbon absorption from biomass and coal burning: Development of an optical emission inventory for China, J. Geophys. Res.-Atmos., 124, 1879–1893, https://doi.org/10.1029/2018JD029352, 2019.
Tian, J., Wang, Q. Y., Han, Y. M., Ye, J. H., Wang, P., Pongpiachan, S., Ni, H. Y., Zhou, Y. Q., Wang, M., Zhao, Y. Z., and Cao, J. J.: Contributions of aerosol composition and sources to particulate optical properties in a southern coastal city of China, Atmos. Res., 235, 104744, doi10.1016/j.atmosres.2019.104744, 2020.
Tian, J., Wang, Q. Y., Zhang, Y., Yan, M. Y., Liu, H. K., Zhang, N. N., Ran, W. K., and Cao, J. J.: Impacts of primary emissions and secondary aerosol formation on air pollution in an urban area of China during the COVID-19 lockdown, Environ. Int., 150, 106426, https://doi.org/10.1016/j.envint.2021.106426, 2021.
Tian, J., Wang, Q., Liu, H., Ma, Y., Liu, S., Zhang, Y., Ran, W., Han, Y., and Cao, J.: Data for “Measurement report: The importance of biomass burning in light extinction and direct radiative effect of urban aerosol during the COVID-19 lockdown in Xi'an, China”, Zenodo [data set], https://doi.org/10.5281/zenodo.6457841, 2022.
Ulbrich, I. M., Canagaratna, M. R., Zhang, Q., Worsnop, D. R., and Jimenez, J. L.: Interpretation of organic components from Positive Matrix Factorization of aerosol mass spectrometric data, Atmos. Chem. Phys., 9, 2891–2918, https://doi.org/10.5194/acp-9-2891-2009, 2009.
Wang, J. F., Ye, J. H., Zhang, Q., Zhao, J., Wu, Y. Z., Li, J. Y., Liu, D. T., Li, W. J., Zhang, Y. G., Wu, C., Xie, C. H., Qin, Y. M., Lei, Y. L., Huang, X. P., Guo, J. P., Liu, P. F., Fu, P. Q., Li, Y. J., Lee, H. C., Choi, H., Zhang, J., Liao, H., Chen, M. D., Sun, Y. L., Ge, X. L., Martin, S. T., and Jacob, D. J.: Aqueous production of secondary organic aerosol from fossil-fuel emissions in winter Beijing haze, P. Natl. Acad. Sci. USA, 118, e2022179118, https://doi.org/10.1073/pnas.2022179118, 2021.
Wang, P., Cao, J. J., Shen, Z. X., Han, Y. M., Lee, S. C., Huang, Y., Zhu, C. S., Wang, Q. Y., Xu, H. M., and Huang, R. J.: Spatial and seasonal variations of PM2.5 mass and species during 2010 in Xi'an, China, Sci. Total Environ., 508, 477–487, https://doi.org/10.1016/j.scitotenv.2014.11.007, 2015.
Wang, P. F., Chen, K. Y., Zhu, S. Q., Wang, P., and Zhang, H. L.: Severe air pollution events not avoided by reduced anthropogenic activities during COVID-19 outbreak, Resour. Conserv. Recy., 158, 104814, https://doi.org/10.1016/j.resconrec.2020.104814, 2020.
Wang, Q., Liu, H., Wang, P., Dai, W., Zhang, T., Zhao, Y., Tian, J., Zhang, W., Han, Y., and Cao, J.: Optical source apportionment and radiative effect of light-absorbing carbonaceous aerosols in a tropical marine monsoon climate zone: the importance of ship emissions, Atmos. Chem. Phys., 20, 15537–15549, https://doi.org/10.5194/acp-20-15537-2020, 2020.
Wang, X., Heald, C. L., Ridley, D. A., Schwarz, J. P., Spackman, J. R., Perring, A. E., Coe, H., Liu, D., and Clarke, A. D.: Exploiting simultaneous observational constraints on mass and absorption to estimate the global direct radiative forcing of black carbon and brown carbon, Atmos. Chem. Phys., 14, 10989–11010, https://doi.org/10.5194/acp-14-10989-2014, 2014.
Wang, Y. C., Yuan, Y., Wang, Q. Y., Liu, C. G., Zhi, Q., and Cao, J. J.: Changes in air quality related to the control of coronavirus in China: Implications for traffic and industrial emissions, Sci. Total Environ., 731, 139133, https://doi.org/10.1016/j.scitotenv.2020.139133, 2020.
Weber, J., Shin, Y. M., Staunton Sykes, J., Archer-Nicholls, S., Abraham, N. L., and Archibald, A. T.: Minimal climate impacts from short-lived climate forcers following emission reductions related to the COVID-19 pandemic, Geophys. Res. Lett., 47, e2020GL090326. https://doi.org/10.1029/2020GL090326, 2020.
Wood, S. N.: Stable and efficient multiple smoothing parameter estimation for generalized additive models, J. Am. Stat. Assoc., 99, 673–686, https://doi.org/10.1198/016214504000000980, 2004.
Wood, S. N.: Generalized additive models: An introduction with R (second edition), edited by: Blitzstein, J. K., Faraway, J. J., Tanner, M., and Zidek, J., CRC press, 496 pp., https://doi.org/10.1201/9781315370279, 2017.
Wu, J., Bei, N., Li, X., Cao, J., Feng, T., Wang, Y., Tie, X., and Li, G.: Widespread air pollutants of the North China Plain during the Asian summer monsoon season: a case study, Atmos. Chem. Phys., 18, 8491–8504, https://doi.org/10.5194/acp-18-8491-2018, 2018.
Xie, M. J., Chen, X., Holder, A. L., Hays, M. D., Lewandowski, M., Offenberg, J. H., Kleindienst, T. E., Jaoui, M., and Hannigan, M. P.: Light absorption of organic carbon and its sources at a southeastern U.S. location in summer, Environ. Pollut., 244, 38–46, https://doi.org/10.1016/j.envpol.2018.09.125, 2019.
Xu, H. M., Cao, J. J., Ho, K. F., Ding, H., Han, Y. M., Wang, G. H., Chow, J. C., Watson, J. G., Khol, S. D., Qiang, J., and Li, W. T.: Lead concentrations in fine particulate matter after the phasing out of leaded gasoline in Xi'an, China, Atmos. Environ., 46, 217–224, https://doi.org/10.1016/j.atmosenv.2011.09.078, 2012.
Xu, L., Zhang, J., Sun, X., Xu, S. C., Shan, M., Yuan, Q., Liu, L., Du, Z. H., Liu, D. T., Xu, D., Song, C. B., Liu, B. W., Lu, G. D., Shi, Z. B., and Li, W. J.: Variation in concentration and sources of black carbon in a megacity of China during the COVID-19 pandemic, Geophys. Res. Lett., 47, e2020GL090444, https://doi.org/10.1029/2020GL090444, 2020.
Xu, W. Q., Sun, Y. L., Chen, C., Du, W., Han, T. T., Wang, Q. Q., Fu, P. Q., Wang, Z. F., Zhao, X. J., Zhou, L. B., Ji, D. S., Wang, P. C., and Worsnop, D. R.: Aerosol composition, oxidation properties, and sources in Beijing: results from the 2014 Asia-Pacific Economic Cooperation summit study, Atmos. Chem. Phys., 15, 13681–13698, https://doi.org/10.5194/acp-15-13681-2015, 2015.
Xu, W. Y., Kuang, Y., Bian, Y. X., Liu, L., Li, F., Wang, Y. Q., Xue, B., Luo, B., Huang, S., Yuan, B., Zhao, P. S., and Shao, M.: Current challenges in visibility improvement in southern China, Environ. Sci. Tech. Let., 7, 395–401, https://doi.org/10.1021/acs.estlett.0c00274, 2020.
Yao, H., Song, Y., Liu, M., Archer-Nicholls, S., Lowe, D., McFiggans, G., Xu, T., Du, P., Li, J., Wu, Y., Hu, M., Zhao, C., and Zhu, T.: Direct radiative effect of carbonaceous aerosols from crop residue burning during the summer harvest season in East China, Atmos. Chem. Phys., 17, 5205–5219, https://doi.org/10.5194/acp-17-5205-2017, 2017.
Yao, L. Q., Kong, S. F., Zheng, H., Chen, N., Zhu, B., Xu, K., Cao, W. X., Zhang, Y., Zheng, M. M., Cheng, Y., Hu, Y., Zhang, Z. X., Yan, Y. Y., Liu, D. T., Zhao, T. L., Bai, Y. Q., and Qi, S. H.: Co-benefits of reducing PM2.5 and improving visibility by COVID-19 lockdown in Wuhan, NPJ Clim. Atmos. Sci., 4, 40, https://doi.org/10.1038/s41612-021-00195-6, 2021.
Yao, M. S., Zhang, L., Ma, J. X., and Zhou, L.: On airborne transmission and control of SARS-Cov-2, Sci. Total Environ., 731, 139178, https://doi.org/10.1016/j.scitotenv.2020.139178, 2020.
Yu, Y. Y., He, S. Y., Wu, X. L., Zhang, C., Yao, Y., Liao, H., Wang, Q. G., and Xie, M. J.: PM2.5 elements at an urban site in Yangtze River Delta, China: High time-resolved measurement and the application in source apportionment, Environ. Pollut., 253, 1089–1099, https://doi.org/10.1016/j.envpol.2019.07.096, 2019.
Zhang, R., Jing, J., Tao, J., Hsu, S.-C., Wang, G., Cao, J., Lee, C. S. L., Zhu, L., Chen, Z., Zhao, Y., and Shen, Z.: Chemical characterization and source apportionment of PM2.5 in Beijing: seasonal perspective, Atmos. Chem. Phys., 13, 7053–7074, https://doi.org/10.5194/acp-13-7053-2013, 2013.
Zhang, R. Y., Wang, G. H., Guo, S., Zamora, M. L., Ying, Q., Lin, Y., Wang, W. G., Hu, M., and Wang, Y.: Formation of urban fine particulate matter, Chem. Rev., 115, 3803–3855, https://doi.org/10.1021/acs.chemrev.5b00067, 2015.
Zhang, Q., Shen, Z. X., Zhang, L. M., Zeng, Y. L., Ning, Z., Zhang, T., Lei, Y. L., Wang, Q. Y., Li, G. H., Sun, J., Westerdahl, D., Xu, H. M., and Cao, J. J.: Investigation of primary and secondary particulate brown carbon in two Chinese cities of Xi'an and Hong Kong in wintertime, Environ. Sci. Technol., 54, 3803–3813, https://doi.org/10.1021/acs.est.9b05332, 2020.
Zhang, Y. M., Sun, J. Y., Zhang, X. Y., Shen, X. J., Wang, T. T., and Qin, M. K.: Seasonal characterization of components and size distributions for submicron aerosols in Beijing, Sci. China-Earth Sci., 56, 890–900, https://doi.org/10.1007/s11430-012-4515-z, 2013.
Zhao, P. S., Feng, Y. C., Tan, Z., and Wu, J. H.: Characterizations of resuspended dust in six cities of North China, Atmos. Environ., 40, 5807–5814, https://doi.org/10.1016/j.atmosenv.2006.05.026, 2006.
Zhao, Y. B., Zhang, K., Xu, X. T., Shen, H. Z., Zhu, X., Zhang, Y. X., Hu, Y. T., and Shen, G. F.: Substantial changes in nitrogen dioxide and ozone after excluding meteorological impacts during the COVID-19 outbreak in mainland China, Environ. Sci. Tech. Let., 7, 402–408, https://doi.org/10.1021/acs.estlett.0c00304, 2020.
Zheng, B., Huo, H., Zhang, Q., Yao, Z. L., Wang, X. T., Yang, X. F., Liu, H., and He, K. B.: High-resolution mapping of vehicle emissions in China in 2008, Atmos. Chem. Phys., 14, 9787–9805, https://doi.org/10.5194/acp-14-9787-2014, 2014.
Zheng, B., Tong, D., Li, M., Liu, F., Hong, C., Geng, G., Li, H., Li, X., Peng, L., Qi, J., Yan, L., Zhang, Y., Zhao, H., Zheng, Y., He, K., and Zhang, Q.: Trends in China's anthropogenic emissions since 2010 as the consequence of clean air actions, Atmos. Chem. Phys., 18, 14095–14111, https://doi.org/10.5194/acp-18-14095-2018, 2018.
Zheng, H., Kong, S. F., Chen, N., Yan, Y. Y., Liu, D. T., Zhu, B., Xu, K., Cao, W. X., Ding, Q. Q., Lan, B., Zhang, Z. X., Zheng, M. M., Fan, Z. W., Cheng, Y., Zheng, S. R., Yao, L. Q., Bai, Y. Q., Zhao, T. L., and Qi, S. H.: Significant changes in the chemical compositions and sources of PM2.5 in Wuhan since the city lockdown as COVID-19. Sci. Total Environ., 739, 140000, https://doi.org/10.1016/j.scitotenv.2020.140000, 2020.
Zhou, Y. Q., Wang, Q. Y., Huang, R. J., Liu, S. X., Tie, X. X., Su, X. L., Niu, X. Y., Zhao, Z. Z., Ni, H. Y., Wang, M., Zhang, Y. G., and Cao, J. J.: Optical properties of aerosols and implications for radiative effects in Beijing during the Asia-Pacific Economic Cooperation (APEC) Summit 2014, J. Geophys. Res.-Atmos., 122, 10119–10132, https://doi.org/10.1002/2017jd026997, 2017.
Zhu, W. F., Zhou, M., Cheng, Z., Yan, N. Q., Huang, C., Qiao, L. P., Wang, H. L., Liu, Y, C., Lou, S. R., and Guo, S.: Seasonal variation of aerosol compositions in Shanghai, China: Insights from particle aerosol mass spectrometer observations, Sci. Total Environ., 771, 144948, https://doi.org/10.1016/j.scitotenv.2021.144948, 2021.
Zotter, P., Herich, H., Gysel, M., El-Haddad, I., Zhang, Y., Močnik, G., Hüglin, C., Baltensperger, U., Szidat, S., and Prévôt, A. S. H.: Evaluation of the absorption Ångström exponents for traffic and wood burning in the Aethalometer-based source apportionment using radiocarbon measurements of ambient aerosol, Atmos. Chem. Phys., 17, 4229–4249, https://doi.org/10.5194/acp-17-4229-2017, 2017.