the Creative Commons Attribution 4.0 License.
the Creative Commons Attribution 4.0 License.
 | 27 Jun 2022
An evaluation of the liquid cloud droplet effective radius derived from MODIS, airborne remote sensing, and in situ measurements from CAMP2Ex
Larry Di Girolamo
Robert M. Rauber
Greg M. McFarquhar
Stephen W. Nesbitt
Jesse Loveridge
Yulan Hong
Bastiaan van Diedenhoven
Brian Cairns
Mikhail D. Alexandrov
Paul Lawson
Sarah Woods
Simone Tanelli
Sebastian Schmidt
Chris Hostetler
Amy Jo Scarino
The cloud drop effective radius (Re) of the drop size distribution derived from passive satellite sensors is a key variable used in climate research. Validation of these satellite products has often taken place under stratiform cloud conditions that favor the assumption of cloud horizontal homogeneity used by the retrieval techniques. However, many studies have noted concerns with respect to significant biases in retrieved Re arising from cloud heterogeneity, for example, in cumulus cloud fields. Here, we examine data collected during the 2019 “Cloud, Aerosol and Monsoon Processes Philippines Experiment” (CAMP2Ex), which, in part, targeted the objective of providing the first detailed evaluation of Re retrieved across multiple platforms and techniques in a cumulus and congestus cloud region. Our evaluation consists of cross-comparisons of Re between the Moderate Resolution Imaging Spectroradiometer (MODIS) onboard the Terra satellite, the Research Scanning Polarimeter (RSP) onboard the NASA P-3 aircraft, and in situ measurements from both the NASA P-3 and Learjet aircraft that are all taken in close spatiotemporal proximity to the same cloud fields. A particular advantage of our approach lies in the capability of the RSP to retrieve Re using a bi-spectral MODIS approach and a polarimetric approach, which allows for the evaluation of bi-spectral and polarimetric Re retrievals from an airborne perspective using the same samples.
Averaged over all P-3 flight segments examined here for warm clouds, the RSP polarimetric method, the in situ method, and the bias-adjusted MODIS method of Fu et al. (2019) show a comparable median (mean ± standard deviation) for the Re samples of 9.6 (10.2 ± 4.0) µm, 11.0 (13.6 ± 11.3) µm, and 10.4 (10.8 ± 3.8) µm, respectively. These values are far lower than the values of 15.1 (16.2 ± 5.5) µm and 17.2 (17.7 ± 5.7) µm from the bi-spectral retrievals of RSP and MODIS, respectively. Similar results are observed when Re is segregated by cloud-top height and in detailed case studies. The clouds sampled during CAMP2Ex consist of mostly small (mean transect length ∼ 1.4 km) and low clouds (mean cloud-top height ∼ 1 km), which had more numerous small clouds than the trade wind cumuli sampled in past field campaigns such as Rain in Shallow Cumulus over the Ocean (RICO) and the Indian Ocean Experiment (INDOEX). The overestimates of Re from the RSP bi-spectral technique compared with the polarimetric technique increased as cloud size and cloud optical depth decreased. Drizzle, cloud-top bumpiness, and solar zenith angle, however, are not closely correlated with the overestimate of bi-spectral Re. For shallow clouds that dominated the liquid cloud cover for the CAMP2Ex region and period, we show that 3-D radiative transfer and cloud heterogeneity, particularly for the optically thin and small clouds, appear to be the leading cause of the large positive biases in bi-spectral retrievals. Because this bias varies with the underlying structure of the cloud field, caution continues to be warranted in studies that use bi-spectral Re retrievals in cumulus cloud fields.
- Article
(7248 KB) - Full-text XML
-
Supplement
(5202 KB) - BibTeX
- EndNote


Satellite-retrieved cloud properties have been critical in advancing the understanding of the role of clouds in the Earth's climate system. However, the role of clouds in a changing climate still remains a dominant source of uncertainty in climate change predictions (IPCC, 2013). Efforts to improve the accuracy of our satellite record of cloud properties continue to be called for (Ohring et al., 2005; NASEM, 2018). This includes the record of the cloud droplet effective radius (Re) of the drop size distribution. Satellite-retrieved Re, owing to its wide spatial coverage and continuous monitoring record, has been applied for a wide range of studies, such as estimating aerosol–cloud interactions (e.g., Menon et al., 2008; Ross et al., 2018; IPCC, 2013) and evaluating model parameterizations (e.g., Ban-Weiss et al., 2014; Suzuki et al., 2013). The (by far) most dominant approach for retrieving Re from space has been based on the bi-spectral technique of Nakajima and King (1990), which simultaneously retrieves cloud optical thickness (COT) and Re from visible–near-infrared (VNIR) and shortwave infrared (SWIR) radiances. It has been applied to sensors such as the Advanced Very High Resolution Radiometer (AVHRR; Rossow and Schiffer, 1991), the Moderate Resolution Imaging Spectroradiometer (MODIS; Platnick et al., 2003), and newer sensors such as the Visible Infrared Imaging Radiometer Suite (VIIRS; Cao et al., 2014) and the Advanced Himawari Imager (AHI; Bessho et al., 2016). Therefore, the longest records (spanning nearly 4 decades) of observations for cloud optical and microphysical properties are derived from the bi-spectral technique. Given its legacy and likely continued use in the future, it is essential to assess the error characteristics of the bi-spectral approach to advance the understanding of climate science, particularly as it applies to cloud feedbacks (e.g., Tan et al., 2019) and aerosol–cloud interactions (e.g., Menon et al., 2008; Gryspeerdt et al., 2019).
There have been numerous studies aimed at understanding the error characteristics of Re retrieved using the bi-spectral technique. The largest errors are expected to occur whenever nature substantially deviates from the assumptions used by the aforementioned technique, such as horizontally homogeneous clouds (i.e., 1-D radiative transfer is used as the forward model in this retrieval algorithm), vertically homogeneous clouds, and a single-mode drop size distribution. Evaluations of Re from past field campaigns (e.g., Nakajima et al., 1991; Platnick and Valero, 1995; Painemal and Zuidema, 2011; McBride et al., 2012; Witte et al., 2018) show a ∼ −0.2 to 3 µm (∼ −2 % to 40 %) bias for MODIS and MODIS-like instruments, mostly for marine stratiform clouds under high sun conditions – conditions that are most favorable for the 1-D assumption (e.g., Loeb et al., 1998; Di Girolamo et al., 2010). Moreover, 3-D radiative transfer simulations suggest larger biases in the cumulus cloud fields that can reach ∼ 100 % (e.g., Marshak et al., 2006), with the bias closely related to cloud heterogeneity and solar zenith angles (SZAs). Under low sun conditions, Ahn et al. (2018) recently compared MODIS Re with airborne in situ measurements over the Southern Ocean and reported a bias of 8–13 µm for non-drizzling clouds. A global perspective of the bias in MODIS Re was provided by Liang et al. (2015), who estimated zonal mean biases ranging from 2 to 11 µm by fusing data from MODIS and the Multi-angle Imaging SpectroRadiometer (MISR; Diner et al., 1998). Their approach was further extended to regional estimates of the bias across the globe by Fu et al. (2019), who showed dependence of the Re bias on the cloud regime (i.e., larger bias in more cumuliform regimes). Fu et al. (2019) showed that the largest Re biases (up to +10 µm) occur over the western tropical Pacific, which is also curiously the region where MODIS pixels detected as cloudy have the largest failures rates (up to 40 %) in retrieving cloud optical and microphysical properties (Cho et al., 2015). As liquid-water clouds in this region are dominated by cumulus and cumulus congestus clouds, a field campaign that, in part, targets the evaluation of Re retrievals for these clouds was warranted.
The “Cloud, Aerosol and Monsoon Processes Philippines Experiment” (CAMP2Ex; Di Girolamo et al., 2015), which took place in the Philippines and its surrounding waters from August to October of 2019, offers an opportunity to evaluate and understand satellite-derived cloud optical and microphysical properties in a heterogeneous environment. Remote sensing and in situ measurements of the clouds and aerosol fields were retrieved by the NASA P-3 and Learjet aircraft platforms. In this study, we focus on evaluating remotely sensed Re retrievals for warm cumulus and congestus clouds sampled during CAMP2Ex. Over the past several decades, satellite retrievals have not been evaluated in cumulus cloud fields, largely because of the difficulties involved with doing so. The fast-changing nature and complex cloud-top structures of these clouds pose challenges for good cloud-top coordination between satellite observations and airborne/in situ measurements. CAMP2Ex provided tight coordination between Terra overpasses and the P-3 aircraft that carried the Research Scanning Polarimeter (RSP; Cairns et al., 1999). The RSP provides bi-spectral and polarimetric retrievals of Re. The polarimetric Re is retrieved from multi-angle polarized radiances that are sensitive to single scattering. Past studies have indicated that the accuracy of polarimetric retrievals is less affected by the assumptions of plane-parallel and homogeneous clouds than the bi-spectral technique (Bréon and Doutriaux-Boucher, 2005; Alexandrov et al., 2012, 2015). In this study, we rely on the RSP polarimetric Re to assess the RSP bi-spectral Re and MODIS Re. In addition, Re derived in situ from the P-3 and the Learjet platforms can also help to assess the performance of both the RSP-retrieved Re and MODIS-retrieved Re. There are several merits in cross-evaluating remotely sensed Re through comparison of data from different techniques and platforms: (1) RSP alone allows us to assess the performance of the bi-spectral technique against the polarimetric technique without concerns regarding spatial and temporal co-location mismatches; (2) comparing the MODIS bi-spectral Re against RSP bi-spectral Re can further assess the impact of measurement resolution (i.e., satellite vs. airborne) on the retrievals; and (3) P-3 Re derived in situ can assess the performance of the RSP polarimetric Re from the same airborne platform, whereas the Learjet Re derived in situ can further supplement the Re derived in situ from a different airborne platform. Along with RSP, the P-3 carried the High-Spectral-Resolution Lidar – Generation 2 (HSRL-2; Hair et al., 2008; Burton et al., 2018), which provided measurements of aerosol properties and cloud-top height (CTH) values, and the Airborne Third Generation Precipitation Radar (APR-3; Durden et al., 2020), which provided precipitation information. Together, these instruments help to further investigate underlying relationships between the Re differences (difference between RSP bi-spectral and polarimetric Re) and potential impact factors such as 3-D effects and drizzle. Thus, the objective of this study is to better understand the error characteristics of satellite-retrieved Re and provide insights into future satellite instrumental designs by comparing bi-spectrally retrieved satellite Re with that from aircraft remote sensing and in situ measurements. In doing so, this study addresses the following questions:
-
What are the microphysical and macrophysical properties of warm cumulus and congestus clouds sampled from a variety of observing systems during CAMP2Ex?
-
What are the relative errors between Re values retrieved using the bi-spectral techniques of MODIS and RSP, the bias-corrected MODIS Re technique of Fu et al. (2019), the RSP polarimetric technique, and in situ cloud probes?
-
How do these relative errors depend on factors such as cloud horizontal and vertical heterogeneity and drizzle?
This paper is structured as follows: in Sect. 2, the dataset and the methodology used in this analysis are presented; in Sect. 3, we first provide an overview of the sampled clouds' characteristics and then examine the detailed behaviors of individual cloud fields while also focusing on the differences in the retrieved Re from different techniques; in Sect. 4, we further examine the dependence of the observed Re differences between the RSP polarimetric Re and bi-spectral Re on various impact factors (e.g., 3-D effects, sub-pixel heterogeneity, and drizzle) and discuss the consistency of the representativeness of the Re retrieved using different techniques during CAMP2Ex; finally, conclusions are provided in Sect. 5.
2.1 CAMP2Ex dataset
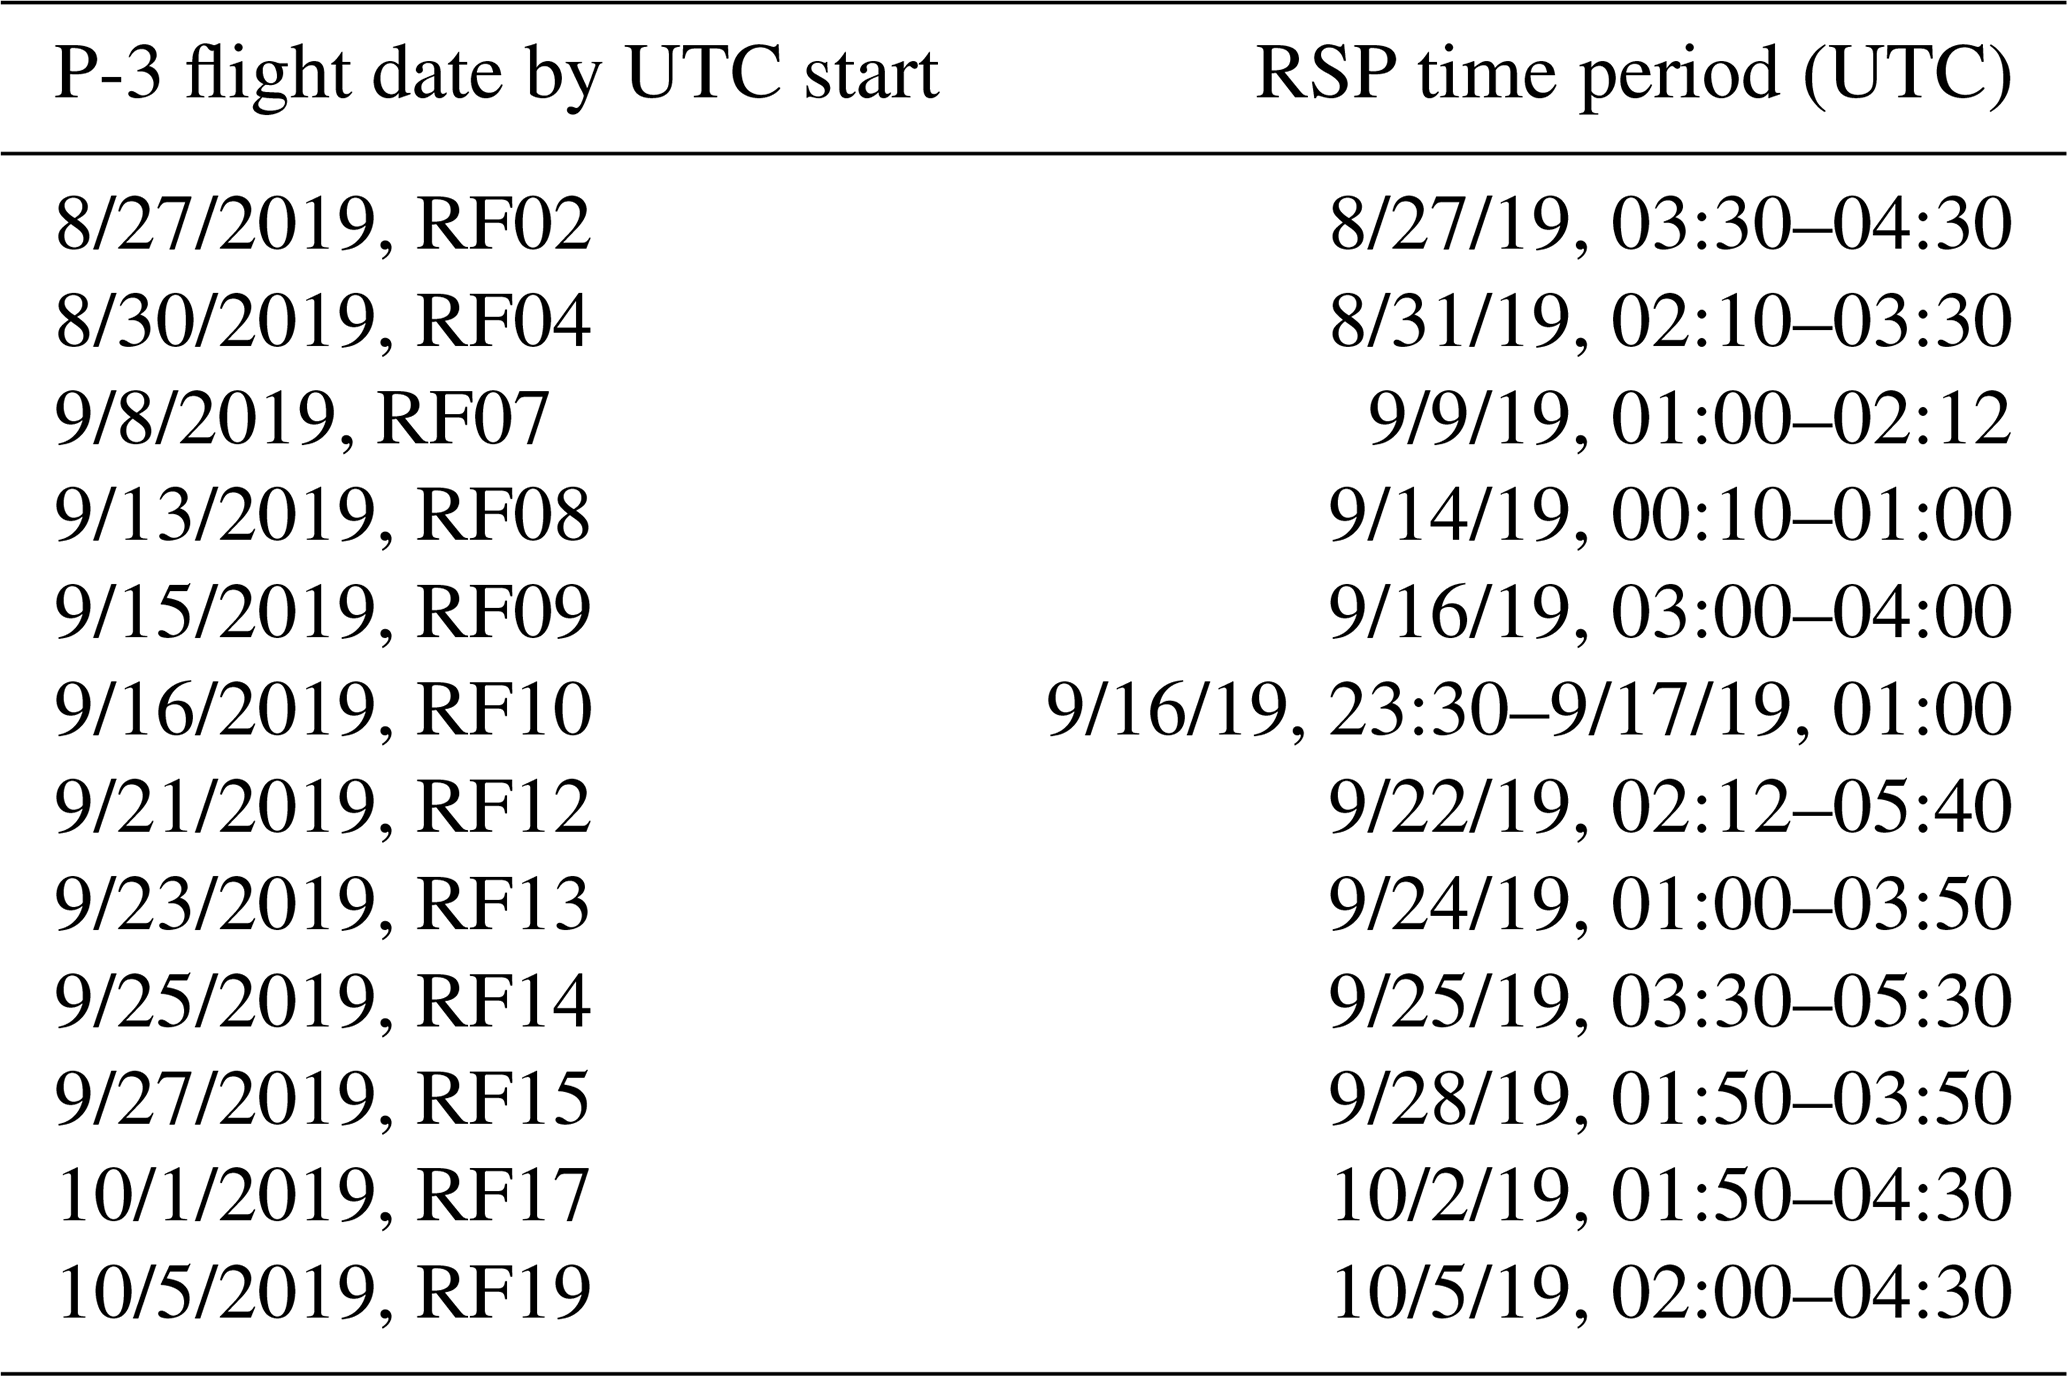
CAMP2Ex was focused on the Philippines and its nearby waters (approximately 6–23∘ N, 116–128.5∘ E). A total of 19 research flights with the NASA P-3 and 13 flights with the Stratton Park Engineering Company (SPEC) Learjet were flown during CAMP2Ex, 12 of which were joint missions. Sampled cloud fields include tropical storm convective cores, cold pools, and broken shallow cumulus and congestus clouds. Frequent cirrus and altostratus clouds were also present during the flights. The P-3 platform was equipped with an array of instruments that included remote sensing instruments such as the RSP, HSRL-2, APR-3, and the SPN-S spectral pyranometer (Badosa et al., 2014; Norgren et al., 2022). In situ probes such as the fast cloud droplet probe (FCDP; O'Connor et al., 2008) and two-dimensional stereo (2D-S) probe (Lawson et al., 2006) were also installed on the P-3. The SPEC Learjet carried similar cloud microphysical probes to those of the P-3. There were 14 research flights (RFs; Fig. 1) of the P-3 that were coordinated with Terra MODIS overpasses. Terra MODIS was chosen for the analysis rather than Aqua MODIS or VIIRS because the overpass time of the latter two sensors occurs in the afternoon when cirrus is more frequent and when the aircraft was returning to base; therefore, the sampling was not favorable. In addition, we applied the bias-adjustment technique of Fu et al. (2019), which was specifically developed for Terra MODIS Re.
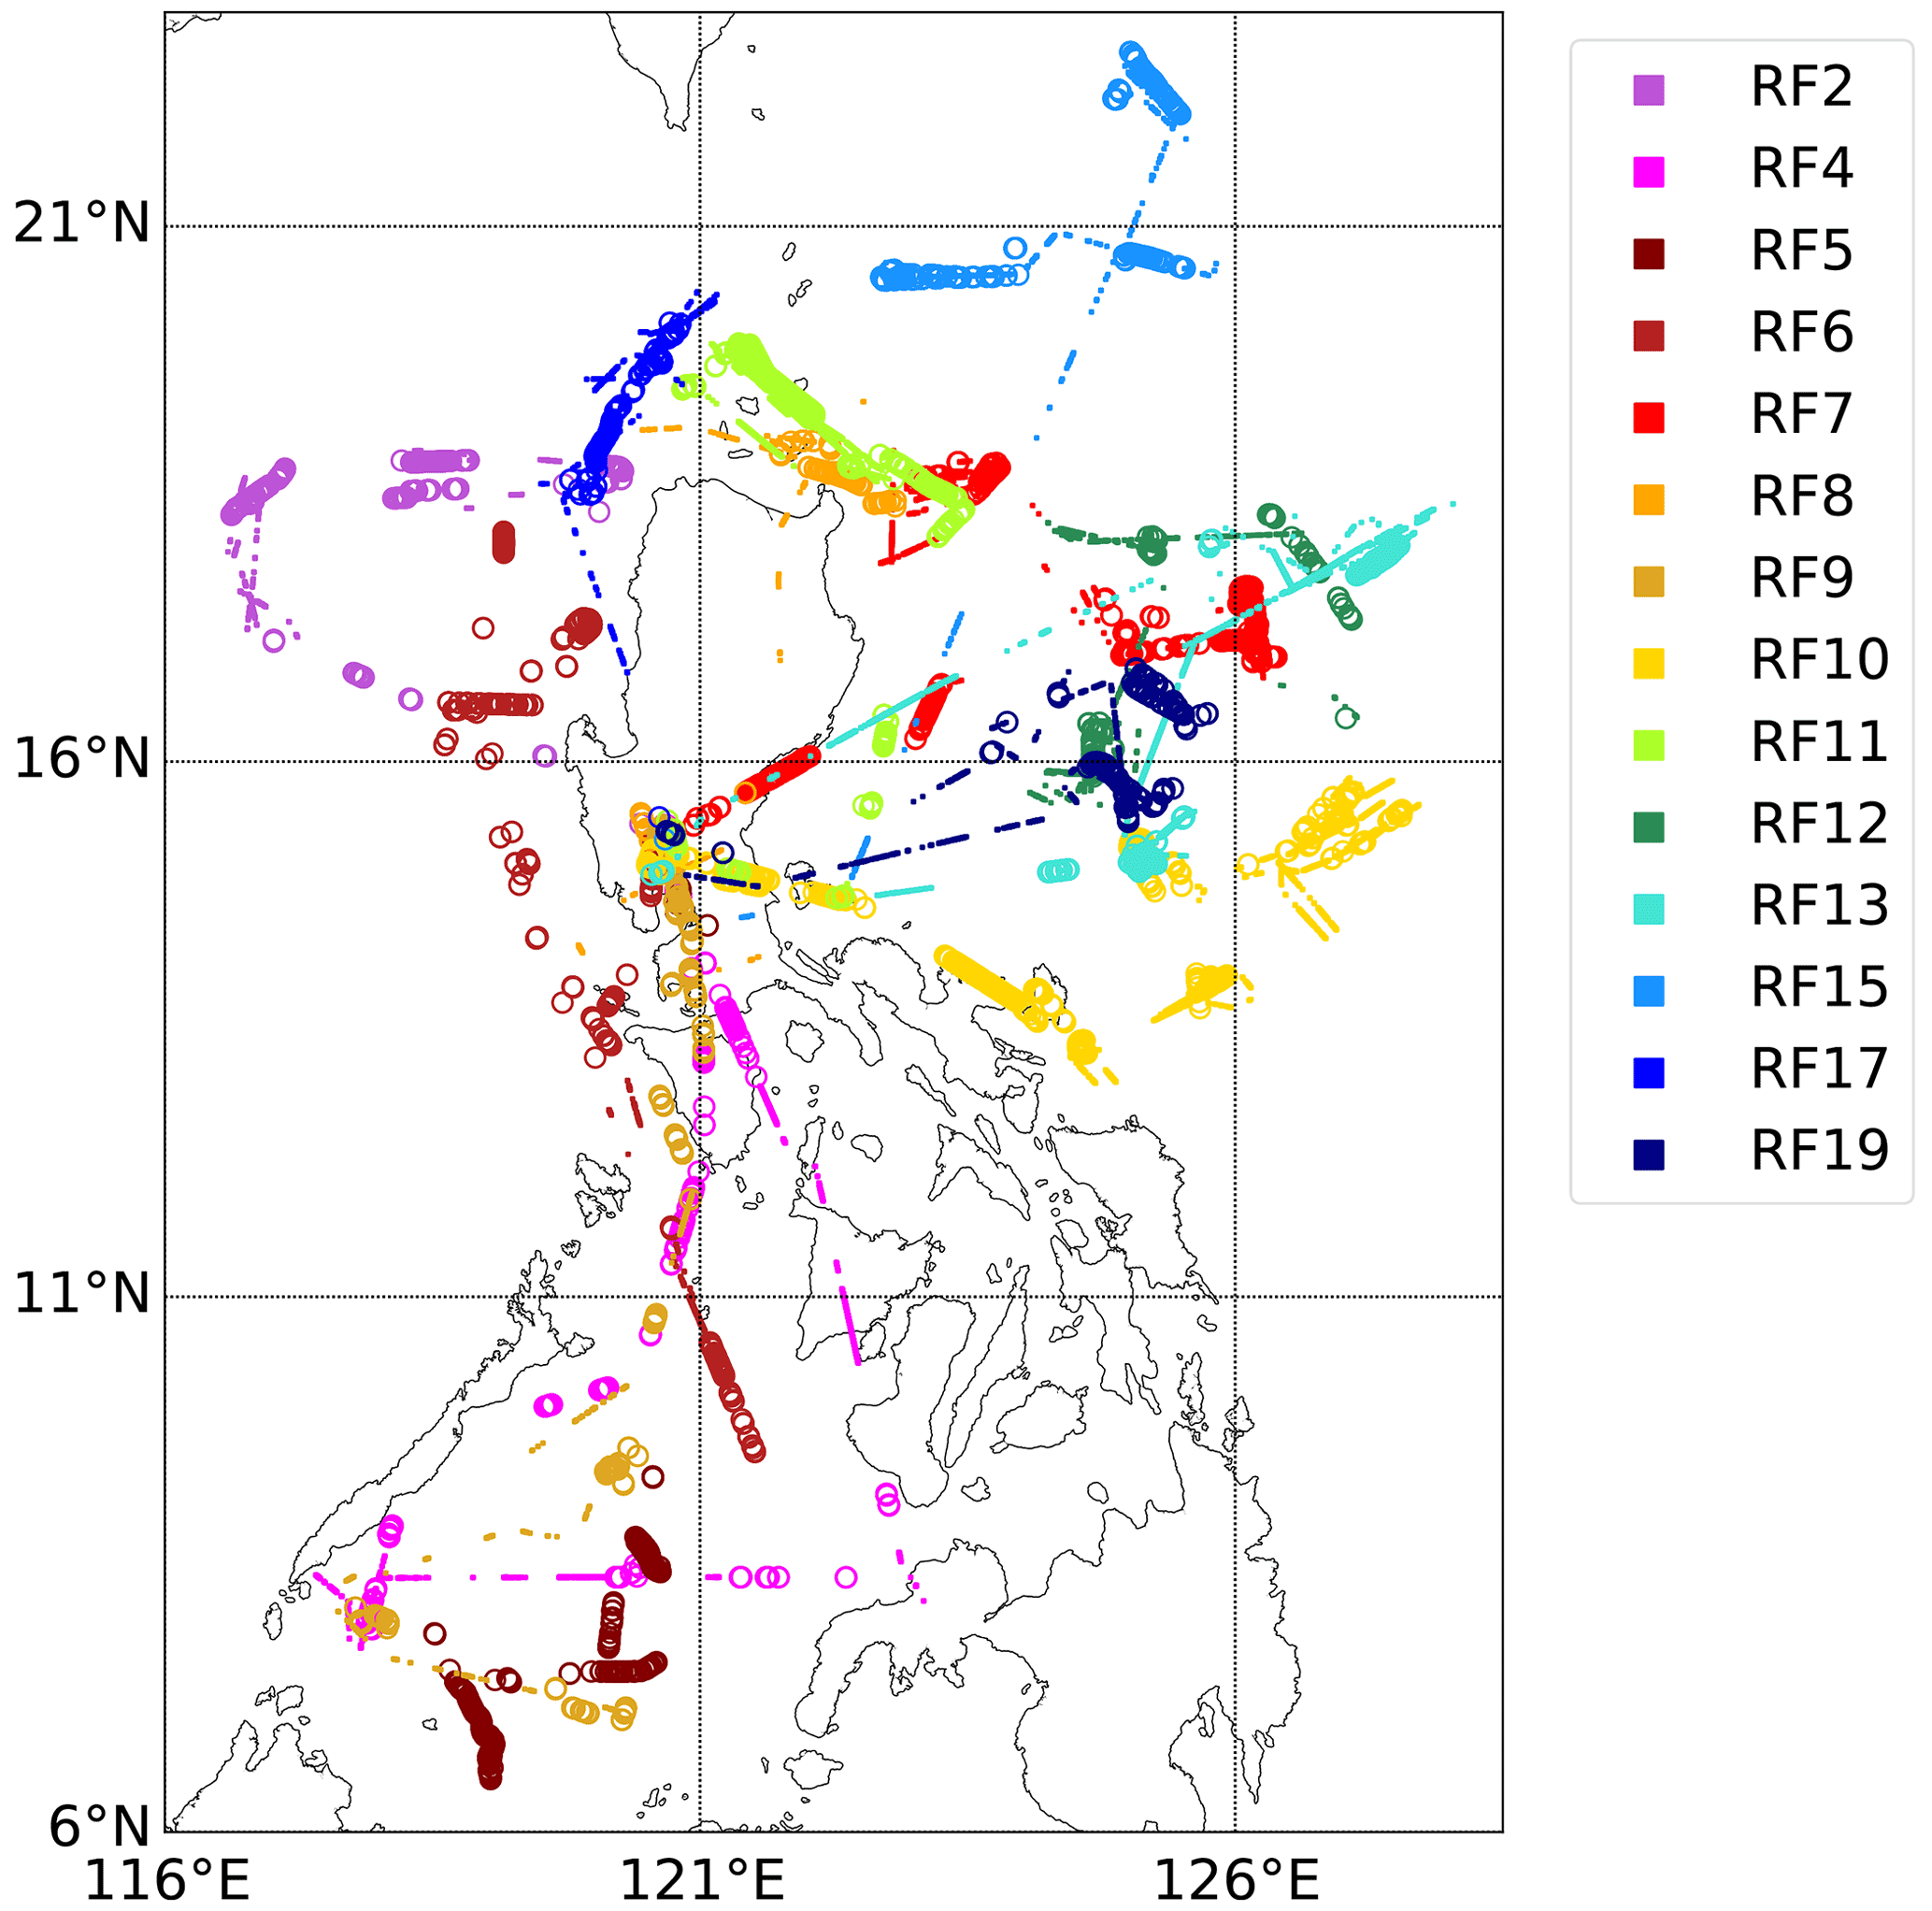
Figure 1Flight tracks for 14 P-3 research flights (RFs) with Terra MODIS overpass coordination over the CAMP2Ex region. Dots indicate remote sensing legs with valid RSP retrievals; hollow circles indicate in situ legs with a FCDP number concentration > 10 cm−3.
2.1.1 RSP cloud retrievals
RSP (Cairns et al., 1999) is a multi-angle multi-spectral polarimeter that provides along-track scans at up to 152 views between view zenith angles of about ±60∘. It measures total and polarized reflectance at nine visible and shortwave infrared channels. RSP retrieves both polarimetric and bi-spectral Re. The instrument retrieves polarimetric Re using polarized reflectance of the cloud bow with scattering angles ranging between 137 and 165∘. The shape of the cloud bow is dominated by the single-scattering properties of cloud particles, which are less susceptible to uncertainties caused by 3-D radiative effects and aerosol loading (Alexandrov et al., 2012). The polarimetric technique uses a pre-calculated lookup table of single-scattering polarized phase functions with various Re, Ve (effective variance), and scattering angles. Polarimetric Re is retrieved by applying a parametric fitting to determine the relation between the phase function and the observed polarized reflectance. For the bi-spectral technique, like MODIS, the RSP uses the nadir reflectance at 865 nm (channel with negligible absorption by water) and at 1588 and 2260 nm (channels with strong absorption by water) to retrieve Re and COT from a lookup table of pre-calculated reflectance of the two channels as a function of Re, COT, and sun-view geometry. In this analysis, we mostly focus on the bi-spectral Re retrievals from 2260 nm. Note the maximum Re for both polarimetric and bi-spectral lookup tables is 30 µm. For COT, the standard COT product from the RSP is retrieved using total reflectances and polarimetric Re; the RSP also reports the bi-spectral retrieved COT. The RSP retrievals are reported at ∼ 0.8 s intervals (∼ 1.2 Hz), which (depending on the aircraft platform altitude and air speed) results in spatial resolutions of ∼ 120 m during CAMP2Ex.
One of the merits of using the RSP for this evaluation study is its capability to provide co-located polarimetric and bi-spectral Re retrievals. Thus, the comparison between the RSP bi-spectral and polarimetric retrievals does not need to consider uncertainty resulting from sampling and co-location (a common issue with cross-platform comparisons). Using RSP retrievals alone provides a comparison between the bi-spectral and polarimetric retrieval techniques. The RSP polarimetric retrievals have been examined in other field campaigns, showing good agreement of better than 1 µm compared to in situ measurements in stratocumulus cloud fields (e.g., Alexandrov et al., 2018; Painemal et al., 2021). Here, we extend its evaluation to cumulus cloud fields sampled during CAMP2Ex.
The RSP retrieves CTH using a multi-angle parallax approach (Sinclair et al., 2017). In addition, a simple cloud mask based on reflectance thresholds is reported, and RSP reports cloud-top height retrievals whenever the cloud mask is valid. As we will show in Sect. 4.1, we also make use of valid (nonzero) RSP CTH retrievals to organize cloud properties in cloud elements, where a contiguous set of CTH retrievals is labeled as one cloud element. Means and standard deviations of retrieved quantities are computed for each cloud element. This further allows us to relate cloud properties to cloud macrophysics, such as cloud length (characterized by the RSP transect length) and cloud-top bumpiness (characterized by the standard deviation of CTH) at a cloud element level.
2.1.2 SPEC in situ measurements
The SPEC provided an array of in situ cloud probes for CAMP2Ex on the NASA P-3 and the SPEC Learjet. During CAMP2Ex, the NASA P-3 often targeted clouds using stacked tracks of in situ cloud legs within the cloud field and cloud remote sensing legs above the cloud field, whereas the Learjet provided only in situ measurements. The Learjet was equipped with in situ instruments only, and data from this platform are used to characterize the cloud microphysical properties. For this study, the SPEC in situ instruments include the fast forward-scattering spectrometer probe (FFSSP; Brenguier et al., 1998), the fast cloud droplet probe (FCDP; O'Connor et al., 2008), and the two-dimensional stereo (2D-S) probe (Lawson et al., 2006). The FFSSP and FCDP are similar scattering probes that retrieve droplet number concentrations from the forward scattering of a laser impinging on cloud droplets and provide the droplet size distribution in 21 size bins ranging from 1.5 to 50 µm in diameter. The two probes share the same electronics and differ slightly with respect to the design of the probe tips to reduce shattering. The FFSSP was only installed on the Learjet, whereas the FCDP was installed on both the Learjet and P-3. The 2D-S is an optical array probe that uses two orthogonal laser-beams to record images of particles and nominally provides size distributions for diameters ranging from 10 to 3000 µm. We combined the FCDP/FFSSP and 2D-S cloud droplet size distributions for diameters from 1 to 1280 µm in order to cover cloud droplet and drizzle sizes. The “break point” to combine the FCDP/FFSSP and 2D-S particle distribution is fixed at 40 µm. Sensitivity tests were carried out using various break points from 25 to 45 µm. We found that the choice of break point does not introduce differences greater than 1 µm in the derived Re for ∼ 90 % of the 1 Hz samples used in this study. The FCDP/FFSSP and 2D-S number concentrations are combined at a 1 Hz temporal resolution. Only drop size distributions with total number concentrations greater than 10 cm−3 and temperatures greater than 0 ∘C are included in this study following thresholds used to define warm cloud in previous studies (e.g., McFarquhar and Heymsfield, 2001). The value of Re from the combined size distributions is calculated as
where ni is the number concentration (no. cm−3) for individual size bins, N is the number of bins, and ri is the bin-center radius.
The CAMP2Ex data also archive an Re product for full-length cloud passes computed from size distributions summed from all samples belonging to the cloud pass. These size distributions use the FCDP/FFSSP, 2DS, and the High-Volume Precipitation Spectrometer (HVPS; Lawson et al., 1993) to extend the size distribution out to 3–5 mm (in diameter). The multiple probes' size distributions are stitched together using break points that vary from different cloud passes. When compared to our Re derived at 1 Hz using only FFSSP/FCDP and 2D-S, our cloud-averaged Re values compared favorably to the cloud pass Re stored in the database: the median differences were within 1 µm for both P-3 and Learjet data across all flights but with a smaller tail in the Re distribution towards larger values – particularly for the Learjet samples, which targeted deeper clouds compared with the P-3. While acknowledging this difference, we used the Re derived at 1 Hz from the FFSSP/FCDP and 2D-S, as it has a horizontal resolution similar to the RSP retrievals at 1.2 Hz. The effects of precipitation on our understanding of RSP bi-spectral and polarimetric Re retrievals are examined here using coincident APR-3 airborne radar data discussed below.
2.1.3 Ancillary data
Apart from the RSP, other remote sensing instruments onboard the P-3 platform provided information about the sampled cloud fields and the surrounding environment that may influence retrieval accuracy. For instance, cirrus above the aircraft can lead to large biases in the bi-spectral retrieved cloud properties, as their absorbing effect is not modeled in the retrieval (e.g., Chang and Li, 2005). To identify the presence of above-aircraft cirrus, we utilize the measurements from the SPN-S (airborne prototype spectral Sunshine Pyranometer; Norgren et al., 2022). The SPN-S was mounted on top of the P-3 for measuring downwelling spectral total and diffuse irradiances at wavelengths ranging from 380 to 1000 nm. We derived direct-beam transmittances at 860 nm with the assumption that the solar direct beam is attenuated as prescribed by the Beer–Lambert law. Proper plane attitude adjustment has been applied to the SPN-S data (Bannerhr and Glover, 1991). By co-locating the SPN-S transmittance with the cloud retrievals from the Advanced Himawari Imager (AHI) (temporal difference < 10 min and spatial difference < 5 km), we found that the co-located samples have a SPN-S transmittance of less than 0.95 when the AHI cloud-phase flag indicates cirrus clouds. Thus, a direct-beam transmittance of 0.95 is used to filter out possible above-aircraft cirrus contamination.
The APR-3 is used to detect in-cloud drizzle in this study. The APR-3 is a Doppler, dual-polarization radar system operating at three frequencies (13, 35, and 94 GHz). It was mounted looking downward from the P-3, and it performed cross-track scans which covered a swath that is within the ±25∘ scan range. The 94 GHz channel's sensitivity to cloud liquid water has led to it being used in many studies to detect drizzle (e.g., Tanelli et al., 2008; Dzambo et al., 2019; Lebsock and L'Ecuyer, 2011). In our analysis, we discovered that Version 2.3 of the APR-3 CAMP2Ex data included numerous segments containing calibration errors that showed up as large along-track discontinuities in the background noise. This affected about 10 % of the total APR-3 data and was, therefore, removed in our analysis.
The HSRL-2 (Burton et al., 2018) is a three-wavelength lidar that makes measurements of the atmosphere at 355, 532, and 1064 nm. It retrieves CTH and aerosol properties, such as extinction coefficient, backscatter, and aerosol optical density (AOD). In our analysis, we take advantage of the capability of the HSRL-2 to provide high-resolution CTH information at 2 Hz, to supplement the RSP in providing cloud macrophysics characteristics of the CAMP2Ex sampled clouds. As we will show in Sect. 4.2.1, we also use HSRL-2 2 Hz CTH to investigate clear-sky contamination for the RSP cloud element analysis.
All of the instruments on the P-3 platform were temporally synchronized with the meteorological and navigation information provided by the National Suborbital Research Center (NSRC).
Compared with past field campaigns, one advantage of CAMP2Ex is the availability of the continuous monitoring from the Advanced Himawari Imager (AHI) on the Himawari 8 geostationary satellite. AHI provides moderate-resolution (1 km) reflectances over the entire CAMP2Ex region at 10 min intervals. This is important for post-campaign data processing, as it provides a continuous view of a cloud field's evolution through each research flight.
2.2 MODIS cloud retrievals
The main goal of this study is to evaluate and understand the performance of bi-spectral Re during CAMP2Ex, including those retrieved by satellites. The satellite Re retrievals in this study come from MODIS onboard the Terra satellite. Terra is in a sun-synchronous orbit and has an Equator-crossing time of 10:30 LT (local time). The Re retrieved from Terra MODIS represents the longest, single-platform, global record of Re. In our analysis, we used the MODIS Collection 6.1 Level 2 (L2) Cloud Product at 1 km resolution (MOD06 V6.1; Platnick et al., 2017). For Re and COT, only the standard product from fully cloudy pixels was included, thereby excluding partially cloudy pixels. Only liquid-water clouds were considered based on the cloud-phase flag provided in the MOD06 product. Only MODIS granules that overlapped with the CAMP2Ex sampling regions during individual P-3 research flights are included. In this analysis, we focus on the Re and COT retrieved using the 0.86 and 2.1 µm channels, as these channels are the most widely used and RSP has a similar channel at 2.26 µm. Some recent studies have discussed the validity of comparing the MODIS 2.1 µm channel to the 2.26 µm channel from VIIRS, AHI, and RSP (e.g., Platnick et al., 2020; Zhuge et al., 2021). It has been pointed out that the inconsistency in the spectral response function of the two wavelengths can lead to differences of ∼ 1–2 µm between the Re derived from the two wavelengths, which is much smaller than the Re bias estimates of up to 10 µm reported in Fu et al. (2019). We also examined the MODIS Re product derived using its 3.7 µm channel and found the differences between the Re products derived from the MODIS 2.1 and 3.7 µm channels to be consistent with what has been reported in previous studies (e.g., Zhang and Platnick, 2011; Fu et al., 2019). Thus, they are not included in the figures and tables in the following sections. However, we provide a brief summary of these differences at the end of Sect. 4.3.
2.3 Bias-adjusted MODIS cloud retrievals
The MODIS Re bias estimates presented in Fu et al. (2019) are also evaluated via comparison against the CAMP2Ex dataset. As a continuation of Liang et al. (2015), Fu et al. (2019) fused MISR Level 1B (L1B) radiance data and MODIS L2 cloud Re to retrieve COT at the nine MISR viewing angles. Liang et al. (2015) revealed that the COT retrievals show a local minimum around the cloud-bow scattering direction (∼ 140∘), and this feature was prominent in multiyear climatologies of MODIS cloud COT values and COT retrieved from MISR. They showed that this minimum is due to an overestimate in the MODIS Re product and that the value of the climatological Re bias could be estimated by extrapolating the Re correction derived from the cloud-bow feature to retrievals at all scattering angles. The local minimum of COT was prevalent in a multiyear climatology carefully stratified by scattering angle, latitude, and SZA rather than apparent at a ∼ 1 km pixel resolution within an L2 MODIS granule because of large spatial variability in scattering angle, SZA, and cloud heterogeneity within an L2 granule. To correct for the Re bias, Fu et al. (2019) used 8 years of MISR and MODIS data that were further stratified by MISR nadir τ and cloud heterogeneity to produce climatology estimates of corrected MODIS Re between 60∘ N and 60∘ S globally at a 2.5∘ resolution for the months of January and July. In the current study, we apply the July regional correction factors from Fu et al. (2019) at 2.5∘ to the MODIS L2 granules over the CAMP2Ex domain to allow for better comparison with Re derived from other techniques under similar seasonal conditions. This enables one to test the robustness of the correction. The average of the July correction factors over the CAMP2Ex domain is ∼ 0.6. The correction factors over this region range from 0.25 to 0.97 depending on latitude, τ, and cloud heterogeneity. We are interested in evaluating the capability of regional bias corrections to capture the actual variability at its original resolution (i.e., MODIS 1 km retrieval) as we compare to field measurements from CAMP2Ex.
2.4 Co-location technique
One major challenge for constructing the evaluation framework is the co-location between different platforms. In CAMP2Ex, the P-3 performed both remote sensing and in situ sampling during the same flight; therefore, simultaneous sampling from both methods is not possible. Furthermore, CAMP2Ex targeted mostly cumulus and congestus clouds that have faster evolution and a shorter lifetime compared with stratocumulus clouds. A sawtooth flight pattern, commonly used in field campaigns targeting stratocumulus regions (e.g., Curry et al., 2000; Painemal and Zuidema, 2011; Witte et al., 2018; McFarquhar et al., 2021; Redemann et al., 2021), was not employed during CAMP2Ex. However, while a strict point-to-point comparison is not achievable, we adopted the following approach to co-locate MODIS, RSP, and in situ measurements from a statistical standpoint.
A valid co-location between MODIS and the P-3 occurs based on a spatial and temporal matching criterion. For the case-by-case comparisons presented in Sect. 3.3, all samples within the tightest rectangular box circumscribing the P-3 flight path that fell within ±1.5 h of the MODIS overpass time are included in the comparison. This time window was chosen based on the examination of all of the 10 min AHI imagery and forward/nadir videos from the P-3 to maintain a balance between ensuring a significant number of samples and ensuring that the airborne remote sensing and MODIS observe the same cloud features. The sensitivity of our results to tighter temporal windows (e.g., 30 min and 1 h) was tested and did not alter the patterns observed in our results. Of the 19 P-3 research flights, 14 research flights had successful overlap with Terra MODIS overpasses (Fig. 1, Table 1).
Table 1CAMP2Ex P-3 research flights (RFs) with successful coordination between P-3 and MODIS. RFs in bold indicate successful overlap between RSP sampling and MODIS.

When comparing remotely sensed Re with Re derived in situ, one limitation lies in the simplified representation of clouds in the algorithms. Current passive remote sensing assumes clouds to be homogeneous in both the horizontal and vertical directions, but this representation of clouds is different from reality. In nature, clouds tend to have an Re profile that increase with height (e.g., McFarquhar et al., 2007; Arabas et al., 2009), although it is relatively constant in the horizontal direction at a given height level (e.g., Khain et al., 2019; Pinsky and Khain, 2020; Zhang et al., 2011). The vertical variability in Re is often observed from Re derived in situ at various levels throughout a cloud. For remotely sensed Re, however, satellite-retrieved bi-spectral Re is viewed as a vertically weighted Re with peak weighting near cloud top (e.g., McFarquhar and Heymsfield, 1998; Platnick, 2000; Nakajima et al., 2010). For the polarimetric Re retrievals, the vertical weighting is more strongly peaked and closer to the cloud top compared with the bi-spectral technique. This is because the polarimetric signature is dominated by single-scattering contributions, with a mean penetration optical depth of ∼ 0.5 and negligible contributions from levels below an optical depth of ∼ 3 from cloud top (Miller et al., 2018). Thus, to directly compare Re retrieved in situ with satellite or airborne remotely sensed Re, many studies have used in situ measurements at the cloud top to evaluate satellite Re (e.g., Painemal and Zuidema, 2011; Witte et al., 2018; Gupta et al., 2022). This requires the determination of the altitude of cloud tops during the in situ legs, which is simple for stratiform cloud with the aircraft performing sawtooth flight patterns at cloud top but not so for cumulus cloud. Here, we made use of all in situ measurements throughout various levels of the cloud fields. While we know the altitude in which the aircraft penetrated cloud, we do not have coincident measurements of co-located cloud top. We exclude in situ samples for which the co-located AHI brightness temperature at 11 µm is below 273 K. This removes deeper convective clouds sampled by the aircraft that are not observed in the warm clouds sampled by passive remote sensing (i.e., RSP). As the two airborne platforms are equipped with similar SPEC probes, despite the differences in the platform and sampling, the two in situ datasets serve to complement each other, providing additional information that is key to the evaluation of remotely sensed bi-spectral Re. We pay special attention to these sampling issues in our comparison of Re measured in situ with remotely sensed Re.
3.1 General cloud characteristics of CAMP2Ex
We begin by providing an overview of some general cloud characteristics derived using the remote sensing data collected by the P-3 for all of the research flights. Only oceanic liquid-water clouds are included based on the RSP cloud-top liquid index (van Diedenhoven et al., 2012). Cloud segments overlaid with cirrus are removed based on SPN-S transmittance < 0.95. Segments where the P-3 was banking (i.e., roll angle > 3∘ and roll angle difference < 1∘) are also removed. Here, data are organized into cloud elements. Figure 2a and b show the respective probability distribution functions (PDFs) and cumulative distribution functions (CDFs) for cloud element mean Re and COT retrieved using the RSP polarimetric and bi-spectral (using the 2260 nm channel) techniques. While the COT distributions among the two techniques are in good agreement, the two Re distributions are quite different: the polarimetric Re distribution mode occurs at ∼ 6 µm, whereas the bi-spectral Re mode occurs at ∼ 12 µm. The median polarimetric Re is 7.0 µm, and the median bi-spectral Re is 16.1 µm. The median COT is 3.5 for the standard RSP COT retrievals and 4.2 for the bi-spectral COT retrievals. Figure 2c provides the PDFs of RSP mean CTH and HSRL-2 mean CTH, with HSRL-2 CTH from 2 Hz samples. Similar to past studies that compared RSP CTH with airborne-lidar-retrieved CTH (e.g., Sinclair et al., 2017), the RSP and HSRL-2 CTH distributions in Fig. 2c are in excellent agreement, both showing that ∼ 60 % of the cloud elements sampled have mean cloud tops < 1 km. Figure 2d and e show the PDFs of cloud element transect lengths and clear lengths (between cloud elements) derived from the RSP and HSRL-2 CTH mask. We see that 50 % of cloud elements sampled by RSP have transect lengths less than 0.6 km, with a mean length of 1.4 km, while 50 % of HSRL-2-derived cloud elements have transect lengths less than 0.5 km, with a mean of 1.3 km. A total of 50 % of the clear lengths derived from RSP and HSRL-2 are less than 1.0 km (mean length of 2.6 km) and 0.8 km (mean length of 1.9 km), respectively. We note that these clouds sampled by the RSP and HSRL-2 have more numerous small clouds than the trade cumuli sampled during INDOEX (the Indian Ocean Experiment; Lelieveld et al., 2001) using a multichannel radiometer (MCR) and during RICO (Rain in Shallow Cumulus Over the Ocean; Rauber et al., 1997) using ASTER (Advanced Spaceborne Thermal Emission and Reflection Radiometer; Abrams et al., 2000), both of which had 50 % of the total cloud fraction contributed by cloud-area-equivalent diameters of less than 2 km and with about half the amount of clouds (McFarquhar et al., 2004; Zhao and Di Girolamo, 2007). Given that the mean cloud-area-equivalent diameter is approximately 1.1 to 1.7 times that of a random linear transect (e.g., Barron et al., 2020; Romps and Vogelmann, 2017), the clouds sampled by RSP and HSRL-2 during CAMP2Ex are much smaller than the trade cumuli sampled during INDOEX or RICO. As such, the 1 km resolution MODIS pixels are expected to have a considerable amount of sub-pixel clouds during CAMP2Ex. We speculate that the reason for the maximum failure rate in MODIS cloud microphysical retrievals occurring over the western tropical Pacific, as reported by Cho et al. (2015), may be the high frequency of small clouds in this region relative to anywhere else. Finally, Fig. 2f shows the PDF and CDF of the derived APR-3 W-band maximum reflectivity within individual RSP cloud elements. The APR-3 W-band maximum reflectivity median is at −9.24 dBZ. Past studies have shown that a threshold of W-band column maximum reflectivity of ∼ −15 dBZ is associated with the transition from non-drizzle to light drizzle (e.g., Dzambo et al., 2019; Wang and Geerts, 2003). From Fig. 2f, ∼ 20 % of the valid APR-3 W-band maximum reflectivity values are less than −15 dBZ, indicating that most of the cloud elements sampled by RSP may have some degree of drizzle somewhere in the cloud. Overall, Fig. 2 reveals that most clouds observed by the P-3 remote sensors are small, optically thin, and often contained pockets of drizzle somewhere within the cloud. Most of the clouds were low clouds with tops under 2 km.
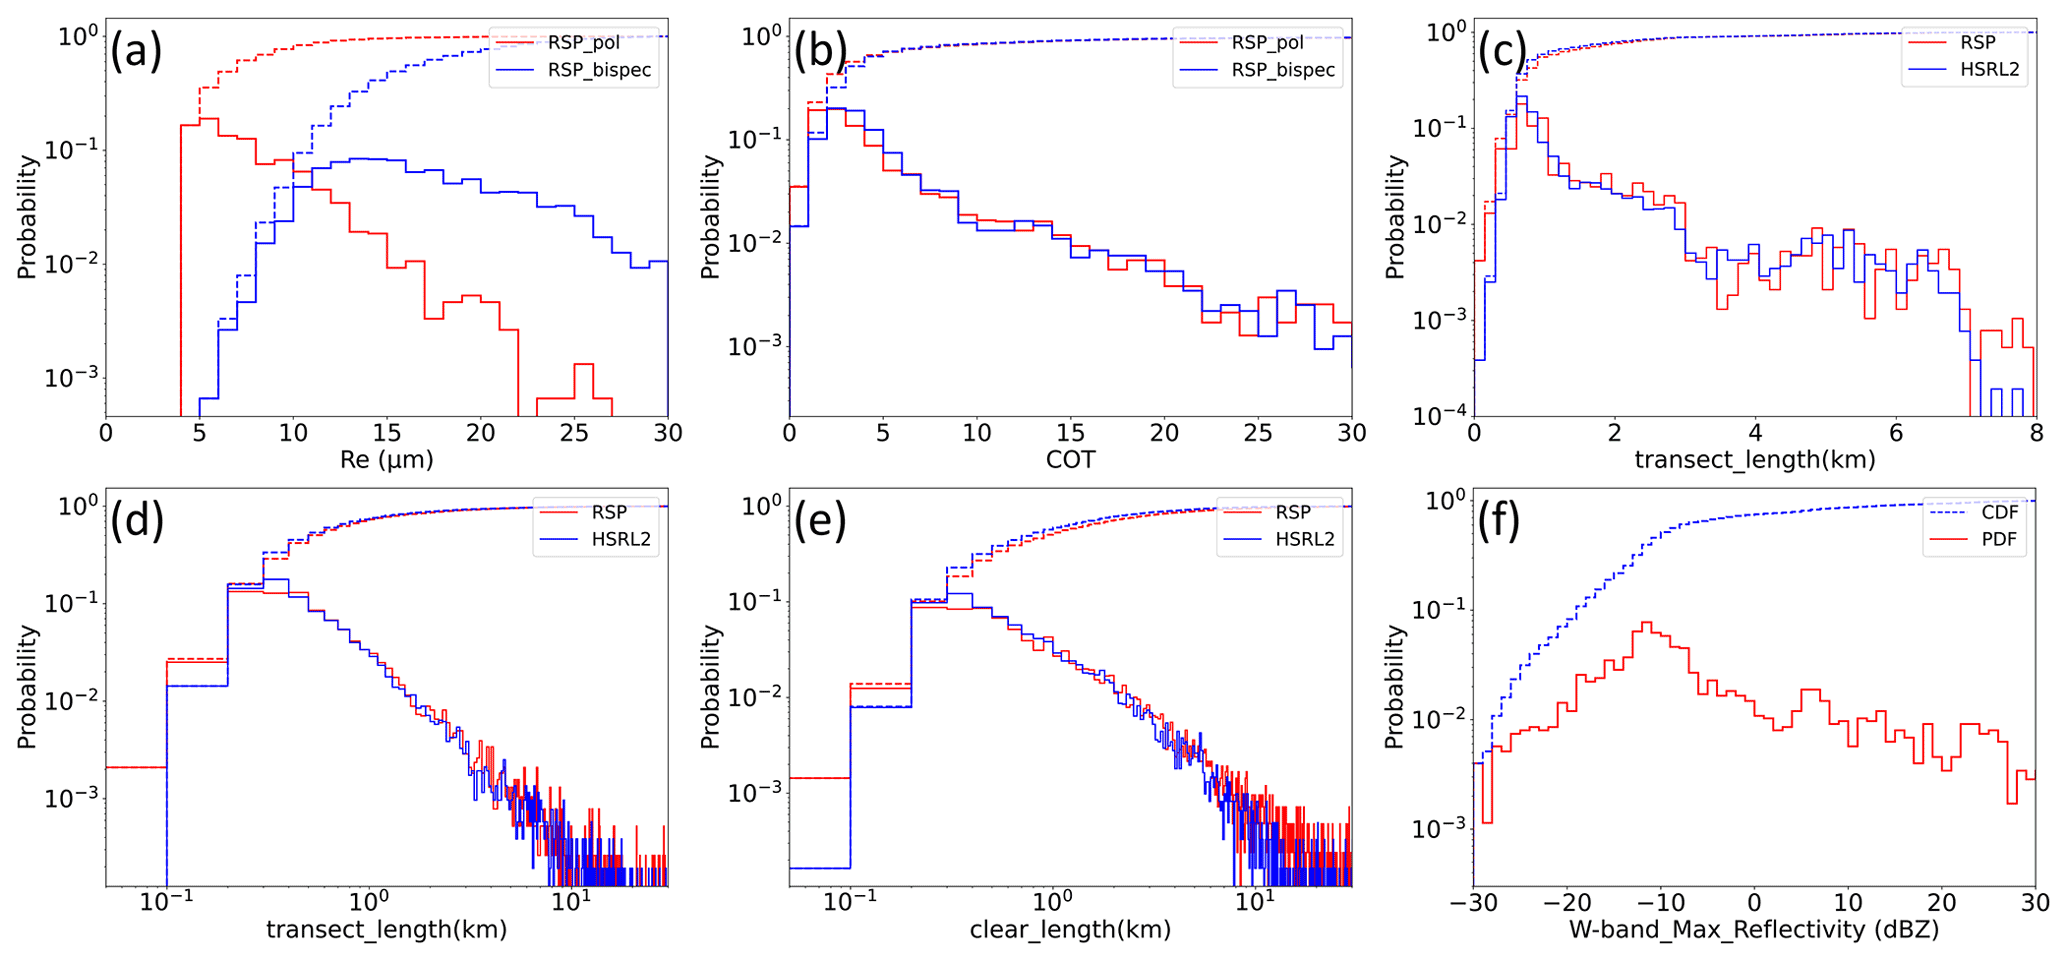
Figure 2Probability distribution function (PDF, solid line) and cumulative distribution function (CDF, dashed line) for cloud element mean values of (a) the RSP polarimetric and bi-spectral Re, (b) the RSP polarimetric and bi-spectral COT, (c) CTH from RSP and HSRL-2, (d) cloud element transect length from RSP and HSRL-2, (e) clear segment length (between cloud elements) from RSP and HSRL-2, and (f) APR-3 W-band maximum reflectivity within a cloud element, using warm oceanic liquid cloud segments from all P-3 research flights.
3.2 RSP cloud microphysics statistics
The ability to retrieve both co-located polarimetric and bi-spectral Re from the RSP allows us to compare the performance of the two techniques without further concerns regarding sampling differences. Figure 3 shows 2-D histograms of RSP polarimetric and bi-spectral Re as well as Re differences (the difference between bi-spectral and polarimetric Re) as a function of COT and CTH, using all 1.2 Hz samples passing the above P-3 cirrus filter for oceanic cloud samples during all flights. The differences between bi-spectral COT and COT as a function of polarimetric Re as well as COT as a function of CTH are also shown. Several key features are displayed in Fig. 3. Figure 3a shows that most of the bi-spectral Re measurements are larger than the polarimetric Re. A linear regression shows that the correlation between the two Re measurements is 0.38, with a bias (difference) of 6 µm and root-mean-square error (RMSE) of 8.2 µm. Figure 3b shows a rapid increase in Re difference as retrieved optical depths decrease below 5. In other words, the largest Re differences are associated with optically thin clouds, which is consistent with the findings from the deployment of the RSP during ORACLES (ObseRvations of Aerosols above CLouds and their intEractionS; Miller et al., 2020). For CAMP2Ex, the differences between the two Re retrievals has a mean of 6.0 µm with a maximum of 26 µm, compared with a mean difference of ∼ 1 µm and a maximum of 15 µm for ORACLES. The likely reason for the much larger Re differences in CAMP2Ex is the greater cloud heterogeneity in the oceanic regions around the Philippines compared with stratocumulus cloud sampled in ORACLES. COT retrievals from the two techniques do not show large differences, as indicated in Fig. 3c. Most of the COT differences are less than 2 (∼ 20 %), which is similar to the results in Miller et al. (2020). Finally, when the Re differences are binned by CTH (Fig. 3d), the Re differences decrease as CTH increases for low to mid-level clouds (CTH < 4 km). As seen from Fig. 3e, COT increases with CTH, which would also result in the liquid water path increasing with CTH. Beyond 4 km, no clear trend in Re difference related to CTH is observed, perhaps because the population is largely alto-clouds (as evident in Fig. 3e).
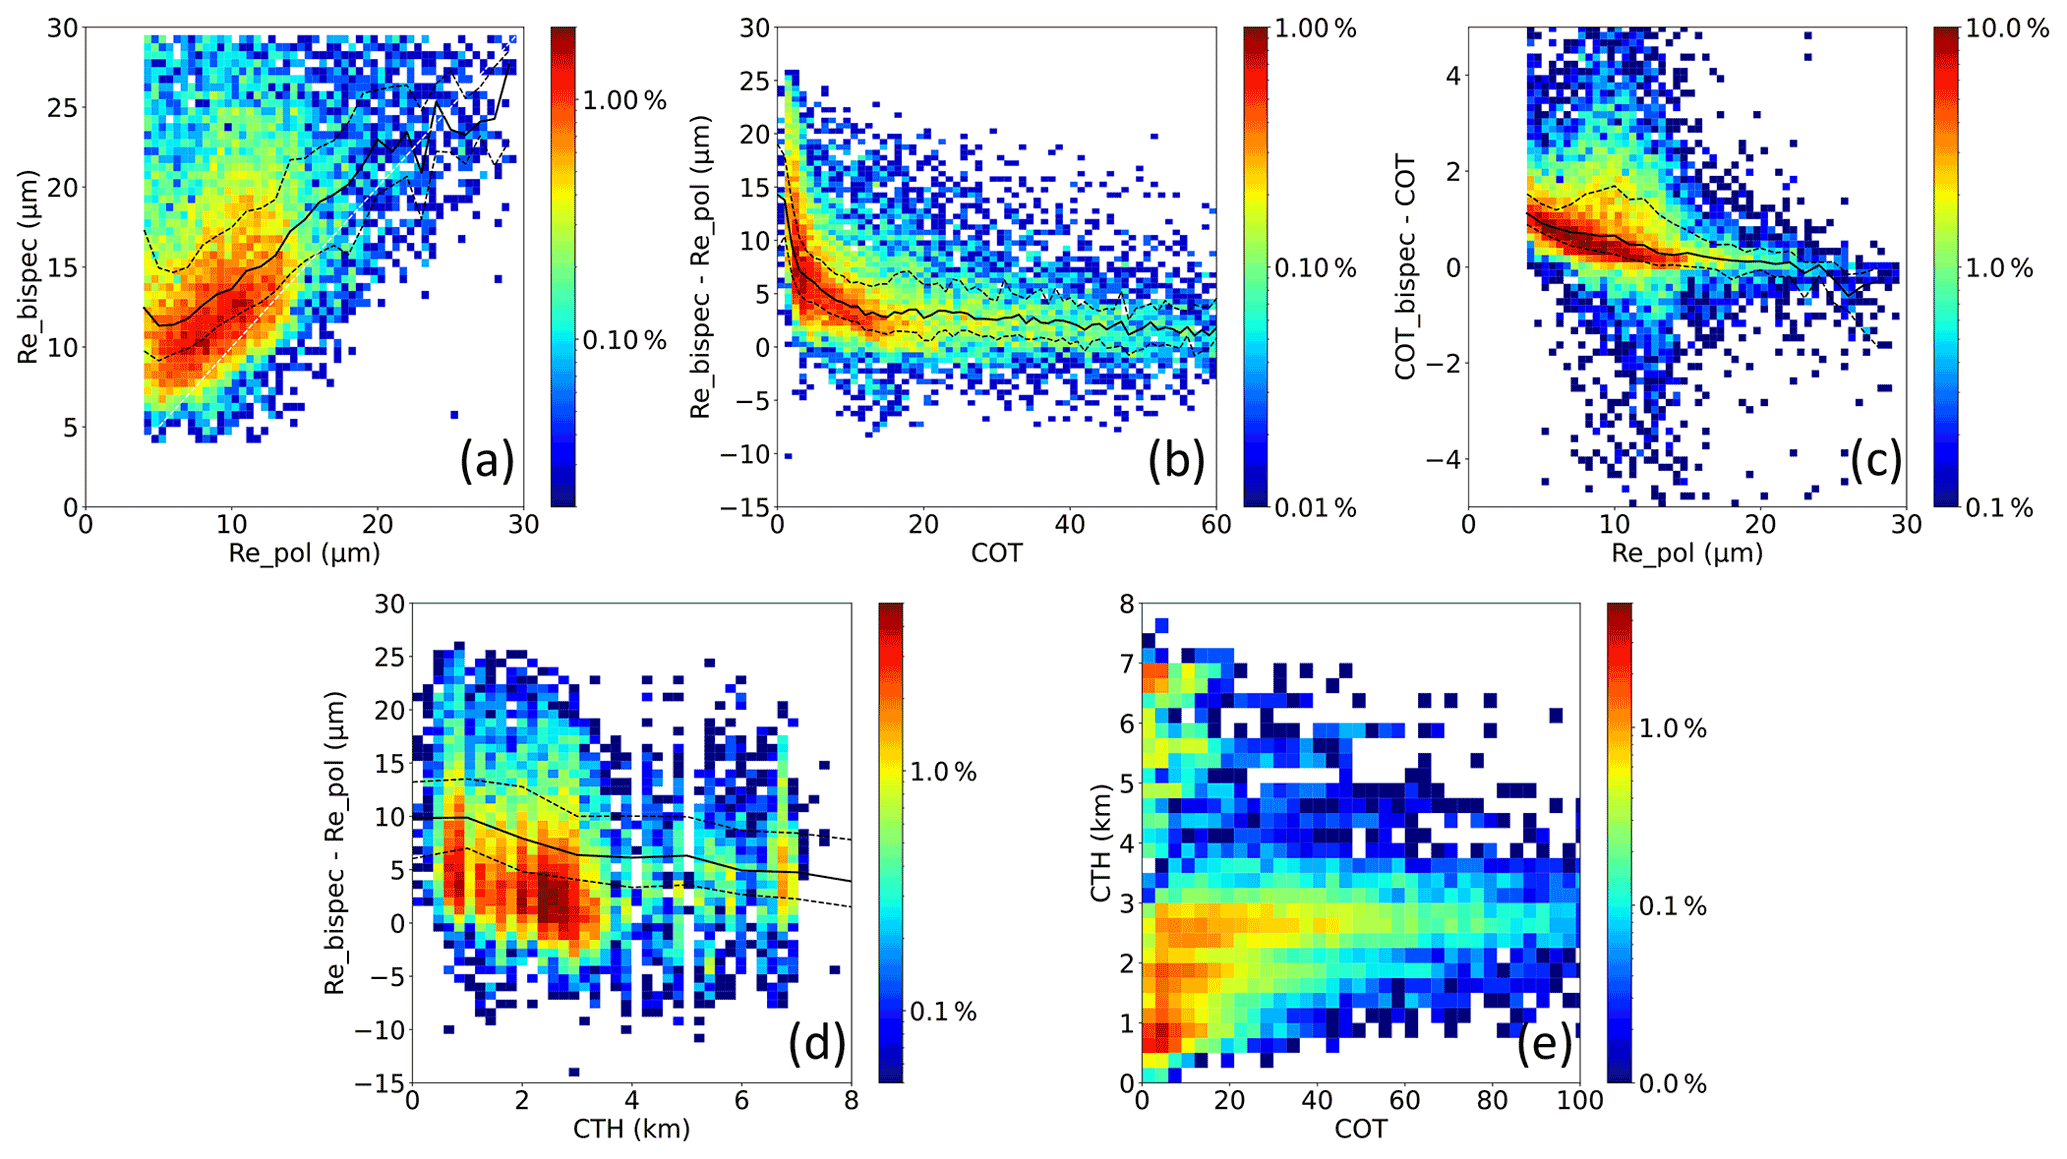
Figure 3RSP 2-D density histogram of (a) polarimetric Re vs. bi-spectral Re, (b) RSP COT vs. Re difference (bi-spectral Re – polarimetric Re), (c) polarimetric Re vs. COT difference (bi-spectral – cloud bow), (d) CTH vs. Re difference (bi-spectral Re – polarimetric Re), and (e) RSP COT vs. CTH. The black solid lines in panels (a)–(d) plot the median with respect to each horizontal bin, and black dashed lines indicate the interquartile range.
This comparison indicates that the bi-spectral Re values are considerably larger than the polarimetric Re. However, without further examining the details of the macrophysics and the microphysics of the sampled cloud fields, it is difficult to comment on possible causes for the observed Re differences. Therefore, it is necessary to focus on individual cloud fields to study the characteristics of each cloud field (Sect. 3.3) and then relate the observed Re differences to other observed properties, such as cloud macrophysics and the presence of drizzle. Possible causes of the differences between the two Re retrieval techniques are further explored in Sect. 4.
3.3 Individual case studies
In our analysis above, we examined the general cloud characteristics and RSP bi-spectral and polarimetric retrieval differences over all 19 P-3 RFs from CAMP2Ex. Here, we provide a few case studies to illustrate detailed intercomparisons between remote sensing (satellite and aircraft) and in situ retrievals of Re during CAMP2Ex. Cases were selected when there was a good overlap between the MODIS, RSP, and in situ sampling over cirrus-free liquid-phase cloud fields over ocean. Table 2 provides the details of selected cases, including the geolocation, MODIS overpass time, selected co-location time period of RSP, and in situ time period for the P-3 and Learjet platforms. For each case, we compare Re sampled by RSP, in situ Re from the P-3 platform, in situ Re from the SPEC Learjet platform, Re sampled by MODIS, and the bias-adjusted MODIS Re from Fu et al. (2019) to evaluate the performance of bi-spectral Re against polarimetric Re and in situ Re measurements. For a shallow cumuli case from RF17, the co-located high-resolution ASTER (also onboard Terra) data allow us to highlight the representativeness of MODIS L2 cloud retrievals in sub-pixel cloud fields. In an effort to keep this discussion concise, we discuss only RF02 here; additional figures and discussions for the RF07, RF12, and RF17 case studies are given in the Supplement.
Table 2Individual case details showing the research flight (RF) designation, approximate domain-center geolocation, MODIS overpass time (UTC), RSP, P-3 in situ and Learjet in situ time periods (UTC), and a brief description of sampled cloud fields. NA – not available.

3.3.1 RF02, 27 August 2019
During RF02, shallow convection was observed near 18.6∘ N, 116.9∘ E, as shown in the MODIS RGB image (Fig. 4a) during the Terra overpass at 03:05 UTC. The P-3 first entered the area depicted in Fig. 4a around 03:00 UTC on a low-altitude leg (∼ 500 m), sampling below the shallow cumulus field. Between 03:00 and 03:30 UTC, the P-3 conducted several upward ascents into level legs to sample clouds in situ. Several high-altitude remote sensing legs were flown between 03:30 and 04:30 UTC, sampling along a cumulus cloud line between 17 and 19∘ N and between 116 and 117∘ E, as indicated in Fig. 4a. This cloud field occurred in the vicinity of a larger low-pressure system east of Luzon; some thin cirrus clouds are observed to the east of the sampled clouds. During the 1.5 h time period, AHI imagery indicated that the shallow convective line retained its overall pattern and distributions, exhibiting consistent cloud-top structures of typical broken shallow to moderate cumulus. Cirrus and ice clouds were filtered out from MODIS according to the MODIS L2 phase flag. For the P-3 platform, the lower cumuli were mostly not affected by cirrus, as seen from the AHI imagery and according to the SPN-S transmittance above the P-3. MODIS L2 retrievals show Re ranging from 8 to 30 µm, associated with optically thin to moderately thick COT (1–50) and a CTH of ∼ 500 to 4000 m. The RSP bi-spectral Re also shows a range of 8 to 30 µm, similar to MODIS. In great contrast, RSP polarimetric Re, bias-adjusted MODIS Re, and Re derived in situ from P-3 all suggest a similar range of 5 to 15 µm (with only a few outliers ∼ 20 µm), which is much lower than the bi-spectral Re retrievals. The W-band maximum reflectivity from APR-3 indicates some precipitation in the deeper clouds (CTH > 2 km).
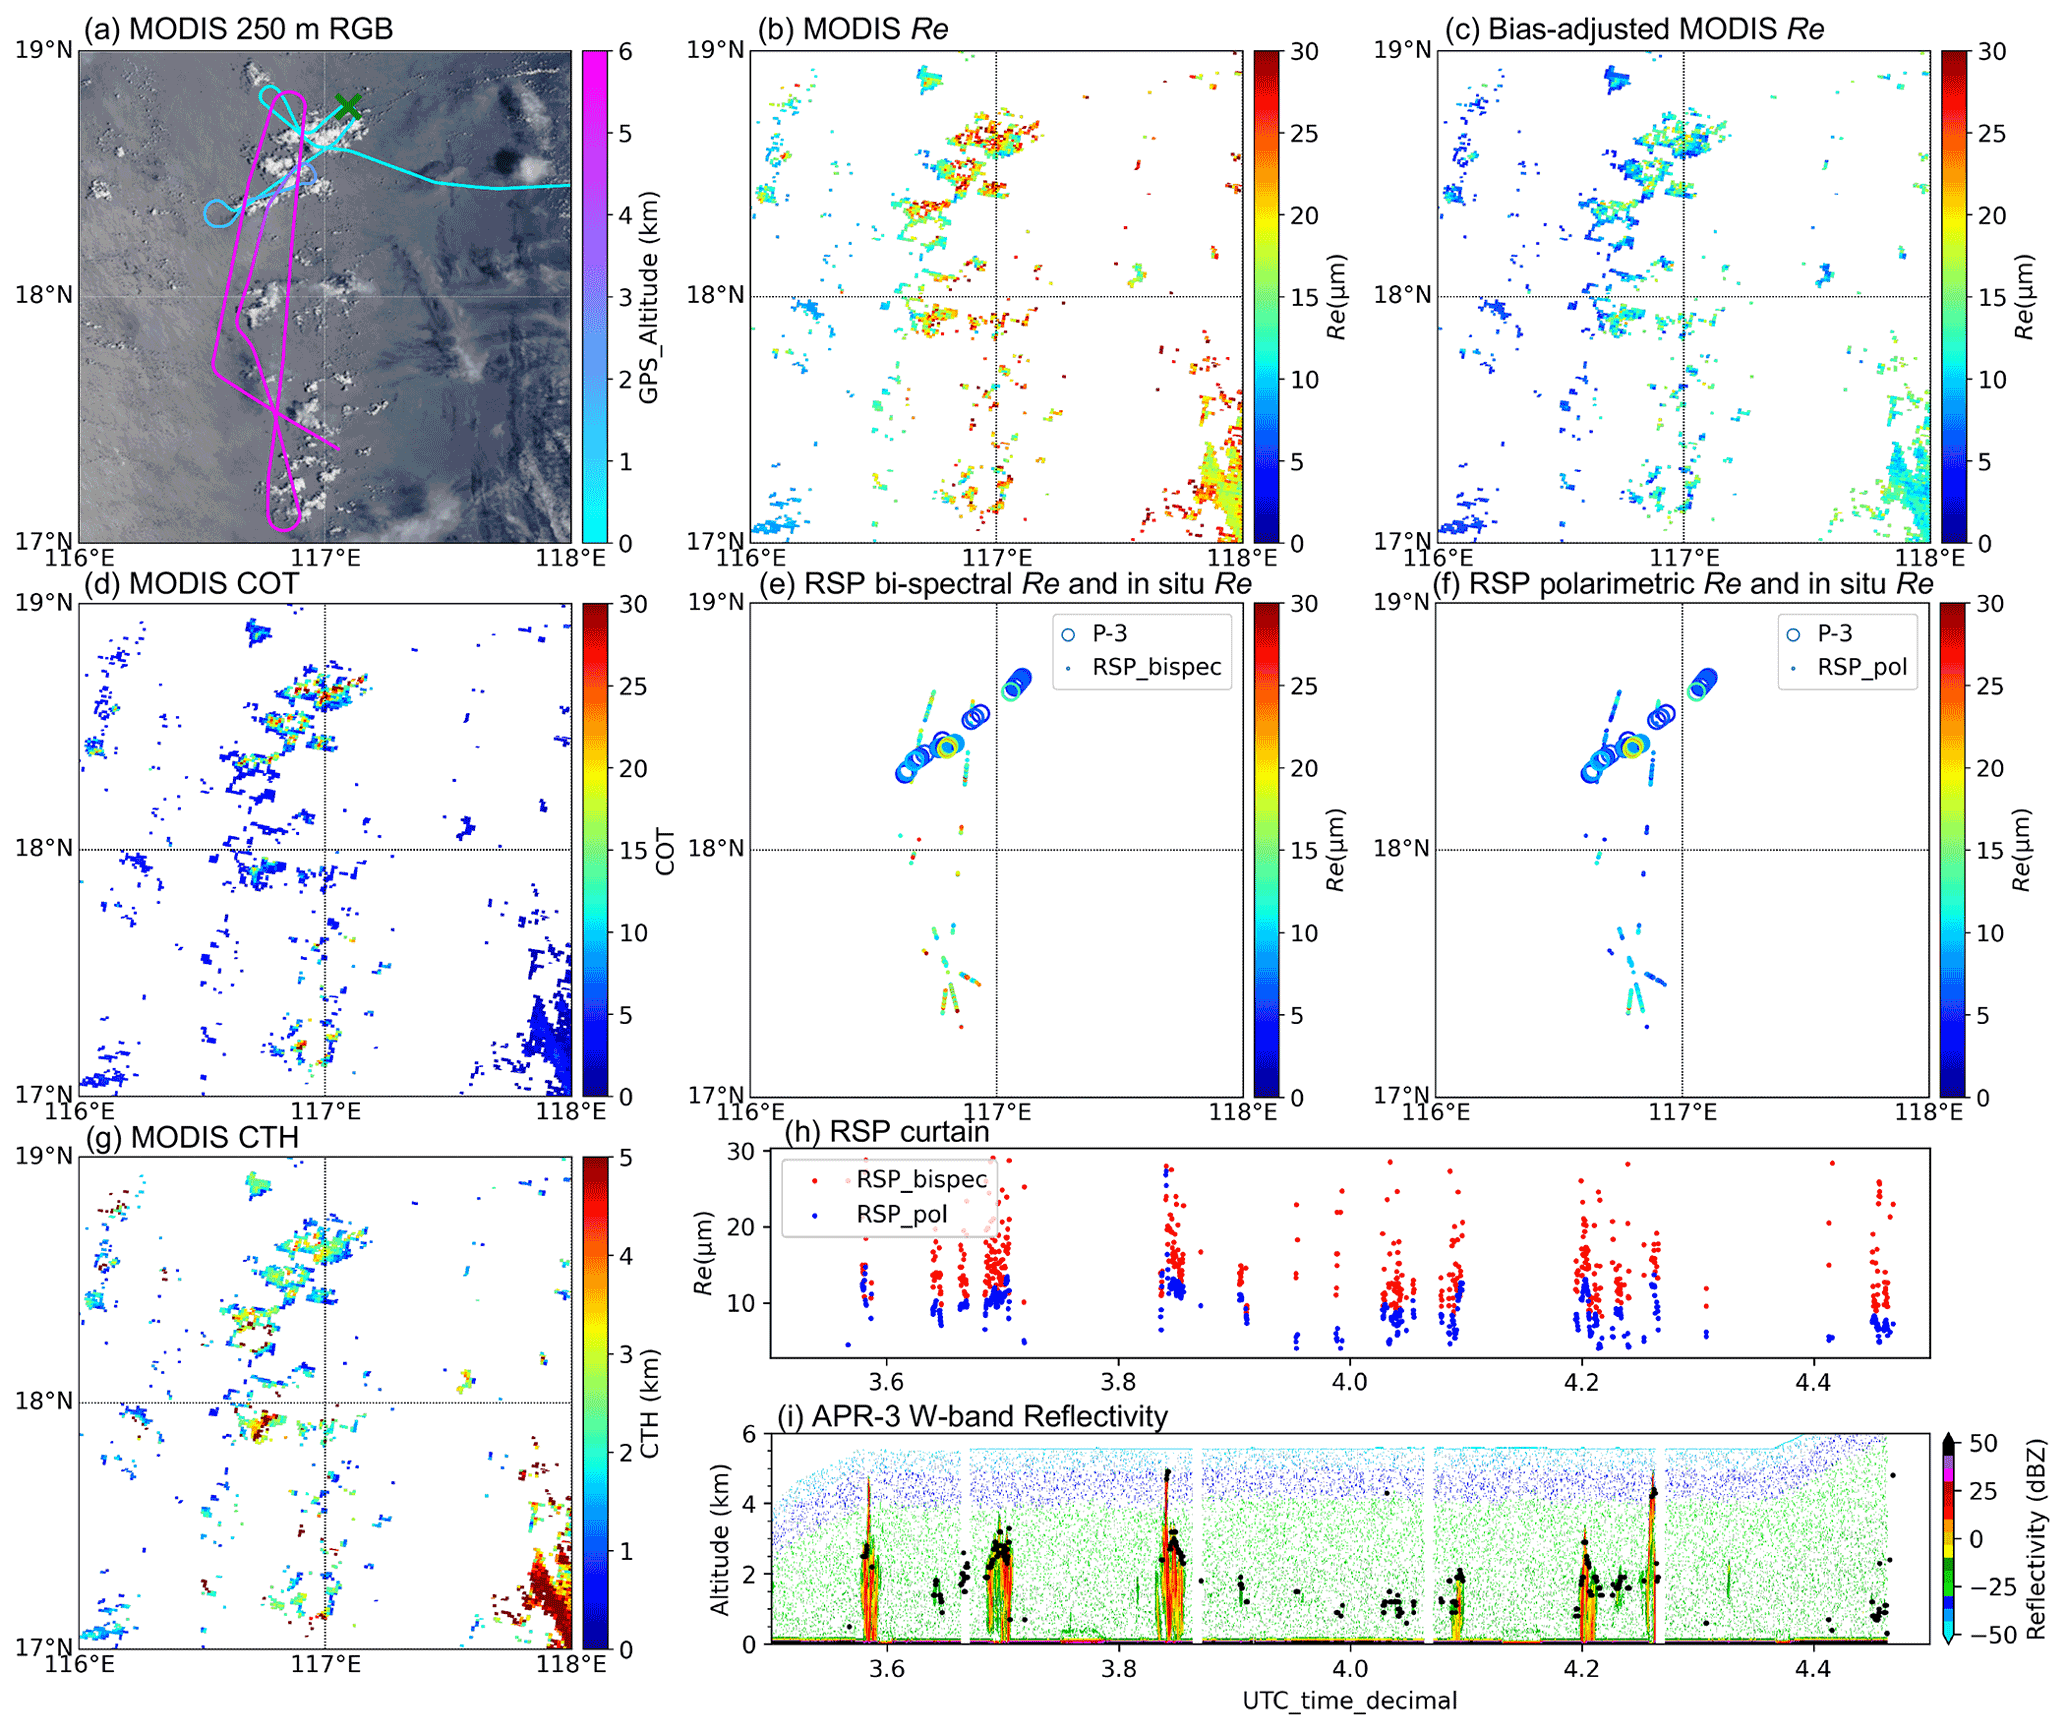
Figure 4(a) MODIS RGB reflectance at 03:05 UTC on 27 August 2019; the color bar indicates the P-3 altitude and flight track within ±1.5 h of the MODIS overpass time, and the green cross indicates the P-3 location at the MODIS overpass time. (b) MODIS Level 2 1 km Re retrievals from the 2.1 µm channel. (c) MODIS Level 2 1 km bias-adjusted Re retrievals from the 2.1 µm channel after applying the Fu et al. (2019) correction factors. (d) MODIS Level 2 1 km COT from the 2.1 µm channel. (e) RSP bi-spectral Re retrievals from the 2.26 µm channel; in situ Re from P-3 is displayed using circles. (f) RSP polarimetric Re retrievals from the 0.86 µm channel; in situ Re from P-3 is displayed using circles. (g) MODIS Level 2 1 km CTH retrievals. (h) RSP Re curtain between 03:30 and 04:30 UTC. (i) APR-3 W-band reflectivity and RSP CTH (black dots) between 03:30 and 04:30 UTC.
The RSP bi-spectral and polarimetric Re retrievals have the same sampling, as does MODIS Re and the MODIS bias-adjusted Re; therefore, they are directly comparable. However, a direct pixel-to-pixel comparison between MODIS, RSP, and Re values sampled in situ is essentially impossible because they are not coincident in space and time. Nevertheless, the samples were collected in a fairly small spatiotemporal window over which little overall change in the cloud field occurs, as indicated by AHI imagery. We sorted the Re retrievals into 250 m CTH bins. The Re mean and standard deviation are computed for each height bin as a means of comparing the remote sensing techniques' ability to capture the variations in Re with CTH, which is important when using the data to understand cloud processes. As the tops of cumulus clouds sampled in situ are hard to determine, the platform altitude was used for in situ sampling, noting that these Re derived in situ are in-cloud measurements rather than a vertically weighted near-cloud-top Re as obtained from remote sensing. While acknowledging the different sensitivity to cloud exterior and in-cloud microphysics for these different techniques, observations and simulations have shown, for shallow cumulus clouds, that low variation in Re (∼ 10 %) exists between the exterior and interior of clouds at a given altitude (e.g., Khain et al., 2019; Gerber et al., 2008). Thus, we primarily focus on accounting for the systematic variation with altitude. To do this, we binned Re retrievals from all five techniques (P-3 in situ, RSP polarimetric, RSP bi-spectral, MODIS bi-spectral, and bias-adjusted MODIS) separately as a function of binned CTH/altitudes. The results for the RF02 case are given in Fig. 5. All five techniques indicated an overall pattern of increasing Re with height. One prominent feature of Fig. 5 is that, for mid- to low-level cloud tops (below 3.5 km), the P-3 in situ (FCDP and 2D-S), RSP polarimetric, and bias-adjusted MODIS Re values all indicate an increasing Re profile from ∼ 7 to ∼ 15 µm in the mean values. Thus, despite the differences in sampling and retrieval technique, the three are very consistent; the mean difference between the three Re profiles (Table 3) are all within 2 µm. The bi-spectral Re from RSP and MODIS, however, shows much larger values than the other three techniques, with increasing Re profiles from ∼ 13 to ∼ 22 µm. Thus, despite sampling and resolution differences, these two bi-spectral products are consistent among themselves, with the RSP bi-spectral Re ∼ 3 µm smaller than that from MODIS. The bi-spectral Re values from MODIS and RSP also show much greater Re variability at each height level (as seen from the horizontal whiskers), compared with RSP polarimetric, in situ, and bias-adjusted MODIS Re. For CTH below ∼ 1.3 km, the RSP bi-spectral Re suggests a decreasing Re profile, which is essentially the opposite of the other techniques. At higher altitudes, the existence of drizzle tends to result in higher Re values with larger variability for both RSP polarimetric and bi-spectral Re retrievals. The APR-3 and RSP curtains in Fig. 4 also confirm the correlation between drizzle and larger Re values for both techniques. At ∼ 3.5 km, Re derived in situ indicated values of 13–20 µm, as it penetrated a convective cloud whose tops were higher than the P-3 by several hundred meters and visually appeared to be optically thick, as indicated by the P-3 forward video just before cloud penetration. Splashing of precipitation on the P-3 windshield was also evident from the forward video. Apart from sampling differences, some of the variability between in situ Re and the remotely sensed Re may also be due to entrainment and mixing (e.g., Gerber et al., 2008).
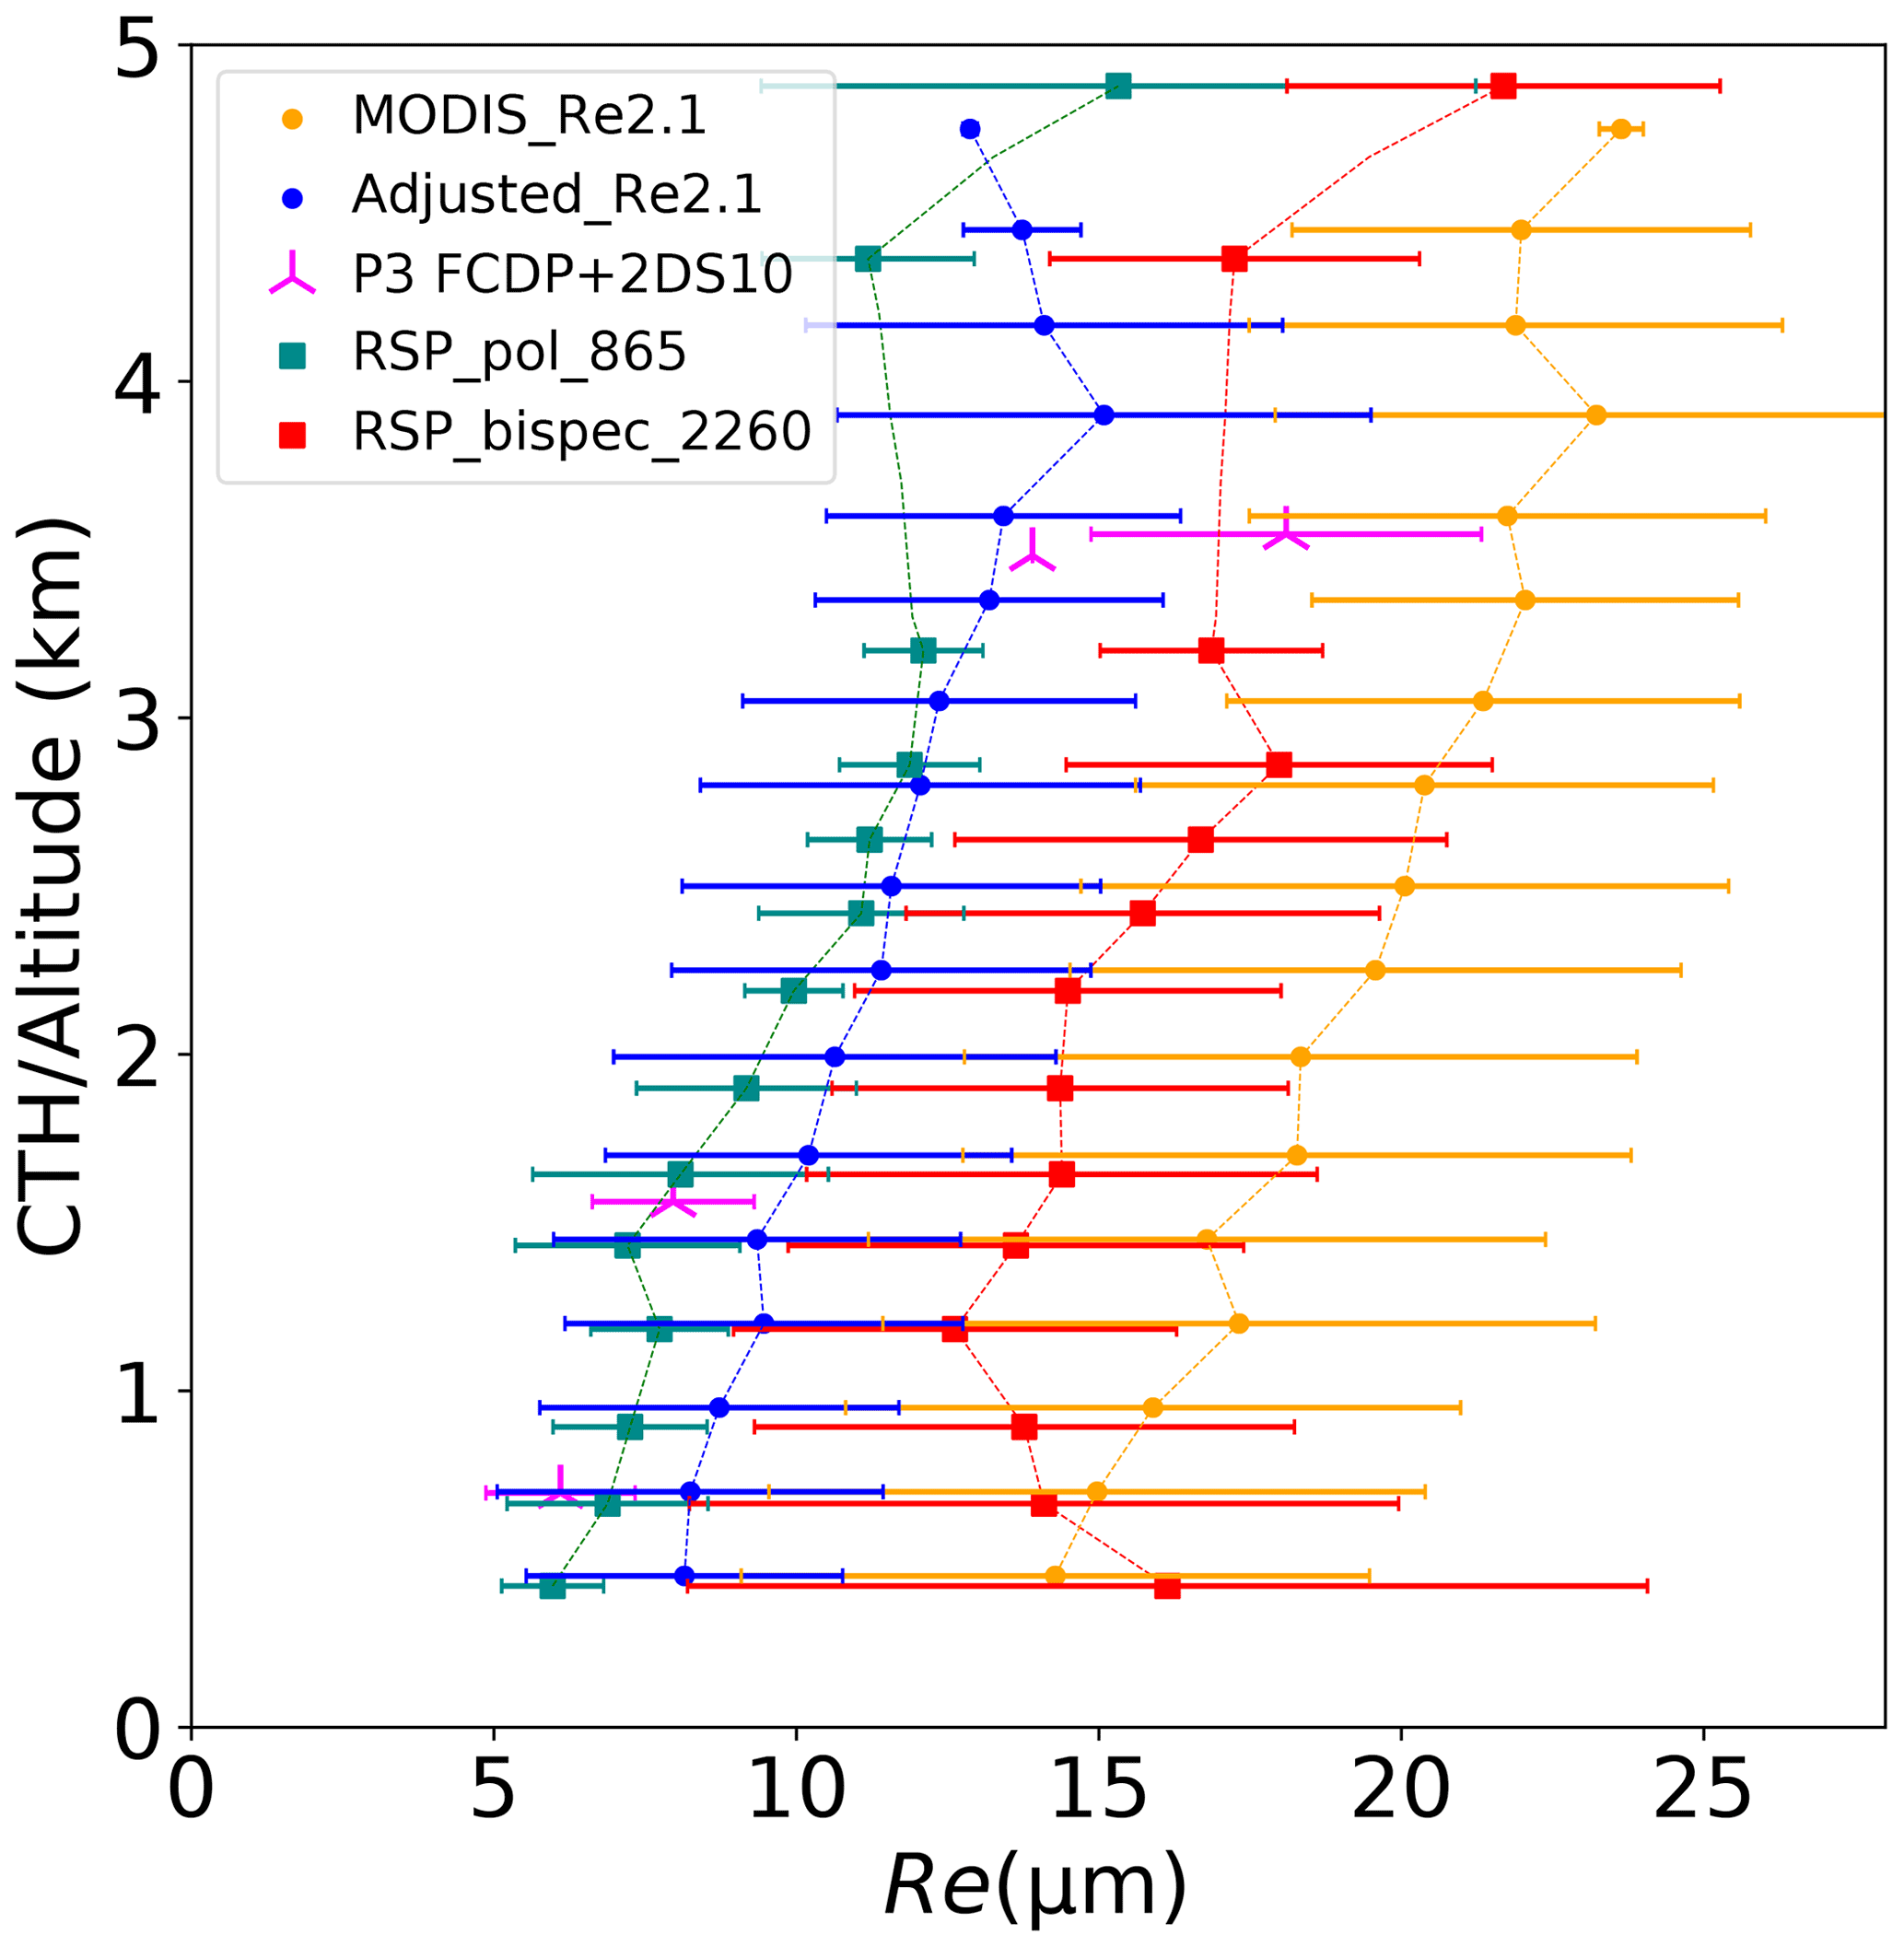
Figure 5Re profile (mean Re vs. mean height) of vertically binned MODIS Re, bias-adjusted MODIS Re (after applying the Fu et al., 2019, correction factors), RSP polarimetric Re, RSP bi-spectral Re, and P-3 Re derived in situ for the RF02 case. Horizontal whiskers indicate the standard deviation of data within each 250 m altitude bin.
Table 3Mean bias (difference) between the RSP polarimetric technique and the other techniques for the four case studies. NA – not available

3.3.2 Summary and discussion of case studies
The analysis and discussion of RF07, RF12, and RF17 presented in the Supplement follow the figures and discussion given above for RF02. Table 3 summarizes the mean difference between the RSP polarimetric Re and the other techniques for these cases. At lower altitudes, the Learjet and P-3 in situ and RSP polarimetric Re values are in good agreement. While acknowledging that the definition of Re is different for remote sensing retrievals and in situ measurements, the overall good agreement between polarimetric and in situ Re should provide more confidence in the performance of polarimetric Re retrievals in cumulus cloud fields. In all comparison cases, RSP polarimetric Re also agrees well with the MODIS bias-adjusted Re, despite the resolution and sampling differences between the two. Finally, both the RSP bi-spectral and MODIS Re values show good agreement with each other, although with the overall largest Re values among all techniques. The distinct separation between bi-spectral Re and Re from all other techniques implies an overestimate in bi-spectral Re for cumulus clouds regions; the mean Re differences of ∼ 5–10 µm in the individual cases match with the estimates of ∼ 6–9 µm bias in the 2.1 µm channel MODIS Re found by Fu et al. (2019).
The impact of drizzle on Re from these case studies was evident in remotely sensed and in situ observations. Direct comparison between in situ and remote sensing in deeper clouds containing drizzle was hampered by the fact that the in situ samples containing drizzle and large Re values occurred at locations that were not close to cloud top according to the aircraft forward video. Therefore, we undertake a more extensive examination of the impact of drizzle on our comparison of bi-spectral and polarimetric retrievals in Sect. 4.2.2 using APR-3.
As mentioned in Sect. 2.2, we acknowledge the channel differences between the MODIS 2.1 µm and RSP 2.26 µm Re retrievals, so we do not expect the Re retrieved from MODIS and RSP bi-spectral to have the exact same bias. In our analysis, other contributing factors that may impact the differences between RSP 2.26 µm bi-spectral Re and MODIS 2.1 µm Re include (1) sampling differences, (2) channel differences in the face of vertical and horizontal variations in cloud optical properties, and (3) pixel size difference in the face of 3-D variations. Despite these factors, the RSP 2.26 µm bi-spectral Re and MODIS 2.1 µm Re have very similar behavior, exhibiting a large positive bias and much greater variability in Re relative to the other techniques.
3.3.3 A brief look at the representativeness of MODIS retrievals with ASTER
As indicated in Fig. 2, CAMP2Ex samples contain lots of small clouds; this introduces possible sub-pixel issues with respect to the MODIS retrievals and calls the representativeness of MODIS-derived cloud climatologies into question. Here, we use RF17 to illustrate a few points. RF17 sampled a field of small, shallow cumuli that appear very different from the previous cases. The most prominent feature for this case is the abundance of small broken cumulus clouds in this domain (Fig. 6a). On 2 October at around 01:00 UTC, the P-3 platform entered the region at around 1.5 km altitude and then descended to ∼ 100 m above sea level to begin in situ measurements below cloud base and at various levels within clouds. Around 02:00 UTC, the P-3 started climbing from 1 to 5 km altitude to perform remote sensing sampling, with long stretches of straight legs, as shown in Fig. 6a. The aircraft exited the region at around 04:30 UTC. A Terra overpass took place at 02:40 UTC. The MODIS and ASTER imagery indicates that clouds were mostly very shallow, small cumuli in this case. To better demonstrate the representativeness problem with MODIS retrievals in this common type of cloud field, we overlaid the MODIS 1 km resolution Re retrievals over the MODIS 250 m RGB imagery (Fig. 6a) and ASTER 15 m radiances (Fig. 6b) for the box region highlighted in red in Fig. 6a.
Figure 6a shows that, while there are numerous very small broken cumulus clouds in the scene, the MODIS L2 Re only reported a handful of pixels with successful retrievals. For the successful MODIS Re retrievals shown in Fig. 6b, the estimated cloud fraction from ASTER 15 m imagery ranges from ∼ 0.25 to 0.62. It clearly shows that these small cumuli are sub-pixel for MODIS L2 retrievals, with cloud variability that cannot be resolved by MODIS. It is expected that this unresolved variability leads to biases in MODIS-retrieved Re, which we further investigate in Sect. 4.2. The MODIS Re retrievals (Fig. 6a, d) and RSP bi-spectral retrievals (Fig. 6c) both suggest Re values in the range of 6 to 30 µm (median Re value of 14.0 µm for MODIS Re and median Re value of 12.0 µm for RSP bi-spectral Re). The RSP polarimetric Re, however, shows much smaller values of 4 to 7 µm (median Re value of 5.3 µm) that also agree well with the P-3 in situ Re (median Re value of 6.1 µm). Similar to Fig. 5, Re retrievals from the different techniques binned by CTH/altitude for the RF17 case are included in the Supplement (Fig. S6).
While not shown, many clouds in the scene are correctly identified by MODIS as partly cloudy (PCL) pixels and are excluded from the standard Re product analyzed here. We examined MODIS PCL Re retrievals within the domain in Fig. 6a; they revealed that most of the Re values were in the 10 to 30 µm range, with a median value of 18.5 µm, which is 4.5 µm larger than the standard MODIS Re. This is mostly due to MODIS not being able to resolve the sub-pixel variability, and the low sub-pixel cloud fraction would lead to erroneously larger Re values. Some failed retrievals may also be attributed to the finite range of the bi-spectral lookup table (LUT). For example, Cho et al. (2015) showed that failed retrievals in the MODIS product would occur whenever the retrievals fell outside the LUT range, and this failure rate can be as high as 40 % in the Southeast Asia oceanic region. This calls the validity of the representativeness of long-term MODIS climatologies into question for regions dominated by small cumulus cloud fields.
As the largest (i.e., > 5 µm) observed Re bias between the bi-spectral and polarimetric technique tends to occur for small retrieved optical thicknesses (COT < 5, Fig. 3b), it is especially important to consider the uncertainties in the retrieval process that can affect the bi-spectral retrieval, even when the core assumptions of 1-D radiative transfer are met. Sources of uncertainty include instrument calibration, atmospheric correction, the surface bidirectional reflectance distribution function (BRDF), the assumed size distribution shape, and the retrieval logic. These uncertainties are derived for MODIS in Platnick et al. (2004), and they are globally validated for COT retrievals of oceanic liquid-water clouds in the limit of homogeneous clouds in Di Girolamo et al. (2010). Nevertheless, even in the case of ideal simulated 1-D retrievals, retrieved Re values can be biased high due to the presence of multiple Re solutions and the limitations of lookup table interpolation for low optical depth (Miller et al., 2018). However, these large Re retrievals are much more frequent in our data (e.g., Fig. 3b) than can be reasonably explained by these sources of uncertainty, as discussed below.
For MODIS, the uncertainty in retrieved Re can be significant (16 %–30 %) for COT < 5 (Platnick et al., 2017). Similar uncertainties can be anticipated for RSP, as RSP has a calibration uncertainty of 3 % (Knobelspiesse et al., 2019), which is similar to MODIS. Even in the worst-case scenario in which all uncertainties are systematic across the field campaign period, these uncertainties are much smaller than the factor of 2 differences observed between RSP polarimetric and bi-spectral Re with COT < 5. This indicates that other retrieval assumptions should be investigated to understand the cause of the observed differences between the Re retrieval techniques.
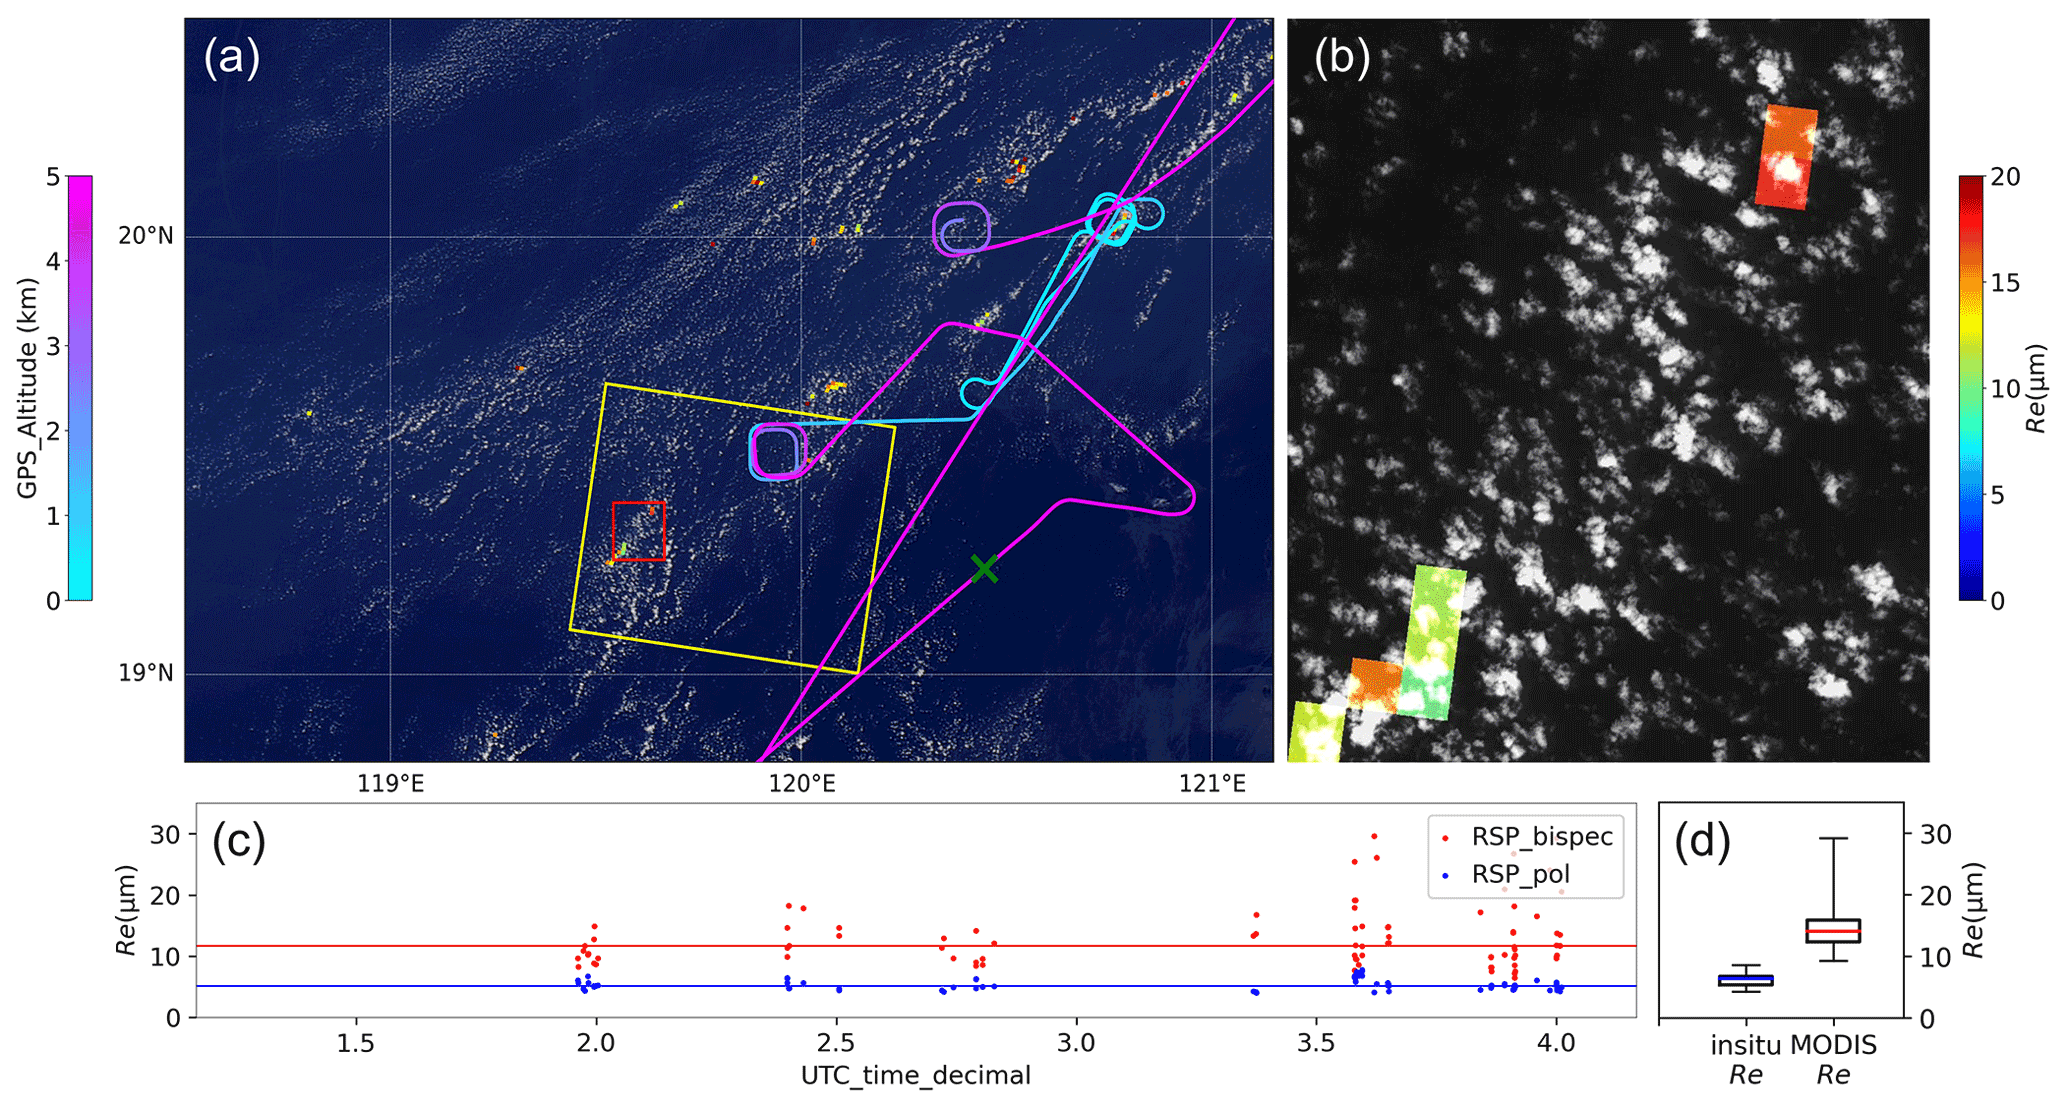
Figure 6(a) MODIS 250 m RGB reflectance at MODIS overpass (02:40 UTC) overlaid by MODIS Level 2 liquid Re retrievals for the RF17 P-3 flight path within 1.5 h of the MODIS overpass; the flight path is color-coded by altitude, the green cross indicates the P-3 position at the MODIS overpass time, the yellow box indicates the outline of the co-located ASTER 15 m granule, and the red box indicates the outline of the close-up view shown in panel (b). (b) Close-up view of ASTER 15 m resolution Band 3 nadir (3N) radiance, overlaid by MODIS Level 2 liquid Re retrievals. (c) Scatterplot of RSP polarimetric and bi-spectral Re retrievals within 1.5 h of the MODIS overpass time; the blue and red lines indicate the median value for the RSP polarimetric and bi-spectral Re retrievals, respectively. (d) Box plots of the MODIS Re retrievals shown in panel (a) and P-3 Re derived in situ within 1.5 h of the MODIS overpass time; the line in the box indicates the median Re value.
The literature contains extended discussions relating passive cloud retrieval bias in COT and Re to the impact of sub-pixel heterogeneity and other 3-D effects (e.g., Marshak et al., 2006; Zhang and Platnick, 2011; Zinner et al., 2010; Zhang et al., 2012, 2016), sun-view geometry (e.g., Loeb and Davies, 1996; Várnai and Davies, 1999; Liang and Di Girolamo, 2013; Grosvenor and Wood, 2014), and the presence of drizzle (e.g., Zhang et al., 2012; Ahn et al., 2018). In this section, we test the hypothesis that retrieval errors from 3-D effects contribute to measurable bias in Re retrievals from the CAMP2Ex dataset. To facilitate our investigation, we used a cloud-element-labeling technique based on RSP L2 cloud retrievals, where a cloud element is defined as a region with contiguous CTH retrievals. We then provide statistics of cloud microphysics and macrophysics for each cloud element. We use cloud macrophysical properties (e.g., cloud size, cloud-top bumpiness, CTH) and solar zenith angle (SZA) as proxies to relate to 3-D radiative effects and test the sensitivity of the Re bias to these factors (Sect. 4.2). We also look at the impact of drizzle on Re bias and find no apparent relationship between the two (details in Sect. 4.2.2).
4.1 RSP cloud element analysis
The cloud-element-labeling technique was developed using the RSP CTH retrievals. A contiguous set of CTH retrievals are counted as one cloud element. Places with no retrievals between the cloud elements are labeled as “clear” segments. For each cloud element, means and standard deviations of cloud properties (Re, COT, CTH) are calculated along with the cloud elements' horizontal length. This method allows one to further relate the RSP-retrieved cloud properties to quantities such as the standard deviation of CTHs and cloud horizontal length, which can serve as proxies for cloud-top bumpiness and cloud size to further investigate the sensitivity of Re retrievals to these factors. When developing the cloud-element-labeling technique, we compared the cloud elements derived using RSP CTHs with that derived from HSRL-2 CTHs (Fig. 2c). While the two CTHs showed very similar results, we chose to use RSP because Re and COT are tied directly to RSP sampling.
This cloud element analysis was implemented for all research flights with good cloud sampling segments (number of cloud elements > 3), without further consideration for MODIS or in situ co-locations. Table 4 lists the 12 research flights and time periods used in our analysis. Figure 7 shows mean Re values for each cloud element as a function of its mean CTH, with whiskers representing the standard deviations of Re and CTH for the cloud element. Each cloud element is color-coded by its cloud transect length. A prominent feature in Fig. 7 is the high degree of correlation between the RSP polarimetric Re and CTH means (linear correlation coefficient, r, of 0.64 averaged across all 12 cases), compared with the correlation between the RSP bi-spectral Re and CTH means (r=0.18 averaged across all 12 cases). The variability in bi-spectral Re is also much larger than that of polarimetric Re across all CTH levels, particularly for the lower levels (below 2 km). Colors also indicate that lower clouds are more often found with smaller lengths (less than 5 km and often less than 1 km), indicating that low clouds are mostly very small cumuli. Figure 7 also shows that higher clouds often have higher CTH standard deviations, indicating bumpier cloud tops. Overall, the bi-spectral Re values are much larger than the polarimetric Re values across all CTH ranges. Across all 12 flights, the mean Re difference between the bi-spectral and the polarimetric Re is 11 µm.

Figure 7RSP cloud element mean Re vs. mean CTH for from 12 research flights with good RSP sampling of warm cumulus and congestus clouds. The dots represent the mean Re value vs. mean CTH of each cloud element, and the whiskers indicate the standard deviations of Re and CTH for each cloud element. Cloud elements are color-coded by their horizontal transect lengths.
Table 4The time periods of 12 research flights used to construct the analysis shown in Fig. 7.
4.2 Sensitivity of Re retrieval bias to potential factors
In this section, the RSP cloud element statistics throughout the entire CAMP2Ex mission are used to investigate the impact of various potential factors on the observed Re differences between RSP polarimetric and bi-spectral retrievals. The factors investigated include COT, cloud size, cloud-top bumpiness, sub-pixel heterogeneity, SZA, and drizzle. In reality, the impacts of these factors are often intertwined. For example, clouds with smaller lengths are also shallower and optically thinner. Deeper clouds may also have larger lengths and increased likelihood of drizzle. While it is not possible to fully isolate the impact from each individual factor, we will focus our discussion primarily within the scope of 3-D radiative effects, sub-pixel heterogeneity, and drizzle.
4.2.1 Three dimensional (3-D) radiative effects and sub-pixel heterogeneity
Cloud optical thickness and cloud size
Figure 8a shows the differences between the cloud element mean polarimetric Re and bi-spectral Re retrievals organized as a function of cloud optical thickness. A sharp decrease in Re differences (bi-spectral − polarimetric) from ∼ 25 to ∼ 8 µm (maximum Re difference) is observed with increasing COT up to 9. This difference tapers off to a value of roughly 4 µm for larger COT values. This pattern is similar to Fig. 5a in Marshak et al. (2006), where they used 3-D large eddy simulation (LES) simulations to discuss the radiative effects of clouds' 3-D structure in 1-D Re retrievals using the bi-spectral technique. Marshak et al. (2006) concluded that shadowing effects (defined as when the measured reflectance is lower than its 1-D plane-parallel equivalent reflectance) dominate over illumination effects (measured reflectance is higher than its 1-D plane-parallel equivalent reflectance) in cumulus cloud fields and lead to an overestimate in retrieved 1-D Re. Vant-Hull et al. (2007) studied the impact of scattering angle on cumulus clouds and found that 3-D cloud structures would lead to overestimates in the 1-D bi-spectral Re retrievals far from the backscatter direction (where shadowing effects dominate). However, near the backscatter viewing geometry (where illumination effects dominate), the opposite is true. To date, these effects in cumuliform cloud fields have only been studied through simulations. As RSP bi-spectral retrievals were never taken close to the backscatter direction, the expectation is an overall overestimate of retrieved Re using the bi-spectral technique. If we assume the RSP polarimetric Re as the true Re (given how well it compared with Re derived in situ in Sect. 3.3), Fig. 8a suggests that large overestimates in bi-spectral Re will dominate in broken cumulus scenes (typical in CAMP2Ex), consistent with the earlier studies based on simulations. However, differences do exist. For example, we observe fewer negative values of scattered Re differences in Fig. 8a compared with Fig. 5a of Marshak et al. (2006). This may be due to different sun-view geometries, cloud structures, and cloud microphysics between RSP retrievals in CAMP2Ex and the simulations in Marshak et al. (2006).
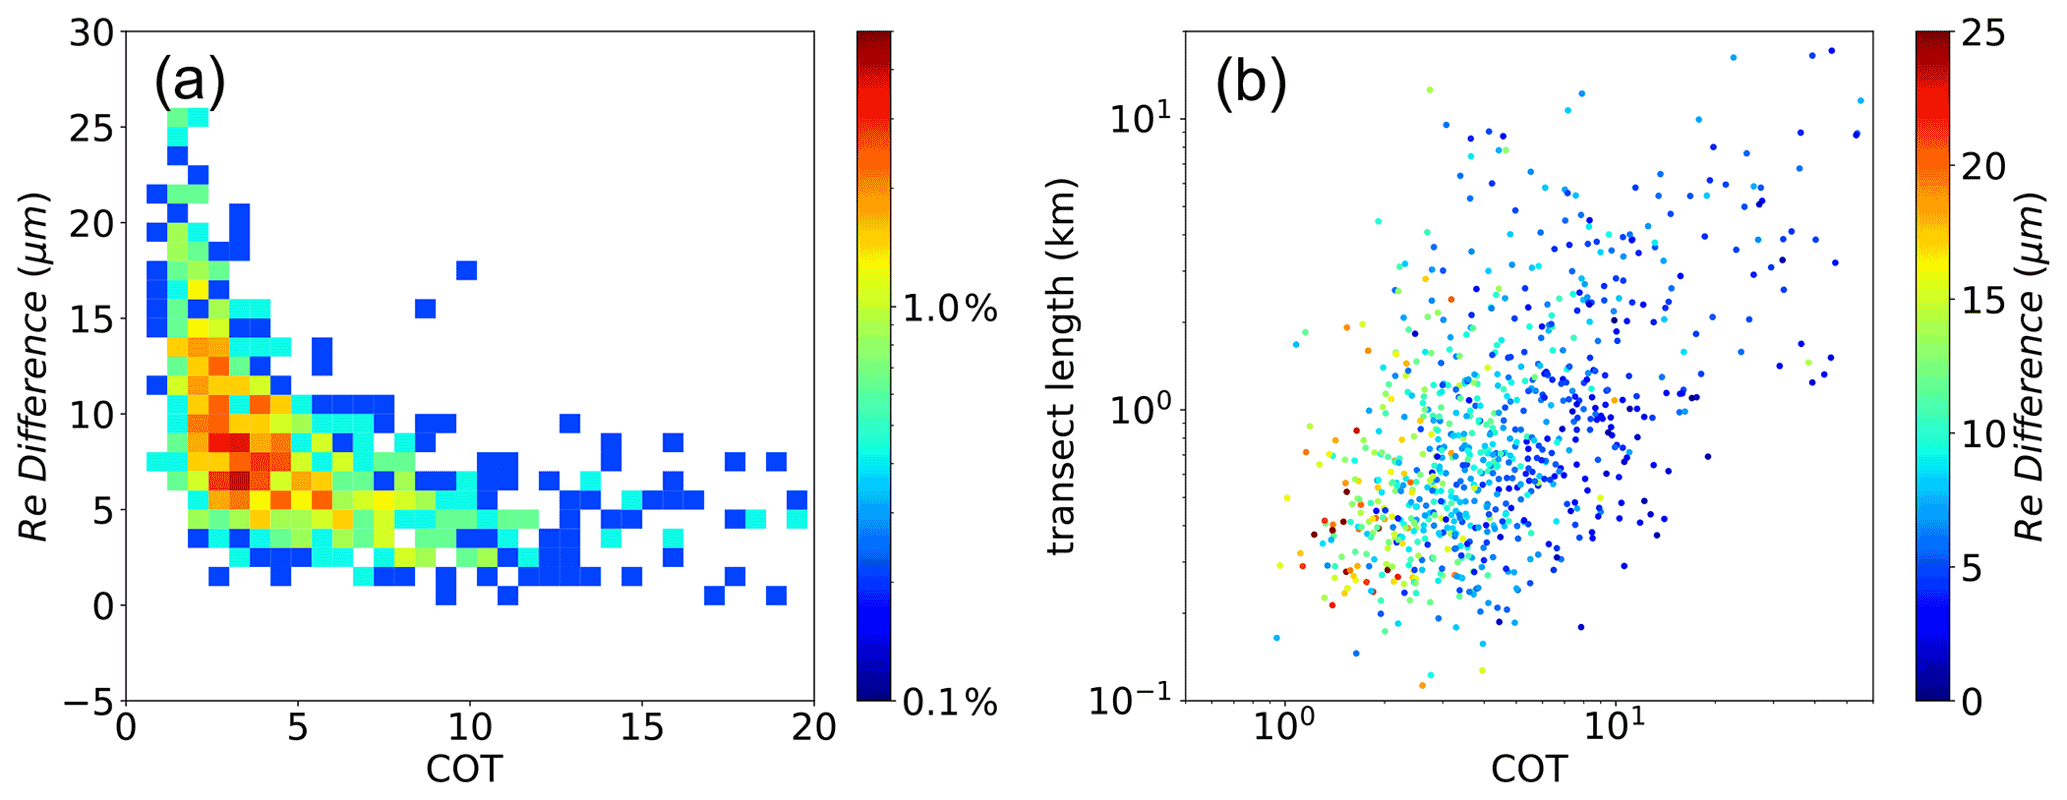
Figure 8(a) Density plot of the cloud element mean Re difference (bi-spectral – polarimetric Re) vs. mean COT. (b) Scatterplot of the Re difference (color) vs. transect length and COT using cloud element means.
Figure 8b shows the relationships between the Re differences, COT, and the cloud element's transect length as measured by RSP. We see that cloud elements with the largest Re differences (up to 25 µm) tend to be associated with the smallest transect lengths (< 1 km) and the smallest retrieved COT. As the transect length increases to 3–5 km, the large Re differences drop rapidly, showing no further dependence on transect length. Smaller transect lengths are strongly associated with smaller clouds, with mean cloud-area-equivalent diameters ∼ 1.1 to 1.7 times larger than the mean of random linear transects though fields of cumuli (e.g., Barron et al., 2020; Romps and Vogelmann, 2017). Figure 8b reveals that clouds with the smallest sizes have the largest Re differences between the two techniques. These smaller clouds are associated with smaller retrieved COT. These 1-D retrieved COT values may be biased low by 3-D effects, such as shadowing and leakage of photons out the side of clouds (e.g., Marshak et al., 2006). From Fig. 8b, it is safe to conclude that the RSP cloud element analysis reveals that the largest Re differences are associated with clouds that are optically thin and small in horizontal size.
Sub-pixel heterogeneity and clear-sky contamination
Several studies have pointed out that the bi-spectral Re retrieval has a sensitivity to instrument resolution due to (a) the nonlinear relationship between VNIR and SWIR reflectances and the COT and Re and (b) the presence of variability in cloudy reflectances at all scales (e.g., Marshak et al., 2006; Zhang et al., 2012, 2016; Werner et al., 2018a). An important example of this effect is clear-sky contamination, in which cloudy radiances and clear-sky radiances are both present within the field of view (FOV) of the sensor. The presence of this sub-pixel clear sky can cause Re overestimates of up to 41 % when decreasing instrument resolution from 30 m to 1 km (Werner et al., 2018b). The bias in the bi-spectral retrieval due to clear-sky contamination decreases monotonically as instrument resolution increases. This is due to the applicability of an independent column approximation as a model of the variability within the FOV due to the negligible atmospheric and surface scattering contributions over ocean surfaces to VNIR and SWIR radiance. Other reflectance variations within cloudy portions of an instrument FOV also cause a sensitivity of the bi-spectral retrieval to instrument resolution, although this is typically smaller (1–3 µm) (Zhang et al., 2016; Werner et al., 2018a). In this case, increasing instrument resolution does not necessarily cause a monotonic reduction in retrieval bias (e.g., Davis et al., 1997; Zhang et al., 2012). This is because the relationship between the heterogeneity of the optical and microphysical properties (e.g., Re) within the cloud and the radiance field is governed by 3-D radiative transfer, not an independent column approximation. Note that polarimetric retrievals are only weakly sensitive to instrument resolution, as they are largely unaffected by clear-sky contamination (e.g., Miller et al., 2018; Shang et al., 2015). Based on these considerations, we assess the sensitivity of our bias estimate in the bi-spectral Re due to the relative coarse resolution of the RSP by investigating the impact of clear-sky contamination using the higher-resolution HSRL-2 instrument. We may then attribute the remaining bias in Re to the expression of cloud heterogeneity and 3-D radiative transfer, whether this occurs at resolved or unresolved (i.e., sub-pixel to HSRL-2) scales.
For CAMP2Ex, given the statistics of the sampled clouds (Fig. 2), the abundance of small (transect length) and optically thin clouds (Fig. 8) led to our investigation of clear-sky contamination of the observed Re differences between RSP bi-spectral and polarimetric retrievals. The RSP instrument's 14 mrad instantaneous field of view (IFOV) converts to a roughly ∼ 120 m horizontal footprint for the cloud retrievals. We used HSRL-2 2 Hz data (∼ 75 m horizontal resolution) to derive the cloud fraction (CF) for each RSP cloud element to identify if RSP-identified cloud elements could contain some unresolved clear sky. The higher resolution and greater sensitivity of the HSRL-2 relative to RSP plays out in Fig. 2d and e cloud and clear length statistics, with the largest differences occurring for lengths < 200 m. The good agreement between the two instruments for in-cloud lengths > 200 m and for CTH (Fig. 2c) indicates similar sensitivity to clouds larger than the RSP footprint. Hence, using HSRL-2 CTH retrievals to derive a cloud fraction for RSP-identified cloud elements should provide a relevant sub-pixel cloud fraction for the RSP retrievals. However, this would be a minimum estimate of clear-sky contamination in RSP cloud elements, as the lidar itself may also contain unresolved clear sky. For RSP cloud elements that have HSRL-2 CTH retrievals, the HSRL-2 cloud fraction for an RSP cloud element is defined as the number of valid HSRL-2 CTH retrievals divided by the total number of HSRL-2 CTH retrievals within the RSP cloud element. We examined the CDF of RSP cloud elements against HSRL-2 CF and found the following: for clouds with transect lengths under 600 m, at least 49 % of cloud elements have CF < 0.95; for all cloud transect lengths, at least 46 % of cloud elements have CF < 0.95. This reveals that at least about half of the cloud elements have some degree of clear-sky contamination (CF < 0.95). We are interested in how the amount of clear-sky contamination can impact the observed differences between bi-spectral and polarimetric Re retrievals.
To further investigate how Re differences depend on the HSRL-2 CF, the cloud elements are separated into partly cloudy (CF < 0.5), mostly cloudy (0.5 < CF < 0.95), and overcast (CF > 0.95) and are then further divided into small-transect-length (< 2 km) and large-transect-length (> 2 km) populations. Figure 9 shows the PDFs of the three CF groups segregated by the two cloud size groups. For transect lengths smaller than 2 km (solid lines in Fig. 9), the three CF groups have similar distributions, with median Re differences of 8.9, 7.3, and 8.1 µm for partly cloudy, mostly cloudy, and overcast, respectively. For transect lengths greater than 2 km (dashed lines in Fig. 9), there are no samples for CF < 0.5 (hence no red dashed histogram), and the median values of the Re differences are 5.3 and 5.7 µm for the mostly cloudy and overcast groups, respectively. Thus, sub-pixel clear-sky contamination (derived from HSRL-2 2 Hz data) appears to account for < ∼ 1 µm in the Re differences, with transect lengths playing a larger role as the median value of the small-size group is 2.4 µm larger than the large-size group in the Re differences. To summarize, from the RSP cloud element analysis, the large Re difference between the two techniques is found to be more related to optical depth and transect length than sub-pixel clear-sky contamination for the RSP warm-cloud samples observed during CAMP2Ex.
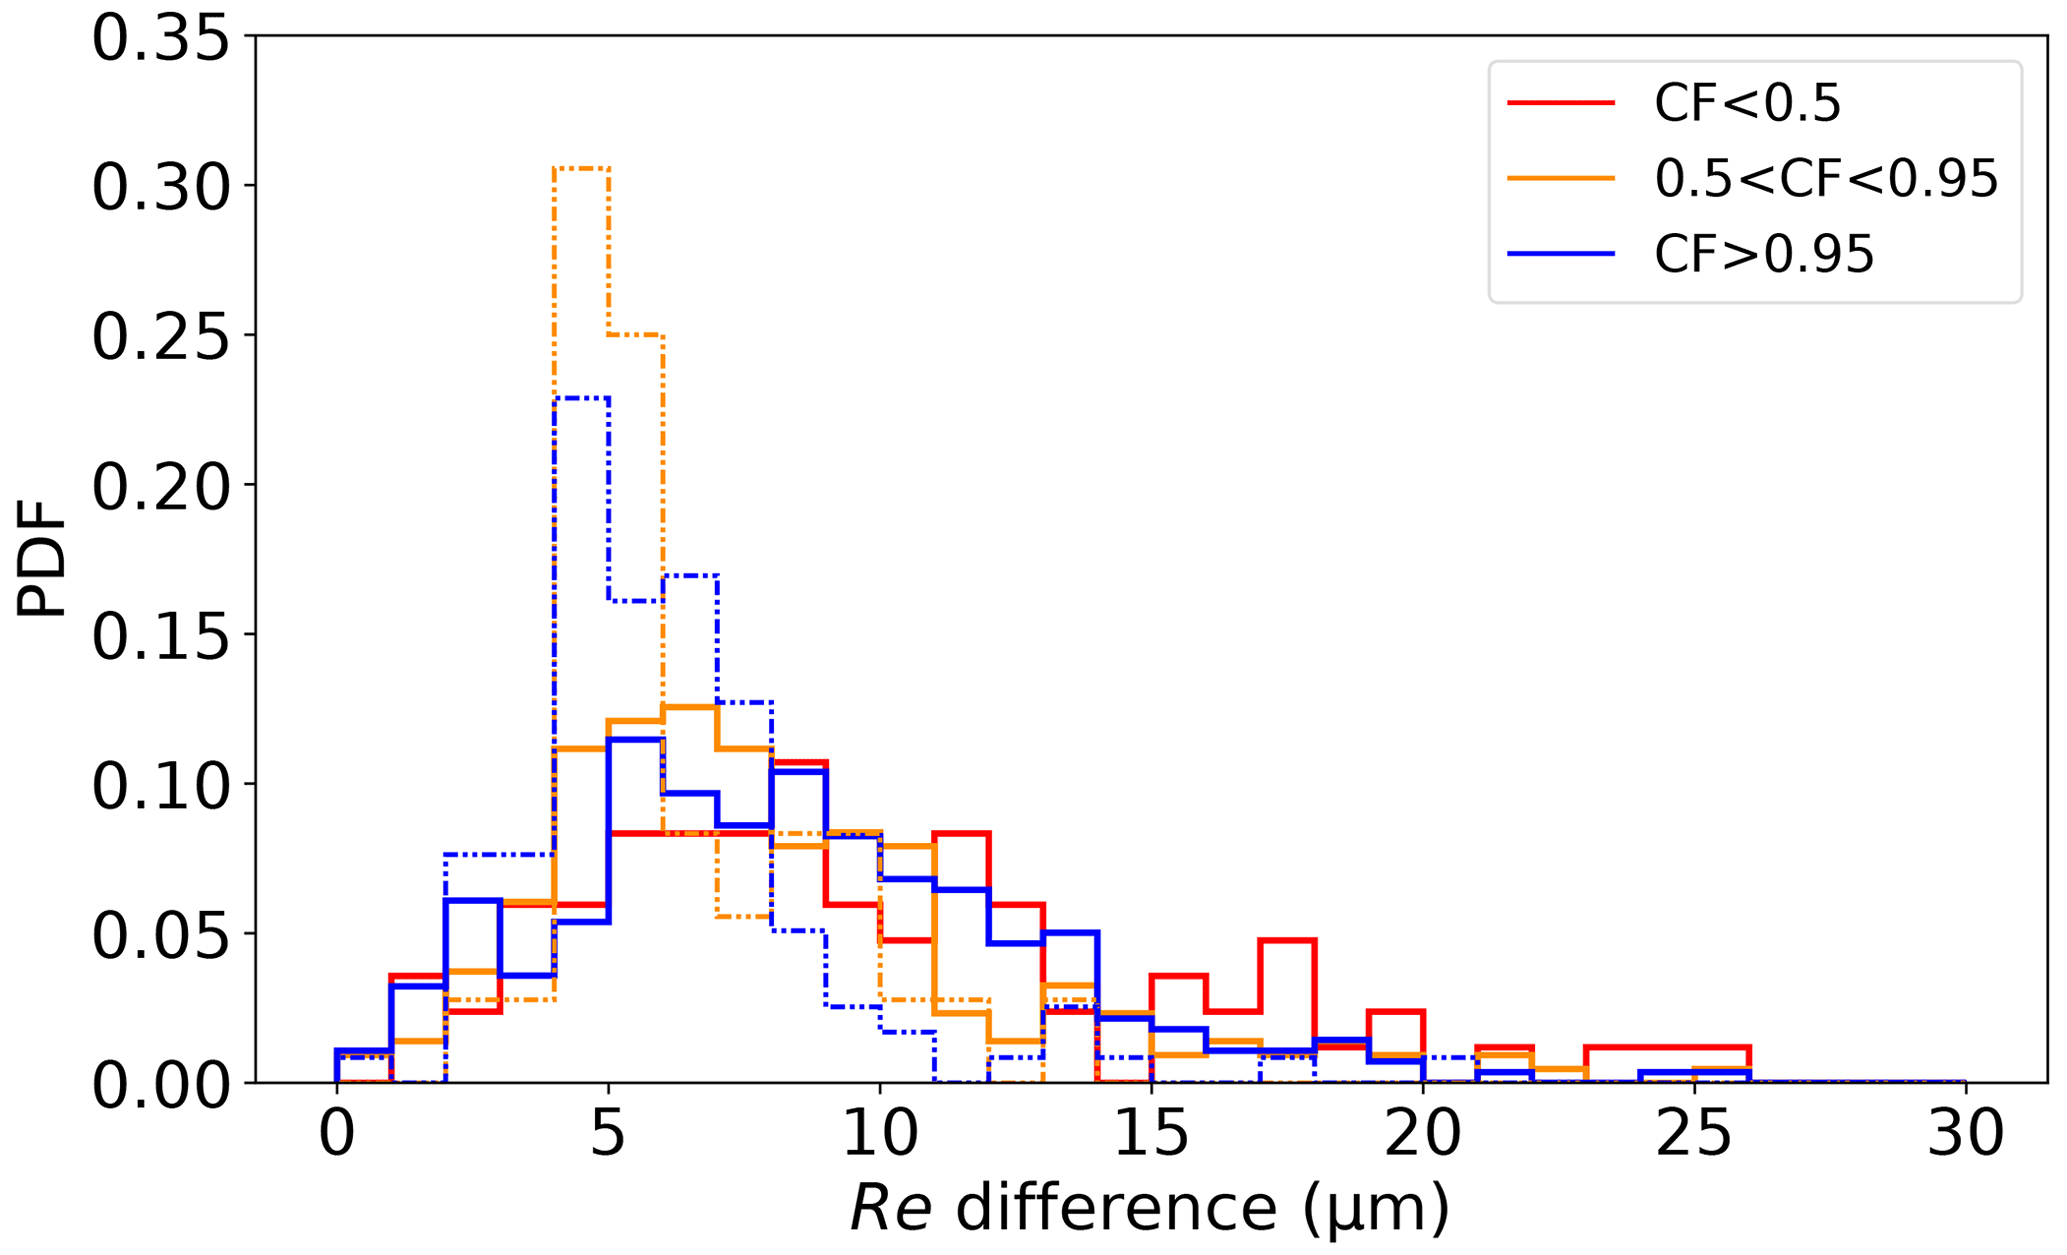
Figure 9PDF of the Re difference stratified by CF < 0.5 (11 % of all cloud elements), 0.5 < CF < 0.95 (34 % of all cloud elements), and CF > 0.95 (54 % of all cloud elements) for cloud elements with transect lengths less than 2 km (79 % of all cloud elements, solid) and greater than 2 km (21 % of all cloud elements, dashed). There are no samples for CF < 0.5 for transect lengths greater than 2 km.
Cloud-top bumpiness and solar zenith angle
In our cloud element analysis, we defined cloud-top bumpiness as the standard deviation of CTH for each cloud element, with the idea that it can capture the variation in cloud-top structure for each cloud element. As pointed out by Loeb et al. (1998), not accounting for sub-pixel variations in CTH in the plane-parallel assumption leads to large biases in retrieved COT, particularly at large SZAs. More recent studies have shown that polarimetric Re retrievals are less susceptible to cloud-top bumpiness (e.g., Cornet et al., 2018). In our analysis, we used HSRL-2 2 Hz CTH to derive cloud-top bumpiness, where the 2 Hz HSRL-2 data convert to a roughly ∼ 75 m horizontal resolution. To avoid clear-sky contamination, we separated overcast cloud elements from partly and mostly cloudy cloud elements, as above. When the differences in RSP bi-spectral and polarimetric Re retrievals are organized as a function of HSRL-2 cloud-top bumpiness, no apparent dependence was observed in the overcast cases (not shown). This might be due to the fact that the possible effects of cloud-top bumpiness on Re differences is masked by the effect of cloud size, as the clouds with the smallest transect length also have the smallest CTH standard deviation.
Past literature that has examined the dependence of Re bias on SZA through simulation and observation studies has typically shown SZA contributions to Re variations of ∼ 1 to 2 µm (e.g., Zhang et al., 2012; Grosvenor and Wood 2014; Horváth et al., 2014; Ahn et al., 2018). We also examined the impact of SZA on the RSP Re retrievals with our cloud element analysis, noting that the RSP retrievals rarely had cloud samples under low sun conditions (SZA < 60∘), with most samples taken at a SZA of between 20 and 45∘. Similar to the findings in Ahn et al. (2018) and Grosvenor and Wood (2014), the cloud element Re difference does not seem to be sensitive to SZA, possibly due to the small range of SZAs under which RSP retrievals were collected, along with the complexity of the co-variability between different cloud variables and 3-D pathways (e.g., shadowing vs. illumination, leakage vs. channeling).
4.2.2 Drizzle
In our analysis, we used the maximum APR-3 W-band reflectivity over a cloud element as a proxy for in-cloud drizzle for that cloud element. We examined the sensitivity of the differences between RSP bi-spectral and polarimetric retrievals of Re to the APR-3 reflectivity. To determine the effect of the single-mode droplet size distribution assumption in the bi-spectral technique, we further restricted the maximum of the APR-3 W-band reflectivity to ∼ 100 m from the cloud top of each cloud element. We also experimented using a column maximum W-band reflectivity, and the results are very similar to those using ∼ 100 m from the cloud top.
Figure 10 shows the Re differences between the RSP polarimetric and bi-spectral retrievals of all of the cloud elements binned by W-band reflectivity in 5 dBZ intervals. Past studies have shown that we can be certain that W-band reflectivities < −20 dBZ contain no drizzle, those between ∼ −15 and −7.5 dBZ contain light drizzle, and those > 0 dBZ contain rain (e.g., Dzambo et al., 2019; Wang and Geerts, 2003; Sauvageot and Omar, 1987). The largest mean Re difference of 9.2 µm (with a standard deviation of 5.6 µm) was observed for Z < −20 dBZ, and the smallest mean Re difference of 3.1 µm (with a standard deviation of 1.7 µm) was observed for 0 < Z < 5 dBZ. Figure 10 also reveals a large range of Re difference values (of up to 25 µm) for bins with Z < −15 dBZ, whereas a trend of decreasing range and maximum Re difference is observed for bins with Z > −15 dBZ. While no clear sensitivity of Re difference to W-band reflectivity is suggested, Fig. 10 indicates that observed large Re differences, especially for bins with Z < −15 dBZ, cannot be explained by drizzle. Therefore, we conclude that it is not likely that the difference in the bi-spectral and polarimetric Re can be explained by drizzle alone. This aligns with findings from Zhang et al. (2012) and Ahn et al. (2018).

Figure 10RSP cloud element Re difference using all RSP cloud elements across all RFs, binned by APR-3 W-band maximum reflectivity intervals of 5 dBZ. The orange line indicates the median for each bin, the box ends indicate the interquartile range, and the ends of the whiskers indicate the maximum and minimum values for each bin.
4.3 Consistency of the Re retrieval representativeness from CAMP2Ex
Lastly, the consistency between Re retrievals across all techniques is examined for the CAMP2Ex region. In doing so, we seek to gauge the representativeness of Terra MODIS Re retrievals by comparing them to RSP (airborne remote sensing) and in situ measurements sampled across all RFs. Level 2 liquid Re retrievals from Terra MODIS within the CAMP2Ex region (Fig. 1) from all 19 P-3 research flight days were included to derive a Re distribution. All valid Re retrievals from RSP and MODIS Re are included after removing the cirrus and ice clouds indicated by the SPN-S and MODIS phase flag. For in situ measurements, again to avoid sampling differences with passive remote sensing (i.e., in situ sampling through deep convective clouds which was not sampled by RSP), samples with an 11 µm brightness temperature < 273K were removed, as indicated from AHI. Figure 11 shows the Re distributions from MODIS, RSP, and in situ measurements. Given the difference in resolution and spectral channel, RSP polarimetric and bias-adjusted MODIS Re values agree within 1 µm, as indicated by the median and mean values in Table 5. The two also have very similar variability, as indicated by the standard deviations. The RSP bi-spectral and the original MODIS Re also have similar Re statistics that agree within ∼ 2 µm of each other, but both are also 5–7 µm larger than RSP polarimetric and bias-adjusted MODIS Re with larger standard deviations. Re values derived in situ from the P-3 and Learjet platforms indicate median values of 11.0 and 12.4 µm, respectively, which agree with RSP polarimetric and bias-adjusted MODIS Re values within ∼ 2 µm. Longer tails in the distributions of Re from in situ measurements are not limited by the 30 µm cut-off in the bi-spectral retrievals LUT. Moreover, as noted in Sect. 3, they are associated with the penetration of deeper clouds at altitudes different from the CTH level observed by remote sensing, with the clouds tending to contain rain. This long tail contributes to the much larger mean and standard deviation relative to the remote sensing retrievals. Overall, Re observations from the RSP polarimetric, the bias-adjusted MODIS Re, the Learjet in situ platform, and the P-3 in situ platform indicated similar median Re values of ∼ 10–12 µm, whereas MODIS Re and RSP bi-spectral Re show overestimates of ∼ 5–7 µm compared with the other techniques. This is also consistent with the results from the individual case studies in Sect. 3.3.
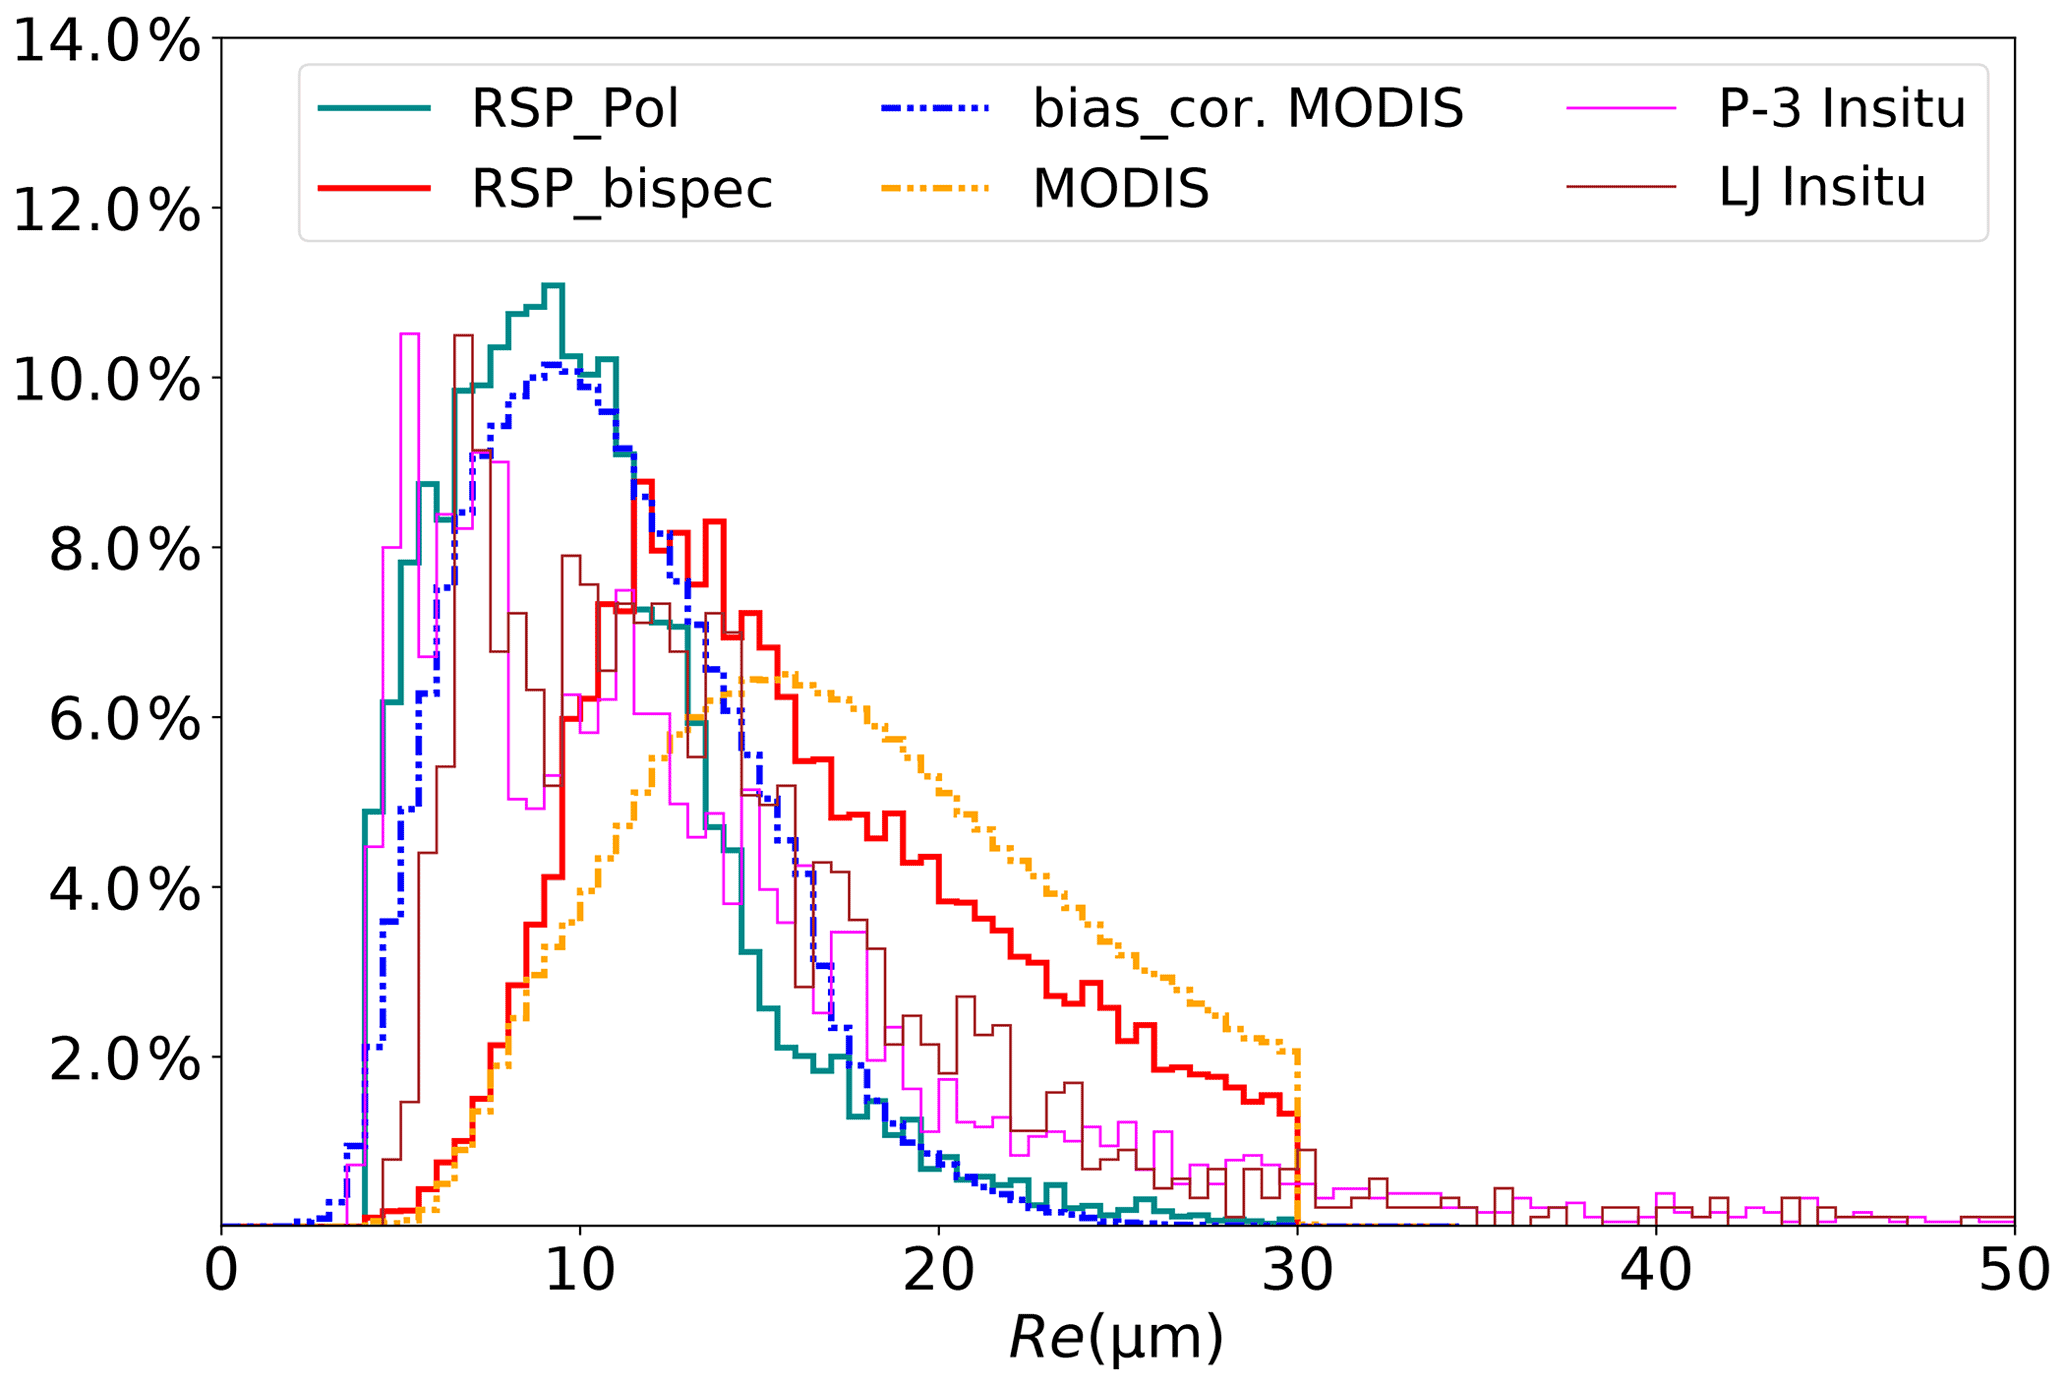
Figure 11Re distributions from L2 RSP polarimetric Re, L2 RSP bi-spectral Re, L2 MODIS Re, L2 MODIS bias-adjusted Re, 1 Hz P-3 Re derived in situ, and 1 Hz Learjet (LJ) Re derived in situ using all valid retrievals of warm oceanic clouds within the domain indicated in Fig. 1.
Table 5Re statistics averaged over all research flight segments for warm clouds.
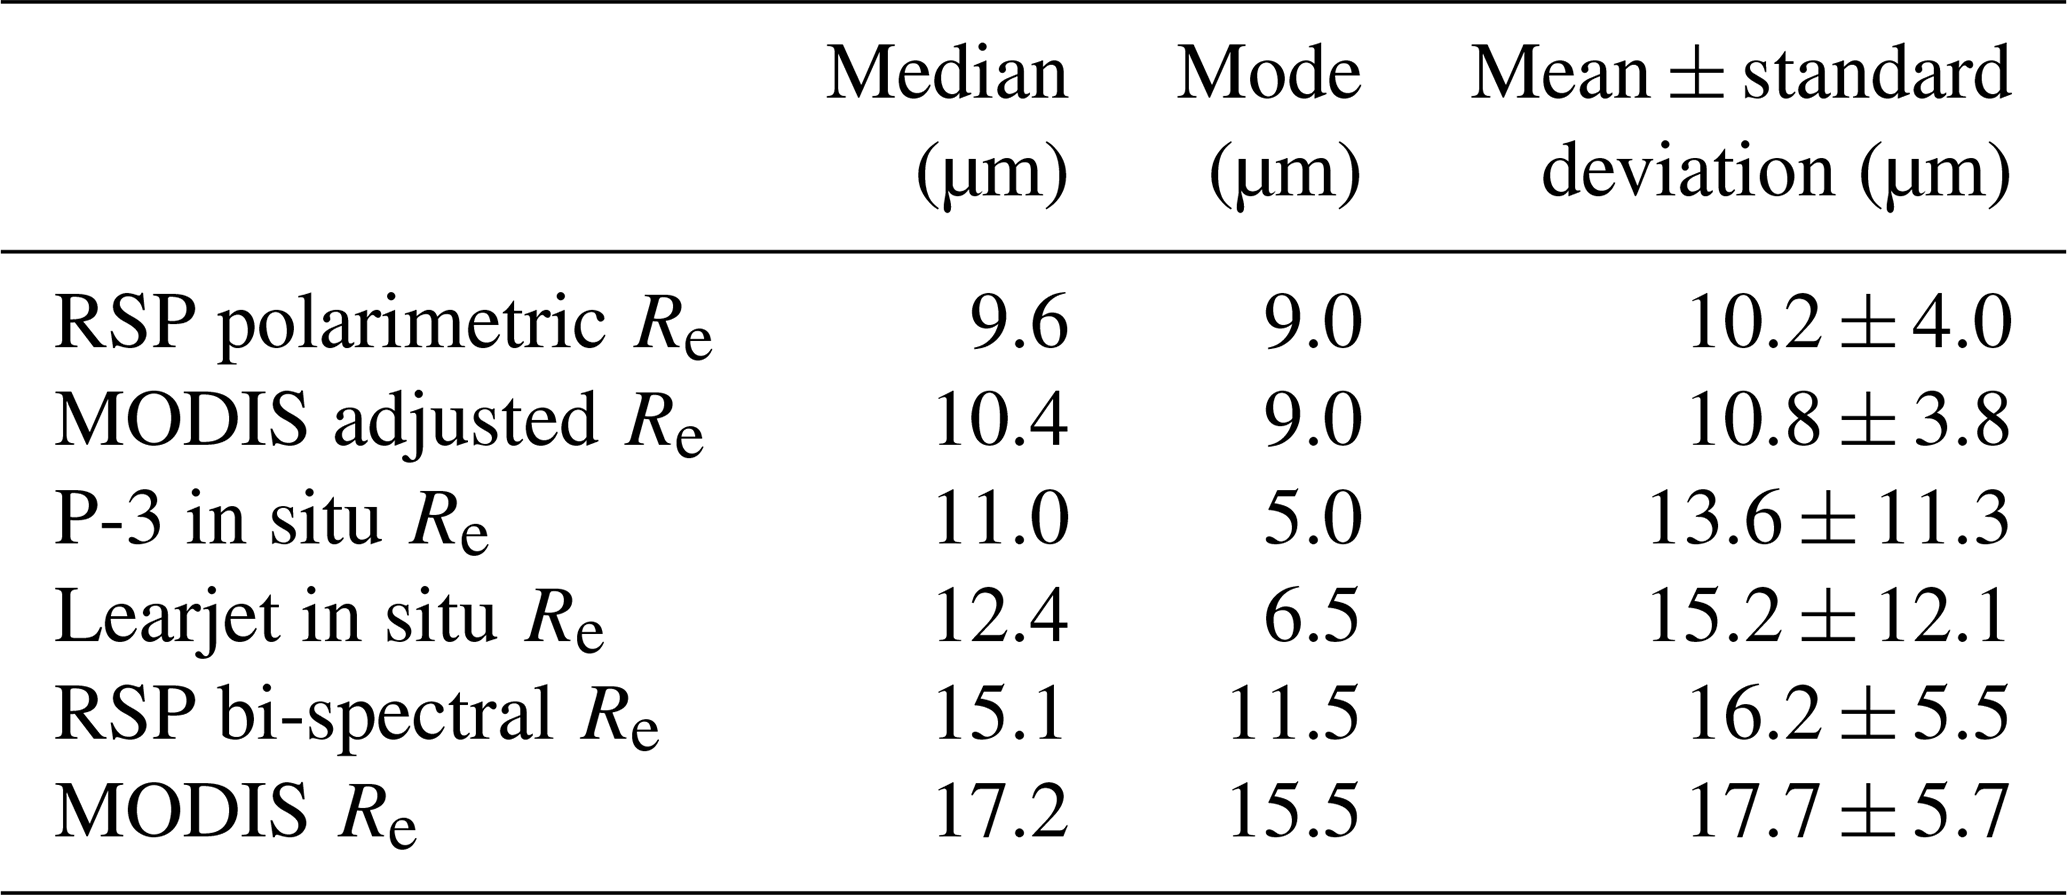
To test the similarity of the different Re distributions shown in Fig. 11, a Kolmogorov–Smirnov (K–S) test was applied to all six Re distributions, with the results listed in Table 6. When the other five Re distributions are compared with the RSP polarimetric Re distribution, both the RSP bi-spectral Re and MODIS Re distributions have p values < 0.05, which indicates that these two Re distributions do not belong to the same distribution as the RSP polarimetric Re distribution. Bias-adjusted MODIS, P-3 in situ, and Learjet in situ Re distributions, however, have p values > 0.05; therefore, we cannot reject the null hypothesis that these three Re distributions belong to the same distribution as the RSP polarimetric Re distribution. Among the three distributions, bias-adjusted MODIS Re has the smallest K–S value and the highest p value, which indicates that it is overall the closest fit to the RSP polarimetric Re distribution. The K–S results are consistent with the difference in the Re median values from Table 5, i.e., RSP polarimetric, bias-adjusted Re, P-3 in situ measurements, and Learjet in situ measurements have closer median Re values that are within 1–2 µm, whereas RSP bi-spectral Re and MODIS Re median values are 5–7 µm larger than that from the RSP polarimetric Re. We also examined the similarity of CTH distributions retrieved from RSP and MODIS, and we obtained a K–S statistic of 0.32 with a p value of 0.31. Therefore, we cannot reject the null hypothesis that the two CTH distributions belong to the same distribution. Similarly, when Learjet and P-3 sampling altitude distributions averaged across all flight segments are compared, the two in situ sampling distributions have a K–S statistic of 0.16 and a p value of 0.98. Thus, we conclude that the two in situ techniques sampled similar cloud fields during CAMP2Ex, and RSP and MODIS cloud samples also came from similar cloud fields during CAMP2Ex.
Table 6Kolmogorov–Smirnov test for similarity statistics, using the RSP polarimetric Re distribution as a reference.
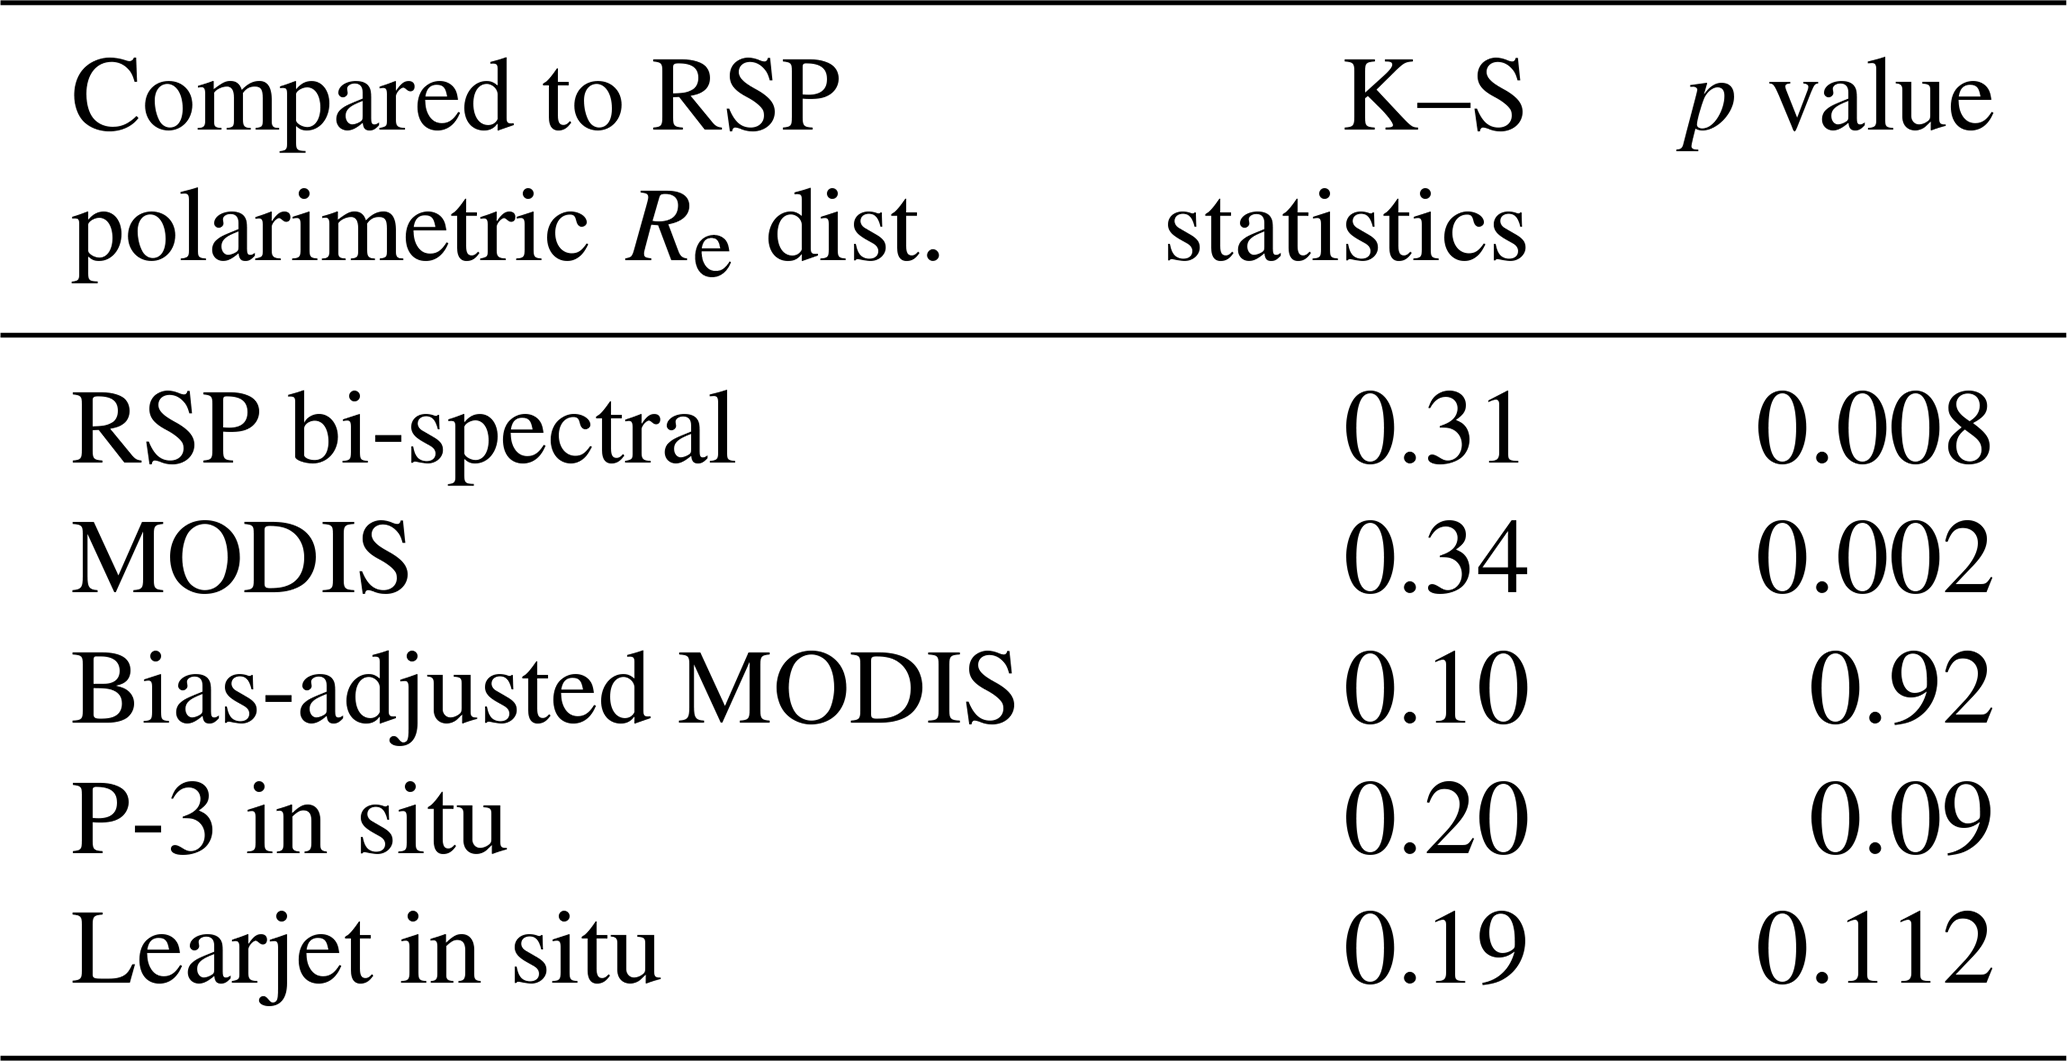
While we have been using the MODIS Re product derived from its 2.1 µm channel, we also examined the MODIS Re derived from its 3.7 µm channel. For MODIS Re derived from its 3.7 µm channel, the median, mode, and mean ± standard deviation are, 14.3, 12.5, and 15 ± 4.8 µm, respectively, for warm clouds over all research flights. Comparing these values to those in Table 5, we see that the MODIS 3.7 µm retrievals are ∼ 2 to 3 µm smaller than MODIS 2.1 µm retrievals; this is thought to be due to a combination of less impact from 3-D effects and differences in the vertical weighting of the two channels (e.g., Zhang and Platnick, 2011). The MODIS 3.7 µm retrievals are still ∼ 3 to 5 µm larger than the RSP polarimetric retrievals.
This paper presents the first field evaluation of satellite bi-spectral Re retrievals in tropical cumulus cloud fields. The evaluation consists of comparison between airborne RSP bi-spectral and polarimetric retrievals of Re as well as cross-comparison between airborne remote sensing, in situ, and satellite-retrieved Re collected during the CAMP2Ex field campaign. Unlike previous studies that used field data for evaluating satellite bi-spectral retrievals of stratocumulus cloud fields, validation in cumulus cloud fields presents a greater challenge because they are less persistent, with fast changing cloud morphologies and complex cloud structures. Here, we take a full advantage of the capability of the RSP to provide both co-located bi-spectral and polarimetric Re retrievals; thus, there is no sampling difference in comparing the two retrieval techniques. We show that the RSP bi-spectral Re retrieved in CAMP2Ex cloud fields is on average overestimated by 6.0 µm compared with the RSP polarimetric Re for the 1.2 Hz samples across the entire mission. RSP polarimetric Re also indicates much less variability and a clear increase with CTH compared with RSP bi-spectral Re.
MODIS Re retrievals, which use a bi-spectral approach, are in good agreement with RSP bi-spectral Re (median Re difference within 2.1 µm from Table 5). The bias-adjusted MODIS Re, based on the Fu et al. (2019) bias-correction factors, shows tight agreement with the RSP polarimetric Re (median Re difference within 0.8 µm from Table 5). The bias-adjusted MODIS Re and the RSP polarimetric Re both show increasing profiles with CTH as well as less variability compared with the original MODIS Re. The Re values measured in situ are in good agreement (median Re difference within 2.8 µm from Table 5) with the RSP polarimetric and bias-adjusted MODIS Re values. Further restricting altitudes to CTH < 2 km for shallow convection yields better agreement (median Re within 1.7 µm) between them. Thus, these three independent techniques are in very good agreement with each other and are ∼ 5.5 to 7.6 µm smaller than the median Re values from the bi-spectral Re from RSP and MODIS. These agreements were found to be consistent between mission-averaged statistics (Table 5) and case-by-case comparison (Table 3). For deeper clouds containing precipitation measured in situ, in situ measures of Re can, at times, be much larger than all of the remotely sensed Re values.
By taking advantage of co-located RSP, APR-3, and HSRL-2 on the P-3, we further examined the differences in RSP bi-spectral and polarimetric Re and how they relate to cloud macrophysics (cloud transect length, cloud-top bumpiness, sub-pixel cloud fraction), COT, SZA, and drizzle. We found that Re differences (bi-spectral – polarimetric) of up to 25 µm (median 11 µm) are associated with small COT values (COT < 5). As the COT increases from 5 to 15, the Re difference maximum decreases to ∼ 5 µm (median ∼ 3 µm). For COT values greater than 15, there is no clear dependence of Re difference on COT. Similarly, Re differences of up to 26 µm (median ∼ 8 µm) are associated with the smallest cloud transect lengths (< 0.5 km). For cloud transect lengths greater than 5 km, Re differences drop to 10 µm (median ∼ 5 µm). The RSP cloud retrievals have clear-sky contamination, as revealed by higher-resolution HSRL-2 data. Clear-sky contamination is shown to have only a minor impact on Re differences (< 1 µm) relative to fully cloudy pixels. No apparent relationships between Re differences and SZA and cloud-top bumpiness are observed, noting that the range of SZA sampled during RSP Re retrievals was small under moderately high sun conditions (SZA = 2 to 45∘) and the co-variability of cloud-top bumpiness with other cloud variables. A total of 80 % of the cloud elements sampled by the RSP contained some degree of drizzle within the cloud as revealed by APR-3, and a general decreasing trend of Re differences is observed for the lowest W-band reflectivities. Separating non-drizzle and drizzle samples by −15 dBZ reveals that, on average, cloud elements with detectable drizzle have Re differences that are ∼ 1 µm smaller than cloud elements with no detectable drizzle.
Our analysis in Sect. 3.1 showed that most samples observed by the P-3 remote sensors came from small, optically thin, shallow clouds. The samples exhibit a large difference (∼ factor of 2) between RSP bi-spectral and polarimetric Re retrievals. For non-drizzling shallow clouds, in situ observations compare well to the RSP polarimetric retrievals, and they show variability of within ∼ 2 µm. For these non-drizzling shallow clouds, no in situ Re samples are as large as the RSP bi-spectral Re. Therefore, for the shallow clouds observed by RSP during CAMP2Ex, the long-standing hypothesis of the presence of drizzle or vertical variations as major contributing factors to Re differences between bi-spectral and polarimetric retrievals could be rejected with near certainty. Furthermore, as revealed by the HSRL-2-derived RSP cloud element cloud fraction, clear-sky contamination only has a very limited contribution (∼ 1 µm) to the observed RSP Re differences. Thus, for shallow, non-drizzling clouds, the evidence presented herein is strongly suggestive that the dominant cause of the differences between RSP polarimetric and bi-spectral Re observed during CAMP2Ex is due to 3-D radiative transfer and cloud heterogeneity (both resolved and unresolved by RSP) effects that lead to large positive biases in bi-spectral retrievals of Re compared with polarimetric retrievals. For deeper clouds that contain drizzle, true in-cloud vertical variations could still be at play in explaining additional Re differences between bi-spectral and polarimetric techniques.
For MODIS, there is a substantial number of partly cloudy pixels, as revealed by coincident, high-resolution ASTER data. These sub-pixel clouds often lead to failed MODIS retrievals of Re, as discussed in Cho et al. (2015). Comparing the cloud macrophysical properties for CAMP2Ex reported in Sect. 3.1 with those reported for RICO and INDOEX, the CAMP2Ex shallow clouds have more numerous smaller clouds. We speculate that the reason for the maximum failure rate in MODIS cloud microphysical retrievals occurring over the western tropical Pacific, as reported by Cho et al. (2015), may be because of the high frequency of small clouds here relative to anywhere else. However, as shown in Sect. 4.3, we cannot reject the null hypothesis that the MODIS CTH distributions belong to the same distributions observed by the RSP from P-3. This provides confidence that the conclusions drawn from the RSP polarimetric and bi-spectral Re comparison extend to MODIS as well.
This study also provides additional validation of the bias-adjusted MODIS Re values reported in Fu et al. (2019), showing a mission-averaged mean ± standard deviation of 10.8 ± 3.8 µm compared with RSP polarimetric Re values of 10.2 ± 4 µm, as shown in Table 5. Throughout, we used the upper-bound Re bias adjustment factors of Fu et al. (2019), rather than present both upper- and lower-bound estimates, simply to reduce clutter within many of the figures. However, both were examined. Using the lower-bound bias adjustment factors leads to a mission mean ± standard deviation of 6.7 ± 3.2 µm. The RSP polarimetric Re falls between the upper- and lower-bound estimates. Fu et al. (2019) showed that the largest regional Re biases for marine liquid-water clouds occur over the western tropical Pacific, and our results seem to indicate that this may be because of a higher frequency of smaller clouds here relative to everywhere else. Our validation here, along with in situ validation of MODIS Re from other regions (e.g., Painemal and Zuidema, 2011; Ahn et al., 2018), provides additional confidence in the global distribution of bias-adjusted MODIS Re reported in Fu et al. (2019).
CAMP2Ex datasets of RSP, APR-3, HSRL-2, SPN-S, P-3 co-located AHI Clouds from AVHRR Extended System (CLAVR-x) data products, and SPEC in situ data used in this analysis are available at https://www-air.larc.nasa.gov/cgi-bin/ArcView/camp2ex (Van Diedenhoven et al., 2022). The CAMP2Ex P-3 and Learjet forward videos can be access at https://asp-archive.arc.nasa.gov/CAMP2EX/N426NA/video/ (Woods and Lawson, 2022a) and https://www-air.larc.nasa.gov/cgi-bin/ArcView/camp2ex?LEARJET=1 (Woods and Lawson, 2022b). The MODIS Collection 6.1 Cloud Product (https://doi.org/10.5067/MODIS/MOD06_L2.061, Platnick et al., 2015) and the MODIS Level 1B Calibrated Radiances at 250 m (https://doi.org/10.5067/MODIS/MOD02QKM.061, MODIS Characterization Support Team, 2017a) and 500 m (https://doi.org/10.5067/MODIS/MOD02HKM.061, MODIS Characterization Support Team, 2017b) were obtained through the Level-1 and Atmosphere Archive and Distribution System of NASA Goddard Space Flight Center (https://ladsweb.modaps.eosdis.nasa.gov, LAADS DAAC, 2022). The MODIS bias-adjusted Re correction factors can be found at https://doi.org/10.17632/j4r72zxc6g.2 (Fu, 2022). AHI standard cloud products are available at https://www.eorc.jaxa.jp/ptree/index.html (JAXA EORC, 2022). The 10 min AHI 1 km reflectance imagery can be accessed from the CAMP2Ex Worldview interface (http://geoworldview.ssec.wisc.edu, NASA, 2022).
The supplement related to this article is available online at: https://doi.org/10.5194/acp-22-8259-2022-supplement.
DF performed the analysis and drafted the manuscript. The methodology was developed by DF and LDG. LDG, JL, BvD, YH, GMM, RMR, and SWN helped with the writing and editing of the manuscript at various stages. The Research Scanning Polarimeter retrievals used in this study were supported by BC, MA, and BvD. PL and SW collected, processed, and curated the in situ measurements used in this study. APR-3 data were supported by TS, and OOS collected, processed, and curated these data. CH and AJS collected, processed, and curated the HSRL-2 dataset. SeS provided the SPN-S dataset, and YH derived SPN-S transmittance. All authors contributed to editing the manuscript.
The contact author has declared that neither they nor their co-authors have any competing interests.
Publisher's note: Copernicus Publications remains neutral with regard to jurisdictional claims in published maps and institutional affiliations.
This article is part of the special issue “Cloud, Aerosol and Monsoon Processes Philippines Experiment (CAMP2Ex) (ACP/AMT inter-journal SI)”. It is not associated with a conference.
The authors would like to acknowledge funding support from NASA (see details in Financial Support) and the program manager, Hal Maring. We thank all of the members of the CAMP2Ex team for their hard work in collecting the datasets analyzed herein. We also thank Guangyu Zhao for his help in providing reprojected overlays of ASTER and MODIS data. We are grateful for the discussion with Graeme Stephens and for comments from the two anonymous reviewers.
This research has been supported by the National Aeronautics and Space Administration (grant nos. 80NSSC18K0144, 80NSSC18K0150, 80NSSC18K0146, and 80NSSC21K1449).
This paper was edited by Johannes Quaas and reviewed by two anonymous referees.
Abrams, M.: The Advanced Spaceborne Thermal Emission and Reflection Radiometer (ASTER): Data products for the high spatial resolution imager on NASA's Terra platform, Int. J. Remote Sens., 21, 847–859, https://doi.org/10.1080/014311600210326, 2000.
Ahn, E., Huang, Y., Siems, S. T., and Manton, M. J.: A comparison of cloud microphysical properties derived from MODIS and CALIPSO with measurements over the wintertime southern ocean, J. Geophys. Res.-Atmos., 123, 11120–11140, https://doi.org/10.1029/2018JD028535, 2018.
Alexandrov, M. D., Cairns, B., Emde, C., Ackerman, A. S., van Diedenhoven, B.: Accuracy assessments of cloud droplet size retrievals from polarized reflectance measurements by the research scanning polarimeter, Remote Sens. Environ., 125, 92–111, https://doi.org/10.1016/j.rse.2012.07.012, 2012.
Alexandrov, M. D., Cairns, B., Wasilewski, A. P., Ackerman, A. S., McGille, M. J., Yorks, J. E., Hlavka, D. L., Platnick, S. E., Arnold, G. T., van Diedenhoven, B., Chowdhary, J., Ottaviani, M., and Knobelspiesse, K. D.: Liquid water cloud properties during the Polarimeter Definition Experiment (PODEX), Remote Sens. Environ., 169, 20–36, https://doi.org/10.1016/j.rse.2015.07.029, 2015.
Alexandrov, M. D., Cairns, B., Sinclair, K., Wasilewski, A.P., Ziemba, L., Crosbie, E., Moore, R., Hair, J., Scarino, A. J., Hu, Y., Stamnes, S., Shook, M. A., and Chen, G.: Retrievals of cloud droplet size from the research scanning polarimeter data: Validation using in situ measurements. Remote Sens. Environ., 210, 76–95, https://doi.org/10.1016/j.rse.2018.03.005, 2018.
Arabas, S., Pawlowska, H., and Grabowski, W. W.: Effective radius and droplet spectral width from in-situ aircraft observations in trade-wind cumui during RICO, Geophys. Res. Lett., 36, L11803, https://doi.org/10.1029/2009GL038257, 2009.
Badosa, J., Wood, J., Blanc, P., Long, C. N., Vuilleumier, L., Demengel, D., and Haeffelin, M.: Solar irradiances measured using SPN1 radiometers: uncertainties and clues for development, Atmos. Meas. Tech., 7, 4267–4283, https://doi.org/10.5194/amt-7-4267-2014, 2014.
Ban-Weiss, G. A., Jin, L., Bauer, S. E., Bennartz, R., Liu, X., Zhang, K., Ming, Y., Guo, H., and Jiang, J.: Evaluating clouds, aerosols, and their interactions in three global climate models using satellite simulators and observations, J. Geophys. Res.-Atmos., 119, 10876–10901, https://doi.org/10.1002/2014JD021722, 2014.
Bannehr, L. and Glover, V.: Preprocessing of airborne pyranometer data, No. NCAR/TN-364+STR, University Corporation for Atmospheric Research, https://doi.org/10.5065/D6MK69T4, 1991.
Barron, N. R., Shawn, D. R., and Heus, T.: Reconciling chord length distributions and area distributions for fields of fractal cumulus clouds, Atmosphere, 11, 824, https://doi.org/10.3390/atmos11080824, 2020.
Bessho, K., Date, K., Hayashi, M., Ikeda, A., Imai, T., Inoue, H., Kumagai, Y., Miyakawa, T., Murata, H., Ohno, T., Okuyama, A., Oyama, R., Sasaki, Y., Shimazu, Y., Shimoji, K., Sumida, Y., Suzuki, M., Taniguchi, H., Tsuchiyama, H., Uesawa, D., Yokota, H., and Yoshida, R.: An introduction to Himawari-8/9 – Japan's new-generation geostationary meteorological satellites, J. Meteorol. Soc. Jpn., 94, 151–183, https://doi.org/10.2151/jmsj.2016-009, 2016.
Bréon, F.-M. and Doutriaux-Boucher, M.: A comparison of cloud droplet radii measured from space, IEEE T. Geosci. Remote, 43, 1796–1805, https://doi.org/10.1109/tgrs.2005.852838, 2005.
Brenguier, J., Bourrianne, T., Coelho, A. A., Isbert, J., Peytavi, R., Trevarin, D., and Weschler, P.: Improvements of droplet size distribution measurements with the Fast-FSSP (Forward Scattering Spectrometer Probe), J. Atmos. Ocean. Tech., 15, 1077–1090, https://doi.org/10.1175/1520-0426(1998)015<1077:IODSDM>2.0.CO;2, 1998.
Burton, S. P., Hostetler, C. A., Cook, A. L., Hair, J. W., Seaman, S. T., Scola, S., Harper, D. B., Smith, J. A., Fenn, M. A., Ferrare, R. A., and Saide, P. E.: Calibration of a high spectral resolution lidar using a Michelson interferometer, with data examples from ORACLES, Appl. Optics, 57, 6061–6075, https://doi.org/10.1364/AO.57.006061, 2018.
Cairns, B., Russell, E. E., and Travis, L. D.: Research Scanning Polarimeter: calibration and ground-based measurements, Proc. SPIE 3754, Polarization: Measurement, Analysis, and Remote Sensing II, Denver, CO, United States, https://doi.org/10.1117/12.366329, 1999.
Cao, C., De Luccia, F. J., Xiong, X., Wolfe, R., and Weng, F.: Early on-orbit performance of the Visible Infrared Imaging Radiometer Suite onboard the Suomi National Polar-orbiting Partnership (S-NPP) satellite. IEEE T. Geosci. Remote, 52, 1142–1156, https://doi.org/10.1109/TGRS.2013.2247768, 2014.
Chang, F. L. and Li, Z. Q.: A new method for detection of cirrus overlapping water clouds and determination of their optical properties, J. Atmos. Sci., 62, 3993–4009, 2005.
Cho, H.-M., Zhang, Z., Meyer, K., Lebsock, M., Platnick, S., Ackerman, A. S., Di Girolamo, L., Labonnote, L., Cornet, C., Riedi, J., and Holz, R. E.: Frequency and causes of failed MODIS cloud property retrievals for liquid phase clouds over global oceans, J. Geophys. Res.-Atmos., 120, 4132–4154, https://doi.org/10.1002/2015JD023161, 2015.
Cornet, C., C.-Labonnote, L., Waquet, F., Szczap, F., Deaconu, L., Parol, F., Vanbauce, C., Thieuleux, F., and Riédi, J.: Cloud heterogeneity on cloud and aerosol above cloud properties retrieved from simulated total and polarized reflectances, Atmos. Meas. Tech., 11, 3627–3643, https://doi.org/10.5194/amt-11-3627-2018, 2018.
Curry, J. A., Hobbs, P. V., King, M. D., Randall, D. A., Minnis, P., Isaac, G. A., Pinto, J. O., Uttal, T., Bucholtz, A., Cripe, D. G., Gerber, H., Fairall, C. W., Garrett, T. J., Hudson, J., Intrieri, J. M., Jakob, C., Jensen, T., Lawson, P., Marcotte, D., Nguyen, L., Pilewskie, P., Rangno, A., Rogers, D. C., Strawbridge, K. B., Valero, F. P. J., Williams, A. G., and Wylie, D.: FIRE arctic clouds experiment, B. Am. Meteorol. Soc., 81, 5–29,https://doi.org/10.1175/1520-0477(2000)081<0005:face>2.3.co;2, 2000.
Davis, A., Marshak, A., Cahalan, R., and Wiscombe, W.: The Landsat scale break in stratocumulus as a three-dimensional radiative transfer effect: Implications for cloud remote sensing, J. Atmos. Sci., 54, 241–260, https://doi.org/10.1175/1520-0469(1997)054<0241:TLSBIS>2.0.CO;2, 1997.
Di Girolamo, L., Liang, L., and Platnick, S.: A global view of one-dimensional solar radiative transfer through oceanic water clouds, Geophys. Res. Lett., 37, L18809, https://doi.org/10.1029/2010GL044094, 2010.
Di Girolamo, L., Holz, R., Reid, J., Tanelli, S., van den Heever, S., Narsma, G., and Simpas, J.: Cloud and aerosol monsoonal processes-Philippines experiment (CAMP2Ex), https://espo.nasa.gov/CAMP2Ex_White-Paper (last access: 24 December 2021), 2015.
Diner, D. J., Beckert, J. C., Reilly, T. H., Bruegge, C. J., Conel, J. E., Kahn, R. A., Martonchik, J. V., Ackerman, T. P., Davies, R., Gerstl, S. A. W., Gordon, H. R., Muller, J.-P., Myneni, R., Sellers, R. J., Pinty, B., and Verstraete, M. M.: Multi-angle Imaging SpectroRadiometer (MISR) instrument description and experiment overview, IEEE T. Geosci. Remote, 36, 1072–1087, https://doi.org/10.1109/36.700992, 1998.
Durden, S. L., Tanelli, S., and Sy, O. O.: Comparison of GPM DPR and airborne radar observations in OLYMPEX, IEEE Geosci. Remote Sens., 17, 10, 1707–1711, https://doi.org/10.1109/LGRS.2019.2952287, 2020.
Dzambo, A. M., L'Ecuyer, T., Sy, O. O., and Tanelli, S.: The observed structure and precipitation characteristics of southeast Atlantic stratocumulus from airborne radar during ORACLES 2016–17, J. Appl. Meteorol. Clim., 58, 2197–2215, https://doi.org/10.1175/JAMC-D-19-0032.1, 2019.
Fu, D.: Bias-corrected MODIS Re, Mendeley Data V2 [data set], https://doi.org/10.17632/j4r72zxc6g.2, 2022.
Fu, D., Di Girolamo, L., Liang, L., and Zhao, G.: Regional biases in MODIS marine liquid water cloud drop effective radius deduced through fusion with MISR. J. Geophys. Res.-Atmos., 124, 13182–13196, https://doi.org/10.1029/2019JD031063, 2019.
Gerber, H., Frick, G., Jensen, J., and Hudson, J.: Entrainment, mixing, and microphysics in trade-wind cumulus, J. Meteorol. Soc. Jpn., 86, 87–106, https://doi.org/10.2151/jmsj.86A.87, 2008.
Grosvenor, D. P. and Wood, R.: The effect of solar zenith angle on MODIS cloud optical and microphysical retrievals within marine liquid water clouds, Atmos. Chem. Phys., 14, 7291–7321, https://doi.org/10.5194/acp-14-7291-2014, 2014.
Gryspeerdt, E., Goren, T., Sourdeval, O., Quaas, J., Mülmenstädt, J., Dipu, S., Unglaub, C., Gettelman, A., and Christensen, M.: Constraining the aerosol influence on cloud liquid water path, Atmos. Chem. Phys., 19, 5331–5347, https://doi.org/10.5194/acp-19-5331-2019, 2019.
Gupta, S., McFarquhar, G. M., O'Brien, J. R., Poellot, M. R., Delene, D. J., Miller, R. M., and Small Griswold, J. D.: Factors affecting precipitation formation and precipitation susceptibility of marine stratocumulus with variable above- and below-cloud aerosol concentrations over the Southeast Atlantic, Atmos. Chem. Phys., 22, 2769–2793, https://doi.org/10.5194/acp-22-2769-2022, 2022.
Hair, J., Hostetler, C., Cook, A., Harper, D., Ferrare, R., Mack, T., Welch, W., Izquierdo, L., and Hovis, F.: Airborne high spectral resolution lidar for profiling aerosol optical properties, Appl. Optics, 47, 6734–6752, https://doi.org/10.1364/AO.47.006734, 2008.
Horváth, Á., Chellappan, S., and Deneke, H.: View angle dependence of MODIS liquid water path retrievals in warm oceanic clouds, J. Geophys. Res., 119, 8304–8328, https://doi.org/10.1002/2013JD021355, 2014.
IPCC: Climate Change 2013: The Physical Science Basis. Contribution of Working Group I to the Fifth Assessment Report of the Intergovernmental Panel on Climate Change, edited by: Stocker, T. F., Qin, D., Plattner, G.-K., Tignor, M., Allen, S. K., Boschung, J., Nauels, A., Xia, Y., Bex, V., and Midgley, P. M., Cambridge University Press, Cambridge, United Kingdom and New York, NY, USA, 1535 pp., 2013.
Japan Aerospace Exploration Agency, Earth Observation Research Center (JAXA EORC): https://www.eorc.jaxa.jp/ptree/index.html, last access: 27 January 2022.
Khain, P., Heiblum, R., Blahak, U., Levi, Y., Muskatel, H., Vadislavsky, E., Altaratz, O., Koren, I., Dagan, G., Shpund, J., and Khain, A.: Parameterization of vertical profiles of governing microphysical parameters of shallow cumulus cloud ensembles using LES with bin microphysics, J. Atmos. Sci., 76, 533–560, https://doi.org/10.1175/JAS-D-18-0046.1, 2019.
Knobelspiesse, K., Tan, Q., Bruegge, C., Cairns, B., Chowdhary, J., van Diedenhoven, B., Diner, D., Ferrare, R., van Harten, G., Jovanovic, V., Ottaviani, M., Redemann, J., Seidel, F., and Sinclair, K.: Intercomparison of airborne multi-angle polarimeter observations from the Polarimeter Definition Experiment, Appl. Optics, 58, 650–669, https://doi.org/10.1364/AO.58.000650, 2019.
Lawson, R. P., Stewart, R. E., Strapp, J. W., and Isaac, G. A.: Airborne measurements of the origin and growth of very large snowflakes, Geophys. Res. Lett., 20, 53–56, https://doi.org/10.1029/92GL02917, 1993.
Lawson, R. P., O'Connor, D., Zmarzly, P., Weaver, K., Baker, B., Mo, Q., and Jonsson, H.: The 2D-S (Stereo) probe: Design and preliminary tests of a new airborne, high-speed, high-resolution particle imaging probe, J. Atmos. Ocean. Tech., 23, 1462–1477, https://doi.org/10.1175/JTECH1927.1, 2006.
Lebsock, M. D. and L'Ecuyer T. S.: The retrieval of warm rain from CloudSat, J. Geophys. Res.,116, D20209, https://doi.org/10.1029/2011JD016076, 2011.
Lelieveld, J., Crutzen, P. J., Ramanathan, V., Andreae, M. O., Brenninkmeijer, C. A. M., Campos, T., Cass, G. R., Dickerson, R. R., Fischer, H., de Gouw, J. A., Hansel, A., Jefferson, A., Kley, D., de Laat, A. T. J., Lal, S., Lawrence, M. G., Lobert J. M., Mayol-Bracero, O. L., Mitra, A. P., Novakov, T., Oltmans, S. J., Prather, K. A., Reiner, T., Rodhe, H., Scheeren, H. A., Sikka, D., and Williams, J.: The indian ocean experiment: Widespread air pollution from South and Southeast Asia, Science, 291, 1031–1036, https://doi.org/10.1126/science.1057103, 2001.
Level-1 and Atmosphere Archive & Distribution System Distributed Active Archive Center (LAADS DAAC): https://ladsweb.modaps.eosdis.nasa.gov, last access: 20 January 2022.
Liang, L. and Di Girolamo, L.: A global analysis on the view-angle dependence of plane-parallel oceanic liquid water cloud optical thickness using data synergy from MISR and MODIS, J. Geophys. Res.-Atmos., 118, 2389–2403, https://doi.org/10.1029/2012JD018201, 2013.
Liang, L., Di Girolamo, L., and Sun, W.: Bias in MODIS cloud drop effective radius for oceanic water clouds as deduced from optical thickness variability across scattering angles, J. Geophys. Res.-Atmos., 120, 7661–7681, https://doi.org/10.1002/2015JD023256, 2015.
Loeb, N. G. and Davies, R.: Observational evidence of plane parallel model biases: Apparent dependence of cloud optical depth on solar zenith angle. J. Geophys. Res., 101, 1621–1634, https://doi.org/10.1029/95JD03298, 1996.
Loeb, N. G., Várnai, T., and Winker, D. M.: Influence of sub-pixel scale cloud-top structure on reflectances from overcast stratiform cloud layers, J. Atmos. Sci., 55, 2960–2973, https://doi.org/10.1175/1520-0442(1998)011<0215:IOMSCO>2.0.CO;2, 1998.
Marshak, A., Platnick, S., Várnai, T., Wen, G., and Cahalan, R. F.: Impact of three-dimensional radiative effects on satellite retrievals of cloud droplet sizes, J. Geophys. Res., 111, D09207, https://doi.org/10.1029/2005JD006686, 2006.
McBride, P. J., Schmidt, K. S., Pilewskie, P., Walther, A., Heidinger, A. K., Wolfe, D. E., Fairall, C. W., and Lance, S.: CalNex cloud properties retrieved from a ship-based spectrometer and comparisons with satellite and aircraft retrieved cloud properties, J. Geophys. Res.-Atmos., 117, 1–10, https://doi.org/10.1029/2012JD017624, 2012.
McFarquhar, G. M. and Heymsfield, A. J.: The definition and significance of an effective radius for ice clouds. J. Atmos. Sci., 55, 2039–2052, https://doi.org/10.1175/1520-0469(1998)055<2039:TDASOA>2.0.CO;2, 1998.
McFarquhar, G. M. and Heymsfield, A. J.: Parameterizations of INDOEX microphysical measurements and calculations of cloud susceptibility: Applications for climate studies, J. Geophys. Res.-Atmos., 106, 28675–28698, https://doi.org/10.1029/2000JD900777, 2001.
McFarquhar, G. M., Platnick, S., Di Girolamo, L., Wang, H., Wind, G., and Zhao, G.: Remotely sensed observations of aerosol indirect effects in the Indian Ocean, Geophys. Res. Lett., 31, L21105, https://doi.org/10.1029/2004GL020412, 2004.
McFarquhar, G. M., Zhang, G., Poellot, M. R., Kok, G. L., McCoy, R., Tooman, T., and Heymsfield, A. J.: Ice properties of single layer stratocumulus during the Mixed-Phase Arctic Cloud Experiment (MPACE). Part I: Observations, J. Geophys. Res., 112, D24202, https://doi.org/10.1029/2007JD008646, 2007.
McFarquhar, G. M., Bretherton, C. S., Marchand, R., Protat, A., DeMott, P. J., Alexander, S. P., Roberts, G. C., Twohy, C. H., Toohey, D., Siems, S., Huang, Y., Wood, R., Rauber, R. M., Lasher-Trapp, S., Jensen, J., Stith, J. L., Mace, J., Um, J., Järvinen, E., Schnaiter, M., Gettelman, A., Sanchez, K. J., McCluskey, C. S., Russell, L. M., McCoy, I. L., Atlas, R. L., Bardeen, C. G., Moore, K. A., Hill, T. C. J., Humphries, R. S., Keywood, M. D., Ristovski, Z., Cravigan, L., Schofield, R., Fairall, C., Mallet, M. D., Kreidenweis, S. M., Rainwater, B., D'Alessandro, J., Wang, Y., Wu, W., Saliba, G., Levin, E. J. T., Ding, S., Lang, F., Truong, S. C. H., Wolff, C., Haggerty, J., Harvey, M. J., Klekociuk, A. R., and McDonald, A.: Observations of clouds, aerosols, precipitation, and surface radiation over the Southern Ocean: An overview of CAPRICORN, MARCUS, MICRE, and SOCRATES, B. Am. Meteorol. Soc., 102, E894–E928, https://doi.org/10.1175/BAMS-D-20-0132.1, 2021.
Menon, S., Del Genio, A. D., Kaufman, Y., Bennartz, R., Koch, D., Loeb, N., and Orlikowski, D.: Analyzing signatures of aerosol-cloud interactions from satellite retrievals and the GISS GCM to constrain the aerosol indirect effect, J. Geophys. Res., 113, D14S22, https://doi.org/10.1029/2007JD009442, 2008.
Miller, D. J., Zhang, Z., Platnick, S., Ackerman, A. S., Werner, F., Cornet, C., and Knobelspiesse, K.: Comparisons of bispectral and polarimetric retrievals of marine boundary layer cloud microphysics: case studies using a LES–satellite retrieval simulator, Atmos. Meas. Tech., 11, 3689–3715, https://doi.org/10.5194/amt-11-3689-2018, 2018.
Miller, D. J., Segal-Rozenhaimer, M., Knobelspiesse, K., Redemann, J., Cairns, B., Alexandrov, M., van Diedenhoven, B., and Wasilewski, A.: Low-level liquid cloud properties during ORACLES retrieved using airborne polarimetric measurements and a neural network algorithm, Atmos. Meas. Tech., 13, 3447–3470, https://doi.org/10.5194/amt-13-3447-2020, 2020.
MODIS Characterization Support Team (MCST): MODIS 250m Calibrated Radiances Product, NASA MODIS Adaptive Processing System, Goddard Space Flight Center USA [data set], https://doi.org/10.5067/MODIS/MOD02QKM.061, 2017a.
MODIS Characterization Support Team (MCST): MODIS 500m Calbrated Radiance Product, NASA MODIS Adaptive Processing System, Goddard Space Flight Center USA [data set], https://doi.org/10.5067/MODIS/MOD02HKM.061, 2017b.
Nakajima, T. and King, M. D.: Determination of the optical thickness and effective particle radius of clouds from reflected solar radiation measurements. Part I: Theory, J. Atmos. Sci., 47, 1878–1893, https://doi.org/10.1175/1520-0469(1990)047<1878:DOTOTA>2.0.CO;2, 1990.
Nakajima, T., King, M. D., Spinhirne, J. D., and Radke, L. F.: Determination of the optical thickness and effective particle radius of clouds from reflected solar radiation measurements. Part II: Marine stratocumulus observations, J. Atmos. Sci., 48, 728–751, https://doi.org/10.1175/1520-0469(1991)048<0728:DOTOTA>2.0.CO;2, 1991.
Nakajima, T. Y., Suzuki, K., and Stephens, G. L.: Droplet growth in warm water clouds observed by the A-Train. Part I: Sensitivity analysis of the MODIS-derived cloud droplet sizes, J. Atmos. Sci., 67, 1884–1896, https://doi.org/10.1175/2009JAS3280.1, 2010.
National Aeronautics and Space Administration (NASA): http://geoworldview.ssec.wisc.edu, last access: 5 May 2022.
NASEM: Thriving on Our Changing Planet: A Decadal Strategy for Earth Observation from Space, The National Academies Press, Washington, DC, 716 pp., https://doi.org/10.17226/24938, 2018.
Norgren, M. S., Wood, J., Schmidt, K. S., van Diedenhoven, B., Stamnes, S. A., Ziemba, L. D., Crosbie, E. C., Shook, M. A., Kittelman, A. S., LeBlanc, S. E., Broccardo, S., Freitag, S., and Reid, J. S.: Above-aircraft cirrus cloud and aerosol optical depth from hyperspectral irradiances measured by a total-diffuse radiometer, Atmos. Meas. Tech., 15, 1373–1394, https://doi.org/10.5194/amt-15-1373-2022, 2022.
O'Connor, D., B. Baker, and R. P. Lawson, Upgrades to the FSSP-100 electronics, Int. Conf. on Clouds and Precipitation, Cancun, Mexico, IAMAS, http://cabernet.atmosfcu.unam.mx/ICCP-2008/abstracts/Program_on_line/Poster_13/O-Connor_extended.pdf (last access: 23 April 2022), 2008.
Ohring, G., Wielicki, B., Spencer, R., Emery, B., and Datla, R.: Satellite instrument calibration for measuring global climate change: Report of a workshop, B. Am. Meteorol. Soc., 86, 1303–1314, https://doi.org/10.1175/bams-86-9-1303, 2005.
Painemal, D. and Zuidema, P.: Assessment of MODIS cloud effective radius and optical thickness retrievals over the Southeast Pacific with VOCALS-REx in situ measurements, J. Geophys. Res., 116, D24206, https://doi.org/10.1029/2011JD016155, 2011.
Painemal, D., Spangenberg, D., Smith Jr., W. L., Minnis, P., Cairns, B., Moore, R. H., Crosbie, E., Robinson, C., Thornhill, K. L., Winstead, E. L., and Ziemba, L.: Evaluation of satellite retrievals of liquid clouds from the GOES-13 imager and MODIS over the midlatitude North Atlantic during the NAAMES campaign, Atmos. Meas. Tech., 14, 6633–6646, https://doi.org/10.5194/amt-14-6633-2021, 2021.
Pinsky, M. and Khain, A.: Analytical investigation of the role of lateral mixing in the evolution of nonprecipitating cumulus. Part I: Developing clouds, J. Atmos. Sci., 77, 891–909, https://doi.org/10.1175/JAS-D-19-0036.1, 2020.
Platnick, S.: Vertical photon transport in cloud remote sensing problems, J. Geophys. Res., 105, 22919–22935, https://doi.org/10.1029/2000JD900333, 2000.
Platnick, S. and Valero, F. P. J.: A validation of a satellite cloud retrieval during ASTEX. J. Atmos. Sci., 52, 2985–3001 https://doi.org/10.1175/1520-0469(1995)0522.0.co;2, 1995.
Platnick, S., King, M., Ackerman, S., Menzel, W., Baum, B., Riedi, J., and Frey, R.: The MODIS cloud products: Algorithms and examples from terra, IEEE T. Geosci. Remote, 41, 459–473, https://doi.org/10.1109/tgrs.2002.808301, 2003.
Platnick, S., Ackerman, S., King, M., Wind, G., Amarasinghe, N., Marchant, B., Arnold, G. T., Zhang, Z., Hubanks, P. A., Holz, R. E., Yang, P., Ridgway, W. L., and Riedi, J.:: MODIS Atmosphere L2 Cloud Product (06_L2), NASA MODIS Adaptive Processing System, Goddard Space Flight Center USA [data set], https://doi.org/10.5067/MODIS/MOD06_L2.061, 2015.
Platnick, S., Meyer, K., King, M. D., Wind, G., Amarasinghe, N., Marchant, B., Arnold, G. T., Zhang, Z., Hubanks, P. A., Holz, R. E., Yang, P., Ridgway, W. L., and Riedi, J.: The MODIS Cloud Optical and Microphysical Products: Collection 6 Updates and Examples From Terra and Aqua, IEEE T. Geosci. Remote, 55, 502–525, https://doi.org/10.1109/TGRS.2016.2610522, 2017.
Platnick, S., Meyer, K., Amarasinghe, N., Wind, G., Hubanks, P. A., and Holz, R. E.: Sensitivity of Multispectral Imager Liquid Water Cloud Microphysical Retrievals to the Index of Refraction, Remote Sens., 12, 4165, https://doi.org/10.3390/rs12244165, 2020.
Platnick, S., Pincus, R., Wind, B., King, M. D., Gray, M. A., and Hubanks, P. A.: An initial analysis of the pixel-level uncertainties in global MODIS cloud optical thickness and effective particle-size retrievals, Fourth International Asia-Pacific Environmental Remote Sensing Symposium 2004, Remote Sensing of the Atmosphere, Ocean, Environment, and Space, 2004, Honolulu, Hawai'i, United States, https://doi.org/10.1117/12.578353, 2004.
Rauber, R. M., Stevens, B., Ochs, H. T., III, Knight, C., Albrecht, B. A., Blyth, A. M., Fairall, C. W., Jensen, J. B., Lasher-Trapp, S. G., Mayol-Bracero, O. L., Vali, G., Anderson, J. R., Baker, B. A., Bandy, A. R., Burnet, E., Brenguier, J.-L., Brewer, W. A., Brown, P. R. A., Chuang, R., Cotton, W. R., Di Girolamo, L., Geerts, B., Gerber, H., Göke, S., Gomes, L., Heikes, B. G., Hudson, J. G., Kollias, P., Lawson, R. R., Krueger, S. K., Lenschow, D. H., Nuijens, L., O'Sullivan, D. W., Rilling, R. A., Rogers, D. C., Siebesma, A. P., Snodgrass, E., Stith, J. L., Thornton, D. C., Tucker, S., Twohy, C. H., and Zuidema, P.: Rain in shallow cumulus over the ocean: The RICO campaign, B. Am. Meteorol. Soc., 88, 1912–1928, https://doi.org/10.1175/BAMS-88-12-1912, 1997.
Redemann, J., Wood, R., Zuidema, P., Doherty, S. J., Luna, B., LeBlanc, S. E., Diamond, M. S., Shinozuka, Y., Chang, I. Y., Ueyama, R., Pfister, L., Ryoo, J.-M., Dobracki, A. N., da Silva, A. M., Longo, K. M., Kacenelenbogen, M. S., Flynn, C. J., Pistone, K., Knox, N. M., Piketh, S. J., Haywood, J. M., Formenti, P., Mallet, M., Stier, P., Ackerman, A. S., Bauer, S. E., Fridlind, A. M., Carmichael, G. R., Saide, P. E., Ferrada, G. A., Howell, S. G., Freitag, S., Cairns, B., Holben, B. N., Knobelspiesse, K. D., Tanelli, S., L'Ecuyer, T. S., Dzambo, A. M., Sy, O. O., McFarquhar, G. M., Poellot, M. R., Gupta, S., O'Brien, J. R., Nenes, A., Kacarab, M., Wong, J. P. S., Small-Griswold, J. D., Thornhill, K. L., Noone, D., Podolske, J. R., Schmidt, K. S., Pilewskie, P., Chen, H., Cochrane, S. P., Sedlacek, A. J., Lang, T. J., Stith, E., Segal-Rozenhaimer, M., Ferrare, R. A., Burton, S. P., Hostetler, C. A., Diner, D. J., Seidel, F. C., Platnick, S. E., Myers, J. S., Meyer, K. G., Spangenberg, D. A., Maring, H., and Gao, L.: An overview of the ORACLES (ObseRvations of Aerosols above CLouds and their intEractionS) project: aerosol–cloud–radiation interactions in the southeast Atlantic basin, Atmos. Chem. Phys., 21, 1507–1563, https://doi.org/10.5194/acp-21-1507-2021, 2021.
Romps, D. M. and Vogelmann, A. M.: Methods for estimating 2D cloud size distributions from 1D observations, J. Atmos. Sci., 74, 3405–3417, https://doi.org/10.1175/JAS-D-17-0105.1, 2017.
Ross, A. D., Holz, R. E., Quinn, G., Reid, J. S., Xian, P., Turk, F. J., and Posselt, D. J.: Exploring the first aerosol indirect effect over Southeast Asia using a 10-year collocated MODIS, CALIOP, and model dataset, Atmos. Chem. Phys., 18, 12747–12764, https://doi.org/10.5194/acp-18-12747-2018, 2018.
Rossow, W. B. and Schiffer, R. A.: ISCCP cloud data products, B. Am. Meteorol. Soc., 72, 2–20, https://doi.org/10.1175/1520-0477(1991)072<0002:ICDP>2.0.CO;2, 1991.
Sauvageot, H. and Omar, J.: Radar reflectivity of cumulus clouds, J. Atmos. Ocean. Tech., 4, 264–272, https://doi.org/10.1175/1520-0426(1987)004<0264:RROCC>2.0.CO;2, 1987.
Shang, H., Chen, L., Bréon, F. M., Letu, H., Li, S., Wang, Z., and Su, L.: Impact of cloud horizontal inhomogeneity and directional sampling on the retrieval of cloud droplet size by the POLDER instrument, Atmos. Meas. Tech., 8, 4931–4945, https://doi.org/10.5194/amt-8-4931-2015, 2015.
Sinclair, K., van Diedenhoven, B., Cairns, B., Yorks, J., Wasilewski, A., and McGill, M.: Remote sensing of multiple cloud layer heights using multi-angular measurements, Atmos. Meas. Tech., 10, 2361–2375, https://doi.org/10.5194/amt-10-2361-2017, 2017.
Suzuki, K., Golaz, J.-C., and Stephens, G. L.: Evaluating cloud tuning in a climate model with satellite observations, Geophys. Res. Lett., 40, 4464–4468, https://doi.org/10.1002/grl.50874, 2013.
Tan, I., Oreopoulos, L., and Cho, N.: The role of thermodynamic phase shifts in cloud optical depth variations with temperature, Geophys. Res. Lett., 46, 4502–4511, https://doi.org/10.1029/2018GL081590, 2019.
Tanelli, S., Durden, S. L., Im, E., Pak, K. S., Reinke, D. G., Partain, P., Haynes, J. M., and Marchand, R. T.: CloudSat's cloud profiling radar after two years in orbit: Performance, calibration, and processing, IEEE T. Geosci. Remote, 46, 3560–3573, https://doi.org/10.1109/TGRS.2008.2002030, 2008.
van Diedenhoven, B., Fridlind, A. M., Ackerman, A. S., and Cairns, B.: Evaluation of hydrometeor phase and ice properties in cloud-resolving model simulations of tropical deep convection using radiance and polarization measurements, J. Atmos. Sci., 69, 3290–3314, https://doi.org/10.1175/JAS-D-11-0314.1, 2012.
Van Diedenhoven, B., Tanelli, S., Hostetler, C., Schmidt, S., Holz, R., and Lawson, P.: https://www-air.larc.nasa.gov/cgi-bin/ArcView/camp2ex, last access: 5 May 2022.
Vant-Hull, B., Marshak, A., Remer, L. A., and Li, Z.: The effects of scattering angle and cumulus cloud geometry on satellite retrievals of cloud drop effective radius, IEEE T. Geosci. Remote, 45, 1039–1045, https://doi.org/10.1109/TGRS.2006.890416, 2007.
Várnai, T. and Davies, R.: Effects of cloud heterogeneities on shortwave radiation: Comparison of cloud-top variability and internal heterogeneity. J. Atmos. Sci., 56, 4206–4224, https://doi.org/10.1175/1520-0469(1999)056<4206:EOCHOS>2.0.CO;2, 1999.
Wang, J. Y. and Geerts, B.: Identifying drizzle within marine stratus with W-band radar reflectivity profiles, Atmos. Res., 69, 1–27, https://doi.org/10.1016/j.atmosres.2003.08.001, 2003.
Werner, F., Zhang, Z., Wind, G., Miller, D. J., and Platnick, S.: Quantifying the impacts of subpixel reflectance variability on cloud optical thickness and effective radius retrievals based on high-resolution ASTER observations, J. Geophys. Res.-Atmos., 123, 4239–4258, https://doi.org/10.1002/2017JD027916, 2018a.
Werner, F., Zhang, Z., Wind, G., Miller, D. J., Platnick, S., and Di Girolamo, L.: Improving cloud optical property retrievals for partly cloudy pixels using coincident higher–resolution single band measurements: A feasibility study using ASTER observations, J. Geophys. Res., 123, 12253–12276, https://doi.org/10.1029/2018JD028902, 2018b.
Witte, M. K., Yuan, T., Chuang, P. Y., Platnick, S., Meyer, K. G., Wind, G., and Jonsson, H. H.: MODIS retrievals of cloud effective radius in marine stratocumulus exhibit no significant bias, Geophys. Res. Lett., 45, 10656–10664, https://doi.org/10.1029/2018GL079325, 2018.
Woods, S. and Lawson, P.: https://asp-archive.arc.nasa.gov/CAMP2EX/N426NA/video/, last access: 20 January 2022a.
Woods, S. and Lawson, P.: https://www-air.larc.nasa.gov/cgi-bin/ArcView/camp2ex?LEARJET=1, last access: 20 January 2022b.
Zhang, S., Xue, H., and Feingold, G.: Vertical profiles of droplet effective radius in shallow convective clouds, Atmos. Chem. Phys., 11, 4633–4644, https://doi.org/10.5194/acp-11-4633-2011, 2011.
Zhang, Z. and Platnick, S.: An assessment of differences between cloud effective particle radius retrievals for marine water clouds from three MODIS spectral bands, J. Geophys. Res., 116, D20215, https://doi.org/10.1029/2011JD016216, 2011.
Zhang, Z., Ackerman, A. S., Feingold, G., Platnick, S., Pincus, R., and Xue, H.: Effects of cloud horizontal inhomogeneity and drizzle on remote sensing of cloud droplet effective radius: Case studies based on large-eddy simulations, J. Geophys. Res., 117, D19208, https://doi.org/10.1029/2012JD017655, 2012.
Zhang, Z., Werner, F., Cho, H. M., Wind, G., Platnick, S., Ackerman, A. S., Di Girolamo, L., Marshak, A., and Meyer K.: A framework based on 2-D Taylor expansion for quantifying the impacts of sub-pixel reflectance variance and covariance on cloud optical thickness and effective radius retrievals based on the bi-spectral method, J. Geophys. Res.-Atmos., 121, 7007–7025, https://doi.org/10.1002/2016JD024837, 2016.
Zhao, G. and Di Girolamo, L.: Statistics on the macrophysical properties of trade wind cumuli over the tropical western Atlantic, J. Geophys. Res., 112, D10204, https://doi.org/10.1029/2006JD007371, 2007.
Zhuge, X., Zou, X., and Wang, Y.: AHI-Derived Daytime Cloud Optical/Microphysical Properties and Their Evaluations With the Collection-6.1 MOD06 Product, IEEE T. Geosci. Remote, 59, 6431–6450, https://doi.org/10.1109/TGRS.2020.3027017, 2021.
Zinner, T., Wind, G., Platnick, S., and Ackerman, A. S.: Testing remote sensing on artificial observations: impact of drizzle and 3-D cloud structure on effective radius retrievals, Atmos. Chem. Phys., 10, 9535–9549, https://doi.org/10.5194/acp-10-9535-2010, 2010.
- Abstract
- Introduction
- Data and methodology
- Results
- Relating Re bias to 3-D factors, sub-pixel heterogeneity, and drizzle
- Conclusions
- Data availability
- Author contributions
- Competing interests
- Disclaimer
- Special issue statement
- Acknowledgements
- Financial support
- Review statement
- References
- Supplement