the Creative Commons Attribution 4.0 License.
the Creative Commons Attribution 4.0 License.
 | 21 Jun 2022
The formation and composition of the Mount Everest plume in winter
Scott Lindstrom
Mount Everest's summit pyramid is the highest obstacle on earth to the wintertime jet-stream winds. Downwind, in its wake, a visible plume can form. The meteorology and composition of the plume are unknown. Accordingly, daily from 1 November 2020 through 31 March 2021 (151 d), we observed real-time images from a geosynchronous meteorological satellite to identify the days plumes formed. The corresponding surface and upper-air meteorological data were collected. The massif was visible on 143 d (95 %), plumes formed on 63 d (44 %) and lasted an average of 12 h. We used the upper-air data with a basic meteorological model to show the plumes formed when sufficiently moist air was drawn into the wake. We conclude the plumes were composed initially of either cloud droplets or ice particles depending on the temperature. The plumes were not composed of resuspended snow. One plume was observed to glaciate downwind. We estimated snowfall from the plumes may be significant.
- Article
(8470 KB) - Full-text XML
-
Supplement
(21047 KB) - BibTeX
- EndNote


Mount Everest's summit is the highest elevation on earth at 8848 m and its summit pyramid (Fig. 1a and b) is the largest obstacle to the upper-air winds. With sufficient flow, a turbulent wake forms downwind of the pyramid and a visible plume can form in the wake as seen in Fig. 2. The meteorology and composition of the plume have been studied, but have not been determined conclusively. This study is a first step to determine the plume's meteorology and composition. We studied the plume in winter as have all previous investigators. The previous studies, to our knowledge, are as follows.
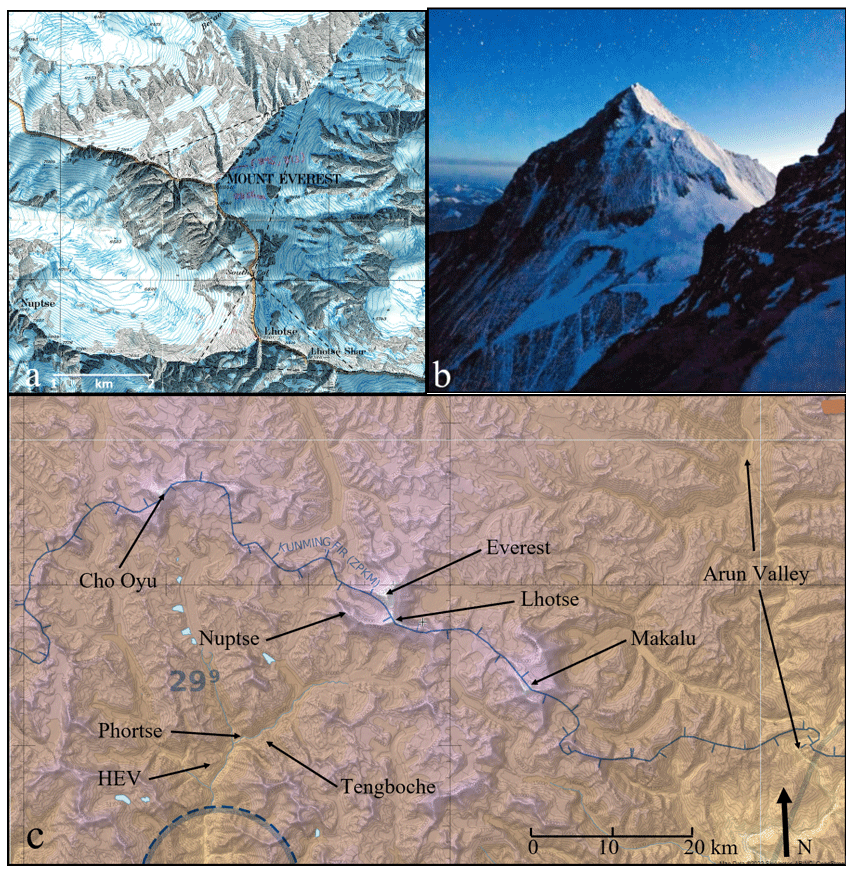
Figure 1(a) The Mount Everest and Lhotse summit pyramids are outlined. The bases of the pyramids are at an elevation of approximately 7900 m. The summits are, respectively, 8848 and 8501 m in elevation. The map is from the November 1988 issue of the National Geographic magazine. (b) The Everest summit pyramid at sunrise in May 2010 as viewed from near the summit of Lhotse (from https://www.coryrichards.com/ (last access: 3 June 2022), and Anker et al., 2013). (c) The Mount Everest region with the major summits and locations identified (HEV is the Hotel Everest View; the chart is from skyvector.com).
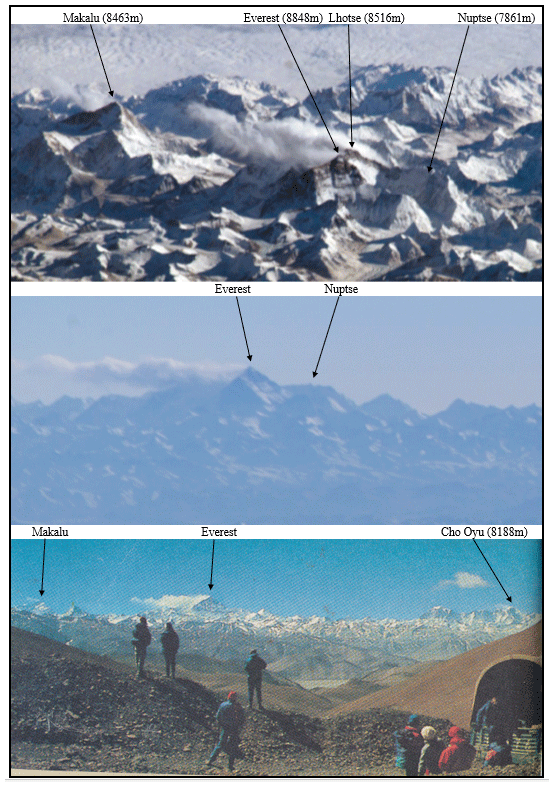
Figure 2Top: The Everest plume studied by Moore (2004) imaged from the International Space Station (ISS) on 28 January 2004 at 10:01 UTC (16:01 LST, Local Solar Time). Middle: The plume 3 min later from the ISS, not reported by Moore. Bottom: The Everest plume published in Venables (1989) photographed from the Pang La in Tibet on 6 March 1988 at about 06:00 UTC (12:00 LST). The major peaks in the images are labeled and their summit elevations are given.
A January 2004 plume was investigated by Moore (2004) (Fig. 2, top and middle). He concluded the plume was composed of resuspended snow blown from the peak. He argued that because the atmosphere was too dry the plume could not have been a banner cloud (Douglas, 1928), i.e., a collection of cloud droplets. A plume photographed by Venables (1989) looks almost identical to Moore's plume (Fig. 2, bottom). Venables, who was on his way to climb Everest's east face (obscured in the image by the plume), referred to the plume as “the usual plume of cloud and snow, blasted off the summit by the prevailing westerlies”.
Plumes from the Everest massif were observed in November and December 1992 by Hindman and Engber (1995) as shown in Fig. 3 and captured in a video by Hindman in November 1995 (see Movie 1 in the Supplement). As can be seen in the figure and in the video, the plumes were not present in the morning but were present in the afternoon. The video illustrates that the plumes formed like clouds and flowed and undulated like clouds. Based on this behavior, plus investigations of the Everest airflow by Hindman and Wick (1990), Hindman and Engber reported these plumes were banner clouds.
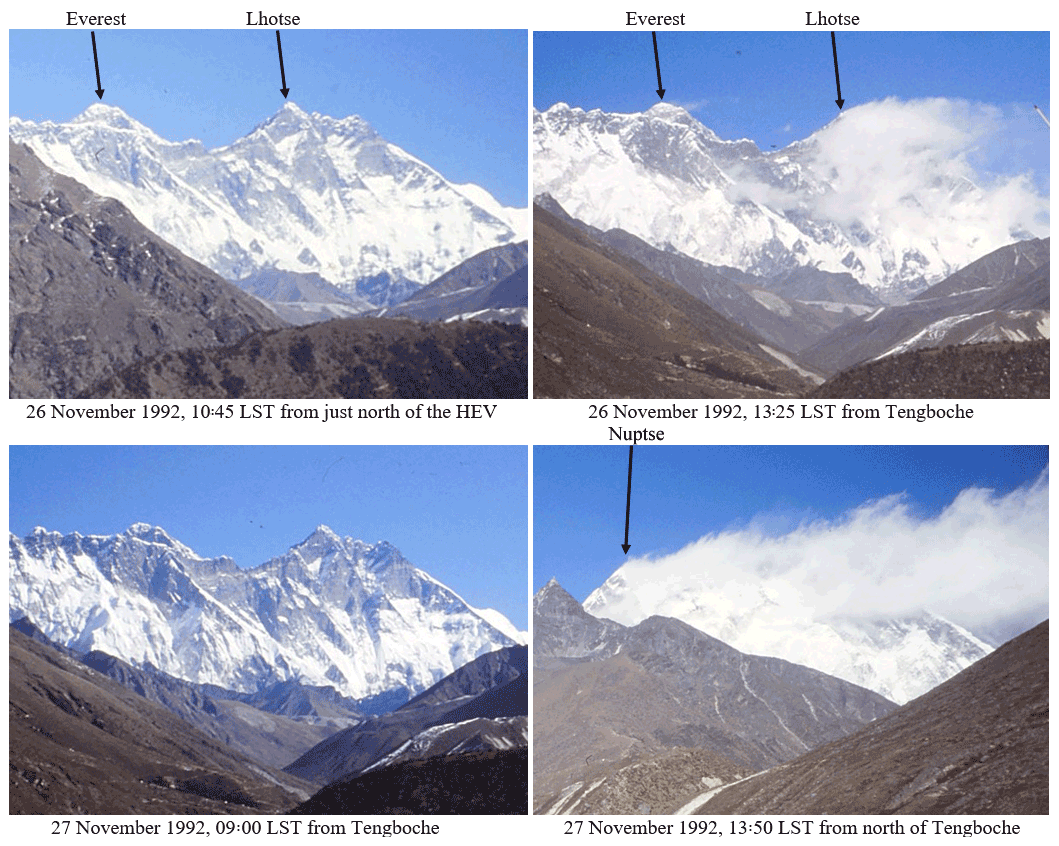
Figure 3The plumes studied by Hindman and Engber (1995) photographed from the Nepal side of the Everest massif during Hindman's trek to Everest's base.
Movie 1 captures the formation and evolution of a plume: The movie began at 09:40 LST (local solar time) showing the summits of Everest (poking over Nuptse) and Lhotse (to the right) were plume free. At about 10:50 LST, a plume began in the wake of Lhotse. Clouds began to form on the valley slopes about 12:00 LST. The plume reached full development at about 14:00 LST. At that time, the plume began to be intermittently obscured by clouds filling the valley. The movie ended at 16:30 LST because the Hotel Everest View (HEV) was enveloped by the clouds that had completely filled the valley.
Numerical simulations by Reinert and Wirth (2009), Voigt and Wirth (2013), and Prestel and Wirth (2016) demonstrate that banner clouds form in the lee of steep mountain peaks as a result of dynamically forced lee upslope flow. This result confirms the flows postulated by Hindman and Wick (1990) that were inspired by Douglas (1928). The simulations show the speed of the lee upslope flow is much smaller than the speed of the wind impacting the peak. Thus, we think the lee upslope flow may be too weak to resuspend snow.
Schween et al. (2007) show still images and animations, all with the same view, from the summit of the Zugspitze in the Bavarian Alps. Because of the best possible spatial and temporal resolution, they were able to show the formation of banner clouds and snow blown off an adjacent peak.
Here we use the best possible spatial and temporal resolution images available to us from a geostationary meteorological satellite to observe the formation of plumes in the lee of the Everest massif. When we saw a plume form in the morning, and if our calculations predicted cloud formation through condensation of moisture in the airstream upwelling in the immediate lee of the massif, the plume was likely a banner cloud. The composition of the cloud was inferred from its temperature.
To our knowledge there is no systematic imaging of the Everest massif from either Nepal or Tibet (China). (Note: Anonymous reviewer, personal communication, 2022, informed us of a live-stream of the massif from the HEV (https://www.youtube.com/watch?v=O7ozpVbakZg, last access: 13 June 2022). The stream was not useful for this study because it began in January 2022). Therefore, daily we observed in real time, every 10 min, images of the Everest region during winter 2020–2021 (1 November through 31 March). Observed were Band 3 (visible) and Band 13 (infrared) from the Himawari-8 (H-8) Japanese geosynchronous meteorological satellite (https://www.data.jma.go.jp/mscweb/data/himawari/sat_img.php?area=ha2, last access: 3 June 2022).
The spatial resolution of the H-8 images is sufficient to resolve the plumes, not as they form, but after they reach a length of a couple of kilometers. The following is our reasoning. The sub-satellite point is at 0∘ N, 104.7∘ E and the summit of Everest is at 27.99∘ N, 86.93∘ E. At the sub-satellite point, the satellite zenith angle is 0∘ (nadir) and the spatial resolution is 0.5 km for images in the visible band and 2.0 km for images in the infrared band. Careful examination of pixel edges suggests that the 0.5 and 2 km nadir resolutions increase to, respectively, about 1 and 4 km in the vicinity of Everest. Moore (2004) estimated the plume he studied, shown in Fig. 2, to be 15 km long. Also comparing the plumes in Fig. 3 with the map in Fig. 1a, it can be seen that the plumes were kilometers in length. Thus, had the H-8 been in orbit in 1992 and 2004, these plumes would have been observed.
The images from the H-8 website were displayed daily in the “Hi-res Asia 2” window and observed in the both the “still” and “animation” modes. The images could be magnified 300× on the FireFox browser and the site provided animations up to 23 h before being overwritten. The forming plumes were observed as moving elements against a mostly stationary background. Once they reached a couple of kilometers in length, the lengthening of the plumes, shown in Movie 1, was observed.
To permit the reader to observe the formation and development of the plumes, we present movies made from the every-10-min H-8 images. All of the H-8 images presented here are oriented such that the vertical points toward true north; Fig. 1c is a map of the region. The map provides a distance scale and identifies the locations of the major peaks, the HEV, Phortse, Tengboche, and the Arun Valley. The times and dates for all the H-8 images are displayed on the images and the movies themselves. The images and movies were produced following procedures in the Data Availability section.
Daily, we collected meteorological data corresponding to the H-8 images: atmospheric profiles (vertical distribution of temperature, moisture (dewpoint), and wind) from the National Oceanic and Atmospheric Administration (NOAA) (https://www.ready.noaa.gov/index.php, last access: 3 June 2022) at the location of Phortse, Nepal (27.84∘ N, 84.75∘ E, Fig. 1c); constant-pressure analyses of the region from the College of DuPage (http://www.weather.cod.edu/forecast/, last access: 3 June 2022); surface measurements from the automatic weather station (AWS) at Phortse (https://www.nationalgeographic.org/projects/perpetual-planet/everest/weather-data/, last access: 3 June 2022). The AWS is described by Perry et al. (2021).
Both Everest and its neighbor to the south, Lhotse, present significant obstacles to the typically west-to-east air flow (Fig. 1a). Hence, both peaks produce wakes and, as seen in Fig. 2 (top), both produce plumes. Cloud formation was investigated in the dynamically forced lee upslope flow in these wakes. The lifted condensation level (LCL) of the upslope flow was calculated with the following procedure.
The atmospheric profiles were displayed using the American Skew-T adiabatic diagram. The profiles were graphically analyzed to determine the LCL: the temperature and dew point values at the 400 mb level, the approximate pressure level at the base of the Everest pyramid, were raised, respectively, dry-adiabatically and with moisture constant to the level where saturation was achieved. If the LCL was achieved before reaching the 300 mb level, the approximate pressure level at Everest's summit, a plume was expected to form. If the LCL was not achieved before reaching 300 mb, a plume was not expected to form; the unsaturated parcel would be swept downwind by the high-speed summit winds. We checked the LCL values using http://www.csgnetwork.com/lclcalc.html (last access: 3 June 2022).
The composition of a forming plume was inferred from the temperature at the LCL. Baker and Lawson (2006) report the composition of mountain wave clouds, an analogue to the Everest plume. They found the clouds could contain ice particles at temperatures colder than about −35 ∘C. Thus, if an LCL temperature was warmer than −35∘C, initially liquid droplets are expected to have formed. Conversely, if an LCL temperature was at or colder than −35∘C, initially ice crystals are expected to have formed. A mixed-phase plume (coexisting droplets and crystals) is expected near −35∘C.
We looked for the following events in the daily H-8 images to identify the conditions in which plumes formed and the conditions in which plumes did not form:
-
A day with no visible plume and no measured snowfall at Phortse either that day or the previous 2 d. This sequence will illustrate the H-8 view of the cloud-free Everest region and the corresponding non-plume atmospheric conditions.
-
A day with a visible plume and no snowfall either that day or the previous 2 d at Phortse. This sequence will illustrate the atmospheric conditions for plume formation.
-
A day with a visible plume with no snowfall measured at Phortse that day but snowfall measured the previous 3 d, an event similar to Moore's (2004) study. If the model does not predict a plume, we conclude the plume was composed of resuspended snow. If a plume was predicted, we conclude the plume was a banner cloud.
We recorded the days the Everest massif was observed to produce a plume, the formation time of the plume, the plume duration and how many plume events were predicted by the LCL model. Cases where a plume was observed but not predicted were investigated because they might have been plumes of resuspended snow.
We studied images from a geosynchronous meteorological satellite of the Moore (2004) plume event to determine whether the plume behaved similarly to Event 3.
3.1 Event 1
No plumes were observed (Fig. 4a–c) and no snowfall was measured at the AWS on 25, 26, and 27 January 2021. Sharp-edge shadows cast by the Cho Oyu and Everest summits can be seen in these afternoon images indicating no plumes were present. The shadows are more easily seen in Movie 2 for 27 January 2021. The movie begins just before sunrise and ends just after sunset, 00:40 to 11:50 UTC (06:40 to 17:50 LST). The Everest massif is in the center of the images. Scrolling slowly through the video, the long shadows in the morning cast by the massif can be seen shrinking and no plumes can be seen streaming from the summits. The shadows reappear in the afternoon. Further, the movie illustrates the snow-covered, cloud-free east face of Everest illuminated by the rising morning sun.

Figure 4The images and profiles (a), (b), and (c) are for 25, 26, and 27 January 2021, at 15:00 LST or 09:00 UTC. The major peaks are circled and the location of Phortse is labeled. The lifting condensation level (LCL) values are determined graphically on the corresponding atmospheric profiles from Phortse and are listed in Table 1. The graphical procedures are described in the text. The pressures at the base and summit of the Everest pyramid, respectively, are approximately 400 and 300 mb.
Table 1Air parcels lifted from the 400 mb level, approximate pressure at the base of the Everest summit pyramid, to their condensation levels (LCL) using gdas1 profiles for Phortse, Nepal (27.84∘ N, 84.75∘ E). The approximate pressure at Everest's summit is 300 mb.
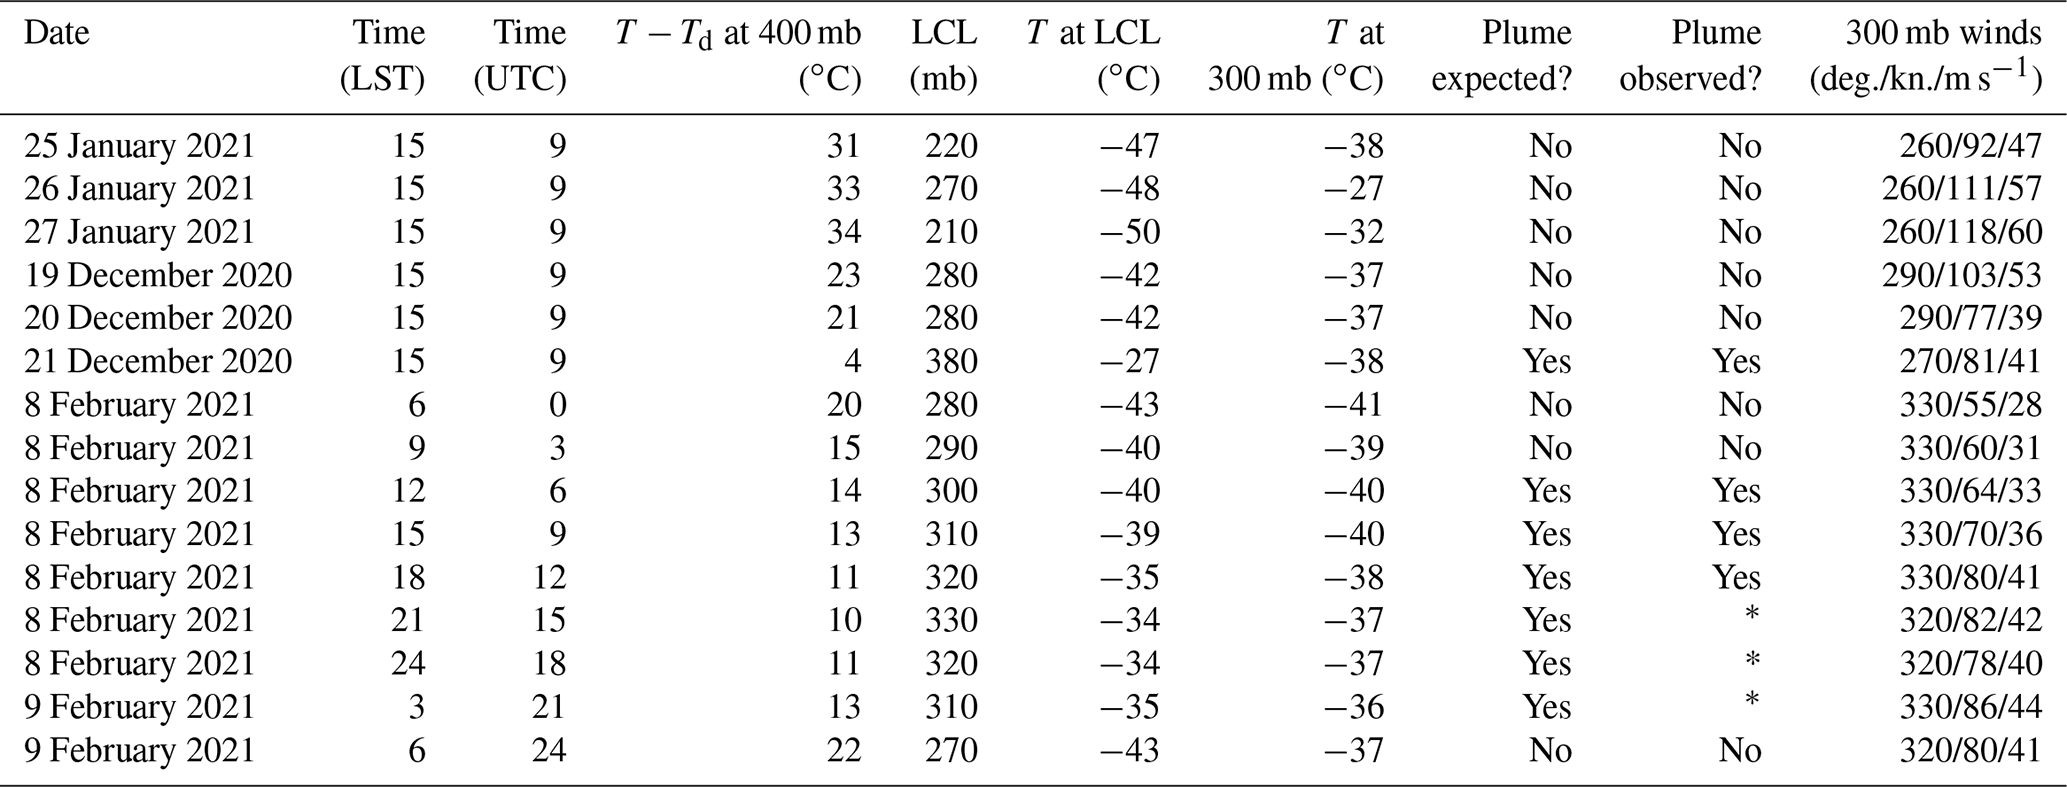
* The infrared images could not resolve a plume.
We computed the LCL values, as illustrated in Fig. 4, on the atmospheric profiles corresponding to the images. The values are given in Table 1. It can be seen that the values were all above the level of the Everest summit. The 400 mb levels were too dry. The temperature-minus-dew point (T−Td) values were all 31 ∘C or larger. This result is consistent with the observation of no plumes.
It can be seen from the profiles and in Table 1 that the winds at the summit were from the west at about 100 knots (51 m s−1) all 3 d.
3.2 Event 2
A plume was observed on 21 December 2020 (Fig. 5c) but no snowfall was measured at the AWS between 19 and 21 December. As observed in Event 1, sharp-edge shadows cast by the Cho Oyu and Everest summits in the images from 19 and 20 December (Fig. 5a and b) indicate no plumes were present. On 21 December 2020, plumes are seen streaming from these summits; the ovals in the image are elongated to bracket the plumes. Convective clouds are seen to the south of the peaks. These features are more easily observed in Movie 3 for 21 December 2020. The movie begins just before sunrise and ends just after sunset, 00:40 to 11:50 UTC (06:40 to 17:50 LST). Scrolling through the movie illustrates the late-morning onset of the plumes and convective clouds.
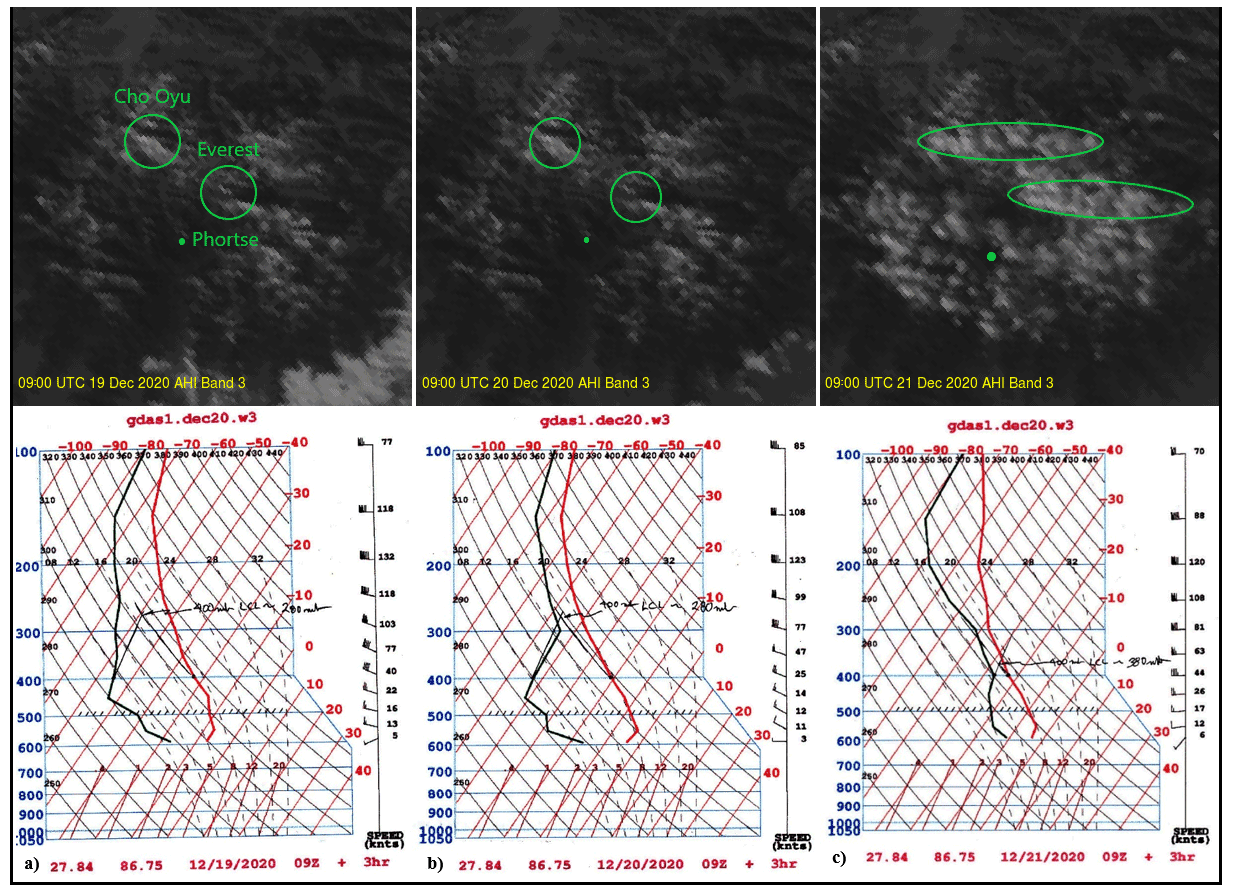
Figure 5The images and profiles (a), (b), and (c) are for 19, 20, and 21 December 2020, at 09:00 UTC (15:00 LST). The major peaks are circled and the location of Phortse is labeled. The LCL values are determined graphically on the corresponding atmospheric profiles from Phortse and are listed in Table 1. The graphical procedures are described in the text. The pressures at the base and summit of the Everest pyramid, respectively, are approximately 400 and 300 mb.
The LCL values computed on the profiles in Fig. 5 are given in Table 1. The values were above the level of the Everest summit on 19 and 20 December 2020, consistent with the observation of no plumes. The 400 mb level T−Td values were all 21 ∘C or larger. The LCL value was below the summit level on 21 December, consistent with the observed plumes. That 400 mb level T−Td value was 4 ∘C, quite moist. The −27 ∘C temperature at the LCL shows the plumes were likely liquid clouds.
It can be seen from the profiles and in Table 1 that the winds at the summit were from the west-north-west between 77 and 103 knots (39 and 53 m s−1) for the 3 d.
3.3 Event 3
A plume was observed on 8 February 2021 (Fig. 6c–e) and snowfall was measured at the AWS on 5 and 6 February but none on 7 and 8 February 2021 (images from 5 through 7 February are not presented in Fig. 6 because the region was obscured by clouds from a passing western disturbance; Lang and Barros, 2004). As can be seen in Fig. 6a and b, on 8 February shadows from the summits appear in the 07:30 and 09:00 LST images, indicating no plumes. Cho Oyu and Everest are producing plumes in the 12:00 and 15:00 LST images (Fig. 6c and d). These plumes along with Lhotse's and Makalu's plume are seen as the bright objects in the 17:30 LST image (Fig. 6e). The corresponding 17:30 LST infrared image did not resolve the plumes nor did the overnight infrared images. However, the visible image the next morning (Fig. 6f), on 9 February at 07:30 LST, is almost identical to the previous morning's image (Fig. 6a). Thus, the plumes dissipated overnight. No plumes were present either morning.
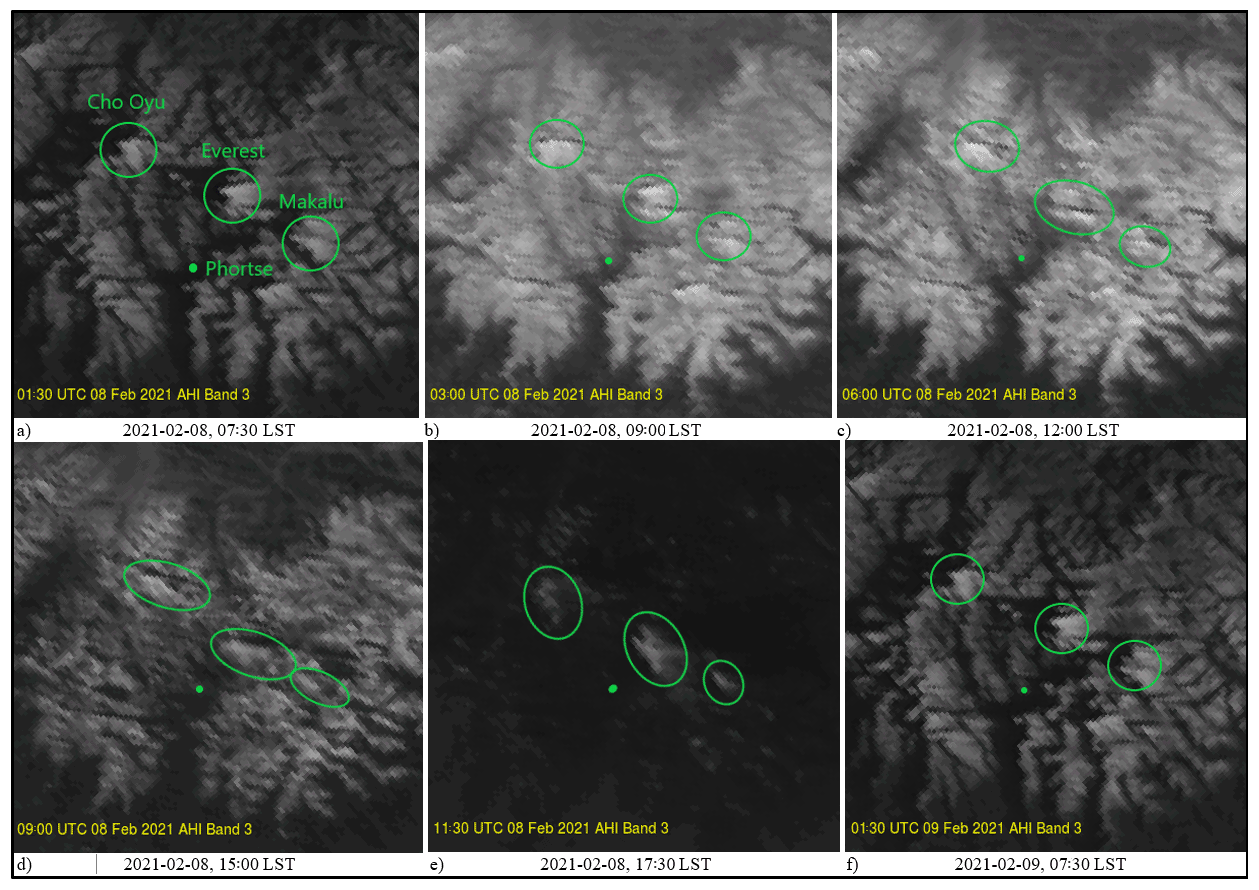
Figure 6The visible images (a), (b), (c), (d), and (e) are for 8 February 2021 and (f) is for 9 February 2021 at LST (UTC + 6h). The locations of the major peaks are circled. The corresponding LCL values are listed in Table 1.
Features in Fig. 6 are more easily viewed in Movie 4 for 8 February 2021. The movie begins just before sunrise and ends just after sunset, 00:50 to 12:10 UTC (06:50 to 18:10 LST). Slowing the video using the scroll bar, the animation illustrates the development of the plumes in the afternoon and their final illumination at sunset. At sunset, the movie reveals four plumes, one streaming from Cho Oyu's summit, a second from Everest's summit, a third from the summit of nearby Lhotse, and the fourth from Makalu. The movie illustrates the plume from Lhotse was much larger than the plume from Everest.
The LCL values, shown in Table 1, were above the level of Everest's summit (∼300 mb) at 00:00 and 03:00 UTC (06:00 and 09:00 LST) consistent with the observation of no plumes. The LCL values were at and below the summit level between 06:00 and 12:00 UTC (12:00 and 18:00 LST) consistent with the observed plumes. The values remained below the summit level overnight. The next day the 24:00 UTC (06:00 LST) value is above the summit level consistent with the observation of no plumes.
It can be seen from Table 1 that the winds at the summit were from the northwest between 55 and 86 knots (28 and 44 m s−1) on 8 and 9 February. These winds were caused by the jet stream that moved through the Everest region during 8 and 9 February, as shown by the sequence of images in Fig. 7. The red sinuous region defines the jet stream. Additionally, it can be seen in the sequence that the trough of the western disturbance, in which the jet stream was embedded, was east of the Everest region and was moving slowly eastward.
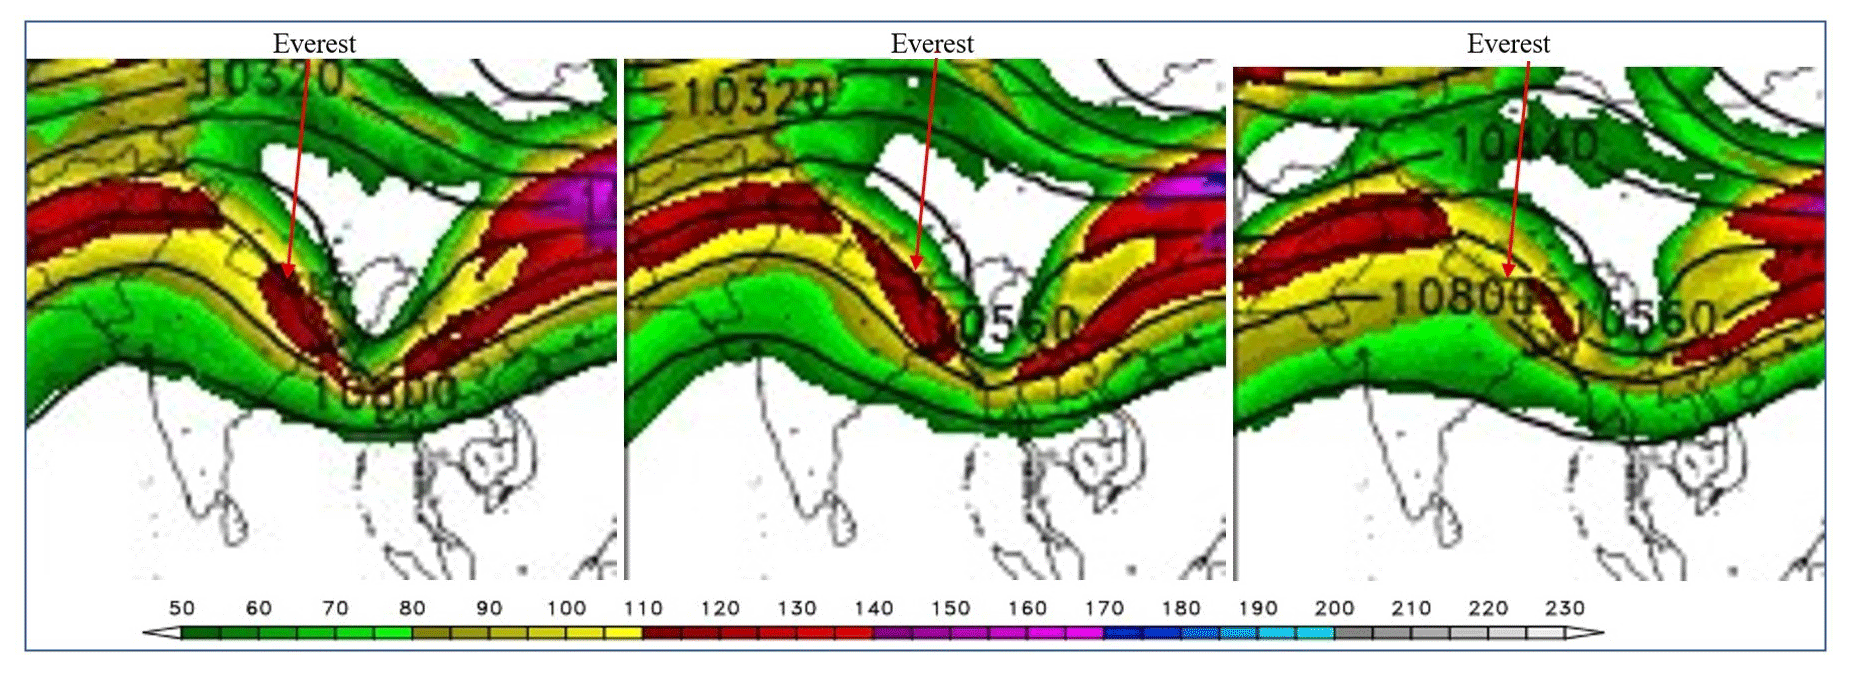
Figure 7The 00:00 UTC Global Forecast System forecast for 8 February 2021. Left: 00:00 UTC (06:00 LST); center: 12:00 UTC (18:00 LST); right: 24:00 UTC (06:00 LST 9 February). Shown are the 250 mb isotachs (knots) in the color scale, geopotential heights (gpm), and the location of Everest. Collected from the College of DuPage NEXLAB website https://weather.cod.edu/forecast/legacy/ (last access: 3 June 2022).
3.4 Plume statistics
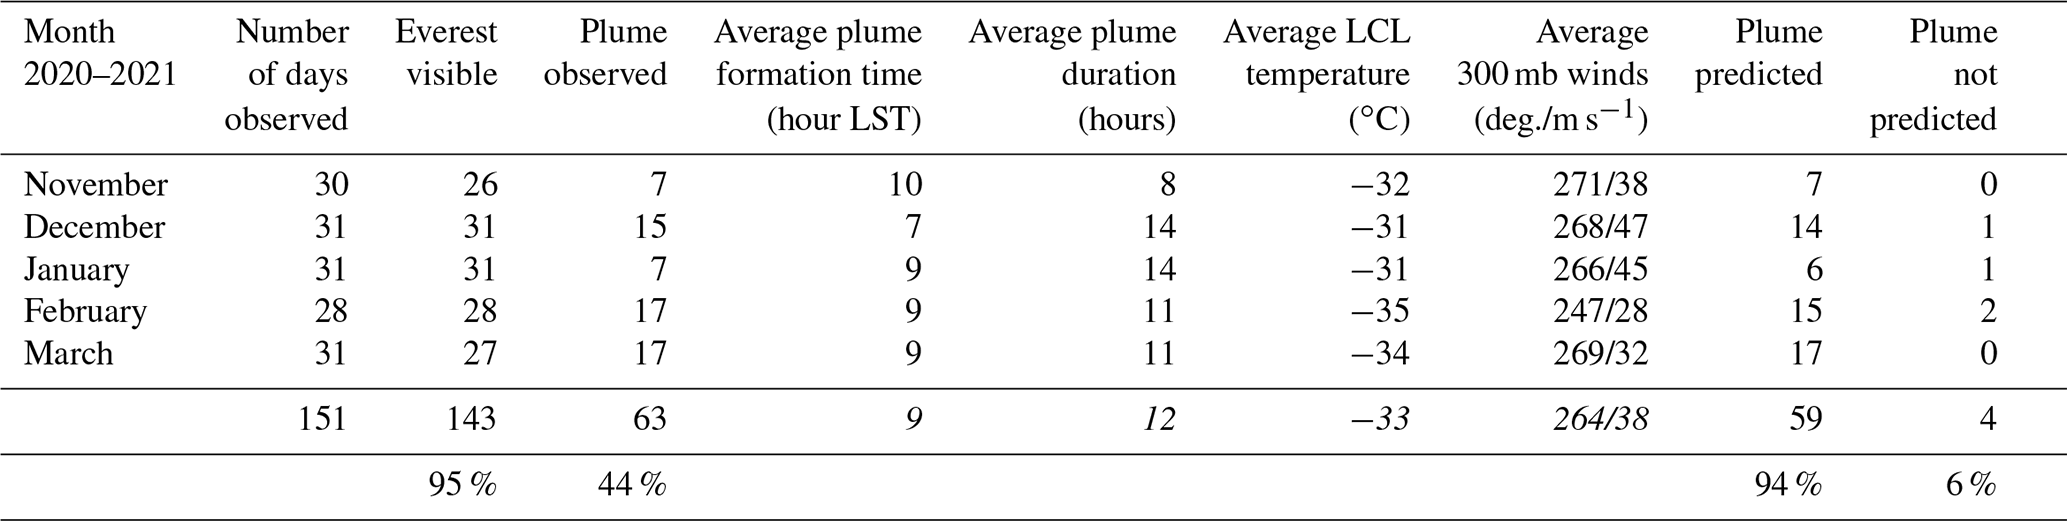
Table 2 displays a summary of our daily observations of the H-8 imagery and the 400 mb LCL values calculated from the corresponding atmospheric profiles. It can be seen from the table that Everest was almost always visible, 143 of the 151 d (95 %). On the days Everest was visible, plumes were observed to form on 63 d (44 %). Of these plumes, 59 (94 %) were predicted to form and four (6 %) were not predicted. Were those four plumes composed of resuspended snow?
Table 2Results from the observations of Himawari-8 imagery and the lifted condensation level (LCL) calculations from the corresponding atmospheric profiles (roman text denotes summed values, italics denotes average values).
The four plumes were observed on 5 December 2020, 29 January 2021, 3 and 11 February 2021. The 400 mb LCL values for the plumes ranged from 295 to 249 mb, all above the 300 mb level of the Everest summit. The plumes formed between 12:00 and 14:00 LST and dissipated around 19:00 LST. The plumes were not visible at sunrise. Therefore, these plumes were not composed of resuspended snow. Thus, none of the 63 plumes we observed were composed of resuspended snow. However, plumes of resuspended snow may have been smaller than the H-8 detection limit of a couple of kilometers.
Twice-daily images of the Everest summit coincident with a portion of our H-8 observations became available from Grey et al. (2022) while this study was in peer-review. The images were taken from 16 December 2020 through 16 January 2021 (32 days) at ∼10:00 and ∼17:00 LST. We studied the images to determine the number of days the summit was visible and the number of days plumes occurred. The summit was visible on 28 d (88 %) while the corresponding H-8 observations revealed the massif was visible on 32 d (100 %). The summit produced 18 morning plumes and 11 afternoon plumes. The corresponding H-8 observations detected eight of the morning plumes and four of the afternoon plumes. This comparison shows a number of Everest plumes did not reach the requisite length (a couple of kilometers) to be detected in the real-time H-8 images.
We observed plumes we suspect were composed primarily of snow formed in situ, as shown in Movie 5. The movie was constructed from the real-time H-8 infrared images as described in the Data Availability section. Note, in the movie NT is Nepal time, which is approximately LST. The major summits are labeled and are seen as white, stationary objects. On 21 December 2020, plumes are seen to form in the morning downwind of the Everest massif and Cho Oyu (also, these plumes are shown in Movie 3). The plumes dissipated 4 d later on 25 December 2020 early in the morning. The plumes fluctuated in length and can be seen to stream well into Tibet. The 400 mb LCL values were between 393 and 356 mb, indicating extremely moist conditions, although no precipitation was measured at Phortse.
3.5 The Moore plume
Moore (2004) studied plumes that streamed from the Everest–Lhotse–Nuptse massif late in the afternoon of 28 January 2004 (Fig. 2, top and middle). The plumes were imaged from the International Space Station (ISS). To determine whether the plumes were present that morning and the next, we analyzed all available images from the Geosynchronous Orbiting Environmental Satellite-9 (GOES-9). The GOES-9 was lent by the USA to Japan after the failed launch of MTSAT-1.
The GOES-9 images are shown in Fig. 8. The early-morning image at 07:25 LST on 28 January (Fig. 8a) shows sharp-edge shadows from Everest and Makalu. Had the plumes been present, the shadows would have been fuzzy and diffuse. The plumes were not visible until lit by the late afternoon sun as seen in the 16:13 and 16:49 LST images (Fig. 8c and d). This illumination of the plumes at sunset also occurred for the plumes presented in Fig. 6e and Movie 4, Event 3.
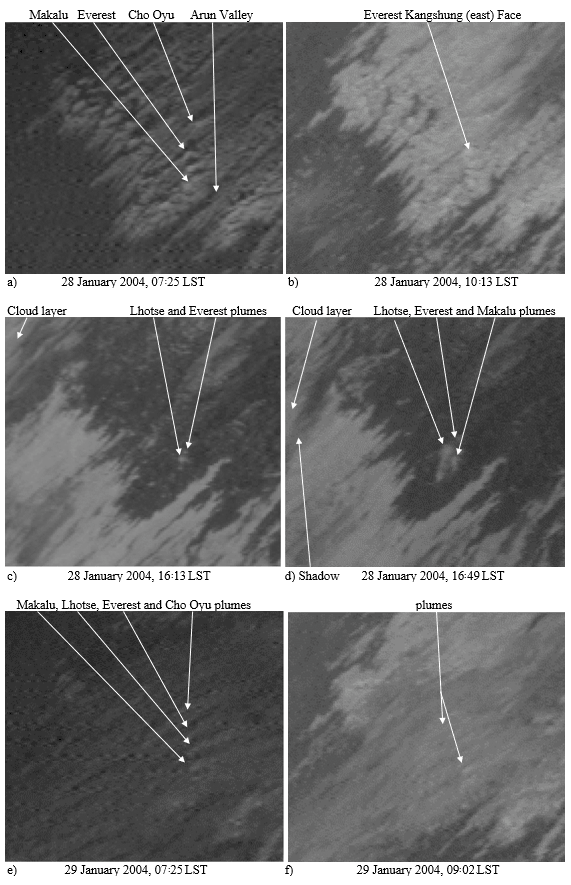
Figure 8(a–f) GOES-9 0.65 µm images of the study region. The major features are labeled.
The GOES images for the afternoon of 28 January show a cloud layer moved toward the Everest region from the west. The layer is visible in the 16:13 and 16:49 LST images (Fig. 8c and d). In the 16:49 LST image, the layer cast a shadow on the lower clouds. Moisture ahead of this layer may have formed the afternoon plumes imaged from the ISS. Based on this interpretation of the GOES images, we conclude the plume Moore studied was not present in the morning and formed in the afternoon.
Overnight, the cloud layer moved into the Everest region because at dawn on 29 January, the plumes produced by the major summits are seen to protrude above the overcast (07:25 and 09:02 LST images, Fig. 8e and f). The protruding plumes are difficult to identify in the figures. Thus, we searched the archives for images of finer spatial resolution from polar-orbiting satellites.
Finer detail of these plumes was found in the Terra/MODerate resolution Imaging Spectroradiometer (MODIS) visible image of 09:10 LST on 29 January 2004 (Fig. 9). The spatial resolution of this MODIS image is 0.38 km per pixel: the distance between Everest and Lhotse summits is 3 km (Fig. 1a) and 8 pixels covers that distance. Unfortunately, the MODIS visible image on 28 January was not useful because it was on the limb and pixelated, smearing the features. The MODIS 0.85 µm wavelength image is good for cloud detection (compared to 0.65 µm on GOES) because atmospheric scattering is less at 0.86 µm and contrasts are better maintained.
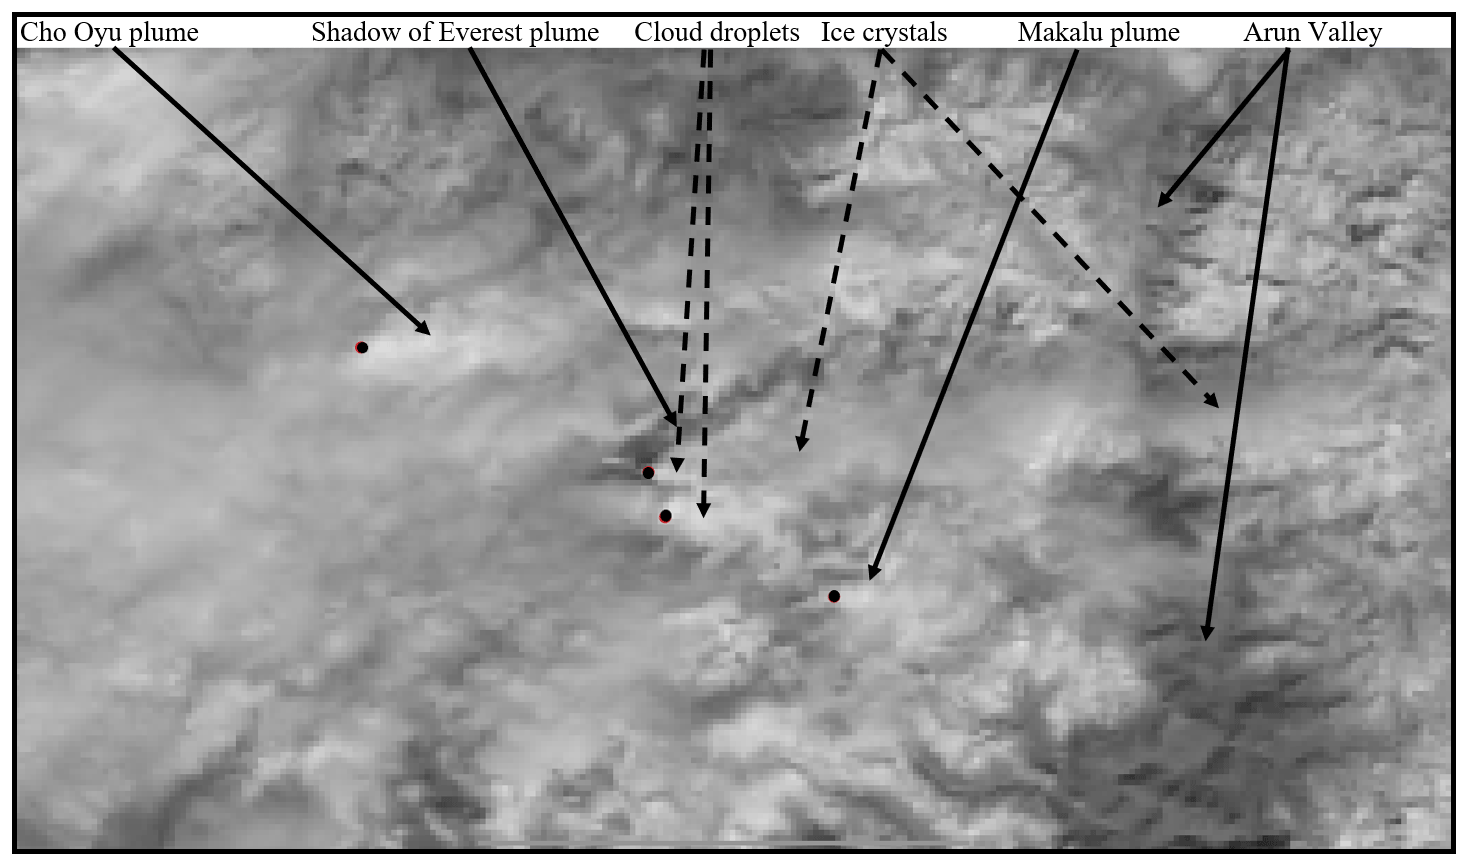
Figure 9Terra/MODIS 0.85 µm visible image of the study region on 29 January 2004 at 09:10 LST. The main features are labeled. The black dots are the locations of the summits. Figure 1c is a map of the region displayed in this image.
The MODIS image shows distinct plumes in the wakes of the major peaks. The Everest plume casts a shadow on the lower cloud layer indicating that it rises above that layer. The shadow shows the plume has a sharp edge, the edge of a liquid cloud. A short distance downwind, the plume merges with the plume from Lhotse and becomes fuzzy, suggesting glaciation. The regions of the plumes containing primarily cloud droplets are the most reflective hence the brightest and the whitest. The regions of the plume containing primarily much larger ice crystals are less reflective and appear dimmer and grayer. The fuzzy plume traveled across the Arun Valley. It is possible crystals fell as snow that may have reached the surface.
4.1 Meteorology
The plume observations and the corresponding meteorological analyses are summarized in Tables 1 and 2. The LCL values show plumes were observed when the 400 mb LCL was below the 300 mb level of the summit of Everest. This result shows that moisture condensed in the dynamically forced rising air in the Everest wake to produce the plumes. Moisture likely was transported vertically in morning convection (Hindman and Upadhyay, 2002) and entrained by the wake producing the afternoon plumes. Some of the moisture could have come from sublimation of snow. Stigter et al. (2018) measured cumulative sublimation and evaporation from a glacier in the Nepalese Himalayas to be 21 % of the total annual snowfall. Finally, the morning moisture transport and afternoon appearance of the plumes are consistent with the findings of Wirth et al. (2012, Fig. 5b) for banner clouds produced by the Zugspitze.
All the plumes we presented (Figs. 3, 5, and 6) were absent in the mornings and visible in the afternoons. The plumes with corresponding meteorology (Figs. 5 and 6) occurred with summit wind speeds of 50 knots (26 m s−1) or greater and 400 mb T−Td values of 14 ∘C or less. If the T−Td values were larger than 14 ∘C, no plumes were observed.
The plume Moore (2004) investigated was not observed in the morning (Fig. 8a and b). Had it been a plume of resuspended snow, as he concluded, the plume would have been visible in the morning because the wind speeds were between 85 and 120 knots (43 and 61 m s−1) all day (from the REANALYSIS archive at https://www.ready.noaa.gov/READYamet.php, last access: 3 June 2022). On the next day, the plume was observed in a MODIS image to glaciate downwind (Fig. 9). Thus, the plume may have produced snow.
4.2 Composition
The initial composition of the plumes was deduced from the temperature of the LCL. The initial composition of the plumes on 21 December 2020 (Fig. 5c) was expected to be cloud droplets because the plume formed at a temperature warmer than −35 ∘C. The plumes of 8 February 2021 (Fig. 6d and e) likely began as ice clouds because the plumes formed at a temperature colder than −35 ∘C. The Everest plume imaged in Fig. 9 appears initially liquid that glaciated downwind. This change in composition is supported by the measurements of Baker and Lawson (2006) that revealed cloud droplets that formed initially could nucleate to form ice crystals further downwind (their Fig. 6).
The plumes we observed, plus Moore's, could not have been composed of resuspended snow because they were not present in the mornings. The wind speeds were fast from morning throughout the day. If the plumes were composed of resuspended snow, they also would have appeared in the mornings.
4.3 Estimate of snowfall from the observed plumes
Assume a saturated parcel of air ascends moist-adiabatically in Everest's wake from the elevation of the South Col at ∼7900 m (∼400 mb) to the summit at ∼8900 m (∼300 mb), see Fig. 1a. The parcel is initially −33 ∘C (the average plume temperature, Table 2) and cools to −40 ∘C at the summit. The initial parcel saturated mixing ratio is 0.59 g kg−1 and the final is 0.39 g kg−1 for an average of 0.49 g kg−1. Employing the precipitable water calculator at http://www.shodor.org/os411/courses/_master/tools/calculators/precipwater/ (last access: 3 June 2022), ∼1 mm of water is expected to precipitate from the parcel.
Assume the parcel ascends at 0.1 m s−1 in the turbulent wake the 1000 m from the South Col to the summit; the ascent requires 104 s. Thus, every 104 s, 1 mm of liquid precipitates from the parcel. The average duration of the observed plumes was 12 h (Table 2) or 4.32×10⁴ s. The amount of precipitation from the average plume was 1 mm per 104 s × 4.32 × 104 s or about 4 mm.
A total of 63 Everest plumes occurred during our 4-month observation period (Table 2). Thus, 63 plumes × 4 mm per plume equals about 252 mm (∼25 cm) of liquid-equivalent. The amount of liquid-equivalent precipitation measured at Phortse during our observation period was 284.5 mm (∼28 cm). Thus, Everest plumes may be a significant source of snowfall.
The plume-generated snowfall is expected to be a maximum in the immediate lee of the Everest massif and diminish downwind as drier air is entrained. The always-white Kangshung face of Everest (Fig. 1b) may be evidence of plume-generated snowfall, although much of this snow may be captured from snow-filled clouds flowing around the summit pyramid. This capture is similar to snow collecting on the tailgate of a truck speeding through a snow storm.
We studied the formation and composition of wintertime plumes produced by the Mount Everest massif. We found the massif produced plumes when the air entrained into its wake was sufficiently moist, 400 mb temperature-minus-dew point values 14 ∘C or smaller. The plumes occurred with summit winds of 50 knots (26 m s−1) or greater. We concluded one plume was initially composed of cloud droplets, not resuspended snow, and the other was initially composed of ice particles. Evidence is presented that one plume glaciated downwind. We estimated the plumes may be a significant source of snowfall.
The Everest massif was visible on 143 of the 151 observation days (95 %) especially in the morning because the plumes most often formed later in the morning. On the days the massif was visible, plumes were observed to form on 63 d (44 %). The plumes lasted an average of 12 h. Of these plumes, 59 (94 %) were predicted to form and four (6 %) were not predicted. These four plumes were not composed of resuspended snow because they were not visible at sunrise. However, plumes of resuspended snow may have been smaller than the H-8 detection limit of a couple of kilometers for the Everest region.
Our analysis of the Grey et al. (2022) images of the Everest summit from the surface showed a number of Everest plumes did not reach the couple of kilometers in length to be detected in the real-time H-8 images. Thus, our plume-occurrence values should be considered a lower limit.
We show that the plume studied by Moore (2004) was a banner cloud, not a plume of resuspended snow.
The images in Figs. 4, 5, and 6 were created using Geo2Grid software (http://cimss.ssec.wisc.edu/csppgeo/geo2grid_v1.0.0.html, Strabala and Hoese, 2022) and Himawari Standard Data (HSD) files from H-8 available at the UW-Madison SSEC Data Center (courtesy of JMA, the Japan Meteorological Agency, https://www.jma.go.jp/jma/jma-eng/satellite/dissemination.html, JMA, 2022).
Movies 2, 3, and 4 were created from the still imagery using ImageMagick. Tutorials on how to use Geo2Grid are available at this CIMSS Satellite Blog link: http://cimss.ssec.wisc.edu/satellite-blog/?s=geo2grid (Lindstrom, 2022a). The movies are in the Supplement.
Movie 5 was constructed from *.GIF images downloaded in real time from the Himawari-8 website (https://www.data.jma.go.jp/mscweb/data/himawari/sat_img.php?area=ha2, Hindman, 2020). Images were downloaded every 30 min. The images were animated and labeled using EzGIF.com and the animation was transformed to MP4 using VideoPad Video Editor.
Wirth (2022) suggested we attempt to post-process the best-resolution H-8 visible imagery to improve the movie resolution. In general, the sharpening techniques we are aware of (e.g., in SatPy) require a higher resolution band. Thus, for example, on H-8, Band 1 (0.47 µm, with 1 km resolution at nadir) or Band 2 (0.51 µm, also 1 km resolution) can be sharpened with information from Band 3 (0.64 µm, with 0.5 km resolution at nadir). Hence, there is no practical method to improve the spatial resolution in Band 3.
Data for the MODIS imagery were downloaded from the NASA LAADS (Level-1 and Atmosphere Archive and Distribution System) DAAC (Distributed Active Archive Center) archive and processed into imagery using Polar2Grid software (Strabala and Hoese, 2022). Lindstrom (2022b) provides a tutorial on how to access and display archived MODIS data at http://cimss.ssec.wisc.edu/satellite-blog/archives/36727.
The supplement related to this article is available online at: https://doi.org/10.5194/acp-22-7995-2022-supplement.
EEH initiated the study, provided the meteorological interpretations, and constructed Movies 1 and 5. SL produced the satellite images, Movies 2, 3, and 4, and satellite sensor interpretations.
The contact author has declared that neither they nor their co-author has any competing interests.
Publisher’s note: Copernicus Publications remains neutral with regard to jurisdictional claims in published maps and institutional affiliations.
Edward E. Hindman's participation was self-funded. Scott Lindstrom was partially supported by the Cooperative Agreement between NOAA and the University of Wisconsin-Madison Cooperative Institute for Meteorological Satellite Studies (CIMSS).
Scott Lindstrom received partial support from the National Oceanic and Atmospheric Administration (NOAA) Joint Polar Satellite System (JPSS) (grant no. NA20NES4320003).
This paper was edited by Martina Krämer and reviewed by Volkmar Wirth and one anonymous referee.
Anker, C., Hornbein, T., Lageson, D., Coburn, B., Byers, A., McDonald, B., Johnson, B., Jenkins, M., and Breashears, D.: The call of Everest, 1st Edn., National Geographic Society, 303 pp., ISBN 978-1-4262-1016-7, 2013.
Anonymous Referee: Referee comment 1, https://doi.org/10.5194/acp-2021-966-RC2, 2022.
Baker, B. A. and Lawson, R. P.: In situ observations of the microphysical properties of wave, cirrus, and anvil clouds. Part I: wave clouds, J. Atmos. Sci., 63, 3160–3185, https://doi.org/10.1175/JAS3802.1, 2006.
Douglas, C. K. M.: Some alpine cloud forms, Q. J. Roy. Meteor. Soc., 5, 175–177, https://doi.org/10.1002/qj.49705422702, 1928.
Grey, L., Johnson, A. V., Matthews, T., Perry, L. B., Elmore, A. C., Khadka, A., Shrestha, D., Tuladhar, S., Baidya, S. K., Aryal, D., and Gajurel, A. P.: Mount Everest's photogenic weather during the post-monsoon, Weather, 77, 156–160, https://doi.org/10.1002/wea.4184, 2022.
Hindman, E. E.: Meteorological Satellite Center of JMA, Movie 5, Himawari Real-Time Image [data set], https://www.data.jma.go.jp/mscweb/data/himawari/sat_img.php?area=ha2 (last access: 4 June 2022), 2020.
Hindman, E. E. and Engber, M. J.: Air motions in the Khumbu Himal and possible soaring flights, Technical Soaring, 19, 3–8, https://journals.sfu.ca/ts/index.php/ts/article/view/574/544 (last access: 4 June 2022), 1995.
Hindman, E. E. and Upadhyay, B. P.: Air pollution transport in the Himalayas of Nepal and Tibet during the 1995–1996 dry season, Atmos. Environ., 36, 727–739, https://doi.org/10.1016/S1352-2310(01)00495-2, 2002.
Hindman, E. E. and Wick, E. J.: Air motions in the vicinity of Mt. Everest as deduced from Pilatus Porter flights, Technical Soaring, 14, 52–56, https://journals.sfu.ca/ts/index.php/ts/article/view/755/713 (last access: 4 June 2022), 1990.
JMA (Japanese Meteorological Agency): https://www.jma.go.jp/jma/jma-eng/satellite/dissemination.html, last access: 16 June 2022.
Lang, T. J. and Barros, A. P.: Winter storms in the central Himalayas, J. Meteorol. Soc. Jpn., 82, 829–844, https://doi.org/10.2151/jmsj.2004.829, 2004.
Lindstrom, S.: Various titles, http://cimss.ssec.wisc.edu/satellite-blog/?s=geo2grid, last access: May 2022a.
Lindstrom, S.: Using Polar2Grid software to display historical MODIS data, http://cimss.ssec.wisc.edu/satellite-blog/archives/36727, last access: 13 June 2022b.
Moore, G. W. K.: Mount Everest snow plume: A case study, Geophys. Res. Lett., 31, 4 pp., https://doi.org/10.1029/2004GL021046, 2004.
Perry, L. B., Matthews, T., Guy, H., Koch, I., Khadka, A., Elmore, A., Shrestha, D., Tuladhar, S., Baldya, S., Maharjan, S., Wagon, P., Aryal, D., Seimon, A., Gajurel, A., and Mayewski, P.: Precipitation characteristics and moisture source regions on Mt. Everest in the Khumbu, Nepal. One Earth, 3, 594–607, https://doi.org/10.1016/j.oneear.2020.10.011, 2021.
Prestel, I. and Wirth, V.: What flow conditions are conducive to banner cloud formation?, J. Atmos. Sci., 73, 2385–2402, https://doi.org/10.1175/JAS-D-15-0319.1, 2016.
Reinert, D. and Wirth, V.: A new large-eddy simulation model for simulating air flow and warm clouds above highly complex terrain. Part II: The moist model and its application to banner clouds, Boundary Layer Meteorology, 133, 113–136, https://doi.org/10.1007/s10546-009-9419-x, 2009.
Schween, J. H., Kuettner, J., Reinert, D., Reuder, J., and Wirth, V.: Definition of “banner clouds” based on time lapse movies, Atmos. Chem. Phys., 7, 2047–2055, https://doi.org/10.5194/acp-7-2047-2007, 2007.
Stigter, E., Litt, M., Steiner, J., Bonekamp, P., Shea, J., Bierkens, M., and Immerzeel, W.: The importance of snow sublimation on a Himalayan glacier, Front. Earth Sci., 6, 16 pp., https://doi.org/10.3389/feart.2018.00108, 2018.
Strabala, K. and Hoese, D.: Polar2Grid documentation, https://www.ssec.wisc.edu/software/polar2grid/, last access: 14 June 2022 (software available at: http://cimss.ssec.wisc.edu/csppgeo/geo2grid_v1.0.0.html, last access: 13 June 2022).
Venables, S.: Everest-Kangshung Face, 1st Edn., Rupa & Co., 256 pp., ISBN 978-0-34042-366-0, 1989.
Voigt, M. and Wirth, V.: Mechanisms of banner cloud formation, J. Atmos. Sci., 70, 3631–3640, https://doi.org/10.1175/JAS-D-12-0353.1, 2013.
Wirth, V., Kristen, M., Leschner, M., Reuder, J., and Schween, J. H.: Banner clouds observed at Mount Zugspitze, Atmos. Chem. Phys., 12, 3611–3625, https://doi.org/10.5194/acp-12-3611-2012, 2012.
Wirth, V.: Referee Comment 2, https://doi.org/10.5194/acp-2021-966-RC1, 2022.