the Creative Commons Attribution 4.0 License.
the Creative Commons Attribution 4.0 License.
 | 16 Jun 2022
Discrepancy in assimilated atmospheric CO over East Asia in 2015–2020 by assimilating satellite and surface CO measurements
Zhaojun Tang
Jiaqi Chen
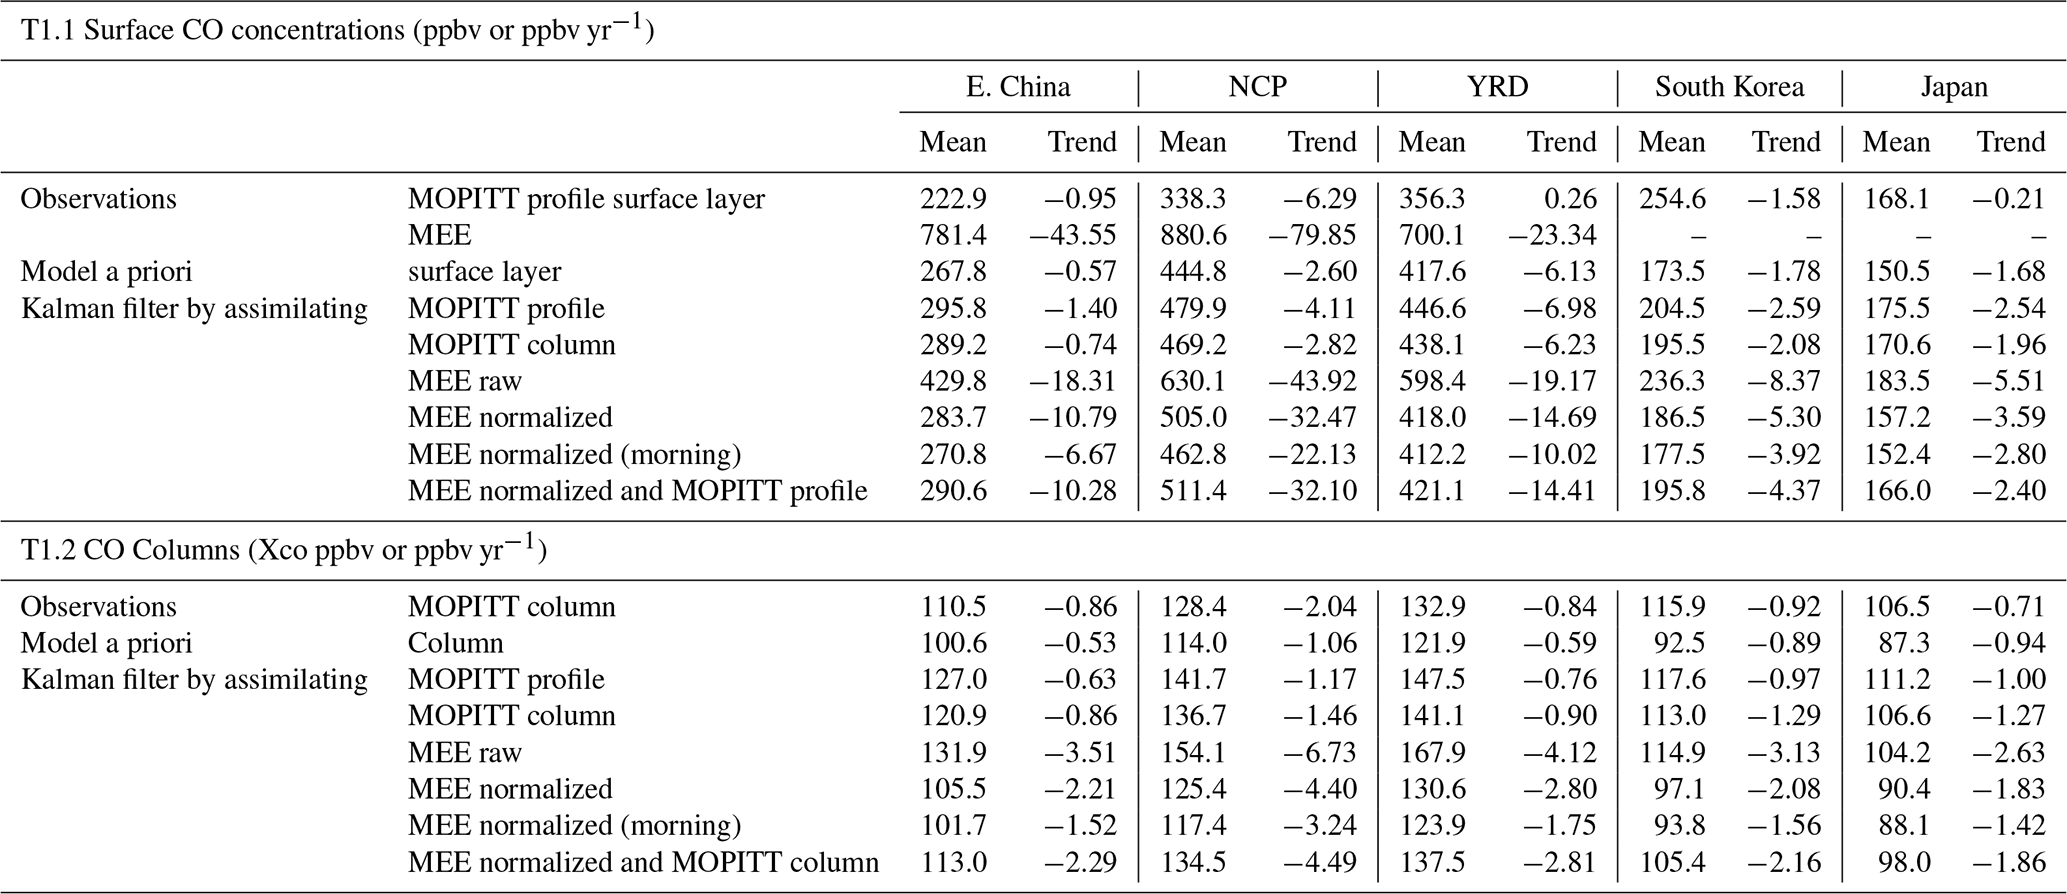
Satellite and surface carbon monoxide (CO) observations have been widely used to investigate the sources and variabilities of atmospheric CO. However, comparative analyses to explore the effects of satellite and surface measurements on atmospheric CO assimilations are still lacking. Here we investigate the assimilated atmospheric CO over East Asia in 2015–2020, via assimilating CO measurements from the Measurement of Pollution in the Troposphere (MOPITT) instrument and Ministry of Ecology and Environment of China (MEE) monitoring network. We find noticeable inconsistencies in the assimilations: the adjusted CO columns (Xco) are about 162, 173 and 172 ppb by assimilating surface CO measurements, in contrast to 138–144, 149–155 and 144–151 ppb by assimilating MOPITT CO observations over East China, the North China Plain (NCP), and the Yangtze River Delta (YRD), respectively. These inconsistencies could be associated with possible representation errors due to differences between urban and regional CO backgrounds. Furthermore, the adjusted surface CO concentrations are about 631, 806, and 657 ppb by assimilating surface CO measurements, in contrast to 418–427, 627–639 and 500–509 ppb by assimilating MOPITT CO observations over East China, NCP, and YRD, respectively; assimilations of normalized surface CO measurements (to mitigate the influences of representation errors) indicate declines of CO columns by about 2.2, 2.1, and 1.8 ppb yr−1, in contrast to 0.63–0.86, 0.97–1.29, and 1.0–1.27 ppb yr−1 by assimilating MOPITT CO measurements over East China, South Korea, and Japan, respectively. These discrepancies reflect the different vertical sensitivities of satellite and surface observations in the lower and free troposphere. This work demonstrates the importance of integrating information from satellite and surface measurements to provide a more accurate evaluation of atmospheric CO changes.
- Article
(5917 KB) - Full-text XML
- BibTeX
- EndNote


Atmospheric CO is one of the most important pollutants and plays a key role in tropospheric chemistry. Sources of atmospheric CO include fossil fuel combustion, biomass burning, and oxidation of hydrocarbons. The importance of atmospheric CO has made it an essential target of global emission controls. Satellite measurements have been used to investigate atmospheric CO changes (Han et al., 2018; Hedelius et al., 2021; Gaubert et al., 2020). Inverse analyses based on satellite measurements have further improved our understanding of CO sources. For example, Jiang et al. (2017) constrained global CO emissions in 2001–2015 by assimilating MOPITT CO observations. Zheng et al. (2018a) constrained East Asian CO emissions in 2005–2016 using MOPITT CO observations. Müller et al. (2018) assimilated Infrared Atmospheric Sounding Interferometer (IASI) CO observations to assess the impacts of hydroxyl radical (OH) on derived CO emissions.
A major advantage of satellite measurements is the global covered observations. In addition, the pixel-based observations allow convenient comparison with grid-based model simulations. However, the limited vertical resolution implies that the retrieved lower tropospheric CO is affected by free tropospheric CO (Jiang et al., 2013; Buchholz et al., 2017; Hedelius et al., 2021), despite the joint retrieval of near-infrared (NIR) and thermal infrared (TIR) spectral data, which can enhance the sensitivity to lower tropospheric CO (Worden et al., 2010; Deeter et al., 2017). In contrast to lower tropospheric CO, free tropospheric CO is more susceptible to influences from factors such as long-range transport. Consequently, interpretation of satellite CO measurements requires disentangling the influences from local and nonlocal sources.
Besides satellite observations, surface in situ CO measurements have been used to analyze atmospheric CO variabilities (Bouarar et al., 2019; Kong et al., 2020; Squires et al., 2020). There are also recent advances to assess CO sources via assimilating surface CO measurements provided by air quality stations, particularly in China. For example, Peng et al. (2018) assimilated surface CO observations to optimize CO emissions in October 2014. Ma et al. (2019) assimilated surface CO observations to optimize CO emissions in September 2016. Feng et al. (2020) constrained CO emissions in December 2013 and 2017. In contrast to satellite measurements, surface CO observations have rapid responses to local CO emissions. Consequently, the interpretation of surface CO observations is less affected by nonlocal sources and sinks. However, the sparse distributions of surface stations have dimmed the importance of surface CO observations. In addition, it is challenging to match in situ surface measurements with grid-based model simulations because of noticeable representation errors (Schutgens et al., 2017) and possible uncertainties in the planetary boundary layer (PBL) mixing (Castellanos et al., 2011).
To sufficiently understand CO variabilities, people may take advantage of information from both satellite and surface measurements. For example, Chen et al. (2020) found decreasing trends in atmospheric CO concentrations from both MOPITT and surface CO measurements over the Yangtze River Delta (YRD). However, comparative analyses to investigate the effects of satellite and surface CO measurements in data assimilation systems are still lacking, which poses a significant barrier to integrating the information provided by satellite and surface measurements in data assimilation applications. In this work, we investigate the assimilated atmospheric CO over East Asia in 2015–2020, via assimilating CO measurements from the MOPITT and Ministry of Ecology and Environment (MEE) surface observations, to explore the methodology of assimilating two types of measurements, as well as the impacts of CO emission declines in China on atmospheric CO over East Asia. This paper is organized as follows: in Sect. 2, we describe the CO observations, GEOS-Chem model, and the Kalman filter approach used in this work. In Sect. 3, we investigate the performances of satellite and surface measurements in Kalman filters. Our conclusions follow in Sect. 4.
2.1 MOPITT CO measurements
The MOPITT instrument was launched on 18 December 1999 on the NASA/Terra spacecraft. The satellite is in a sun-synchronous polar orbit of 705 km and crosses the Equator at 10:30 local time. The instrument makes measurements in a 612 km cross-track scan with a footprint of 22 km × 22 km and provides global coverage every three days. The MOPITT data used here were obtained from the joint retrieval (V8J) of CO from thermal infrared (TIR, 4.7 µm) and near-infrared (NIR, 2.3 µm) radiances using an optimal estimation approach (Worden et al., 2010; Deeter et al., 2017). The retrieved volume mixing ratios (VMRs) are reported as layer averages of 10 pressure levels (surface, 900, 800, 700, 600, 500, 400, 300, 200, and 100 hPa).
Following Jiang et al. (2017), we reject MOPITT data with CO column amounts of less than 5×10¹⁷ molec. cm2 and with low cloud observations. Since the NIR channel measures reflected solar radiation, only daytime data are considered. As shown in Fig. 1a, CO columns provided by MOPITT indicate decreasing trends over East Asia in 2015–2020, consistent with reported CO variability (Zheng et al., 2018a; Chen et al., 2020; Hedelius et al., 2021). In addition, the vertical columns are converted to column-averaged dry-air mole fractions (Xco) in this work.
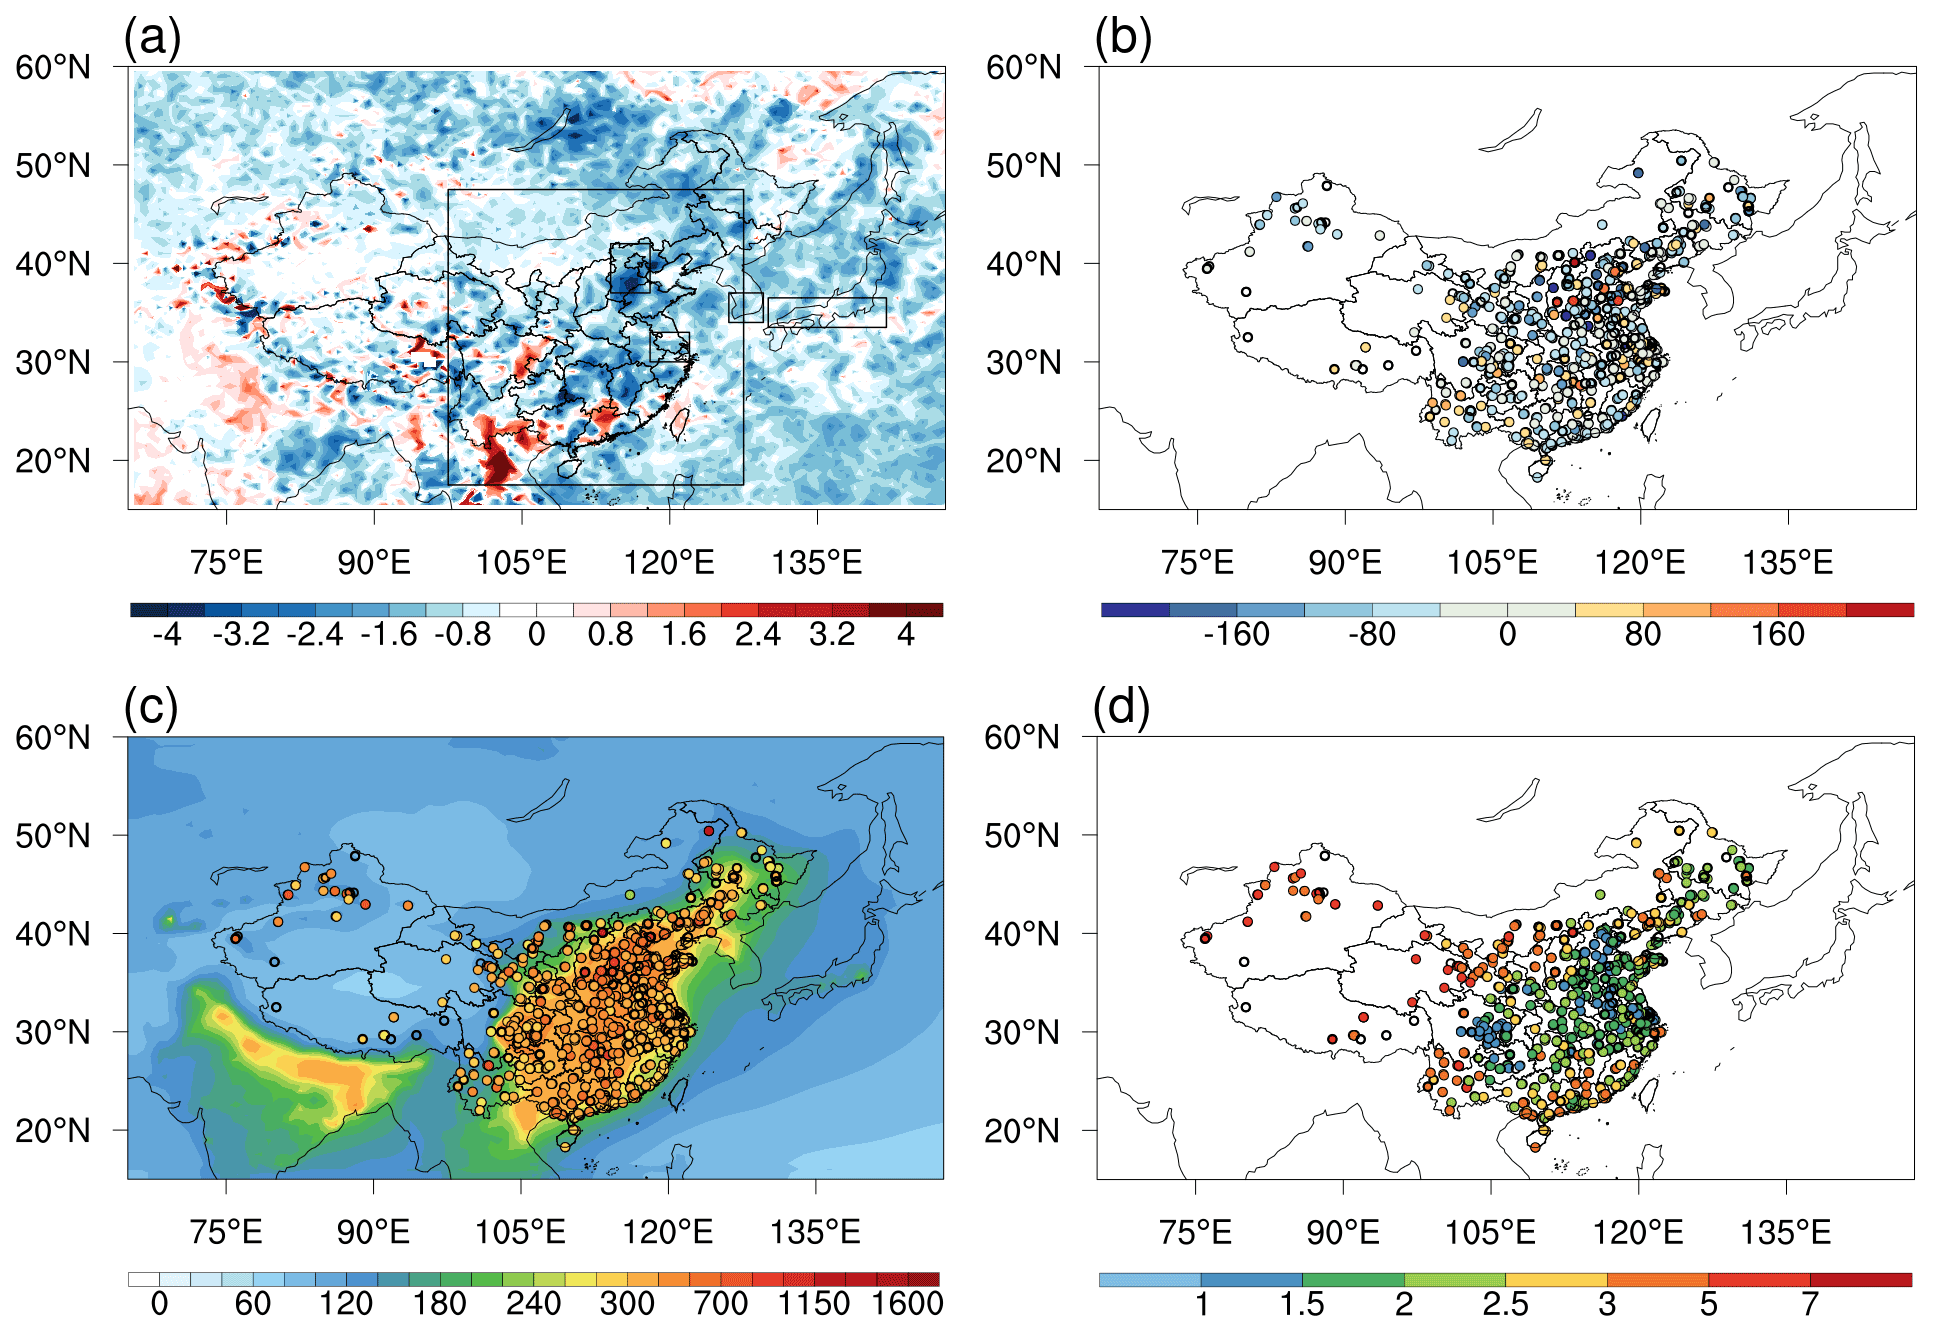
Figure 1(a) Trends of MOPITT CO columns (Xco) in 2015–2020 with unit ppb yr−1; (b) trends of MEE surface CO concentrations in 2015–2020 with unit ppb yr−1; (c) modeled (contour, a priori simulation) and observed (dotted) surface CO concentrations in 2019 with unit ppb; (d) ratios between observed and modeled (a priori simulation) surface CO concentrations in 2019. The black boxes in panel (a) define the domains (land only) of East China, NCP, YRD, South Korea, and Japan. The areas outside of China are excluded in the East China domain.
2.2 MEE surface CO measurements
We use MEE surface in situ hourly CO concentration data (https://quotsoft.net/air/, last access: 14 June 2022) for the period of 2015–2020. These real-time monitoring stations have the ability to report hourly concentrations of critical pollutants from over 1670 sites in 2020, which have been widely used to investigate the sources and changes of atmospheric CO in China (Peng et al., 2018; Ma et al., 2019; Feng et al., 2020). Concentrations were reported by the MEE in units of mg m−3 with a precision of 0.001 mg m−3, under standard temperature (273 K) until 31 August 2018. This reference state was changed on 1 September 2018 to 298 K. We converted CO concentrations to ppb and rescaled post-August 2018 concentrations to standard temperature (273 K) to keep consistency in the trend analysis. To ensure the reliability of the data before assimilation, we screened the data on the numerical range and the time range. In the first step, we removed data with CO concentrations higher than 6000 ppb (∼ 7.5 mg m−3), and the selection of this empirical value is relatively close to the 7 mg m−3 selected by Feng et al. (2020). In the second step, to ensure the rationality of the daily variation of the assimilation results, we eliminated 327 sites with missing data for more than 14 consecutive days, accounting for 19.5 % of the total number of sites. Figure 1b shows the trends of surface CO concentrations provided by MEE. There are high-density surface stations in East China with significant decreasing trends of CO concentrations from 2015 to 2020.
2.3 GEOS-Chem model simulations
The GEOS-Chem chemical transport model (http://www.geos-chem.org (last access: 4 June 2022), version 12–8–1) is driven by assimilated meteorological data of MERRA-2. Our analysis is conducted at a horizontal resolution of nested 0.5∘ × 0.625∘, and employs the CO-only simulation in GEOS-Chem, which uses archived monthly OH fields from the full chemistry simulation (Fisher et al., 2017). The CO boundary conditions are updated every 3 h from a global simulation with 4∘ × 5∘ resolution. Emissions in GEOS-Chem are computed by the Harvard-NASA Emission Component (HEMCO). Global default anthropogenic emissions are from the Community Emissions Data System (CEDS) (Hoesly et al., 2018). Regional emissions are replaced by the Multiresolution Emission Inventory for China (MEIC) in China and MIX in other regions of Asia (Li et al., 2017). The total anthropogenic CO emissions in the MEIC inventory are further scaled with linear projections based on Zheng et al. (2018b). Open fire emissions are from the Quick Fire Emissions Dataset (QFED) (Darmenov and da Silva, 2015). The biogenic emissions of volatile organic compounds (VOCs) are calculated according to the Model of Emissions of Gases and Aerosols from Nature (MEGAN v2.1) (Guenther et al., 2006).
2.4 Kalman filter approach
We employ the suboptimal Kalman filter (Todling and Cohn, 1994) to assimilate MOPITT and surface CO observations. As a brief description of the assimilation algorithm, the forward model (M) predicts CO concentration (xat) at time t:
The optimized CO concentrations can be expressed as
where yt is observation, Kt represents operation operator, which projects CO concentrations from the model space to observation space. Gt is the Kalman filter gain matrix, which can be described as
where Sat and Sϵ are model and observation covariance, respectively. The suboptimal Kalman filter has been applied in previous studies to provide quick optimization for initial and boundary atmospheric CO concentrations (Jiang et al., 2015, 2017). Han et al. (2022) further provided a comparative analysis between suboptimal Kalman filter and a hybrid deep learning model to predict surface CO concentrations in China in 2015–2020, and found a good performance of the Kalman filter in respect to independent observations. We note that the optimization effect of suboptimal Kalman filter is expected to be weaker than more complicated methods such as ensemble Kalman filter, particularly because the latter can optimize CO emissions and concentrations simultaneously (Miyazaki et al., 2017; Feng et al., 2020). For example, Ma et al. (2019) indicated that updated anthropogenic emissions led to improved CO forecast by about 10 % during the first 36 h of forecasts.
The assimilations were started on 1 July 2014 by assimilating MOPITT or MEE CO observations to produce optimized initial conditions on 1 January 2015. The modeled CO concentrations are compared with observations and updated hourly, based on Eq. (2), and then forwarded to Eq. (1) for the model simulations in the next time step; i.e., the assimilation window is 1 h. We assume fixed model errors (50 %). The observation errors of satellite data are calculated based on the MOPITT error covariance matrix. The observation errors of surface observations include measurement errors and representative errors. The measurement errors are calculated following Feng et al. (2020): , where ermax is the base error (6 ppb) and Π0 represents the observed CO concentrations. The representation errors are calculated following Elbern et al. (2007) and Tang et al. (2013): , where γ is a scaling factor (0.5), Δl is the model resolution (∼ 56 km in this study), and L represents the range that observation can reflect, which depends on the station type (2 km for urban, 4 km for suburban). Given the measurement error ε0 and the representative error εr, the total observation error is defined as . Furthermore, the “super-observation” method was applied in this work to further reduce the influence of representative error (Miyazaki et al., 2017; Feng et al., 2020):
where yj is CO observation of the jth station, ωj represents the weighting factor of the jth station, ys and εs are the grid-based CO observations and errors (super-observation), respectively.
3.1 Kalman filter assimilating MOPITT CO
We firstly assimilate MOPITT CO data with global simulations (4∘ × 5∘ resolution) to optimize East Asian CO boundary conditions. Similar to Jiang et al. (2017), the MOPITT profile and column data are assimilated individually to produce two types of CO boundary conditions. High-resolution (0.5∘ × 0.625∘) Kalman filter assimilation is performed within the East Asian domain via assimilating MOPITT profile and column data individually, and reading the corresponding CO boundary conditions. As shown in Fig. 2a, we find marked seasonality in surface CO concentrations: about 800 ppb in winter and 300 ppb in summer over the North China Plain (NCP) in 2019. The assimilation of MOPITT CO has a small influence on CO concentrations at the surface level: the mean surface CO concentrations over East China increased from 268 to 289–296 ppb in 2015–2020 (Table 1). This could be associated with the limited sensitivity of MOPITT to lower tropospheric CO, as well as the revisit time of satellite measurements; i.e., MOPITT visits an individual model grid every 3 d. Thus, the adjustment of surface CO by Kalman filter can be affected by biased CO emissions in the forward simulations with a 60 min time step.
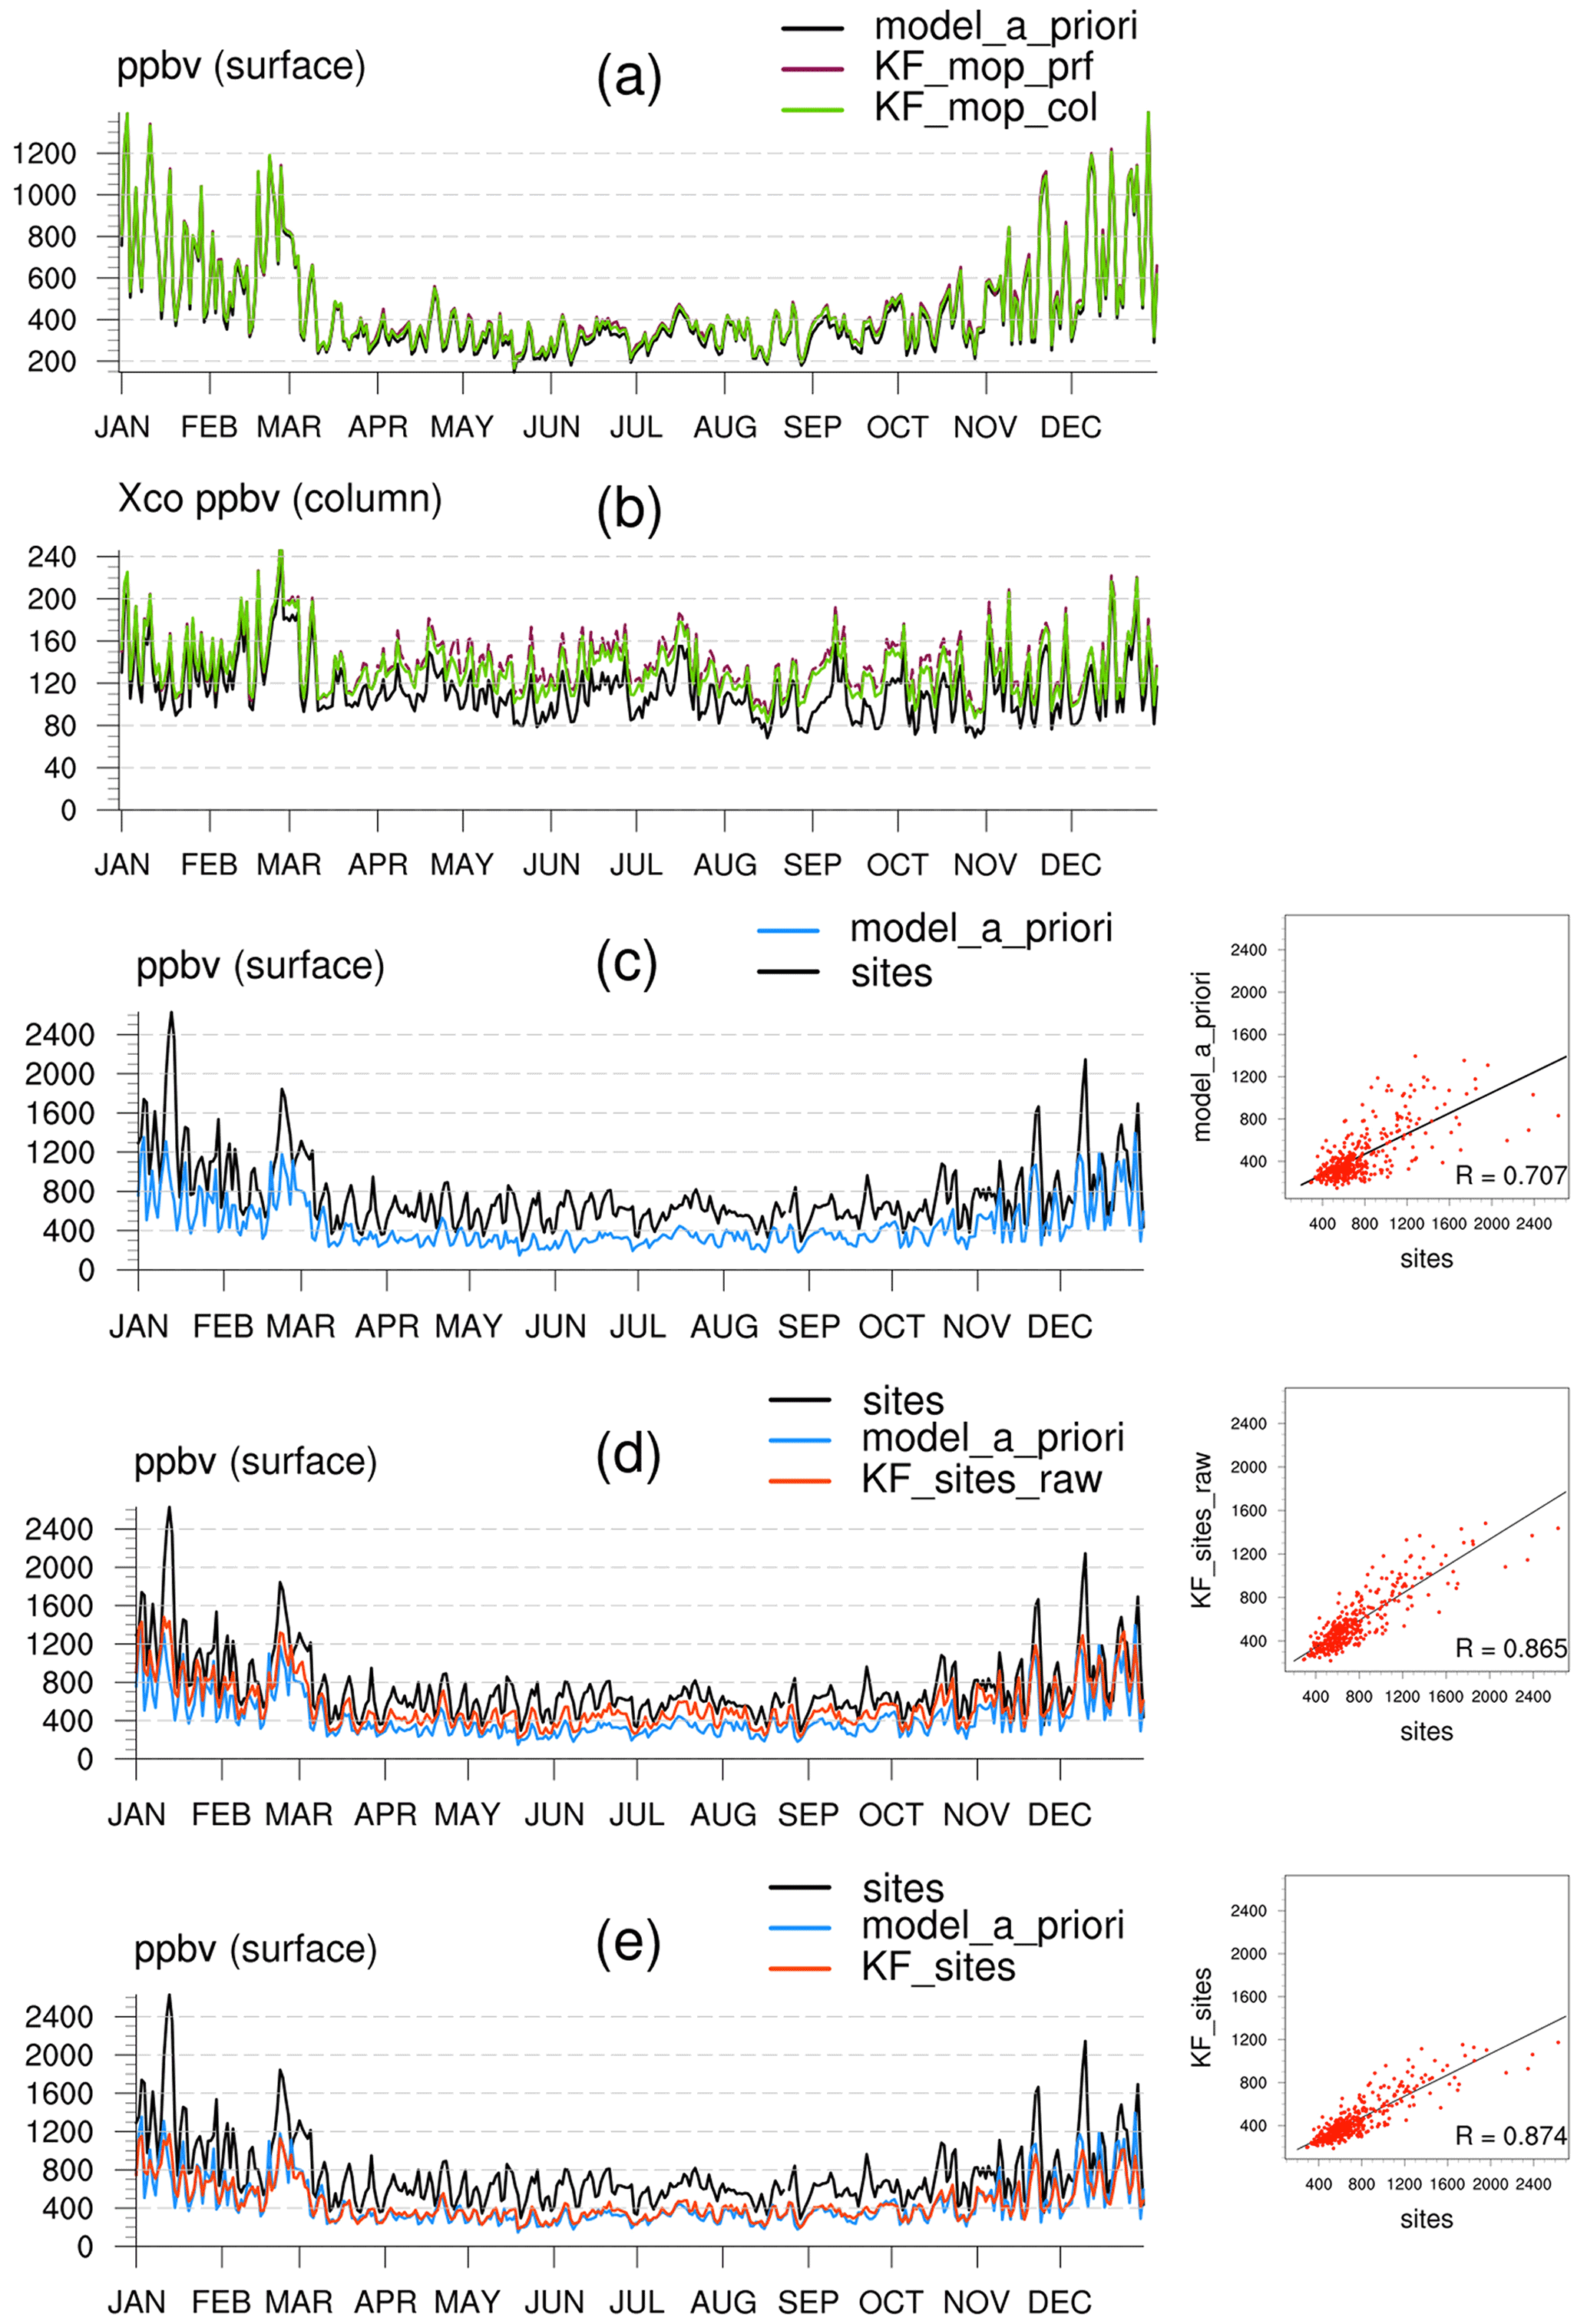
Figure 2(a) Surface CO concentrations over NCP in 2019 from a priori simulation and Kalman filter by assimilating MOPITT CO; (b) same as panel (a), but for CO columns; (c) surface CO concentrations from a priori simulation and MEE observations; (d) surface CO concentrations from a priori simulation, MEE observations and Kalman filter by assimilating MEE CO; (e) surface CO concentrations from a priori simulation, MEE observations and Kalman filter by assimilating normalized MEE CO.
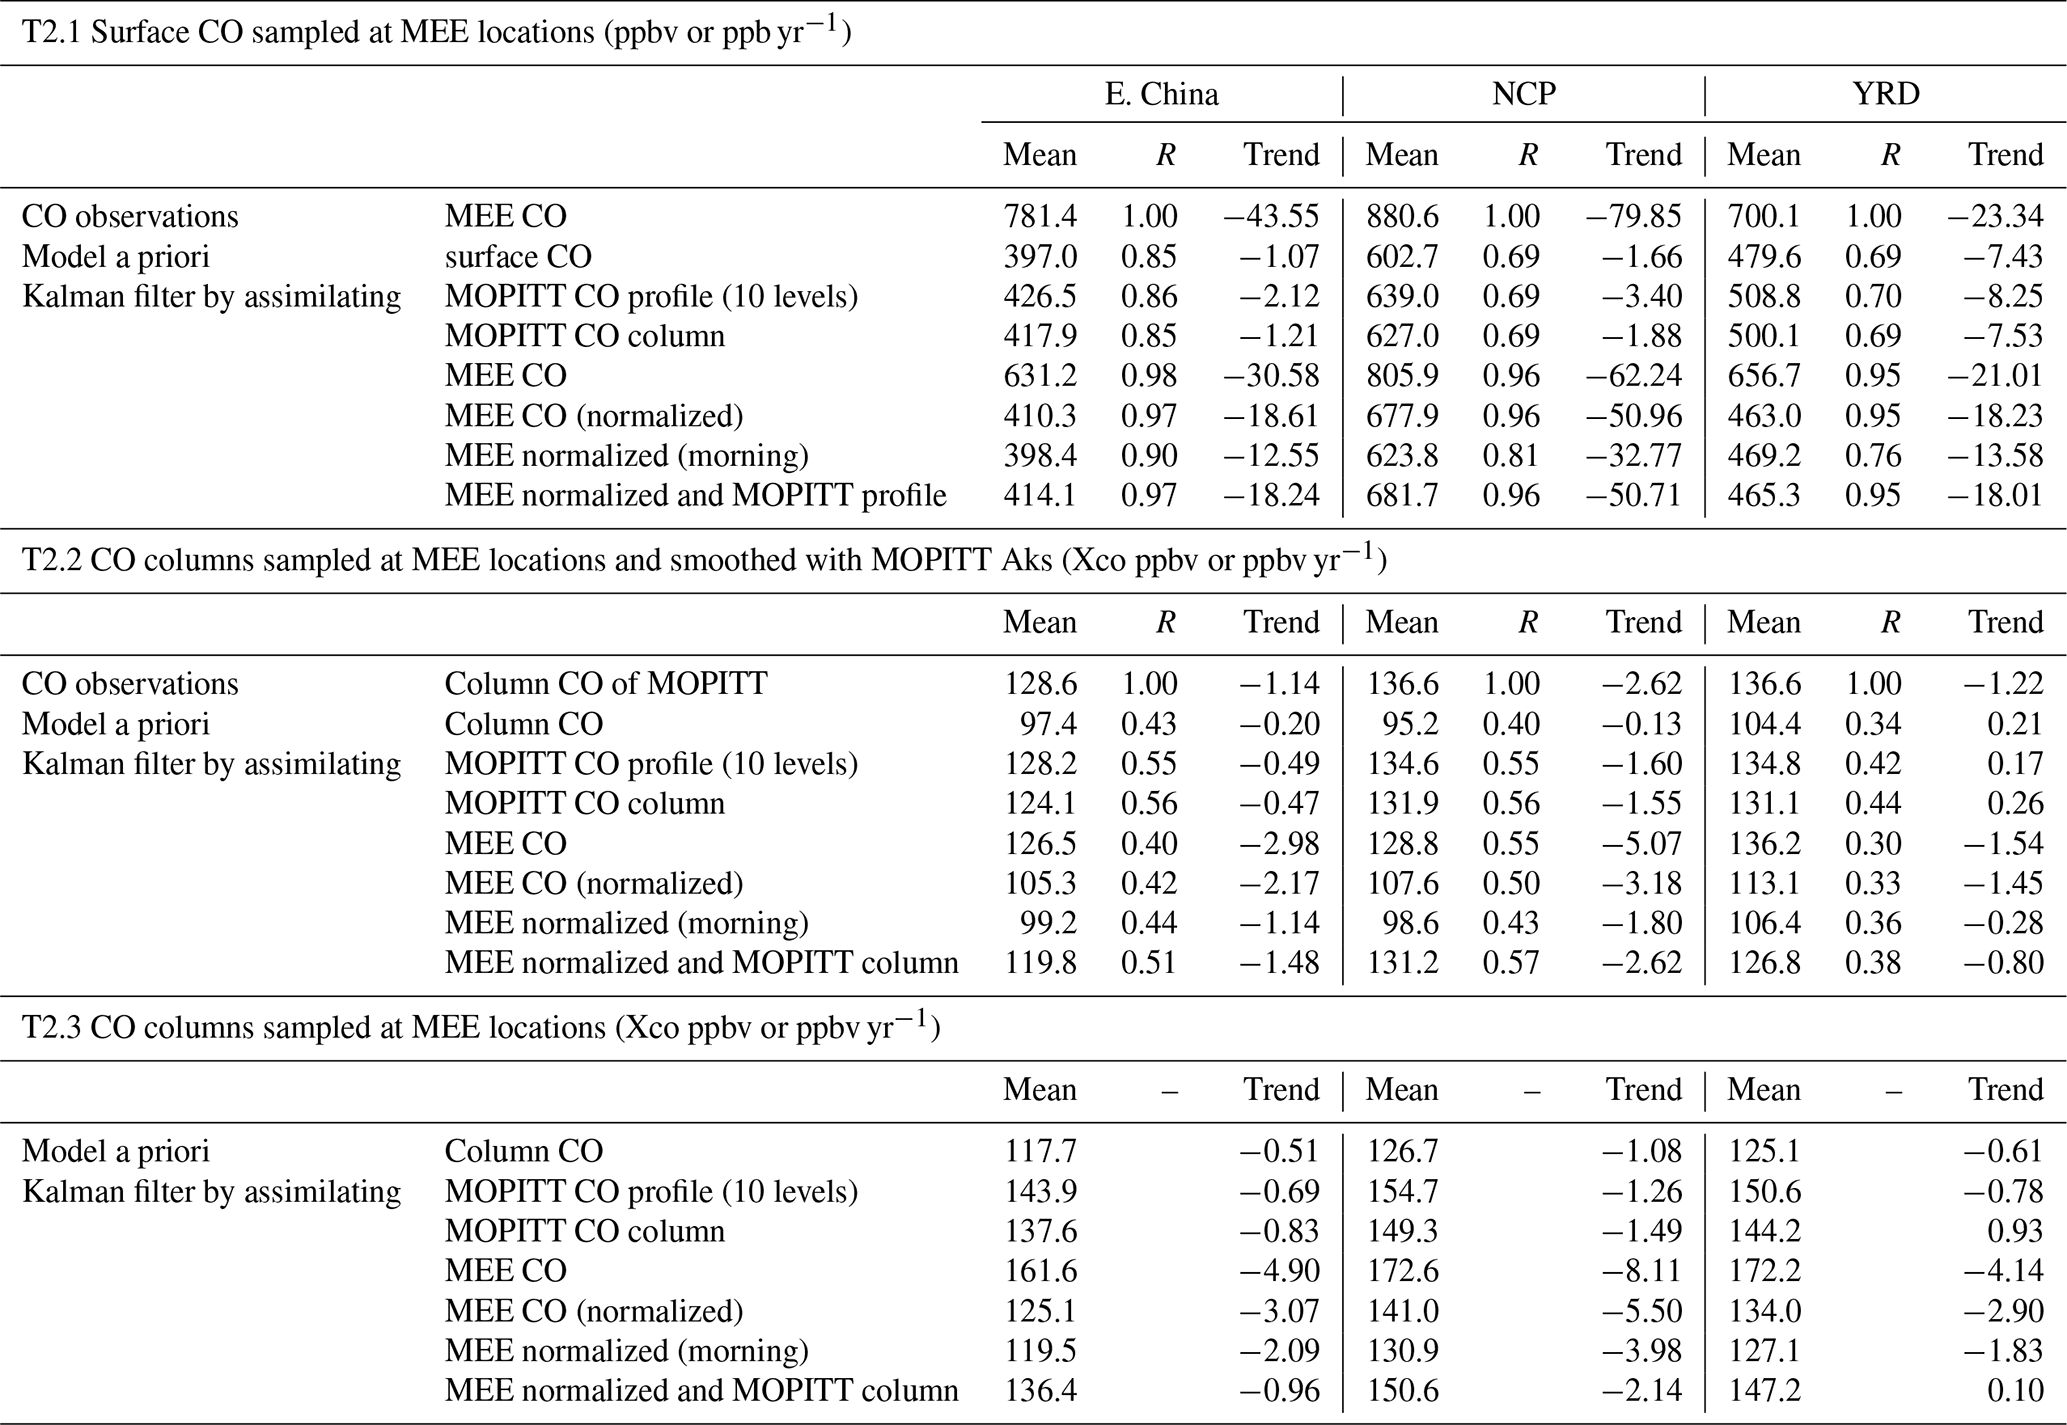
Table 1Averages and trends of surface (T 1.1) and column (T 1.2) CO concentrations in 2015–2020. The domain definitions are shown in Fig. 1a. The East Asian CO boundary conditions are provided by global a priori simulations, except Kalman filters, by assimilating MOPITT CO, while the boundary conditions are provided by global assimilations of MOPITT CO. The “MEE normalized and MOPITT column” is performed simultaneously by assimilating both MOPITT CO and normalized surface CO measurements.
In contrast to CO at the surface level, the Kalman filter led to marked enhancement of CO columns (Fig. 2b). As shown in Table 1, the modeled CO columns (Xco) over East China in 2015–2020 were adjusted from about 101 to 121–127 ppb. The difference in the Kalman filter by assimilating MOPITT column and profile data is small. Similarly, Fig. 3 exhibits the CO vertical profiles from model a priori simulations and Kalman filter. Assimilations of different MOPITT CO data (blue lines) led to similar enhancement of CO abundances, except at high altitudes around 100 hPa. Furthermore, Fig. 4 demonstrates the relative differences between modeled and MOPITT CO columns in 2019. There are pronounced negative biases in the a priori simulations by about 40 % (Fig. 4a). By contrast, the differences are dramatically mitigated by assimilating MOPITT CO column data (Fig. 4b). As shown in Table 2, the modeled CO columns (smoothed with MOPITT averaging kernels and sampled at MEE locations) increased from 97 to 124–128 ppb over East China in 2015–2020. The good agreement between assimilations and MOPITT CO observations (129 ppb, Table 2) confirms the efficiency of Kalman filter assimilation in this work.
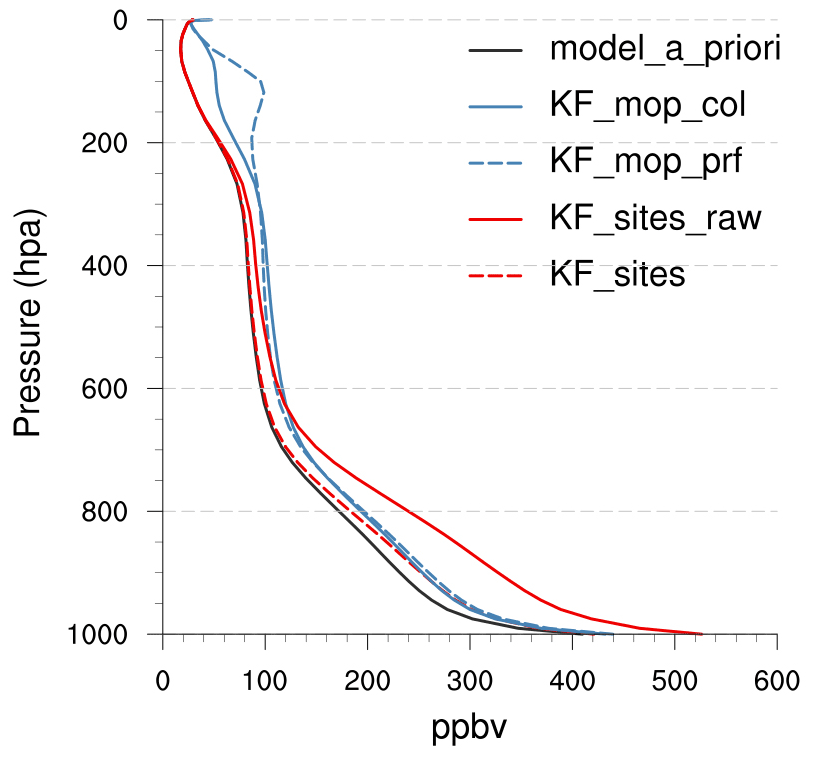
Figure 3CO profiles over NCP in 2019 from a priori simulations (black line), Kalman filter by assimilating MOPITT CO (column: blue solid line; profile: blue dashed line) and MEE CO (raw data: red solid line; normalized data: red dashed line).
Table 2Averages, correlations and trends of surface (T 2.1) and column (T 2.2 and T 2.3) CO concentrations in 2015–2020, sampled at the locations of MEE stations. The domain definitions are shown in Fig. 1a. The correlations between simulations and MOPITT observations in T 2.3 are not shown because MOPITT averaging kernels are not applied.
3.2 Kalman filter assimilating surface CO
Figure 2c (black line) shows MEE surface CO observations over NCP in 2019. The blue line shows the model a priori surface CO concentrations, which are lower than observed CO concentrations. The underestimated surface CO concentrations have been reported in recent studies; for example, Peng et al. (2018) found that modeled surface CO concentrations by WRF-Chem (752 µg m−3) are about 40 % lower than MEE surface CO (1318 µg m−3) in NCP in October 2014. Bouarar et al. (2019) indicated an underestimation of surface CO concentrations in WRF-Chem (about 1000 ppb) than surface observations (about 2000 ppb) in Beijing in January 2010. Feng et al. (2020) demonstrated high MEE surface CO in December 2013, i.e., 2.18 and 1.66 mg m−3 in contrast to 0.86 and 0.73 mg m−3 in WRF/CMAQ simulations over NCP and East China, respectively.
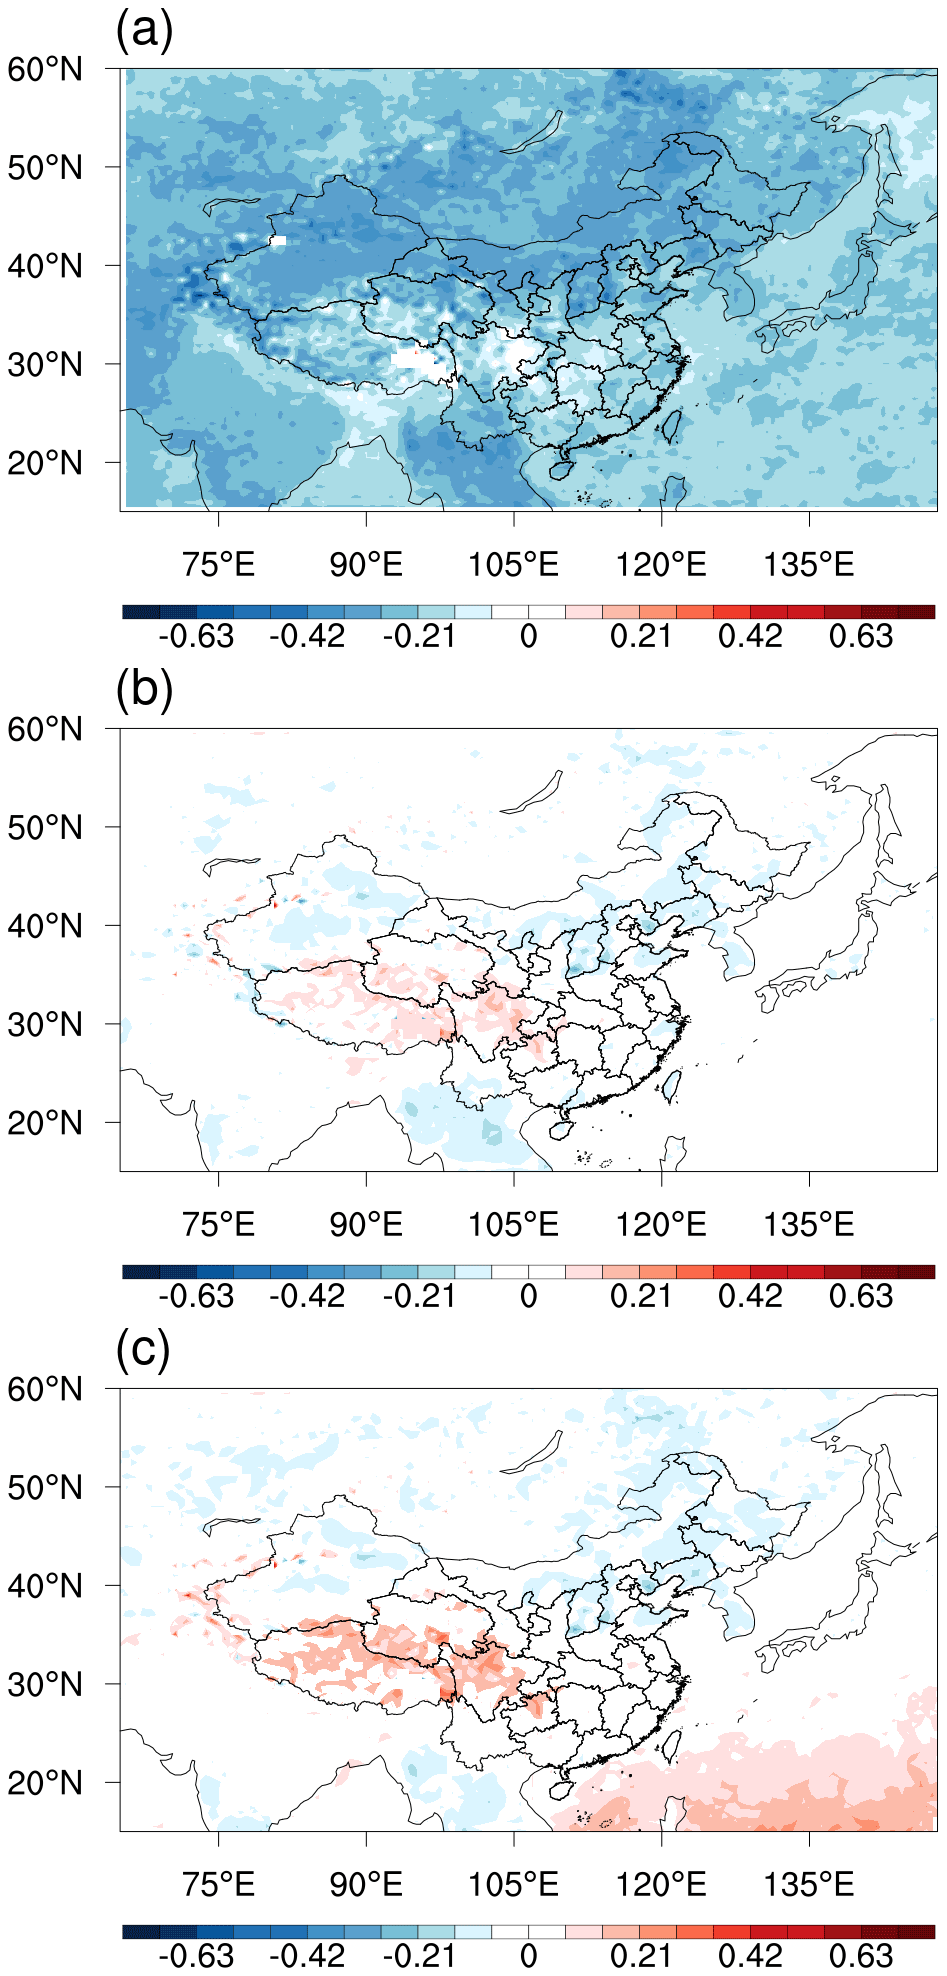
Figure 4(a) Relative difference between a priori simulation and MOPITT in 2019, calculated by (Model - MOPITT)/MOPITT; (b) same as panel (a), but with Kalman filter by assimilating MOPITT CO column data; (c) same as panel (a), but with Kalman filter by assimilating MOPITT CO profile data.
We then assimilate MEE surface CO measurements to investigate the impacts of assimilations on atmospheric CO. In contrast to Kalman filter by assimilating MOPITT data, the CO boundary conditions here are from a priori simulations. Figure 2d (orange line) shows the optimized surface CO concentrations in NCP in 2019. The assimilation of surface CO measurements significantly improved the agreement between observations and model simulations. As shown in Table 1, the modeled surface CO concentrations in 2015–2020 increased from 268 to 430 ppb over East China, 445 to 630 ppb over NCP and 418 to 598 ppb over YRD. The correlations between modeled and observed surface CO are enhanced from 0.707 to 0.865 over NCP in 2019. The enhancement of surface CO concentrations due to assimilating surface CO measurements has been reported in recent studies. For example, Peng et al. (2018) demonstrated enhancement of surface CO from 752 to 1418 µg m−3 in NCP in October 2014. Feng et al. (2020) exhibited enhancement of surface CO from 0.73 to 1.62 mg m−3 in December 2013 over East China. Furthermore, as shown in Table 2, the assimilation led to an increase in surface CO concentrations from 397 to 631 ppb over East China in 2015–2020, exhibiting better agreement with MEE observations (781 ppb).
3.3 Discrepancy in assimilated CO by assimilating satellite and surface data
As shown in Fig. 3, the modeled CO profile by assimilating MEE surface CO (red solid line) is higher than MOPITT-based CO concentrations (blue lines) in the lower troposphere. It indicates a possible discrepancy in the adjusted CO concentrations by assimilating satellite and surface observations. As shown in Table 2, the adjusted surface CO concentrations by assimilating MEE CO measurements are higher than those by assimilating MOPITT data in 2015–2020: 631 and 417–427 ppb over East China; 806 and 627–639 ppb over NCP; 657 and 500–509 ppb over YRD. Similarly, the adjusted CO columns (Xco) by assimilating MEE CO measurements are higher than those by assimilating MOPITT data in 2015–2020 (Table 2): 162 and 138–144 ppb over East China; 173 and 149–155 ppb over NCP; 172 and 144–151 ppb over YRD. However, the adjusted CO columns by assimilating MEE CO measurements are comparable with those by assimilating MOPITT data after the application of MOPITT averaging kernels (Table 2), which could be associated with the weaker sensitivity of MOPITT to lower free tropospheric CO.
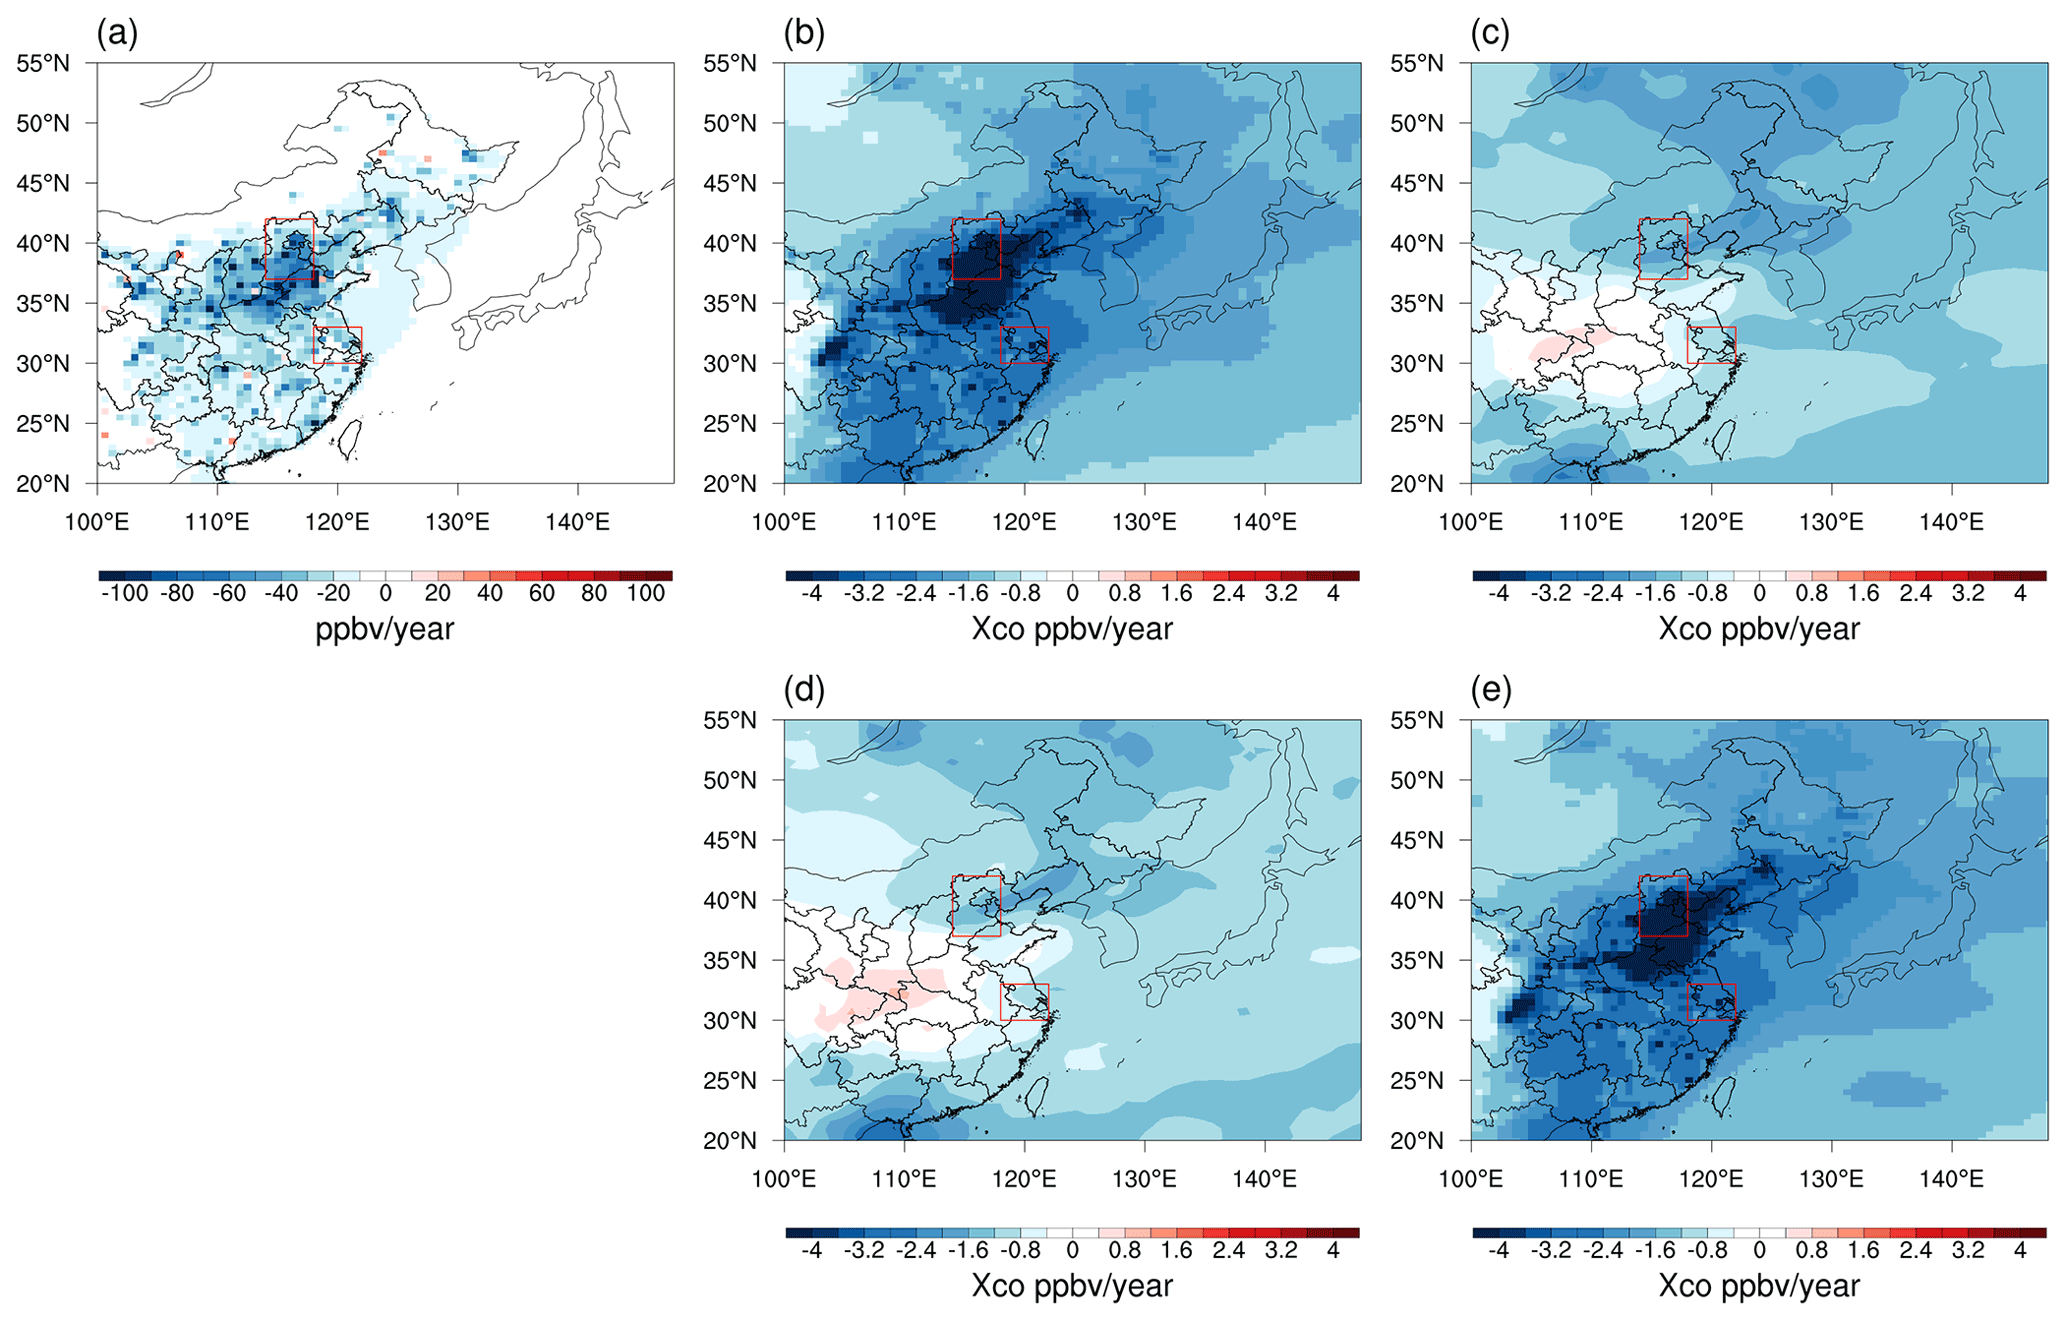
Figure 5Trends of surface CO concentrations in 2015–2020 by assimilating (a) raw MEE CO and trends of CO columns in 2015–2020 by assimilating (b) normalized MEE CO, (c) MOPITT CO column data, (d) MOPITT CO profile data and (e) normalized MEE CO + MOPITT CO column data.
MOPITT CO retrievals have been sufficiently evaluated. For example, Deeter et al. (2017) indicated that the bias in MOPITT CO column data was about 3 % in respect to NOAA flask measurements. The higher CO columns by assimilating MEE CO measurements thus indicate possible overestimated enhancements on free tropospheric CO. Similarly, Feng et al. (2020) suggest a 186 % enhancement of CO emissions over East China via assimilating surface CO measurements. By contrast, the MOPITT-based CO emission estimates are comparable with a priori emissions in China (Elguindi et al., 2020). In addition, as shown in Fig. 4a, the modeled CO columns from the boundary conditions are biased low by about 40 %, which was not removed when assimilating MEE surface CO. While the influence from boundary conditions on surface CO concentrations over East China could be limited, it is expected to have a noticeable influence on free tropospheric CO over East China. It further confirms the overestimated enhancements on free tropospheric CO by assimilating MEE CO measurements, because potential negative biases due to the usage of a priori boundary conditions have been completely covered.
Figures 1c and 1d exhibit the model a priori simulation and observed surface CO, as well as the ratios between observed and model a priori surface CO in 2019. The ratios are about 1.5 over high polluted areas such as NCP and 2–6 over low polluted areas (Fig. 1d). Because most MEE stations are urban air quality sites, the regional discrepancy in the ratios reveals possible influences from representation error; i.e., the regional CO backgrounds are lower than observations from urban stations, and the influences are stronger over low polluted areas. Despite representation errors having been considered in the covariance matrix in the Kalman filter (Sect. 2.4), it seems that the mitigation of representation errors is limited. This is not surprising, because the covariance matrix is supposed to contain random errors with Gaussian distribution, whereas representation errors due to differences between urban and regional backgrounds are systematic biases. In addition, insufficient parameterized processes such as PBL mixing can further contribute to the underestimation of modeled surface CO concentrations (Castellanos et al., 2011).
3.4 Kalman filter assimilating normalized surface CO
The possible systematic biases imply it may not be a good idea to assimilate surface CO measurements to optimize free tropospheric CO directly. Alternatively, considering the high capability of models to capture the observed CO variabilities, we can scale surface CO measurements using the ratios between observations and models. In the following discussion, the MEE surface CO measurements will be scaled using the ratios shown in Fig. 1d. The actual effect of this adjustment is normalizing modeled and observed surface CO concentrations in 2019; hence Kalman filter, by assimilating the normalized surface CO measurements, can reflect the variabilities (i.e., trends) instead of magnitudes of CO concentrations. It should be noted that the ratios are expected to be affected by interannual variabilities of meteorological conditions as well as possible land usage changes. The land usage changes are supposed to be insignificant due to the limited studied period (i.e., 2015–2020). More efforts are needed in the future to evaluate the possible influence of meteorological condition changes on the inconsistency between observations and simulations.
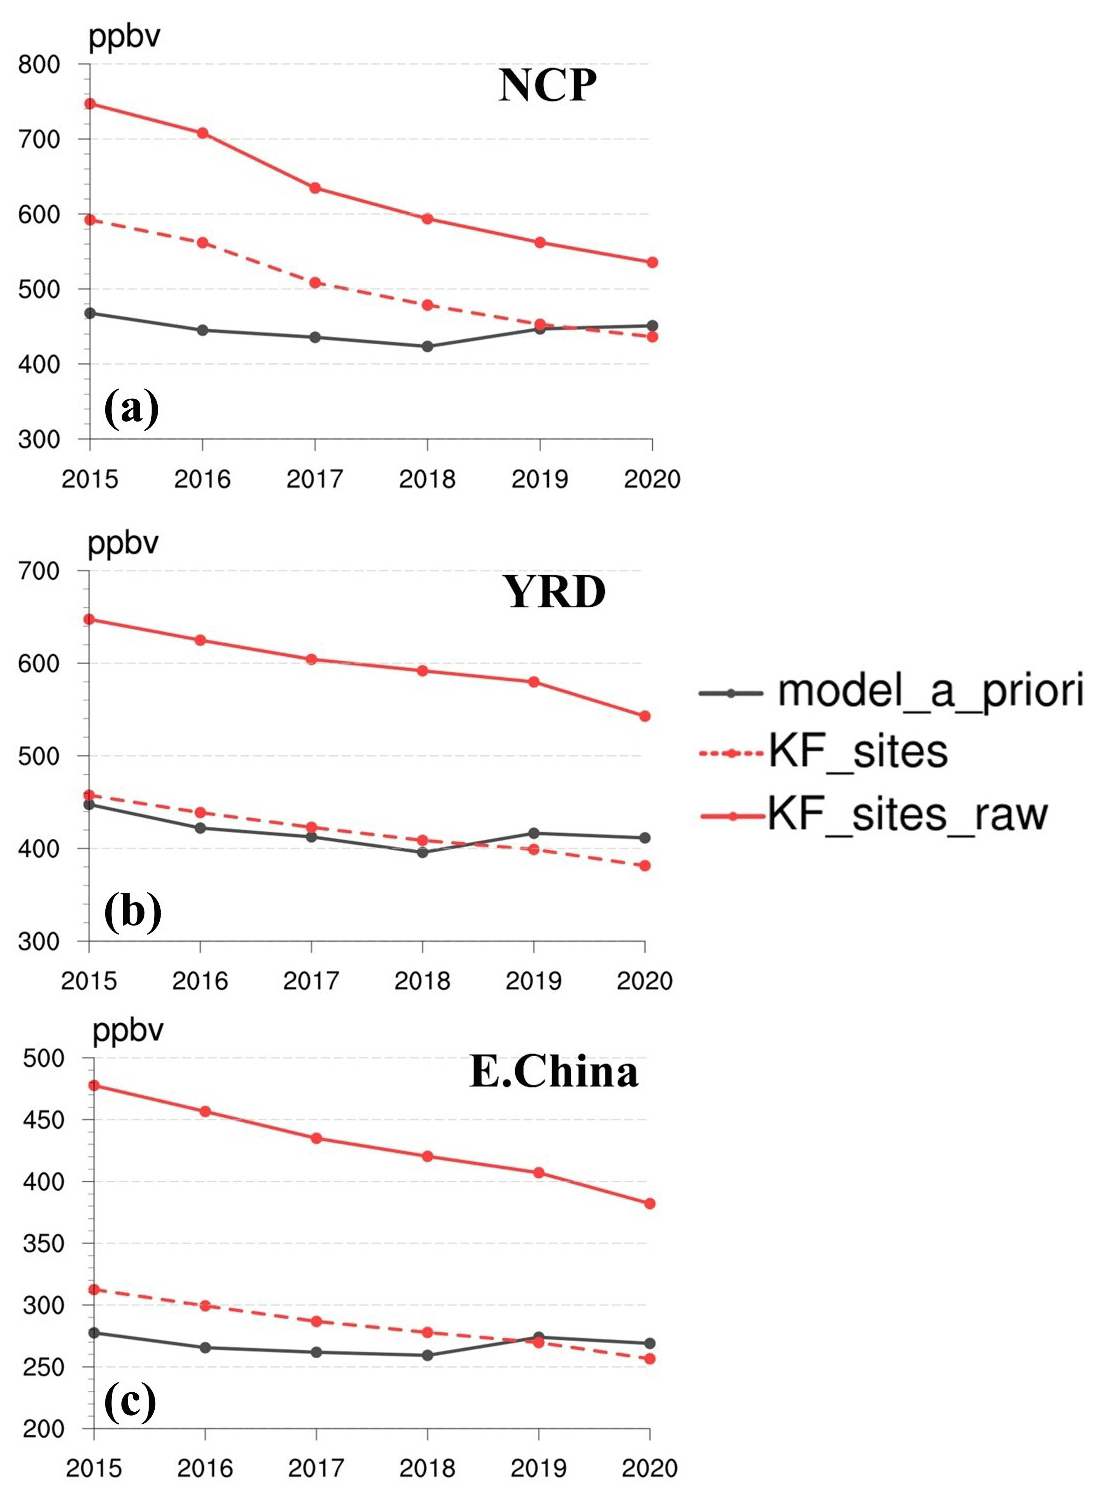
Figure 6Surface CO concentrations in 2015–2020 from a priori simulations (black line), Kalman filter, by assimilating raw (red solid line) and normalized (red dashed line) MEE CO.
Figure 2e (orange line) shows surface CO concentrations in NCP in 2019 by assimilating normalized surface CO measurements. The magnitudes of model a priori (blue line) and Kalman filter (orange line) are consistent in Fig. 2e due to the normalization of surface CO measurements. As shown in Table 1, the adjusted surface and column CO concentrations by assimilating normalized MEE CO measurements are closer to the a priori simulations in 2015–2020. The correlation between modeled and observed surface CO is 0.874 over NCP in 2019, which is comparable with the correlation by assimilating raw surface CO measurements. Furthermore, we performed sensitivity assimilation to evaluate the effects of MOPITT pass time by assimilating MEE CO measurements only in the morning. As shown in Table 1, the assimilation of morning data led to lower surface and column CO concentrations, and thus, the discrepancy in the CO columns (Sect. 3.3) is not driven by different temporal resolutions between satellite and surface CO observations.
3.5 Assimilated atmospheric CO over East Asia in 2015–2020
Here we expand our analysis to investigate the assimilated atmospheric CO over East Asia in 2015–2020. As shown in Fig. 5a, Kalman filter, by assimilating raw surface CO measurements, reveals wide declines in surface CO concentrations over East China. The declines of surface CO resulted in decreases of CO columns (Fig. 5b, via assimilating normalized surface CO measurements) by about 2.2, 2.1 and 1.8 ppb yr−1 in 2015–2020 over East China, South Korea, and Japan, respectively. By contrast, the decreasing trends in the MOPITT-based assimilations (Fig. 5c–d) are weaker: 0.63–0.86, 0.97–1.29 and 1.00–1.27 ppb yr−1 in 2015–2020 over East China, South Korea, and Japan, respectively. It should be noted that the decreasing trends in the MOPITT-based assimilations are more affected by the a priori simulations and are thus, weaker than those of MOPITT observations, as exhibited by the neutral changes over central China in Fig. 5c–d. In addition, Fig. 5e demonstrates the trends of CO columns by assimilating both MOPITT CO column and normalized surface CO measurements simultaneously; the decreasing trends are about 2.3, 2.2 and 1.9 ppb yr−1 over East China, South Korea, and Japan, respectively.

Figure 7CO columns (Xco) in 2015–2020 from a priori simulations (black line), Kalman filter, by assimilating MOPITT CO columns (blue line), MEE CO (raw data: red solid line; normalized data: red dashed line) and MOPITT CO column + normalized MEE CO (purple line).
As shown in Fig. 6, the a priori simulations with fixed anthropogenic CO emissions in 2010 (black lines) predict stable surface CO concentrations in 2015–2020. By contrast, Kalman filter, by assimilating raw surface CO measurements (red solid lines), demonstrates declines in surface CO concentrations by about 43.9, 19.2, and 18.3 ppb yr−1 over NCP, YRD, and East China, respectively. The difference between the a priori simulations (black lines) and assimilations (red solid lines) indicates the impacts of successful CO emission controls in China. In addition, Kalman filter, by assimilating normalized surface CO measurements (red dashed lines), indicates declines of surface CO concentrations by about 32.1, 14.4, and 10.3 ppb yr−1 over NCP, YRD, and East China, respectively.
Finally, we analyze the interannual variabilities of CO columns by assimilating MOPITT and surface CO measurements. As shown in Fig. 7, Kalman filter, by assimilating normalized surface CO measurements (red dashed lines), demonstrates declines of CO columns by about 4.4, 2.8 and 2.2 ppb yr−1 in 2015–2020 over NCP, YRD, and East China, respectively. Kalman filter, by assimilating raw surface CO measurements (red solid lines), leads to overestimated CO columns. Kalman filter, by assimilating MOPITT observations (blue lines), exhibits smaller changes in CO columns: 1.2–1.5, 0.76–0.9 and 0.63–0.86 ppb yr−1 in 2015–2020 over NCP, YRD, and East China, respectively. Kalman filter, by assimilating both MOPITT CO column and normalized surface CO measurements simultaneously (purple lines), exhibits decreasing trends of CO columns by about 4.5, 2.8, and 2.3 ppb yr−1 in 2015–2020 over NCP, YRD, and East China, respectively.
A comparative analysis is provided in this work to explore the effects of satellite and surface measurements on atmospheric CO assimilations over East Asia in 2015–2020. We find possible inconsistencies by assimilating satellite and surface CO measurements: the adjusted CO columns (Xco) are about 161, 173, and 172 ppb by assimilating surface CO measurements, in contrast to 138–144, 149–155, and 144–151 ppb by assimilating MOPITT CO observations in 2015–2020 over East China, NCP, and YRD, respectively. This difference is larger than the reported uncertainties in MOPITT CO columns (Deeter et al., 2017) and similar to the reported discrepancy in the derived CO emissions based on MOPITT and surface CO measurements (Elguindi et al., 2020; Feng et al., 2020). In addition, we find large regional discrepancies in the ratios between observed and model a priori surface CO: about 1.5 over high polluted areas such as NCP, and 2–6 over low polluted areas (Fig. 1d). These inconsistencies could be associated with possible representation errors due to differences between urban and regional CO backgrounds, which cannot be effectively contained via adjusting the covariance matrix in the assimilations.
Assimilations of raw surface CO measurements indicate declines in surface CO concentrations by about 43.9, 19.2, and 18.3 ppb yr−1 over NCP, YRD, and East China in 2015–2020. Assimilations of normalized surface CO measurements further indicate declines of CO columns (Xco) by about 2.2, 2.1, and 1.8 ppb yr−1 over East China, South Korea, and Japan in 2015–2020, respectively. This demonstrates the important impacts of CO emission controls in China on East Asian atmospheric CO changes. By contrast, assimilations of MOPITT CO measurements suggest small trends in CO columns: 0.63–0.86, 0.97–1.29, and 1.00–1.27 ppb yr−1 over East China, South Korea, and Japan in 2015–2020, respectively. These discrepancies reflect the different vertical sensitivities of satellite and surface observations to CO concentrations in the lower and free troposphere. While the normalized CO measurements in this work are supposed to provide a better representation of atmospheric CO in the free troposphere, Kalman filter, by assimilating raw CO measurements, is closer to real urban CO concentrations at the surface level. More efforts to analyze the effects of meteorological variabilities on observed and modeled surface CO concentrations are helpful for better assimilation of surface CO observations, and more accurate evaluation of atmospheric CO changes.
The MEE CO data can be downloaded from https://quotsoft.net/air/ (Wang, 2014). The MOPITT CO data can be downloaded from https://asdc.larc.nasa.gov/data/MOPITT/ (NASA Earth Data, 2022). The GEOS-Chem model (version 12.8.1) can be downloaded from http://wiki.seas.harvard.edu/geos-chem/index.php/GEOS-Chem_12#12.8.1 (GEOS-Chem v12.8.1, 2022).
ZJ designed the research. ZT and JC performed the research. ZJ and ZT wrote the manuscript. All authors contributed to discussions and editing the manuscript.
The contact author has declared that neither they nor their co-authors have any competing interests.
Publisher's note: Copernicus Publications remains neutral with regard to jurisdictional claims in published maps and institutional affiliations.
We thank the providers of the MOPITT CO data, and we thank the Ministry of Ecology and Environment of China (MEE) for providing the surface CO measurements. The numerical calculations in this paper were done on the supercomputing system in the Supercomputing Center of the University of Science and Technology of China.
This research has been supported by the Hundred Talents Program of the Chinese Academy of Sciences and the National Natural Science Foundation of China (grant no. 41721002).
This paper was edited by Timothy Bertram and reviewed by two anonymous referees.
Bouarar, I., Brasseur, G., Petersen, K., Granier, C., Fan, Q., Wang, X., Wang, L., Ji, D., Liu, Z., Xie, Y., Gao, W., and Elguindi, N.: Influence of anthropogenic emission inventories on simulations of air quality in China during winter and summer 2010, Atmos. Environ., 198, 236–256, https://doi.org/10.1016/j.atmosenv.2018.10.043, 2019.
Buchholz, R. R., Deeter, M. N., Worden, H. M., Gille, J., Edwards, D. P., Hannigan, J. W., Jones, N. B., Paton-Walsh, C., Griffith, D. W. T., Smale, D., Robinson, J., Strong, K., Conway, S., Sussmann, R., Hase, F., Blumenstock, T., Mahieu, E., and Langerock, B.: Validation of MOPITT carbon monoxide using ground-based Fourier transform infrared spectrometer data from NDACC, Atmos. Meas. Tech., 10, 1927–1956, https://doi.org/10.5194/amt-10-1927-2017, 2017.
Castellanos, P., Marufu, L. T., Doddridge, B. G., Taubman, B. F., Schwab, J. J., Hains, J. C., Ehrman, S. H., and Dickerson, R. R.: Ozone, oxides of nitrogen, and carbon monoxide during pollution events over the eastern United States: An evaluation of emissions and vertical mixing, J. Geophys. Res., 116, D16307, https://doi.org/10.1029/2010jd014540, 2011.
Chen, Y., Ma, Q., Lin, W., Xu, X., Yao, J., and Gao, W.: Measurement report: Long-term variations in carbon monoxide at a background station in China's Yangtze River Delta region, Atmos. Chem. Phys., 20, 15969–15982, https://doi.org/10.5194/acp-20-15969-2020, 2020.
Darmenov, A. S. and da Silva, A.: The Quick Fire Emissions Dataset (QFED): Documentation of versions 2.1, 2.2 and 2.4, NASA Technical Report Series on Global Modeling and Data Assimilation NASA TM-2015-104606, Volume 38, http://gmao.gsfc.nasa.gov/pubs/docs/Darmenov796.pdf (last access: 14 June 2022), 2015.
Deeter, M. N., Edwards, D. P., Francis, G. L., Gille, J. C., Martínez-Alonso, S., Worden, H. M., and Sweeney, C.: A climate-scale satellite record for carbon monoxide: the MOPITT Version 7 product, Atmos. Meas. Tech., 10, 2533–2555, https://doi.org/10.5194/amt-10-2533-2017, 2017.
Elbern, H., Strunk, A., Schmidt, H., and Talagrand, O.: Emission rate and chemical state estimation by 4-dimensional variational inversion, Atmos. Chem. Phys., 7, 3749–3769, https://doi.org/10.5194/acp-7-3749-2007, 2007.
Elguindi, N., Granier, C., Stavrakou, T., Darras, S., Bauwens, M., Cao, H., Chen, C., Denier van der Gon, H. A. C., Dubovik, O., Fu, T. M., Henze, D. K., Jiang, Z., Keita, S., Kuenen, J. J. P., Kurokawa, J., Liousse, C., Miyazaki, K., Müller, J. F., Qu, Z., Solmon, F., and Zheng, B.: Intercomparison of Magnitudes and Trends in Anthropogenic Surface Emissions From Bottom-Up Inventories, Top-Down Estimates, and Emission Scenarios, Earth's Future, 8, e2020EF001520, https://doi.org/10.1029/2020ef001520, 2020.
Feng, S., Jiang, F., Wu, Z., Wang, H., Ju, W., and Wang, H.: CO Emissions Inferred From Surface CO Observations Over China in December 2013 and 2017, J. Geophys. Res.-Atmos., 125, e2019JD031808, https://doi.org/10.1029/2019jd031808, 2020.
Fisher, J. A., Murray, L. T., Jones, D. B. A., and Deutscher, N. M.: Improved method for linear carbon monoxide simulation and source attribution in atmospheric chemistry models illustrated using GEOS-Chem v9, Geosci. Model Dev., 10, 4129–4144, https://doi.org/10.5194/gmd-10-4129-2017, 2017.
Gaubert, B., Emmons, L. K., Raeder, K., Tilmes, S., Miyazaki, K., Arellano Jr., A. F., Elguindi, N., Granier, C., Tang, W., Barré, J., Worden, H. M., Buchholz, R. R., Edwards, D. P., Franke, P., Anderson, J. L., Saunois, M., Schroeder, J., Woo, J.-H., Simpson, I. J., Blake, D. R., Meinardi, S., Wennberg, P. O., Crounse, J., Teng, A., Kim, M., Dickerson, R. R., He, H., Ren, X., Pusede, S. E., and Diskin, G. S.: Correcting model biases of CO in East Asia: impact on oxidant distributions during KORUS-AQ, Atmos. Chem. Phys., 20, 14617–14647, https://doi.org/10.5194/acp-20-14617-2020, 2020.
GEOS-Chem v12.8.1: http://wiki.seas.harvard.edu/geos-chem/index.php/GEOS-Chem_12#12.8.1, last access: 14 June 2022.
Guenther, A., Karl, T., Harley, P., Wiedinmyer, C., Palmer, P. I., and Geron, C.: Estimates of global terrestrial isoprene emissions using MEGAN (Model of Emissions of Gases and Aerosols from Nature), Atmos. Chem. Phys., 6, 3181–3210, https://doi.org/10.5194/acp-6-3181-2006, 2006.
Han, H., Liu, J., Yuan, H., Jiang, F., Zhu, Y., Wu, Y., Wang, T., and Zhuang, B.: Impacts of Synoptic Weather Patterns and their Persistency on Free Tropospheric Carbon Monoxide Concentrations and Outflow in Eastern China, J. Geophys. Res.-Atmos., 123, 7024–7046, https://doi.org/10.1029/2017jd028172, 2018.
Han, W., He, T.-L., Tang, Z., Wang, M., Jones, D., and Jiang, Z.: A comparative analysis for a deep learning model (hyDL-CO v1.0) and Kalman filter to predict CO concentrations in China, Geosci. Model Dev., 15, 4225–4237, https://doi.org/10.5194/gmd-15-4225-2022, 2022.
Hedelius, J. K., Toon, G. C., Buchholz, R. R., Iraci, L. T., Podolske, J. R., Roehl, C. M., Wennberg, P. O., Worden, H. M., and Wunch, D.: Regional and Urban Column CO Trends and Anomalies as Observed by MOPITT Over 16 Years, J. Geophys. Res.-Atmos., 126, e2020JD033967, https://doi.org/10.1029/2020jd033967, 2021.
Hoesly, R. M., Smith, S. J., Feng, L., Klimont, Z., Janssens-Maenhout, G., Pitkanen, T., Seibert, J. J., Vu, L., Andres, R. J., Bolt, R. M., Bond, T. C., Dawidowski, L., Kholod, N., Kurokawa, J.-I., Li, M., Liu, L., Lu, Z., Moura, M. C. P., O'Rourke, P. R., and Zhang, Q.: Historical (1750–2014) anthropogenic emissions of reactive gases and aerosols from the Community Emissions Data System (CEDS), Geosci. Model Dev., 11, 369–408, https://doi.org/10.5194/gmd-11-369-2018, 2018.
Jiang, Z., Jones, D. B. A., Worden, H. M., Deeter, M. N., Henze, D. K., Worden, J., Bowman, K. W., Brenninkmeijer, C. A. M., and Schuck, T. J.: Impact of model errors in convective transport on CO source estimates inferred from MOPITT CO retrievals, J. Geophys. Res.-Atmos., 118, 2073–2083, https://doi.org/10.1002/jgrd.50216, 2013.
Jiang, Z., Jones, D. B. A., Worden, J., Worden, H. M., Henze, D. K., and Wang, Y. X.: Regional data assimilation of multi-spectral MOPITT observations of CO over North America, Atmos. Chem. Phys., 15, 6801–6814, https://doi.org/10.5194/acp-15-6801-2015, 2015.
Jiang, Z., Worden, J. R., Worden, H., Deeter, M., Jones, D. B. A., Arellano, A. F., and Henze, D. K.: A 15-year record of CO emissions constrained by MOPITT CO observations, Atmos. Chem. Phys., 17, 4565–4583, https://doi.org/10.5194/acp-17-4565-2017, 2017.
Kong, L., Tang, X., Zhu, J., Wang, Z., Fu, J. S., Wang, X., Itahashi, S., Yamaji, K., Nagashima, T., Lee, H.-J., Kim, C.-H., Lin, C.-Y., Chen, L., Zhang, M., Tao, Z., Li, J., Kajino, M., Liao, H., Wang, Z., Sudo, K., Wang, Y., Pan, Y., Tang, G., Li, M., Wu, Q., Ge, B., and Carmichael, G. R.: Evaluation and uncertainty investigation of the NO2, CO and NH3 modeling over China under the framework of MICS-Asia III, Atmos. Chem. Phys., 20, 181–202, https://doi.org/10.5194/acp-20-181-2020, 2020.
Li, M., Zhang, Q., Kurokawa, J.-I., Woo, J.-H., He, K., Lu, Z., Ohara, T., Song, Y., Streets, D. G., Carmichael, G. R., Cheng, Y., Hong, C., Huo, H., Jiang, X., Kang, S., Liu, F., Su, H., and Zheng, B.: MIX: a mosaic Asian anthropogenic emission inventory under the international collaboration framework of the MICS-Asia and HTAP, Atmos. Chem. Phys., 17, 935–963, https://doi.org/10.5194/acp-17-935-2017, 2017.
Ma, C., Wang, T., Mizzi, A. P., Anderson, J. L., Zhuang, B., Xie, M., and Wu, R.: Multiconstituent Data Assimilation With WRF-Chem/DART: Potential for Adjusting Anthropogenic Emissions and Improving Air Quality Forecasts Over Eastern China, J. Geophys. Res.-Atmos., 124, 7393–7412, https://doi.org/10.1029/2019jd030421, 2019.
Miyazaki, K., Eskes, H., Sudo, K., Boersma, K. F., Bowman, K., and Kanaya, Y.: Decadal changes in global surface NOx emissions from multi-constituent satellite data assimilation, Atmos. Chem. Phys., 17, 807–837, https://doi.org/10.5194/acp-17-807-2017, 2017.
Müller, J. F., Stavrakou, T., Bauwens, M., George, M., Hurtmans, D., Coheur, P. F., Clerbaux, C., and Sweeney, C.: Top-Down CO Emissions Based On IASI Observations and Hemispheric Constraints on OH Levels, Geophys. Res. Lett., 45, 1621–1629, https://doi.org/10.1002/2017gl076697, 2018.
NASA Earth Data: ASDC Direct Data Download, NASA Earth Data [data set], https://asdc.larc.nasa.gov/data/MOPITT/, last access: 14 June 2022.
Peng, Z., Lei, L., Liu, Z., Sun, J., Ding, A., Ban, J., Chen, D., Kou, X., and Chu, K.: The impact of multi-species surface chemical observation assimilation on air quality forecasts in China, Atmos. Chem. Phys., 18, 17387–17404, https://doi.org/10.5194/acp-18-17387-2018, 2018.
Schutgens, N., Tsyro, S., Gryspeerdt, E., Goto, D., Weigum, N., Schulz, M., and Stier, P.: On the spatio-temporal representativeness of observations, Atmos. Chem. Phys., 17, 9761–9780, https://doi.org/10.5194/acp-17-9761-2017, 2017.
Squires, F. A., Nemitz, E., Langford, B., Wild, O., Drysdale, W. S., Acton, W. J. F., Fu, P., Grimmond, C. S. B., Hamilton, J. F., Hewitt, C. N., Hollaway, M., Kotthaus, S., Lee, J., Metzger, S., Pingintha-Durden, N., Shaw, M., Vaughan, A. R., Wang, X., Wu, R., Zhang, Q., and Zhang, Y.: Measurements of traffic-dominated pollutant emissions in a Chinese megacity, Atmos. Chem. Phys., 20, 8737–8761, https://doi.org/10.5194/acp-20-8737-2020, 2020.
Tang, X., Zhu, J., Wang, Z. F., Wang, M., Gbaguidi, A., Li, J., Shao, M., Tang, G. Q., and Ji, D. S.: Inversion of CO emissions over Beijing and its surrounding areas with ensemble Kalman filter, Atmos. Environ., 81, 676–686, https://doi.org/10.1016/j.atmosenv.2013.08.051, 2013.
The Quick Fire Emissions Dataset (QFED): Documentation of versions 2.1, 2.2 and 2.4, NASA Technical Report Series on Global Modeling and Data Assimilation NASA TM-2015-104606, Vol. 38, 212 pp., http://gmao.gsfc.nasa.gov/pubs/docs/Darmenov796.pdf (last access: 14 June 2022), 2015.
Todling, R. and Cohn, S. E.: Suboptimal schemes for atmospheric data assimilation based on the Kalman filter, Month. Weather Rev., 122, 2530–2557, https://doi.org/10.1175/1520-0493(1994)122<2530:SSFADA>2.0.CO;2, 1994.
Wang, X. L.: Historical air quality data in China, Baidu Netdisk [data set], https://quotsoft.net/air/, last access: June 2014.
Worden, H. M., Deeter, M. N., Edwards, D. P., Gille, J. C., Drummond, J. R., and Nédélec, P.: Observations of near-surface carbon monoxide from space using MOPITT multispectral retrievals, J. Geophys. Res., 115, D18314, https://doi.org/10.1029/2010jd014242, 2010.
Zheng, B., Chevallier, F., Ciais, P., Yin, Y., Deeter, M. N., Worden, H. M., Wang, Y., Zhang, Q., and He, K.: Rapid decline in carbon monoxide emissions and export from East Asia between years 2005 and 2016, Environ. Res. Lett., 13, 044007, https://doi.org/10.1088/1748-9326/aab2b3, 2018a.
Zheng, B., Tong, D., Li, M., Liu, F., Hong, C., Geng, G., Li, H., Li, X., Peng, L., Qi, J., Yan, L., Zhang, Y., Zhao, H., Zheng, Y., He, K., and Zhang, Q.: Trends in China's anthropogenic emissions since 2010 as the consequence of clean air actions, Atmos. Chem. Phys., 18, 14095–14111, https://doi.org/10.5194/acp-18-14095-2018, 2018b.