the Creative Commons Attribution 4.0 License.
the Creative Commons Attribution 4.0 License.
 | 14 Jun 2022
Regional impacts of black carbon morphologies on shortwave aerosol–radiation interactions: a comparative study between the US and China
Zhengqiang Li
Chenchong Zhang
Yongming Zhang
Ying Zhang
Gabriele Curci
Rajan K. Chakrabarty
Black carbon (BC) is one of the dominant absorbing aerosol species in the atmosphere. It normally has complex fractal-like structures due to the aggregation process during combustion. A wide range of aerosol–radiation interactions (ARIs) of BC have been reported throughout experimental and modeling studies. One reason for the large discrepancies among multiple studies is the application of the oversimplified spherical morphology for BC in ARI estimates. In current climate models, the Mie theory is commonly used to calculate the optical properties of spherical BC aerosols. Here, we employ a regional chemical transport model coupled with a radiative transfer code that utilizes the non-spherical BC optical simulations to re-evaluate the effects of particles' morphologies on BC shortwave ARI, and the wavelength range of 0.3–4.0 µm was considered. Anthropogenic activities and wildfires are two major sources of BC emissions. Therefore, we choose the typical polluted area in eastern China, which is dominated by anthropogenic emissions, and the fire region in the northwest US, which is dominated by fire emissions in this study. A 1-month simulation in eastern China and a 7 d simulation in the fire region in the northwest US were performed. The fractal BC model generally presents a larger clear-sky ARI compared to the spherical BC model. Assuming BC particles are externally mixed with other aerosols, the relative differences in the time-averaged clear-sky ARI between the fractal model with a fractal dimension (Df) of 1.8 and the spherical model are 12.1 %–20.6 % and 10.5 %–14.9 % for typical polluted urban cities in China and fire sites in the northwest US, respectively. Furthermore, the regional-mean clear-sky ARI is also significantly affected by the BC morphology, and relative differences of 17.1 % and 38.7 % between the fractal model with a Df of 1.8 and the spherical model were observed in eastern China and the northwest US, respectively. However, the existence of clouds would weaken the BC morphological effects. The time-averaged all-sky ARI relative differences between the fractal model with a Df of 1.8 and the spherical model are 4.9 %–6.4 % and 9.0 %–11.3 % in typical urban polluted cities and typical fire sites, respectively. Besides, for the regional-mean all-sky ARI, the relative differences between the fractal model and the spherical model are less than 7.3 % and 16.8 % in the polluted urban area in China and the fire region in the US, respectively. The results imply that current climate modeling may significantly underestimate the BC ARI uncertainties as the morphological effects on BC ARI are ignored in most climate models.
- Article
(9718 KB) - Full-text XML
-
Supplement
(3936 KB) - BibTeX
- EndNote


Black carbon (BC), as the main absorbing aerosol in the atmosphere, exerts a positive radiative forcing and lofts smoke plumes (Buseck and Buseck, 2000; Streets et al., 2006; Moosmüller et al., 2009). However, there are still large uncertainties in evaluating the BC radiative effects. An important cause of the discrepancy is BC's complex morphology. BC aerosols are assumed to be spheres, and the optical properties are calculated using the Mie theory in most climate and atmospheric chemical transport models, such as the Community Earth System Model (CESM) (Danabasoglu et al., 2020), the Model for Interdisciplinary Research on Climate (MIROC-SPRINTARS) (Takemura et al., 2005, 2009), Weather Research and Forecasting coupled to Chemistry (WRF-Chem) (Grell et al., 2005; Fast et al., 2006), and GEOS-Chem. However, many studies have shown that BC particles, especially nascent ones, have fractal-like structures. The spherical assumption for BC can lead to a large deviation from the field measurement data and non-spherical simulated results (Chakrabarty et al., 2007; Luo et al., 2018c, 2021b; He et al., 2015; Liu and Mishchenko, 2005; Luo et al., 2018d; Mishchenko et al., 2016a). Based on the sampled BC images, researchers found that the shape of uncoated BC aggregates can be fitted well by a fractal law with monomer number (Ns), mean monomer radius (R), fractal prefactor (k0), fractal dimension (Df) and the radius of gyration (Rg) (Mishchenko et al., 2002; Sorensen, 2011; Luo et al., 2021a):
Previous studies have shown that aggregated particle models are more realistic to reproduce the optical measurement results (Kahnert, 2010a; Luo et al., 2019, 2018b). Some studies have used the fractal BC models to investigate the radiative properties of BC (Wu et al., 2015; C. Liu et al., 2015; Liu and Mishchenko, 2005; Yin and Liu, 2010; Teng et al., 2019; Luo et al., 2018a; Kahnert, 2010a). The direct radiative effect (DRE) was widely used to evaluate the climate effects of aerosol (Bond et al., 2013; Saleh et al., 2015). IPCC (2014) suggested using the new terminology of aerosol–radiation interactions (ARIs) instead of DRE. Thus, in this work, we use the terminology of ARI to replace DRE. However, an extremely limited number of studies have evaluated the ARI of non-spherical BC in regional or global climate models. Kahnert (2010b) has made efforts to simulate the radiative properties of freshly emitted BC using the Multiple-scale Atmospheric Transport and CHemistry (MATCH) model. That study assumed a fixed solar zenith angle (SZA) and restricted the modeling region in western Europe. Expanding the modeling range to regions with different emission characteristics is important to understand the effects of BC sources on ARI.
A global mean BC all-sky ARI of +0.6 W m−2 has been reported by IPCC (2014). However, the BC ARI values estimated based on in situ optical measurements in some regions are much larger than the rest. BC emissions in China roughly account for one-fourth of its global anthropogenic emission budget (Streets et al., 2001). Eastern China, a typical polluted region, is dominated by anthropogenic emissions (Zhang et al., 2009; Li et al., 2017). Therefore, BC ARI in eastern China has gained increasing interest.
Besides anthropogenic sources, wildfires significantly contribute to regional BC emissions. Extremely high BC concentrations can be found at those fire sites. Recent studies have shown that BC emitted from fire sites can also loft the surrounding atmospheric aerosols to the upper troposphere and lower stratosphere (Yu et al., 2019). Thus, the investigation of BC ARI in these regions is important to understand the detailed plume dynamics and the warming effects of BC. The northwest US, as one of the regions where wildfires are most frequent, has also been investigated in addition to eastern China.
In this work, we employed WRF-Chem to simulate aerosol mass concentrations. Note here that WRF-Chem assumes aerosols to be spherical. Therefore, the radiative parameters of fractal BC aggregates were calculated offline using an optical module, Flexible Aerosol Optical Depth (FlexAOD) (Curci, 2012). We calculated the ARI at the top of the atmosphere (TOA) using a radiative transfer model, libRadtran (Mayer and Kylling, 2005), after the particles' optical properties were calculated.
2.1 Aerosol distribution simulation
In this work, WRF-Chem version 4.1.3 was used to simulate the transport of atmospheric species. Two areas were selected to represent the BC sources with different emission characteristics. Eastern China, a major polluted region in the world, represents the typical polluted urban region. It consists of 115 east–west grids and 105 south–north grids centered at 35.00∘ N, 112.00∘ E with a grid resolution of 18 km. The northwest US, one of the regions where wildfires are most frequent in the world, was also investigated in this work. The fire region consists of 120 east–west grids and 120 south–north grids centered at 39.89∘ N, 121.48∘ W with a grid resolution of 4 km. The schematics of the two regions are shown in Fig. S1 in the Supplement. Both regions have 33 vertical layers above the ground, with a top pressure of 50 hPa.
We used the Model of Emissions of Gases and Aerosols from Nature version 2.1 (MEGAN2.1) to compute the biogenic emissions over two regions (Guenther et al., 1994, 2006). The anthropogenic inventory for eastern China in the year 2016 was compiled by the Multi-resolution Emission Inventory for China (MEIC) (Li et al., 2014; F. Liu et al., 2015). We used the MIX anthropogenic inventory for the region outside China (Li et al., 2017). The Regional Acid Deposition Model version 2 (RADM2) atmospheric chemical mechanism (Stockwell et al., 1990) and the Model Aerosol Dynamics for Europe with the Secondary ORGanic Aerosol Model (MADE/SORGAM) were applied in the simulation of eastern China (Seinfeld et al., 2001; Ackermann et al., 1998). The Fast-J photolysis scheme (Wild et al., 2000) was used to simulate the photolysis rates. The physical scheme options in WRF-Chem are shown in Table S1. The simulations in eastern China started at 00:00 UTC on 31 November 2016, and ended at 00:00 UTC on 1 January 2017. The data from 00:00 UTC on 1 December 2016 to 00:00 UTC on 1 January 2017 were used for analysis.
The Emission Database for Global Atmospheric Research for Hemispheric Transport of Air Pollution (EDGAR-HTAP) version 2 emission inventory for 2010 was used in the northwest US. The MOSAIC aerosol scheme (Zaveri and Peters, 1999; Zaveri et al., 2008) and the Carbon Bond Mechanism Z (CBM-Z) photochemical mechanism (Zaveri and Peters, 1999) were used in the fire region simulation. The Fire emission was provided by the Fire INventory from NCAR (FINN) (Wiedinmyer et al., 2011). Note here that the EDGAR-HTAP anthropogenic inventory and FINN were provided for the MOZART chemical mechanism, so we mapped the emission for the Model for Ozone and Related chemical Tracers (MOZART) chemical mechanism to the CBM-Z chemical mechanism based on the study of Emmons et al. (2010). For both simulations in eastern China and the northwest US, the National Center for Environmental Prediction (NCEP) Global Forecast System (GFS) Final Analysis (FNL) with a horizontal grid spacing of 0.25∘ and 6 h intervals was used to provide the meteorological initial and boundary conditions. The chemical initial and boundary conditions were obtained from the Model for Ozone and Related chemical Tracers, version 4 (MOZART-4). The simulations in the northwest US started at 00:00 UTC on 5 August 2016 and ended at 00:00 UTC on 21 August, and the data from 00:00 UTC on 14 August to 00:00 UTC on 21 August were used for analysis.
2.2 The morphology of BC
In this work, we only consider externally mixed BC aerosols, which are commonly represented by fractal structures. Df is a key parameter to describe the compactness of fractal BC (Wang et al., 2017; Yuan et al., 2019). Df increases from approximately 1.8 to 3 when the BC morphology can vary from a chain-like structure to a spherical structure. The freshly emitted BC generally exhibits a fluffy structure with a Df of approximately 1.8 (Heinson et al., 2010, 2017). The laboratory measurements also showed that the freshly emitted BC generally presents a small Df. Chakrabarty et al. (2006) have shown that Df of BC emitted from wildland fuels generally exhibits a range of 1.67–1.83. A Df range of 1.6–1.9 was observed for BC produced from diesel combustion (Wentzel et al., 2003). China et al. (2013) indicated that the BC freshly emitted from wildfire generally exhibits Df with a range of 1.74–1.92. However, a more compact structure was commonly observed for BC in the atmosphere with particle aging (Li et al., 2003; Adachi et al., 2014, 2010; Chen et al., 2016). A Df range of 2.2–2.4 was observed in the study of Adachi et al. (2010). The fractal structures with a larger Df are widely used to describe the BC with more compact structures (Adachi et al., 2010). Chakrabarty et al. (2006) further showed that the Df of aged BC can reach up to 2.6. To represent both fluffy and compact BC, Df values of 1.8, 2.2 and 2.6 were considered in this study. While the fractal prefactor k0 was also measured in a wide range in the atmosphere, its impact on the optical properties was relatively small. We assumed a fixed k0 of 1.2 in this work. The typical morphologies of fractal BC are shown in Fig. 1.

The volume-mean particle radius was commonly used to describe the size of non-spherical BC. Previous studies have observed a range of approximately 8–57 nm for BC monomer radius (Eggersdorfer and Pratsinis, 2012; Mikhailov et al., 2006; Köylü and Faeth, 1992; Lee et al., 2002), while Kahnert and Kanngießer (2020) further showed that the typical range is approximately 10–25 nm. In this work, we assumed a fixed monomer radius of 20 nm. We considered an Ns range of 1–1000 to represent BC with different sizes. The volume-mean particle radius (rp) can be calculated using
Note here that BC can also internally mix with other compositions, and the morphology can become more complex (Wang et al., 2021c, 2017). However, we mainly focus on the freshly emitted BC, and we only consider externally mixed BC. Further investigations would be performed for more complex internally mixed BC in the future.
2.3 The refractive index and size distribution of BC
BC refractive index shows spectral dependence (Chang and Charalampopoulos, 1990), while it does not vary largely with wavelengths in the short wavelength range (Liu et al., 2018; Lack and Cappa, 2010; Bond and Bergstrom, 2006). The suggested BC refractive index values by Bond and Bergstrom (2006) were commonly used. In this work, the median value of 1.85+0.71i was used, as it was widely used in many regional and global climate models (e.g., WRF-Chem). The size distribution of BC also suffers large uncertainties from different fuels and conditions. The size distribution of BC is commonly fitted by a lognormal size distribution with a geometric mean radius (rg) and a geometric standard deviation (σg) (Schwarz et al., 2008; Mishchenko et al., 2016b):
where n(rp) is the probability density distribution of particle number concentrations, rp is the volume-mean particle radius and N0 is the number concentration, which can be calculated by the mass concentration obtained from WRF-Chem by assuming BC mass density, rg and σg. The details about the calculation of N0 are shown in Curci (2012).
BC geometric mean radius of 0.05–0.06 µm is frequently observed by instruments and widely assumed in numerical studies (Alexander et al., 2008; Coz and Leck, 2011; Reddington et al., 2013; Liu et al., 2018). In this work, BC geometric mean radius was assumed to be 0.05 µm, and σg was assumed to be 1.6. We used the volume-equivalent radius to characterize the particle size of fractal BC. The density of BC was assumed to be 1.8 gm−3 based on the suggested values by Bond and Bergstrom (2006).
2.4 BC radiative properties
In this work, BC radiative properties were calculated using the multiple-sphere T-matrix method (MSTM) (Mackowski and Mishchenko, 2011, 1996). The MSTM can efficiently calculate the optical properties of spheres without intersecting surfaces. The MSTM has high computational efficiency because it theoretically calculates the optical properties of randomly oriented particles without numerically averaging them over different particle orientations. The MSTM can directly calculate the extinction efficiency (Qext), scattering efficiency (Qsca) and phase function (P) with the refractive index, wavelength and input shapefile. Then, the extinction cross section (Cext) and scattering cross section (Csca) were obtained using
Extinction coefficient (bext), scattering coefficient (bsca) and bulk phase function were calculated using the following equations.
In climate modeling, instead of using the phase function, the Legendre expansion coefficients were commonly used:
where θ is the scattering angle, PS represents generalized spherical functions, αS represents the Legendre expansion coefficients and Smas is the order of truncation of the Legendre expansion coefficients.
In this work, we used the pmom tool, which is available in libRadtran software for calculating the Legendre expansion coefficients. With the inputs of the aerosol bulk phase function and the desired number of Legendre expansion coefficients, the pmom tool can calculate the Legendre expansion coefficients.
The radiative properties of fractal BC and spherical BC were calculated at 300–4000 nm wavelengths. The step size of Δλ=50 nm was chosen when λ is less than 1000 nm, while Δλ=200 nm was selected for 1000 nm 2000 nm and Δλ=400 nm when λ≥2000 nm. We created look-up tables for bext, bsca and the Legendre expansion coefficients of phase functions for each σg and rg. Thus, the optical properties of BC can be obtained by interpolating the look-up tables.
2.5 Flexible Aerosol Optical Depth (FlexAOD)
The aerosol mass concentrations from WRF-Chem were inputted into an optical software Flexible Aerosol Optical Depth (FlexAOD) (Curci, 2012; Curci et al., 2015) to calculate the aerosol radiative properties. FlexAOD is an optical post-processing tool for the atmospheric chemistry-transport model, and it started as a tool for the GEOS-Chem model. We have made some modifications to FlexAOD to make it accommodate the WRF-Chem outputs. We first mapped the aerosols from WRF-Chem into five categories: BC, organic carbon (OC), inorganic salt (INS), sea salt (SA) and dust (DST). The mapping details are shown in Tables S2–S3. After the WRF-Chem species were mapped, the size distribution, refractive indices and hygroscopic growth factors were then assigned.
FlexAOD first reads the aerosol mass concentrations from WRF-Chem and then converts them to aerosol volume concentrations based on the assigned mass densities. Based on the assigned normalized size distributions, we can calculate the number concentration (N0) of each aerosol. FlexAOD pre-calculates the optical properties of each type of aerosol by assuming N0=1 with the assumed size distributions. The total scattering and extinction coefficients can be obtained by multiplying the pre-calculated scattering and extinction cross sections with the number concentrations. The phase function of each type of aerosol is identical to the pre-calculated phase function by assuming N0=1, and then the total phase function was calculated according to the number concentration of each aerosol. In FlexAOD, aerosol shapes were assumed to be spherical, and the corresponding optical properties of each aerosol species were calculated using the Mie code provided by Mishchenko et al. (1999). The bulk optical properties were then calculated by combining an assembly of aerosols.


Figure 3The time series of BC concentrations at typical sites in the northwest US and eastern China.
BC optical properties were overwritten using the look-up tables created in Sect. 2.4. As described in Sect. 2.4, we have created look-up tables for non-spherical BC with different size distributions. Thus, if the size distribution of BC is assigned, the optical properties of BC with a normalized size distribution can be determined by interpolating the look-up tables. Once the number concentration is calculated, we can determine the total optical properties.
Apart from BC, the physical properties of other chemical species were also specified. We used the OC refractive indices suggested by Highwood (2009). The density of OC varies under different conditions. The density of the oxidized organic aerosol was reported to be approximately 1.3 g cm−3 (Cross et al., 2007), while Nakao et al. (2013) reported that the density of OC with lower oxidation was approximately 1–1.2 g cm−3. For freshly formed OC, 0.9–1.1 g cm−3 was used by Liu et al. (2017). In this work, the density of OC was assumed to be 1.2 g m−3. OC size is also commonly fitted by a lognormal size distribution. In the study of He et al. (2016) and Dentener et al. (2006), rg=0.03 µm and rg=0.075 µm were assumed for hydrophobic and hydrophilic OC, respectively. In this study, all OC was assumed to be hydrophilic, and we assumed a rg of 0.075 µm and a σg of 1.6 for OC. The refractive indices of dust were identical to those used in the Goddard Chemistry Aerosol Radiation and Transport (GOCART) model (Chin et al., 2002). For dust, the gamma distribution was assumed (Martin et al., 2003; Curci, 2012):
where a and b are two parameters for the distribution, and b is in the range of 0–0.5.
The refractive indices of other chemical species were adapted from the Optical Properties of Aerosols and Clouds (OPAC) package (Hess et al., 1998). The physical properties are displayed in Table S4. Similar to the study of Curci et al. (2019), the hygroscopic growth factors of different aerosols were taken from the OPAC package (Hess et al., 1998). Note here that many internally mixed particles exist in the atmosphere, while in this study we mainly aim to study the morphological effects of freshly emitted particles, and more complex particles may be investigated in the future. Effective refractive indices were calculated using the volume mixing method for hydrophilic particles.
The total column single-scattering albedo (SSA) and aerosol optical depth (AOD) were calculated by FlexAOD, and absorption aerosol optical depth (AAOD) was calculated by
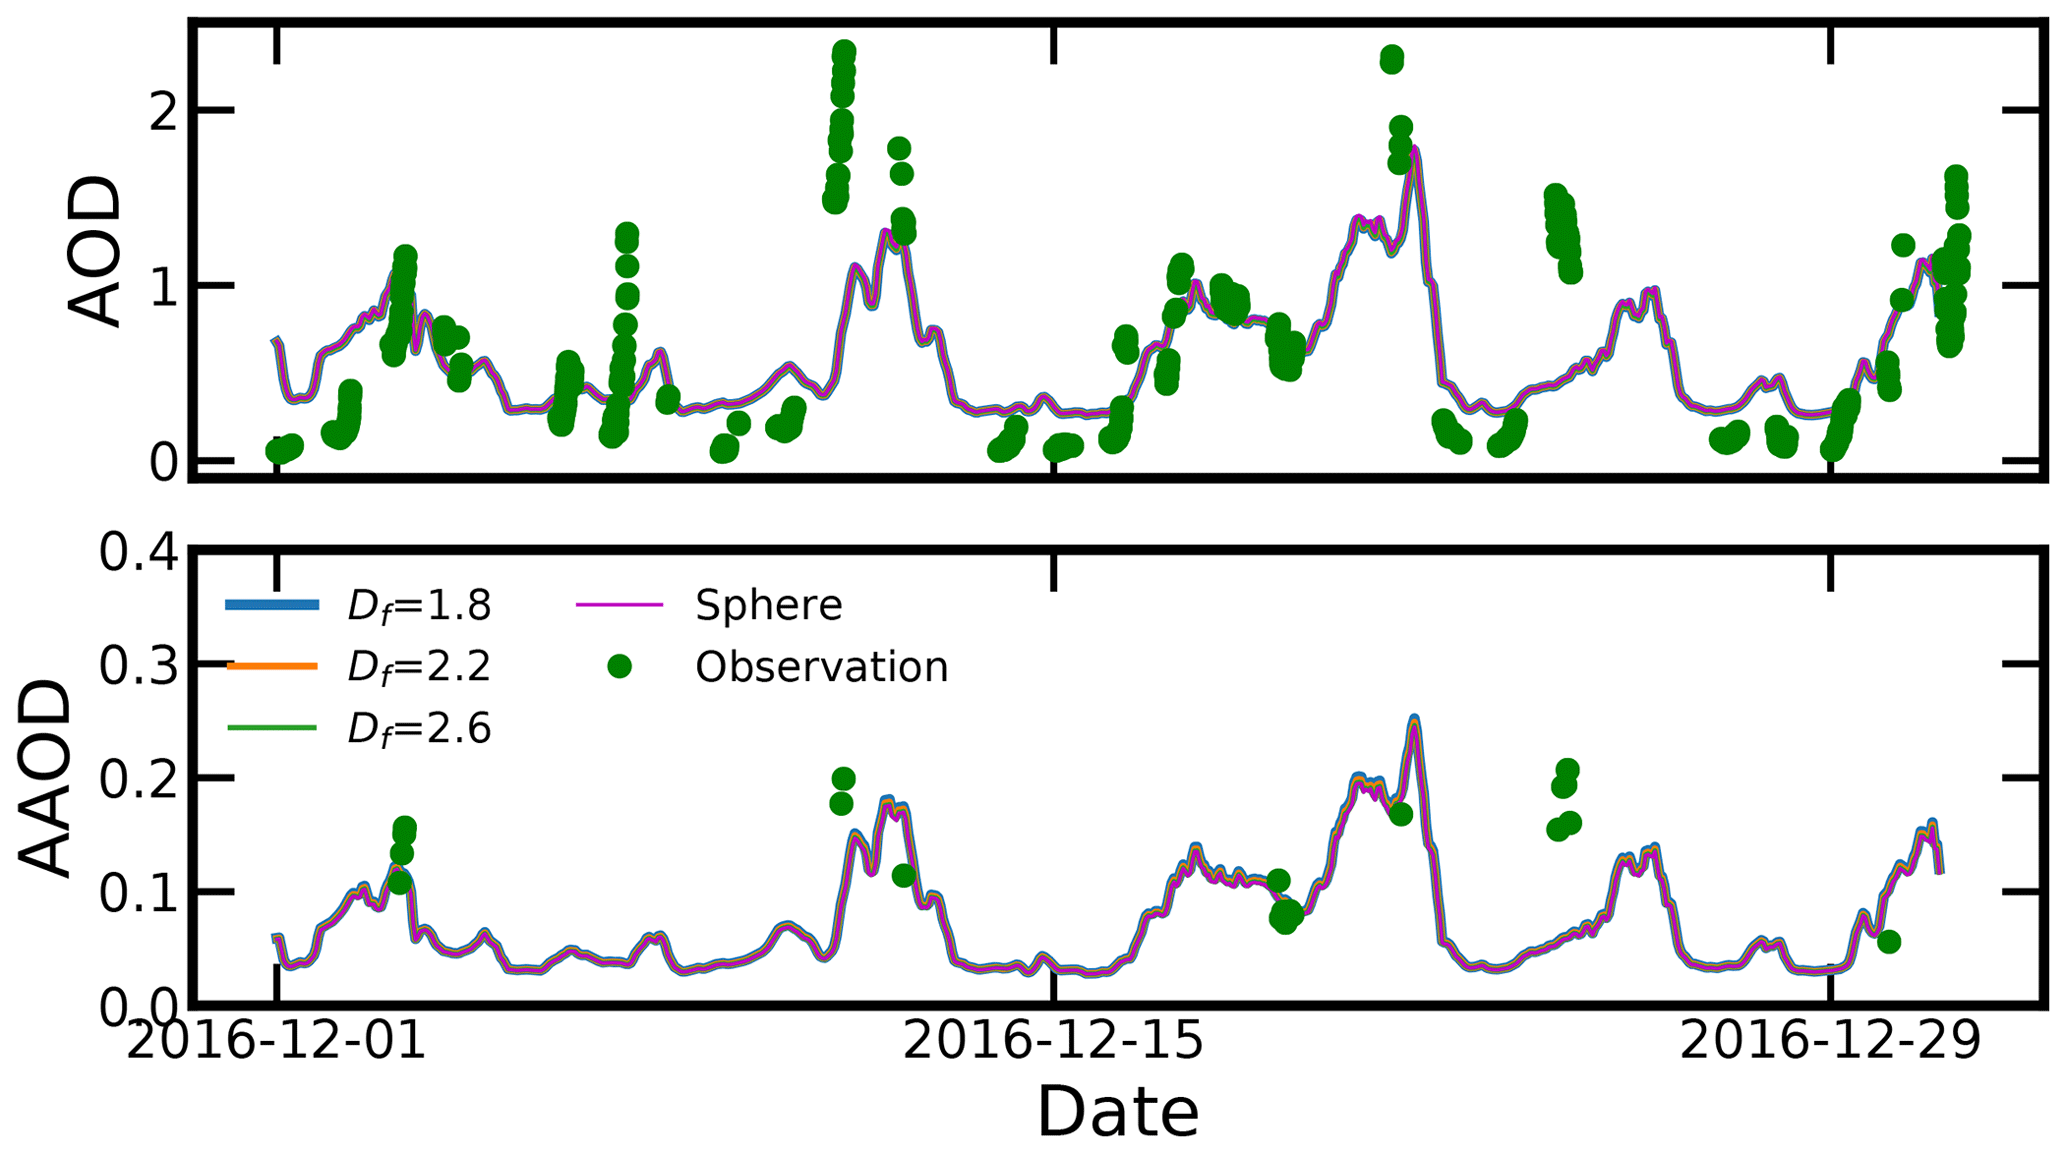
Figure 4Comparison of measured and calculated AOD and AAOD in Beijing, where λ=500 nm for AOD. λ=440 and 450 nm for measured and calculated AAOD, respectively, and the observations were obtained from AERONET.
2.6 ARI modeling
The optical properties (extinction coefficient, SSA, asymmetric factor (ASY)) calculated using FlexAOD at each WRF-Chem grid were inputted into a radiative transfer model, libRadtran (Mayer and Kylling, 2005), to calculate the radiative fluxes at the top of the atmosphere (TOA). The radiative transfer equation was solved by the DIScrete Ordinate Radiative Transfer (DISORT) radiative transfer equation solver (Stamnes et al., 1988; Buras et al., 2011). The libRadtran can select a standard atmosphere background and determine the solar zenith angle (SZA) based on the longitude, latitude and UTC time. The surface albedo information was obtained from NASA Earth Observations (NEO). The radiative transfer calculations were performed for each hour and then were averaged over 1 d. In this work, ARIs of BC aerosol were calculated using the following equations:
where F↓ represents downward radiative flux and F↑ represents upward radiative flux. In this work, we just considered the ARI at the TOA. Only shortwave ARI was considered, and the wavelength is in the range of 0.3–4.0 µm.
In this work, both the clear-sky ARI and all-sky ARI were calculated. The daily-mean cloud optical thickness, cloud effective radius and cloud cover data from the MOderate Resolution Imaging Spectroradiometer (MODIS) products were used for the all-sky ARI calculations. The regional-mean BC ARI was also calculated. The aerosol optical properties and cloud properties were first averaged, and then the radiative transfer calculations were performed for only 1 d (the median day). Similar methods were also used in previous studies (e.g., Saleh et al., 2015; Tuccella et al., 2020).
3.1 Impacts of BC morphology on AOD and AAOD
To verify the modeling performance of the aerosol concentrations, we compared the simulated PM2.5 concentrations with observations at some monitoring sites, and the results are shown in Fig. 2. In the figures, the left column represents typical cities in eastern China, and the right column represents the sites in the northwest US. The calculated PM2.5 concentrations in eastern China are generally consistent with the observations. Even though the simulated PM2.5 concentrations in the fire region are a little higher than the observations, the deviations are not large, and the general trends are consistent. Therefore, it is reasonable to represent the atmospheric aerosol concentrations using WRF-Chem modeling.
In this study, we selected three fire sites to evaluate the morphological effects on the BC ARI. The positions of the selected sites are shown in Table S5, and they represent the fire sites with high aerosol concentrations. As shown in Fig. 3, the temporal BC concentrations at fire sites can even exceed approximately 400 µg m−3 when the fire occurs, while the BC concentrations are extremely low on other days. As shown in Fig. 3, even though the maximum BC concentrations in the polluted urban cities are much smaller than the fire sites, the mean BC concentrations can reach approximately 12 µg m−3. The simulated BC concentrations generally agree with the measurements of Zhang et al. (2012) for the urban region, where BC concentrations were observed to be approximately 4–12.7 µg m−3. We further compare the calculated AOD and AAOD with observations from AErosol RObotic NETwork (AERONET). The AERONET data of Beijing are available among all selected cities in eastern China. As shown in Fig. 4, the calculated AAOD and AOD can generally represent the observations.
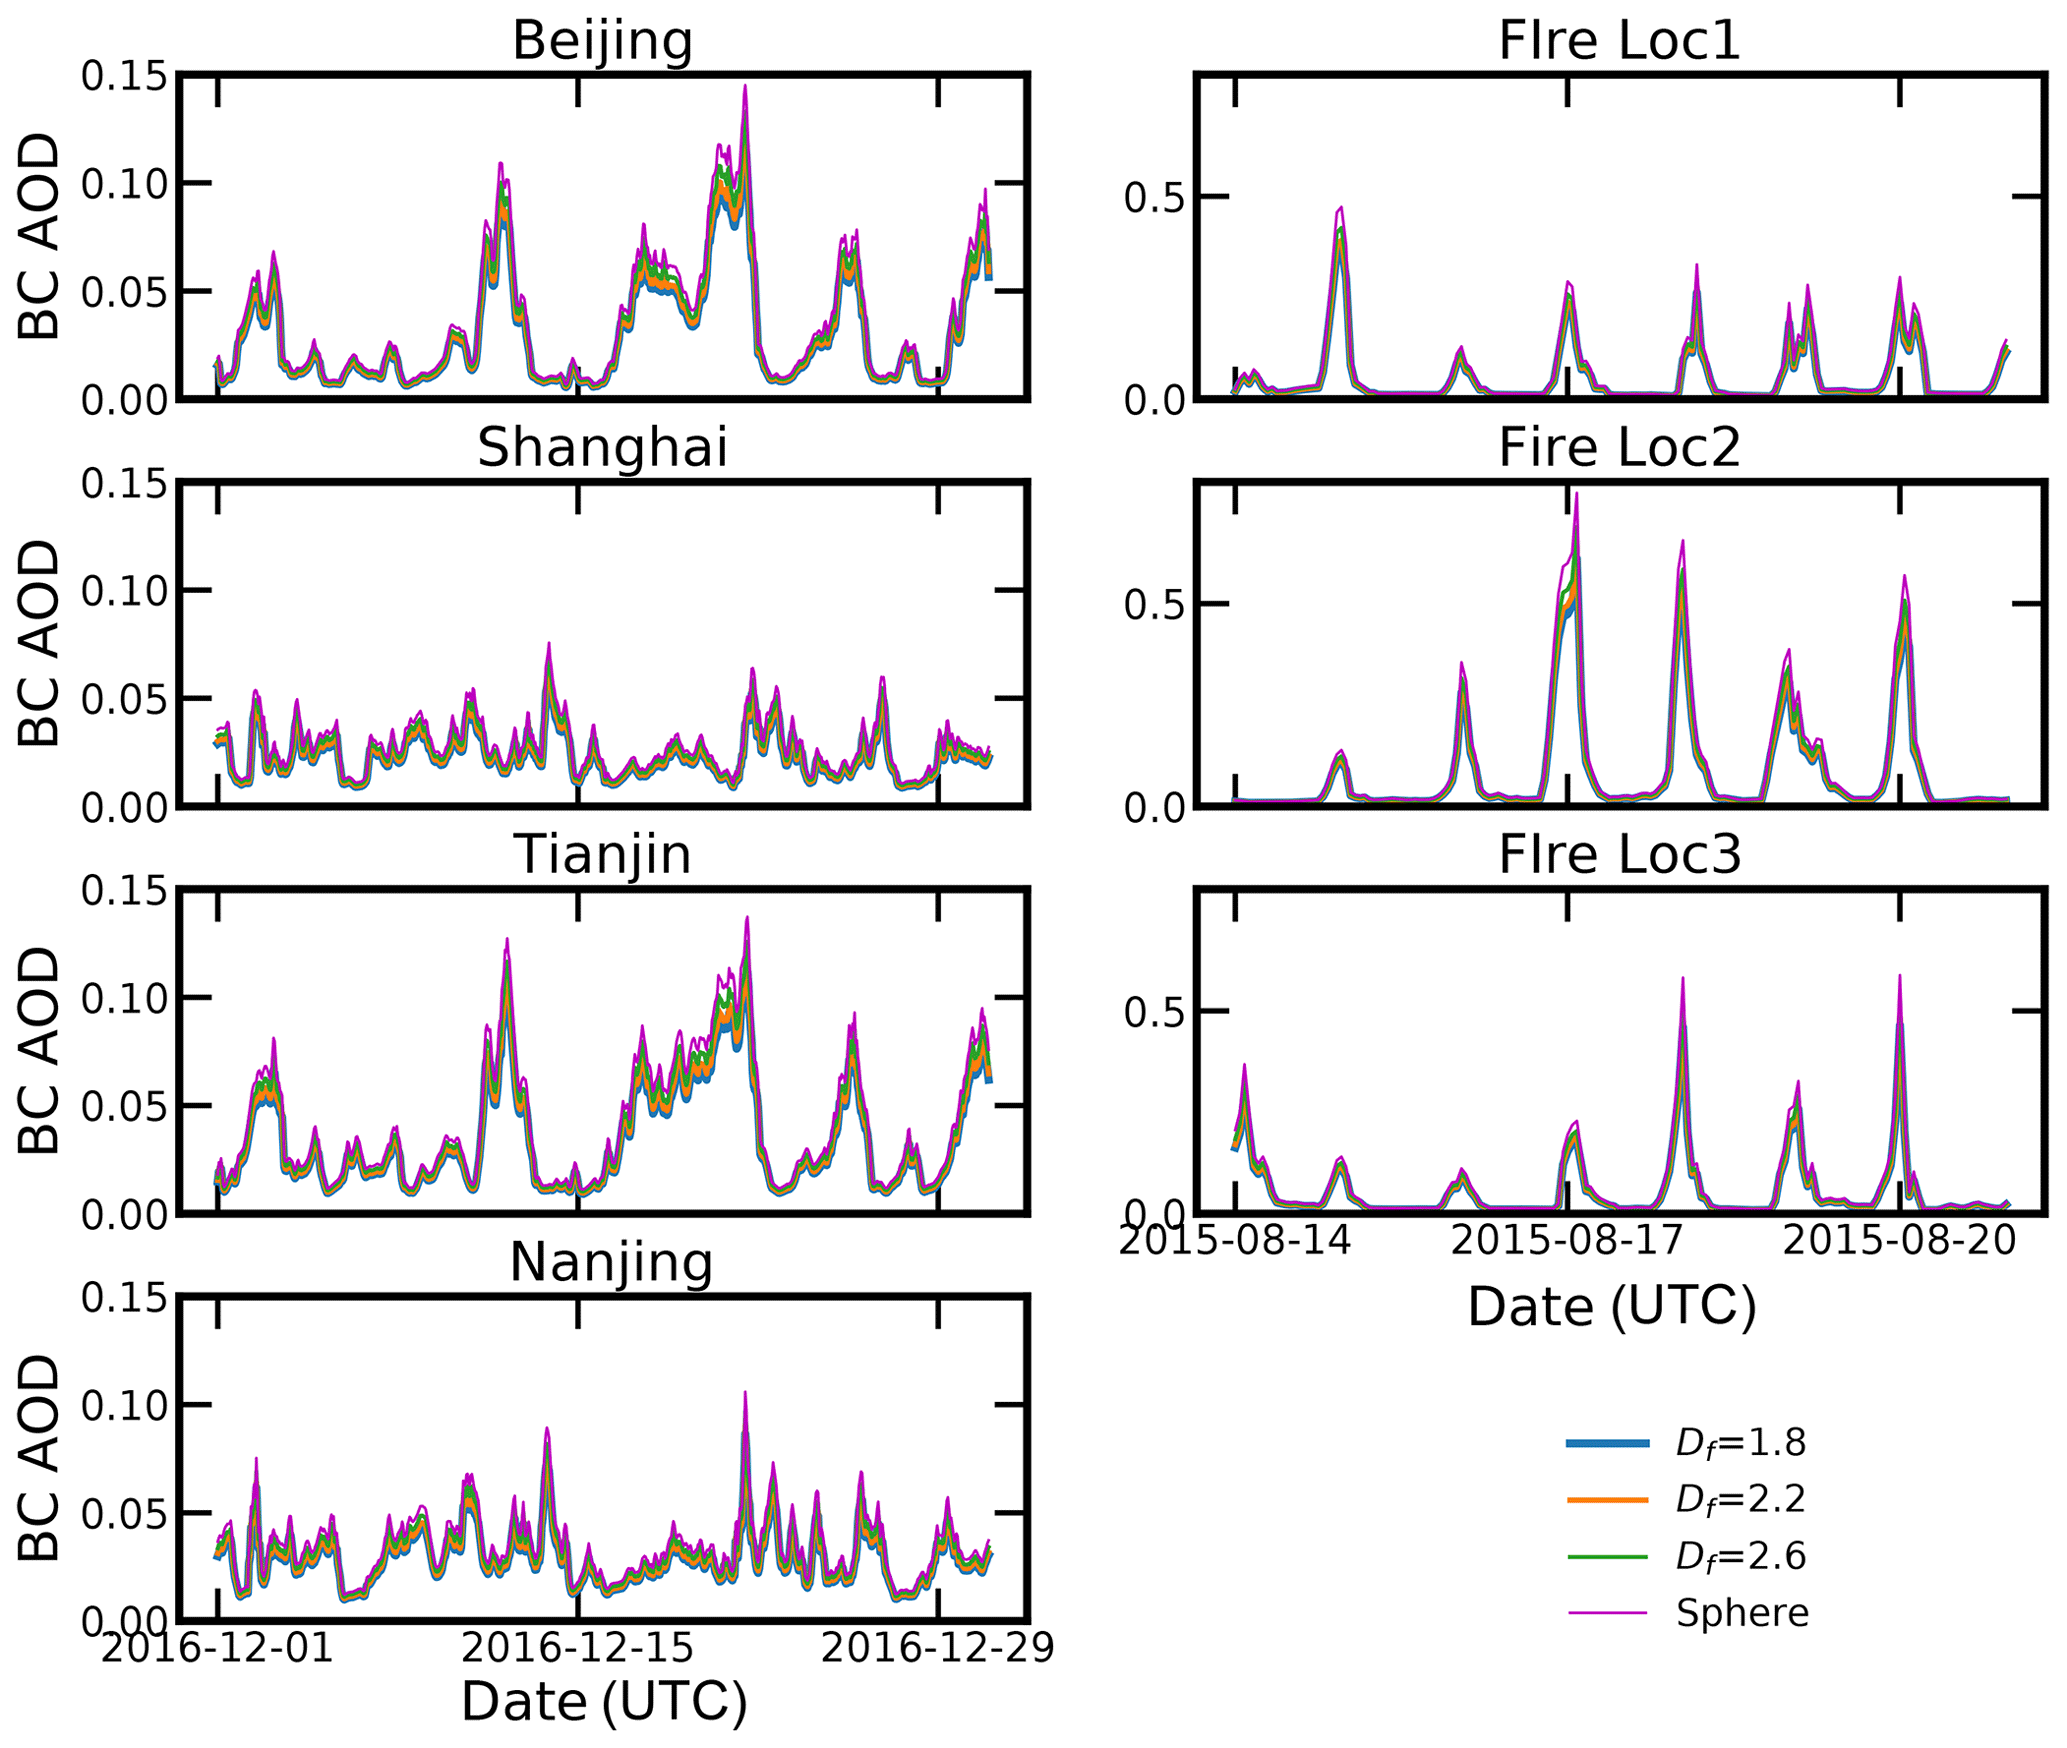
Figure 5 shows the AOD of BC with different morphologies, where BC AOD was calculated by the difference between AOD with BC and that without BC. Zhuang et al. (2019) indicated that the time-averaged BC AOD in Beijing, Hefei and Taihu was approximately 0.05–0.06. Our simulations are generally in agreement with their results, and the simulated BC AOD varies from approximately 0.01 to approximately 0.12 in the selected urban cities. In Beijing and Tianjin, BC AOD can reach approximately 0.12, while in Shanghai and Nanjing, the maximum BC AOD is approximately 0.07 and 0.1, respectively. The maximum BC AOD can reach 0.5–0.9 in typical fire sites. From Fig. 5, we can also see that BC AOD calculated using the spherical model is relatively higher than those using fractal aggregate models, which is consistent with the findings of Liu and Mishchenko (2005). As shown in Fig. 6, in the urban area a spherical assumption for BC led to an overestimation of less than 0.03 for AOD compared to the fractal model with a Df of 1.8, while the overestimation can reach approximately 0.15 in fire sites. The overestimation accounts for a large proportion of BC AOD, which can exceed 20 % of the total BC AOD.
Figure 7 shows the calculated BC AAOD using different BC models, where BC AAOD was calculated by the difference between AAOD with BC and that without BC. Our modeling results show that a more compact structure may lead to a smaller AAOD, and this is consistent with the findings of Liu and Mishchenko (2005) for single BC particles. The reason is that a more compact structure blocks the light from transmitting into the inner part of the particle, and a smaller absorption efficiency was observed (Kahnert and Devasthale, 2011). Shin et al. (2019a) showed that most BC AAOD at 440 nm in Asia is within the range of 0–0.12. Our simulated BC AAOD at 450 nm is generally consistent with their findings. At fire sites, BC AAOD at 450 nm wavelength can reach approximately 0.7. As shown in Fig. 8, the spherical model underestimates AAOD by approximately 0.016 compared to the fractal model with a Df of 1.8 in typical polluted cities, while the AAOD underestimation using the spherical model can reach approximately 0.04 in fire sites. In general, the AAOD underestimation using the spherical model is approximately 8 % of the total BC AAOD.
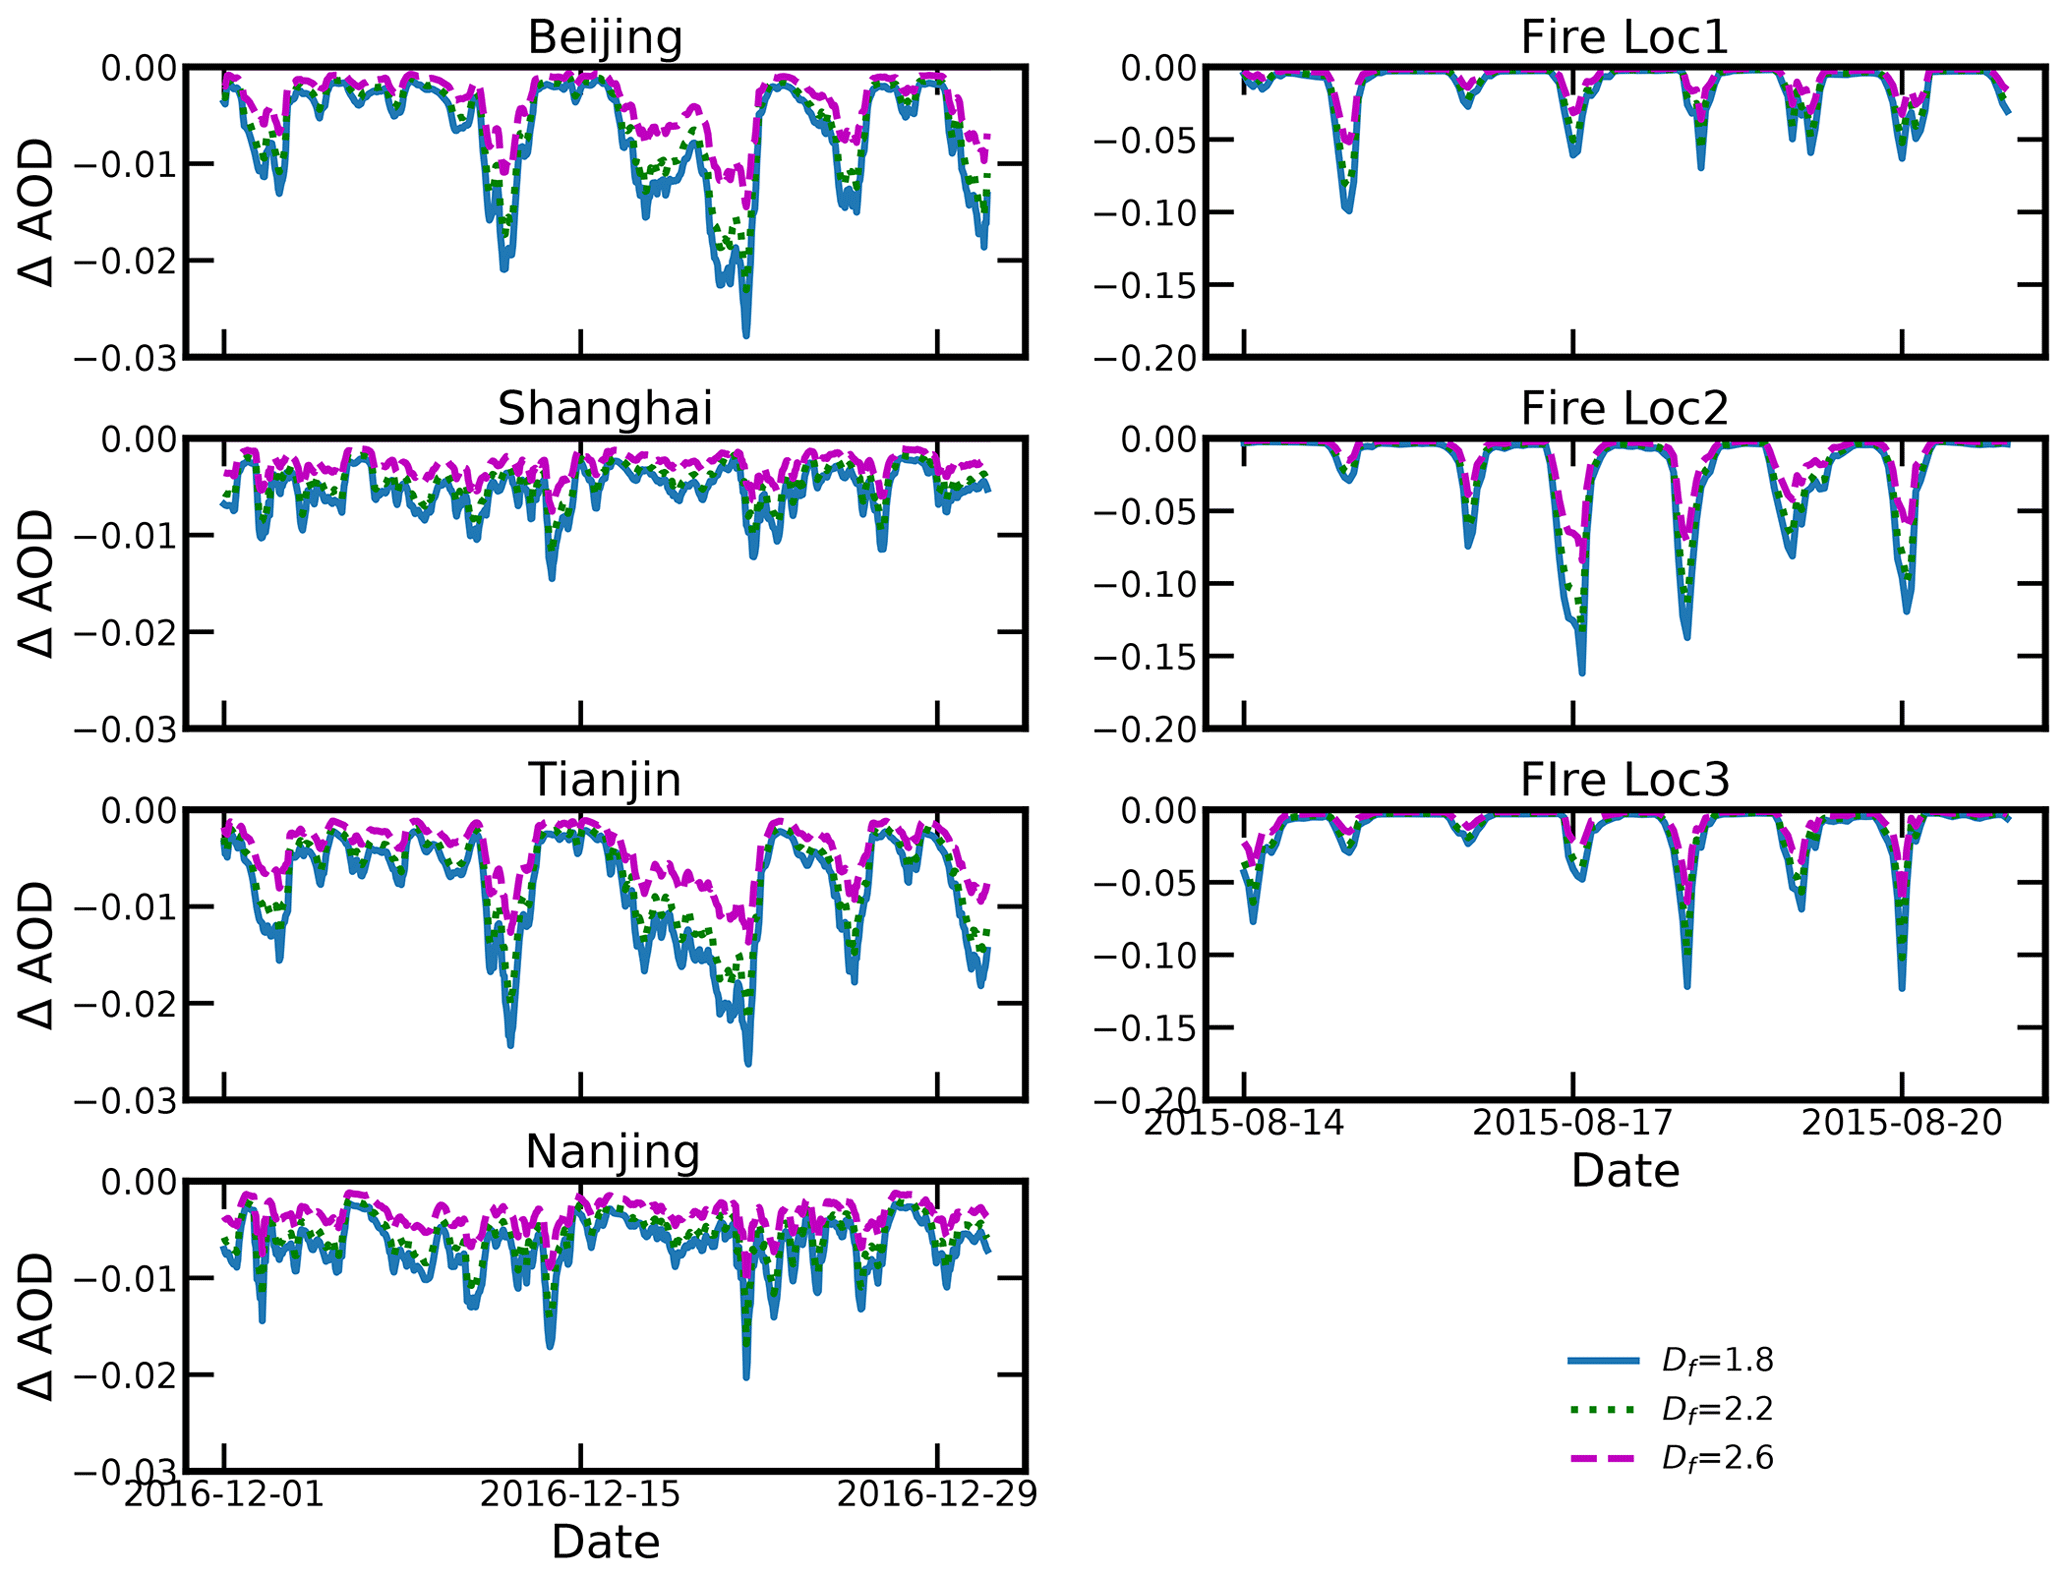
Figure 6The AOD difference between fractal aggregate models and the spherical model, λ=550 nm.
Figure 9 shows the time-averaged BC AOD at 550 nm and AAOD at 450 nm as a percentage of the total AOD and AAOD, respectively. In typical polluted cities in China, BC AOD at 550 nm accounts for approximately 4.6 %–7 % of the total AOD, while BC AOD at fire sites can account for more than 10 % of the total AOD. At 450 nm, at both polluted urban and fire sites, the fractions of BC AAOD are close and are approximately 30 %. This means that the relative proportions of BC and OC in polluted urban sites are close to those of fire sites.
BC morphologies also have significant impacts on the BC AOD and AAOD fractions. As BC morphologies change from a fractal dimension of 1.8 to a spherical structure, BC AOD fraction increases from 4.6 %–5.5 % to 5.8 %–6.9 % in typical polluted urban cities and from 9.0 %–10.3 % to 11.1 %–12.7 % at typical fire sites, respectively. The relative differences between the fractal model and the spherical model ((fractal – sphere)/sphere) can be above 25 %. For BC AAOD fraction, the values can vary in the range of 25.0 %–33.2 % in typical polluted urban cities and the range of 25.4 %–30.0 % at typical fire sites, respectively. The AAOD fraction relative differences between the fractal model with a Df of 1.8 and the spherical model are approximately 10 %.
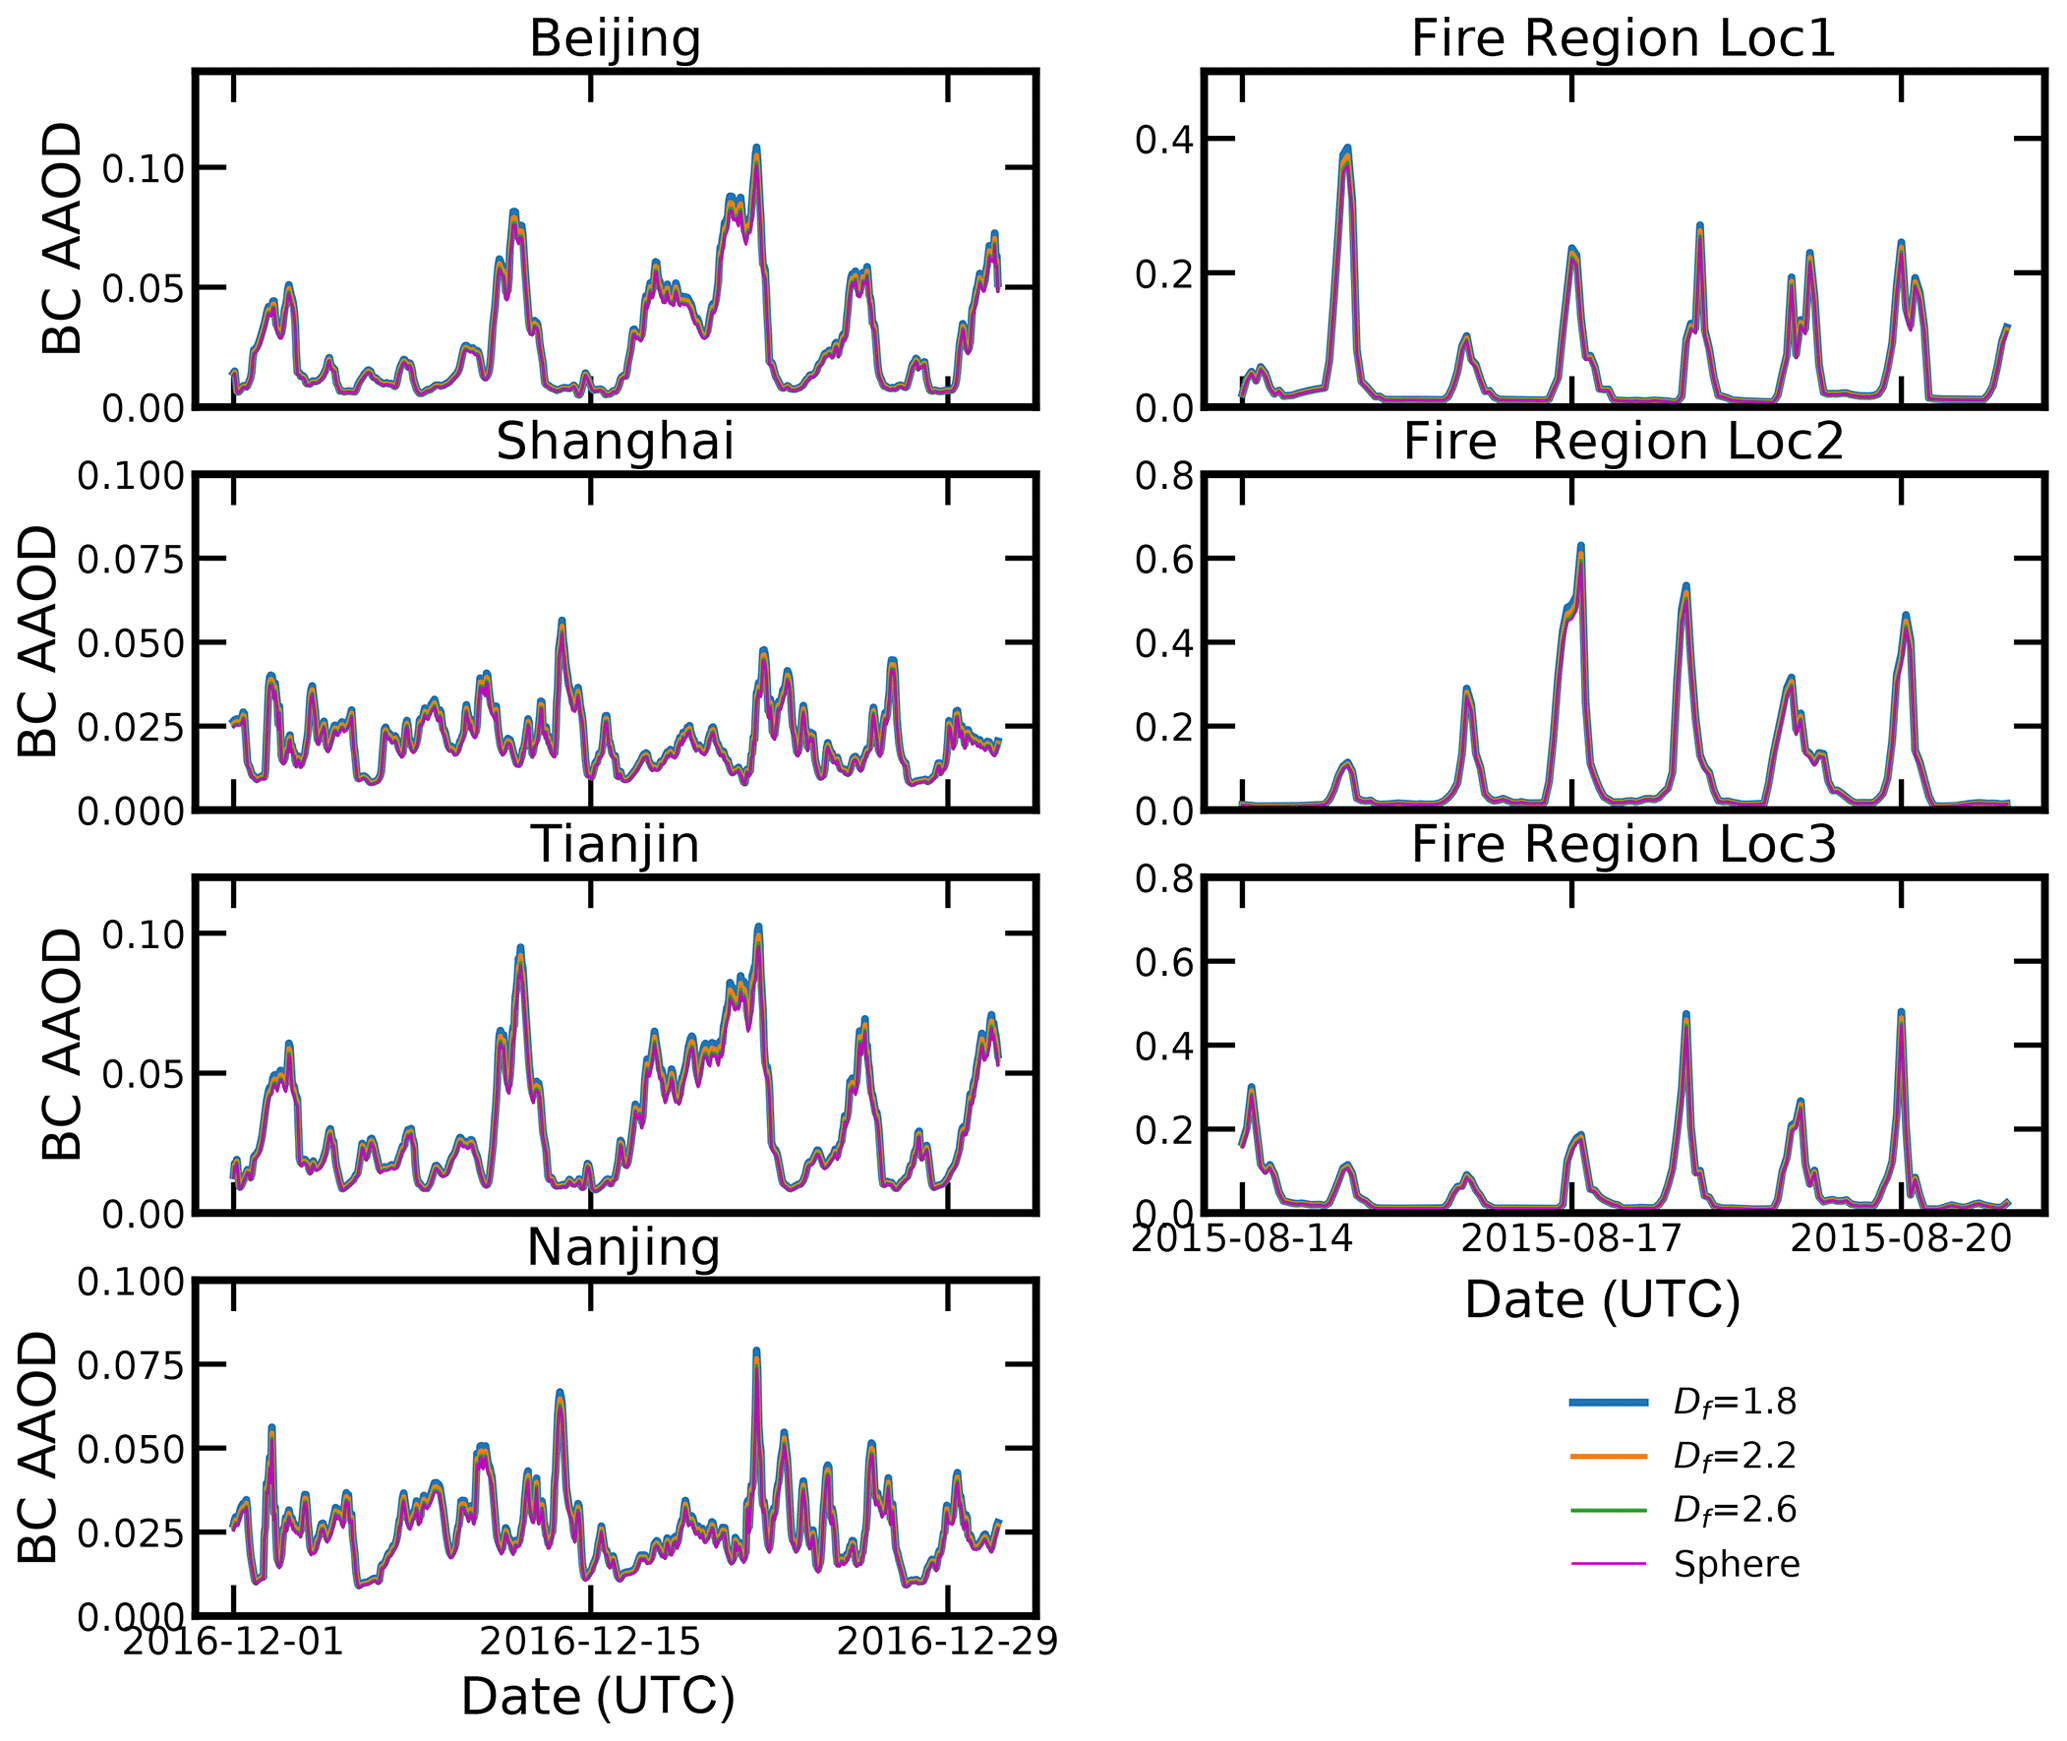
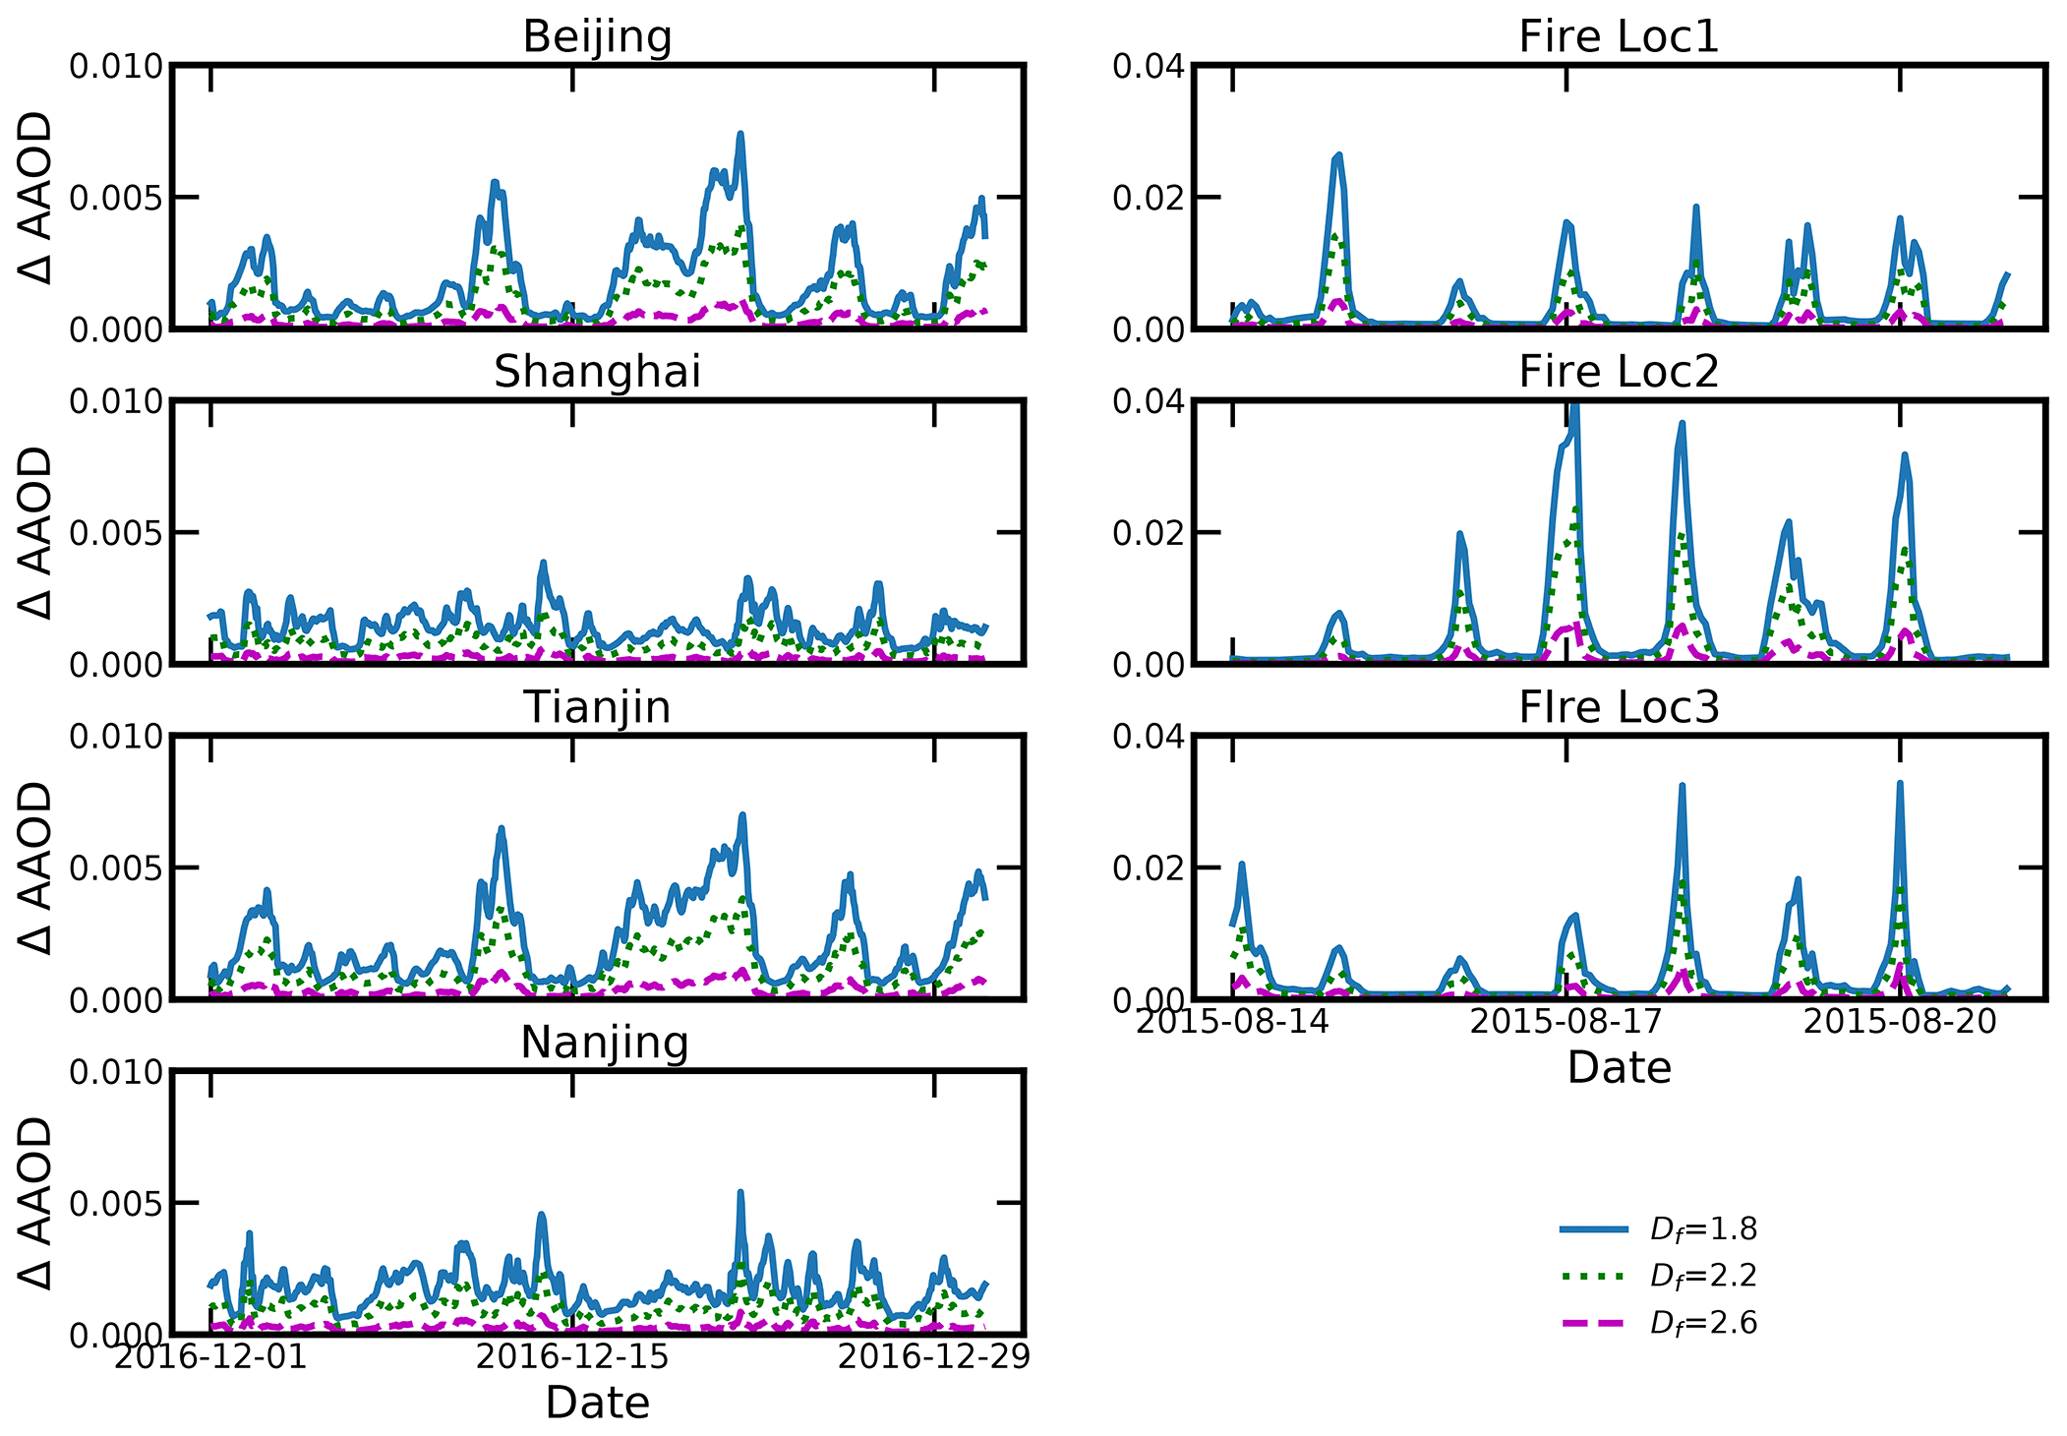
Figure 8The AAOD difference between fractal aggregate models and the spherical model, λ=450 nm.
3.2 Impacts of BC morphology on SSA
SSA, as the ratio of scattering to extinction, is widely used to infer aerosol types. Figure 10 shows the comparison of SSA using different BC models. Shin et al. (2019b) showed that the mean SSA at 440 nm was approximately 0.89–0.92 in Beijing using AERONET data, and Shaheen et al. (2019) demonstrated that the mean SSA at 440 nm was approximately 0.897 in winter Beijing. At 450 nm, the calculated SSA in typical urban cities is within the range of 0.86–0.92, which is generally consistent with the observations in previous studies. In the fire region, SSA varies in a wider range. At 450 nm, SSA at the selected fire sites can vary in the range of 0.75–0.9, which is a little smaller than that in polluted urban areas due to large portions of carbonaceous aerosols in the fire region.
With more compact structures, SSA presents a larger value, which is consistent with the findings of Kahnert and Devasthale (2011). However, the effects of BC morphologies on total SSA at 450 nm are not obvious due to the small percentage of BC in the atmosphere. As shown in Fig. 11, the overestimations of the spherical BC model for SSA at 450 nm are generally within 0.005 in typical polluted cities and within 0.012 at fire sites, which is less than 1 % of the total SSA. However, these values may have relatively larger impacts when evaluating the climate effect of BC, as BC commonly presents a relatively small value of 0.2–0.4 (Kahnert and Devasthale, 2011).

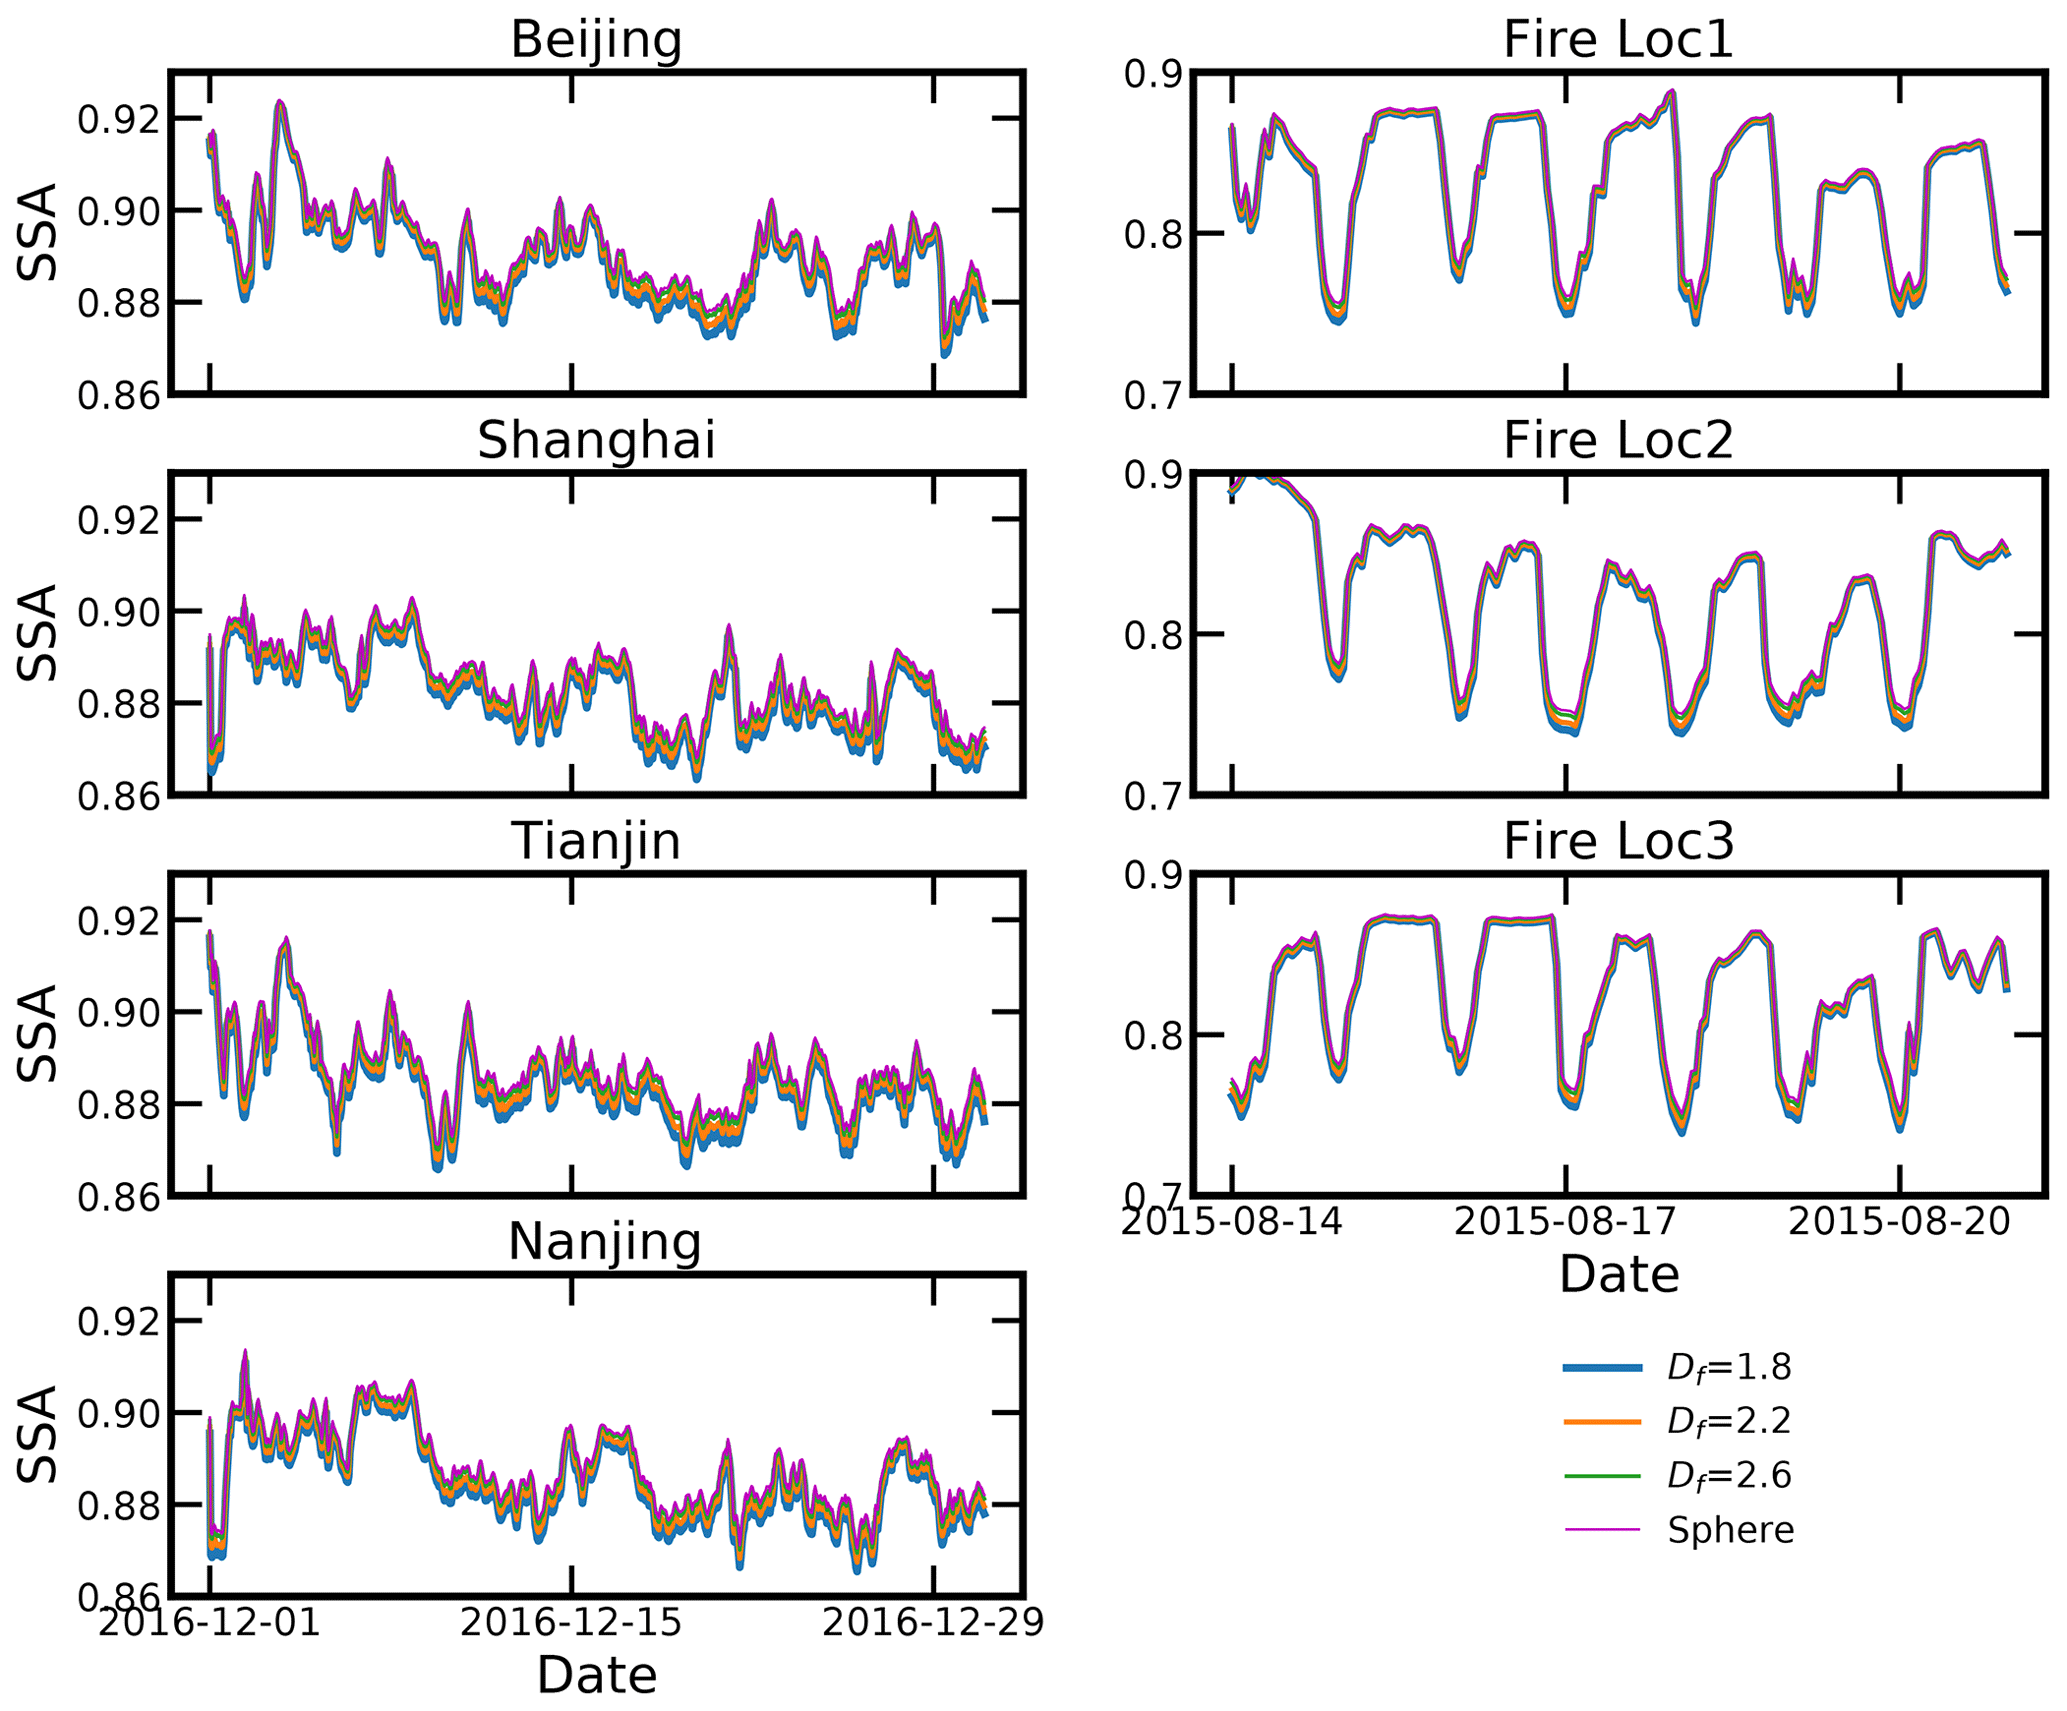
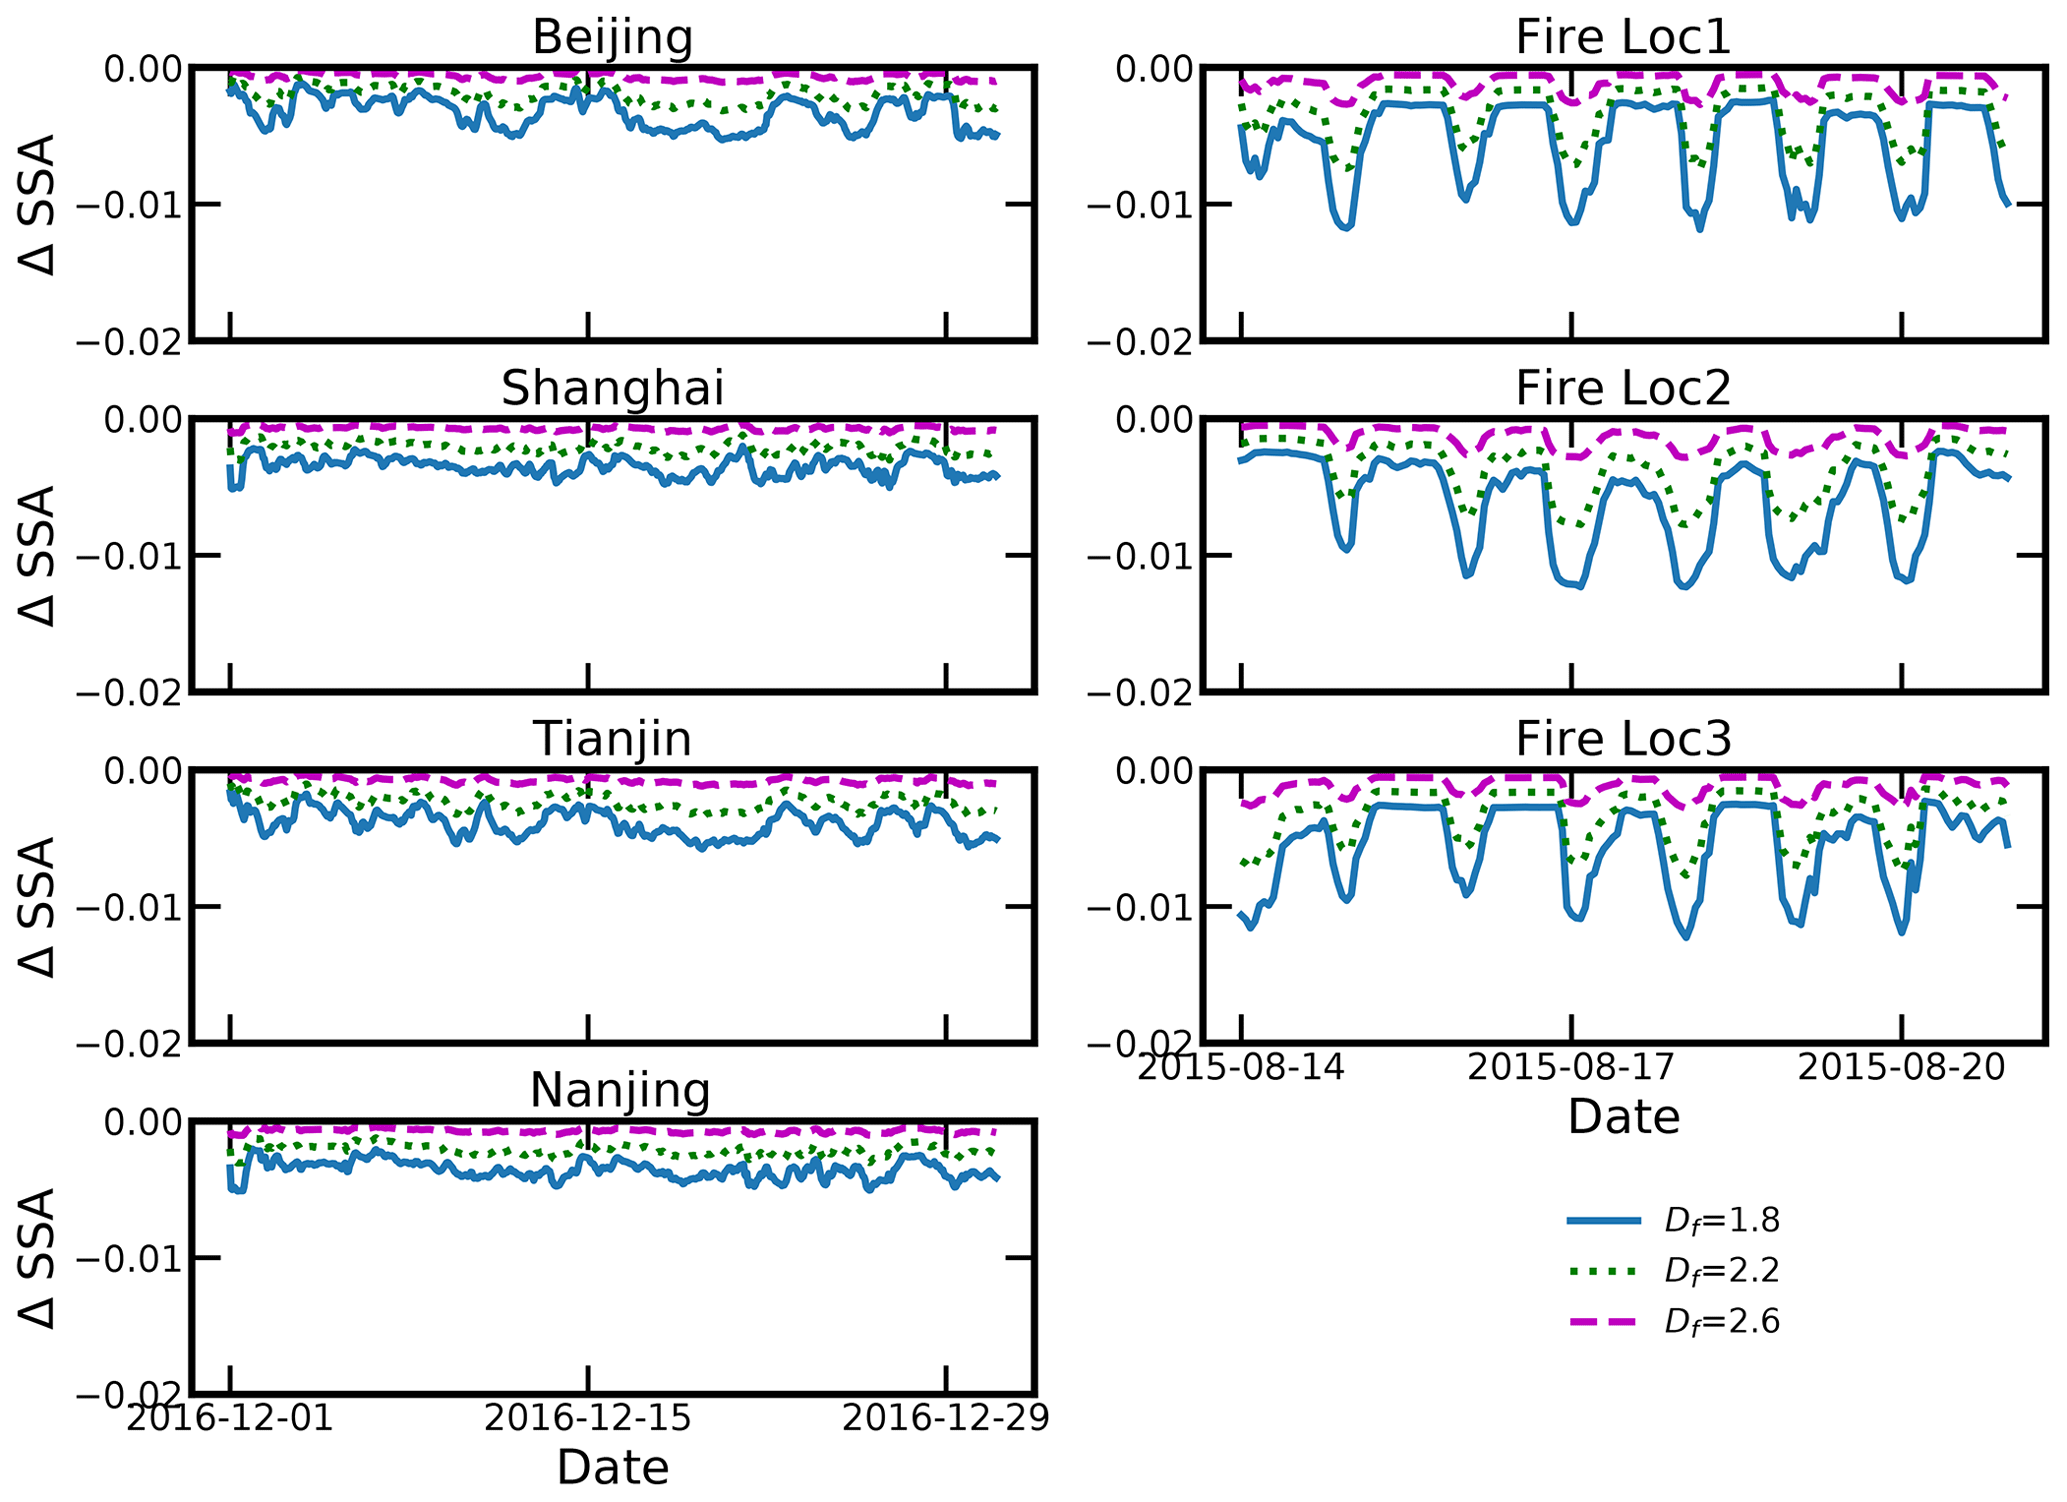
Figure 11The SSA differences between fractal aggregate models and the spherical model, λ=450 nm.
3.3 Impacts of BC morphology on ARI
BC clear-sky ARI varies in different regions, and the reported BC ARI varies in previous studies. Zhuang et al. (2018) estimated BC clear-sky ARI to be +1.85 W m−2 in East Asia. Much larger BC clear-sky ARIs during December (+15 W m−2) and November (+8 W m−2) over Ahmedabad and Guru Shikhar, respectively, were reported by Rajesh and Ramachandran (2018). Zhuang et al. (2019) showed that clear-sky ARIs averaged over East Asia were +0.02 to +1.34 W m−2 in summer in eastern Asia. Lu et al. (2020) showed daily-mean BC clear-sky ARIs were within the range of +1.37–4.89 W m−2 in Beijing. Our calculated daily-mean BC ARI in winter generally agrees with those previous studies. The daily-mean clear-sky BC ARI at the TOA in typical sites using different BC models is presented in Fig. 12. In winter, BC clear-sky ARI in typically polluted cities varies in the range of approximately +0.5–5.0 W m−2. At large fire sites, the daily mean BC clear-sky ARI exceeds +8.0 W m−2. Generally, with a more compact structure, BC presents a smaller clear-sky ARI at the TOA. The reason can be explained by the following. Fractal BC can more efficiently absorb than spherical BC, while the total scattering is not significantly modified. Thus, the fractal BC leads to a larger positive clear-sky ARI.
Table 1Time-averaged BC clear-sky ARI at different sites (W m−2).
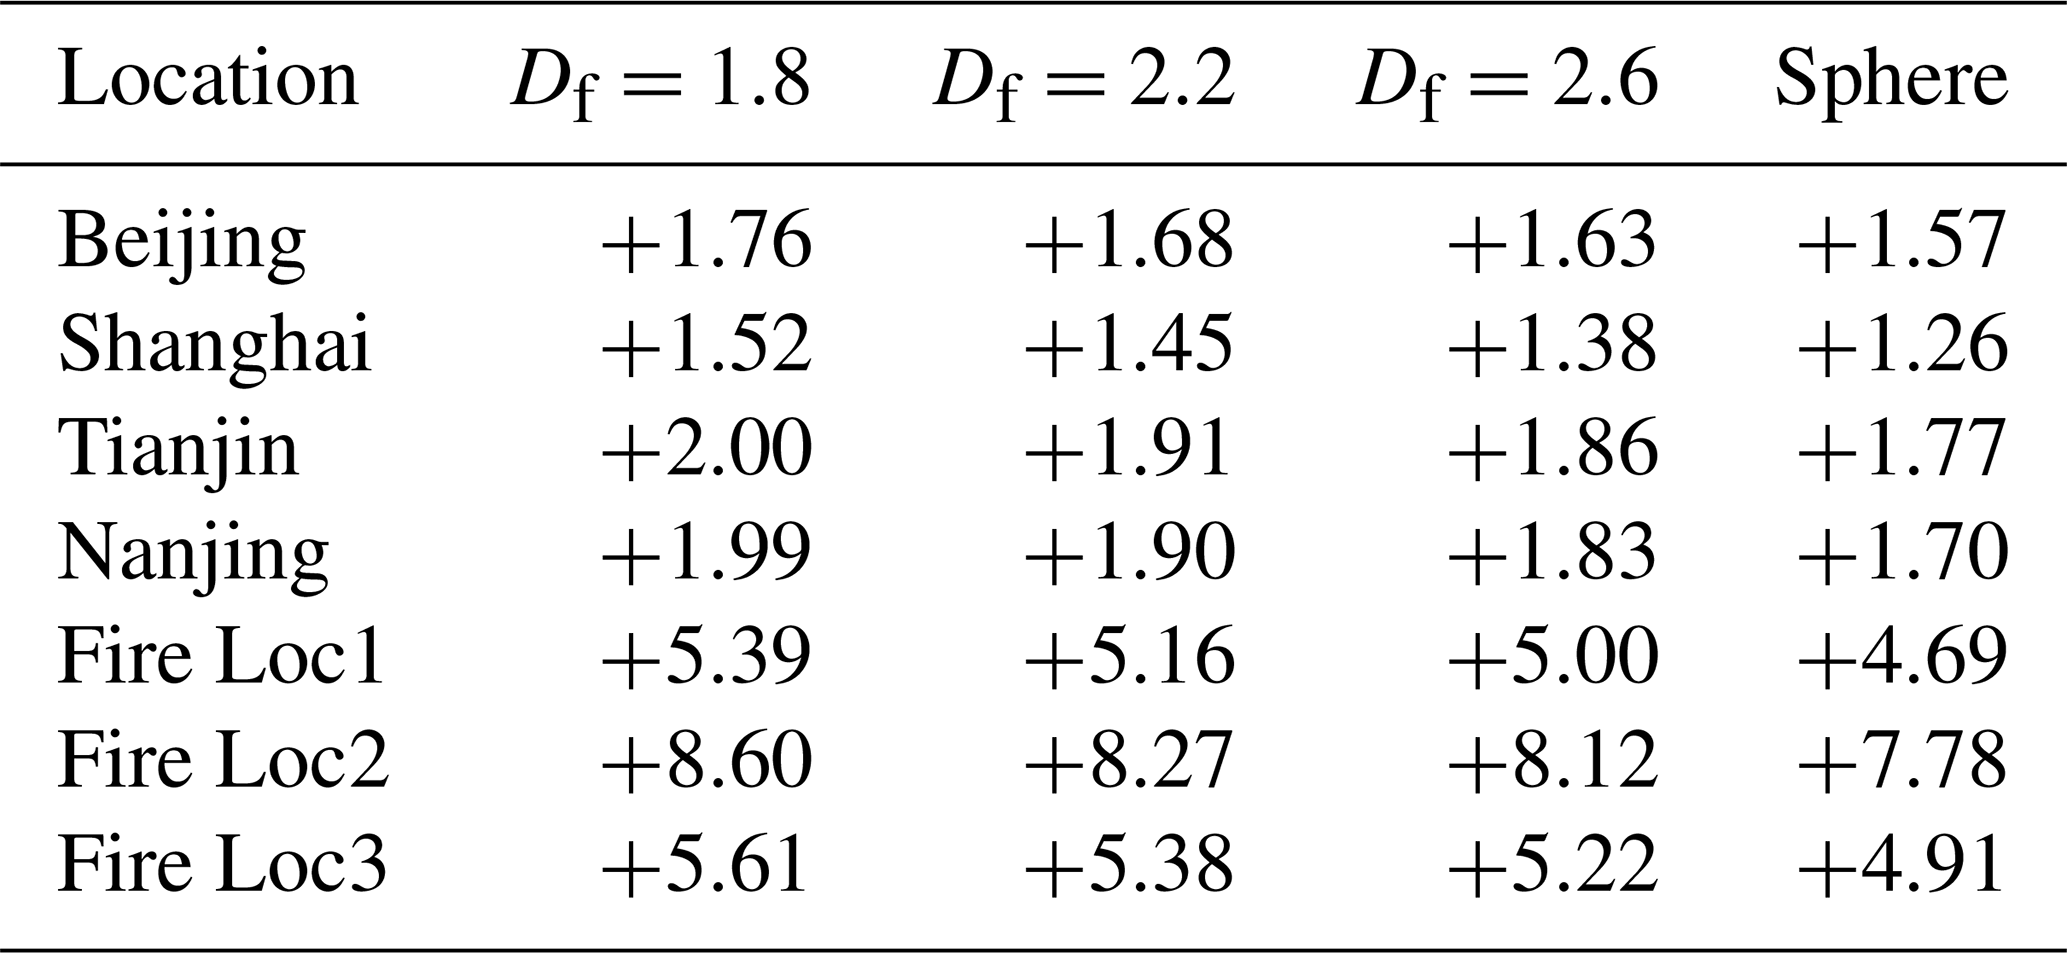
Table 2Time-averaged BC all-sky ARI at different sites (W m−2).

Table 1 shows the time-averaged BC clear-sky ARI (averaging BC clear-sky ARI over the simulation period) at typical polluted urban sites and fire sites. Using the spherical model, the time-averaged clear-sky ARI is +1.26–+1.77 W m−2 in typical polluted urban cities, while it increases to +1.52–+2.00 W m−2 using a fractal aggregate model with a Df of 1.8. The relative differences between the fractal model with a Df of 1.8 and spherical model ((fractal – sphere)/sphere) can reach approximately 12.1 %–20.6 % in typical urban cities. At fire sites, when modifying BC structure from a sphere to a fractal aggregate with a Df of 1.8, the time-averaged BC clear-sky ARI increases from +4.69–+7.78 W m−2 to +5.39–+8.60 W m−2, and the relative differences between the two models are 10.5 %–14.9 %. Lu et al. (2020) showed that BC shapes can introduce approximately 5 % relative uncertainties in eastern China using different measured BC profiles. However, our results show that much larger uncertainties can be introduced from BC morphologies. The reason is that Df=2.8 was assumed for BC aggregates in the study of Lu et al. (2020), which are close to spherical shape. This Df value is larger than the observed Df. Besides, due to different solar zenith angles, our results show the ARI uncertainties caused by BC morphologies may vary in different regions. Therefore, the BC morphological effects on the BC ARI should be carefully considered in different regions.
IPCC (2014) has reported a global mean BC all-sky ARI of +0.6 W m−2, while Wang et al. (2014) estimated a smaller all-sky ARI of +0.13 W m−2 based on the constraints from the mass and absorption observations. Tuccella et al. (2020) further showed that the global mean BC all-sky ARI is in the range of +0.13 and +0.25 W m−2. However, the BC all-sky ARI in some specific regions is relatively large. Based on in situ measurements, Lamb et al. (2018) have estimated the mean column all-sky BC ARI to be +0.48 to +2.01 W m−2 over South Korea. In Beijing, Sun et al. (2022) found that the mean BC all-sky ARI decreased from +3.36 W m−2 in 2012 to +1.09 W m−2 in 2020. The daily-mean all-sky ARIs in typical urban polluted cities in eastern China and fire sites in the northwest US are shown in Fig. 13. The daily-mean all-sky ARI estimated in this study generally varies in the range of approximately +0.2–+4.5 W m−2 in typical polluted cities. Table 2 shows the time-averaged BC all-sky ARI (averaging BC all-sky ARI over the simulation period) at different sites. The time-averaged all-sky ARIs are +1.67–+2.79 W m−2 in urban cities, and it is relatively high compared to the regional-mean all-sky ARI due to the high BC emissions. Our estimated BC all-sky ARI is generally in the range reported by Sun et al. (2022).

Figure 12The clear-sky BC ARI in the typical urban polluted cities in eastern China and fire sites in the northwest US calculated using different BC models.
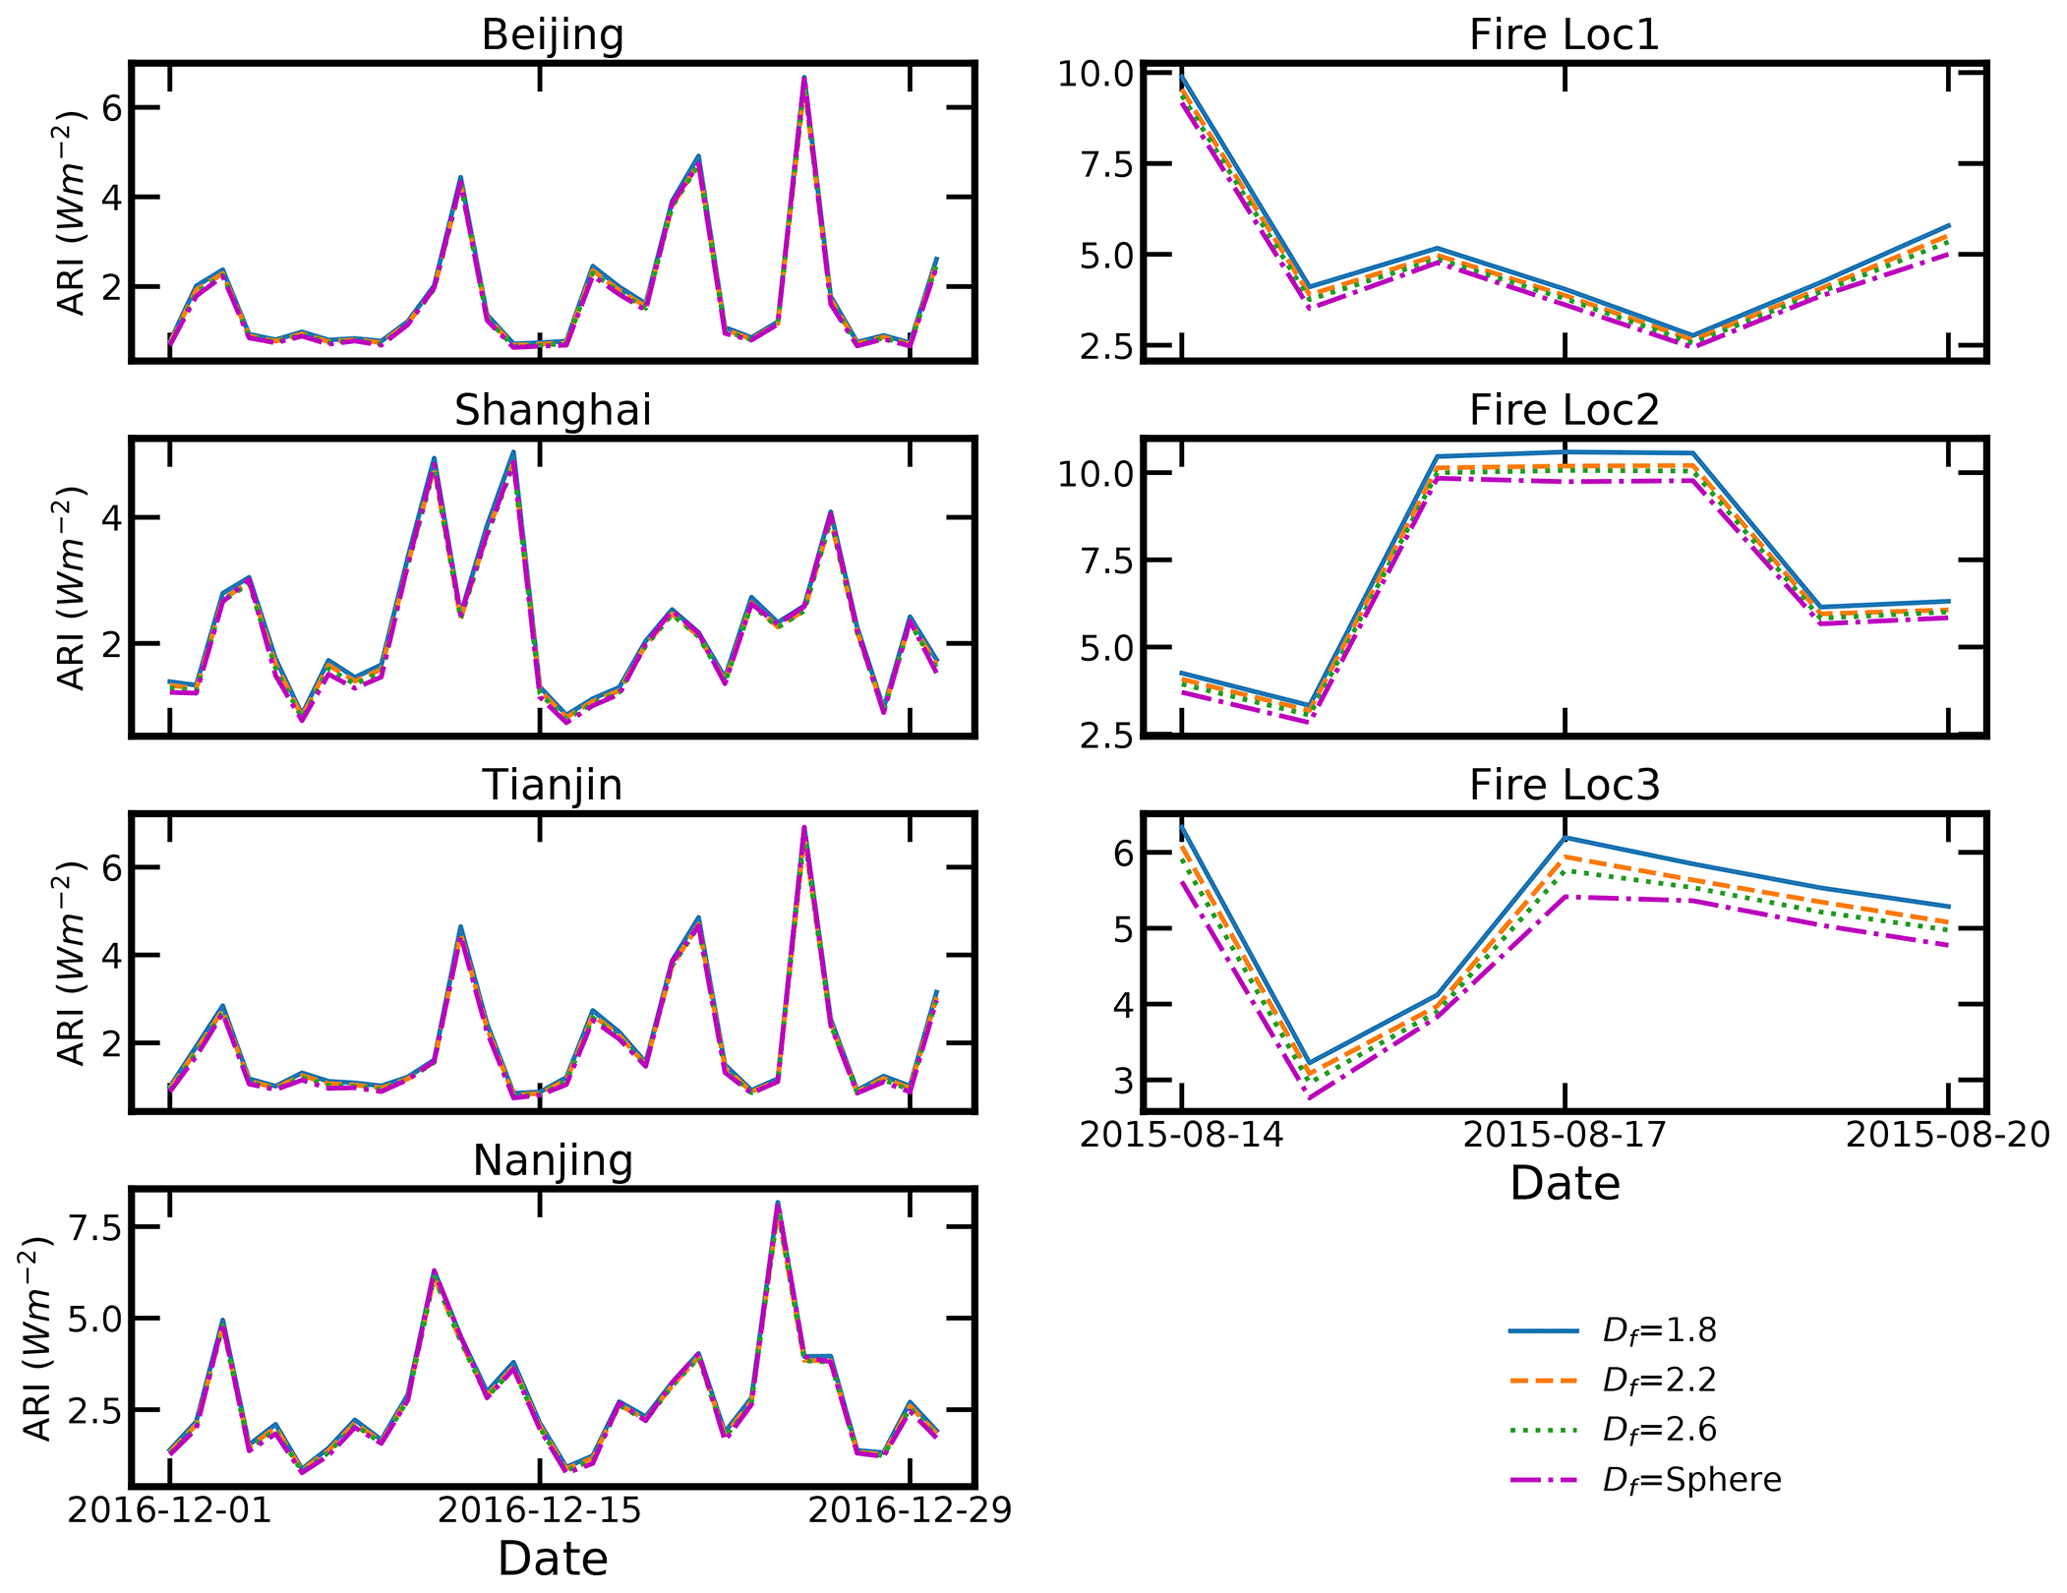
Figure 13The all-sky BC ARI in the typical urban polluted cities in eastern China and fire sites in the northwest US calculated using different BC models.
The differences in all-sky ARI between the fractal model and spherical model are smaller than those of clear-sky ARI in typical polluted cities in eastern China. The relative differences in the time-averaged all-sky ARI between the fractal model and the spherical model are below 6.5 % in typical polluted cities. The all-sky ARI at fire sites in the northwest US is smaller than the clear-sky ARI. The time-averaged all-sky ARIs are +4.62–+7.38 W m−2 at typical fire sites. The relative differences in the time-averaged all-sky ARI between the fractal model with a Df of 1.8 and the spherical model are 9.0 %–11.3 % at typical fire sites, which is relatively smaller than the differences for clear-sky ARI.

Figure 14The regional-mean BC ARI at the TOA in eastern China for different particle models.
The regional-mean ARIs are shown in Figs. 14–15. As shown in Fig. 14, the BC clear-sky ARI of exceeding +3.0 W m−2 is observed in eastern China. With a spherical BC model, the regional-mean clear-sky ARI in eastern China is estimated as +1.35 W m−2, and it agrees well with the reported regional-mean clear-sky ARI of +1.34 W m−2 in East Asia by Zhuang et al. (2019). BC morphologies also have a non-ignorable impact on the BC ARI. The regional-mean ARI deviations between the fractal model and spherical model are +0.23, +0.15 and +0.1 W m−2 when Df is 1.8, 2.2 and 2.6, respectively, and the relative differences are 17.1 %, 11.1 % and 7.4 %, respectively.
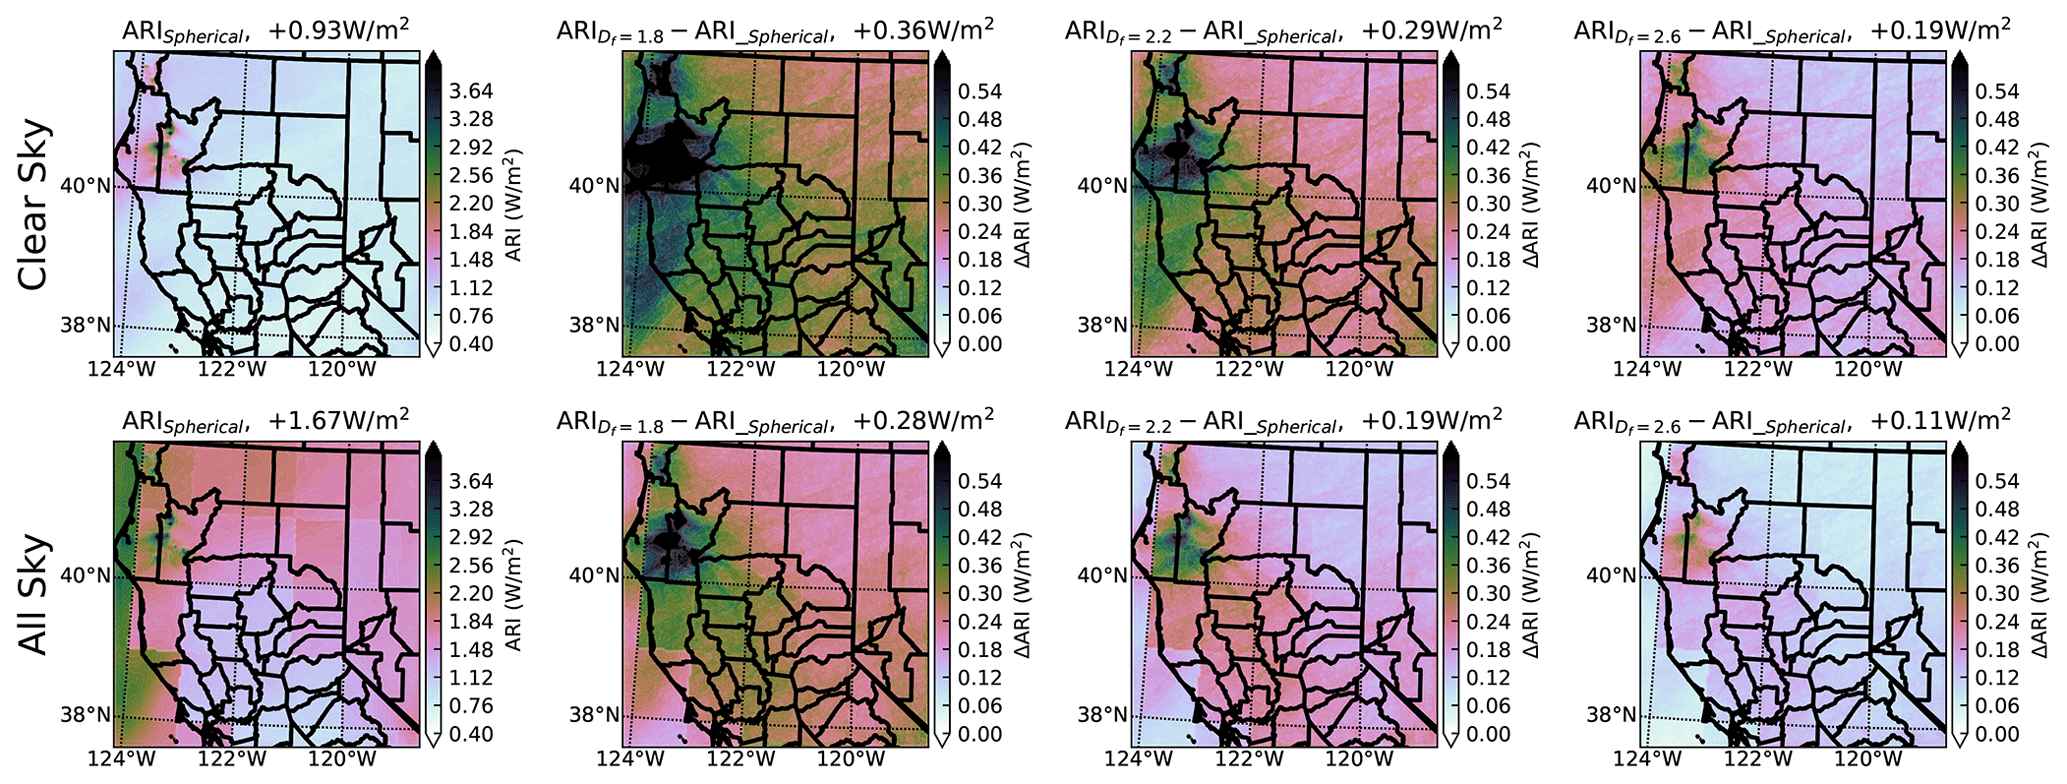
Figure 15Similar to Fig. 14, but for the northwest US.
The BC morphologies have a relatively small impact on the all-sky ARI. As shown in the lower panels of Fig. 14, the all-sky ARI is generally larger than the clear-sky ARI, while the deviations between the fractal model and spherical model are smaller compared to those for clear-sky ARI. The BC all-sky ARI can exceed +4.0 W m−2 in eastern China. A relatively larger regional-mean all-sky ARI is observed than clear-sky ARI, which is +1.79 W m−2 in eastern China when using the spherical model. The regional-mean all-sky ARI differences between the fractal model and spherical model are 0.13, 0.06 and 0.03 W m−2 when Df is 1.8, 2.2 and 2.6, respectively. The relative differences for all-sky ARI between the two models are less than 7.3 %.
The regional-mean clear-sky ARI in the fire region in the northwest US is shown in Fig. 15. The clear-sky ARI at the fire sites is obviously larger than the other sites. The BC clear-sky ARI exceeding +5.0 W m−2 is observed, and the regional-mean clear-sky ARI is +0.93 W m−2. The differences in regional-mean clear-sky ARI between the fractal model and the spherical model in the fire region in the northwest US are more substantial than those in eastern China, which reach approximately +0.36, +0.29 and +0.19 W m−2 when Df is 1.8, 2.2 and 2.6, respectively. The relative differences between the fractal model and spherical model are 38.7 %, 31.2 % and 20.4 % when Df is 1.8, 2.2 and 2.6, respectively. Smaller all-sky ARIs than clear-sky ARIs are observed at the sites where fire occurs, while the regional-mean all-sky ARI in the fire region in the northwest US is generally larger than clear-sky ARI, which is +1.67 W m−2. The differences between the two models are +0.28, +0.19 and +0.11 W m−2 when Df is 1.8, 2.2 and 2.6, respectively, and the relative differences are 16.8 %, 11.4 % and 6.6 %.
In current climate models, such as CESM, MIROC-SPRINTARS and WRF-Chem, the Mie theory was commonly used to calculate the optical properties of BC aerosols. However, fractal-like BC aerosols were often observed in the atmosphere. In this work, we found that the effects of BC morphology are spatially dependent. Compared to the spherical BC model, the fractal BC model generally presents a larger clear-sky ARI, which may lead to underestimations of BC ARI in the climate models. The relative differences in the time-averaged clear-sky ARI are 12.1 %–20.6 % and 10.5 %–14.9 % in typical polluted urban cities and fire sites, respectively. Furthermore, the regional-mean clear-sky ARI is also significantly affected by the BC morphology, and relative differences of 17.1 % and 38.7 % between the fractal model were observed in eastern China and in the northwest US, respectively, while the existence of cloud would weaken the BC morphological effects. The results imply that current climate modeling may significantly underestimate the BC ARI uncertainties as the morphological effects on BC ARI are ignored in most climate models.
However, this work is by no means exhaustive. This work assumed that BC aerosols are externally mixed with other chemical components, while BC aerosols are often internally mixed with other components, such as organic aerosols, sulfate, etc. (China et al., 2013; Adachi et al., 2010; Wang et al., 2021b). BC absorption can be significantly enhanced by the “lensing effect” even if BC aerosols are internally mixed with non-absorbing materials, which may lead to larger BC ARI (Chung et al., 2012; Liu et al., 2017). Previous studies have shown that the morphologies of internally mixed BC would significantly affect its absorption enhancement (Luo et al., 2019, 2021c; Wang et al., 2021a) and thus lead to larger uncertainties in the estimation of BC ARI. Thus, the sensitivities of BC morphologies to the ARI estimated in this work may be smaller than those in real cases.
Furthermore, we found that the spherical assumption generally underestimates the clear-sky ARI for externally mixed BC, while the opposite phenomenon may be found for internally mixed BC. A core–shell spherical morphology was widely used to represent the internally mixed BC. However, many partially coated BC aerosols exist in the atmosphere, while the core–shell spherical BC model commonly assumes the BC is fully embedded in a coating shell. The core–shell morphology may overestimate the absorption of partially coated BC (Wang et al., 2021a; Zhang et al., 2018) and thus overestimate the ARI. Thus, the ARI of internally mixed BC with complex morphologies should be further investigated in the future.
The current climate modeling commonly assumes a spherical morphology for BC, while the fractal structure is more realistic than the spherical morphology for externally mixed BC. In this work, we used the fractal model to re-evaluate the BC ARI in a typical polluted urban area in eastern China and a fire region in the northwest US. We found that BC morphologies have non-ignorable impacts on the aerosol optical properties. At 550 nm wavelength, the spherical BC model can overestimate the AOD up to 0.03 and 0.15 in typical polluted cities in China and fire sites in the US, respectively. The overestimations roughly account for 20 % of the total BC AOD. Besides, the spherical BC model underestimates BC AAOD at 450 nm up to 0.016 and 0.04 in typical polluted cities in China and fire sites in the US, respectively, compared to the fractal model with a Df of 1.8. The underestimations account for approximately 8 % of the total BC AAOD.
The morphological effects on both clear-sky and all-sky ARIs are evaluated. With a spherical BC model, the estimated time-averaged clear-sky ARI is generally in the range of +1.26–+1.77 W m−2 in typical urban polluted cities in eastern China, while this range increases to approximately +1.52–+2.00 W m−2 when using the fractal model with a Df of 1.8. The clear-sky ARI relative differences between the two models are approximately 12.1 %–20.6 % in typical urban polluted cities. At fire sites, when modifying BC structure from a sphere to a fractal aggregate, the time-averaged BC clear-sky ARI increases from +4.69–+7.78 W m−2 to +5.39–+8.60 W m−2 at typical fire sites. The relative differences between the two models are approximately 10.5 %–14.9 % at typical fire sites. The existence of clouds weakens the effects of BC morphologies on the ARI. The all-sky ARI relative differences between the fractal model and the spherical model are approximately 4.9 %–6.4 % and 9.0 %–11.3 % in typical urban polluted cities and typical fire sites, respectively, which is relatively smaller than those of clear-sky ARI.
The impacts of BC morphologies on the regional-mean ARI were also evaluated. The regional-mean clear-sky ARI was estimated as +1.35 W m−2 and +0.93 W m−2 in the polluted urban area and the fire region, respectively, using the spherical BC model. The regional-mean clear-sky ARI differences between the fractal model and the spherical model are approximately +0.23 and +0.36 W m−2 in these two regions, respectively, and the relative differences between the two models are approximately 17.1 % and 38.7 %, respectively. The all-sky ARI differences between the fractal model and the spherical model are relatively smaller. The relative differences in the regional-mean all-sky ARI between the fractal model and the spherical model are less than 7.3 % and 16.8 % in these two regions, respectively. Thus, the effects of BC morphologies on the ARI should be carefully considered in different regions.
The WRF-Chem is publicly available from https://ruc.noaa.gov/wrf/wrf-chem/ (last access: 30 April 2022; Wong et al., 2022). MSTM can be downloaded from https://www.eng.auburn.edu/~dmckwski/scatcodes/(last access: 30 April 2022, Mackowski, 2013). libRadtran is available from http://www.libradtran.org/doku.php(last access: 30 April 2022; ). FlexAOD can be requested from Gabriele Curci (http://pumpkin.aquila.infn.it/flexaod/, last access: 30 April 2022; Curci, 2022).
The look-up tables calculated in this work can be obtained from https://figshare.com/articles/dataset/Look_up_tables_zip/13096241 (last access: 30 April 2022; Luo, 2022). The PM2.5 data in China were obtained from https://www.aqistudy.cn/historydata/ (last access: 30 April 2022; Wang, 2022), and PM2.5 data in the northwest US can be found at https://www.epa.gov/outdoor-air-quality-data/download-daily-data (last access: 30 April 2022; EPA, 2022).
The supplement related to this article is available online at: https://doi.org/10.5194/acp-22-7647-2022-supplement.
JL and QXZ conceived the presented idea. JL developed the models, performed the computations, and wrote the paper. ZQL, CZ, YMZ, RKC, YZ verified the simulation methods and results. QXZ revised the paper and supervised the findings of this work. GC developed the FlexAOD model. All authors discussed the results and contributed to the final paper.
The contact author has declared that neither they nor their co-authors have any competing interests.
Publisher’s note: Copernicus Publications remains neutral with regard to jurisdictional claims in published maps and institutional affiliations.
The authors thank Daniel W. Mackowski and Michael I. Mishchenko for making the MSTM code publicly available. We also thank the libRadtran and WRF-Chem developer group for making their code publicly available. We also thank the two anonymous reviewers for their constructive suggestions. CZ would like to acknowledge the partial support from the McDonnell International Scholars Academy at Washington University in St. Louis.
This research has been supported by the National Natural Science Foundation of China (grant no. 41925019), the National Key Research and Development Program of China (grant no. 2021YFC3000300), the University of Science and Technology of China (grant no. WK2320000052), the National Science Foundation (grant no. AGS-1926817), and the National Aeronautics and Space Administration (grant no. NNH20ZDA001N-ACCDAM).
This paper was edited by Toshihiko Takemura and reviewed by two anonymous referees.
Ackermann, I. J., Hass, H., Memmesheimer, M., Ebel, A., Binkowski, F. S., and Shankar, U.: Modal aerosol dynamics model for Europe: Development and first applications, Atmos. Environ., 32, 2981–2999, 1998. a
Adachi, K., Chung, S. H., and Buseck, P. R.: Shapes of soot aerosol particles and implications for their effects on climate, J. Geophys. Res.-Atmos., 115, D15206, https://doi.org/10.1029/2009JD012868, 2010. a, b, c, d
Adachi, K., Zaizen, Y., Kajino, M., and Igarashi, Y.: Mixing state of regionally transported soot particles and the coating effect on their size and shape at a mountain site in Japan, J. Geophys. Res.-Atmos., 119, 5386–5396, https://doi.org/10.1002/2013JD020880, 2014. a
Alexander, D. T., Crozier, P. A., and Anderson, J. R.: Brown carbon spheres in East Asian outflow and their optical properties, Science, 321, 833–836, 2008. a
Bond, T. C. and Bergstrom, R. W.: Light absorption by carbonaceous particles: An investigative review, Aerosol Sci. Technol., 40, 27–67, 2006. a, b, c
Bond, T. C., Doherty, S. J., Fahey, D. W., Forster, P. M., Berntsen, T., DeAngelo, B. J., Flanner, M. G., Ghan, S., Karcher, B., Koch, D., Kinne, S., Kondo, Y., Quinn, P. K., Sarofim, M. C., Schultz, M. G., Schulz, M., Venkataraman, C., Zhang, H., Zhang, S., Bellouin, N., Guttikunda, S. K., Hopke, P. K., Jacobson, M. Z., Kaiser, J. W., Klimont, Z., Lohmann, U., Schwarz, J. P., Shindell, D., Storelvmo, T., Warren, S. G., and Zender, C. S.: Bounding the role of black carbon in the climate system: A scientific assessment, J. Geophys. Res.-Atmos., 118, 5380–5552, https://doi.org/10.1002/jgrd.50171, 2013. a
Buras, R., Dowling, T., and Emde, C.: New secondary-scattering correction in DISORT with increased efficiency for forward scattering, J. Quant. Spectrosc. Ra. Transf., 112, 2028–2034, 2011. a
Buseck, S. E. and Buseck, P. R.: Absorbing phenomena (vol 288, pg 989, 2000), Science, 289, 58–58, 2000. a
Chakrabarty, R. K., Moosmuller, H., Garro, M. A., Arnott, W. P., Walker, J., Susott, R. A., Babbitt, R. E., Wold, C. E., Lincoln, E. N., and Hao, W. M.: Emissions from the laboratory combustion of wildland fuels: Particle morphology and size, J. Geophys. Res.-Atmos., 111, D07204, https://doi.org/10.1029/2005JD006659, 2006. a, b
Chakrabarty, R. K., Moosmüller, H., Arnott, W. P., Garro, M. A., Slowik, J. G., Cross, E. S., Han, J.-H., Davidovits, P., Onasch, T. B., and Worsnop, D. R.: Light scattering and absorption by fractal-like carbonaceous chain aggregates: Comparison of theories and experiment, Appl. Opt., 46, 6990–7006, 2007. a
Chang, H.-C. and Charalampopoulos, T.: Determination of the wavelength dependence of refractive indices of flame soot, P. Roy. Soc. London A, 430, 577–591, 1990. a
Chen, C., Fan, X., Shaltout, T., Qiu, C., Ma, Y., Goldman, A., and Khalizov, A. F.: An unexpected restructuring of combustion soot aggregates by subnanometer coatings of polycyclic aromatic hydrocarbons, Geophys. Res. Lett., 43, 11080–11088, https://doi.org/10.1002/2016GL070877, 2016. a
Chin, M., Ginoux, P., Kinne, S., Torres, O., Holben, B. N., Duncan, B. N., Martin, R. V., Logan, J. A., Higurashi, A., and Nakajima, T.: Tropospheric Aerosol Optical Thickness from the GOCART Model and Comparisons with Satellite and Sun Photometer Measurements, J. Atmos. Sci., 59, 461–483, https://doi.org/10.1175/1520-0469(2002)059<0461:TAOTFT>2.0.CO;2, 2002. a
China, S., Mazzoleni, C., Gorkowski, K., Aiken, A. C., and Dubey, M. K.: Morphology and mixing state of individual freshly emitted wildfire carbonaceous particles, Nat. Commun., 4, 2122, https://doi.org/10.1038/ncomms3122, 2013. a, b
Chung, C., Lee, K., and Mu'́uller, D.: Effect of internal mixture on black carbon radiative forcing, Tellus B, 64, 10925, https://doi.org/10.3402/tellusb.v64i0.10925, 2012. a
Coz, E. and Leck, C.: Morphology and state of mixture of atmospheric soot aggregates during the winter season over Southern Asia-a quantitative approach, Tellus B, 63, 107–116, 2011. a
Cross, E. S., Slowik, J. G., Davidovits, P., Allan, J. D., Worsnop, D. R., Jayne, J. T., Lewis, D. K., Canagaratna, M., and Onasch, T. B.: Laboratory and ambient particle density determinations using light scattering in conjunction with aerosol mass spectrometry, Aerosol Sci. Technol., 41, 343–359, 2007. a
Curci, G.: FlexAOD: A chemistry-transport model post-processing tool for a flexible calculation of aerosol optical properties, in: Proceedings of the 9th International Symposium on Tropospheric Profiling, L'Aquila, Italy, September 2012, 978–90 pp., 2012. a, b, c, d
Curci, G.: FlexAOD: A post-processing tool for Aerosol Optical Properties calculations, Italian Space Agency [code], http://pumpkin.aquila.infn.it/flexaod/, last access: 30 April 2022. a
Curci, G., Hogrefe, C., Bianconi, R., Im, U., Balzarini, A., Baró, R., Brunner, D., Forkel, R., Giordano, L., Hirtl, M., Honzak, L., Jiménez-Guerrero, P., Knote, C., Langer, M., Makar, P., Pirovano, G., Pérez, J., San José, R., Syrakov, D., Tuccella, P., Werhahn, J., Wolke, R., Žabkar, R., Zhang, J., and Galmarini, S.: Uncertainties of simulated aerosol optical properties induced by assumptions on aerosol physical and chemical properties: An AQMEII-2 perspective, Atmos. Environ., 115, 541–552, 2015. a
Curci, G., Alyuz, U., Barò, R., Bianconi, R., Bieser, J., Christensen, J. H., Colette, A., Farrow, A., Francis, X., Jiménez-Guerrero, P., Im, U., Liu, P., Manders, A., Palacios-Peña, L., Prank, M., Pozzoli, L., Sokhi, R., Solazzo, E., Tuccella, P., Unal, A., Vivanco, M. G., Hogrefe, C., and Galmarini, S.: Modelling black carbon absorption of solar radiation: combining external and internal mixing assumptions, Atmos. Chem. Phys., 19, 181–204, https://doi.org/10.5194/acp-19-181-2019, 2019. a
Danabasoglu, G., Lamarque, J.-F., Bacmeister, J., Bailey, D. A., DuVivier, A. K., Edwards, J., Emmons, L. K., Fasullo, J., Garcia, R., Gettelman, A., Hannay, C., Holland, M. M., Large, W. G., Lauritzen, P. H., Lawrence, D. M., Lenaerts, J. T. M., Lindsay, K., Lipscomb, W. H., Mills, M. J., Neale, R., Oleson, K. W., Otto-Bliesner, B., Phillips, A. S., Sacks, W., Tilmes, S., van Kampenhout, L., Vertenstein, M., Bertini, A., Dennis, J., Deser, C., Fischer, C., Fox-Kemper, B., Kay, J. E., Kinnison, D., Kushner, P. J., Larson, V. E., Long, M. C., Mickelson, S., Moore, J. K., Nienhouse, E., Polvani, L., Rasch, P. J., and Strand, W. G.: The Community Earth System Model Version 2 (CESM2), J. Adv. Model. Earth Syst., 12, e2019MS001916, https://doi.org/10.1029/2019MS001916, 2020. a
Dentener, F., Kinne, S., Bond, T., Boucher, O., Cofala, J., Generoso, S., Ginoux, P., Gong, S., Hoelzemann, J. J., Ito, A., Marelli, L., Penner, J. E., Putaud, J.-P., Textor, C., Schulz, M., van der Werf, G. R., and Wilson, J.: Emissions of primary aerosol and precursor gases in the years 2000 and 1750 prescribed data-sets for AeroCom, Atmos. Chem. Phys., 6, 4321–4344, https://doi.org/10.5194/acp-6-4321-2006, 2006. a
Eggersdorfer, M. L. and Pratsinis, S. E.: The structure of agglomerates consisting of polydisperse particles, Aerosol Sci. Technol., 46, 347–353, 2012. a
Emmons, L. K., Walters, S., Hess, P. G., Lamarque, J.-F., Pfister, G. G., Fillmore, D., Granier, C., Guenther, A., Kinnison, D., Laepple, T., Orlando, J., Tie, X., Tyndall, G., Wiedinmyer, C., Baughcum, S. L., and Kloster, S.: Description and evaluation of the Model for Ozone and Related chemical Tracers, version 4 (MOZART-4), Geosci. Model Dev., 3, 43–67, https://doi.org/10.5194/gmd-3-43-2010, 2010. a
Fast, J. D., Gustafson Jr., W. I., Easter, R. C., Zaveri, R. A., Barnard, J. C., Chapman, E. G., Grell, G. A., and Peckham, S. E.: Evolution of ozone, particulates, and aerosol direct radiative forcing in the vicinity of Houston using a fully coupled meteorology-chemistry-aerosol model, J. Geophys. Res.-Atmos., 111, D21305, https://doi.org/10.1029/2005JD006721, 2006. a
Grell, G. A., Peckham, S. E., Schmitz, R., McKeen, S. A., Frost, G., Skamarock, W. C., and Eder, B.: Fully coupled ”online” chemistry within the WRF model, Atmos. Environ., 39, 6957–6975, https://doi.org/10.1016/j.atmosenv.2005.04.027, 2005. a
Guenther, A., Zimmerman, P., and Wildermuth, M.: Natural volatile organic compound emission rate estimates for US woodland landscapes, Atmos. Environ., 28, 1197–1210, 1994. a
Guenther, A., Karl, T., Harley, P., Wiedinmyer, C., Palmer, P. I., and Geron, C.: Estimates of global terrestrial isoprene emissions using MEGAN (Model of Emissions of Gases and Aerosols from Nature), Atmos. Chem. Phys., 6, 3181–3210, https://doi.org/10.5194/acp-6-3181-2006, 2006. a
He, C., Liou, K.-N., Takano, Y., Zhang, R., Levy Zamora, M., Yang, P., Li, Q., and Leung, L. R.: Variation of the radiative properties during black carbon aging: theoretical and experimental intercomparison, Atmos. Chem. Phys., 15, 11967–11980, https://doi.org/10.5194/acp-15-11967-2015, 2015. a
He, C., Li, Q., Liou, K.-N., Qi, L., Tao, S., and Schwarz, J. P.: Microphysics-based black carbon aging in a global CTM: constraints from HIPPO observations and implications for global black carbon budget, Atmos. Chem. Phys., 16, 3077–3098, https://doi.org/10.5194/acp-16-3077-2016, 2016. a
Heinson, W. R., Sorensen, C. M., and Chakrabarti, A.: Does Shape Anisotropy Control the Fractal Dimension in Diffusion-Limited Cluster-Cluster Aggregation?, Aerosol Sci. Technol., 44, i–iv, https://doi.org/10.1080/02786826.2010.516032, 2010. a
Heinson, W. R., Liu, P., and Chakrabarty, R. K.: Fractal scaling of coated soot aggregates, Aerosol Sci. Technol., 51, 12–19, https://doi.org/10.1080/02786826.2016.1249786, 2017. a
Hess, M., Koepke, P., and Schult, I.: ”Optical Properties of Aerosols and Clouds: The Software Package OPAC”, B. Am. Meteorol. Soc., 79, 831–844, https://doi.org/10.1175/1520-0477(1998)079<0831:OPOAAC>2.0.CO;2, 1998. a, b
Highwood, E. J.: Suggested Refractive Indices and Aerosol Size Parameters for Use in Radiative Effect Calculations and Satellite Retrievals, ADIENT/APPRAISE CP2 Technical Report, DRAFT V2 (5 August 2009), http://www.met.rdg.ac.uk/~adient/refractiveindices.html (last access: 3 January 2019), 2009. a
IPCC: Climate change 2013: the physical science basis: Working Group I contribution to the Fifth assessment report of the Intergovernmental Panel on Climate Change, Cambridge University Press, ISBN:978-92-9169-138-8, 1–1535 pp., 2014. a, b, c
Kahnert, M.: On the Discrepancy between Modeled and Measured Mass Absorption Cross Sections of Light Absorbing Carbon Aerosols, Aerosol Sci. Technol., 44, 453–460, 2010a. a, b
Kahnert, M.: Modelling the optical and radiative properties of freshly emitted light absorbing carbon within an atmospheric chemical transport model, Atmos. Chem. Phys., 10, 1403–1416, https://doi.org/10.5194/acp-10-1403-2010, 2010b. a
Kahnert, M. and Devasthale, A.: Black carbon fractal morphology and short-wave radiative impact: a modelling study, Atmos. Chem. Phys., 11, 11745–11759, https://doi.org/10.5194/acp-11-11745-2011, 2011. a, b, c
Kahnert, M. and Kanngießer, F.: Modelling optical properties of atmospheric black carbon aerosols, J. Quant. Spectrosc. Ra. Transf., 244, 106849, https://doi.org/10.1016/j.jqsrt.2020.106849, 2020. a
Köylü, Ü. and Faeth, G.: Structure of overfire soot in buoyant turbulent diffusion flames at long residence times, Combust. Flame, 89, 140–156, https://doi.org/10.1016/0010-2180(92)90024-J, 1992. a
Lack, D. A. and Cappa, C. D.: Impact of brown and clear carbon on light absorption enhancement, single scatter albedo and absorption wavelength dependence of black carbon, Atmos. Chem. Phys., 10, 4207–4220, https://doi.org/10.5194/acp-10-4207-2010, 2010. a
Lamb, K. D., Perring, A. E., Samset, B., Peterson, D., Davis, S., Anderson, B. E., Beyersdorf, A., Blake, D. R., Campuzano-Jost, P., Corr, C. A., Diskin, G. S., Kondo, Y., Moteki, N., Nault, B. A., Oh, J., Park, M., Pusede, S. E., Simpson, I. J., Thornhill, K. L., Wisthaler, A., and Schwarz, J. P.: Estimating Source Region Influences on Black Carbon Abundance, Microphysics, and Radiative Effect Observed Over South Korea, J. Geophys. Res.-Atmos., 123, 13527–13548, https://doi.org/10.1029/2018JD029257, 2018. a
Lee, K. O., Cole, R., Sekar, R., Choi, M. Y., Kang, J. S., Bae, C. S., and Shin, H. D.: Morphological investigation of the microstructure, dimensions, and fractal geometry of diesel particulates, Proc. Combust. Inst., 29, 647–653, https://doi.org/10.1016/S1540-7489(02)80083-9, 2002. a
Li, J., Anderson, J. R., and Buseck, P. R.: TEM study of aerosol particles from clean and polluted marine boundary layers over the North Atlantic, J. Geophys. Res.-Atmos., 108, 4189, https://doi.org/10.1029/2002JD002106, 2003. a
Li, M., Zhang, Q., Streets, D. G., He, K. B., Cheng, Y. F., Emmons, L. K., Huo, H., Kang, S. C., Lu, Z., Shao, M., Su, H., Yu, X., and Zhang, Y.: Mapping Asian anthropogenic emissions of non-methane volatile organic compounds to multiple chemical mechanisms, Atmos. Chem. Phys., 14, 5617–5638, https://doi.org/10.5194/acp-14-5617-2014, 2014. a
Li, M., Zhang, Q., Kurokawa, J.-I., Woo, J.-H., He, K., Lu, Z., Ohara, T., Song, Y., Streets, D. G., Carmichael, G. R., Cheng, Y., Hong, C., Huo, H., Jiang, X., Kang, S., Liu, F., Su, H., and Zheng, B.: MIX: a mosaic Asian anthropogenic emission inventory under the international collaboration framework of the MICS-Asia and HTAP, Atmos. Chem. Phys., 17, 935–963, https://doi.org/10.5194/acp-17-935-2017, 2017. a, b
Liu, C., Yin, Y., Hu, F., Jin, H., and Sorensen, C. M.: The Effects of Monomer Size Distribution on the Radiative Properties of Black Carbon Aggregates, Aerosol Sci. Technol., 49, 928–940, https://doi.org/10.1080/02786826.2015.1085953, 2015. a
Liu, C., Chung, C. E., Yin, Y., and Schnaiter, M.: The absorption Ångström exponent of black carbon: from numerical aspects, Atmos. Chem. Phys., 18, 6259–6273, https://doi.org/10.5194/acp-18-6259-2018, 2018. a, b
Liu, D., Whitehead, J., Alfarra, M. R., Reyes-Villegas, E., Spracklen, D. V., Reddington, C., Kong, S., Williams, P., Ting, Y.-C., Haslett, S., Taylor, J., Flynn, M. J., Morgan, W., McFiggans, G., Coe, H., and Allan, J.: Black-carbon absorption enhancement in the atmosphere determined by particle mixing state, Nat. Geosci., 10, 184–188, https://doi.org/10.1038/ngeo2901, 2017. a, b
Liu, F., Zhang, Q., Tong, D., Zheng, B., Li, M., Huo, H., and He, K. B.: High-resolution inventory of technologies, activities, and emissions of coal-fired power plants in China from 1990 to 2010, Atmos. Chem. Phys., 15, 13299–13317, https://doi.org/10.5194/acp-15-13299-2015, 2015. a
Liu, L. and Mishchenko, M. I.: Effects of aggregation on scattering and radiative properties of soot aerosols, J. Geophys. Res.-Atmos., 110, D11211, https://doi.org/10.1029/2004JD005649, 2005. a, b, c, d
Lu, Q., Liu, C., Zhao, D., Zeng, C., Li, J., Lu, C., Wang, J., and Zhu, B.: Atmospheric heating rate due to black carbon aerosols: Uncertainties and impact factors, Atmos. Res., 240, 104891, https://doi.org/10.1016/j.atmosres.2020.104891, 2020. a, b, c
Luo, J.: Look_up_tables.zip, figshare [data set], https://figshare.com/articles/dataset/Look_up_tables_zip/13096241, last access: 30 April 2022. a
Luo, J., Zhang, Y., Wang, F., Wang, J., and Zhang, Q.: Applying machine learning to estimate the optical properties of black carbon fractal aggregates, J. Quant. Spectrosc. Ra. Transf., 215, 1–8, https://doi.org/10.1016/j.jqsrt.2018.05.002, 2018a. a
Luo, J., Zhang, Y., Wang, F., and Zhang, Q.: Effects of brown coatings on the absorption enhancement of black carbon: a numerical investigation, Atmos. Chem. Phys., 18, 16897–16914, https://doi.org/10.5194/acp-18-16897-2018, 2018b. a
Luo, J., Zhang, Y., and Zhang, Q.: A model study of aggregates composed of spherical soot monomers with an acentric carbon shell, J. Quant. Spectrosc. Ra. Transf., 205, 184–195, https://doi.org/10.1016/j.jqsrt.2017.10.024, 2018c. a
Luo, J., Zhang, Y. M., Zhang, Q. X., Wang, F., Liu, J., and Wang, J. J.: Sensitivity analysis of morphology on radiative properties of soot aerosols, Opt. Express, 26, A420–A432, 2018d. a
Luo, J., Zhang, Q., Luo, J., Liu, J., Huo, Y., and Zhang, Y.: Optical Modeling of Black Carbon With Different Coating Materials: The Effect of Coating Configurations, J. Geophys. Res.-Atmos., 124, 13230–13253, https://doi.org/10.1029/2019JD031701, 2019. a, b
Luo, J., Zhang, Q., Zhang, C., Zhang, Y., and Chakrabarty, R. K.: The fractal characteristics of atmospheric coated soot: Implication for morphological analysis, J. Aerosol Sci., 157, 105804, https://doi.org/10.1016/j.jaerosci.2021.105804, 2021a. a
Luo, J., Zhang, Q., Zhang, Y., and Li, Z.: Radiative Properties of Non-spherical Black Carbon Aerosols, pp. 69–124, Springer International Publishing, Cham, https://doi.org/10.1007/978-3-030-87683-8_3, 2021b. a
Luo, J., Zhang, Y., and Zhang, Q.: Effects of black carbon morphology on brown carbon absorption estimation: from numerical aspects, Geosci. Model Dev., 14, 2113–2126, https://doi.org/10.5194/gmd-14-2113-2021, 2021c. a
Mackowski, D. W.: MSTM Version 3.0: April 2013, MSTM [code], available at: http://www.eng.auburn.edu/~dmckwski/scatcodes/ (last access: 30 April 2022), 2013. a
Mackowski, D. W. and Mishchenko, M. I.: Calculation of the T matrix and the scattering matrix for ensembles of spheres, J. Opt. Soc. Am. A, 13, 2266–2278, 1996. a
Mackowski, D. W. and Mishchenko, M. I.: A multiple sphere T-matrix Fortran code for use on parallel computer clusters, J. Quant. Spectrosc. Ra. Transf., 112, 2182–2192, 2011. a
Martin, R. V., Jacob, D. J., Yantosca, R. M., Chin, M., and Ginoux, P.: Global and regional decreases in tropospheric oxidants from photochemical effects of aerosols, J. Geophys. Res.-Atmos., 108, 4097, https://doi.org/10.1029/2002JD002622, 2003. a
Mayer, B. and Kylling, A.: Technical note: The libRadtran software package for radiative transfer calculations – description and examples of use, Atmos. Chem. Phys., 5, 1855–1877, https://doi.org/10.5194/acp-5-1855-2005, 2005. a, b
Mayer, B., Emde, C., Gasteiger, J., and Kylling, A.: libRadtran, libRadtran [code], http://www.libradtran.org/doku.php, last access: 30 April 2022.
Mikhailov, E., Vlasenko, S., Podgorny, I., Ramanathan, V., and Corrigan, C.: Optical properties of soot–water drop agglomerates: An experimental study, J. Geophys. Res.-Atmos., 111, D07209, https://doi.org/10.1029/2005JD006389, 2006. a
Mishchenko, M. I., Dlugach, J. M., Yanovitskij, E. G., and Zakharova, N. T.: Bidirectional reflectance of flat, optically thick particulate layers: an efficient radiative transfer solution and applications to snow and soil surfaces, J. Quant. Spectrosc. Ra. Transf., 63, 409–432, 1999. a
Mishchenko, M. I., Travis, L. D., and Lacis, A. A.: Scattering, absorption, and emission of light by small particles, Cambridge University Press, Cambridge, 1–359, ISBN 9780521782524, 2002. a
Mishchenko, M. I., Dlugach, J. M., and Liu, L.: Linear depolarization of lidar returns by aged smoke particles, Appl. Opt., 55, 9968–9973, 2016a. a
Mishchenko, M. I., Dlugach, J. M., Yurkin, M. A., Bi, L., Cairns, B., Liu, L., Panetta, R. L., Travis, L. D., Yang, P., and Zakharova, N. T.: First-principles modeling of electromagnetic scattering by discrete and discretely heterogeneous random media, Phys. Rep., 632, 1–75, https://doi.org/10.1016/j.physrep.2016.04.002, 2016b. a
Moosmüller, H., Chakrabarty, R., and Arnott, W.: Aerosol light absorption and its measurement: A review, J. Quant. Spectrosc. Ra. Transf., 110, 844–878, 2009. a
Nakao, S., Tang, P., Tang, X., Clark, C. H., Qi, L., Seo, E., Asa-Awuku, A., and Cocker III, D.: Density and elemental ratios of secondary organic aerosol: Application of a density prediction method, Atmos. Environ., 68, 273–277, 2013. a
Rajesh, T. and Ramachandran, S.: Black carbon aerosols over urban and high altitude remote regions: Characteristics and radiative implications, Atmos. Environ., 194, 110–122, 2018. a
Reddington, C. L., McMeeking, G., Mann, G. W., Coe, H., Frontoso, M. G., Liu, D., Flynn, M., Spracklen, D. V., and Carslaw, K. S.: The mass and number size distributions of black carbon aerosol over Europe, Atmos. Chem. Phys., 13, 4917–4939, https://doi.org/10.5194/acp-13-4917-2013, 2013. a
Saleh, R., Marks, M., Heo, J., Adams, P. J., Donahue, N. M., and Robinson, A. L.: Contribution of brown carbon and lensing to the direct radiative effect of carbonaceous aerosols from biomass and biofuel burning emissions, J. Geophys. Res.-Atmos., 120, 10285–10296, https://doi.org/10.1002/2015JD023697, 2015. a, b
Schwarz, J. P., Gao, R. S., Spackman, J. R., Watts, L. A., Thomson, D. S., Fahey, D. W., Ryerson, T. B., Peischl, J., Holloway, J. S., Trainer, M., Frost, G. J., Baynard, T., Lack, D. A., de Gouw, J. A., Warneke, C., and Del Negro, L. A.: Measurement of the mixing state, mass, and optical size of individual black carbon particles in urban and biomass burning emissions, Geophys. Res. Lett., 35, L13810, https://doi.org/10.1029/2008GL033968, 2008. a
Seinfeld, J. H., Erdakos, G. B., Asher, W. E., and Pankow, J. F.: Modeling the formation of secondary organic aerosol (SOA). 2. The predicted effects of relative humidity on aerosol formation in the α-pinene-, β-pinene-, sabinene-, Δ3-carene-, and cyclohexene-ozone systems, Environ. Sci. Technol., 35, 1806–1817, 2001. a
Shaheen, K., Shah, Z., Suo, H. L., Liu, M., Ma, L., Alam, K., Gul, A., Cui, J., Li, C. Y., Wang, Y., Khan, S. A., and Khan, S. B.: Aerosol clustering in an urban environment of Beijing during (2005-2017), Atmos. Environ., 213, 534–547, https://doi.org/10.1016/j.atmosenv.2019.06.027, 2019. a
Shin, S.-K., Tesche, M., Müller, D., and Noh, Y.: Technical note: Absorption aerosol optical depth components from AERONET observations of mixed dust plumes, Atmos. Meas. Tech., 12, 607–618, https://doi.org/10.5194/amt-12-607-2019, 2019a. a
Shin, S.-K., Tesche, M., Noh, Y., and Müller, D.: Aerosol-type classification based on AERONET version 3 inversion products, Atmos. Meas. Tech., 12, 3789–3803, https://doi.org/10.5194/amt-12-3789-2019, 2019b. a
Sorensen, C.: The mobility of fractal aggregates: a review, Aerosol Sci. Technol., 45, 765–779, 2011. a
Stamnes, K., Tsay, S.-C., Wiscombe, W., and Jayaweera, K.: Numerically stable algorithm for discrete-ordinate-method radiative transfer in multiple scattering and emitting layered media, Appl. Opt., 27, 2502–2509, 1988. a
Stockwell, W. R., Middleton, P., Chang, J. S., and Tang, X.: The second generation regional acid deposition model chemical mechanism for regional air quality modeling, J. Geophys. Res.-Atmos., 95, 16343–16367, https://doi.org/10.1029/JD095iD10p16343, 1990. a
Streets, D. G., Gupta, S., Waldhoff, S. T., Wang, M. Q., Bond, T. C., and Yiyun, B.: Black carbon emissions in China, Atmos. Environ., 35, 4281–4296, https://doi.org/10.1016/S1352-2310(01)00179-0, 2001. a
Streets, D. G., Wu, Y., and Chin, M.: Two-decadal aerosol trends as a likely explanation of the global dimming/brightening transition, Geophys. Res. Lett., 33, L15806, https://doi.org/10.1029/2006GL026471, 2006. a
Sun, J., Wang, Z., Zhou, W., Xie, C., Wu, C., Chen, C., Han, T., Wang, Q., Li, Z., Li, J., Fu, P., Wang, Z., and Sun, Y.: Measurement report: Long-term changes in black carbon and aerosol optical properties from 2012 to 2020 in Beijing, China, Atmos. Chem. Phys., 22, 561–575, https://doi.org/10.5194/acp-22-561-2022, 2022. a, b
Takemura, T., Nozawa, T., Emori, S., Nakajima, T. Y., and Nakajima, T.: Simulation of climate response to aerosol direct and indirect effects with aerosol transport-radiation model, J. Geophys. Res.-Atmos., 110, D02202, https://doi.org/10.1029/2004JD005029, 2005. a
Takemura, T., Egashira, M., Matsuzawa, K., Ichijo, H., O'ishi, R., and Abe-Ouchi, A.: A simulation of the global distribution and radiative forcing of soil dust aerosols at the Last Glacial Maximum, Atmos. Chem. Phys., 9, 3061–3073, https://doi.org/10.5194/acp-9-3061-2009, 2009. a
Teng, S., Liu, C., Schnaiter, M., Chakrabarty, R. K., and Liu, F.: Accounting for the effects of nonideal minor structures on the optical properties of black carbon aerosols, Atmos. Chem. Phys., 19, 2917–2931, https://doi.org/10.5194/acp-19-2917-2019, 2019. a
Tuccella, P., Curci, G., Pitari, G., Lee, S., and Jo, D. S.: Direct Radiative Effect of Absorbing Aerosols: Sensitivity to Mixing State, Brown Carbon, and Soil Dust Refractive Index and Shape, J. Geophys. Res.-Atmos., 125, e2019JD030967, https://doi.org/10.1029/2019JD030967, 2020. a, b
EPA: United States Environmental Protection Agency, EPA [data set], https://www.epa.gov/outdoor-air-quality-data/download-daily-data, last access: 30 April 2022. a
Wang, J.: Air quality historical data query, [code], https://www.aqistudy.cn/historydata/, last access: 30 April 2022. a
Wang, X., Heald, C. L., Ridley, D. A., Schwarz, J. P., Spackman, J. R., Perring, A. E., Coe, H., Liu, D., and Clarke, A. D.: Exploiting simultaneous observational constraints on mass and absorption to estimate the global direct radiative forcing of black carbon and brown carbon, Atmos. Chem. Phys., 14, 10989–11010, https://doi.org/10.5194/acp-14-10989-2014, 2014. a
Wang, Y., Liu, F., He, C., Bi, L., Cheng, T., Wang, Z., Zhang, H., Zhang, X., Shi, Z., and Li, W.: Fractal dimensions and mixing structures of soot particles during atmospheric processing, Environ. Sci. Technol. Lett., 4, 487–493, 2017. a, b
Wang, Y., Li, W., Huang, J., Liu, L., Pang, Y., He, C., Liu, F., Liu, D., Bi, L., Zhang, X., and Shi, Z.: Nonlinear Enhancement of Radiative Absorption by Black Carbon in Response to Particle Mixing Structure, Geophys. Res. Lett., 48, e2021GL096437, https://doi.org/10.1029/2021GL096437, 2021a. a, b
Wang, Y., Pang, Y., Huang, J., Bi, L., Che, H., Zhang, X., and Li, W.: Constructing Shapes and Mixing Structures of Black Carbon Particles With Applications to Optical Calculations, J. Geophys. Res.-Atmos., 126, e2021JD034620, https://doi.org/10.1029/2021JD034620, 2021b. a
Wang, Y., Pang, Y., Huang, J., Bi, L., Che, H., Zhang, X., and Li, W.: Constructing shapes and mixing structures of black carbon particles with applications to optical calculations, J.f Geophys. Res.-Atmos., 126, e2021JD034620, https://doi.org/10.1029/2021JD034620, 2021c. a
Wentzel, M., Gorzawski, H., Naumann, K.-H., Saathoff, H., and Weinbruch, S.: Transmission electron microscopical and aerosol dynamical characterization of soot aerosols, J. Aerosol Sci., 34, 1347–1370, https://doi.org/10.1016/S0021-8502(03)00360-4, 2003. a
Wiedinmyer, C., Akagi, S. K., Yokelson, R. J., Emmons, L. K., Al-Saadi, J. A., Orlando, J. J., and Soja, A. J.: The Fire INventory from NCAR (FINN): a high resolution global model to estimate the emissions from open burning, Geosci. Model Dev., 4, 625–641, https://doi.org/10.5194/gmd-4-625-2011, 2011. a
Wild, O., Zhu, X., and Prather, M. J.: Fast-J: Accurate simulation of in-and below-cloud photolysis in tropospheric chemical models, J. Atmos. Chem., 37, 245–282, 2000. a
Wong, K. Y.: Weather Research and Forecasting model coupled to Chemistry (WRF-Chem), WRF-Chem Support [code], https://ruc.noaa.gov/wrf/wrf-chem/, last access: 30 April 2022. a
Wu, Y., Cheng, T. H., Zheng, L. J., and Chen, H.: A Study of Optical Properties of Soot Aggregates Composed of Poly-Disperse Monomers Using the Superposition T-Matrix Method, Aerosol Sci. Technol., 49, 941–949, 2015. a
Yin, J. Y. and Liu, L. H.: Influence of complex component and particle polydispersity on radiative properties of soot aggregate in atmosphere, J. Quant. Spectrosc. Ra. Transf., 111, 2115–2126, 2010. a
Yu, P. F., Toon, O. B., Bardeen, C. G., Zhu, Y. Q., Rosenlof, K. H., Portmann, R. W., Thornberry, T. D., Gao, R. S., Davis, S. M., Wolf, E. T., de Gouw, J., Peterson, D. A., Fromm, M. D., and Robock, A.: Black carbon lofts wildfire smoke high into the stratosphere to form a persistent plume, Science, 365, 587–590, 2019. a
Yuan, Q., Xu, J., Wang, Y., Zhang, X., Pang, Y., Liu, L., Bi, L., Kang, S., and Li, W.: Mixing state and fractal dimension of soot particles at a remote site in the southeastern Tibetan plateau, Environ. Sci. Technol., 53, 8227–8234, 2019. a
Zaveri, R. A. and Peters, L. K.: A new lumped structure photochemical mechanism for large-scale applications, J. Geophys. Res.-Atmos., 104, 30387–30415, https://doi.org/10.1029/1999JD900876, 1999. a, b
Zaveri, R. A., Easter, R. C., Fast, J. D., and Peters, L. K.: Model for Simulating Aerosol Interactions and Chemistry (MOSAIC), J. Geophys. Res.-Atmos., 113, D13204, https://doi.org/10.1029/2007JD008782, 2008. a
Zhang, Q., Streets, D. G., Carmichael, G. R., He, K. B., Huo, H., Kannari, A., Klimont, Z., Park, I. S., Reddy, S., Fu, J. S., Chen, D., Duan, L., Lei, Y., Wang, L. T., and Yao, Z. L.: Asian emissions in 2006 for the NASA INTEX-B mission, Atmos. Chem. Phys., 9, 5131–5153, https://doi.org/10.5194/acp-9-5131-2009, 2009. a
Zhang, X., Mao, M., Yin, Y., and Wang, B.: Numerical Investigation on Absorption Enhancement of Black Carbon Aerosols Partially Coated With Nonabsorbing Organics, J. Geophys. Res.-Atmos., 123, 1297–1308, https://doi.org/10.1002/2017JD027833, 2018. a
Zhang, X. Y., Wang, Y. Q., Niu, T., Zhang, X. C., Gong, S. L., Zhang, Y. M., and Sun, J. Y.: Atmospheric aerosol compositions in China: spatial/temporal variability, chemical signature, regional haze distribution and comparisons with global aerosols, Atmos. Chem. Phys., 12, 779–799, https://doi.org/10.5194/acp-12-779-2012, 2012. a
Zhuang, B., Li, S., Wang, T., Liu, J., Chen, H., Chen, P., Li, M., and Xie, M.: Interaction between the black carbon aerosol warming effect and East Asian monsoon using RegCM4, J. Climate, 31, 9367–9388, 2018. a
Zhuang, B. L., Chen, H. M., Li, S., Wang, T. J., Liu, J., Zhang, L. J., Liu, H. N., Xie, M., Chen, P. L., Li, M. M., and Zhao, M.: The direct effects of black carbon aerosols from different source sectors in East Asia in summer, Clim. Dynam., 53, 5293–5310, https://doi.org/10.1007/s00382-019-04863-5, 2019. a, b, c