the Creative Commons Attribution 4.0 License.
the Creative Commons Attribution 4.0 License.
 | 16 May 2022
Trends in secondary inorganic aerosol pollution in China and its responses to emission controls of precursors in wintertime
Fanlei Meng
Yibo Zhang
Jiahui Kang
Mathew R. Heal
Stefan Reis
Mengru Wang
Lei Liu
Pengfei Li
Yong Hou
Ying Zhang
Xuejun Liu
Zhenling Cui
Fusuo Zhang
The Chinese government recently proposed ammonia (NH3) emission reductions (but without a specific national target) as a strategic option to mitigate fine particulate matter (PM2.5) pollution. We combined a meta-analysis of nationwide measurements and air quality modeling to identify efficiency gains by striking a balance between controlling NH3 and acid gas (SO2 and NOx) emissions. We found that PM2.5 concentrations decreased from 2000 to 2019, but annual mean PM2.5 concentrations still exceeded 35 µg m−3 at 74 % of 1498 monitoring sites during 2015–2019. The concentration of PM2.5 and its components were significantly higher (16 %–195 %) on hazy days than on non-hazy days. Compared with mean values of other components, this difference was more significant for the secondary inorganic ions SO, NO, and NH (average increase 98 %). While sulfate concentrations significantly decreased over this period, no significant change was observed for nitrate and ammonium concentrations. Model simulations indicate that the effectiveness of a 50 % NH3 emission reduction for controlling secondary inorganic aerosol (SIA) concentrations decreased from 2010 to 2017 in four megacity clusters of eastern China, simulated for the month of January under fixed meteorological conditions (2010). Although the effectiveness further declined in 2020 for simulations including the natural experiment of substantial reductions in acid gas emissions during the COVID-19 pandemic, the resulting reductions in SIA concentrations were on average 20.8 % lower than those in 2017. In addition, the reduction in SIA concentrations in 2017 was greater for 50 % acid gas reductions than for the 50 % NH3 emission reductions. Our findings indicate that persistent secondary inorganic aerosol pollution in China is limited by emissions of acid gases, while an additional control of NH3 emissions would become more important as reductions of SO2 and NOx emissions progress.
- Article
(4411 KB) - Full-text XML
-
Supplement
(3701 KB) - BibTeX
- EndNote


Over the past two decades, China has experienced severe PM2.5 (particulate matter with aerodynamic diameter ≤ 2.5 µm) pollution (Huang et al., 2014; Wang et al., 2016), leading to adverse impacts on human health (Liang et al., 2020) and the environment (Yue et al., 2020). In 2019, elevated PM2.5 concentrations accounted for 46 % of polluted days in China and PM2.5 was officially identified as a key year-round air pollutant (MEEP, 2019). Mitigation of PM2.5 pollution is therefore the most pressing current challenge to improve China's air quality.
The Chinese government has put a major focus on particulate air pollution control through a series of policies, regulations, and laws to prevent and control severe air pollution. Before 2010, the Chinese government mainly focused on controlling SO2 emissions via improvement of energy efficiency, with less attention paid to NOx abatement (CSC, 2007, 2011, 2013b). For example, the 11th Five-Year Plan (FYP) (2006–2010) set a binding goal of a 10 % reduction for SO2 emission (CSC, 2007). The 12th FYP (2011–2015) added NOx regulation and required 8 % and 10 % reductions for SO2 and NOx emissions, respectively (CSC, 2011). This was followed by further reductions in SO2 and NOx emissions of 15 % and 10 %, respectively, in the 13th FYP (2016–2020) (CSC, 2013b). In response to the severe haze events of 2013, the Chinese State Council promulgated the toughest-ever “Atmospheric Pollution Prevention and Control Action Plan” in September 2013, aiming to reduce ambient PM2.5 concentrations by 15 %–20 % in 2017 relative to 2013 levels in metropolitan regions (CSC, 2013a). As a result of the implementation of stringent control measures, emission reductions markedly accelerated from 2013 to 2017, with decreases of 59 % for SO2, 21 % for NOx, and 33 % for primary PM2.5 (Zheng et al., 2018). Consequently, significant reductions in annual mean PM2.5 concentrations were observed nationwide (Zhang et al., 2019; Yue et al., 2020), in the range 28 %–40 % in metropolitan regions (CSC, 2018a). To continue its efforts in tackling air pollution, China promulgated the Three-Year Action Plan (TYAP) in 2018 for Winning the Blue-Sky Defense Battle (CSC, 2018b), which required a further 15 % reduction in NOx emissions by 2020 compared to 2018 levels.
Despite a substantial reduction in PM2.5 concentrations in China, the proportion of secondary aerosols during severe haze periods is increasing (An et al., 2019), and can comprise up to 70 % of PM2.5 concentrations (Huang et al., 2014). Secondary inorganic aerosols (SIA, the sum of sulfate (SO), nitrate (NO), and ammonium (NH)) were found to be of equal importance to secondary organic aerosols, with 40 %–50 % contributions to PM2.5 in eastern China (Huang et al., 2014; Yang et al., 2011). The acid gases (i.e., NOx, SO2), together with NH3, are crucial precursors of SIA via chemical reactions that form particulate ammonium sulfate, ammonium bisulfate, and ammonium nitrate (Ianniello et al., 2010). In addition to the adverse impacts on human health via fine particulate matter formation (Liang et al., 2020; Kuerban et al., 2020), large amounts of NH3 and its aerosol-phase products also lead to nitrogen deposition and consequently to environmental degradation (Ortiz-Montalvo et al., 2014; Pan et al., 2012; Xu et al., 2015, 2018; Zhan et al., 2021).
Following the successful controls on NOx and SO2 emissions since 2013 in China, some studies found SO exhibited a much larger decline than NO and NH, which lead to a rapid transition from sulfate-driven to nitrate-driven aerosol pollution (Li et al., 2019, 2021; Zhang et al., 2019). Attention is turning to NH3 emissions as a possible means of further PM2.5 control (Bai et al., 2019; Kang et al., 2016), particularly as emissions of NH3 increased between the 1980s and 2010s. Some studies have found that NH3 limited the formation of SIA in winter in the eastern United States (Pinder et al., 2007) and Europe (Megaritis et al., 2013). Controls on NH3 emissions have been proposed in the TYAP, although mandatory measures and binding targets have not yet been set (CSC, 2018b). Nevertheless, this proposal means that China will enter a new phase of PM2.5 mitigation, with attention now given to both acid gas and NH3 emissions. However, in the context of effective control of PM2.5 pollution via its SIA component, two key questions arise: (1) what are the responses of the constituents of SIA to implementation of air pollution control policies, and (2) what is the relative efficiency of NH3 versus acid gas emission controls to reduce SIA pollution?
To fill this evidence gap and provide useful insights for policy-making to improve air quality in China, this study adopts an integrated assessment framework. With respect to the emission control policy summarized above, China's PM2.5 control can be divided into three periods: period I (2000–2012), in which PM2.5 was not the targeted pollutant; period II (2013–2016), the early stage of targeted PM2.5 control policy implementation; and period III (2017–2019), the latter stage with more stringent policies. Therefore, our research framework consists of two parts: (1) assessment of trends in annual mean concentrations of PM2.5, its chemical components and SIA gaseous precursors from meta-analyses and observations; (2) quantification of SIA responses to emission reductions in NH3 and acid gases using the Weather Research and Forecasting and Community Multiscale Air Quality (WRF/CMAQ) models.
2.1 Research framework
This study developed an integrated assessment framework to analyze the trends of SIA and strategic options for reducing SIA and PM2.5 pollution in China (Fig. 1). The difference in PM2.5 chemical components between hazy and non-hazy days was first assessed by a meta-analysis of published studies. These were interpreted in conjunction with the trends in air concentrations of PM2.5 and its secondary inorganic aerosol precursors (SO2, NO2, and NH3) derived from surface measurements and satellite observations. The potential of SIA and PM2.5 concentration reductions from precursor emission reductions was then evaluated using the WRF/CMAQ models.
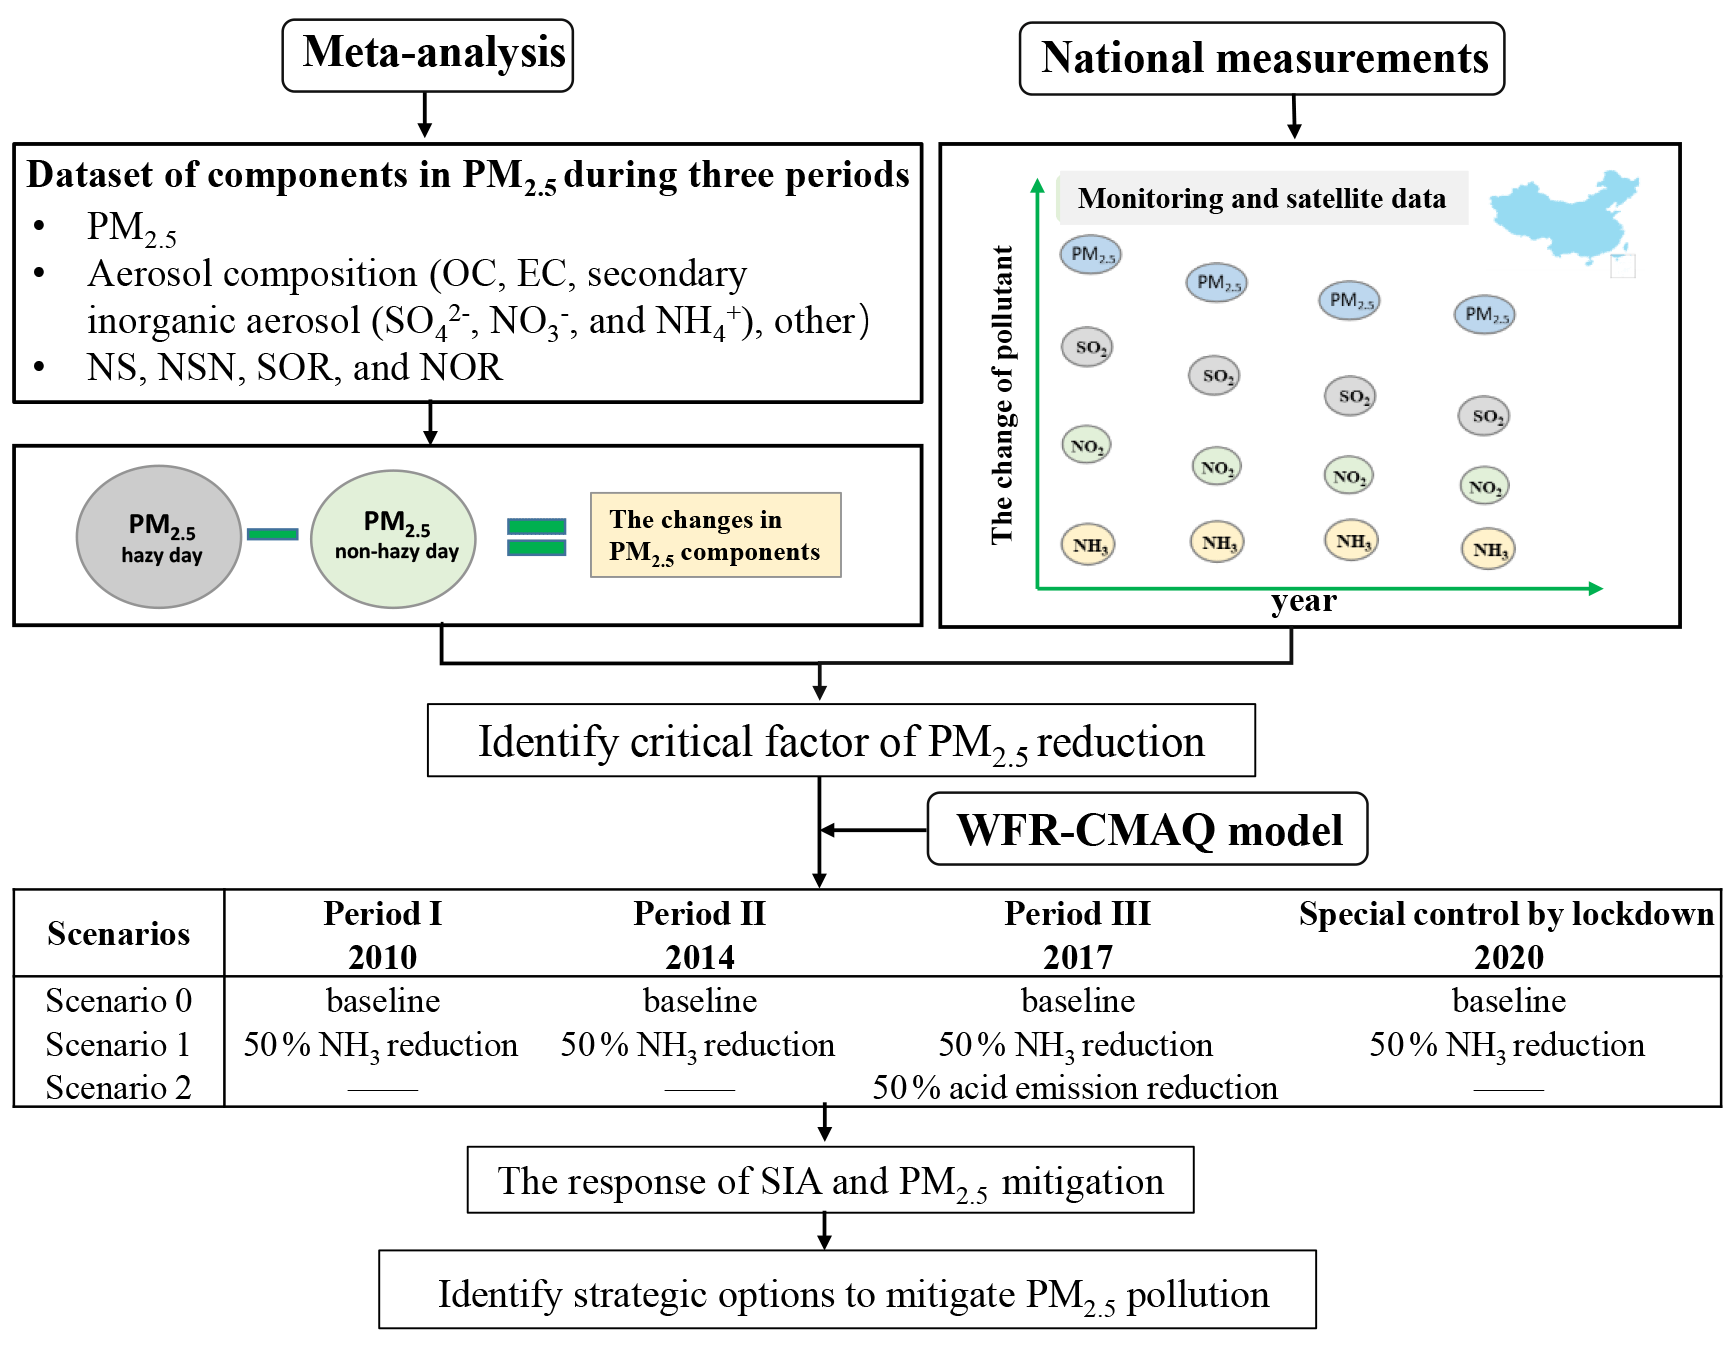
Figure 1Integrated assessment framework for Chinese PM2.5 mitigation strategic options. OC is organic carbon, EC is elemental carbon, NO is nitrate, SO is sulfate, and NH is ammonium. NS is the slope of the regression equation between [NH] and [SO], NSN is the slope of the regression equation between [NH] and [], SOR is sulfur oxidation ratio, and NOR is nitrogen oxidation ratio. SIA is secondary inorganic aerosols. WRF-CMAQ is Weather Research and Forecasting and Community Multiscale Air Quality models.
2.2 Meta-analysis of PM2.5 and its chemical components
Meta-analyses can be used to quantify the differences in concentrations of PM2.5 and its secondary inorganic aerosol components (NH, NO, and SO) between hazy and non-hazy days and to identify the major pollutants on non-hazy days (Y. C. Wang et al., 2019); this provides evidence for effective options in the control of precursor emissions (NH3, NO2, and SO2) for reducing occurrences of hazy days. To build a database of atmospheric concentrations of PM2.5 and chemical components between hazy and non-hazy days, we conducted a literature survey using the Web of Science and the China National Knowledge Infrastructure for papers published between January 2000 and January 2020. The keywords included: (1) “particulate matter”, or “aerosol”, or “PM2.5” and (2) “China” or “Chinese”. Studies were selected based on the following conditions:
-
Measurements were taken on both hazy and non-hazy days.
-
PM2.5 chemical components were reported.
-
If hazy days were not defined in the screened articles, the days with PM2.5 concentrations >75 µg m−3 (the Chinese Ambient Air Quality Standard Grade II for PM2.5, MEPC, 2012) were treated as hazy days.
-
If an article reported measurements from different monitoring sites in the same city, e.g., Mao et al. (2018) and Xu et al. (2019), then each measurement was considered an independent study.
-
If there were measurements in the same city for the same year, e.g., Tao et al. (2016) and Han et al. (2017), then each measurement was treated as an independent study.
A total of 100 articles were selected based on the above conditions with the lists provided by Xu (2022). For each selected study, we documented the study sites, study periods, seasons, aerosol types, and aerosol species mass concentrations (in µg m−3) over the entire study period (2000–2019) (the detailed data are provided in the dataset). In total, the number of sites contributing data to the meta-analysis was 267 and their locations are shown in Fig. S1 in the Supplement. If relevant data were not directly presented in studies, a GetData Graph Digitizer (Version 2.25, http://www.getdata-graph-digitizer.com/, last access: 25 August 2020) was used to digitize concentrations of PM2.5 chemical components from figures. The derivations of other variables such as sulfur and nitrogen oxidation ratios are described in Sect. S1 of the Supplement.
Effect sizes were developed to normalize the combined studies' outcomes to the same scale. This was done through the use of log response ratios (lnRR) (Nakagawa and Santos, 2012; Ying et al., 2019). The variations in aerosol species were evaluated as follows:
where Xp and Xn represent the mean values of the studied variables of PM2.5 components on hazy and non-hazy days, respectively. The mean response ratio was then estimated as
where W(i) is the weight given to that observation as described below. Finally, variable-related effects were expressed as percent changes, calculated as () × 100 %. A 95 % confidence interval not overlapping with zero indicates that the difference is significant. A positive or negative percentage value indicates an increase or decrease in the response variables, respectively.
We used inverse sampling variances to weight the observed effect size (RR) in the meta-analysis (Benitez-Lopez et al., 2017). For the measurement sites where standard deviations (SD) or standard errors (SE) were absent in the original study reports, we used the “Bracken, 1992” approach to estimate SD (Bracken et al., 1992). The variation-related chemical composition of PM2.5 was assessed by random effects in the meta-analysis. Rosenberg's fail-safe numbers () were calculated to assess the robustness of findings on PM2.5 to publication bias (Ying et al., 2019) (see Table S1 in the Supplement). The results (effects) were considered robust despite the possibility of publication bias if , where n indicates the number of sites. For the statistical analysis of the concentrations of PM2.5 and secondary inorganic ions for three periods, we used a non-parametric statistical method since concentrations were not normally distributed based on the Kruskal–Wallis test (Kruskal and Wallis, 1952). For each species, the Kruskal–Wallis one-way analysis of variance (ANOVA) on ranks among three periods was performed with pairwise comparison using Dunn's method (Dunn, 1964).
2.3 Data collection of air pollutant concentrations
To assess the recent annual trends in China of PM2.5 and of the SO2 and NO2 gaseous precursors to SIA, real-time monitoring data of these pollutants at 1498 monitoring stations in 367 cities during 2015–2019 were obtained from the China National Environmental Monitoring Center (CNEMC) (http://106.37.208.233:20035/, last access: 8 May 2022). This is an open-access archive of air pollutant measurements from all prefecture-level cities since January 2015. Successful use of data from CNEMC to determine characteristics of air pollution and related health risks in China has been demonstrated previously (Liu et al., 2016; Kuerban et al., 2020). The geography stations are shown in Fig. S1. The annual mean concentrations of the three pollutants at all sites were calculated from the hourly time-series data according to the method of Kuerban et al. (2020). Information about sampling instruments, sampling methods, and data quality controls for PM2.5, SO2, and NO2 is provided in Sect. S2. Surface NH3 concentrations over China for the period 2008–2016 (the currently available data) were extracted from the study of L. Liu et al. (2019). Further details are in Sect. S2.
2.4 WRF/CMAQ model simulations
The Weather Research and Forecasting model (WRFv3.8) and the Models-3 Community Multiscale Air Quality (CMAQv5.2) model were used to evaluate the impacts of emission reductions on SIA and PM2.5 concentrations over China. The simulations were conducted at a horizontal resolution of 12 km × 12 km. The simulation domain covered the whole of China, part of India, and east Asia. In the current study, focus was on the following four regions in China: Beijing–Tianjin–Hebei (BTH), Yangtze River Delta (YRD), Pearl River Delta (PRD), and Sichuan Basin (SCB). The model configurations used in this study were the same as those used by Y. J. Wu et al. (2018) and are briefly described here. The WRFv3.8 model was applied to generate meteorological inputs for the CMAQ model using the National Center for Environmental Prediction Final Operational Global Analysis (NCEP-FNL) dataset (Morrison et al., 2009). Default initial and boundary conditions were used in the simulations. The carbon-bond (CB05) gas-phase chemical mechanism and AERO6 aerosol module were selected in the CMAQ configuration (Guenther et al., 2012). Anthropogenic emissions for 2010, 2014, and 2017 were obtained from the Multi-resolution Emission Inventory (http://meicmodel.org, last access: 14 October 2021) with 0.25∘ × 0.25∘ spatial resolution and aggregated to 12 km × 12 km resolution (Zheng et al., 2018; Li et al., 2017). Each simulation was spun-up for 6 d in advance to eliminate the effects of the initial conditions.
The years 2010, 2014, and 2017 were chosen to represent the anthropogenic emissions associated with the periods I, II, and III, respectively. January was selected as the typical simulation month because wintertime haze pollution frequently occurs in this month (Wang et al., 2011; M. X. Liu et al., 2019). January 2010 was also found to have PM2.5 pollution more serious than other months (Geng et al., 2017, 2021). The sensitivity scenarios of emissions in January can therefore help to identify the efficient option for controlling haze pollution.
The Chinese government has put a major focus on acid gas emission control through a series of policies in the past three periods (Fig. S2). The ratio decreases of anthropogenic emissions of SO2 and NOx in January for the years 2010, 2014, 2017, and 2020 are presented in Tables S2 and S3 in the Supplement, respectively. The emissions from surrounding countries were obtained from the Emissions Database for Global Atmospheric Research (EDGAR): HTAPV2. The scenarios and the associated reductions of NH3, NOx, and SO2 for the selected 4 years in three periods can be found in Fig. 1.
The sensitivities of SIA and PM2.5 to NH3 emission reductions were determined from the average PM2.5 concentrations in model simulations without and with an additional 50 % NH3 emission reduction. The choice of 50 % additional NH3 emission reduction is based on the feasibility and current upper bound of NH3 emission reduction expected to be realized in the near future (L. Liu et al., 2019; X. M. Zhang et al., 2020; Table S4). For example, X. M. Zhang et al. (2020) found that the mitigation potential of NH3 emissions from cropland production and livestock production in China can reach up to 52 % and 58 %, respectively. To eliminate the influences of varying meteorological conditions, all simulations were conducted under the fixed meteorological conditions of 2010.
During the COVID-19 lockdown in China, emissions of primary pollutants were subject to unprecedented reductions due to national restrictions on traffic and industry; in particular, emissions of NOx and SO2 decreased by 46 % and 24 %, respectively, averaged across all Chinese provinces (Huang et al., 2021). We therefore also ran simulations applying the same reductions in NOx and SO2 (based on 2017 MEIC) that were actually observed during the COVID-19 lockdown as a case of special control in 2020.
2.5 Model performance
The CMAQ model has been extensively used in air quality studies (Zhang et al., 2019; Backes et al., 2016), and the validity of the chemical regime in the CMAQ model had been confirmed by our previous studies (Zhang et al., 2021a; L. Wang et al., 2020; Wang, 2021). In this study, we used surface measurements from previous publications (e.g., Xiao et al., 2020, 2021; Geng et al., 2019; Xue et al., 2019) and satellite observations to validate the modeling meteorological parameters by the WRF model and air concentrations of PM2.5 and associated chemical components by the CMAQ model. The meteorological measurements used for validating the WRF model performance were obtained from the National Climate Data Center (NCDC) (ftp://ftp.ncdc.noaa.gov/pub/data/noaa/, last access: 10 May 2022). For validation of the CMAQ model, monthly mean concentrations of PM2.5 were obtained from the ChinaHighAirPollutants (CHAP, https://weijing-rs.github.io/product.html, last access: 12 November 2019) database. We also collected ground-based observations from previous publications to validate the modeling concentrations of SO, NO, and NH. Detailed information on the monitoring sites is presented in Table S5. Further information about the modeling is given in Sect. S3 and Figs. S3–S7 and Table S5.
3.1 Characteristics of PM2.5 and its chemical components from the meta-analysis and from nationwide observations
The meta-analysis based on all published analyses of PM2.5 and chemical component measurements during 2000–2019 reveals the changing characteristics of PM2.5. To assess the annual trends in PM2.5 and its major chemical components, we made a three-period comparison using the measurements at sites that include both PM2.5 and secondary inorganic ions SO, NO, and NH (Fig. 2). The PM2.5 concentrations on both hazy and non-hazy days showed no significant trend from period I to period II based on the Kruskal–Wallis test. This could be explained by the enhanced atmospheric oxidation capacity (Huang et al., 2021), faster deposition of total inorganic nitrate (Zhai et al., 2021), and the changes in atmospheric circulation (Zheng et al., 2015; Li et al., 2020). However, the observed concentrations of PM2.5 showed a downward trend from period I to period III on the non-hazy days, decreasing by 8.2 % (Fig. 2a), despite no significant decreasing trend on the hazy days (Fig. 2a). In addition, the annual mean PM2.5 concentrations from the nationwide measurements showed declining trends during 2015–2019 averaged across all of China and for each of the BTH, YRD, SCB, and PRD megacity clusters of eastern China (Fig. 3a, d).
These results reflect the effectiveness of the pollution control policies (Fig. S2) implemented by the Chinese government at the national scale. Nevertheless, PM2.5 remained at relatively high levels. During 2015–2019, the annual mean PM2.5 concentrations at 74 % of the 1498 sites (averaging 51.9±12.4 µg m−3, Fig. 3a) exceeded the Chinese Grade-II Standard (GB 3095–2012) of 35 µg m−3 (MEPC, 2012), indicating that PM2.5 mitigation is a significant challenge for China.
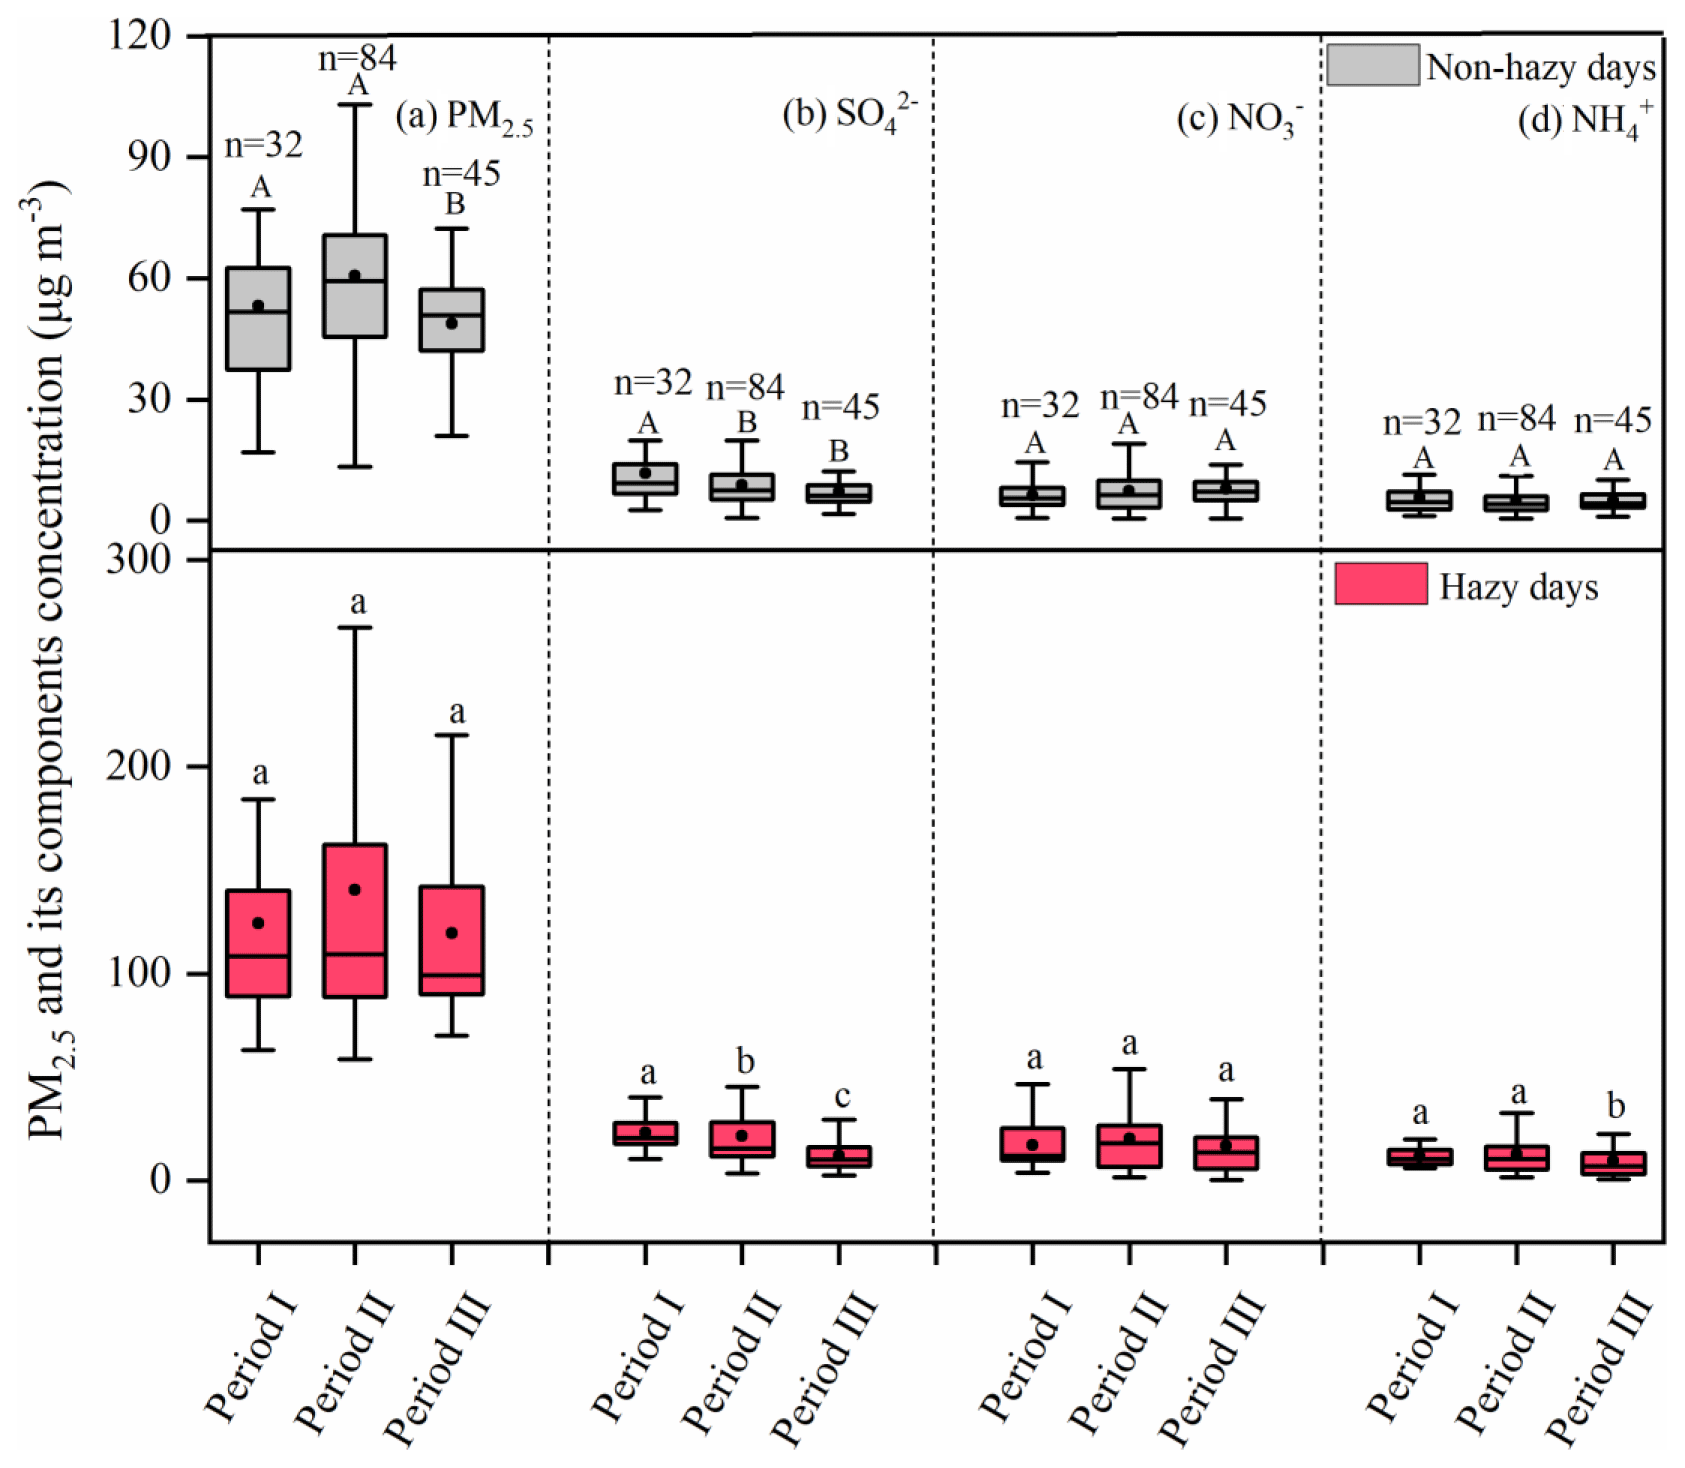
Figure 2Comparisons of observed concentrations of (a) PM2.5, (b) SO, (c) NO, and (d) NH between non-hazy and hazy days in period I (2000–2012), period II (2013–2016), and period III (2017–2019). Bars with different letters denote significant differences among the three periods (P<0.05) (upper and lowercase letters for non-hazy and hazy days, respectively). The upper and lower boundaries of the boxes represent the 75th and 25th percentiles; the line within the box represents the median value; the whiskers above and below the boxes represent the 90th and 10th percentiles; the point within the box represents the mean value. Comparison of the pollutants among the three periods using the Kruskal–Wallis test and Dunn's test. The n represents independent sites; more details on this are presented in Sect. 2.2.
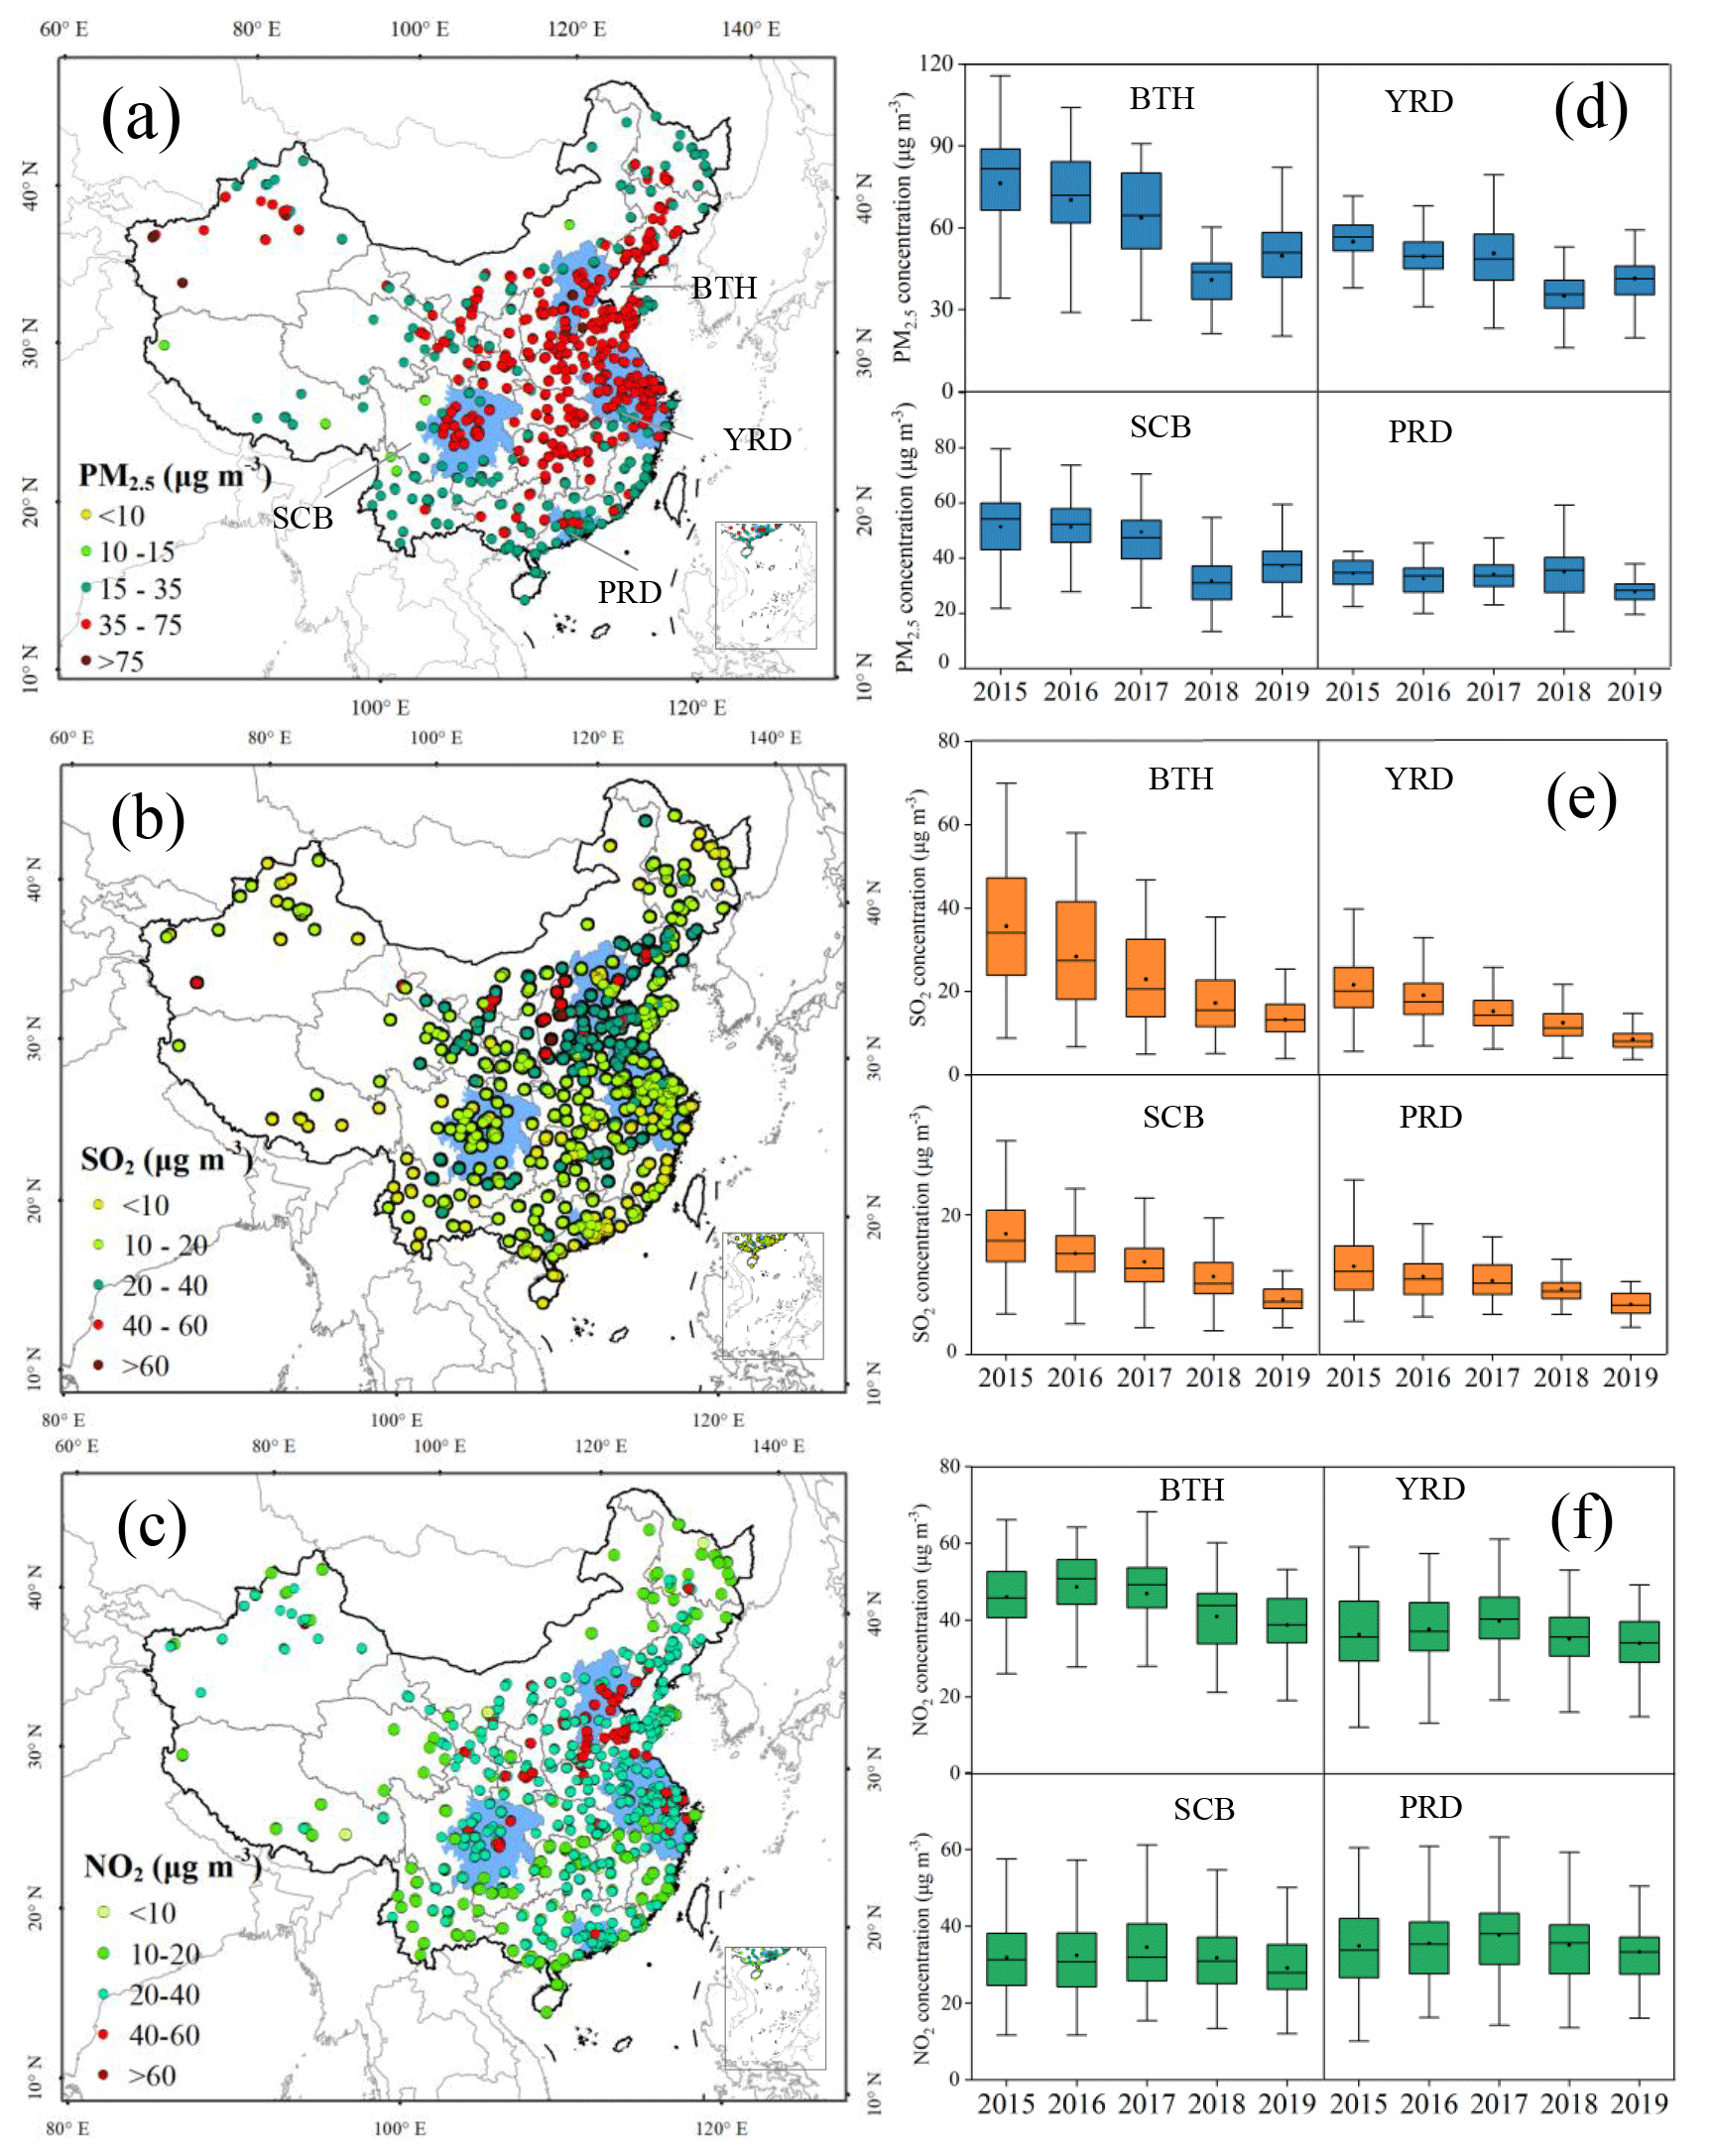
Figure 3Left: spatial patterns of annual mean observed concentration of (a) PM2.5, (b) SO2, (c) NO2 at 1498 sites, averaged for the period 2015–2019. Right: the annual observed concentrations of (d) PM2.5, (e) SO2, and (f) NO2 for the period 2015–2019 in four megacity clusters (BTH: Beijing–Tianjin–Hebei, YRD: Yangtze River Delta, SCB: Sichuan Basin, PRD: Pearl River Delta). The locations of the regions are indicated by the blue shading on the map. The upper and lower boundaries of the boxes represent the 75th and 25th percentiles; the line within the box represents the median value; the whiskers above and below the boxes represent the 90th and 10th percentiles; the point within the box represents the mean value.
To further explore the underlying drivers of PM2.5 pollution, we analyzed the characteristics of PM2.5 chemical components and their temporal changes in China. The concentrations of PM2.5 and all its chemical components (except F− and Ca2+) were significantly higher on hazy days than on non-hazy days (Fig. 4a). Compared with other components, this difference was more significant for secondary inorganic ions (i.e., SO, NO, and NH). The sulfur oxidation ratio (SOR) and the nitrogen oxidation ratio (NOR) were also 58.0 % and 94.4 % higher on hazy days than on non-hazy days, respectively, implying higher oxidations of gaseous species to sulfate- and nitrate-containing aerosols on the hazy days (Sun et al., 2006; Xu et al., 2017).
To provide quantitative information on differences in PM2.5 and its components between hazy days and non-hazy days, we made a comparison using 46 groups of data on simultaneous measurements of PM2.5 and chemical components. The 46 groups refer to independent analyses from the literature that compare concentrations of PM2.5 and major components (SO, NO, NH, OC, and EC) on hazy and non-hazy days measured across different sets of sites. The “Other” species was calculated by difference between PM2.5 and sum of OC, EC, and secondary inorganic ions (SO, NO and NH). As shown in Fig. 4b.1, PM2.5 concentrations significantly increased (by 136 %) on the hazy days (149.2±81.6 µg m−3) relative to those on the non-hazy days (63.2±29.8 µg m−3). By contrast, each component's proportions within PM2.5 differed slightly, with 36 % and 40 % contributions by SIA on non-hazy days and hazy days, respectively (Fig. 4b.2). This is not surprising because concentrations of PM2.5 and SIA both significantly increased on the hazy days (60.1±37.4 µg m−3 for SIA) relative to the non-hazy days (22.4±12.1 µg m−3 for SIA). Previous studies have found that increased SIA formation is the major influencing factor for haze pollution in wintertime and summertime (mainly in the years since 2013) in major cities in eastern China (Huang et al., 2014; Y. Wang et al., 2019; Li et al., 2018). Our results extend confirmation of the dominant role of SIA in PM2.5 pollution over a large spatial scale in China and to longer temporal scales.

Figure 4(a) Variations in PM2.5 concentration, aerosol component concentration, NS, NSN, SOR, and NOR from non-hazy to hazy days in China during 2000–2019. (b) Subpanel (1) Summary of differences in PM2.5 concentration between non-hazy and hazy days in China; (2) the average proportions of components of PM2.5 on non-hazy and hazy days. NS is the slope of the regression equation between [NH] and [SO], NSN is the slope of the regression equation between [NH] and [], SOR is sulfur oxidation ratio, and NOR is nitrogen oxidation ratio. The variations are considered significant if the confidence intervals of the effect size do not overlap with zero. denotes significant difference (P<0.01) between hazy days and non-hazy days. The upper and lower boundaries of the boxes represent the 75th and 25th percentiles; the line within the box represents the median value; the whiskers above and below the boxes represent the 90th and 10th percentiles; the point within the box represents the mean value. Values adjacent to each confidence interval indicate number of measurement sites. The n represents independent sites; more details on this are presented in Sect. 2.2.
The effect values of SIA on the hazy days were significantly higher than those on non-hazy days for all three periods (I, II, and III) (Fig. 5), indicating the persistent prevalence of the SIA pollution problem over the past two decades. Considering changes in concentrations, SO showed a downward trend from period I to period III on the non-hazy days and hazy day, decreasing by 38.6 % and 48.3 %, respectively (Fig. 2b). These results reflect the effectiveness of the SO2 pollution control policies (van der A et al., 2017). By contrast, there were no significant downward trends in concentrations of NO and NH on either hazy or non-hazy days (Fig. 2c, d), but the mean NO concentration in period III decreased by 10.5 % compared with that in period II, especially on hazy days (−16.8 %). These results could be partly supported by decreased NOx emissions and tropospheric NO2 vertical column densities between 2011 and 2019 in China owing to effective NOx control policies (Zheng et al., 2018; Fan et al., 2021). The lack of significantly downward trends in NH concentrations is due to the fact that the total NH3 emissions in China changed little and remained at high levels between 2000 and 2018, i.e., slightly decreased from 2000 (10.3 Tg) to 2012 (9.3 Tg) (Kang et al., 2016) and then slightly increased between 2013 and 2018 (Liu et al., 2021). The same trends are also found in Quzhou in the North China Plain (detailed information on Quzhou can be found in Meng et al., 2022, and Feng et al., 2022) during the period 2012–2020 based on analysis of observations from our previous studies (Xu et al., 2016; Zhang et al., 2021b, note that data during 2017–2020 are unpublished) (Fig. S8). Y. Zhang et al. (2020) found that the clean air actions implemented in 2017 effectively reduced wintertime concentrations of PM1 (particulate matter with diameter ≤1 µm), SO, and NH in Beijing compared with those in 2007, but had no apparent effect on NO. Li et al. (2021) also found that SO exhibited a significant decline. However, NO did not evidently exhibit a decreasing trend in the BTH region.
Our findings are to some extent supported by the nationwide measurements. Annual mean SO2 concentrations displayed a clear decreasing trend with a 53 % reduction in 2019 relative to 2015 for the four megacity clusters of eastern China (Fig. 3b, e), whereas there were only slight reductions in annual mean NO2 concentrations (Fig. 3c, f). By contrast, annual mean NH3 concentrations showed an obvious increasing trend in both northern and southern regions of China, and especially in the BTH region (Fig. S9).
Overall, the above analyses indicate that SO concentrations responded positively to air policy implementations at the national scale, but that reducing NO and NH remains a significant challenge. China has a history of around 10–20 years for SO2 and NOx emission control and has advocated NH3 controls despite to date no mandatory measures and binding targets having been set (Fig. S2). Nevertheless, PM2.5 pollution, especially SIA such as NO and NH, is currently a serious problem (Figs. 4 and 5a, b). Some studies have reported that PM2.5 pollution can be effectively reduced if implementing synchronous NH3 and controls (M. X. Liu et al., 2019). Therefore, based on the above findings, we propose that NH3 and emission mitigation should be simultaneously strengthened to mitigate haze pollution.
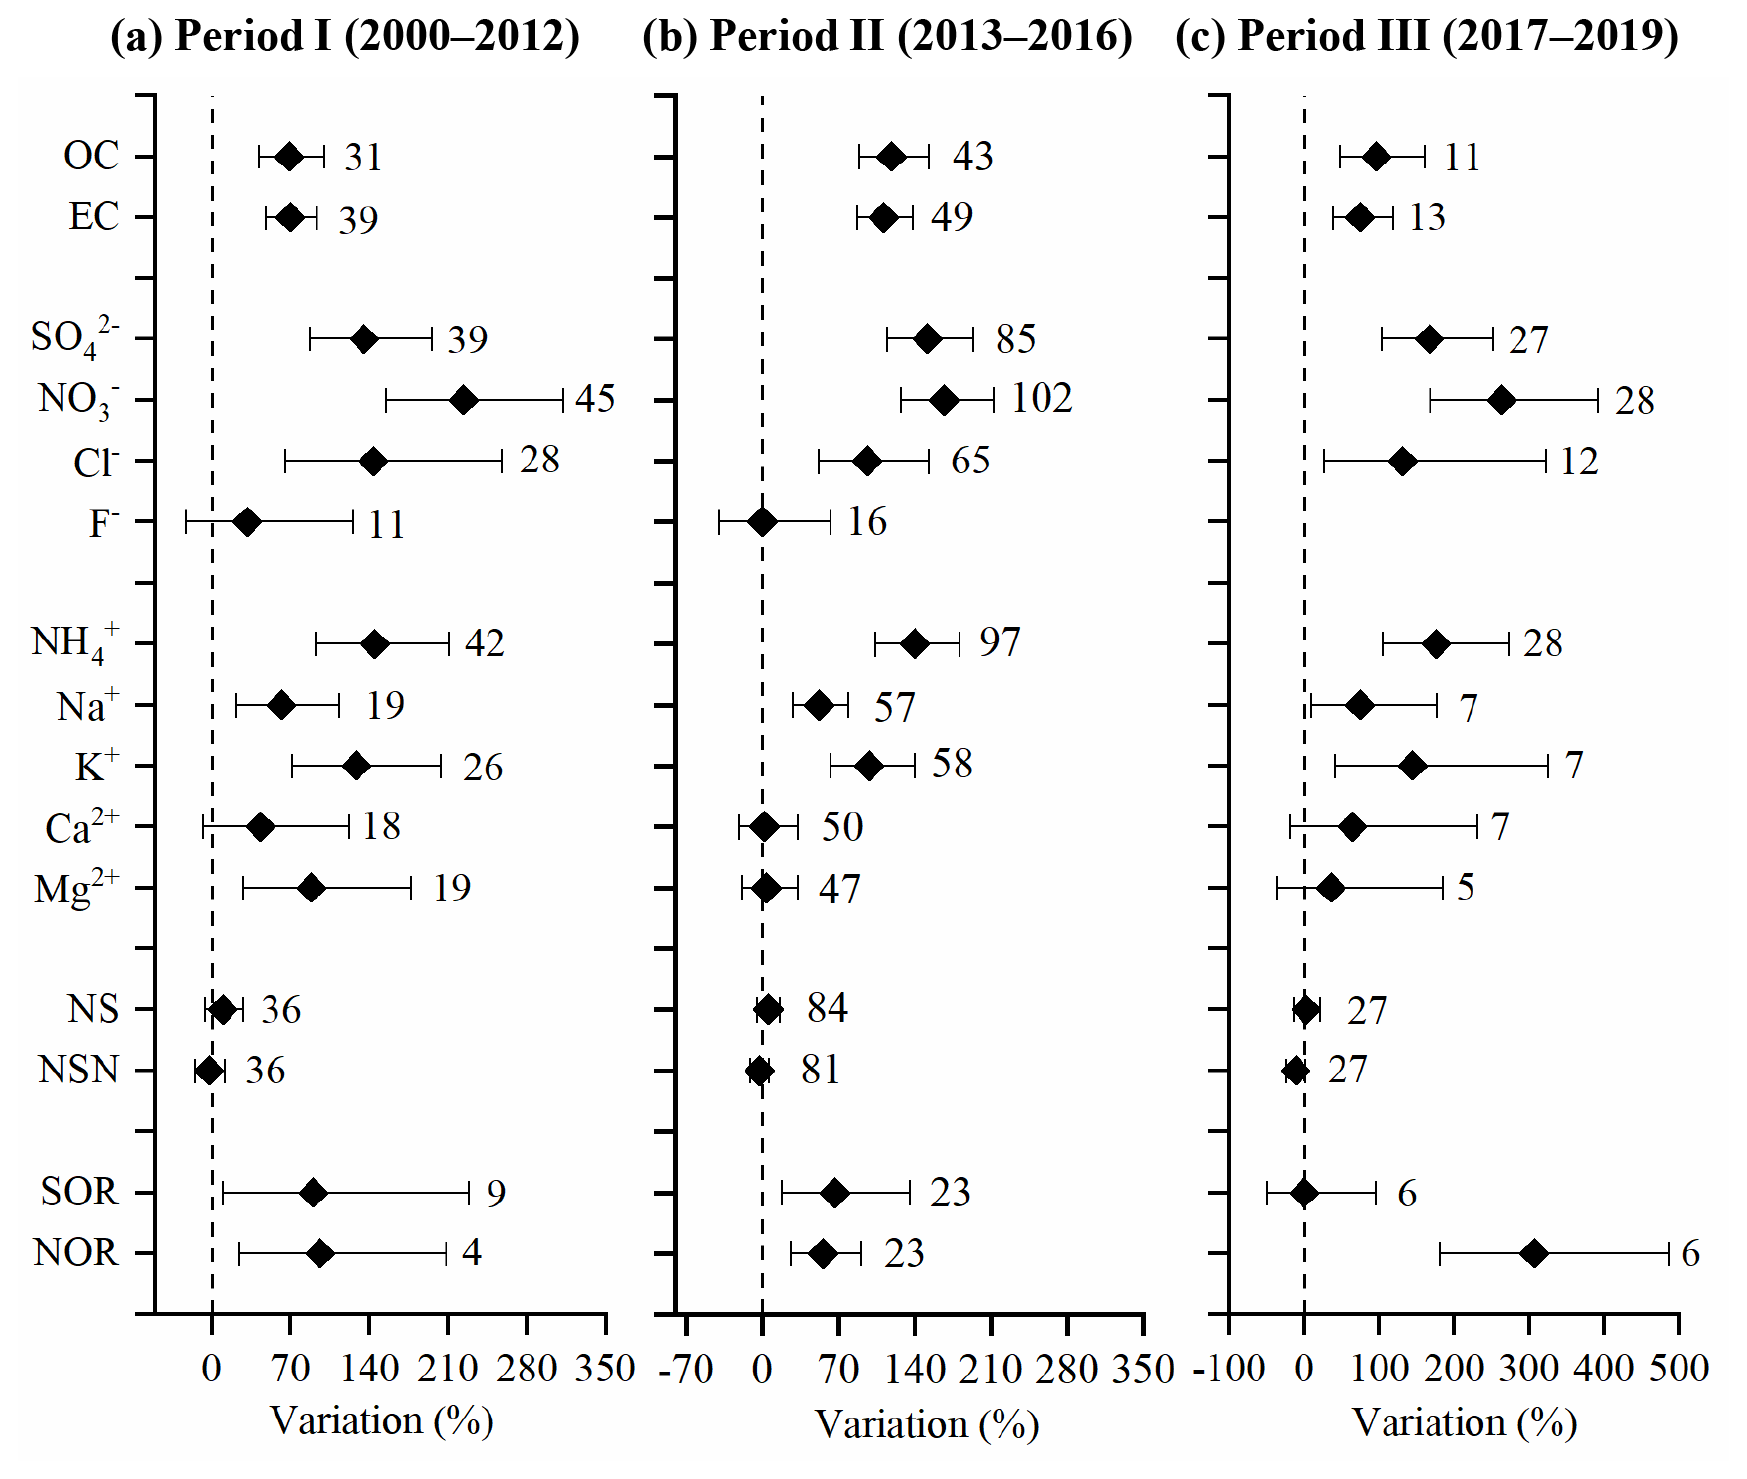
Figure 5Variations in PM2.5 composition, NS, NSN, SOR, and NOR from non-hazy to hazy days in (a) period I (2000–2012), (b) period II (2013–2016), (c) period III (2017–2019). NS is the slope of the regression equation between [NH] and [SO], NSN is the slope of the regression equation between [NH] and [SO + NO], SOR is sulfur oxidation ratio, and NOR is nitrogen oxidation ratio. The variations are statistically significant if the confidence intervals of the effect size do not overlap with zero. Values adjacent to each confidence interval indicate number of measurement sites. The n represents independent sites; more details on this are presented in Sect. 2.2.
3.2 Sensitivity tests with additional emission controls
To further examine the effectiveness of NH3 and acid gas emission reductions in SIA and PM2.5 mitigation, the decreases in mean SIA and PM2.5 concentrations with and without additional 50 % NH3 reductions were simulated using the WRF/CMAQ model. Figures 6 and S10 show that, compared to 2010, SIA and PM2.5 concentrations in January 2017 were significantly decreased in the BTH, YRD, SCB, and PRD megacity clusters in the simulations without additional NH3 emission reductions. Across the four megacity clusters, the reduction in SIA and PM2.5 is largest in the SCB region from 2010 to 2017 and smallest in the PRD region.
When simulating the effects of an additional 50 % NH3 emission reductions in January in each of the years 2010, 2014, and 2017, the SIA concentrations in the megacity clusters (i.e., BTH, YRD, SCB, and PRD) decreased by 25.9±0.3 %, 24.4±0.3 %, and 22.9±0.3 %, respectively (Figs. 6, S11, and Table S6). The reductions in PM2.5 in 2010, 2014, and 2017 were 9.7±0.1 %, 9.0±0.1 %, and 9.2±0.2 % in the megacity clusters, respectively (Figs. S10 and S12). While these results confirm the effectiveness of NH3 emission controls, it is important to note that the response of SIA concentrations is less sensitive to additional NH3 emission controls along the timeline of the SO2 and NOx anthropogenic emission reductions associated with the series of clean air actions implemented by the Chinese government from 2010 to 2017 (Zheng et al., 2018). Given the feasibility and current upper bound of NH3 emission reduction options in the near future (50 %) (M. X. Liu et al., 2019), further abatement of SIA concentrations merely by reducing NH3 emissions is limited in China. In other words, the controls on acid gas emissions should continue to be strengthened beyond their current levels.
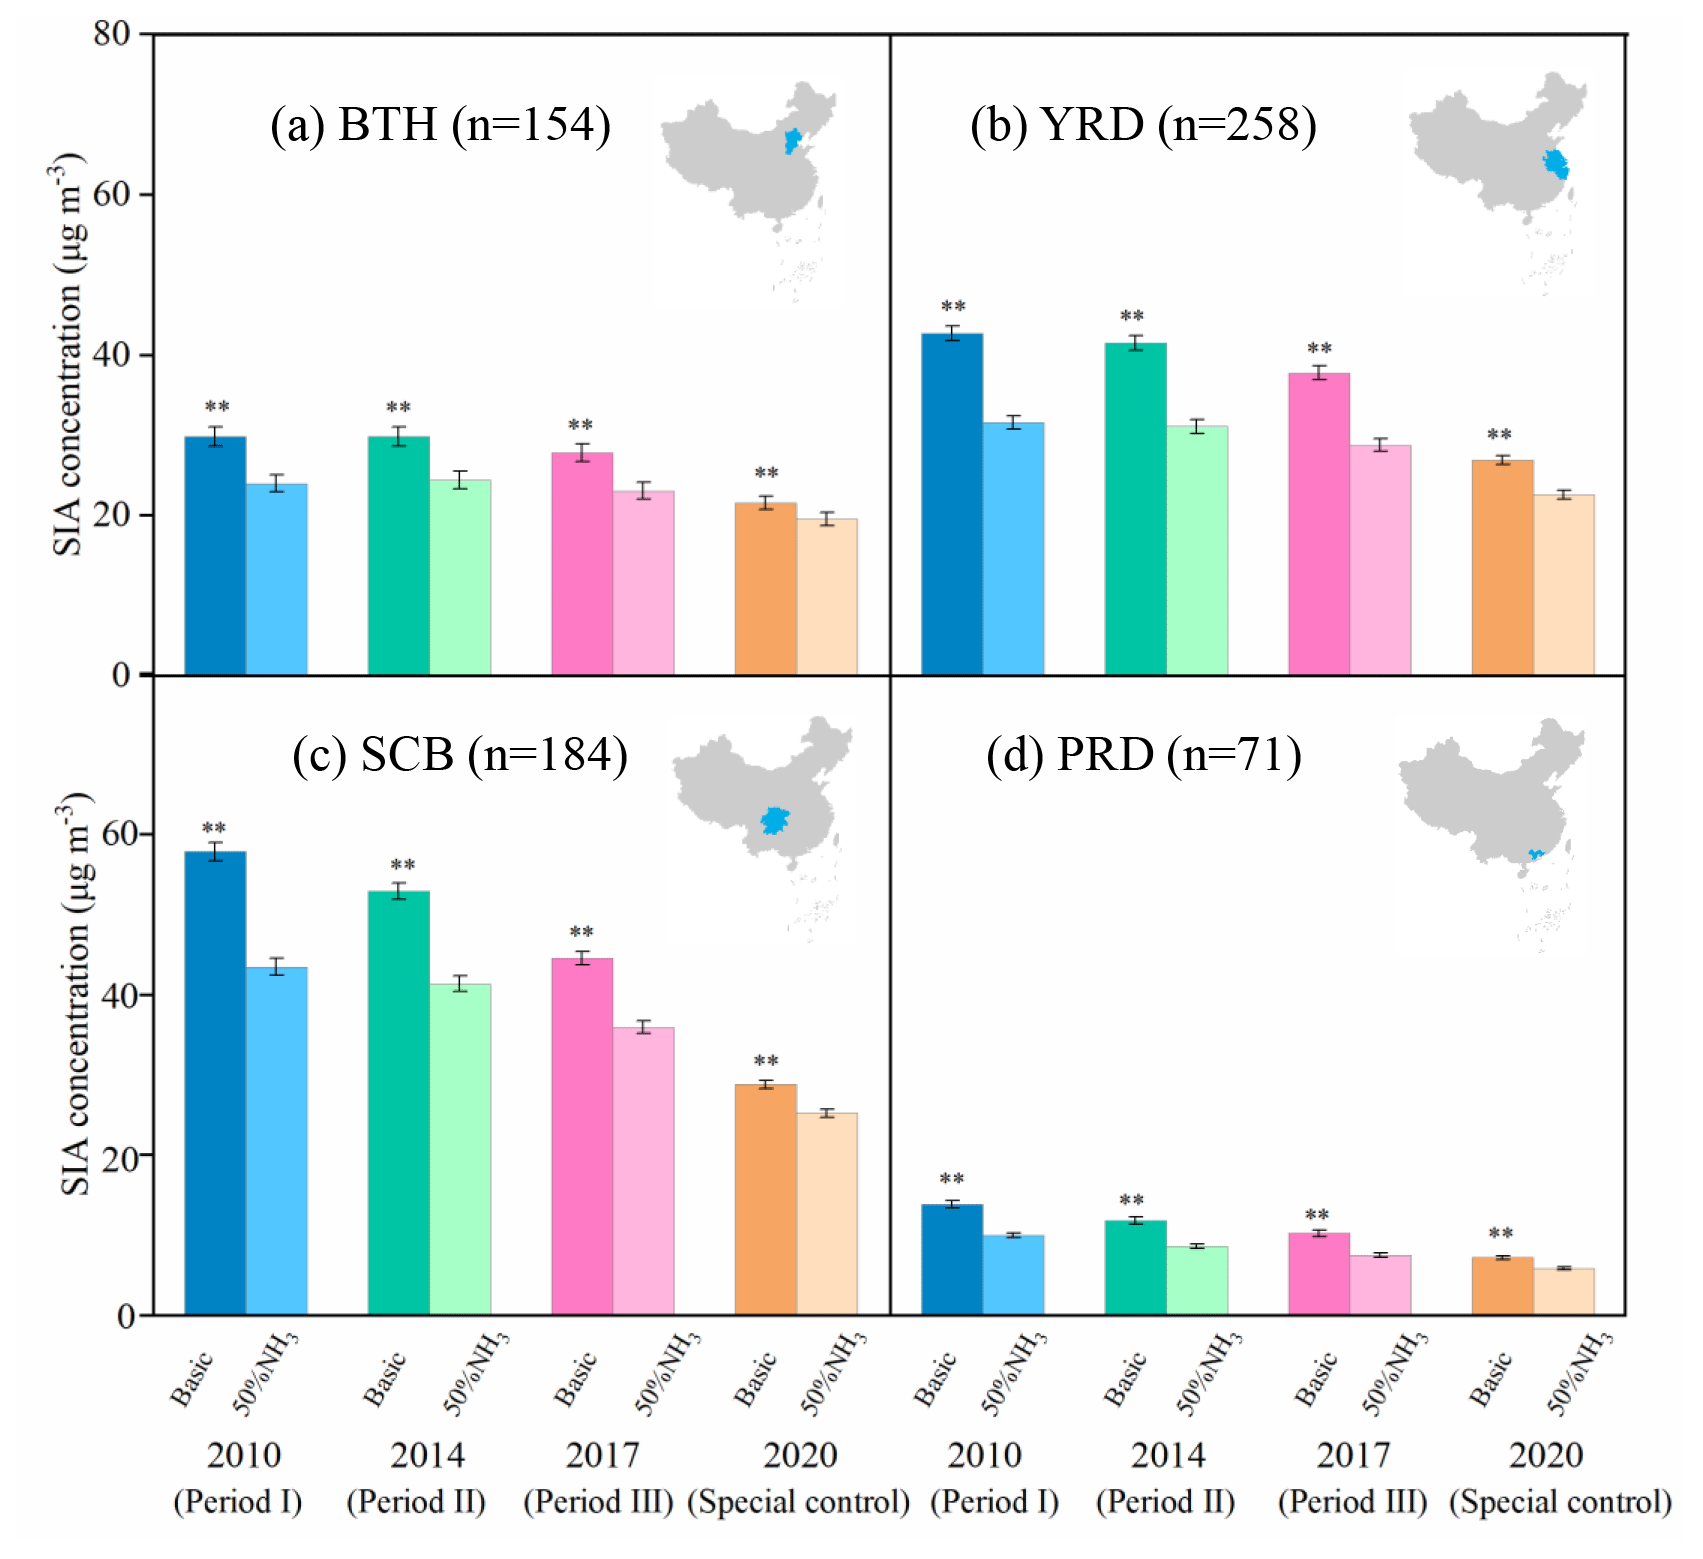
Figure 6Simulated SIA concentrations (in µg m−3) without (basic) and with 50 % ammonia (NH3) emission reductions in January for the years 2010, 2014, 2017, and 2020 in four megacity clusters (BTH: Beijing–Tianjin–Hebei, YRD: Yangtze River Delta, SCB: Sichuan Basin, PRD: Pearl River Delta). Inset maps indicate the location of each region. denotes significant difference without and with 50 % ammonia emission reductions (P<0.05). n is the number of calculated samples by grid extraction. Error bars are standard errors of means. Period I (2000–2012), period II (2013–2016), and period III (2017–2019); special control is the restrictions in economic activities and associated emissions during the COVID-19 lockdown period in 2020).
To further verify the above findings, we used the reductions in emissions of acid gases (46 % and 23 % for NOx and SO2, respectively, in the whole of China) during the COVID-19 lockdown period as a further scenario (Huang et al., 2021). The model simulations suggest that the effectiveness of reductions in SIA and PM2.5 concentrations by a 50 % NH3 emission reduction further declined in 2020 (15±0.2 % for SIA, and 5.1±0.2 % for PM2.5), but the resulting concentrations were lower (20.8±0.3 % for SIA, and 15.6±0.3 % for PM2.5) when compared with those in 2017 under the same scenario of an additional 50 % NH3 emission reduction (and constant meteorological conditions) (Fig. 6 and Table S6), highlighting the importance of concurrent NH3 mitigation when acid gas emissions are strengthened. To confirm the importance of acid gas emissions, another sensitivity simulation was conducted for 2017, in which the acid gas (NOx and SO2) emissions were reduced by 50 % (Fig. 7). We found that reductions in SIA concentrations were 13.4±0.5 % greater for the 50 % reductions in SO2 and NOx emissions than for the 50 % reductions in NH3 emissions. These results indicate that to substantially reduce SIA pollution it remains imperative to strengthen emission controls on NOx and SO2 even when a 50 % reduction in NH3 emission is targeted and achieved.
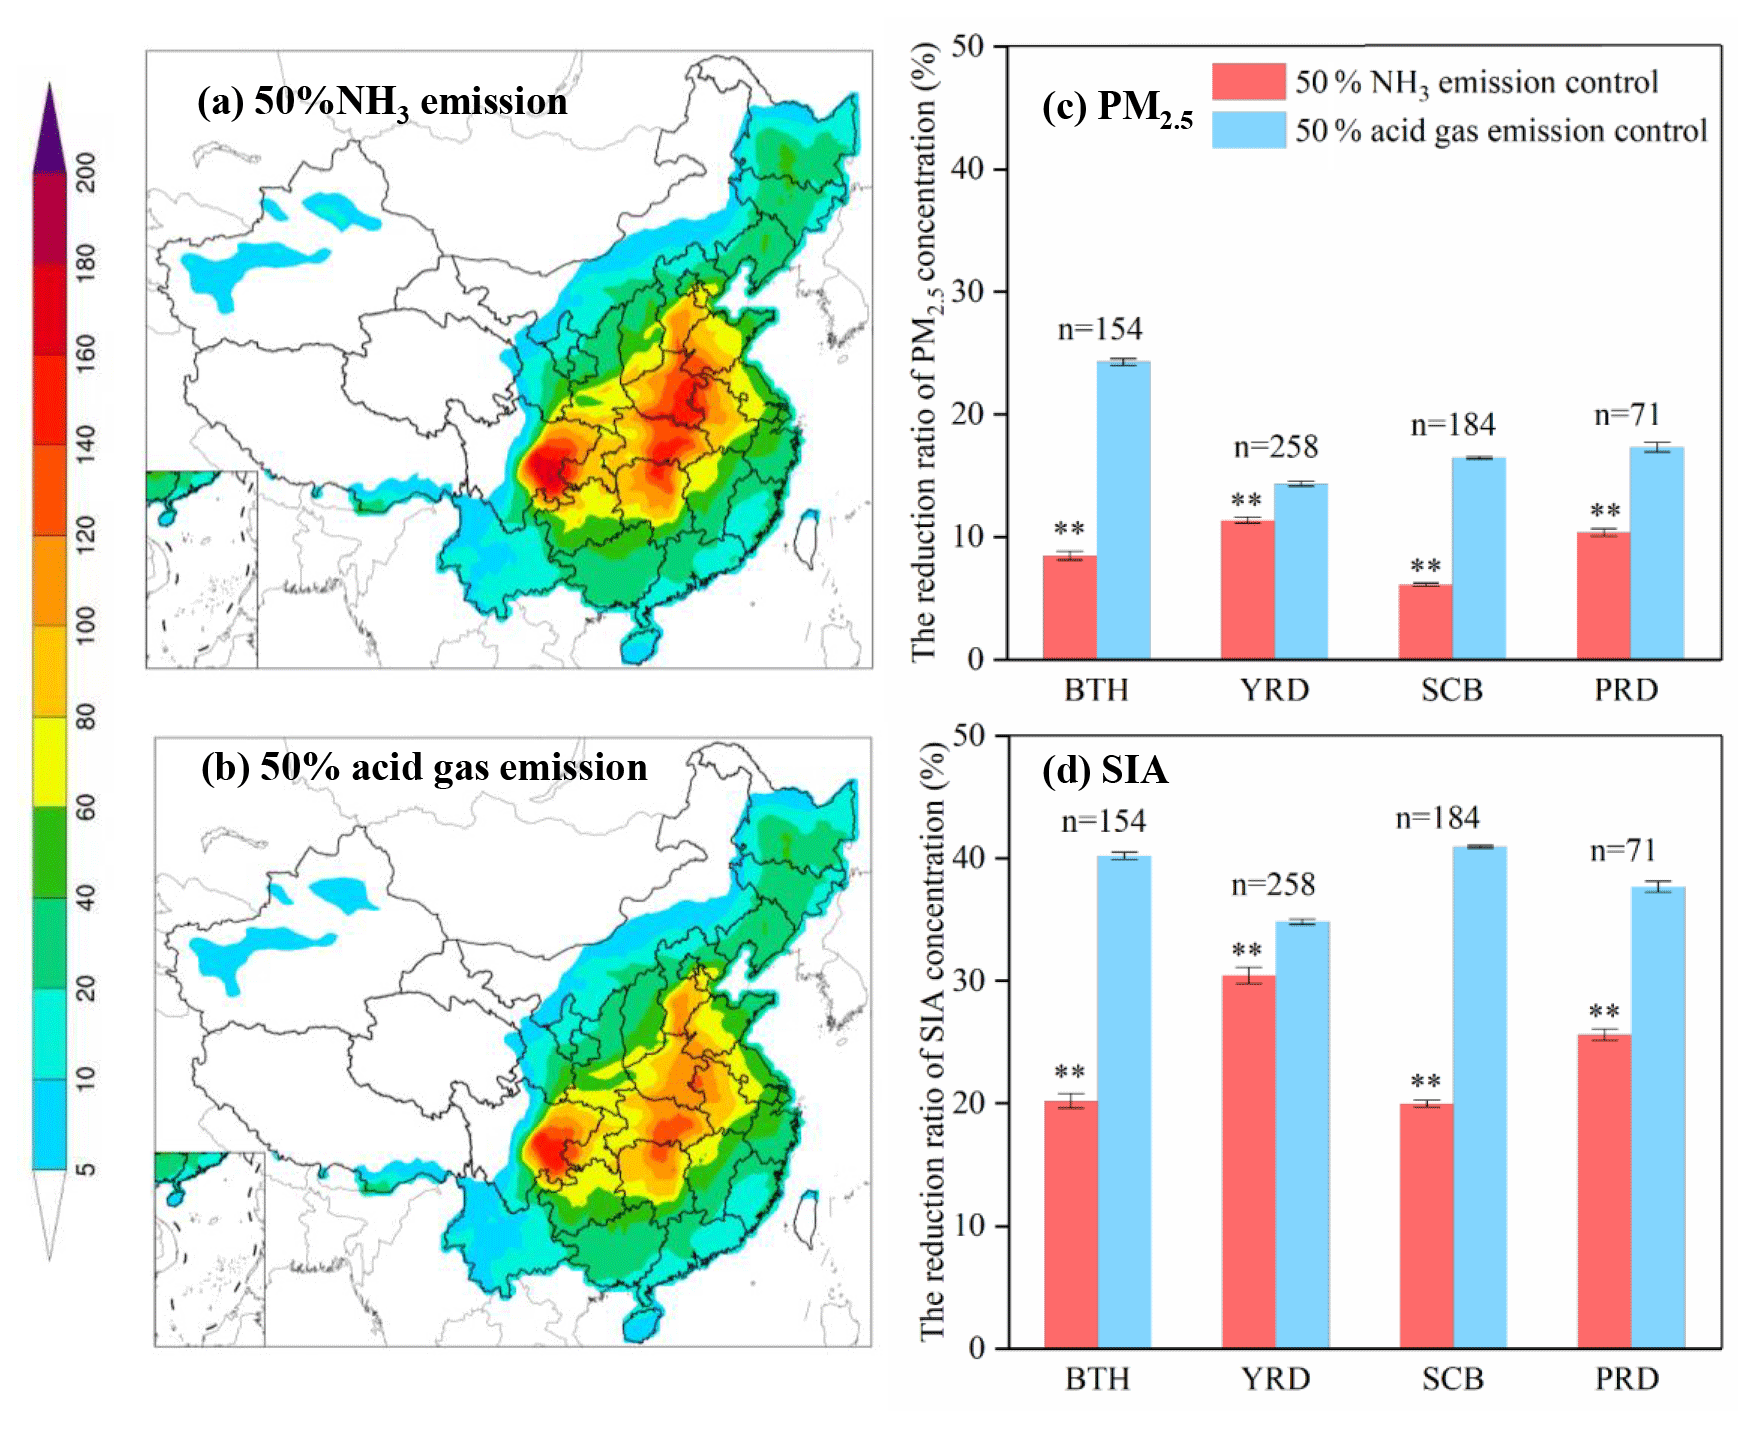
Figure 7Left: the spatial distributions of simulated PM2.5 concentrations (in µg m−3) in January 2017 with (a) 50 % reductions in ammonia (NH3) emissions and (b) 50 % reductions in acid gas (NOx and SO2) emissions. Right: the % decreases in PM2.5 (c) and SIA (d) concentrations for the simulations with versus without the NH3 and acid gas emission reductions in four megacity clusters (BTH: Beijing–Tianjin–Hebei, YRD: Yangtze River Delta, SCB: Sichuan Basin, PRD: Pearl River Delta). denotes significant differences without and with 50 % ammonia emission reductions (P<0.05). n is the number of calculated samples by grid extraction. Error bars are standard errors of means.
3.3 Uncertainty analysis and limitations
Some limitations should be noted in interpreting the results of the present study: this study examined period-to-period changes in PM2.5 chemical components based on a meta-analysis and the efficiencies of NH3 and acid gas emission reductions on PM2.5 mitigation. Some uncertainties may still exist in the meta-analysis of nationwide measurements owing to differences in monitoring, sample handling, and analysis methods as well as lack of long-term continuous monitoring sites (Fig. 2). For example, the measurements of PM2.5 were mainly taken using the TEOM method, which is associated with under-reading of PM due to some nitrate volatilization at its operational temperature. To test whether the use of data during 2000–2019 could bias annual trends of PM2.5 and chemical components, we summarize measurements of PM2.5 at a long-term monitoring site (Quzhou County) during the period 2012–2020. The PM2.5 and SO show a decreasing trend. The concentrations of NO and NH do not show a significant change (Fig. S8). The results are consistent with the trend for the whole of China obtained from the meta-analysis. Considering the uncertainty of PM2.5 and its major components between different seasons (winter, summer, etc.) and site type (urban, suburban, or rural), we have analyzed historic trend in the different season and sites (Figs. S13–S20). We found that concentrations of PM2.5 and its major chemical components (SO, NO, and NH were significantly higher in fall and winter than in spring and summer (Fig. S13). Only the winter season showed significant change trend in the three periods (Figs. S14–S17). The analyses also confirmed that pollution days predominated in winter. We also found that concentrations of PM2.5 and its major chemical components were higher at urban than at rural sites (Fig. S18). Spatially, the trends of PM2.5 and its major components are similar across the whole of China (both urban and rural areas) (Fig. S19). Rural areas show the same change trend on hazy days compared with the whole of China (Fig. S20).
The performance of the WRF-CMAQ model also has some uncertainty. We performed the validations of the WRF and CMAQ models. The simulations of temperature at 2 m above ground (T2), wind speed (WS), and relative humidity (RH) versus observed values at 400 monitoring sites in China are shown in Fig. S7. The meteorological measurements were obtained from the National Climate Data Center (NCDC) (ftp://ftp.ncdc.noaa.gov/pub/data/noaa/, last access: 10 May 2022). The comparisons showed that the model performed well at predicting meteorological parameters with R values of 0.94, 0.64, and 0.82 for T2, WS, and RH, respectively. However, the WS was overestimated (22.3 % NMB) in most regions of China, which is also reported in previous studies (Gao et al., 2016; Chen et al., 2019). This may be related to the underlying surface parameters set in the WRF model configurations.
In addition, the simulations of PM2.5 and associated chemical components by the CMAQ model have potential biases in the spatial pattern, although the CMAQ model has been extensively used in air quality studies (Backes et al., 2016; Zhang et al., 2019) and the validity of the chemical regime in the CMAQ model had been confirmed by our previous studies (Zhang et al., 2021a; L. Wang et al., 2020; Wang, 2021). Since nationwide measurements of PM2.5 and associated chemical components are lacking for 2010 in China, we undertook our own validation of PM2.5 and its components (such as SO, NO, and NH) using a multi-observation dataset that includes those monitoring data and satellite observations at a regional scale that were available.
First, the simulated monthly mean PM2.5 concentration in January 2010 was compared with corresponding data obtained from the ChinaHighAirPollutants (CHAP, https://weijing-rs.github.io/product.html, last access: 12 November 2019) database. The satellite historical PM2.5 predictions are reliable (average R2=0.80 and RMSE = 11.26 µg m−3) using cross validation against the in situ surface observations on a monthly basis (Wei et al., 2020, 2021). The model captured well the spatial distributions of PM2.5 concentrations in our study regions of BTH, YRD, PRD, and SCB (Fig. S3a), with correlation coefficients (R) between simulated and satellite observed PM2.5 concentrations of 0.96, 0.80, 0.60, and 0.85 for BTH, YRD, PRD, and SCB, respectively.
Second, we also collected ground-based observations from previous publications (Xiao et al., 2020, 2021; Geng et al., 2019; Xue et al., 2019) to validate the modeling concentrations of SO, NO, and NH. Detailed information about the monitoring sites is presented in Table S5. The distributions of the simulated monthly mean concentrations of SO, NO, and NH in January 2010 over China compared with collected surface measurements are shown in Fig. S4a, b, and c, respectively, with their linear regression analysis presented in Fig. S4d. The model showed underestimation in simulating SO and NO in the BTH region, which might be caused by the uncertainty in the emission inventory. The lack of heterogeneous pathways for SO formation in the CMAQ model might also be an important reason for the negative bias between simulations and measurements (Yu et al., 2005; Cheng et al., 2016). The model overestimated NO concentration in the SCB region, but can capture the spatial distribution of NO in other regions. The overestimation of NO has been a common problem in regional chemical transport models such as CMAQ, GEOS-CHEM, and CAMx (Yu et al., 2005; Fountoukis et al., 2011; Zhang et al., 2012; Wang et al., 2013), due to the difficulties in correctly capturing the gas- and aerosol-phase nitrate partitioning (Yu et al., 2005). The modeling of NH concentrations show good agreement with the observed values. Generally, the evaluation results indicate that the model reasonably predicted concentrations of SO, NO, and NH in PM2.5.
Third, we performed a comparison of the time-series of the observed and simulated hourly PM2.5 and its precursors (SO2 and NO2) during January 2010. The model captures well the temporal variations of the PM2.5 in Beijing, with an NMB value of 0.05 µg m−3, NME of 28 %, and R of 0.92 (Fig. 5a). The predicted daily concentrations of NO2 and SO2 during January 2010 also show good agreement with the ground measurements in Beijing, with NMB and R values of 0.12 µg m−3 and 0.89 for NO2, and −0.04 and 0.95 for SO2, respectively (Fig. 5b). The variations of daily PM2.5 concentrations between simulation and observation at four monitoring sites (Shangdianzi, Chengdu, Institute of Atmospheric Physics, Chinese Academy of Sciences (IAP-CAS), and Tianjin) from 14 to 30 January 2010 also matched well, with NMB values ranging from −0.05 to 0.12 µg m−3, and R values exceeding 0.89 (Fig. S5c).
We also compared the simulated and observed concentrations of PM2.5, NO2, and SO2 in China in the pre-COVID period (1–26 January 2020) and during the COVID-19 lockdown period (27 January to 26 February) with actual meteorological conditions. As shown in Fig. S6, both the simulations and observations suggested that the PM2.5 and NO2 concentrations substantially decreased during the COVID-19 lockdown, mainly due to the sharp reduction in vehicle emissions (Huang et al., 2021; Wang et al., 2021). For SO2, the concentrations decreased very little and even increased at some monitoring sites. The model underestimated the concentrations of PM2.5, NO2, and SO2, with NMB values of −21.4 %, −22.1 %, and −9.6 %, respectively. We also newly evaluated the model performance in actual meteorological conditions for PM2.5 concentrations in January 2014 and 2017. As shown in Fig. S21, the model captured well the spatial distribution of PM2.5 concentration in China with MB (NMB) values of 23.2 µg m−3 (15.4 %) and 26.8 µg m−3 (−26.7 %) for 2014 and 2017, respectively. The simulated PM2.5 concentrations compared well against the observations, with R values of 0.82 and 0.65, respectively
3.4 Implication and outlook
Improving air quality is a significant challenge for China and the world. A key target in China is for all cities to attain annual mean PM2.5 concentrations of 35 µg m−3 or below by 2035 (Xing et al., 2021). However, this study has shown that 74 % of 1498 nationwide measurement sites have exceeded this limit value in recent years (averaged across 2015–2019). Our results indicated that acid gas emissions still need to be a focus of control measures, alongside reductions in NH3 emissions, in order to reduce SIA (or PM2.5) formation. Model simulations for the month of January underpin the finding that the relative effectiveness of NH3 emission control decreased from 2010 to 2017. However, simulating the substantial emission reductions in acid gases due to the lockdown during the COVID-19 pandemic, with fossil fuel-related emissions reduced to unprecedented levels, indicated the importance of ammonia emission abatement for PM2.5 air quality improvements when SO2 and NOx emissions have already reached comparatively low levels. Therefore, a strategic and integrated approach to simultaneously undertaking acid gas emission and NH3 mitigation is essential to substantially reduce PM2.5 concentrations. However, the mitigation of acid gas and NH3 emissions poses different challenges due to the different sources they originate from.
The implementation of further reductions in acid gas emissions is challenging. The prevention and control of air pollution in China originally focused on the control of acid gas emissions (Fig. S2). The controls have developed from desulfurization and denitrification technologies in the early stages to advanced end-of-pipe control technologies. By 2018, over 90 % of coal-fired power plants had installed end-of-pipe control technologies (CEC, 2019). The potential for further reductions in acid gas emissions by end-of-pipe technology might therefore be limited. Instead, addressing total energy consumption and the promotion of a transition to clean energy through a de-carbonization of energy production is expected to be an inevitable requirement for further reducing PM2.5 concentrations (Xing et al., 2021). In the context of improving air quality and mitigating climate change, China is adopting a portfolio of low-carbon policies to meet its nationally determined contribution pledged in the Paris Agreement. Studies show that if energy structure adjusts and energy conservation measures are implemented, SO2 and NOx will be further reduced by 34 % and 25 % in a co-benefit energy scenario compared to the nationally determined contribution scenario in 2035 (Xing et al., 2021). Although it has been reported that excessive acid gas emission controls may increase the oxidizing capacity of the atmosphere and increase other pollution, PM2.5 concentrations have consistently decreased with previous acid gas control (Huang et al., 2021). In addition, under the influence of low-carbon policies, other pollutant emissions will also be controlled. Opportunities and challenges coexist in the control of acid gas emissions.
In contrast to acid gas emissions, NH3 emissions predominantly come from agricultural sources. Although the Chinese government has recognized the importance of NH3 emission controls in curbing PM2.5 pollution, NH3 emission reductions have only been proposed recently as a strategic option and no specific nationwide targets have yet been implemented (CSC, 2018b). The efficient implementation of NH3 reduction options is a major challenge because NH3 emissions are closely related to food production, and smallholder farming is still the dominant form of agricultural production in China. The implementation of NH3 emission reduction technologies is subject to investment in technology, knowledge, and infrastructure, and most farmers are unwilling or economically unable to undertake additional expenditures that cannot generate financial returns (Gu et al., 2011; Y. Y. Wu et al., 2018). Therefore, economically feasible options for NH3 emission controls need to be developed and implemented nationwide.
We propose the following three requirements that need to be met in order to achieve effective reductions of SIA concentrations and hence of PM2.5 concentrations in China.
First, binding targets to reduce both NH3 and acid gas emissions should be set. The targets should be designed to meet the PM2.5 standard, and NH3 concentrations should be incorporated into the monitoring system as a government assessment indicator. In this study, we find large differences in PM2.5 concentration reductions from NH3 emission reductions in the four megacity regions investigated. At a local scale (i.e., city or county), the limiting factors may vary within a region (Wang et al., 2011). Thus, local-specific environmental targets should be considered in policy-making.
Second, further strengthening of the controls on acid gas emissions are still needed, especially under the influence of low-carbon policies, to promote emission reductions and the adjustment of energy structures and conservation. Ultra-low emissions should be requirements in the whole production process, including point source emissions, diffuse source emissions, and clean transportation (Xing et al., 2021; Wang, 2021). The assessment of the impact of ultra-low emissions is provided in Table S7. In terms of energy structure, it is a requirement to eliminate outdated production capacity and promote low-carbon new energy-generation technologies.
Third, a requirement to promote feasible NH3 reduction options throughout the whole food production chain, for both crop and animal production, is important. Options include the following. (1) Reduction of nitrogen input at source achieved, e.g., through balanced fertilization based on crop needs instead of over-fertilization, and promotion of low-protein feed in animal breeding. (2) Mitigation of NH3 emissions in food production via, e.g., improved fertilization techniques (such as enhanced-efficiency fertilizer, urease inhibitor products), fertilizer deep application, fertilization-irrigation technologies (Zhan et al., 2021), and coverage of solid and slurry manure. (3) Encouragement for the recycling of manure back to croplands, and reduction in manure discarding and long-distance transportation of manure fertilizer. Options for NH3 emission control are provided in Table S4. Although the focus here has been on methods to mitigate NH3 emissions, it is of course critical simultaneously to minimize nitrogen losses in other chemical forms such as nitrous oxide gas emissions and aqueous nitrate leaching (Q. H. Wang et al., 2020).
The present study developed an integrated assessment framework using a meta-analysis of published literature results, analysis of national monitoring data, and chemical transport modeling to provide insight into the effectiveness of SIA precursor emission controls in mitigating poor PM2.5 air quality in China. We found that PM2.5 concentrations significantly decreased during 2000–2019 due to acid gas control policies, but PM2.5 pollution was still severe. Compared with other components, this difference was significantly higher (average increase 98 %) for secondary inorganic ions (i.e., SO, NO, and NH) on hazy days than on-hazy days. This is mainly caused by the persistent SIA pollution during the same period, with sulfate concentrations significantly decreased and no significant changes observed for nitrate and ammonium concentrations. The SIA concentrations in January in megacity clusters of eastern China, by an additional 50 % NH3 emission control, decreased from 25.9±0.3 % in 2010 to 22.9±0.3 % in 2017, and to 15±0.2 % during the COVID-19 lockdown in 2020 for simulations representing reduced acid gas emissions to unprecedented levels; however, the SIA concentrations decreased by 20.8±0.3 % in 2020 compared with those in 2017 under the same scenario of an additional 50 % NH3 emission reduction. In addition, the reduction of SIA concentration in 2017 was 13.4±0.5 % greater for 50 % acid gas (SO2 and NOx) reductions than for the NH3 emission reduction. These results indicate that acid gas emissions need to be further controlled in concert with NH3 reductions in order to substantially reduce PM2.5 pollution in China.
Overall, this study provides new insight into the responses of SIA concentrations in China to past air pollution control policies and the potential balance of benefits in including NH3 emission reductions with acid gas emission controls to curb SIA pollution. The outcomes from this study may also help other countries seeking feasible strategies to mitigate PM2.5 pollution.
All data for meta-analysis in this study are available at https://doi.org/10.6084/m9.figshare.16429092 (Xu, 2022).
The supplement related to this article is available online at: https://doi.org/10.5194/acp-22-6291-2022-supplement.
WX, SY, and FZ designed the study. FM, YibZ, WX, and JK performed the research. FM, YibZ, WX, and JK analyzed the data and interpreted the results. YibZ conducted the model simulations. LL provided satellite-derived surface NH3 concentration. FM, WX, YibZ, and MRH wrote the paper, SR, MW, KW, JK, YinZ, YH, PL, JW, ZC, XL, MRH, SY and FZ contributed to the discussion and revision of the paper.
The contact author has declared that neither they nor their co-authors have any competing interests.
Publisher's note: Copernicus Publications remains neutral with regard to jurisdictional claims in published maps and institutional affiliations.
We would like to thank Yuepeng Pan and Yangyang Zhang for their help in providing field measurements for validation of the modeling results.
This study was supported by National Natural Science Foundation of China (grant nos. 42175137, 21577126 and 41561144004), China Scholarship Council (grant no. 201913043), the National Key Research and Development Program of China (grant no. 2021YFD1700900), the Department of Science and Technology of China (grant nos. 2016YFC0202702, 2018YFC0213506 and 2018YFC0213503), National Research Program for Key Issues in Air Pollution Control in China (grant no. DQGG0107), and the High-level Team Project of China Agricultural University. SR's contribution was supported by the Natural Environment Research Council award number NE/R000131/1 as part of the SUNRISE program delivering National Capability.
This paper was edited by James Allan and reviewed by four anonymous referees.
An, Z. S., Huang, R. J., Zhang, R. Y., Tie, X. X., Li, G. H., Cao, J. J., Zhou, W. J., Shi, Z. G., Han, Y. M., Gu, Z. L., and Ji, Y. M.: Severe haze in northern China: A synergy of anthropogenic emissions and atmospheric processes, P. Natl. Acad. Sci. USA, 116, 8657–8666, https://doi.org/10.1073/pnas.1900125116, 2019.
Backes, A., Aulinger, A., Bieser, J., Matthias, V., and Quante, M.: Ammonia emissions in Europe, part II: How ammonia emission abatement strategies affect secondary aerosols, Atmos. Environ., 126, 153–161, https://doi.org/10.1016/j.atmosenv.2015.11.039, 2016.
Bai, Z., Winiwarter, W., Klimont, Z., Velthof, G., Misselbrook, T., Zhao, Z., Jin, X., Oenema, O., Hu, C., and Ma, L.: Further improvement of air quality in China needs clear ammonia mitigation target, Environ. Sci. Technol., 53, 10542–10544, https://doi.org/10.1021/acs.est.9b04725, 2019.
Benitez-Lopez, A., Alkemade, R., Schipper, A. M., Ingram, D. J., Verweij, P. A., Eikelboom, J. A. J., and Huijbregts, M. A. J.: The impact of hunting on tropical mammal and bird populations, Science, 356, 180–183, https://doi.org/10.1126/science.aaj1891, 2017.
Bracken, M. B.: Statistical methods for analysis of effects of treatment in overviews of randomized trials, in: Effective care of the newborn infant, edited by: Sinclair, J. C. and Bracken, M. B., Oxford University Press, 1992.
Chen, Z., Chen, D., Wen, W., Zhuang, Y., Kwan, M.-P., Chen, B., Zhao, B., Yang, L., Gao, B., Li, R., and Xu, B.: Evaluating the “2+26” regional strategy for air quality improvement during two air pollution alerts in Beijing: variations in PM2.5 concentrations, source apportionment, and the relative contribution of local emission and regional transport, Atmos. Chem. Phys., 19, 6879–6891, https://doi.org/10.5194/acp-19-6879-2019, 2019.
Cheng, Y. F., Zheng, G. A., Wei, C., Mu, Q., Zheng, B., Wang, Z. B., Gao, M., Zhang, Q., He, K. B., Carmichael, G., Pöschl, U., and Su, H.: Reactive nitrogen chemistry in aerosol water as a source of sulfate during haze events in China, Sci. Adv., 2, e1601530, https://doi.org/10.1126/sciadv.1601530, 2016.
CEC (China Electricity Council): China Power Industry Annual Development Report 2019, https://www.cec.org.cn/yaowenkuaidi/2019-06-14/191782.html, last access: 14 June 2019.
CSC (China State Council): The 11th Five-Year plan on energy saving and emissions reduction, http://www.gov.cn/zhengce/content/2008-03/28/content_4877.htm (last access: 28 March 2008), 2007.
CSC (China State Council): The 12th Five-Year plan on energy saving and emissions reduction, http://www.gov.cn/zwgk/2011-12/20/content_2024895.htm, last access: 20 December 2011.
CSC (China State Council): Action Plan on Prevention and Control of Air Pollution, China State Council, Beijing, China, http://www.gov.cn/zwgk/2013-09/12/content_2486773.htm, last access: 12 September 2013a.
CSC (China State Council): The 13th Five-Year plan on energy saving and emissions reduction, http://www.gov.cn/zhengce/content/2016-12/05/content_5143290.htm, last access: 12 September 2013b.
CSC (China State Council): Air quality targets set by the Action Plan have been fully realized, http://www.gov.cn/xinwen/2018-02/01/content_5262720.htm, last access: 1 February 2018a.
CSC (China State Council): Notice of the state council on issuing the three-year action plan for winning the Blue Sky defense battle, http://www.gov.cn/zhengce/content/2018-07/03/content_5303158.htm, last access: 3 July 2018b.
Dunn, O. J.: Multiple comparisons using rank sums, Technometrics, 6, 241–252, 1964.
Fountoukis, C., Racherla, P. N., Denier van der Gon, H. A. C., Polymeneas, P., Charalampidis, P. E., Pilinis, C., Wiedensohler, A., Dall'Osto, M., O'Dowd, C., and Pandis, S. N.: Evaluation of a three-dimensional chemical transport model (PMCAMx) in the European domain during the EUCAARI May 2008 campaign, Atmos. Chem. Phys., 11, 10331–10347, https://doi.org/10.5194/acp-11-10331-2011, 2011.
Fan, C., Li, Z., Li, Y., Dong, J., van der A, R., and de Leeuw, G.: Variability of NO2 concentrations over China and effect on air quality derived from satellite and ground-based observations, Atmos. Chem. Phys., 21, 7723–7748, https://doi.org/10.5194/acp-21-7723-2021, 2021.
Feng, S. J., Xu, W., Cheng, M. M., Ma, Y. X., Wu, L. B., Kang, J. H., Wang, K., Tang, A. H., Collett Jr., J. L., Fang, Y. T., Goulding, K., Liu, X. J., and Zhang, F. S.: Overlooked nonagricultural and wintertime agricultural NH3 emissions in Quzhou County, North China Plain: Evidence from 15N-stable isotopes, Environ. Sci. Tech. Let., 9, 127–133, https://doi.org/10.1021/acs.estlett.1c00935, 2022.
Gao, M., Carmichael, G. R., Wang, Y., Saide, P. E., Yu, M., Xin, J., Liu, Z., and Wang, Z.: Modeling study of the 2010 regional haze event in the North China Plain, Atmos. Chem. Phys., 16, 1673–1691, https://doi.org/10.5194/acp-16-1673-2016, 2016.
Geng, G., Zhang, Q., Tong, D., Li, M., Zheng, Y., Wang, S., and He, K.: Chemical composition of ambient PM2.5 over China and relationship to precursor emissions during 2005–2012, Atmos. Chem. Phys., 17, 9187–9203, https://doi.org/10.5194/acp-17-9187-2017, 2017.
Geng, G., Xiao, Q., Zheng, Y., Tong, D., Zhang, Y., Zhang, X., Zhang, Q., He, K., and Liu, Y.: Impact of China's air pollution prevention and control action plan on PM2.5 chemical composition over eastern China, Sci. China Earth Sci., 62, 1872–1884, https://doi.org/10.1007/s11430-018-9353-x, 2019.
Geng, G., Xiao, Q., Liu, S., Liu, X., Cheng, J., Zheng, Y., Xue, T., Tong, D., Zheng, B., Peng, Y., and Huang, X.: Tracking air pollution in China: Near real-time PM2.5 retrievals from multisource data fusion, Environ. Sci. Technol., 55, 12106–12115, https://doi.org/10.1021/acs.est.1c01863, 2021.
Gu, B. J., Zhu, Y. M., Chang, J., Peng, C. H., Liu, D., Min, Y., Luo, W. D., Howarth, R. W., and Ge, Y.: The role of technology and policy in mitigating regional nitrogen pollution, Environ. Res. Lett., 6, 014011, https://doi.org/10.1088/1748-9326/6/1/014011, 2011.
Guenther, A. B., Jiang, X., Heald, C. L., Sakulyanontvittaya, T., Duhl, T., Emmons, L. K., and Wang, X.: The Model of Emissions of Gases and Aerosols from Nature version 2.1 (MEGAN2.1): an extended and updated framework for modeling biogenic emissions, Geosci. Model Dev., 5, 1471–1492, https://doi.org/10.5194/gmd-5-1471-2012, 2012.
Han, Y., Wu, Y. F., Don, H. Y., and Chen, F.: Characteristics of PM2.5 and its chemical composition during the Asia-Pacific Economic Cooperation Summit in Beijing-Tianjin-Hebei Region and surrounding cities, Environ. Sci. Technol., 40, 134–138, 2017 (in Chinese with English abstract).
Huang, R. J., Zhang, Y. L., Bozzetti, C., Ho, K. F., Cao, J. J., Han, Y. M., Daellenbach, K. R., Slowik, J. G., Platt, S. M., Canonaco, F., Zotter, P., Wolf, R., Pieber, S. M., Bruns, E. A., Crippa, M., Ciarelli, G., Piazzalunga, A., Schwikowski, M., Abbaszade, G., Schnelle-Kreis, J., Zimmermann, R., An, Z. S., Szidat, S., Baltensperger, U., El Haddad, I., and Prevot, A. S.: High secondary aerosol contribution to particulate pollution during haze events in China, Nature, 514, 218–222, https://doi.org/10.1038/nature13774, 2014.
Huang, X., Ding, A. J., Gao, J., Zheng, B., Zhou, D. R., Qi, X. M., Tang, R., Wang, J. P., Ren, C. H., Nie, W., Chi, X. G., Xu, Z., Chen, L. D., Li, Y. Y., Che, F., Pang, N. N., Wang, H. K., Tong, D., Qin, W., Cheng, W., Liu, W. J., Fu, Q. Y., Liu, B. X., Chai, F. H., Davis, S. J., Zhang, Q., and He, K. B.: Enhanced secondary pollution offset reduction of primary emissions during COVID-19 lockdown in China, Natl. Sci. Rev., 8, nwaa137, https://doi.org/10.1093/nsr/nwaa137, 2021.
Ianniello, A., Spataro, F., Esposito, G., Allegrini, I., Rantica, E., Ancora, M. P., Hu, M., and Zhu, T.: Occurrence of gas phase ammonia in the area of Beijing (China), Atmos. Chem. Phys., 10, 9487–9503, https://doi.org/10.5194/acp-10-9487-2010, 2010.
Kang, Y., Liu, M., Song, Y., Huang, X., Yao, H., Cai, X., Zhang, H., Kang, L., Liu, X., Yan, X., He, H., Zhang, Q., Shao, M., and Zhu, T.: High-resolution ammonia emissions inventories in China from 1980 to 2012, Atmos. Chem. Phys., 16, 2043–2058, https://doi.org/10.5194/acp-16-2043-2016, 2016.
Kruskal, W. H. and Wallis, W. A.: Use of ranks in one-criterion variance analysis, J. Am. Stat. Assoc., 47, 583–621, https://doi.org/10.1080/01621459.1952.10483441, 1952.
Kuerban, M., Waili, Y., Fan, F., Liu, Y., Qin, W., Dore, A. J., Dore, A. J., Xu, W., and Zhang, F. S.: Spatio-temporal patterns of air pollution in China from 2015 to 2018 and implications for health risks, Environ. Pollut., 258, 113659, https://doi.org/10.1016/j.envpol.2019.113659, 2020.
Li, H., Zhang, Q., Zheng, B., Chen, C., Wu, N., Guo, H., Zhang, Y., Zheng, Y., Li, X., and He, K.: Nitrate-driven urban haze pollution during summertime over the North China Plain, Atmos. Chem. Phys., 18, 5293–5306, https://doi.org/10.5194/acp-18-5293-2018, 2018.
Li, H., Cheng, J., Zhang, Q., Zheng, B., Zhang, Y., Zheng, G., and He, K.: Rapid transition in winter aerosol composition in Beijing from 2014 to 2017: response to clean air actions, Atmos. Chem. Phys., 19, 11485–11499, https://doi.org/10.5194/acp-19-11485-2019, 2019.
Li, K., Jacob, D. J., Shen, L., Lu, X., De Smedt, I., and Liao, H.: Increases in surface ozone pollution in China from 2013 to 2019: anthropogenic and meteorological influences, Atmos. Chem. Phys., 20, 11423–11433, https://doi.org/10.5194/acp-20-11423-2020, 2020.
Li, M., Liu, H., Geng, G., Geng, G. N., Hong, C. P., Liu, F., Song, Y., Tong, D., Zheng, B., Cui, H. Y., Man, H. Y., Zhang, Q., and He, K. B.: Anthropogenic emission inventories in China: a review, Natl. Sci. Rev., 4, 834–866, https://doi.org/10.1093/nsr/nwx150, 2017.
Li, X., Bei, N., Hu, B., Wu, J., Pan, Y., Wen, T., Liu, Z., Liu, L., Wang, R., and Li, G.: Mitigating NOx emissions does not help alleviate wintertime particulate pollution in Beijing-Tianjin-Hebei, China, Environ. Pollut., 279, 116931, https://doi.org/10.1016/j.envpol.2021.116931, 2021.
Liang, F. C., Xiao, Q. Y., Huang, K. Y., Yang, X. L., Liu, F. C ., Li, J. X., Lu, X. F., Liu, Y., and Gu, D. F.: The 17-y spatiotemporal trend of PM2.5 and its mortality burden in China, P. Natl. Acad. Sci. USA, 117, 25601–25608, https://doi.org/10.1073/pnas.1919641117, 2020.
Liu, J., Han, Y. Q., Tang, X., Zhu, J., and Zhu, T.: Estimating adult mortality attributable to PM2.5 exposure in China with assimilated PM2.5 concentrations based on a ground monitoring network, Sci. Total. Environ., 568, 1253–1262, https://doi.org/10.1016/j.scitotenv.2016.05.165, 2016.
Liu, L., Zhang, X., Wong, A. Y. H., Xu, W., Liu, X., Li, Y., Mi, H., Lu, X., Zhao, L., Wang, Z., Wu, X., and Wei, J.: Estimating global surface ammonia concentrations inferred from satellite retrievals, Atmos. Chem. Phys., 19, 12051–12066, https://doi.org/10.5194/acp-19-12051-2019, 2019.
Liu, M. X., Huang, X., Song, Y., Tang, J., Cao, J. J., Zhang, X. Y., Zhang, Q., Wang, S. X., Xu, T. T., Kang, L., Cai, X. H., Zhang, H. S., Yang, F. M., Wang, H. B., Yu, J. Z., Lau, A. K. H., He, L. Y., Huang, X. F., Duan, L., Ding, A. J., Xue, L. K., Gao, J., Liu, B., and Zhu, T.: Ammonia emission control in China would mitigate haze pollution and nitrogen deposition, but worsen acid rain, P. Natl. Acad. Sci. USA, 116, 7760–7765, https://doi.org/10.1073/pnas.1814880116, 2019.
Liu, X. J., Sha, Z. P., Song, Y., Dong, H. M., Pan, Y. P., Gao, Z. L., Li, Y. E., Ma, L., Dong, W. X., Hu, C. S., Wang, W. L., Wang, Y., Geng, H., Zheng, Y. H., and Gu, M. N.: China's atmospheric ammonia emission characteristics, mitigation options and policy recommendations, Res. Environ. Sci., 34, 149–157, https://doi.org/10.13198/j.issn.1001-6929.2020.11.12, 2021.
Mao, S. S., Chen, T, Fu, J. M., Liang, J. L., An, X. X., Luo, X. X., Zhang, D. W., and Liu, B. X.: Characteristic analysis for the thick winter air pollution accidents in Beijing based on the online observations, Journal of Safety and Environment, 1, 1009–6094, 2018 (in Chinese with English abstract).
MEEP: The Ministry of Ecology and Environment of the People's Republic of China, 57 pp., China Ecological Environment Bulletin, http://www.mee.gov.cn/hjzl/sthjzk/zghjzkgb/ (last access: 2 June 2020), 2019.
Megaritis, A. G., Fountoukis, C., Charalampidis, P. E., Pilinis, C., and Pandis, S. N.: Response of fine particulate matter concentrations to changes of emissions and temperature in Europe, Atmos. Chem. Phys., 13, 3423–3443, https://doi.org/10.5194/acp-13-3423-2013, 2013.
Meng, F. L., Wang, M. R., Strokal, M., Kroeze, C., Ma, L., Li, Y. N., Zhang, Q., Wei, Z. B., Hou, Y., Liu, X. J., Xu, W., and Zhang, F. S.: Nitrogen losses from food production in the North China Plain: A case study for Quzhou, Sci. Total. Environ., 816, 151557, https://doi.org/10.1016/j.scitotenv.2021.151557, 2022.
MEPC: Ministry of Environment Protection of China, Ambient air quality standards (GB3095–2012), http://www.mep. gov.cn/, last access: 26 June 2012.
Morrison, H., Thompson, G., and Tatarskii, V.: Impact of cloud microphysics on the development of trailing stratiform precipitation in a simulated squall line: comparison of one- and two-moment schemes, Mon. Weather. Rev., 137, 991–1007, https://doi.org/10.1175/2008MWR2556.1, 2009.
Nakagawa, S. and Santos, E. S. A.: Methodological issues and advances in biological meta-analysis, Evol. Ecol., 26, 1253–1274, https://doi.org/10.1007/s10682-012-9555-5, 2012.
Ortiz-Montalvo, D., Häkkinen, S. A. K., Schwier, A. N., Lim, Y. B., Faye McNeill, V., and Turpin, B. J.: Ammonium addition (and aerosol pH) has a dramatic impact on the volatility and yield of glyoxal secondary organic aerosol, Environ. Sci. Technol., 48, 255–262, https://doi.org/10.1021/es4035667, 2014.
Pan, Y. P., Wang, Y. S., Tang, G. Q., and Wu, D.: Wet and dry deposition of atmospheric nitrogen at ten sites in Northern China, Atmos. Chem. Phys., 12, 6515–6535, https://doi.org/10.5194/acp-12-6515-2012, 2012.
Pinder, R. W., Adams, P. J., and Pandis, S. N.: Ammonia emission controls as a cost-effective strategy for reducing atmospheric particulate matter in the eastern United States, Environ. Sci. Technol., 41, 380–386, https://doi.org/10.1021/es060379a, 2007.
Sun, Y. L., Zhuang, G. S., Tang, A. H., Wang, Y., and An, Z. S.: Chemical characteristics of PM2.5 and PM10 in haze-fog episodes in Beijing, Environ. Sci. Technol., 40, 3148–3155, https://doi.org/10.1021/es051533g, 2006.
Tao, J., Gao, J., Zhang, L. M., Wang, H., Qiu, X. H., Zhang, Z. S., Wu, Y. F., Chai, F. H., and Wang, S. L: Chemical and optical characteristics of atmospheric aerosols in Beijing during the Asia-Pacific Economic Cooperation China 2014, Atmos. Environ., 144, 8–16, https://doi.org/10.1016/j.atmosenv.2016.08.067, 2016.
van der A, R. J., Mijling, B., Ding, J., Koukouli, M. E., Liu, F., Li, Q., Mao, H., and Theys, N.: Cleaning up the air: effectiveness of air quality policy for SO2 and NOx emissions in China, Atmos. Chem. Phys., 17, 1775–1789, https://doi.org/10.5194/acp-17-1775-2017, 2017.
Wang, G. H., Zhang, R. Y., Gomez, M. E., Yang, L. X., Zamora, M. L., Hu, M., Lin, Y., Peng, J. F., Guo, S., Meng, J. J., Li, J. J., Cheng, C. L., Hu, T. F., Ren, Y. Q., Wang, Y. S., Gao, J., Cao, J. J., An, Z. S., Zhou, W. J., Li, G. H., Wang, J. Y., Tian, P. F., Marrero-Ortiz, W., Secrest, J., Du, Z. F., Zheng, J., Shang, D. J., Zeng, L. M., Shao, M., Wang, W. G., Huang, Y., Wang, Y., Zhu, Y. J., Li, Y. X., Hu, J. X., Pan, B., Cai, L., Cheng, Y. T., Ji, Y. M., Zhang, F., Rosenfeld, D., Liss, P. S., Duce, R. A., Kolb, C. E., and Molina, M. J.: Persistent sulfate formation from London Fog to Chinese haze, P. Natl. Acad. Sci. USA, 113, 13630–13635, https://doi.org/10.1073/pnas.1616540113, 2016.
Wang, L., Chen, X., Zhang, Y., Li, M., Li, P., Jiang, L., Xia, Y., Li, Z., Li, J., Wang, L., Hou, T., Liu, W., Rosenfeld, D., Zhu, T., Zhang, Y., Chen, J., Wang, S., Huang, Y., Seinfeld, J. H., and Yu, S.: Switching to electric vehicles can lead to significant reductions of PM2.5 and NO2 across China, One Earth, 4, 1037–1048, https://doi.org/10.1016/j.oneear.2021.06.008, 2021.
Wang, L., Yu, S., Li, P., Chen, X., Li, Z., Zhang, Y., Li, M., Mehmood, K., Liu, W., Chai, T., Zhu, Y., Rosenfeld, D., and Seinfeld, J. H.: Significant wintertime PM2.5 mitigation in the Yangtze River Delta, China, from 2016 to 2019: observational constraints on anthropogenic emission controls , Atmos. Chem. Phys., 20, 14787–14800, https://doi.org/10.5194/acp-20-14787-2020, 2020.
Wang, Q. H., Zhou, F., Shang, Z. Y., Ciais, P., Winiwarter, W., Jackson, R. B., Tubiello, F. N., Janssens-Maenhout, G., Tian, H. Q., Cui, X. Q., Canadell, J. G., Piao, S. L., and Tao, S.: Data-driven estimates of global nitrous oxide emissions from cropland, Natl. Sci. Rev., 7, 441–452, https://doi.org/10.1093/nsr/nwz087, 2020.
Wang, S.: How to promote ultra-low emissions during the 14th Five-Year Plan?, China. Environment. News., http://epaper.cenews.com.cn/html/2021-04/30/node_7.htm, last access: 30 April 2021.
Wang, S. X., Xing, J., Jang, C., Jang, C. R., Zhu, Y., Fu, J. S., and Hao, J. M.: Impact assessment of ammonia emissions on inorganic aerosols in East China using response surface modeling technique, Environ. Sci. Technol., 45, 9293–9300, https://doi.org/10.1021/es2022347, 2011.
Wang, Y., Wang, Y., Wang, L., Petäjä, T., Zha, Q., Gong, C., Li, S., Pan, Y., Hu, B., Xin, J., and Kulmala, M.: Increased inorganic aerosol fraction contributes to air pollution and haze in China, Atmos. Chem. Phys., 19, 5881–5888, https://doi.org/10.5194/acp-19-5881-2019, 2019.
Wang, Y., Zhang, Q. Q., He, K., Zhang, Q., and Chai, L.: Sulfate-nitrate-ammonium aerosols over China: response to 2000–2015 emission changes of sulfur dioxide, nitrogen oxides, and ammonia, Atmos. Chem. Phys., 13, 2635–2652, https://doi.org/10.5194/acp-13-2635-2013, 2013.
Wang, Y. C., Chen, J., Wang, Q. Y., Qin, Q. D., Ye, J. H., Han, Y. M., Li, L., Zhen, W., Zhi, Q., Zhang, Y. X., and Cao, J. J.: Increased secondary aerosol contribution and possible processing on polluted winter days in China, Environ. Int., 127, 78–84, https://doi.org/10.1016/j.envint.2019.03.021, 2019.
Wei, J., Li, Z., Cribb, M., Huang, W., Xue, W., Sun, L., Guo, J., Peng, Y., Li, J., Lyapustin, A., Liu, L., Wu, H., and Song, Y.: Improved 1 km resolution PM2.5 estimates across China using enhanced space–time extremely randomized trees, Atmos. Chem. Phys., 20, 3273–3289, https://doi.org/10.5194/acp-20-3273-2020, 2020.
Wei, J., Li, Z. Q., Lyapustin, A., Sun, L., Peng, Y. R., Xue, W. H., Su, T. N., and Cribb, M.: Reconstructing 1-km-resolution high-quality PM2.5 data records from 2000 to 2018 in China: spatiotemporal variations and policy implications, Remote. Sens. Environ., 252, 112136, https://doi.org/10.1016/j.rse.2020.112136, 2021.
Wu, Y. J., Wang, P., Yu, S. C., Wang, L. Q., Li, P. F., Li, Z., Mehmood, K., Liu, W. P., Wu, J., Lichtfouse, E., Rosenfeld, D., and Seinfeld, J. H.: Residential emissions predicted as a major source of fine particulate matter in winter over the Yangtze River Delta, China, Environ. Chem. Lett., 16, 1117–1127, https://doi.org/10.1007/s10311-018-0735-6, 2018.
Wu, Y. Y., Xi, X. C., Tang, X., Luo, D. M., Gu, B. J., Lam, S. K., Vitousek, P. M., and Chen, D. L.: Policy distortions, farm size, and the overuse of agricultural chemicals in China, P. Natl. Acad. Sci. USA, 115, 7010–7015, https://doi.org/10.1073/pnas.1806645115, 2018.
Xiao, Q., Zheng, Y., Geng, G., Chen, C., Huang, X., Che, H., Zhang, X., He, K., and Zhang, Q.: Separating emission and meteorological contributions to long-term PM2.5 trends over eastern China during 2000–2018, Atmos. Chem. Phys., 21, 9475–9496, https://doi.org/10.5194/acp-21-9475-2021, 2021.
Xiao, Q. Y., Geng, G. N., Liang, F. C., Wang, X., Lv, Z., Lei, Y., Huang, X. M., Zhang, Q., Liu, Y., and He, K. B.: Changes in spatial patterns of PM2.5 pollution in China 2000–2018: Impact of clean air policies, Environ. Int., 141, 105776, https://doi.org/10.1016/j.envint.2020.105776, 2020.
Xing, J., Liu, X., Wang, S. X., Wang, T., Ding, D., Yu, S., Shindell, D., Ou, Y., Morawska, L., Li, S. W., Ren, L., Zhang, Y. Q., Loughlin, D., Zheng, H. T., Zhao, B., Liu, S. C., Smith, K. R., and Hao, J. M.: The quest for improved air quality may push China to continue its CO2 reduction beyond the Paris Commitment, P. Natl. Acad. Sci. USA, 117, 29535–29542, https://doi.org/10.1073/pnas.2013297117, 2021.
Xu, Q. C., Wang, S. X., Jiang, J. K., Bhattarai, N., Li, X. X., Chang, X., Qiu, X. H., Zheng, M., Hua, Y., and Hao, J. M.: Nitrate dominates the chemical composition of PM2.5 during haze event in Beijing, China, Sci. Total. Environ., 689, 1293–1303, https://doi.org/10.1016/j.scitotenv.2019.06.294, 2019.
Xu, W.: Supplementary information_Dataset_PM2.5 and associated chemical components.xlsx, figshare [data set], https://doi.org/10.6084/m9.figshare.16429092, 2022.
Xu, W., Luo, X. S., Pan, Y. P., Zhang, L., Tang, A. H., Shen, J. L., Zhang, Y., Li, K. H., Wu, Q. H., Yang, D. W., Zhang, Y. Y., Xue, J., Li, W. Q., Li, Q. Q., Tang, L., Lu, S. H., Liang, T., Tong, Y. A., Liu, P., Zhang, Q., Xiong, Z. Q., Shi, X. J., Wu, L. H., Shi, W. Q., Tian, K., Zhong, X. H., Shi, K., Tang, Q. Y., Zhang, L. J., Huang, J. L., He, C. E., Kuang, F. H., Zhu, B., Liu, H., Jin, X., Xin, Y. J., Shi, X. K., Du, E. Z., Dore, A. J., Tang, S., Collett Jr., J. L., Goulding, K., Sun, Y. X., Ren, J., Zhang, F. S., and Liu, X. J.: Quantifying atmospheric nitrogen deposition through a nationwide monitoring network across China, Atmos. Chem. Phys., 15, 12345–12360, https://doi.org/10.5194/acp-15-12345-2015, 2015.
Xu, W., Wu, Q. H., Liu, X. J., Tang, A. H., Dore, A. J., and Heal, M. R.: Characteristics of ammonia, acid gases, and PM2.5 for three typical land-use types in the North China Plain, Environ Sci Pollut R., 23, 1158–1172, https://doi.org/10.1007/s11356-015-5648-3, 2016.
Xu, W., Song, W., Zhang, Y., Liu, X., Zhang, L., Zhao, Y., Liu, D., Tang, A., Yang, D., Wang, D., Wen, Z., Pan, Y., Fowler, D., Collett Jr., J. L., Erisman, J. W., Goulding, K., Li, Y., and Zhang, F.: Air quality improvement in a megacity: implications from 2015 Beijing Parade Blue pollution control actions, Atmos. Chem. Phys., 17, 31–46, https://doi.org/10.5194/acp-17-31-2017, 2017.
Xu, W., Liu, L., Cheng, M., Zhao, Y., Zhang, L., Pan, Y., Zhang, X., Gu, B., Li, Y., Zhang, X., Shen, J., Lu, L., Luo, X., Zhao, Y., Feng, Z., Collett Jr., J. L., Zhang, F., and Liu, X.: Spatial–temporal patterns of inorganic nitrogen air concentrations and deposition in eastern China, Atmos. Chem. Phys., 18, 10931–10954, https://doi.org/10.5194/acp-18-10931-2018, 2018.
Xue, T., Liu, J., Zhang, Q., Geng, G. N., Zheng, Y. X., Tong, D., Liu, Z., Guan, D. B., Bo, Y., Zhu, T., He, K. B., and Hao, J. M.: Rapid improvement of PM2.5 pollution and associated health benefits in China during 2013–2017, Sci. China Earth Sci., 62, 1847–1856, https://doi.org/10.1007/s11430-018-9348-2, 2019.
Yang, F., Tan, J., Zhao, Q., Du, Z., He, K., Ma, Y., Duan, F., Chen, G., and Zhao, Q.: Characteristics of PM2.5 speciation in representative megacities and across China, Atmos. Chem. Phys., 11, 5207–5219, https://doi.org/10.5194/acp-11-5207-2011, 2011.
Ying, H., Yin, Y. L., Zheng, H. F., Wang, Y. C., Zhang, Q. S., Xue, Y. F., Stefanovski, D., Cui, Z. L., and Dou, Z. X.: Newer and select maize, wheat, and rice varieties can help mitigate N footprint while producing more grain, Glob. Change Biol., 12, 4273–4281, https://doi.org/10.1111/gcb.14798, 2019.
Yu, S. C., Dennis, R., Roselle, S., Nenes, A., Walker, J., Eder, B., Schere, K., Swall, J., and Robarge, W.: An assessment of the ability of three-dimensional air quality models with current thermodynamic equilibrium models to predict aerosol NO, J. Geophys. Res.-Atmos., 110, D07S13, https://doi.org/10.1029/2004JD004718, 2005.
Yue, H. B., He, C. Y., Huang, Q. X., Yin, D., and Bryan, B. A.: Stronger policy required to substantially reduce deaths from PM2.5 pollution in China, Nat. Commun., 11, 1462, https://doi.org/10.1038/s41467-020-15319-4, 2020.
Zhai, S., Jacob, D. J., Wang, X., Liu, Z., Wen, T., Shah, V., Li, K., Moch, J. M., Bates, K. H., Song, S., and Shen, L.: Control of particulate nitrate air pollution in China, Nat. Geosci., 14, 389–395, https://doi.org/10.1038/s41561-021-00726-z, 2021.
Zhan, X. Y., Adalibieke, W., Cui, X. Q., Winiwarter, W., Reis, S., Zhang, L., Bai, Z. H., Wang, Q. H., Huang, W. C., and Zhou, F.: Improved estimates of ammonia emissions from global croplands, Environ. Sci. Technol., 55, 1329–1338, https://doi.org/10.1021/acs.est.0c05149, 2021.
Zhang, L., Jacob, D. J., Knipping, E. M., Kumar, N., Munger, J. W., Carouge, C. C., van Donkelaar, A., Wang, Y. X., and Chen, D.: Nitrogen deposition to the United States: distribution, sources, and processes, Atmos. Chem. Phys., 12, 4539–4554, https://doi.org/10.5194/acp-12-4539-2012, 2012.
Zhang, Q., Zheng, Y. X., Tong, D., Shao, M., Wang, S. X., Zhang, Y. H., Xu, X. D., Wang, J. N., He, H., Liu, W. Q., Ding, Y. H., Lei, Y., Li, J. H., Wang, Z. F., Zhang, X. Y., Wang, Y. S., Cheng, J., Liu, Y., Shi, Q. R., Yan, L., Geng, G. N., Hong, C. P., Li, M., Liu, F., Zheng, B., Cao, J. J., Ding, A. J., Gao, J., Fu, Q. Y., Huo, J. T., Liu, B. X., Liu, Z. R., Yang, F. M., He, K. B., and Hao, J. M.: Drivers of improved PM2.5 air quality in China from 2013 to 2017, P. Natl. Acad. Sci. USA, 49, 24463–24469, https://doi.org/10.1073/pnas.1907956116, 2019.
Zhang, X. M., Gu, B. J., van Grinsven, H., Lam, S. K., Liang, X., Bai, M., and Chen, D. L.: Societal benefits of halving agricultural ammonia emissions in China far exceed the abatement costs, Nat. Commun., 11, 4357, https://doi.org/10.1038/s41467-020-18196-z, 2020.
Zhang, Y., Vu, T. V., Sun, J., He, J., Shen, X., Lin, W., Zhang, X., Zhang, J., Gao, W., Wang, Y., Fu, T., Ma, Y., Li, W., and Shi, Z.: Significant changes in chemistry of fine particles in wintertime Beijing from 2007 to 2017: Impact of clean air actions, Environ. Sci. Technol., 54, 1344–1352, https://doi.org/10.1021/acs.est.9b04678, 2020.
Zhang, Y., Chen, X., Yu, S., Wang, L., Li, Z., Li, M., Liu, W., Li, P., Rosenfeld, D., and Seinfeld, J. H.: City-level air quality improvement in the Beijing-Tianjin-Hebei region from 2016/17 to 2017/18 heating seasons: Attributions and process analysis, Environ. Pollut., 274, 116523, https://doi.org/10.1016/j.envpol.2021.116523, 2021a.
Zhang, Y., Liu, X., Zhang, L., Tang, A., Goulding, K., and Collett Jr., J. L.: Evolution of secondary inorganic aerosols amidst improving PM2.5 air quality in the North China Plain, Environ. Pollut., 281, 117027, https://doi.org/10.1016/j.envpol.2021.117027, 2021b.
Zheng, B., Tong, D., Li, M., Liu, F., Hong, C., Geng, G., Li, H., Li, X., Peng, L., Qi, J., Yan, L., Zhang, Y., Zhao, H., Zheng, Y., He, K., and Zhang, Q.: Trends in China's anthropogenic emissions since 2010 as the consequence of clean air actions, Atmos. Chem. Phys., 18, 14095–14111, https://doi.org/10.5194/acp-18-14095-2018, 2018.
Zheng, G. J., Duan, F. K., Su, H., Ma, Y. L., Cheng, Y., Zheng, B., Zhang, Q., Huang, T., Kimoto, T., Chang, D., Pöschl, U., Cheng, Y. F., and He, K. B.: Exploring the severe winter haze in Beijing: the impact of synoptic weather, regional transport and heterogeneous reactions, Atmos. Chem. Phys., 15, 2969–2983, https://doi.org/10.5194/acp-15-2969-2015, 2015.