the Creative Commons Attribution 4.0 License.
the Creative Commons Attribution 4.0 License.
 | 10 May 2022
Projections of hydrofluorocarbon (HFC) emissions and the resulting global warming based on recent trends in observed abundances and current policies
John S. Daniel
Stephen A. Montzka
Isaac Vimont
Matthew Rigby
Paul B. Krummel
Jens Muhle
Simon O'Doherty
Ronald G. Prinn
Ray F. Weiss
Dickon Young
The emissions of hydrofluorocarbons (HFCs) have increased significantly in the past 2 decades, primarily as a result of the phaseout of ozone-depleting substances under the Montreal Protocol and the use of HFCs as their replacements. In 2015, large increases were projected in HFC use and emissions in this century in the absence of regulations, contributing up to 0.5 ∘C to global surface warming by 2100. In 2019, the Kigali Amendment to the Montreal Protocol came into force with the goal of limiting the use of HFCs globally, and currently, regulations to limit the use of HFCs are in effect in several countries. Here, we analyze trends in HFC emissions inferred from observations of atmospheric abundances and compare them with previous projections. Total CO2 eq. inferred HFC emissions continue to increase through 2019 (to about 0.8 ) but are about 20 % lower than previously projected for 2017–2019, mainly because of the lower global emissions of HFC-143a. This indicates that HFCs are used much less in industrial and commercial refrigeration (ICR) applications than previously projected. This is supported by data reported by the developed countries and the lower reported consumption of HFC-143a in China. Because this time period preceded the beginning of the Kigali provisions, this reduction cannot be linked directly to the provisions of the Kigali Amendment. However, it could indicate that companies transitioned away from the HFC-143a with its high global warming potential (GWP) for ICR applications in anticipation of national or global mandates. There are two new HFC scenarios developed based (1) on current trends in HFC use and Kigali-independent (K-I) control policies currently existing in several countries and (2) current HFC trends and compliance with the Kigali Amendment (KA-2022). These current policies reduce projected emissions in 2050 from the previously calculated 4.0–5.3 to 1.9–3.6 . The added provisions of the Kigali Amendment are projected to reduce the emissions further to 0.9–1.0 in 2050. Without any controls, projections suggest a HFC contribution of 0.28–0.44 ∘C to global surface warming by 2100, compared to a temperature contribution of 0.14–0.31 ∘C that is projected considering the national K-I policies current in place. Warming from HFCs is additionally limited by the Kigali Amendment controls to a contribution of about 0.04 ∘C by 2100.
- Article
(3420 KB) - Full-text XML
-
Supplement
(817 KB) - BibTeX
- EndNote


Hydrofluorocarbons (HFCs) are largely used as alternatives for ozone-depleting substances, which are being phased out as a result of the provisions of the Montreal Protocol (UNEP, 2020). Consequently, large percentage increases have been observed in the emissions and atmospheric abundances of many HFCs since the beginning of this century (Montzka and Velders et al., 2018). HFCs do not deplete the ozone layer directly but can lead to small ozone depletion thought indirect radiative impacts (Hurwitz et al., 2015). However, HFCs are potent greenhouse gases contributing to climate warming. Global projections from 2009 and 2015 anticipated large increases in HFC use and emissions in the absence of regulations (Velders et al., 2015; Velders et al., 2009). Similar increases were suggested by other studies (Purohit et al., 2020; Gschrey et al., 2011; Purohit and Hoglund-Isaksen, 2017). The projected increase in emissions results in an increase in the radiative forcing of the climate – leading to a potential contribution to a global average surface warming of 0.3–0.5 ∘C in 2100 (Montzka and Velders et al., 2018; Xu et al., 2013). In the EU, USA, Japan (EU, 2014, 2006; METI, 2015; US-EPA, 2020), and several other countries, regulations to limit the use of HFCs were already in place before 1 January 2019, which is when the reduction in HFC production and consumption was scheduled to begin (UNEP, 2020). Following the provisions of the Kigali Amendment, HFC emissions were projected to be constrained, and the surface warming is expected to be limited to less than 0.1 ∘C in 2100 (Montzka and Velders et al., 2018). The effect of the Kigali Amendment was therefore projected to reduce surface warming by 0.2–0.4 ∘C in 2100.
In 2015, global projections of HFC use, emissions, mixing ratios, and radiative forcing were reported based on observation-based estimates of emissions through 2012 and observations of mixing ratios up to 2013 (Velders et al., 2015). Since then, regional-scale HFC emissions inferred from observed mixing ratios have been reported for several countries, such as the United Kingdom up to 2018 (Manning et al., 2021), the United States from 2008 through 2014 (Hu et al., 2015, 2017), China for 2011–2017 (Yao et al., 2019), and India for 2016 (Say et al., 2019). Also, reviews of bottom-up and top-down emission estimates of HFCs have recently been published by Montzka and Velders et al. (2018) and Flerlage et al. (2021). Historical HFC consumption data for several use sectors in China have been reported by Li et al. (2019) and Fang et al. (2016) and specifically for Chinese room air conditioning (AC) by Liu et al. (2019).
In this paper, we examine how the global 2015 scenario from Velders et al. (2015) compares with trends in emissions inferred from atmospheric observations that have been made since 2013 to investigate if there are indications of reduced use or slower increase in use of HFCs, e.g., from national regulations, from the anticipation of the Kigali provisions, or from Kigali Amendment reductions (in and after 2019 only, as this was the first year of reductions, which were 10 % in developed countries). Based on this comparison, updated historical hydrochlorofluorocarbon (HCFC) consumption data reported to the United Nations Environment Programme (UNEP), HFC use derived from data reported by developed countries to the United Nations Framework Convention on Climate Change (UNFCCC), and HFC use data reported for China, we develop new HFC projections and discuss differences with the 2015 scenarios. Apart from the new and updated atmospheric observational information, the current projections also differ from the baseline projections of Velders et al. (2015; hereafter referred to as V-2015) because they follow the HFC phasedown policies in place in the EU, USA, and Japan that are ostensibly independent of the Kigali Amendment.
This study focuses on comparing different scenarios with respect to emissions, radiative forcing, and surface temperature and not on estimating the best absolute values of these quantities. An important factor for the overall uncertainty are the assumption for the projected HFC consumption. We therefore present upper and lower ranges for the scenarios based on projected growth the demand for HFCs.
The structure is as follows. First, in Sect. 2.1 to 2.5, the observations and methods used to infer global emissions are described, historical HFC and HCFC consumption are discussed, HFC use and emission scenarios are presented, and the model to project HFC emissions and the model assumptions are given. Second, in Sect. 3.1 to 3.3 the V-2015 baseline scenario is compared with recent trends in global emissions inferred from observations. Third, the effect of the new, current policy Kigali-independent scenario and the updated Kigali Amendment scenario on emissions are presented in Sect. 3.4 and 3.5, followed by the effects of hypothetical zero production and emissions scenarios in Sect. 3.6. Finally, the effects of the new HFC scenarios on future surface warming are discussed in Sect. 3.7, followed by a discussion and conclusions of the results in Sect. 4.
2.1 AGAGE and NOAA observations and inferred emissions
HFC mixing ratios are measured by the Advanced Global Atmospheric Gases Experiment (AGAGE; Prinn et al., 2018) and by the National Oceanographic and Atmospheric Administration (NOAA) Global Monitoring Laboratory (GML; Montzka et al., 2015) at various locations around the globe (see Fig. 1). Global average mixing ratios are calculated from the HFC observations made at the various remote locations across the globe, including uncertainties (see Fig. S2 in the Supplement and Montzka and Velders et al., 2018). The global and annual average mixing ratios are used here to infer the global total annual emissions for the individual HFCs from 1990 to 2020 using a one-box model of the atmosphere and constant prescribed HFC lifetimes as presented by the World Meteorological Organization (WMO, 2018 ;see Sect. 2.5). Because of the relatively long atmospheric lifetime, the HFCs are distributed more or less uniformly over the globe, and their annual emissions can be estimated from the annual change in mixing ratio and lifetime (see, e.g., Velders and Daniel, 2014, and Rigby et al., 2013). The HFCs considered here are HFC-32, HFC-125, HFC-134a, HFC-143a, HFC-152a, HFC-227ea, HFC-236fa, HFC-245fa, HFC-365mfc, and HFC-43-10mee. These HFCs are used in large amounts for refrigeration and air conditioning applications, foam blowing, as aerosol propellants, in fire suppression systems, and as solvents. HFC-23 is not considered here, since it has only very small intentional uses, and its emissions originate mainly as a by-product from the production of HCFC-22 (Stanley et al., 2020); furthermore, the Kigali Amendment controls HFC-23 in a different manner than the other HFCs considered here.

Figure 1Global total HFC emissions () from the baseline scenario (V-2015), the Kigali Amendment scenario (KA-2015), and inferred from observed mixing ratios from the AGAGE and NOAA networks (see Sect. 2). The solid line shows an adjusted scenario with reduced HFC consumption for industrial and commercial refrigeration (ICR) from 2013 onward. The curves contain the contributions from all HFC emissions, except HFC-23. The scenarios were constrained by the emissions inferred from observed mixing ratios up to 2013. Also shown are the emissions reported to the UNFCCC by developed (Annex 1) countries. AGAGE global annual means are estimated from observations at Mace Head (Ireland), Trinidad Head (Barbados), Ragged Point (Barbados), Cape Matatula (American Samoa), and Kennaook / Cape Grim (Tasmania). NOAA global annual means are estimated from measurements from flasks collected at Alert (Canada), Barrow (Alaska), Niwot Ridge (Colorado), Mauna Loa (Hawaii), Kumukahi (Hawaii), American Samoa, Kennaook / Cape Grim (Tasmania), and the South Pole. See Fig. S2 in the Supplement for the mixing ratios of the 10 individual HFCs.
2.2 Historical HFC consumption
The new scenarios start with reported historical consumption and assumptions for missing data, using the same procedure as described in Velders et al. (2015). Historical consumption is based on the (1) HFC activity data and emissions per sector reported by developed countries to the United Nations Framework Convention on Climate Change (UNFCCC, 2021) up to 2018, (2) HCFC consumption data reported by developing countries to United Nations Environment (UNEP, 2021) up to 2019, and (3) global HFC emissions derived from global average HFC mixing ratio histories measured by the AGAGE and NOAA networks through 2019 (see Sects. 2.1 and 3.1).
The annual consumption of individual HFCs per sector is derived from the UNFCCC (2021) activity data as the change from 1 year to the next in the amounts of HFCs in stock plus the annual HFC emissions from manufacturing, stocks, disposal, and recovery. The derived consumption data, available for developed (Annex 1) countries only, is grouped into the following five regions: European Union (EU), USA, Japan, other countries of the Organization for Economic Co-operation and Development (OECD), and Russia and the central Asian republics. Consumption for 12 separate use sectors is derived for each region (see Sect. 2.5). The data reported for Japan to the UNFCCC (2021) are augmented with consumption data for stationary air conditioning (AC) from their National Inventory report (NIES, 2020). Consumption data for other reporting OECD countries, only available for Australia, Canada, New Zealand, Norway, Switzerland, Iceland, and Turkey, are multiplied by a factor of 1.05 (based on the ratio of the populations) to account for non-reporting OECD countries. Consumption data for Russia has been multiplied by a factor of 1.5 (population ratio) to account for other countries in this region.
Consumption data reported for developing countries are only available for China as reported by Li et al. (2019) for 1995–2017. These consumption data take into account the import and export of HFCs and therefore represent the Chinese national HFC consumption. HFC consumption in most other developing countries started around 2013, following the first limits on the use of HCFCs in developing countries mandated by the Montreal Protocol. Some counties have reported HFC consumption data for 2018 to UNEP under the requirements of the Kigali Amendment, but since these data are still incomplete, they are not used in the scenarios here. For India, consumption data are estimated from emissions inferred for 2016 by Say et al. (2019) and are used in the scenarios. For other developing countries, HFC consumption data for 2013 to 2018 from the baseline scenario of Velders et al. (2015) is used here, which is based on a similar approach to the one used here. These regions are Asian countries other than China and India, middle and southern Africa, Latin America, and the Middle East and northern Africa. HFC-134a consumption data for mobile air conditioning in developing countries (except China) are estimated from the number of cars in use and the average charge and lifetime of cars (see Velders et al., 2009, 2015).
From the UNFCCC (2021) data, emissions factors, i.e., the annual emissions as a fraction of the banks, are derived per use sector for the five developed countries/regions. The HFC consumption data from 1990 to 2018 are used in the aforementioned one-box model of the global atmosphere, in combination with these emission factors and WMO (2018) lifetimes, to calculate annual emissions and mixing ratios associated with these use sectors and this UNFCCC reporting. The consumption data are then increased or decreased (by applying a fixed scaling factor to each sector and region) so that the calculated emissions match the emissions inferred from observations (see Sect. 3.1). This adjustment is applied since uncertainty in emissions derived from observed HFC mixing ratios are small (Montzka and Velders et al., 2018) and assumed to be smaller than emissions estimated from reported consumption data. The 2018 emissions from these calculations, which are used as a starting point for our projections, are therefore consistent with emissions derived from observed atmospheric mixing ratios.
For some HFCs there is a large mismatch between calculated emissions from UNFCCC reporting or estimated consumption and those inferred from observed mixing ratios. This results from no reporting, or underreporting, of HFC consumption by developed countries to the UNFCCC and missing information from developing countries (Flerlage et al., 2021; Montzka et al., 2015). To obtain a good starting point for the scenarios, the consumption of these HFCs is scaled, similar as for the other HFCs, so that the calculated emissions match the emissions inferred from observations. Large mismatches are found for HFC-152a (extruded polystyrene (XPS) foam and aerosol use in the USA), HFC-227ea (fire protection and aerosol use in the USA), HFC-236fa (fire protection use in China), HFC-245fa (polyurethane (PUR) foam in the USA), HFC-365mfc (solvent use in the EU), and HFC-41-10mee (solvent use in the EU and the USA).
2.3 Current policy Kigali-independent (K-I) scenario for future emissions
Our scenario that is consistent with existing regional and national policies, but independent of controls specified in the Kigali Amendment, starts with the derived consumption totals from both developed and developing countries during 1990 to 2017. The total consumption in each year is adjusted so that the calculated emission of a specific HFC agrees with the emission derived from the observed atmospheric mixing ratios, using fixed emissions factors. Projections through 2050 (and 2100) are based on assumptions for growth in demand for HFCs and HCFCs (see below), the phaseout of HCFCs following the provisions of the Montreal Protocol, and assumptions on how much this demand is met by HFCs or not-in-kind alternatives. The procedure is similar to that of Velders et al. (2015). The V-2015 baseline scenario of Velders et al. (2015) assumed unabated growth in HFC use and emissions. Since 2015, regulations to limit the use of HFCs have been in place in the EU (EU, 2006, 2014), the USA (US-EPA, 2020), Japan (METI, 2015), and several other countries and reductions in HFC consumption are observed in several sectors (see Sect. 3.3). Therefore, the scenario presented here takes into account the reductions in HFC use from these regional and national regulations and is referred to as the current policy, Kigali-independent (K-I) scenario. This scenario includes the legislation adopted by parliaments in countries and implemented in national regulations as of the end of 2020 and does not include the provisions of the Kigali Amendment, despite some of them affecting HFC production and consumption beginning on 1 January 2019.
The demand for HCFCs and HFCs in developed countries in the various applications is assumed to be saturated in 2018 and the demand after 2018 therefore changes proportional to the projected growth or decline in population in each of these five countries or world regions (see Sect. 2.2). This could underestimate the projected demand for HFCs considering, for example, the recent push in the EU for heat pumps to replace oil and gas for space heating. The demand in developing countries is assumed to be the sum of the demand for applications that already use HFCs and the demand for applications in which HCFCs are currently or soon to be phased out and replaced in part by HFCs; it is assumed to change proportional to the growth or decline in gross domestic product (GDP) for each of the six countries or world regions (see Sect. 2.2). The HCFC consumption from 1989 to 2019, reported to UNEP (2021) from developing countries, is the starting point for determining HCFC demand. The GDP and population data are taken from the Shared Socioeconomic Pathway (SSP) projections (O'Neill et al., 2012). The current policy K-I scenario consists of an upper range scenario, following the GDP and population in the SSP5 pathway, and a lower range scenario, following the SSP3 pathway.
In the current policy K-I scenario, similar as in the V-2015 baseline scenario, market saturation is assumed in developing countries when the demand reaches a level such that the sum of HFC and HCFC consumption per capita in that country or region reaches a level of the maximum consumption per capita of the developed countries. This saturation level is reached in different years for the different groups of sectors (domestic refrigeration, industrial and commercial refrigeration, stationary AC, mobile AC, foams, and other sectors). After saturation, the consumption in each sector changes proportionally to population projections in a region.
The current policy K-I scenario includes the policies in place to limit the use of HFCs, such as the EU mobile air conditioning directive (EU, 2006), the EU revised F-gas directive (EU, 2014), the American Innovation and Manufacturing Act (US-EPA, 2020), and regulations in Japan (METI, 2015). This scenario also includes a phaseout of HFC-134a used for mobile air conditioning, following recent trends in several countries. In the EU, the use of fluorinated gases with a global warming potential (GWP) greater than 150 has been prohibited for new vehicles since 2017. Currently, the vast majority of new vehicles sold in the EU, the USA, and Japan are not equipped with HFC-134a but with the low-GWP alternative hydrofluoroolefin HFO-1234yf (Taddonio, 2021). HFC-134a may still be used for recharging the AC systems in existing vehicles. In the current policy K-I scenario, the consumption of HFC-134a for mobile AC is therefore reduced linearly from 2018 to 2030 in the EU, USA, Japan, and other OECD countries. The amount of HFC consumption in excess of the limits of the current K-I policies is assumed to be replaced by low-GWP alternative substances of alternative technologies. Apart from the use of HFO-1234yf in mobile AC, HFOs are also being used in other markets, e.g., HFO-1234ze, HFO-1336mzz-E, and HFO-1336mzz(Z) for refrigeration and as propellant (UNEP, 2019).
In Sect. 3.2, we will show that the global emissions of HFC-143a inferred from observed mixing ratios is much lower than previously projected (Velders et al., 2015) and more or less constant from 2016 to 2019. This shows that the consumption of R-404A (the blend in which HFC-143a is mainly used), for industrial and commercial refrigeration, has been lower in recent years than previously projected. Therefore, for the upper range of the current policy scenario, the consumption of HFCs for industrial and commercial refrigeration is constant at the 2018 level for all developing countries. For the lower range of the current policy scenario, future consumption for these applications is still proportional to the growth in GDP in developing countries, allowing for the transition and use of other HFCs in this application.
Following the provisions of the Montreal Protocol (UNEP, 2020), the consumption of HCFCs in developing countries is reduced in a stepwise manner, with a full phaseout in 2040. In the baseline scenario, the demand for HCFCs is then replaced by HFCs and not-in-kind replacements. We use the same replacement schedule as by Velders et al. (2009) and Velders et al. (2015) here, where HCFC-22 is replaced by R-410A and R-404A (90 %) and low-GWP or not-in-kind alternatives (10 %), and HCFC-141b and HCFC-142b are replaced by HFC-245fa and HFC-365mfc (50 %) and by low-GWP alternatives (50 %).
2.4 Kigali amendment scenario
Here we update the Velders et al. (2015) scenario representing compliance with the Kigali Amendment (KA-2015) with a new one based on factors mentioned above and updated observations. The HFC phasedown schedule of the 2016 Kigali Amendment is applied to the consumption in the current policy K-I scenario to derive a Kigali Amendment (KA-2022) scenario, assuming adoption by all countries of the world. The phasedown is applied to the total CO2 equivalent (CO2 eq.) HFC consumption using 100 year GWPs to scale down the consumption in all sectors of a country or region by the same factor. The amount of HFC consumption in the current policy K-I scenario in excess of the limits of the Kigali Amendment is assumed to be replaced by low-GWP alternative substances or alternative technologies. Several low-GWP alternatives are available, depending on the application. In the scenario we do not specify the alternative, only that is has a GWP of 10 or less.
2.5 Box model
The historical and projected HFC consumption is used in a global one-box model to calculate the amounts present in equipment (the bank), the emissions, mixing ratios, and radiative forcing for each of the 10 HFCs, 12 use sectors, and 11 regions from 1990 to 2050 (or 2100; see Velders and Daniel, 2014 and Velders et al., 2015). The time evolution of HFC banks and emissions, and their contributions to global average mixing ratios are calculated for each individual HFC for each sector and region separately. The annual change in HFC banks, per sector and region, is calculated as the difference in the annual consumption and emission. The emissions are calculated as a fraction of the bank, as estimated from the UNFCCC (2021) data (see Table S1 in the Supplement). These emission factors are therefore based on the release rates used and reported by the countries themselves, following the IPCC (Intergovernmental Panel on Climate Change) guidelines for national greenhouse gas inventories. With this procedure, each region and sector contribute to the global average mixing ratio, calculated from the annual emission and loss rate (based on the atmospheric lifetime) of each individual HFC. In the box model, a fixed atmospheric lifetime is used. The atmospheric lifetimes, the global warming potentials (GWP with a 100 year time horizon), and the radiative efficiencies are from WMO (2018). Recently, new GWPs have been reported (IPCC, 2021), which are about 10 % larger than those of WMO (2018). For consistency with the V-2015 baseline used in (Velders et al., 2015) we chose not to use the new GWPs. The use of different GWPs would not affect the scenarios of temperature calculation, only the reported CO2 eq. consumption and emissions. The HFC observations from both the AGAGE and NOAA networks are used in the comparison of the inferred emissions with the emissions of the V-2015 baseline scenario (Sect. 3.1 and 3.2). As a starting point for the new scenarios, only the observations from the AGAGE network are used (Sect. 3.4 to 3.6).
In the model, 12 separate use sectors taken are considered, namely (1) industrial refrigeration, (2) commercial (open compressor and hermetically sealed compressor), (3) transport refrigeration, (4) domestic refrigeration, (5) stationary AC, (6) mobile AC, (7) extruded polystyrene foams (XPS), (8) polyurethane foams (PUR), (9) open-cell foams, (10) aerosol products, (11) fire extinguishing systems, and (12) solvents.
The contribution of the HFCs to the global average surface warming is calculated from the emissions and atmospheric mole fractions derived from 1990 to 2100 using the low-complexity carbon cycle climate model MAGICC6 (Meinshausen et al., 2011a). This model has been calibrated with output from complex coupled atmosphere–ocean general circulation models and applied in several simulations (Meinshausen et al., 2011b). The HFC lifetimes, GWP100, radiative efficiencies, and observed mixing ratios are identical to those used in the scenarios discussed here. The purpose of the calculation of the surface warming from HFCs is to compare the effects of the different scenarios and not so much to obtain a best estimate for the absolute temperature contribution of HFCs.
3.1 Emissions baseline scenario compared with recent trends
The V-2015 baseline scenario from Velders et al. (2015) was based on reported HFC data for developed countries up to 2011, reported HCFC consumption data up to 2013, and observed HFC mixing ratios up to 2013. The global total CO2 eq. emissions from the V-2015 baseline scenario are compared with emissions inferred from HFC observations from the AGAGE and NOAA networks from 2010 to 2020 (Fig. 1). The inferred emission global totals are consistently derived by the different networks (differences of < 4 %) but are substantially below the V-2015 baseline emissions by about 20 % in the period 2017–2019.
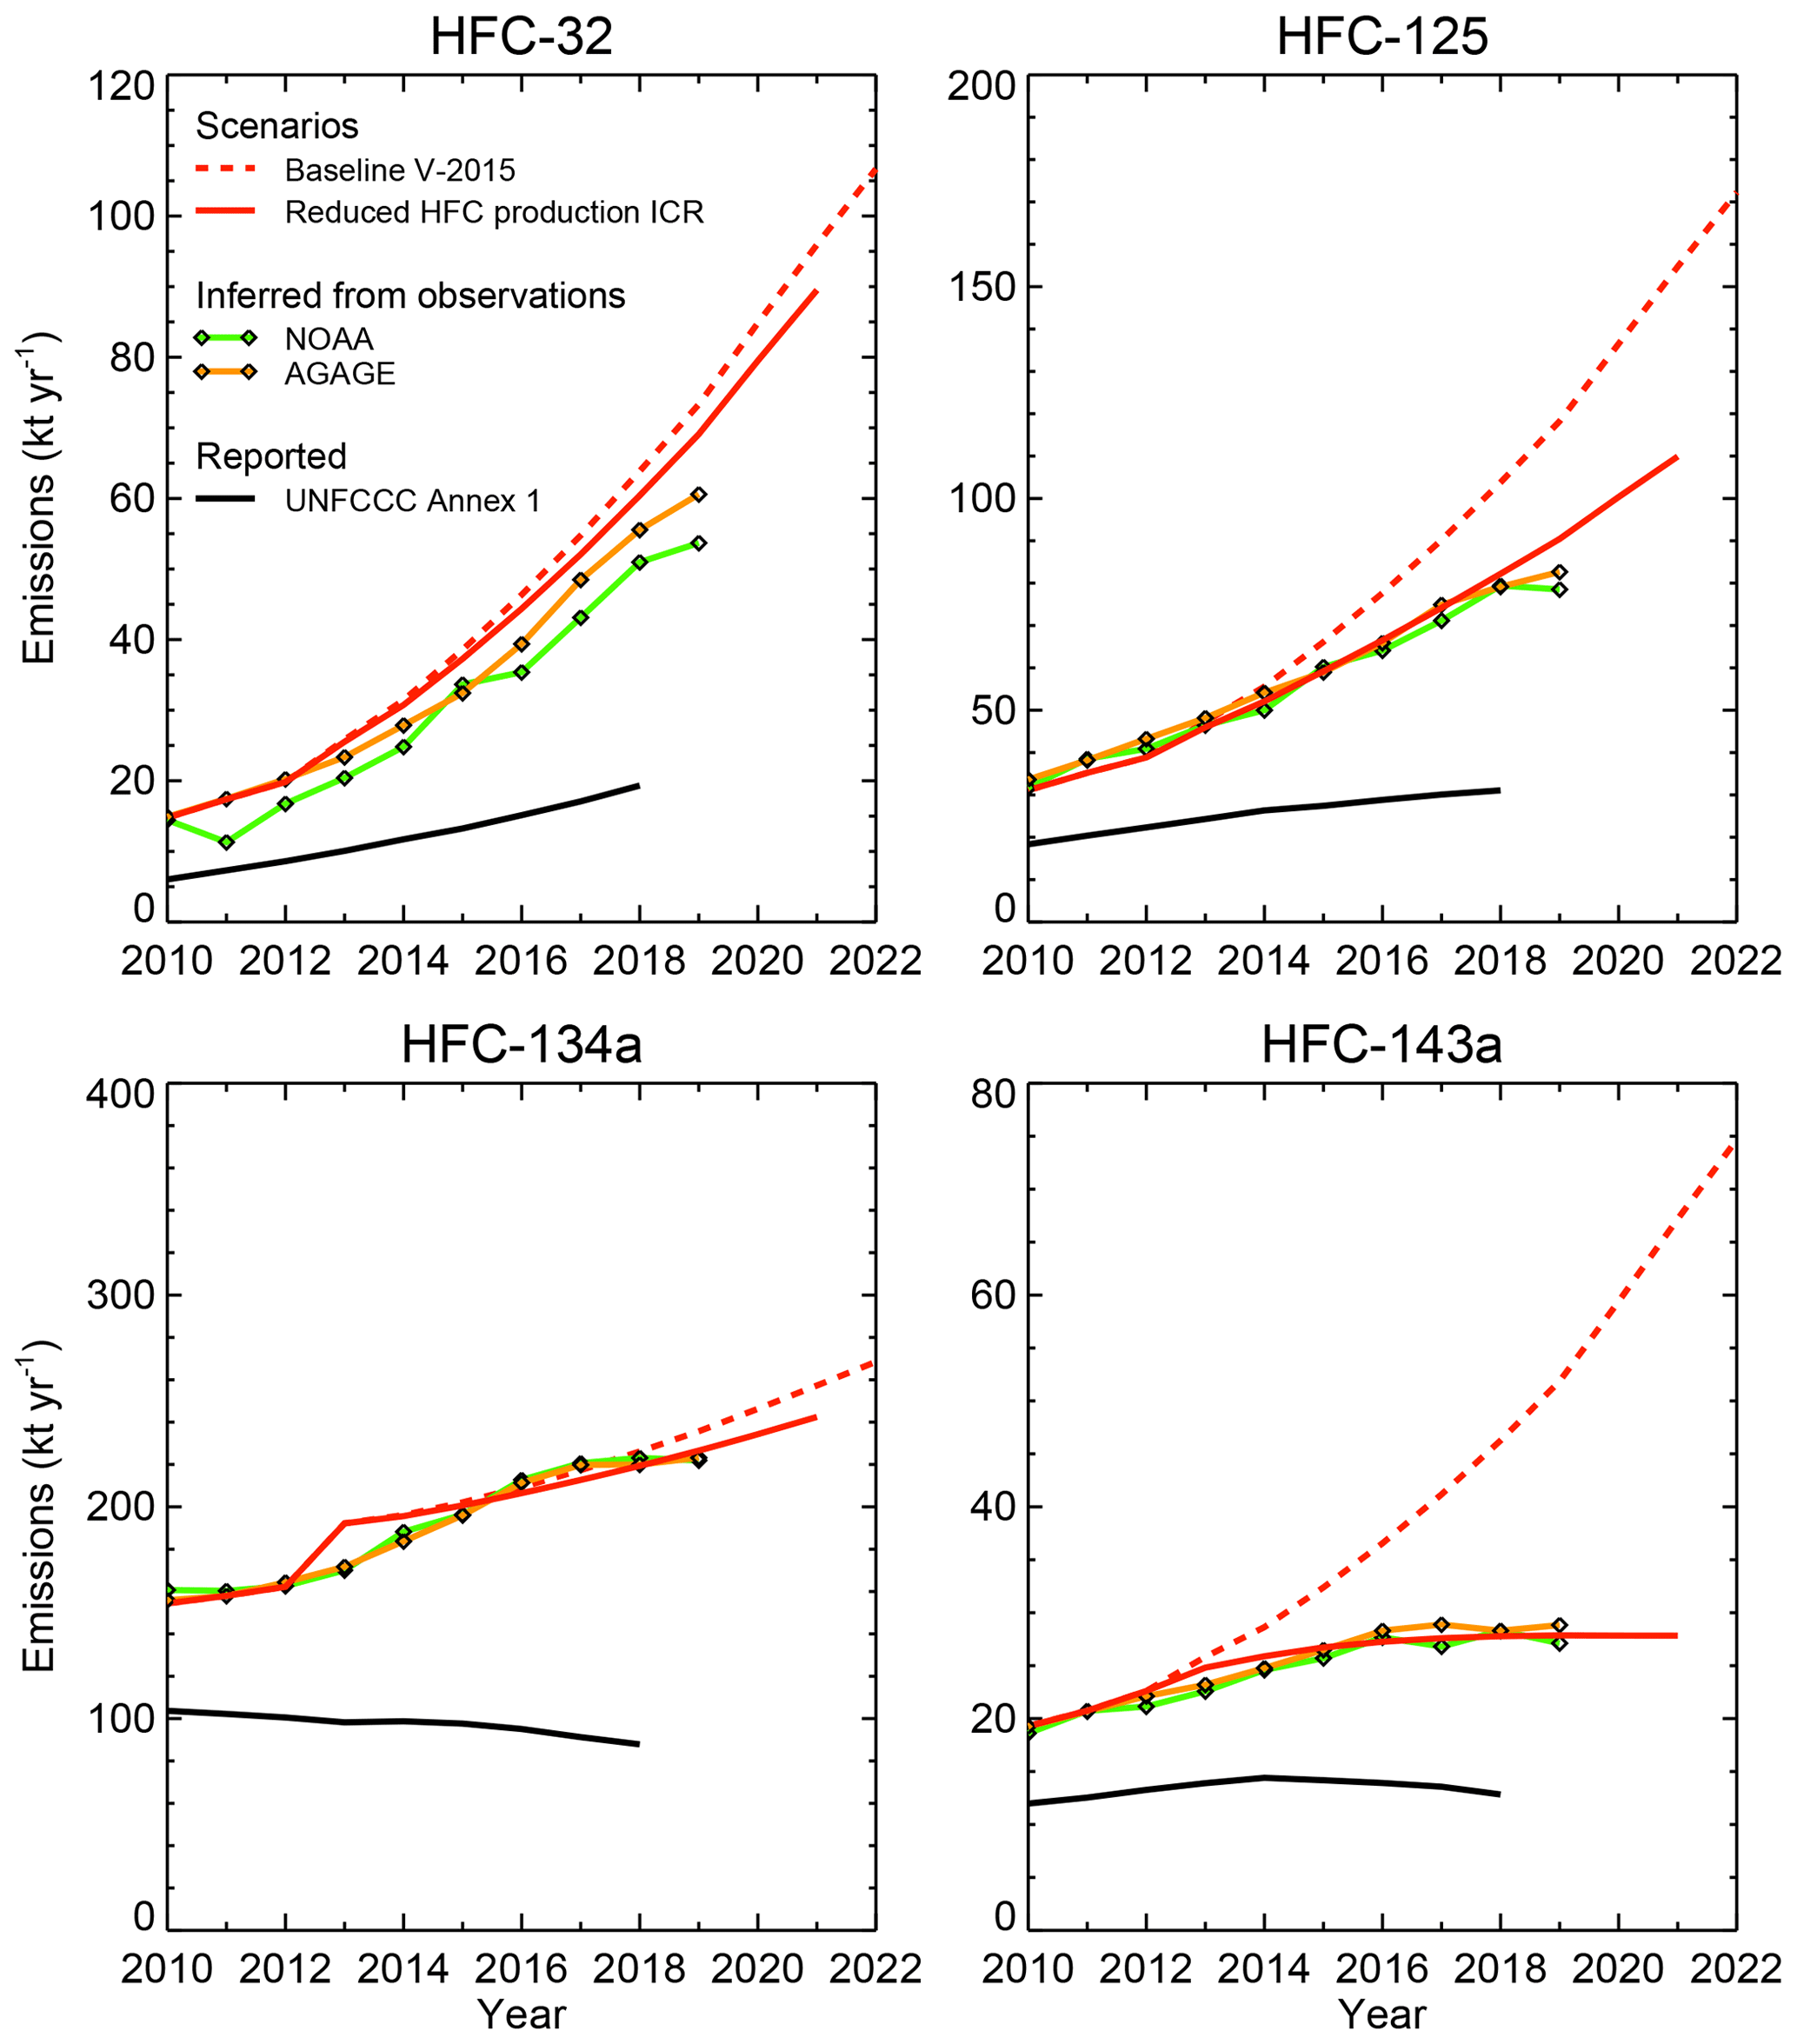
Figure 2Global total HFC emissions (kt yr−1) from the V-2015 baseline compared with emissions inferred from observed mixing ratios from the AGAGE and NOAA networks. The solid line shows an adjusted scenario with reduced HFC production for industrial and commercial refrigeration (ICR) from 2013 onward. Also shown are the emissions reported to the UNFCCC by Annex 1 countries. The scenarios were constrained by the emissions inferred from observed mixing ratios up to 2013.
The V-2015 baseline emissions of the HFCs with the largest global use, i.e., HFC-32, HFC-125, HFC-134a, and HFC-143a, are compared, individually, with the emissions inferred from observed mixing ratios (Fig. 2). A comparison of the emissions of the other HFCs are shown in Fig. S1 and a comparison of the mixing ratios in Fig. S2. The V-2015 baseline emission projections of HFC-134a are in good agreement with the inferred emissions. The inferred emissions of HFC-32 and HFC-125 are lower than the baseline emissions by about 19 % and 25 %, respectively, and averaged over 2017–2019. The largest difference is seen for HFC-143a; the inferred emissions are about 40 % lower than the baseline emissions for 2017–2019.
The global total inferred emission of HFC-143a slowly increased through 2016 but are more or less constant from 2016 to 2019 (Fig. 2). HFC-143a is used mainly (for 90 % or more in our scenario) in the blend R-404A (52 % HFC-143a, 44 % HFC-125, 4 % HFC-134a) for industrial and commercial refrigeration applications (UNFCCC, 2021; UNEP, 2019). In the V-2015 baseline scenario, it was assumed that the global consumption of R-404A would increase following the growing demand for refrigeration applications, mainly in developing countries, and the phaseout of HCFC-22 under the Montreal Protocol. The fact that the global emissions of HFC-143a are significantly below the V-2015 baseline scenario, and constant in recent years, shows that R-404A is used in smaller amounts than expected to replace HCFC-22 for refrigeration applications. Other alternatives are likely used in larger amounts in this sector than expected previously (Velders et al., 2015). In Europe, R-404A has already been replaced by an HFC blend (R-452A) without HFC-143a for new trucks (transport refrigeration), while propane and CO2 are also being used in commercial refrigeration applications (UNEP, 2019).
3.2 HFC-143a consumption trends
Until about 2013, the majority (more than 80 %) of the HFC-143a emissions came from use in developed countries in the V-2015 baseline scenario, as estimated from the reported consumption data. In that scenario, the consumption in developing countries increased by about a factor of 3.5 from 2013 to 2019, while that in developed countries increased by only 27 % in the same period. Consequently, the 2015 scenario anticipated that 2019 emissions of HFC-143a would originate from developed and developing countries in equal amounts.
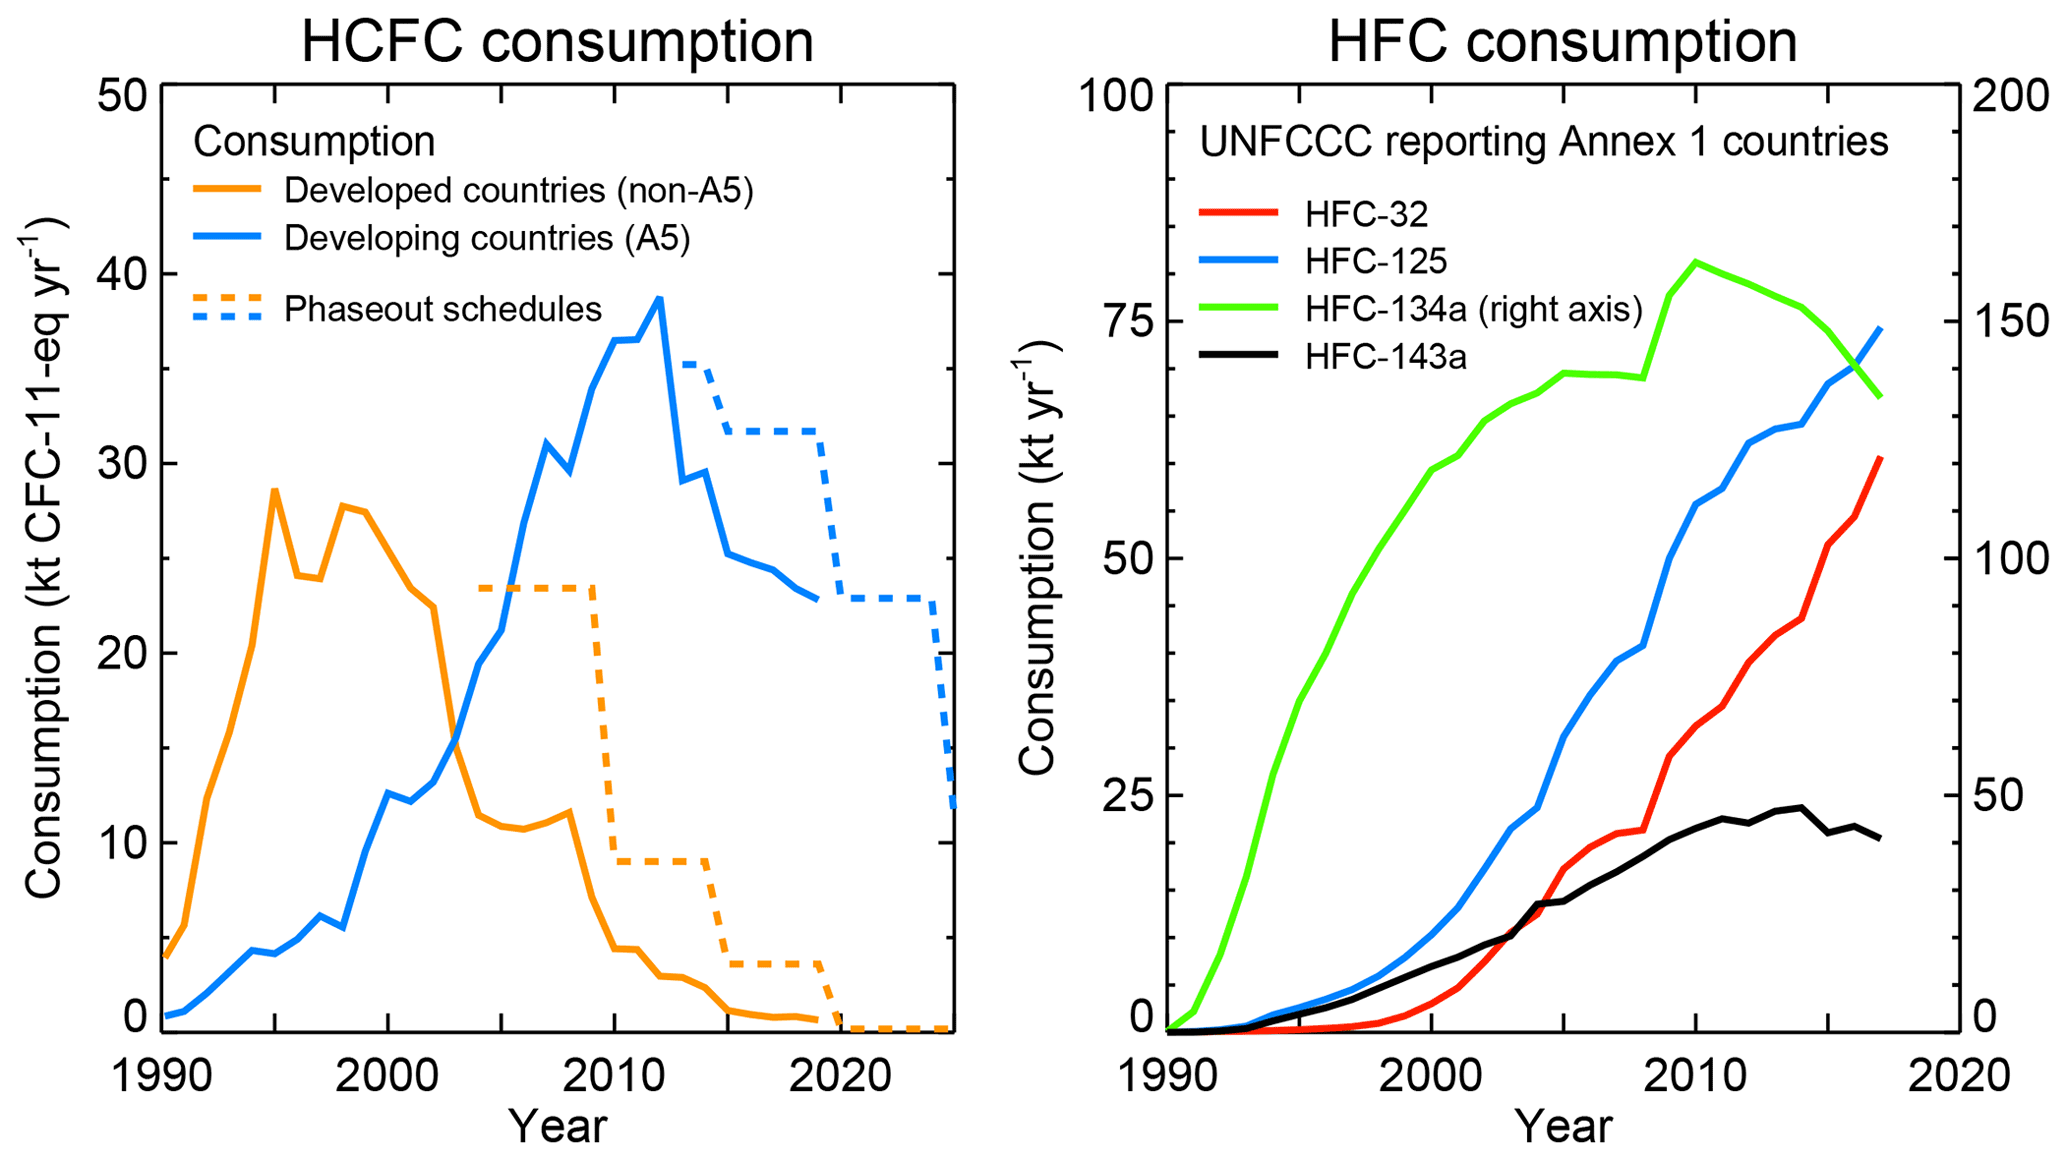
Figure 3The left panel shows the HCFC consumption (kt CFC-11-eq yr−1) in developed (non-A5) and developing (A5) countries as reported to UNEP (2021) and the Montreal Protocol phaseout schedules. The right panel shows the HFC consumption (kt yr−1) in developed countries (Annex 1 countries) derived from the data reported to the UNFCCC (2021).
The EU and USA have the largest reported use (consumption) of HFC-143a of all developed (Annex 1) countries (UNFCCC, 2021). The use in the EU has decreased by about 60 % in 2017 compared to 2010. This decrease is ahead of the ban for HFCs with a GWP larger than 2500 or more for commercial refrigeration applications, which has been in effect since 2020 (EU, 2014). In the USA, the use of HFC-143a increased by 14 % in 2017 compared to 2010, while small increases are also seen in other developed countries. In sum, the EU decreases dominated the global trend, and total Annex 1 use (consumption) decreased by about 8 % in 2017 compared to 2010 (Fig. 3; right panel).
The largest growth in HFC-143a in the baseline scenario was projected for China, with an increase of a factor of 6 from 2010 to 2017 (Velders et al., 2015). This projected increase was based on the cap and initial phaseout of HCFC-22 and large projected economic growth in China. According to Li et al. (2019) the consumption of HFC-143a in China also increased by a factor of 6 from 2010 to 2017, but the absolute values are much lower than in the Velders et al. (2015) scenario. The consumption for China in the V-2015 baseline scenario was based on Zhang and Wang (2014) and Fang et al. (2016) and is about 10 times larger than that reported by Li et al. (2019) for 2005–2013, and the 2013 consumption is 0.8 kt in Li et al. (2019) versus 6.4 kt in Fang et al. (2016). The lower reported consumption of HFC-143a from Li et al. (2019) takes into account the export of HFCs. Information on the export of HFCs, which is significant for HFC-143a, was not available for the studies from Zhang and Wang (2014) and Fang et al. (2016; Jianxin Hu, personal communication, 2021).
Based on the decreased use of HFC-143a in the EU, limited increases in other developed countries, and lower reported consumption in China, the 2015 baseline scenario result for HFC-143a was adjusted to test if the observed trend in emissions can be matched with a simple adjustment. In this reduced HFC production ICR scenario, the use of HFCs for industrial and commercial refrigeration (ICR) in developed countries was reduced following the UNFCCC reported reduction in HFC-143a from 2013 to 2020, while the use in developing countries was held constant at the 2013 level. With these simple adjustments, emissions of HFC-143a and also of HFC-125 (also part of the blend R-404A) in the reduced HFC production ICR scenario are close to the emissions inferred from observations (Fig. 2). With this single adjustment, the CO2 eq. emissions of all HFCs closely follow the emissions inferred from observations (Fig. 1). This adjustment was directly included in the current policy K-I scenario, since it is based on the historical UNFCCC reported data.
3.3 Reported HCFC and HFC consumption
The total reported HCFC consumption in both developed and developing countries is decreasing (Fig. 3; left panel). In 2019, the consumption in developed countries was about 98 % below the 1990s peak, while the consumption in developing countries was about 60 % lower than the peak in 2012. The reported HCFC phaseout in developed countries is already virtually complete, which in line with the assumption in the current policy scenario discussed here (Sect. 2.3). For both groups of countries, the total HCFC consumption was below the limits set by the Montreal Protocol for all years. This potentially provided additional pressure on demand for HFCs to replace HCFCs and compounded the demand associated with the required HCFC phaseout schedule.
The global HFC consumption derived here from the reported UNFCCC (2021) activity data and emissions shows strong increases for HFC-32 and HFC-125 (Fig. 3; right panel), prior to scaling to match observation derived emissions, albeit less than projected in the V-2015 baseline scenario. Both compounds are predominantly used in the blend R-410A (50 % HFC-32 and 50 % HFC-125) in stationary AC. In 2017, about 90 % of the HFC-32 and 63 % of HFC-125 consumption in developed countries are from use in R-410A, leading to the conclusion that the use of HFCs in stationary ACs is increasing strongly in developed countries.
The consumption of HFC-134a increased in developed countries until about 2010, after which it started to decrease (Fig. 3; right panel). This HFC is used in many applications, of which mobile AC is the largest; about 43 % of all HFC-134a consumption in developed countries was in this sector in 2017 (UNFCCC, 2021). The decrease since 2010 is mainly from less use in mobile AC in the EU and USA. The consumption for mobile AC in the EU and USA stabilized between 2000 and 2010 and then decreased, probably as a result of smaller charges and less frequent recharging of existing systems (as a result of reduced leakage rates). Adding to this slowdown was the introduction of HFO-1234yf for mobile AC around 2012 (Vollmer et al., 2015), thereby reducing the use of HFC-134a for these applications further in the EU and USA.
The trend in consumption of HFC-143a is discussed in Sect. 3.2.
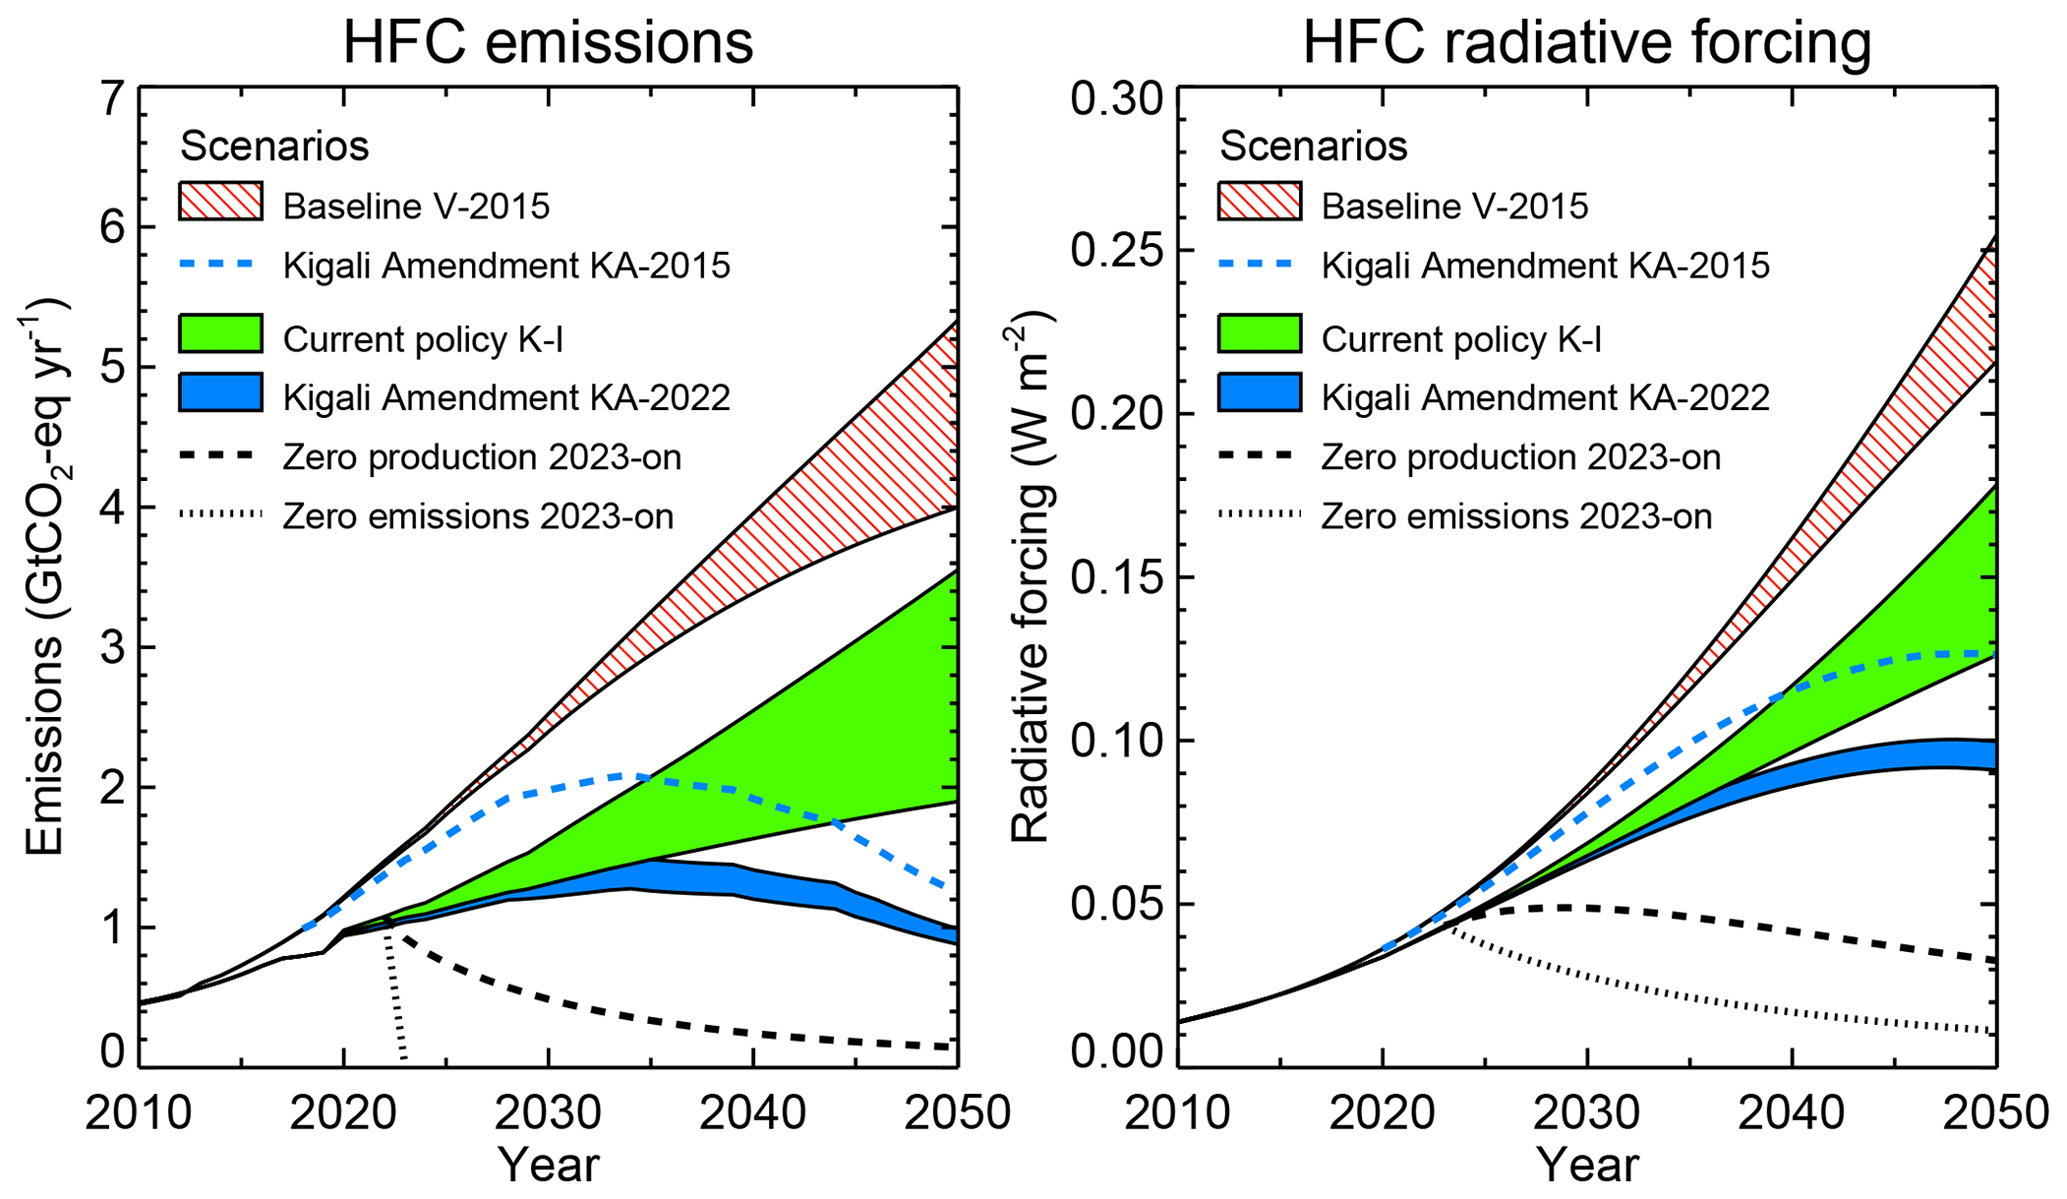
Figure 4Global total HFC emissions (; left panel) and radiative forcing (right panel) from the V-2015 baseline scenarios developed in Velders et al. (2015) and the updated scenarios derived here (current policy Kigali independent (K-I) and KA-2022). The bands represent the upper and lower ranges of these scenarios. Also shown are scenarios that follow the phasedown schedules of the Kigali Amendment, based on the V-2015 baseline, and the current policy K-I scenario. No range is shown for the updated Kigali Amendment scenario (KA-2022), since the lower and upper range scenarios virtually coincide. Also shown are hypothetical scenarios in which the global HFC production ceases in 2023 or the global HFC emissions (from new production and from banks) cease in 2023. The curves contain the contributions of all HFCs, except HFC-23.
3.4 Current policy scenario
The CO2 eq. emissions and radiative forcing of the current policy K-I scenario are compared with the V-2015 baseline scenario for the period up to 2050 (Fig. 4). The difference in scenarios from 2010 to 2020 arises from the difference between the projections of the V-2015 scenario and the inferred observations included in the current policy K-I scenario. Both scenarios use the emissions inferred from observed mixing ratios as a starting point. For the V-2015 baseline scenario, observational-based emissions were available up to 2012, and for the current policy K-I scenario they were available through the year 2019. The 2050 emissions in current policy K-I scenario are 1.6–2.1 lower than in the V-2015 baseline scenario (1.9–3.6 versus 4.0–5.3 ). This difference comes from the different assumptions in the projections, mainly the lower projected consumption of HFC-125 and HFC-143a for industrial and commercial refrigeration in developed and developing countries (see Sect. 3.2). Smaller contributions come from the transition from HFC-134a to HFO-1234yf in mobile AC in developed countries and the implementation of other provisions of the current regional and national HFC regulations in the EU, the USA, and Japan (see Sect. 2.3).
The effect of the regulations in the EU, the USA, and Japan, including the changes in mobile AC, are estimated to reduce the global emissions by 0.4–0.5 in 2050, relative to the current policy K-I scenario (not shown).
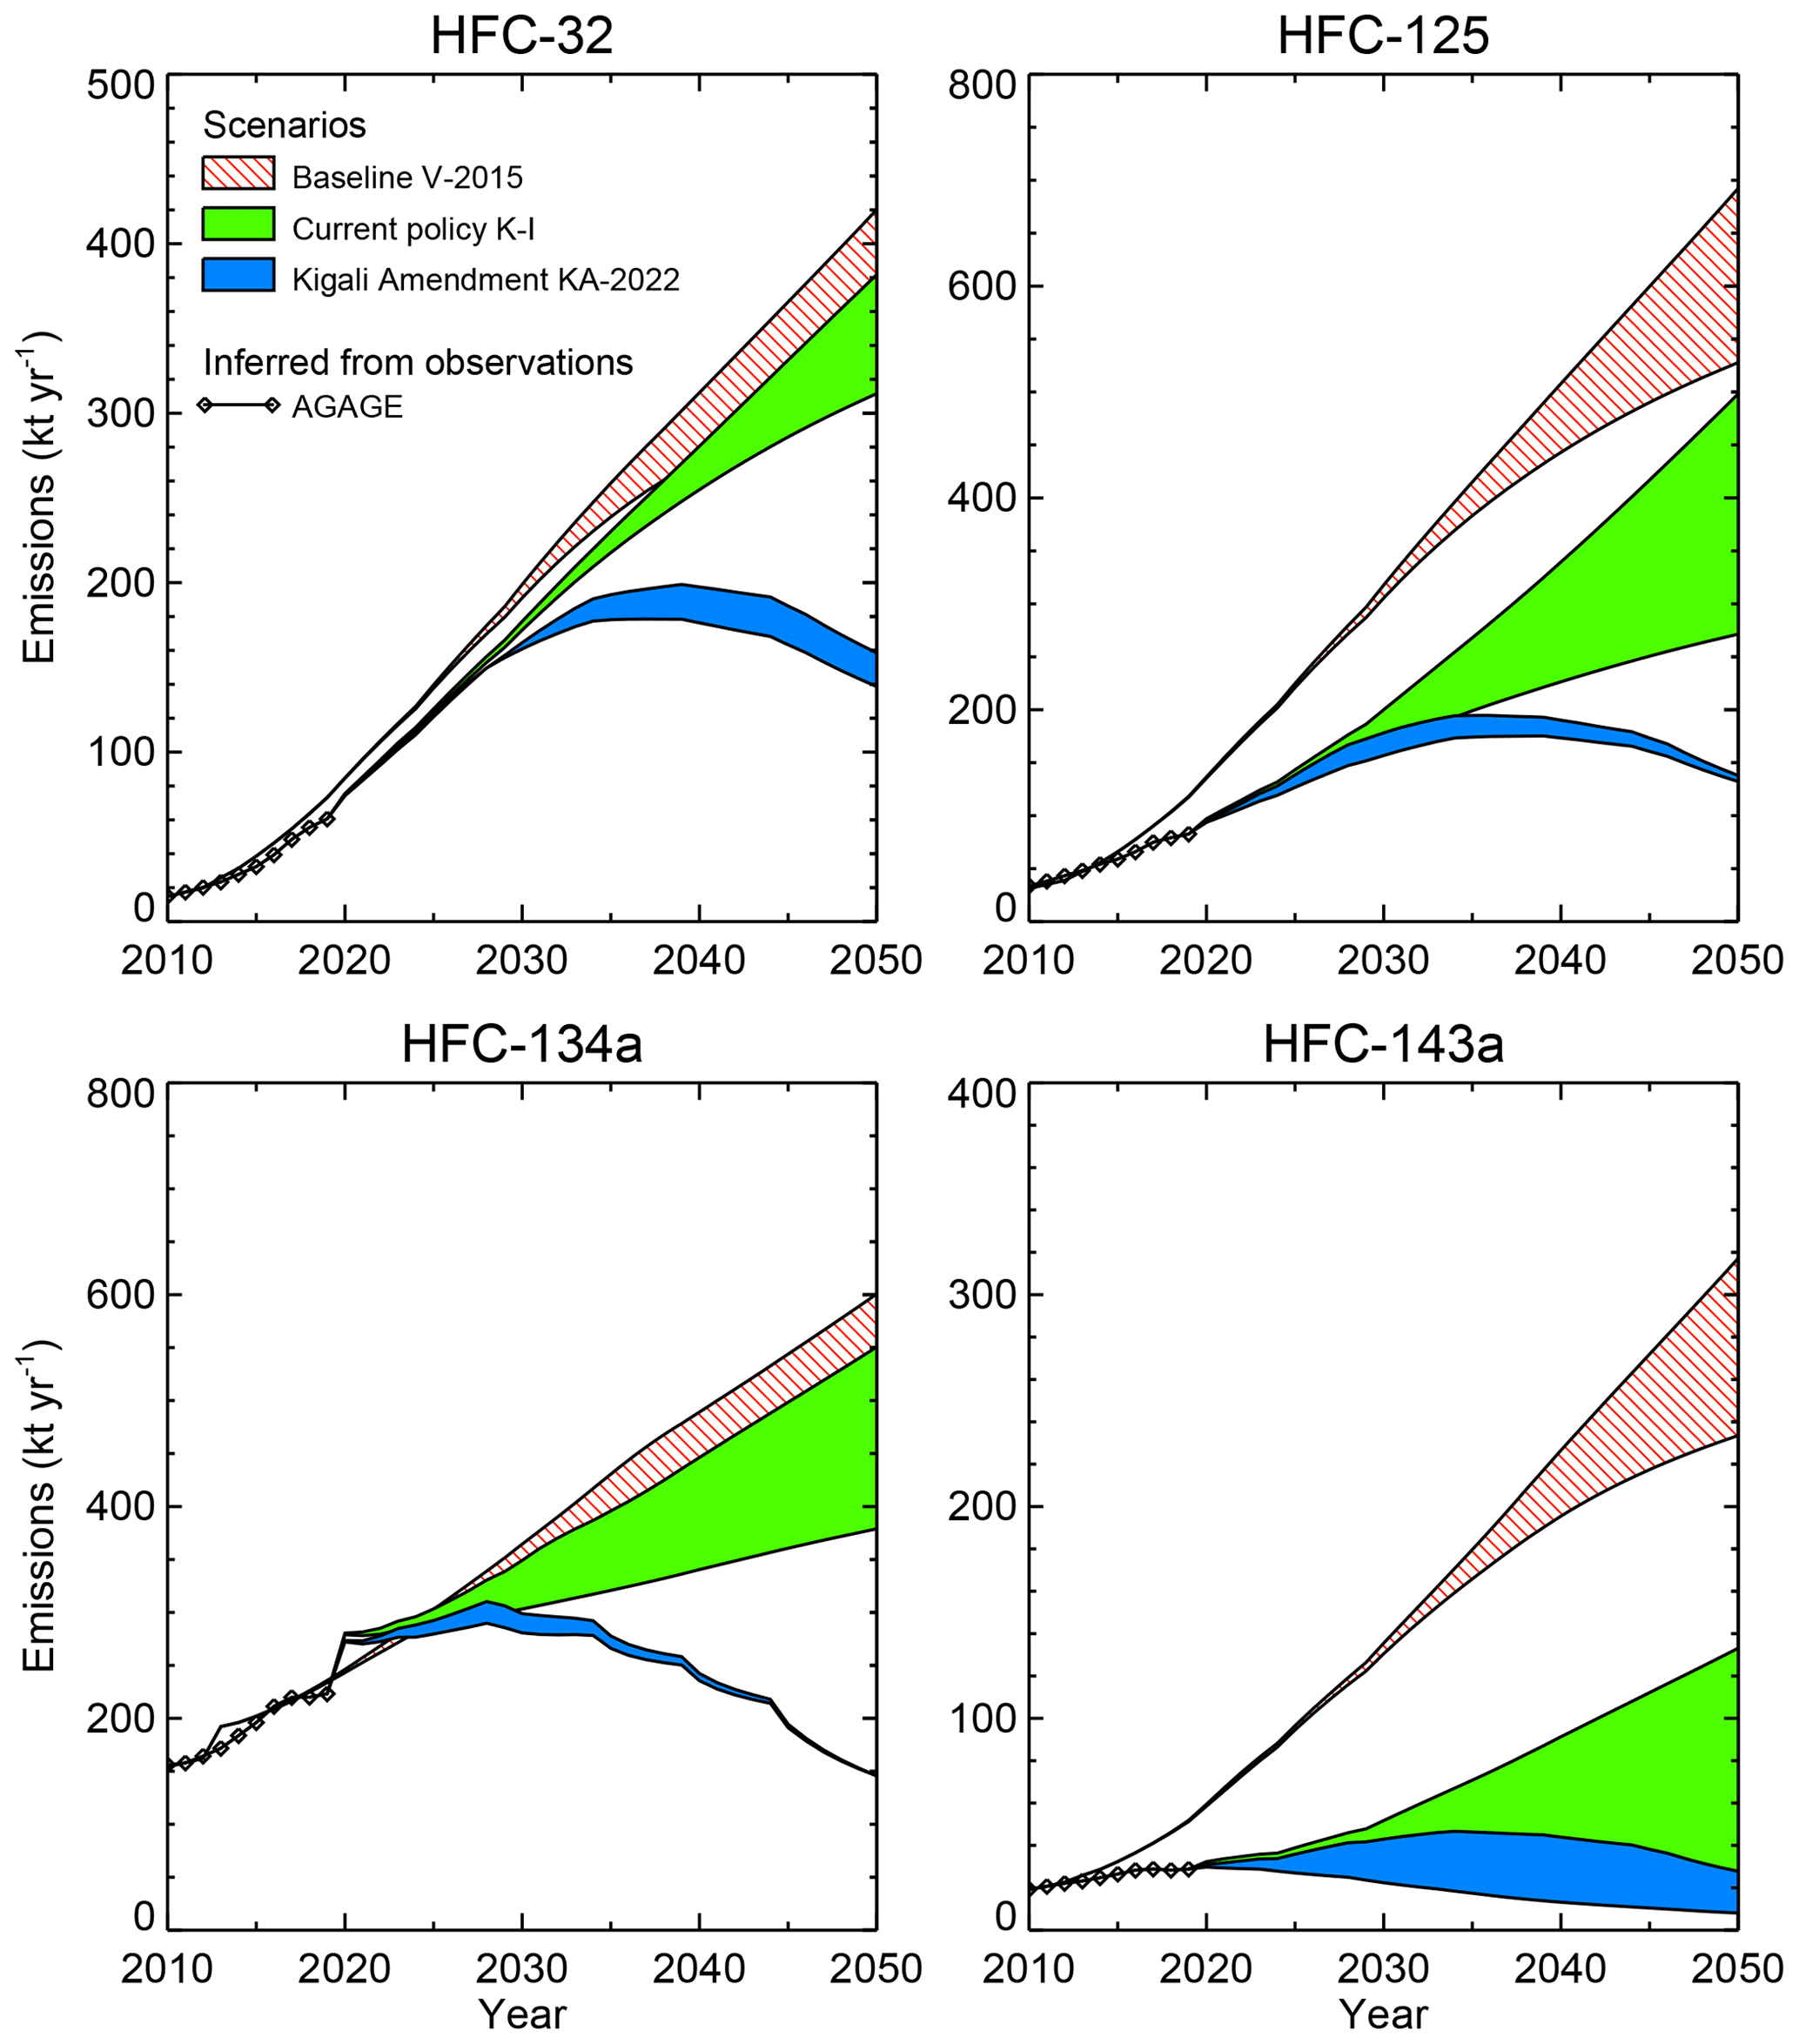
Figure 5Global total emissions (kt yr−1) of HFC-32, HFC-125, HFC-134a, and HFC-143a from the V-2015 baseline scenario, the current policy K-I scenario, and the Kigali Amendment (KA-2022) scenario. The bands represent the upper and lower ranges of these scenarios. Also shown are the emissions inferred from observed mixing ratios from the AGAGE network.
The effects of the regulations are also evident in the emissions projections of HFC-32, HFC-125, HFC-134a, and HFC-143a in Fig. 5 (see Fig. S3 for the other HFCs). The lower emissions in HFC-125 and HFC-143a in the current policy K-I scenario compared to the V-2015 baseline scenario (Fig. 5) contribute most to the difference in CO2 eq. emissions (Fig. 4) due to the large GWPs of 3450 and 5080 (WMO, 2018), respectively. These differences in emissions translate into a difference in 2050 radiative forcing of 0.08–0.09 W m−2 (0.13–0.18 W m−2 in the current policy scenario versus 0.22–0.25 W m−2 in the baseline scenario).
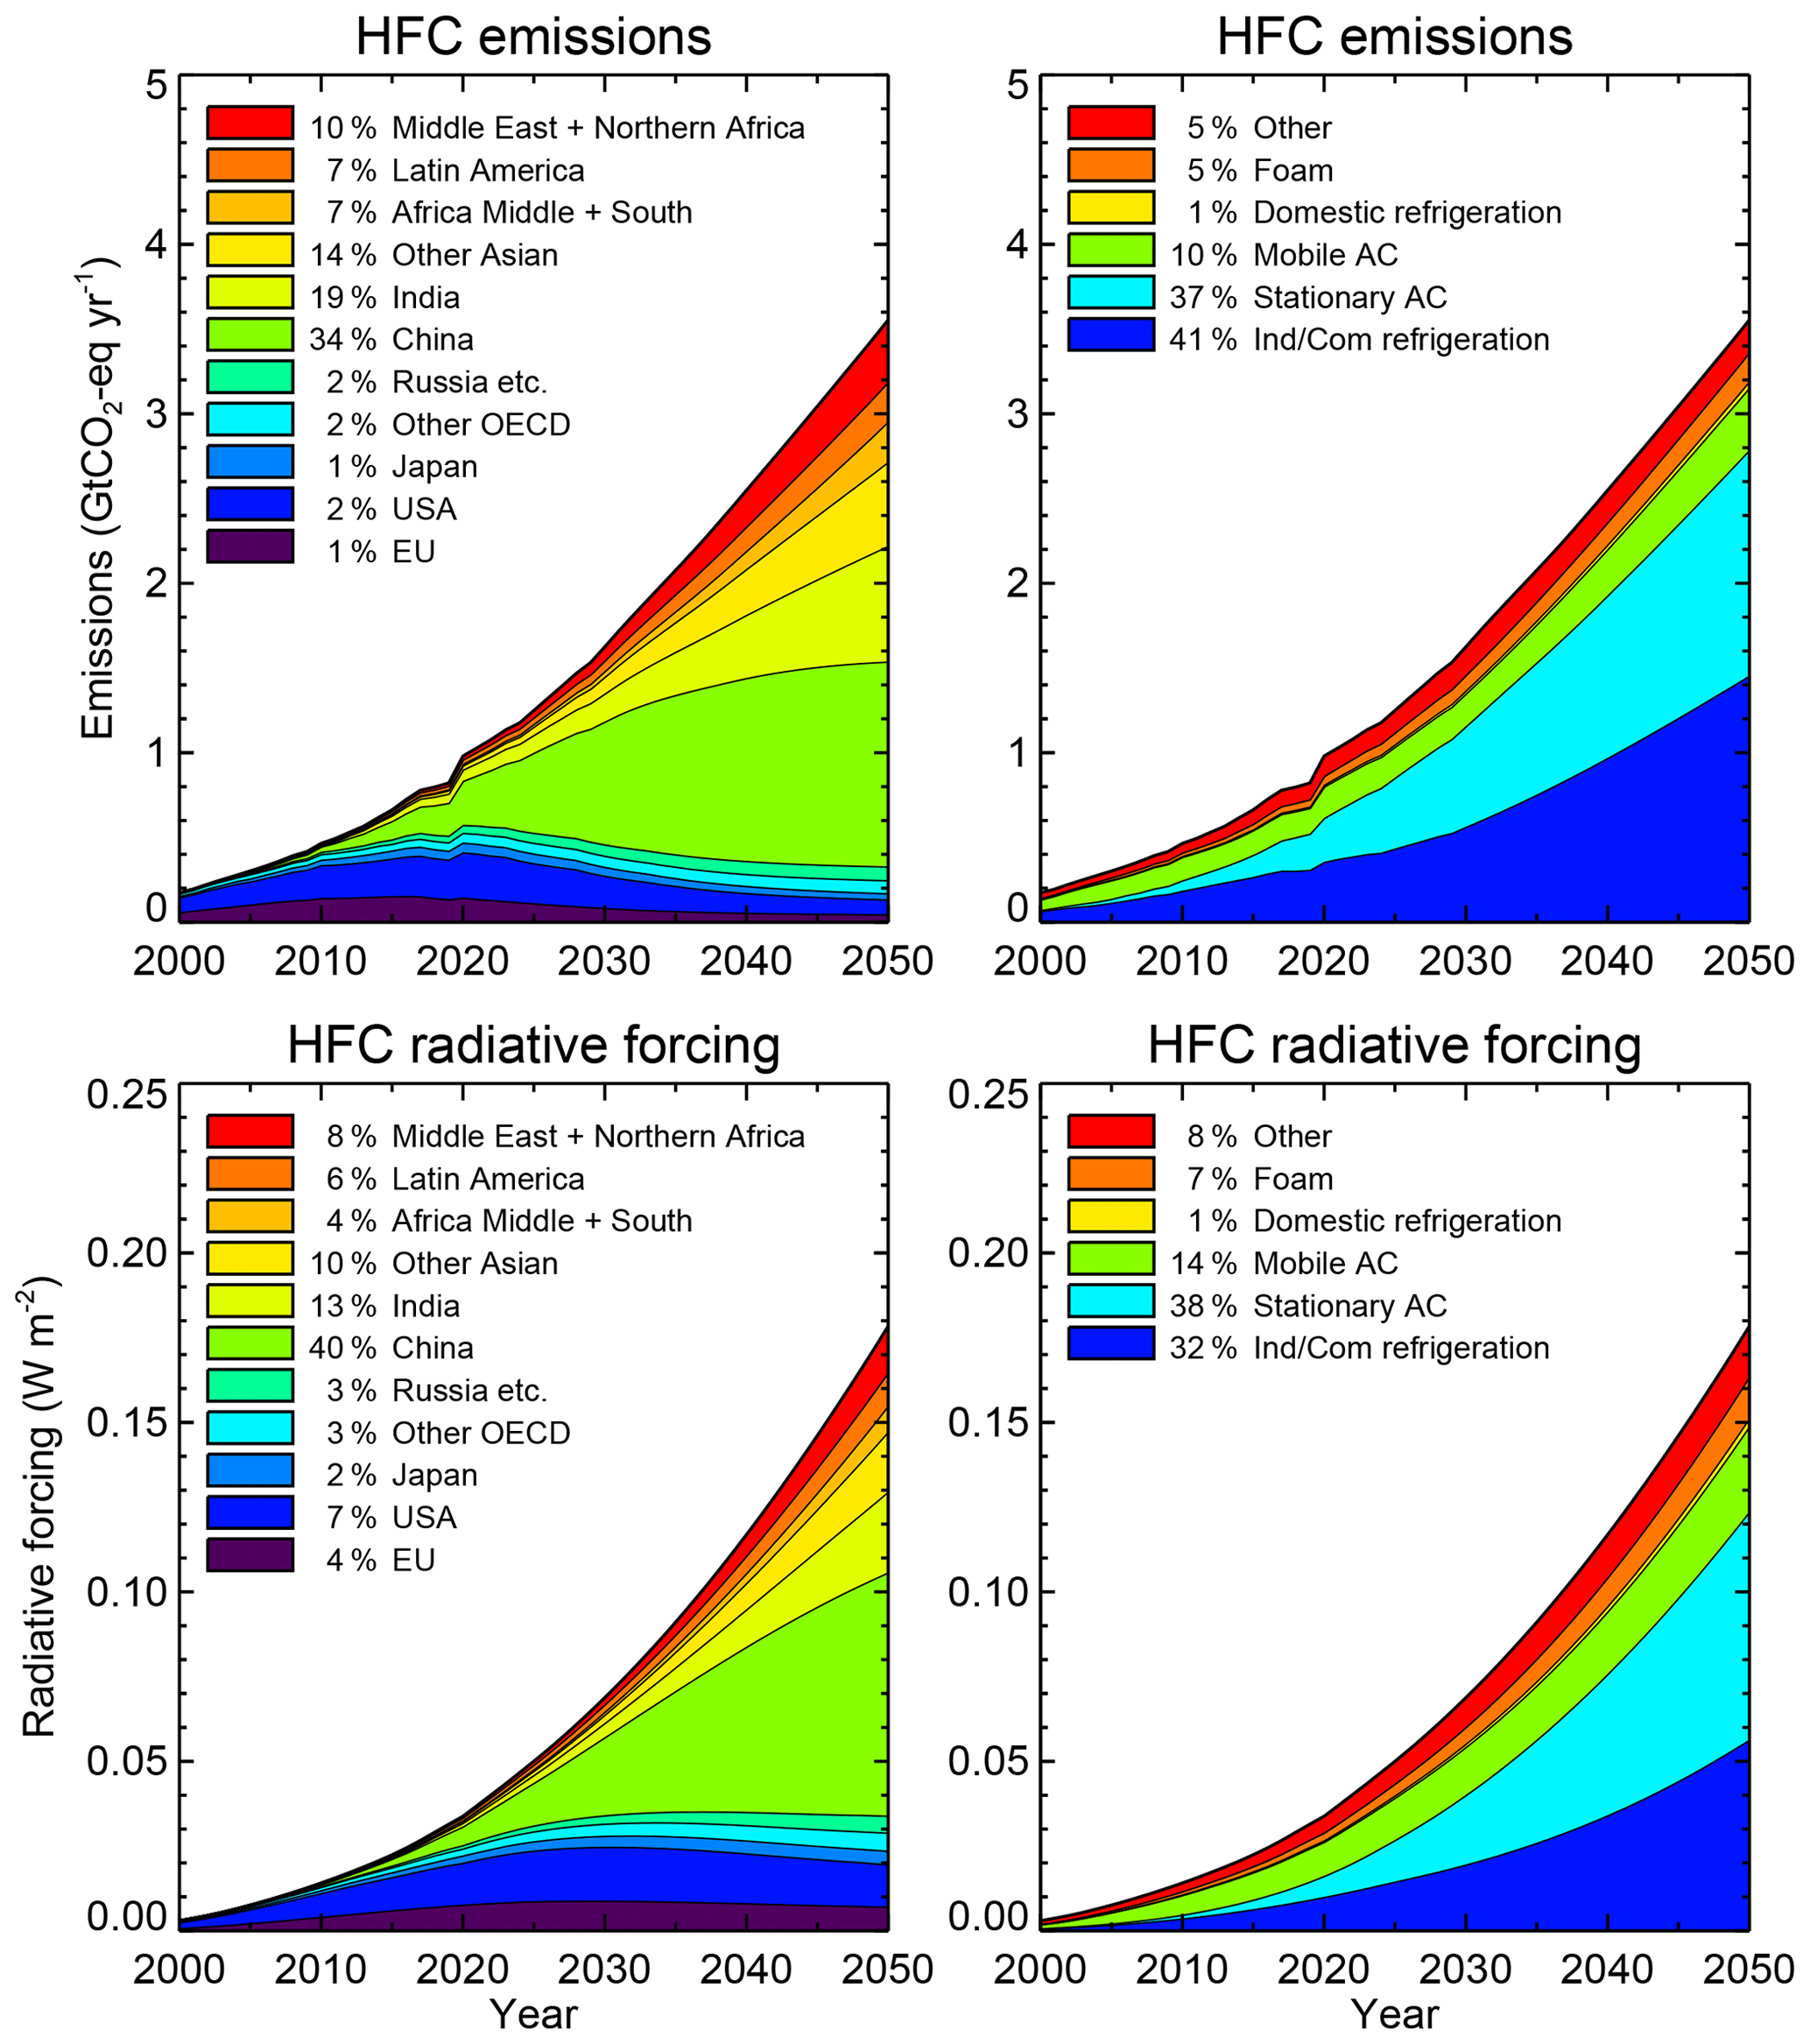
Figure 6Global total HFC emissions (; top panels) and radiative forcing (bottom panels) from the upper range of the current policy Kigali-independent (K-I) scenario. Shown are the contributions from the different regions (left) and different sectors (right). The percentages refer to the relative contributions of the CO2 eq. emissions and radiative forcing in the upper range in 2050. Industrial and commercial refrigeration (ICR) includes transport refrigeration. For developed countries, the consumption and emissions of each subsector is projected individually, starting from the UNFCCC (2021) data. No subsector information is available for most developing countries; therefore, the ICR is considered as one combined-use sector.
The contributions of the different world regions and application sectors to the CO2 eq. emissions and radiative forcing of the upper range of the current policy K-I scenario are shown in Fig. 6. While the contributions to the emissions and radiative forcing in developed countries decrease after about 2020 and 2040, respectively, the contributions from developing countries continue to grow in the absence of the provisions of the Kigali Amendment. The largest contributions are from China (34 % in CO2 eq. emissions and 40 % in radiative forcing for the upper range of the current policy K-I scenario for 2050), followed by India (19 % and 13 %, respectively). Considering the use sectors, the largest contributions for the upper range of the current policy K-I scenario are from ICR and stationary AC applications, with 41 % and 37 %, respectively, of the total in 2050. For the lower range of the current policy K-I scenario, the contributions from ICR applications are strongly reduced, and stationary AC applications have the largest contributions to both emissions and radiative forcing, with 56 % and 47 %, respectively, in 2050 (not shown).
3.5 Kigali Amendment scenario
The provisions of the 2016 Kigali Amendment in KA-2022 are projected to cause emissions in 2050 to drop to 0.9–1.0 ; this is substantially less than the 1.9–3.6 projected for emissions in the absence of the Kigali Amendment (from the current policy K-I scenario; Fig. 4). This is slightly lower than the projected relative to the V-2015 baseline scenario because of a lower Kigali baseline level (average consumption of 2020–2022 or 2024–2026) for developing countries. The corresponding radiative forcing in the current policy K-I scenario is reduced from 0.13–0.18 to 0.09–0.10 W m−2 in 2050 by the provisions of the Kigali Amendment.
3.6 Zero production and emissions scenario
In two hypothetical scenarios that incorporate a cessation in global production or emissions of HFCs in 2023, the emissions and radiative forcing are further reduced (Fig. 4). With a cessation in production in 2023, the radiative forcing drops to about 0.03 W m−2 by 2050, while if all emissions (from new production and from banks) cease in 2023, it is reduced to about 0.01 W m−2 by 2050, compared to 0.09–0.10 W m−2, considering the provisions of the Kigali Amendment. While these scenarios are not necessarily achievable, the do supply important constraints on lower limits of future radiative forcing related to HFCs.
3.7 Surface temperature contributions by HFCs
Radiative forcing of greenhouse gases contributes to global surface warming, changes in atmospheric circulation, and other effects. The contribution of emissions and radiative forcing of HFCs (Fig. 4) to the surface warming is calculated using the MAGICC6 model (Meinshausen et al., 2011a) and shown in Fig. 7. For this calculation, the scenarios are extended to 2100 based on the same assumptions as used for the period 2020–2050. In the current policy K-I scenario, the HFCs are projected to contribute 0.14–0.31 ∘C to the global average surface warming in 2100, compared to 0.28–0.44 ∘C in the V-2015 baseline scenario (Velders et al., 2015; Montzka et al., 2018). With the provisions of the Kigali Amendment, the surface warming of the HFCs drops to about 0.04 ∘C in 2100 (in KA-2022). For comparison, all greenhouse gases are projected to contribute 1.4–4.4 ∘C to the surface warming by the end of the 21st century following IPCC scenarios (Shared Socioeconomic Pathways best estimate; IPCC, 2021). In hypothetical scenarios with a cessation in global production or emissions of HFCs in 2023, the contribution to the surface warming is reduced to virtually zero (0.01 and 0.004 ∘C in 2100, respectively).

Figure 7Contribution of HFCs to the global average surface warming for the V-2015 baseline scenario without measures on HFC consumption and the current policy Kigali-independent (K-I) scenario. The bands represent the upper and lower ranges of these scenarios. Also shown are the effects of the phasedown of HFCs, following controls of the Kigali Amendment (KA-2022), and a hypothetical scenario which assumes that the global production of emissions of HFCs would cease in 2023. No range is shown for the Kigali Amendment scenario since the lower and upper range scenarios virtually coincide. The surface temperature change is calculated using the MAGICC6 model (Meinshausen et al., 2011a). The curves contain the contributions of all HFCs, except HFC-23.
We analyzed trends in the observations of atmospheric abundances of 10 different HFCs from 1990 to 2020, and the emissions inferred from these observations and compared them with previous projections. Total CO2 eq. HFC emissions inferred from observations continue to increase through 2019 but are about 20 % lower than previously projected for 2017–2019. The main reason is lower global inferred emissions of HFC-143a during 2012–2019. This HFC is mainly used in the blend R-404A in ICR applications. Data reported to the UNFCCC also show a lower-than-projected consumption of HFC-143a, with a reduction in use in the EU and a stabilization in the USA and Japan. Consumption data reported for China also shows a reduced use of HFC-143a (Li et al., 2019). These lower emissions and reduced consumption cannot be linked directly to the provisions of the Kigali Amendment, since that only came into force in January 2019. It could indicate that companies transitioned away from higher GWP HFCs, and HFC-143a in particular, for ICR applications prior to national or global regulation mandates. For example, in the EU, the use of any HFC with a GWP of 2500 or more, such as HFC-143a (GWP100 of 5080), has been banned from use in ICR applications since January 2020, but companies appear to have switched to lower-GWP or not-in-kind alternatives before this date. This could also explain the observed emissions reduction in HFC-125, which is used together with HFC-143a in R-404A.
The HFC emissions reported by Annex 1 (developed) countries to the UNFCCC are roughly constant throughout the period 2014–2018 and account for about half of the global total emissions inferred from observations during these years. This gap is predominantly not the result of underreporting by Annex 1 countries (at least not from the EU and the USA, for which atmospheric-measurement-based emissions estimates are in general agreement with UNFCCC reporting) but instead is associated with substantial emissions from non-Annex 1 countries (Montzka et al., 2018).
New HFC scenario projections are developed based on the trends in the use of HFCs in developed and developing countries, current policies in effect in the EU, the USA, and Japan, and emissions inferred from observed abundances as constraints until 2019. In this current policy K-I scenario, the 2050 HFC emissions of 1.9–3.6 are substantially lower than in a baseline scenario (V-2015) derived without any control measures or anticipation of control measures of 4.0–5.3 . The provisions of the Kigali Amendment in addition to the current policies are projected (in KA-2022) to reduce the emissions further to 0.9–1.0 by 2050, which is very similar to total HFC emissions in 2019 of about 0.8 .
Global emissions of all fluorinated gases have recently been estimated by Purohit et al. (2020) using projections of activity data in various sectors and taking into account the national and regional emission controls in place as of 2016 when the Kigali Amendment was adopted. Their baseline 2050 emissions are about 4.3 , which is consistent with the baseline derived previously (V-2015) for that year but higher than our current policy K-I scenario that includes the consideration of additional control measures in some countries.
Li et al. (2019) reported projections of HFC use and emissions for China. Their 2050 business-as-usual HFC emissions are about 0.9 , which agrees well with our current policy K-I estimate for China of 0.9–1.3 . In our K-I scenario, we use the Chinese historical HFC consumption from 1995 to 2017 from Li et al. (2019) as a starting point but with somewhat different assumptions with respect to growth rates and market saturation. Li et al. (2019) estimated total Chinese HFC emissions in 2050, considering compliance with the Kigali Amendment, of about 0.20 , which is slightly lower than our estimate of about 0.43 . Liu et al. (2019) reported projections specifically for room AC in China and estimated 2050 emissions of 0.13–0.26 for this use sector. This number cannot be directly compared with our scenario, since we have one sector of stationary AC, which consists of both residential and commercial AC.
Projected mixing ratios, radiative forcing, and globally averaged temperature changes are calculated from the projected HFC emissions. The 2050 radiative forcing is 0.13–0.18 W m−2 in the current policies K-I scenario and drops to 0.08–0.09 W m−2 when the additional Kigali Amendment controls are considered (in KA-2022). In the current policies K-I scenario, the HFCs are projected to contribute 0.14–0.31 ∘C to the global surface warming in 2100, compared to 0.28–0.44 ∘C without policies. Following the Kigali Amendment, the surface warming of HFCs is reduced to about 0.05 ∘C in 2050 and 0.04 ∘C in 2100 (KA-2022. In a hypothetical scenario with a full phaseout of HFCs production and consumption in 2023, the contribution is reduced to about 0.01 ∘C in 2100.
Clearly, uncertainties are associated with the consumption, emissions, radiative forcing and surface temperatures calculated and projected in these scenarios. These uncertainties originate from, e.g., the box model (i.e., the lifetime of the HFCs), the emission factors, radiative properties of the HFCs, and the temperature calculation. Uncertainties are also associated with the scenarios themselves, as are expressed by the ranges shown for the emissions, radiative forcing, and temperatures. In our study, the focus is more on comparing the effects of different scenarios and less on their absolute values. The uncertainties in the model and parameters are therefore less important and not considered here. An extensive uncertainty analyses of similar long-lived ozone-depleting compounds has been reported by (Velders and Daniel, 2014).
Projected CO2 eq. emissions, radiative forcing, and climate warming calculated here are only the effects of the direct emissions of HFCs. There are also indirect emissions of greenhouse gases associated with the production and use of HFCs in various applications. For example, AC systems use electricity to operate and, depending on the manner in which the electricity is generated, significant emissions of CO2 can occur. This, and other indirect effects arising from the use of HFCs and/or alternative substances and technologies, needs to be considered to estimate the complete effect of HFCs and alternatives and the Kigali Amendment on climate. For example, switching to superefficient low-GWP alternatives in room AC systems and cooling equipment in general has both direct and indirect climate benefits (Shah et al., 2015, 2019). Purohit et al. (2020) estimated significant electricity savings from a global phasedown of HFCs in addition to the saving in GWP-weighted emissions from HFCs directly.
In conclusion, the current observed trends in developed and developing countries and policies in several developed countries reduce the projected global average surface warming attributed to HFC emissions (excluding HFC-23) by about 0.14 ∘C (from 0.28–0.44 to 0.14–0.31 ∘C) in 2100, compared to earlier estimates that did not include the updated data and new controls. A further reduction of 0.10–0.26 ∘C (to about 0.04 ∘C) is possible in 2100 with the global implementation and compliance with the provisions of the Kigali Amendment.
Data used in this publication are available at https://doi.org/10.5281/zenodo.6520707 (Velders, 2022) and upon request to the corresponding author (guus.velders@rivm.nl).
The supplement related to this article is available online at: https://doi.org/10.5194/acp-22-6087-2022-supplement.
GJMV designed the research, collected and analyzed the consumption data, and performed the calculations. JSD, SAM, and MR assisted with the research design. Measurement data were collected by SAM, IV, MR, PBK, JM, SO'D, RGP, RFW, and DY. GJMV wrote the article, with contributions from all co-authors.
The contact author has declared that neither they nor their co-authors have any competing interests.
Publisher's note: Copernicus Publications remains neutral with regard to jurisdictional claims in published maps and institutional affiliations.
We thank Jianxin Hu (University of Beijing), for the information about use of HFC in China, and Kristen Taddonio (Institute for Governance and Sustainable Development), for the information of HFC use for mobile AC.
The five AGAGE stations from which ambient measurements were used here have been supported by the National Aeronautics and Space Administration (NASA; grant nos. NNX16AC98G (to MIT), NNX16AC97G, and NNX16AC96G (to SIO), and preceding grants). Support also comes from the UK Department for Business, Energy and Industrial Strategy (BEIS; contract no. 1537/06/2018 to the University of Bristol) for Mace Head, the National Oceanic and Atmospheric Administration (NOAA; contract no. 1305M319CNRMJ0028 to the University of Bristol) for Ragged Point, and the Commonwealth Scientific and Industrial Research Organization (CSIRO) and the Bureau of Meteorology (Australia) for Kennaook / Cape Grim. NOAA measurements of HFCs benefited from the technical assistance of Caroline Sico, Bradley Hall, Ben Miller, and Molly Crotwell, who are personnel at remote sampling stations, and funding in part from the NOAA Climate Program Office's AC4 program (NOAA Coorperative Agreement with CIRES; grant no. NA17OAR4320101).
This paper was edited by Andreas Engel and reviewed by two anonymous referees.
EU: Directive 2006/40/EC of the European parliament and of the council of 17 May 2006 relating to emissions from air-conditioning systems in motor vehicles, Official J. EU, L161, 12–18, 2006.
EU: Regulation (EC) No 517/2014 of the European parliament and of the council of 16 April 2014 on fluorinated greenhouse gases and repealing Regulation (EC) No 842/2006, Official J. EU, L 150, 195–230, 2014.
Fang, X., Velders, G. J. M., Ravishankara, A. R., Molina, M. J., Hu, J., and Prinn, R. G.: Hydrofluorocarbon (HFC) emissions in China: An inventory for 2005–2013 and projections to 2050, Environ. Sci. Technol., 50, 2027–2034, https://doi.org/10.1021/acs.est.5b04376, 2016.
Flerlage, H., Velders, G. J. M., and de Boer, J.: A review of bottom-up and top-down emission estimates of hydrofluorocarbons (HFCs) in different parts of the world, Chemosphere, 283, 131208, https://doi.org/10.1016/j.chemosphere.2021.131208, 2021.
Gschrey, B., Schwarz, W., Elsner, C., and Engelhardt, R.: High increase of global F-gas emissions until 2050, Greenhouse Gas Measurement & Management, 1, 85–92, https://doi.org/10.1080/20430779.2011.579352, 2011.
Hu, L., Montzka, S. A., Miller, J. B., Andrews, A. E., Lehmann, S. J., Miller, B. R., Thoning, K., Sweeney, C., Chen, H., Godwin, D. S., Masarie, K., Bruhwiler, L., Fischer, M. L., Biraud, S. C., Torn, M. S., Mountain, M., Nehrkorn, T., Eluszkiewicz, J., Miller, S., Draxler, R. R., Stein, A. F., Hall, B. D., Elkins, J. W., and Tans, P. P.: U. S. emissions of HFC-134a derived for 2008–2012 from an extensive flask-air sampling network, J. Geophys. Res., 120, 801–825, https://doi.org/10.1002/2014JD022617, 2015.
Hu, L., Montzka, S. A., Lehman, S. J., Godwin, D. S., Miller, B. R., Andrews, A. E., Thoning, K., Miller, J. B., Sweeney, C., Siso, C., Elkins, J. W., Hall, B. D., Mondeel, D. J., Nance, D., Nehrkorn, T., Mountain, M., Fischer, M. L., Biraud, S. C., Chen, H., and Tans, P. P.: Considerable contribution of the Montreal Protocol to declining greenhouse gas emissions from the United States, Geophys. Res. Lett., 44, 8075–8083, https://doi.org/10.1002/2017GL074388, 2017.
Hurwitz, M. M., Flemming, E. L., Newman, P. A., Li, F., Mlawer, E., Cady-Pereira, K., and Bailey, R.: Ozone depletion by hydrofluorocarbons, Geophys. Res. Lett., 8686–8692, https://doi.org/10.1002/2015GL065856, 2015.
IPCC: Climate Change 2021: The physical science basis, Contribution of Working Group I to the sixth assessment report of the Intergovernmental Panel on Climate Change, edited by: Masson-Delmotte, V., Zhai, P., Pirani, A., Connors, S. L., Péan, C., Berger, S., Caud, N., Chen, Y., Goldfarb, L., Gomis, M. I., Huang, M., Leitzell, K., Lonnoy, E., Matthews, J. B. R., Maycock, T. K., Waterfield, T., Yelekçi, O., Yu, R., and Zhou, B., Cambridge Univ Press, Cambridge, UK and New York, 2021.
Li, Y.-X., Zhang, Z.-Y., An, M.-D., Gao, D., and Hu, J.-X.: The estimated schedule and mitigation potential for hydrofluorocarbons phase-down in China, Advances in Climate Change Research, 10, 174–180, https://doi.org/10.1016/j.accre.2019.10.002, 2019.
Liu, L., Dou, Y., Yao, B., Bie, P., Wang, L., Peng, M., and Hu, J.: Historical and projected HFC-410A emission from room air conditioning sector in China, Atmos. Environ., 212, 194–200, https://doi.org/10.1016/j.atmosenv.2019.05.022, 2019.
Manning, A. J., Redington, A. L., Say, D., O'Doherty, S., Young, D., Simmonds, P. G., Vollmer, M. K., Mühle, J., Arduini, J., Spain, G., Wisher, A., Maione, M., Schuck, T. J., Stanley, K., Reimann, S., Engel, A., Krummel, P. B., Fraser, P. J., Harth, C. M., Salameh, P. K., Weiss, R. F., Gluckman, R., Brown, P. N., Watterson, J. D., and Arnold, T.: Evidence of a recent decline in UK emissions of hydrofluorocarbons determined by the InTEM inverse model and atmospheric measurements, Atmos. Chem. Phys., 21, 12739–12755, https://doi.org/10.5194/acp-21-12739-2021, 2021.
Meinshausen, M., Raper, S. C. B., and Wigley, T. M. L.: Emulating coupled atmosphere-ocean and carbon cycle models with a simpler model, MAGICC6 – Part 1: Model description and calibration, Atmos. Chem. Phys., 11, 1417–1456, https://doi.org/10.5194/acp-11-1417-2011, 2011a.
Meinshausen, M., Wigley, T. M. L., and Raper, S. C. B.: Emulating atmosphere-ocean and carbon cycle models with a simpler model, MAGICC6 – Part 2: Applications, Atmos. Chem. Phys., 11, 1457–1471, https://doi.org/10.5194/acp-11-1457-2011, 2011b.
METI: Act on the rational use and proper management of fluorocarbons (Act no. 64 of 2001), http://conf.montreal-protocol.org/meeting/workshops/hfc_management/presentations/Statements by Heads of Delegations/4-Masafumi Ohki_session_4.ppt (last access: 2 October 2015), Ministry of Economy, Trade and Industry, Japan, Tokyo, 2015.
Montzka, S. A., McFarland, M., Andersen, S. O., Miller, B. R., Fahey, D. W., Hall, B. D., Hu, L., Siso, C., and W., E. J.: Recent trends in global emissions of hydrochlorofluorocarbons and hydrofluorocarbons - Reflecting on the 2007 Adjustments to the Montreal Protocol, J. Phys. Chem. A, 119, 4439–4449, https://doi.org/10.1021/jp5097376, 2015.
Montzka, S. A., Velders, G. J. M. (lead authors), Krummel, P. B., Mühle, J., Orkin, V. L., Park, S., Shah, N., and Walter-Terrinoni, H.: Hydrofluorocarbons (HFCs), Chapter 2 in: Scientific Assessment of Ozone Depletion: 2018, Global Ozone Research and Monitoring, World Meteorological Organization, Geneva, Switzerland, 2018.
NIES: National greenhouse gas inventory report of Japan, edited by: Studies, N. I. o. E., Center for Global Environmental Research, National Institute for Environmental Studies, National Institute of Environmental Studies, Tsubuka, Japan, 2020.
O'Neill, B. C., Carter, T. R., Ebi, K. L., Edmonds, J., Hallegatte, S., Kemp-Benedict, E., Kriegler, E., Mearns, L., Moss, R., Riahi, K., van Ruijven, B., and van Vuuren, D.: Meeting Report of the Workshop on The Nature and Use of New Socioeconomic Pathways for Climate Change Research, Boulder, CO, November 2–4, 2011, (database version 0.93), https://secure.iiasa.ac.at/web-apps/ene/SspDb/dsd?Action=htmlpage&page=about (last access: 26 January 2015), International Institute for Applied System Analysis, Laxenburg, AustriaUNEP/OzL.Pro.16/4, 110, 2012.
Prinn, R. G., Weiss, R. F., Arduini, J., Arnold, T., DeWitt, H. L., Fraser, P. J., Ganesan, A. L., Gasore, J., Harth, C. M., Hermansen, O., Kim, J., Krummel, P. B., Li, S., Loh, Z. M., Lunder, C. R., Maione, M., Manning, A. J., Miller, B. R., Mitrevski, B., Mühle, J., O'Doherty, S., Park, S., Reimann, S., Rigby, M., Saito, T., Salameh, P. K., Schmidt, R., Simmonds, P. G., Steele, L. P., Vollmer, M. K., Wang, R. H., Yao, B., Yokouchi, Y., Young, D., and Zhou, L.: History of chemically and radiatively important atmospheric gases from the Advanced Global Atmospheric Gases Experiment (AGAGE), Earth Syst. Sci. Data, 10, 985–1018, https://doi.org/10.5194/essd-10-985-2018, 2018.
Purohit, P. and Höglund-Isaksson, L.: Global emissions of fluorinated greenhouse gases 2005–2050 with abatement potentials and costs, Atmos. Chem. Phys., 17, 2795–2816, https://doi.org/10.5194/acp-17-2795-2017, 2017.
Purohit, P., Höglund-Isaksson, L., Dulac, J., Shah, N., Wei, M., Rafaj, P., and Schöpp, W.: Electricity savings and greenhouse gas emission reductions from global phase-down of hydrofluorocarbons, Atmos. Chem. Phys., 20, 11305–11327, https://doi.org/10.5194/acp-20-11305-2020, 2020.
Rigby, M., Prinn, R. G., O'Doherty, S., Montzka, S. A., McCulloch, A., Harth, C. M., Mühle, J., Salameh, P. K., Weiss, R. F., Young, D., Simmonds, P. G., Hall, B. D., Dutton, G. S., Nance, D., Mondeel, D. J., Elkins, J. W., Krummel, P. B., Steele, L. P., and Fraser, P. J.: Re-evaluation of the lifetimes of the major CFCs and CH3CCl3 using atmospheric trends, Atmos. Chem. Phys., 13, 2691–2702, https://doi.org/10.5194/acp-13-2691-2013, 2013.
Say, D., Ganesan, A. L., Lunt, M. F., Rigby, M., O'Doherty, S., Harth, C., Manning, A. J., Krummel, P. B., and Bauguitte, S.: Emissions of halocarbons from India inferred through atmospheric measurements, Atmos. Chem. Phys., 19, 9865–9885, https://doi.org/10.5194/acp-19-9865-2019, 2019.
Shah, N., Wei, M., Letschert, V. E., and Phadke, A.: Benefits of leapfrogging to superefficiency and low global warming potential refrigerants in room air conditioning, Lawrence Berkeley National Laboratory (LBNL), Berkeley, USALBLN-1003671, 2015.
Shah, N., Wei, M., Letschert, V. E., and Phadke, A.: Benefits of energy efficient and low-global warming potential refrigerant cooling equipment, Lawrence Berkeley National Laboratory (LBNL), Berkeley, USALBLN-2001229, 2019.
Stanley, K. M., Say, D., Muhle, J., Harth, C. M., Krummel, P. B., Young, D., O'Doherty, S. J., Salameh, P. K., Simmonds, P. G., Weiss, R. F., Prinn, R. G., Fraser, P. J., and Rigby, M.: Increase in global emissions of HFC-23 despite near-total expected reductions, Nat. Commun., 11, 397, https://doi.org/10.1038/s41467-019-13899-4, 2020.
Taddonio, K.: Global number of vehicles using HFO-1234yf refrigerant, Institute for Governance and Sustainable Development, Washington, DC, USA, 2021.
UNEP: Technology and Economic Assessment Panel. 2018 Assessment report, United Nations Environment Programme, Nairobi, Kenya, 2019.
UNEP: Handbook for the Montreal Protocol on substances that deplete the ozone layer, http://ozone.unep.org/ (last access: 16 July 2021), Ozone Secretariat, United Nations Environment Programme (UNEP), Nairobi, Kenya, 2020.
UNEP: Production and consumption of ozone depleting substances under the Montreal Protocol, http://ozone.unep.org (last access: April 2021), United Nations Environment Programme, Nairobi, Kenya, 2021.
UNFCCC: National Inventory Submissions 2020 to the United Nations Framework Convention of Climate Change, http://unfccc.int (last access: February 2021), Climate Change Secretariat, Bonn, Germany, 2021.
US-EPA: American Innovation and Manufacturing (AIM) Act, US Environmental Protection Agency, Washington, 2020.
Velders, G.: veldersguus/HFC-scenarios-2022: v1.0 (v1.0), Zenodo [data set], https://doi.org/10.5281/zenodo.6520707, 2022.
Velders, G. J. M. and Daniel, J. S.: Uncertainty analysis of projections of ozone-depleting substances: mixing ratios, EESC, ODPs, and GWPs, Atmos. Chem. Phys., 14, 2757–2776, https://doi.org/10.5194/acp-14-2757-2014, 2014.
Velders, G. J. M., Fahey, D. W., Daniel, J. S., McFarland, M., and Andersen, S. O.: The large contribution of projected HFC emissions to future climate forcing, P. Nat. Acad. Sci. USA, 106, 10949–10954, https://doi.org/10.1073/pnas.0902817106, 2009.
Velders, G. J. M., Fahey, D. W., Daniel, J. S., Andersen, S. O., and McFarland, M.: Future atmospheric abundances and climate forcings from scenarios of global and regional hydrofluorocarbon (HFC) emissions, Atmos. Environ., 123, 200–209, https://doi.org/10.1016/j.atmosenv.2015.10.071, 2015.
Vollmer, M. K., Reimann, S., Hill, M., and Brunner, D.: First observations of the fourth generation synthetic halocarbons HFC-1234yf, HFC-1234ze(E), and HCFC-1233zd(E) in the atmosphere, Environ. Sci. Technol., 49, 2703–2708, https://doi.org/10.1021/es505123x, 2015.
WMO: Scientific Assessment of Ozone Depletion: 2018, Global Ozone Research and Monitoring Project, No. 58, World Meteorological Organization, Geneva, 2018.
Xu, Y., Zaelke, D., Velders, G. J. M., and Ramanathan, V.: The role of HFCs in mitigating 21st century climate change, Atmos. Chem. Phys., 13, 6083–6089, https://doi.org/10.5194/acp-13-6083-2013, 2013.
Yao, B., Fang, X., Vollmer, M. K., Reimann, S., Chen, L., Fang, S., and Prinn, R. G.: China's hydrofluorocarbon emissions for 2011–2017 inferred from atmospheric measurements, Environmental Science and Technology Letters, 6, 479–486, https://doi.org/10.1021/acs.estlett.9b00319, 2019.
Zhang, J. and Wang, C.: China's hydrofluorocarbons challenge, Nat. Clim. Change, 4, 943–945, 2014.