the Creative Commons Attribution 4.0 License.
the Creative Commons Attribution 4.0 License.
 | 02 May 2022
Smoke in the river: an Aerosols, Radiation and Clouds in southern Africa (AEROCLO-sA) case study
Cyrille Flamant
Marco Gaetani
Jean-Pierre Chaboureau
Patrick Chazette
Juan Cuesta
Stuart John Piketh
Paola Formenti
The formation of a river of smoke crossing southern Africa was investigated during the Aerosols, Radiation and Clouds in southern Africa (AEROCLO-sA) campaign in September 2017. A complementary set of global and mesoscale numerical simulations as well as ground-based, airborne and space-borne observations of the dynamics, thermodynamics and composition of the atmosphere are used to characterize the river of smoke in terms of timing and vertical extent of the biomass burning aerosol (BBA) layer.
The study area was under the synoptic influence of a coastal low rooted in a tropical easterly wave and a high-pressure system over the continent and westerly waves at mid latitudes, one of which had an embedded cut-off low (CoL). The coastal low interacted with the second of two approaching westerly waves and ultimately formed a mid-level tropical temperate trough (TTT). The TTT created the fast-moving air mass transported to the southwestern Indian Ocean as a river of smoke. The CoL, which developed and intensified in the upper levels associated with the first (easternmost) westerly wave, remained stationary above northern Namibia prior to the formation of the TTT and was responsible for the thickening of the BBA layer.
This shows that the evolution of the river of smoke is very much tied to the evolution of the TTT, while its vertical extent is related to the presence of the CoL. The mechanisms by which the CoL, observed over Namibia in the entrance region of the river of smoke, influences the vertical structure of the BBA layer is mainly associated with the ascending motion above the BBA layer. In the presence of the CoL, the top of the BBA layer over northern Namibia reaches altitudes above 8 km. This is much higher than the average height of the top of the BBA layer over the regions where the smoke comes from (Angola, Zambia, Zimbabwe, Mozambique), which is 5 to 6 km.
The results suggest that the interaction between the TTTs and the CoLs which form during the winter may have a role in promoting the transport of BBA from fire-prone regions in the tropical band to the temperate mid latitudes and the southwestern Indian Ocean.
- Article
(26485 KB) - Full-text XML
-
Supplement
(4196 KB) - BibTeX
- EndNote


Widespread, coherent bands of smoke from forest fires are regularly observed to cross the southern African subcontinent near the end of southern Africa's dry season, and particularly in September (Annegarn et al., 2002; McMillan et al., 2003; Swap et al., 2003). These features are generally referred to as “rivers of smoke” (owing to the sharply defined boundaries of the smoke plume, giving them the appearance of a “river”) and can be several hundred kilometers wide and extend over a few thousands of kilometers while flowing off the southeastern coast of Africa. The smoke transported in these rivers comes from thousands of agricultural fires as well as accidental forest fires burning in Angola, Zambia, Zimbabwe, Mozambique, the Democratic Republic of Congo, and South Africa, favored by dry conditions during the austral winter (see Fig. 1 in Roberts et al., 2009). The smoke from the southern African subcontinent is generally contained in multiple stratified layers trapped below approximately 850, 700, and 500 hPa, depending on synoptic conditions (Stein et al., 2003). The river-of-smoke events generally correspond to the direct eastward transport of biomass burning aerosols (BBAs) from southern Africa to the southwestern Indian Ocean in five main transport paths classified by Garstang et al. (1996). These trajectories lead to the transport of massive amounts of aerosols and gases (e.g., carbon monoxide) towards the southwestern Indian Ocean (Duflot et al., 2010) and as far as southeastern Australia (Pak et al., 2003; Sinha et al., 2004), with potential important implications for the radiative budget and the marine productivity of the region (Luo et al., 2008).
The aerosol properties, transport and distribution across southern Africa, the South Atlantic and the Indian Ocean have been widely investigated for their key role in controlling the radiative budget in the region and, consequently, global climate dynamics (Zuidema et al., 2016a, b; Haywood et al., 2021; Redemann et al., 2021). Recently, the long-term aerosol transport in the region was characterized in terms of synoptic weather patterns (Gaetani et al., 2021). Nevertheless, to date, the rivers of smoke have exclusively been studied in the framework of the 2000 Southern African Regional Science Initiative (SAFARI 2000) using ground-based, airborne and space-borne observations (Annegarn et al., 2002; Jury and Freiman, 2002; Swap et al., 2003; McMillan et al., 2003; Stein et al., 2003; Schmid et al., 2003; Pak et al., 2003; Magi et al., 2003) as well as numerical simulations (Sinha et al., 2004). Among other studies, Stein et al. (2003) showed that they form in regions where high-pressure and low-pressure synoptic-scale systems are juxtaposed to constrain the shape of the aerosol rivers.
Rivers of smoke are very effective at transporting large amounts of smoke from the fire-prone tropical regions into the mid-latitude westerly circulation (Annegarn et al., 2002). Surface synoptic conditions in the tropical zone are generally dominated by easterly waves and associated lows, whereas aloft a more stable anticyclonic circulation prevails in association with the continental high-pressure system. The subtropical latitudes are dominated by continental highs and baroclinic westerly waves at all levels (Jury and Freiman, 2002). Hence, the transport of smoke from tropical Africa to the southwestern Indian Ocean implies the formation of complex synoptic systems that can bridge two climatic regions, namely the tropical band (10–20∘ S) and the temperate subtropical band (20–30∘ S) over the southern African subcontinent.
Tropical temperate troughs (TTTs) typically form when a tropical disturbance in the lower atmosphere is coupled with a mid-latitude trough in the upper atmosphere (Lyons, 1991). Mid-latitude baroclinic waves are a necessary condition for TTT development (Macron et al., 2014). TTTs are known to be the dominant rainfall-producing weather system over southern Africa during the austral summer, when they form a cloud band that extends along the northwest–southeast direction across the landmass and the adjacent southwestern Indian Ocean (Ratna et al., 2013; Howard et al., 2019, and references therein) and tend to propagate eastward. TTT events have been suggested to act as a major mechanism of poleward transfer of moisture owing to the strong convergence forming a pronounced poleward flux along the cloud band (Ratna et al., 2013). However, the role of TTTs in the transport of BBA during the late winter has never been investigated until now.
During the AEROCLO-sA (AErosol, RadiatiOn and CLOuds in southern Africa) field campaign held in Namibia in August–September 2017 (Formenti et al., 2019), a river of smoke was observed to sweep through southern Africa from west to east between 5 and 6 September 2017. The study area was under the synoptic influence of a coastal low rooted in a tropical easterly wave, a high-pressure system over the continent and westerly waves at the mid latitudes, one of which had an embedded cut-off low (CoL; Favre et al., 2012). During this period, the coastal low interacted with the second of two approaching westerly waves and ultimately formed a mid-level TTT, which created the fast-moving limb of air transported to the southwestern Indian Ocean as a river of smoke. The CoL, which developed and intensified in the upper levels associated with the first (easternmost) of the two approaching westerly waves, remained stationary above northern Namibia prior to the formation of the TTT (from 2 to 4 September 2017) and was responsible for the thickening of the BBA layer that subsequently was conveyed southeastward. The objective of the paper is to assess the respective impact of both the CoL and the TTT on the atmospheric circulation and composition in the mid and lower troposphere over southern Africa prior to and during the river of smoke event.
In Sect. 2 we present the model simulations and measurements used in the study. In Sect. 3, we detail the life cycle of the CoL and the TTT over western Namibia, while their impact on the formation of the river of smoke event over southern Africa is analyzed in Sect. 4. We also detail the vertical distribution and origin of smoke in the lower troposphere over northern Namibia, in the entrance region of the river of smoke, using airborne measurements made on 5 and 6 September. In Sect. 5, the impact of the CoL and the TTT on the tropospheric composition over the subcontinent is investigated. Finally, we summarize and conclude in Sect. 6.
2.1 Modeling
2.1.1 ECMWF reanalysis products: ERA5 and CAMS
The regional circulation over continental southern Africa and adjacent oceans for the period 1–6 September 2017 is analyzed using the Fifth European Centre for Medium-Range Weather Forecasts (ECMWF) Reanalysis (ERA5, Hersbach et al., 2018). The reanalysis outputs are available every hour on a grid as well as 137 pressure levels, 88 of which are below 20 km and 60 below 5 km (note that only 37 levels are available for download). Among the available variables, we focus on mean sea level pressure (MSLP), geopotential height (Z), potential vorticity (PV), outgoing longwave radiation (OLR), vertical velocity (ω) and wind.
We also make use of the Copernicus Atmospheric Monitoring Service (CAMS; Inness et al., 2019) reanalysis available every 3 h (00:00, 03:00, 06:00, 09:00, 12:00, 15:00, 18:00 and 21:00 UTC) with a resolution of approximately 80 km and 60 pressure levels (37 of which are below 20 km and 20 below 5 km) to analyze the evolution of BBA during the episode of interest (note that only 25 levels are available for download). For consistency with ERA5 data, CAMS data have been interpolated onto a 0.25∘ regular grid. In the following, we use organic matter as a proxy for BBA. In addition, we have compared with the same dynamical and thermodynamic variables as for ERA5 in order to check the consistency between the two types of products. This is essential as we intend to investigate the relationship between the atmospheric dynamics and the distribution of BBA. It turns out that fields such as PV, ω, wind and relative humidity are very consistent between ERA5 and CAMS (not shown).
The evolution of the BBA transport and the associated atmospheric circulation from 1 to 6 September 2017 above Namibia is analyzed by using a principal component analysis (PCA) of organic matter aerosol optical thickness (AOT) at 550 nm and MSLP and Z at 700 and 300 hPa from the CAMS reanalysis product. PCA consists in projecting data variability onto an orthogonal basis by solving the eigenvalue problem of the data covariance matrix, so that data variability is decomposed into independent variability modes, each explaining a fraction of the total variability (von Storch and Zwiers, 1999). Each variability mode is presented as an empirical orthogonal function (EOF), accounting for the anomaly pattern of the variable related to the mean of the analyzed period and the associated PC time series accounting for the evolution of the anomaly amplitude. It follows that negative values indicate a reversal of the anomaly pattern.
2.1.2 Meso-NH
A high-resolution simulation of the atmospheric dynamics, thermodynamics, and composition for the case study was also run with the non-hydrostatic mesoscale model Meso-NH (Lac et al., 2018), version 5.4, over a domain covering southern Africa. Running the model at a relatively fine resolution allows a comparison with high spatiotemporal resolution airborne observations at a commensurate scale as well as to have a better description of the topography in the area and its influence on aerosol transport. The model was run on a grid with 5 km horizontal spacing and 64 levels (14 of them in the lower 1 km and 30 in the lower 6 km) with a resolution of 60 m close to the surface to 600 m above 7 km. It was run for 6 d starting from 00:00 UTC on 1 September 2017. The lateral boundary conditions were given by ECMWF operational analysis. The simulation used the Surface Externalisée (SURFEX) scheme for surface fluxes (Masson et al., 2013), a 1.5th-order closure scheme for turbulence (Cuxart et al., 2000), an eddy-diffusivity mass-flux scheme for shallow convection (Pergaud et al., 2009), a microphysical scheme for mixed-phase clouds (Pinty and Jabouille, 1998), a statistical scheme for subgrid cloud cover (Chaboureau and Bechtold, 2002), the Rapid Radiative Transfer Model (Mlawer et al., 1997) for longwave radiation, and the two-stream scheme (Fouquart and Bonnel, 1986) for shortwave radiation. Wind is advected using a fourth-order centered scheme coupled to an explicit fourth-order centered Runge–Kutta time splitting (Lunet et al., 2017), and the other variables are advected with the piece-wise parabolic method (PPM) advection scheme (Colella and Woodward, 1984), a scheme with excellent mass-conservation properties and low numerical diffusion (Müller, 1992).
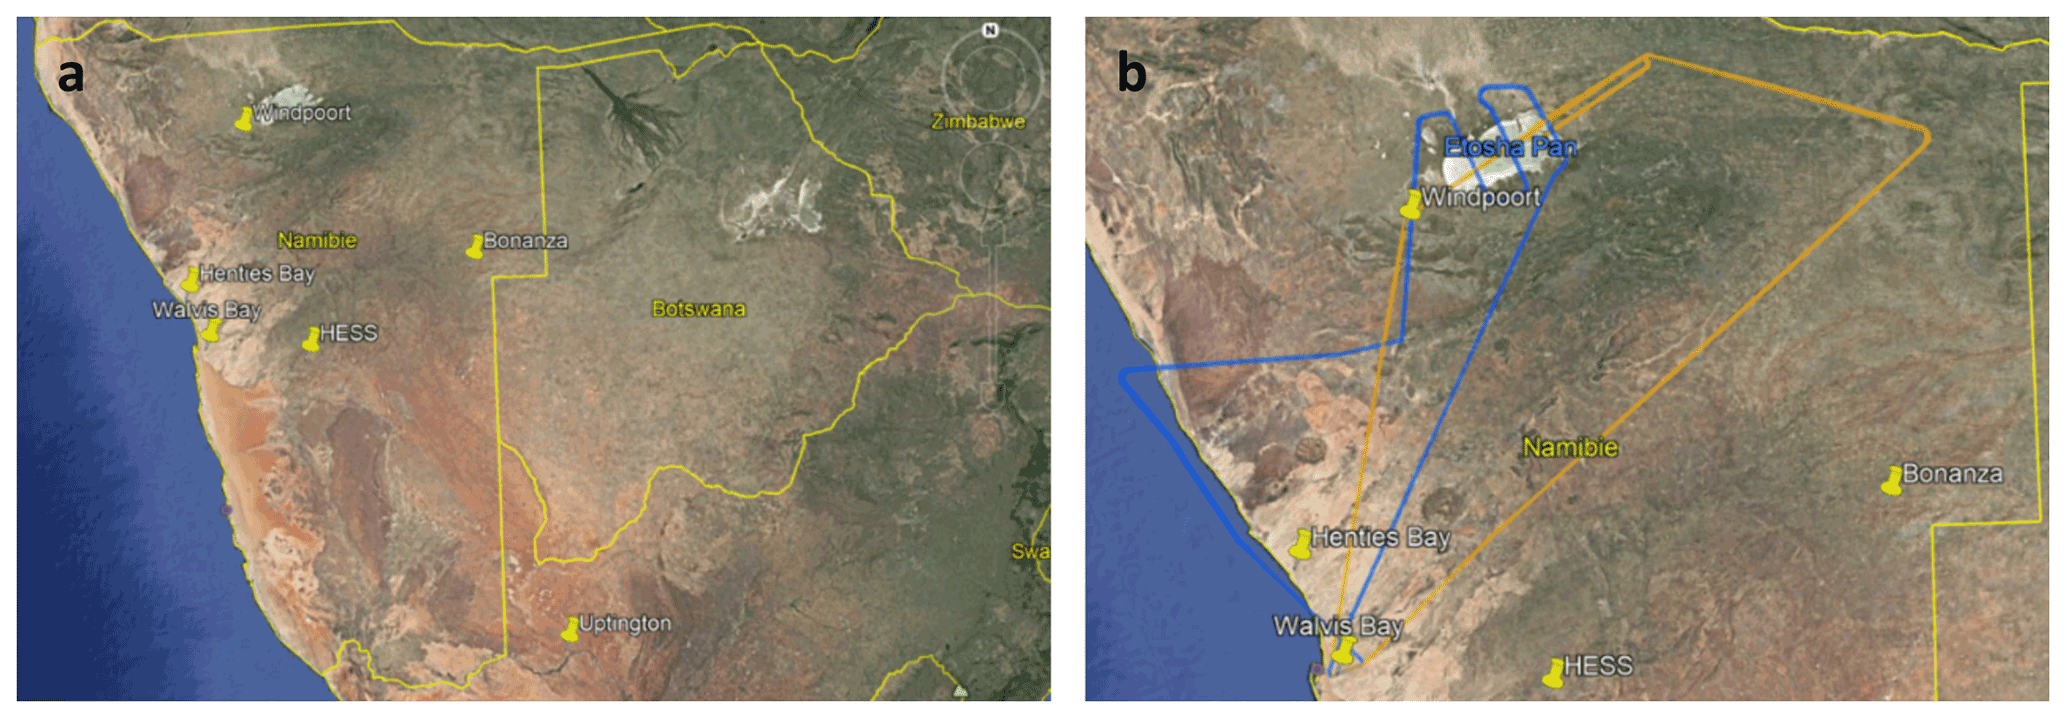
Figure 1(a) Geographical map of Namibia and surrounding countries with the location of the main sites of interest: Walvis Bay (airport), Henties Bay (AEROCLO-sA main ground-based supersite), and AERONET stations in Windpoort, HESS, Bonanza (Namibia), and Upington (South Africa). (b) Zoom on northern Namibia, where the Etosha pan is located (white area just northeast of Windpoort). The blue solid line represents the SAFIRE Falcon 20 flight track on 5 September in the morning (07:36–10:14 UTC), and the orange solid line represents the Falcon 20 flight track on 6 September in the afternoon (10:55–14:01 UTC). Map credit: © Google Earth 2021.
Emission, transport and deposition of dust were parameterized using a prognostic scheme (Grini et al., 2006) to allow online interaction with radiation. In the simulations, a biomass burning (BB) carbon passive tracer (accounting for both black carbon and organic carbon) is used as a proxy for smoke. The BB tracer is emitted in the first layer of the model based on the daily Global Fire Emissions Database (GFED) version 4, available at a horizontal resolution of (van der Werf et al., 2017). The BB tracer is then mixed vertically by turbulence in the atmospheric boundary layer. Fires in the area of interest are not intense enough to inject BBA above the atmospheric boundary layer, as discussed in several studies (e.g., Labonne et al., 2017; Menut et al., 2018; Mallet et al., 2020). No initial conditions are assumed for BBA, so that BB trace concentrations build up with time in the simulation domain. In source regions, BB tracers will fill the lower 6 km of the troposphere in about 12 h, i.e., approximately the time for the atmospheric boundary layer to develop during the day. Therefore, the assessment of the BBA simulation is meaningful only after a spinup period that we estimate at 12 h. Backward trajectories were computed using three passive tracers initialized with the 3D coordinates of each grid cell at their initial location (Gheusi and Stein, 2002). A mass extinction efficiency of 5.05 m2 g−1 (representative of aged smoke as in Mallet et al., 2019) was used to compute AOT at 550 nm from BB carbon concentration simulated by Meso-NH.
2.2 Observations
2.2.1 Ground-based observations
The National Aeronautics and Space Administration Aerosol Robotic Network (NASA AERONET) operates a number of Sun spectral photometers in Namibia and South Africa, providing long-term and continuous monitoring of aerosol optical, microphysical, and radiative properties. We use level-2.0 (cloud-screened and quality-assured) AOT at 500 nm data. AERONET stations of interest are located in Windpoort, Bonanza, the HESS (High Energy Stereoscopic System) site, Henties Bay (Namibia), as well as Upington (South Africa) (see Fig. 1).
2.2.2 Airborne observations
For the period from 5 to 12 September 2017, dynamics and thermodynamics profiles over continental Namibia were obtained from dropsondes released from a high-flying aircraft, the French Falcon 20 aircraft for environmental research of Safire (Service des Avions Français Instrumentés pour la Recherche en Environnement) based in Walvis Bay, on the western coast of Namibia (see Fig. 1). The vertical structure of the aerosol layers was obtained from the nadir-pointing airborne lidar LEANDRE Nouvelle Génération (LNG; Bruneau et al., 2015) installed on the same aircraft. Details about the Safire Falcon 20 flights, the lidar LNG, and the dropsonde launching unit can be found in Formenti et al. (2019). In the following we shall only analyze lidar and dropsonde data acquired on 5 and 6 September 2017.
On 5 September, the Falcon 20 circuit from and to Walvis Bay was performed counterclockwise from 07:36 to 10:14 UTC (flight F06). On 6 September, the Falcon 20 circuit was performed clockwise from 10:55 to 14:01 UTC (flight F09). The flight paths during the AEROCLO-sA campaign aimed at characterizing BBA- or dust-related emission or transport processes over specific areas or at a particular time of day. The clockwise or counterclockwise orientations of the flights were therefore dictated by the need to adapt to the specific emission and transport conditions expected for each flight.
On both flights, the aircraft flew around 10 km a.m.s.l. (above mean sea level), except on 6 September between 11:45 and 12:18 UTC, when the aircraft performed a sounding and penetrated the BBA layer over the Etosha pan. In the following, we will discuss the dynamics and thermodynamics profiles from two dropsondes released over the Etosha pan at nearly the same location: 16.445∘ E/18.772∘ S on 5 September at 08:39 UTC and 16.401∘ E/18.766∘ S on 6 September at 11:46 UTC. We also compare these profiles with the one obtained in the vicinity of Henties Bay, over the ocean at 13.78∘ E/21.69∘ S on 5 September at 09:51 UTC, and with those obtained south of Etosha at 16.33∘ E/21.74∘ S on 6 September at 11:37 UTC. Note that the dropsonde data acquired during AEROCLO-sA have not been assimilated in the ECMWF operational analysis or in the reanalysis.
The signal backscattered to the LNG system telescope at 1064 nm is range square corrected to produce atmospheric reflectivity. Total attenuated backscatter coefficient (ABC) profiles are derived from atmospheric reflectivity profiles by normalizing the atmospheric reflectivity above the aerosol layers to the molecular backscatter coefficient profiles. Hence the slope of the lidar reflectivity above 7.5 km a.m.s.l. matched that of the molecular backscatter derived from dropsonde measurements of pressure and temperature. In the following, we only use ABC at 1064 nm because the attenuation by the BBA in the lower troposphere, in spite of being important, does not prevent the lidar signal from reaching the surface, unlike at the other wavelengths of operation of LNG (i.e., 355 and 532 nm). The vertical resolution of the ABC profiles is 30 m. Profiles are averaged over 5 s, yielding a horizontal resolution of 1 km for an aircraft flying at 200 m s−1 on average. It is worth noting that ABC as observed with LNG is sensitive to both aerosol concentration and aerosol hygroscopicity. Indeed, relative humidity (RH) in excess of 60 % modifies the size and the complex refractive index of aerosol and hence their optical properties, enhancing the ABC (e.g., Randriamiarisoa et al., 2006). Extinction coefficients at 1064 nm are retrieved from ABC profiles using a standard lidar inversion method that employs a lidar ratio of 40 sr, characteristic of BBA. The retrievals have an estimated uncertainty of 15 %.
2.2.3 Space-borne observations
We make use of AOT (at 550 nm) and fire hotspot locations from the National Aeronautics and Space Administration Moderate Resolution Imaging Spectroradiometer (NASA MODIS; King et al., 1992). We also make use of ABC and aerosol typing products obtained from the space-borne Cloud-Aerosol Transport System (CATS; Yorks et al., 2016) to gather information on the vertical structure of aerosol and cloud layers as well as aerosol composition over Namibia from two overpasses on 4 and 5 September 2017. Details about the space-borne products used in this study can be found in Chazette et al. (2019). The horizontal distribution of the smoke plumes is also described daily with total column amounts of carbon monoxide (CO) derived from radiance spectra measured by the Infrared Atmospheric Sounding Spectrometer (IASI; Clerbaux et al., 2009) on board the MetOp-A and MetOp-B satellites and overpassing the region around 08:30 and 09:00 LT (local time), respectively. This satellite dataset is retrieved using the Fast Optimal Retrievals on Layers for IASI algorithm (Hurtmans et al., 2012) and validated against airborne and space-borne observations (George et al., 2009; De Wachter et al., 2012). Finally, we utilize RGB natural color imagery of cloud cover obtained with the Spinning Enhanced Visible and InfraRed Imager (SEVIRI) instrument on board the geostationary satellite MeteoSat Second Generation.
3.1 The life cycle of the CoL and the TTT
In the low levels, the northern part of Namibia is under the influence of easterly flow, and on 1 September a marked coastal trough is seen along the western coast of Namibia, west of the instrumented sites, associated with an easterly wave (Fig. 2a). In the following days (2–3 September), a weak coastal trough is seen to develop offshore (Fig. 2b and c). Further south, a belt of high-pressure systems is present in the vicinity of the tip of the southern African subcontinent (e.g., Fig. 2a–c). From 4 September, as the baroclinic westerly flow approaches the western coast, a distinct low forms over Angola and northern Namibia within the easterly flow (Fig. 2d–f), which corresponds to the Angola low in the mid troposphere. During the same period, the southeastern Atlantic high-pressure system (St. Helena anticyclone) is strengthening (Fig. 2d). Its eastern fringe approaches the land on 5 September (Fig. 2e) and even intrudes over the subcontinent on 6 September (Fig. 2f).
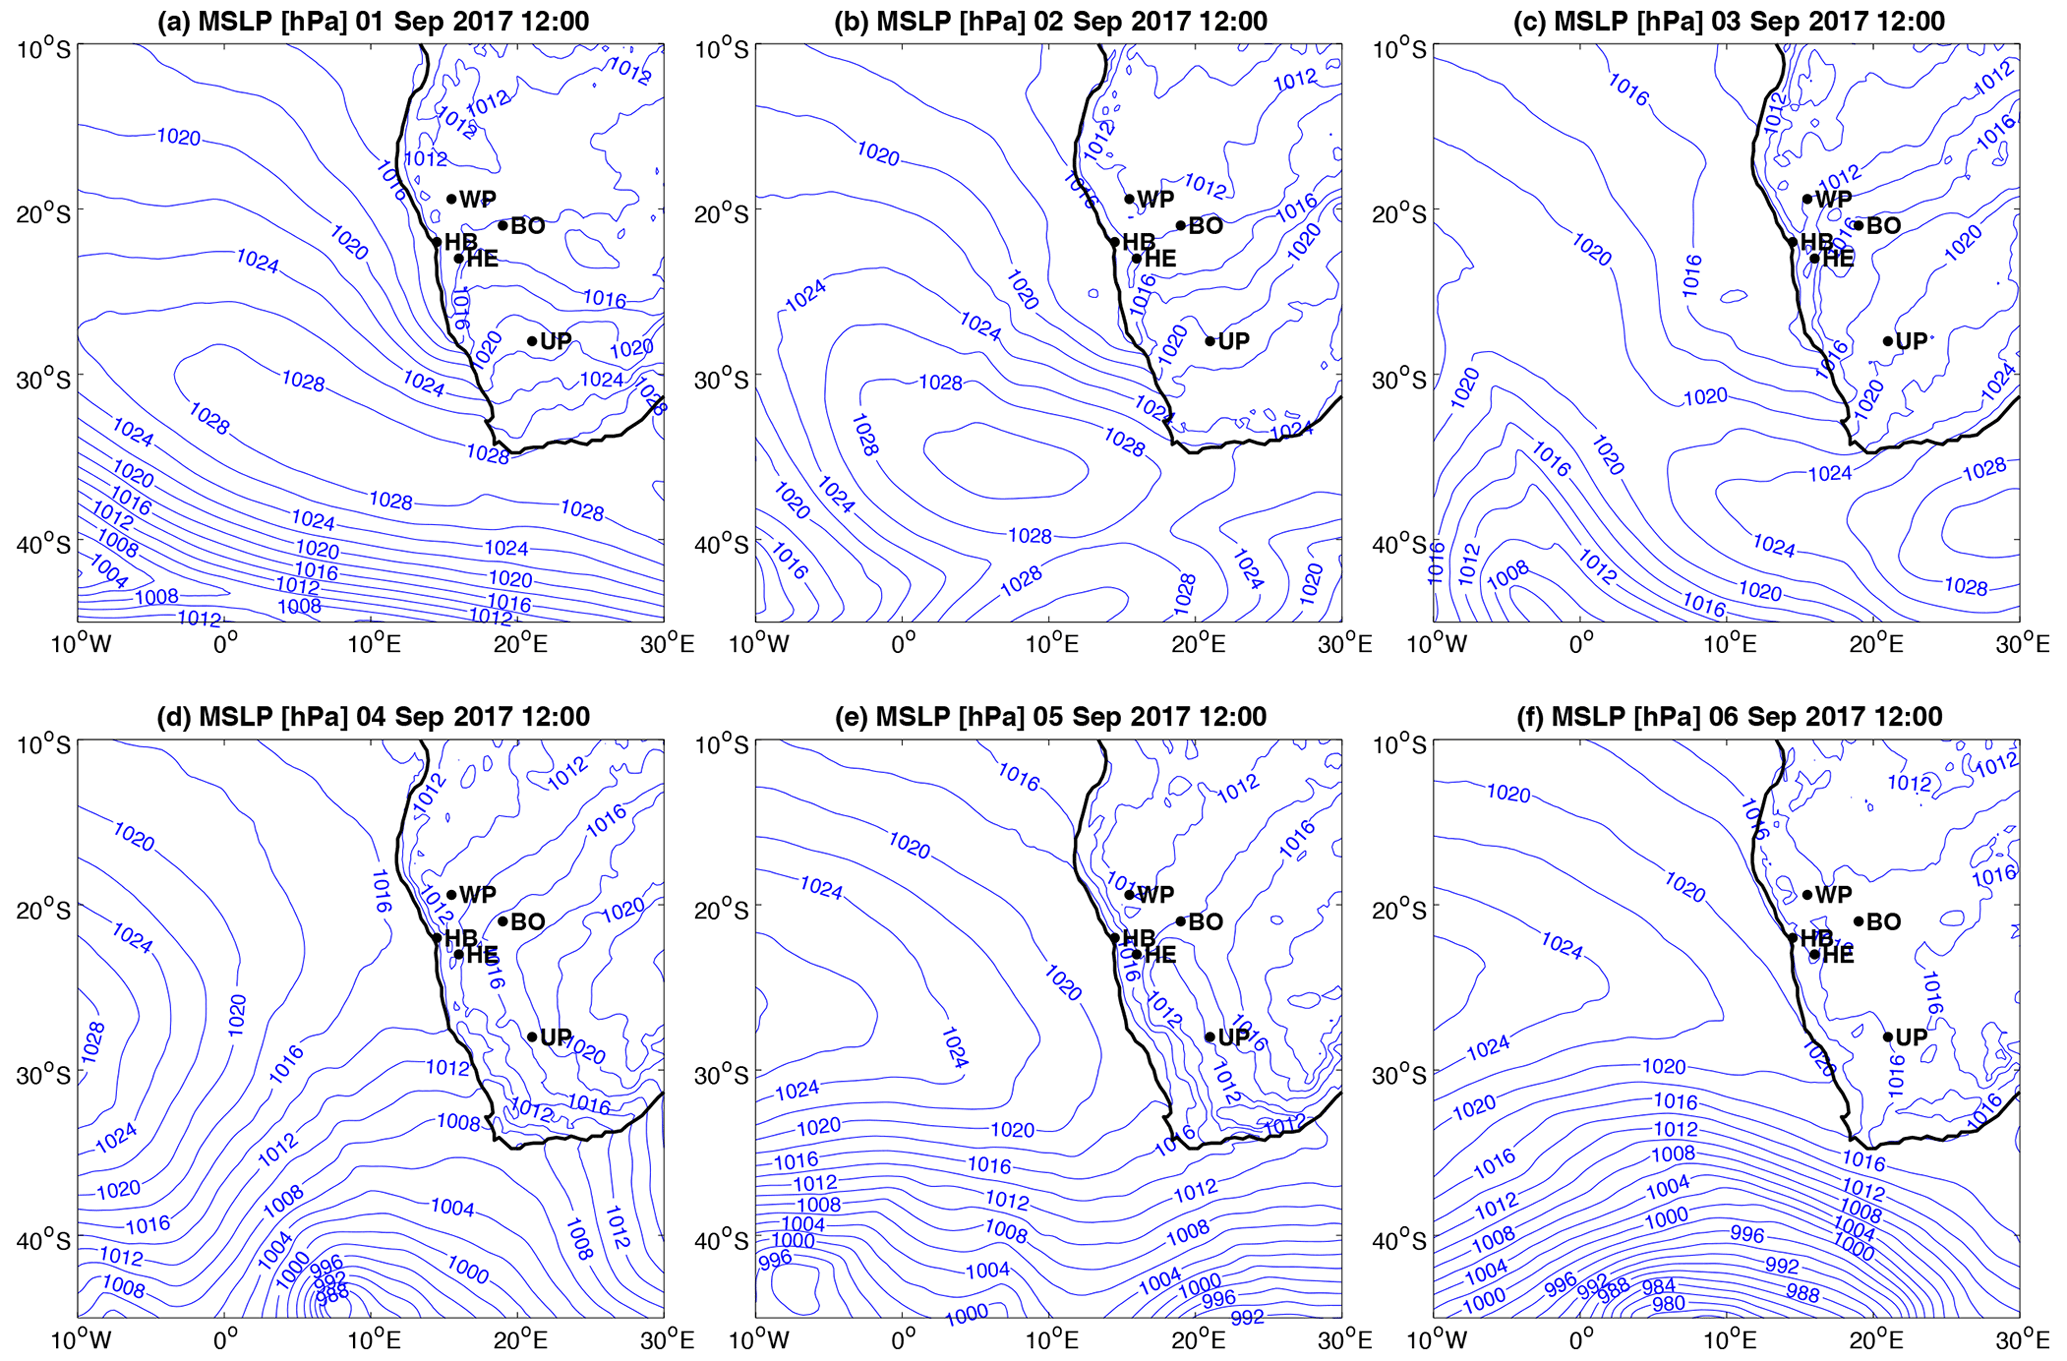
Figure 2Mean sea level pressure (hPa) at 12:00 UTC on (a) 1 September, (b) 2 September, (c) 3 September, (d) 4 September, (e) 5 September and (f) 6 September 2017 from ERA5 reanalysis. The names of the instrumented sites appear in black (from north to south): WP is Windpoort, BO is Bonanza, HB is Henties Bay, HE is HESS (Namibia) and UP is Upington (South Africa).
Figure 3 shows the evolution of the ERA5 geopotential and PV at 300 hPa at 12:00 UTC over the area of interest. On 1 September, the instrumented sites over northern Namibia are under the influence of a westerly flow in the upper levels, which is clearly separated from the main westerlies located poleward of 40∘ S (Fig. 3a). The split in the westerlies is generally associated with the breaking of the upper level jet and is seen upstream of southern Africa at 10∘ W (Favre et al., 2012). Strong negative PV is associated with the cyclonic circulation in the area of separation between the main westerlies and the northern westerlies branch, just west of the Namibian coastline. On 2 September, the region of splitting reaches the coastline, and some of the instrumented sites in the southern part of the domain and along the coast are under the influence of a southerly flow, while the sites to the north are under a westerly flow (Fig. 3b). The maximum of negative PV is located approximately above the AERONET HESS site. The main westerly flow exhibits a pronounced poleward dip just west of the tip of South Africa which is further enhanced on the following day, when the closed circulation has formed and is centered over the region of the AERONET Bonanza site (Fig. 3c). This closed circulation now contains the strongest negative PV feature. In the ERA5 reanalysis, ascending motion is present to the north and east of the CoL center, while descending motion is highlighted to the south and west of the CoL center (Fig. S1a in the Supplement). The CoL is positioned in the same area the next day (4 September, Fig. 3d), with the instrumented sites being essentially beneath the negative PV associated with the CoL. On this day also, ascending motion is present to the north and east of the CoL center, while descending motion is highlighted to the south and west of the CoL center (Fig. S1b). The CoL starts deforming shortly after, becomes elongated in the north–south direction and can be seen as an elongated filament of negative PV to the east of most of the instrumented sites located in Namibia. It then moves poleward and merges back with the main westerly flow between 09:00 and 12:00 UTC on 5 September (not shown). The area of interest lies below a hump in the northwesterly flow on the eastern side of the poleward dip of the westerlies (Fig. 3e). Finally, on 6 September, the area of interest is under a rather weak east-northeasterly flow, north of the main westerlies located south of 40∘ S (Fig. 3f). The filament of negative PV marking the remains of the CoL has now moved further southeast over South Africa and over the Indian Ocean.
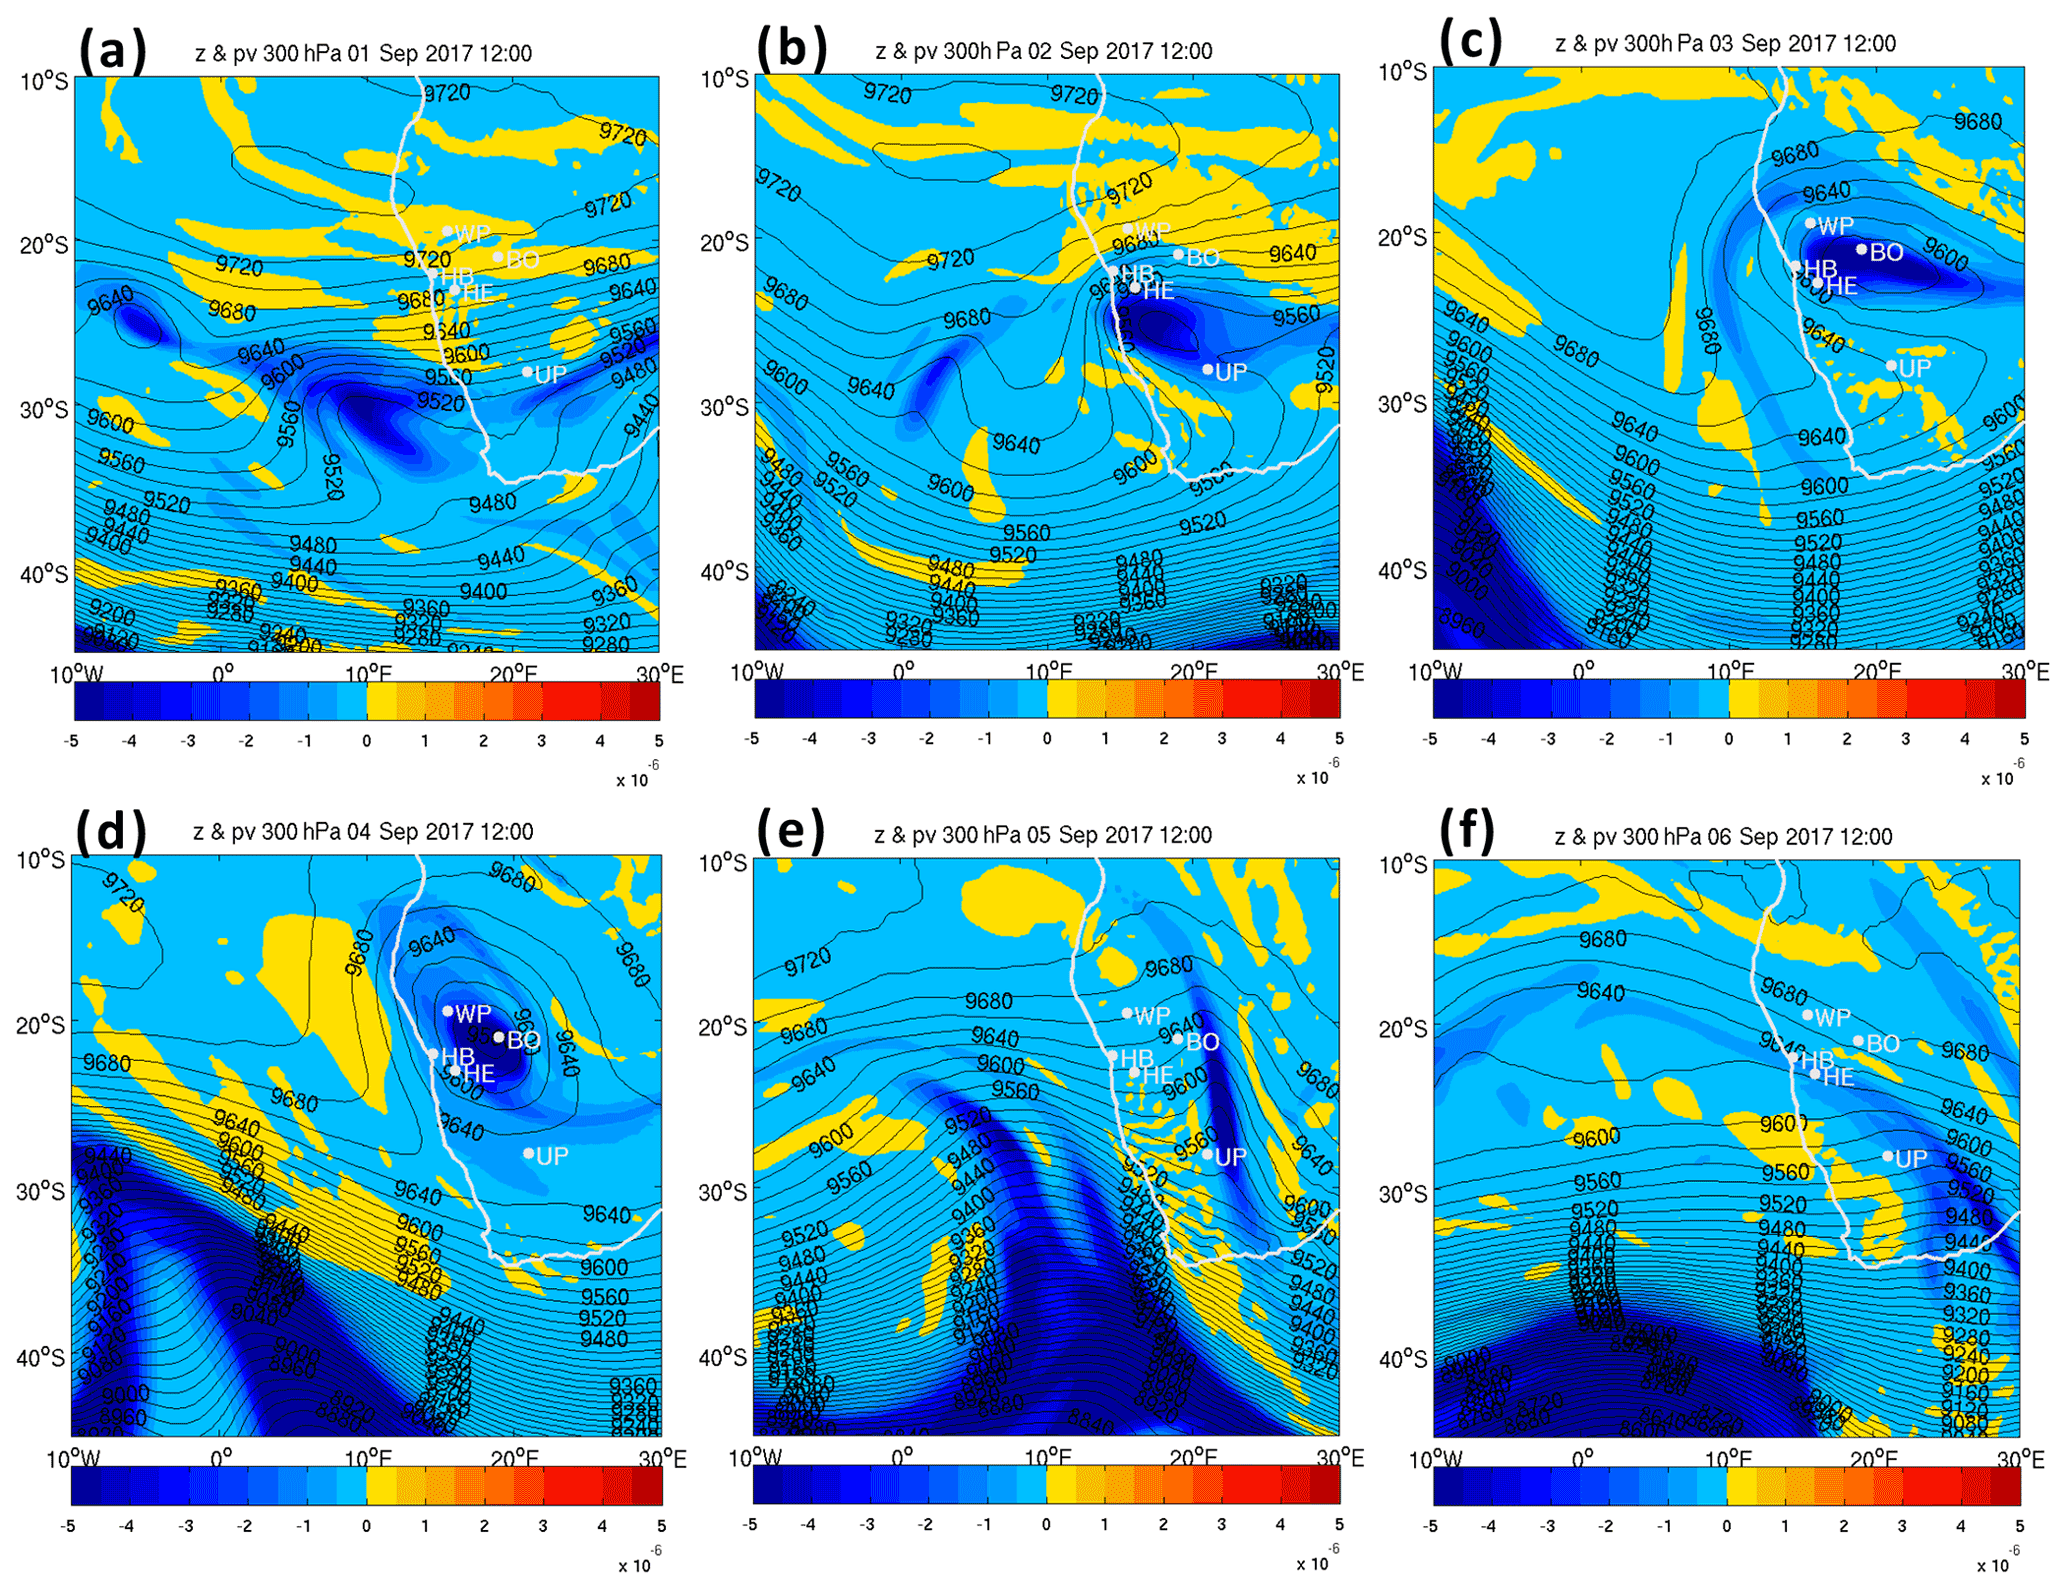
Figure 3Geopotential (m, contours) and potential vorticity (K m2 kg−1 s−1, color) at 300 hPa at 12:00 UTC on (a) 1 September, (b) 2 September, (c) 3 September, (d) 4 September, (e) 5 September and (f) 6 September 2017 from ERA5 reanalysis. The names of the instrumented sites appear in white (from north to south): WP is Windpoort, BO is Bonanza, HB is Henties Bay, HE is HESS (Namibia) and UP is Upington (South Africa).
On 3 September, the CAMS-derived circulation at 700 hPa shows, equatorward of the strong westerlies, the presence of a high-pressure system over the southern tip of the continent as well as an isolated low-pressure feature (connected with the CoL) located offshore of Namibia, over the Atlantic Ocean (Fig. 4a). The cyclonic and anticyclonic circulations associated with the CoL and the high pressure, respectively, create conditions that are favorable to the advection of BBA poleward, between them as shown by Chazette et al. (2019). It is worth noting that, at this level, both the low- and high-pressure features are characterized by low BBA-related AOT. As the wave in the westerly flow at 70 hPa approaches the western coast of southern Africa on 4 September, the high pressure moves eastward and is partly over the Indian Ocean (Fig. 4b). At the same time, the low pressure becomes elongated and is oriented almost parallel to the coastline (a shape that resembles that observed at 300 hPa on 4 September; see Fig. 3d). The poleward advection of BBA at 700 hPa becomes more pronounced and results in the formation of the river of smoke. On 5 September (Fig. 4c), the equatorward dip of the westerly flow is now positioned over southern Africa and the high pressure has moved over the Indian Ocean, generating a TTT aligned with the Namibian coast. The resulting circulation promotes the poleward advection of a more massive river of smoke extending over the eastern coast of southern Africa and over the Indian Ocean and extends poleward almost to 50∘ S. The signature of the CoL at 700 hPa is no longer identifiable. BBAs over the Atlantic Ocean related to biomass burning events over South America are also observed by Chazette et al. (2019). Finally, on 6 September, the St. Helena anticyclone pushes the poleward dip of the westerlies and the TTT further east, while the high-pressure system over the Indian Ocean also weakens (Fig. 4d). The river of smoke is now well established over southern Africa and is located further east, particularly over South Africa.
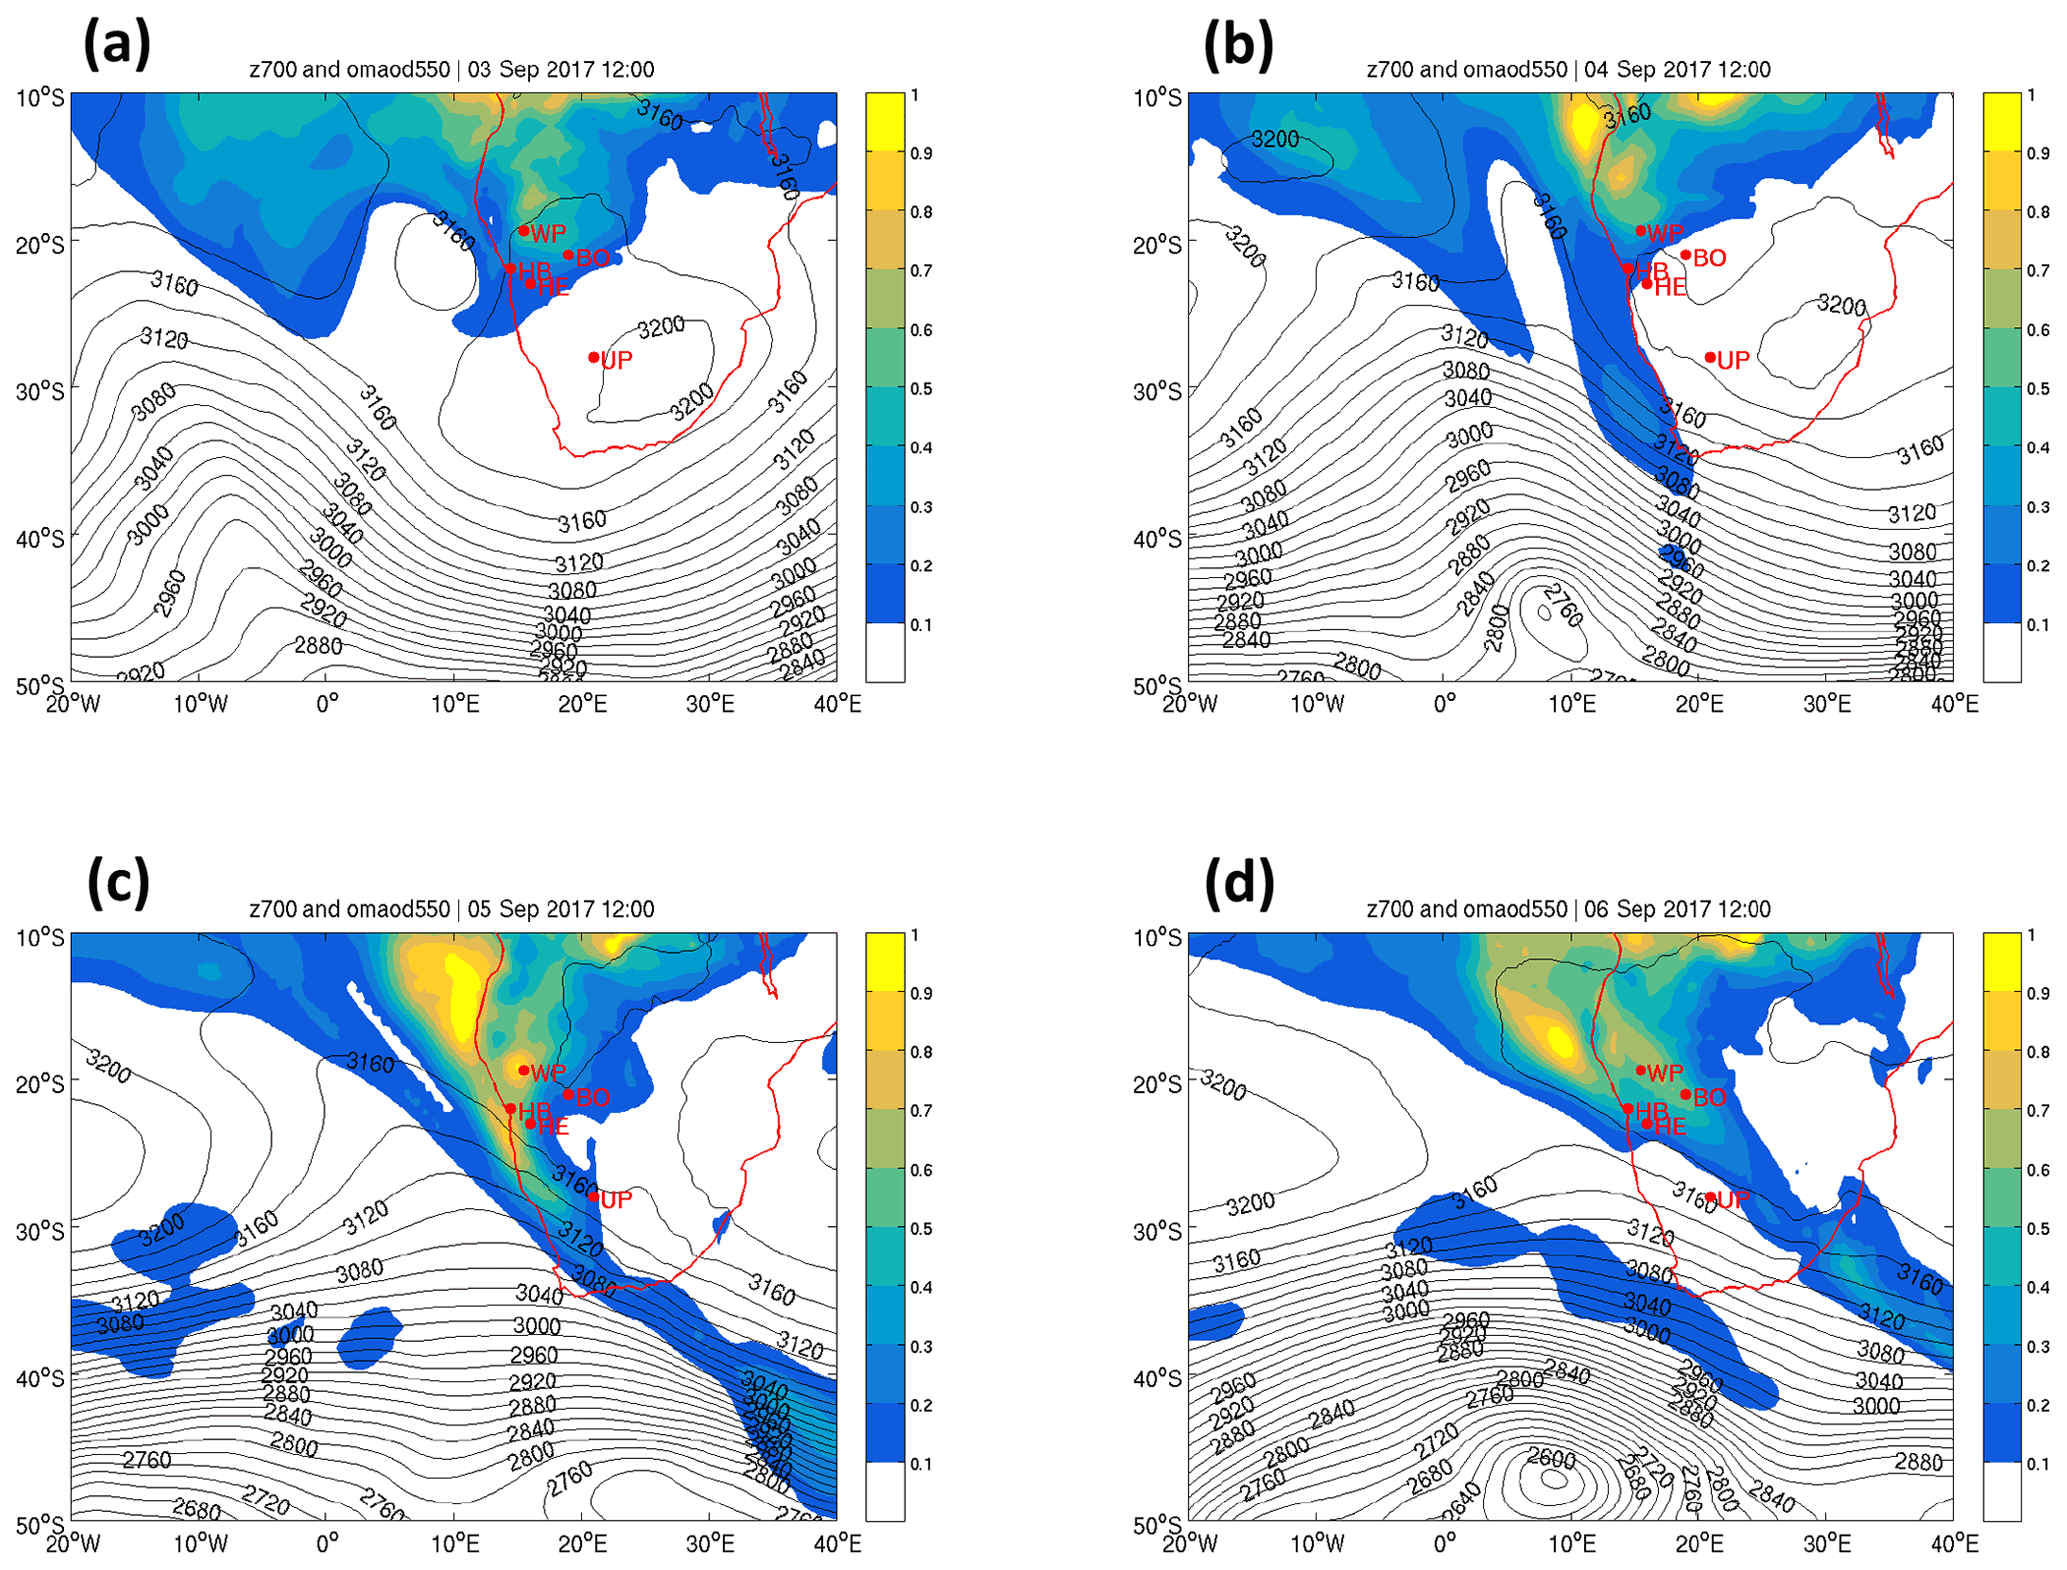
Figure 4Geopotential at 700 hPa (contours) and organic matter AOT (color) at 12:00 UTC on (a) 3 September, (b) 4 September, (c) 5 September and (d) 6 September 2017 from CAMS reanalysis. The names of the instrumented sites appear in red (from north to south): WP is Windpoort, BO is Bonanza, HB is Henties Bay, HE is HESS (Namibia) and UP is Upington (South Africa).
3.2 Dynamical controls
The variability of the BBA distribution in the period 1–6 September is compared with the atmospheric circulation variability by means of a PCA. The first EOF of the organic matter AOT (Fig. 5a), explaining 55 % of the variability, shows a negative anomaly in the BBA transport until 4 September and a river of smoke developing over Namibia on 5 and 6 September (red line in Fig. 5e). BBAs are mainly transported at 700 hPa, and the evolution of the river of smoke is controlled by the circulation at this level. The first EOF of the geopotential at 700 hPa (Fig. 5c), explaining 74 % of the variability at this level, shows on 1–2 September a positive gradient along the northeast–southwest direction, which drives a southeasterly flow inhibiting the northerly BBA transport. The gradient reverses on 4 September (green line in Fig. 5e), favoring the southward penetration of the river of smoke. The control on the BBA exerted by the circulation at 700 hPa is confirmed by the high correlation (0.78, Table 1) of PCA time series in Fig. 5e. The first EOF of the geopotential at 300 hPa (Fig. 5b), explaining 56 % of the variability, shows the transit of the CoL along the meridional direction, migrating from southern Namibia on 1 September to central Namibia on 3–4 September and retreating to the south on 5–6 September (blue line in Fig. 5e). The evolution of the AOT and geopotential PCAs suggests a possible control of the river of smoke by the CoL from 4 September onwards (PCA correlation is 0.50, Table 1), when a high- to low-pressure dipole (Fig. 5b) favors the channeling of the BBA along the Namibian coast. The first EOF of the MSLP (Fig. 5d), explaining 43 % of the variability, shows a coastal trough on 1–2 September evolving into a coastal ridge on 3–4 September (black line in Fig. 5e). The associated northwesterly flow could have a role in favoring the installation of the river of smoke. However, the comparison of the PCAs (Table 1) shows no stable relationship between the conditions at the surface and the BBA transport. In conclusion, the CoL and the circulation at 300 hPa have a dominating influence on the circulation around 700 hPa (∼4 km a.m.s.l.) and consequently on the tropospheric composition over Namibia, as the circulation at this level controls the distribution of BBA away from the main sources.
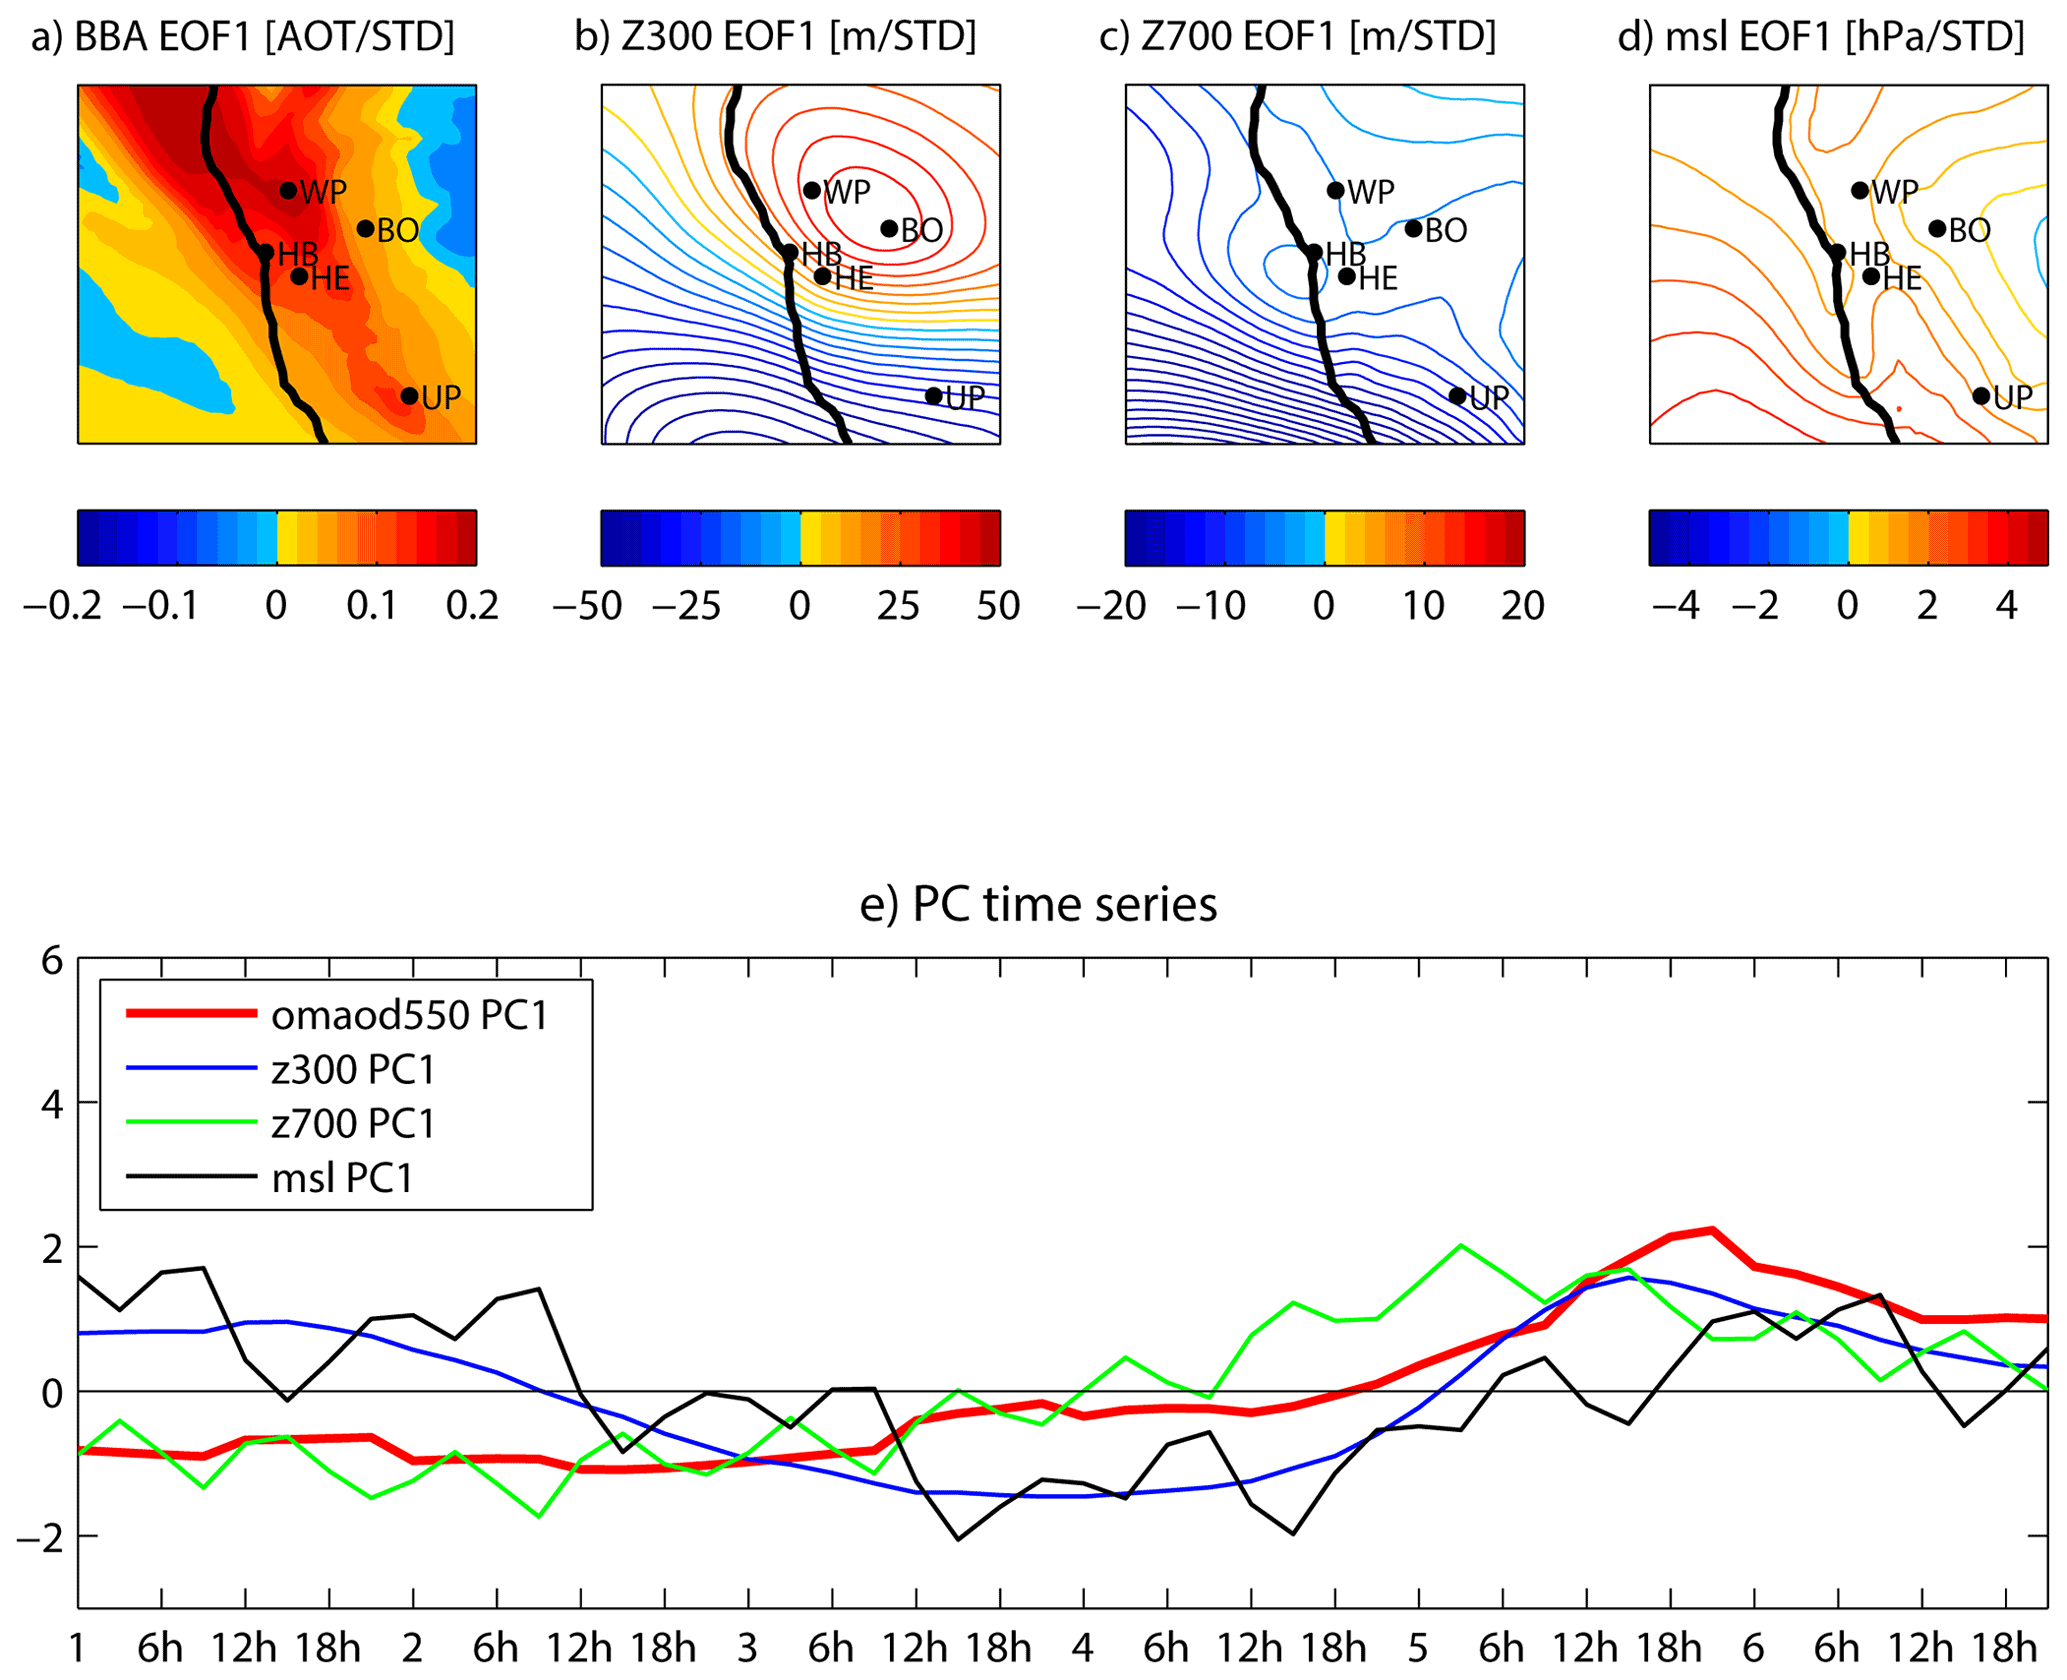
Figure 5Principal component analysis (PCA) of CAMS BBA and atmospheric circulation above Namibia from 1 to 6 September 2017. In panels (a)–(d) the anomaly patterns associated with the first mode of variability of (a) organic matter AOT at 550 nm, geopotential height at (b) 300 hPa and (c) 700 hPa and (d) MSLP are obtained by regressing raw data onto the PCA time series displayed in panel (e). Anomaly patterns display anomalies per standard deviation (SD). The 12 h oscillation seen in the time series of the MSLP and the geopotential at 700 hPa is a tidal effect, typical of the Earth's atmosphere (Chapman and Lindzen, 1970).
Table 1Correlation coefficients computed between the first and second principal components of MSLP, geopotential height at 300 and 700 hPa and the first principal component of the organic matter AOT. P values are indicated in parentheses.

4.1 The river of smoke in satellite and ground-based observations
The position of the river of smoke in the CAMS reanalysis at 12:00 UTC in Fig. 4b–d matches the observations retrieved from MODIS (Fig. 6) and IASI (Fig. S2), respectively, in terms of AOT and CO total amounts, on 4, 5 and 6 September. In particular, we note the southward progression of the plume between 4 and 5 September (Figs. 6a, c and S2b, c) and then its eastward displacement reaching the continent on 6 September (Figs. 6c, e and S2c, d). For the AOT measurements, the signature of the river of smoke is more distinct on 6 September over the continent (Fig. 6e) thanks to the mostly cloud-free conditions over southern Africa on that day. On the other hand, the river of smoke on 5 September is more difficult to detect with the MODIS observations (Fig. 6c) due to its co-location with a band of mid-level clouds positioned along the Namibian coastline. CO retrievals depict the river of smoke on both 5 and 6 September (Fig. S2c and d), as these measurements can also be retrieved above low- and mid-level relatively thin clouds. On 3–4 September, enhanced CO amounts (adjacent to clouds, shown as blanks in the figure) already show an elongated plume over the Atlantic extending from northwest to southeast over the latitude band 10–40∘ S, which probably corresponds to the river of smoke transported eastwards over the continent and enhanced in concentration on the 2 following days. This plume structure is simulated by CAMS reanalysis for BBA but only extends southwards to 30∘ S. After 5 September, the CO distributions also depict the plume originating from South America, located over the Atlantic (at 25–35∘ S, Fig. S2c and d). This plume presents similar CO amounts to that of the river of smoke (3–3.5×10¹⁸ molec cm−2), and it is transported eastwards until it reaches the western South African coast on 6 September (Chazette et al., 2019). This is qualitatively consistent with the BBA plume shown by CAMS reanalysis, but these last ones show a relatively less dense plume as compared with that of the river of smoke.
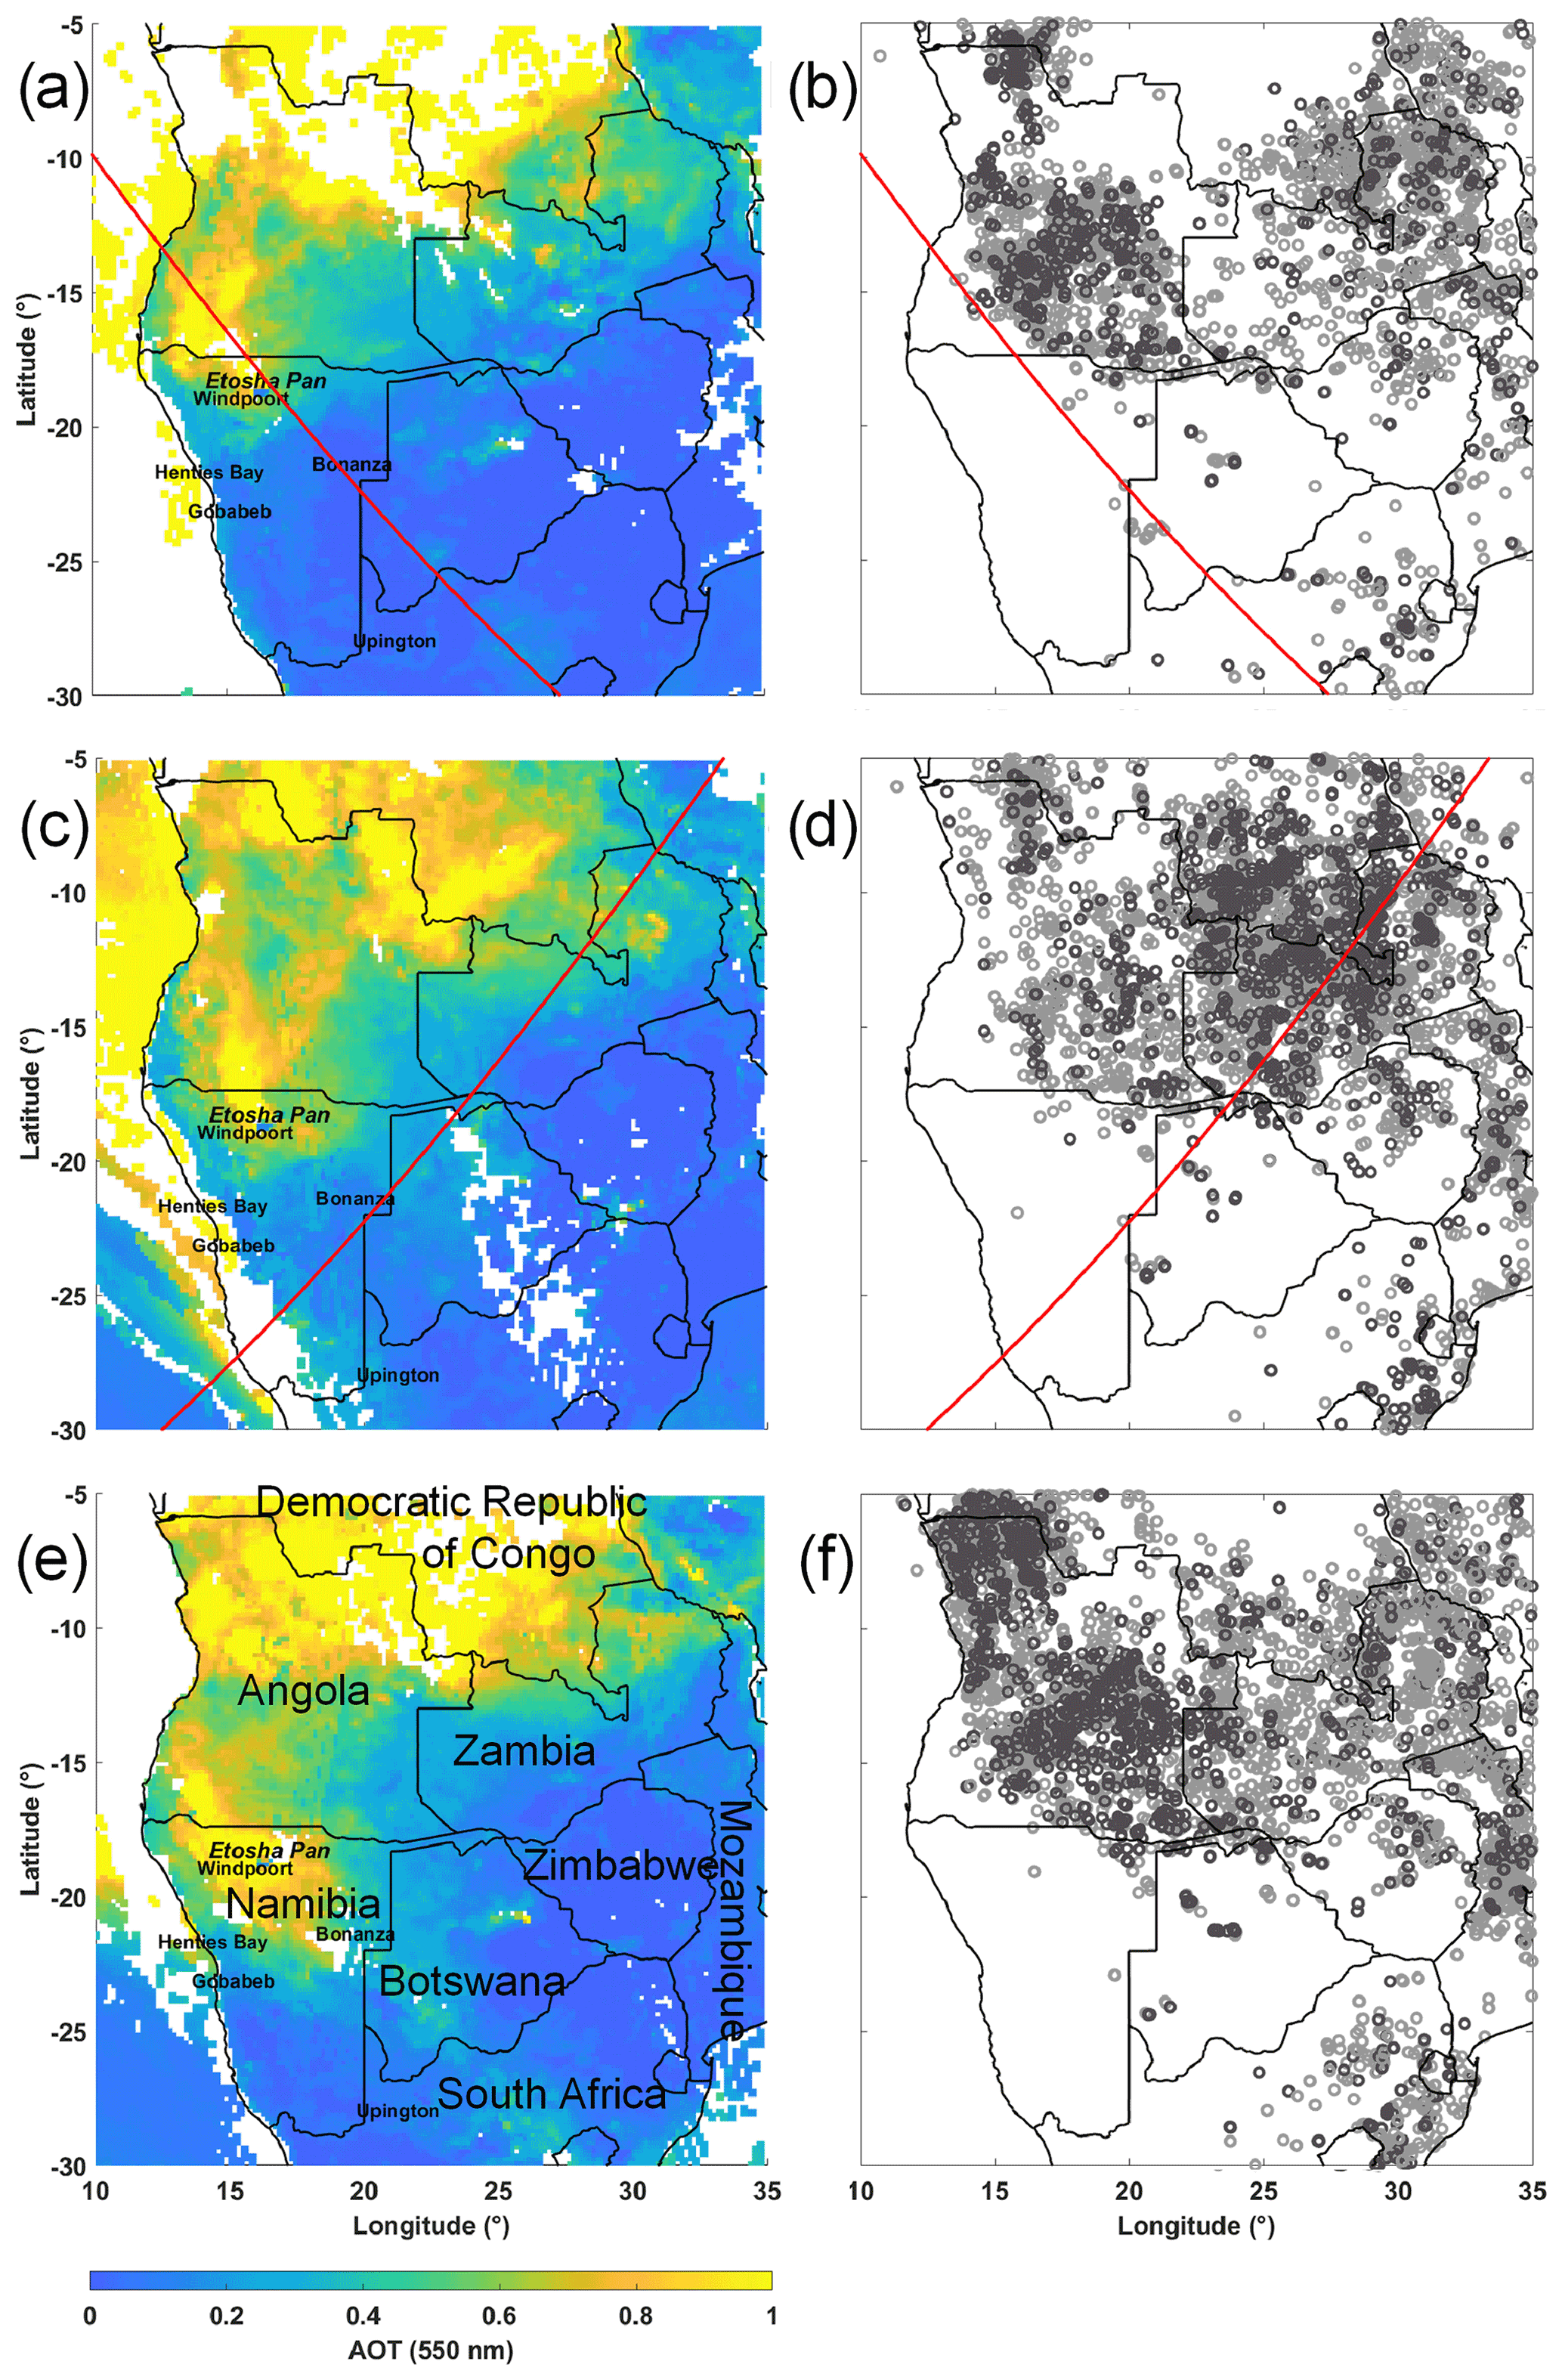
Figure 6AOT (a, c, e) on and fire hotspot location (b, d, f) derived from MODIS on 4 (a, b), 5 (c, d) and 6 (e, f) September 2017. The CATS tracks overpassing Namibia on 4 and 5 September are overlain in panels (a, b) and (c, d) as a solid red line. The confidence in the detection of the location of the fire hotspots is indicated by the color of the circles (dark circles indicating high confidence and grey circles nominal confidence, as provided by the MODIS team).

Figure 7(a) Total attenuated backscatter coefficient from the space-borne lidar CATS between 22:05 and 22:21 UTC on 5 September 2017. (b) Same as (a) but for CATS-derived aerosol. The corresponding CATS track is shown in Fig. 6b.
On 5 September, the space-borne lidar CATS overpassed southern Namibia at around 22:00 UTC across the mid-level cloud band (Fig. 7a), just to the south of the Bonanza AERONET station (Fig. 6c). CATS provides further observational evidence that BBA dominates the aerosol composition of the low troposphere over continental southern Africa during the period of interest (Fig. 7b). Smoke is seen to be well mixed over the depth of the boundary layer (∼3 km) over northern Botswana and Zambia, where fires are observed to be very active and widespread (Fig. 6d). Interestingly, the depth of the smoke layer is seen to be much deeper over continental Namibia, its top reaching almost 7.5 km a.m.s.l. in the vicinity of the mid-level cloud band. The smoke is observed to reach the coastline above 3 km a.m.s.l., consistent with MODIS observations. At lower altitude, CATS evidences the presence of pollution at the coast and maritime aerosols further west of the continent, over the ocean (Fig. 7b).
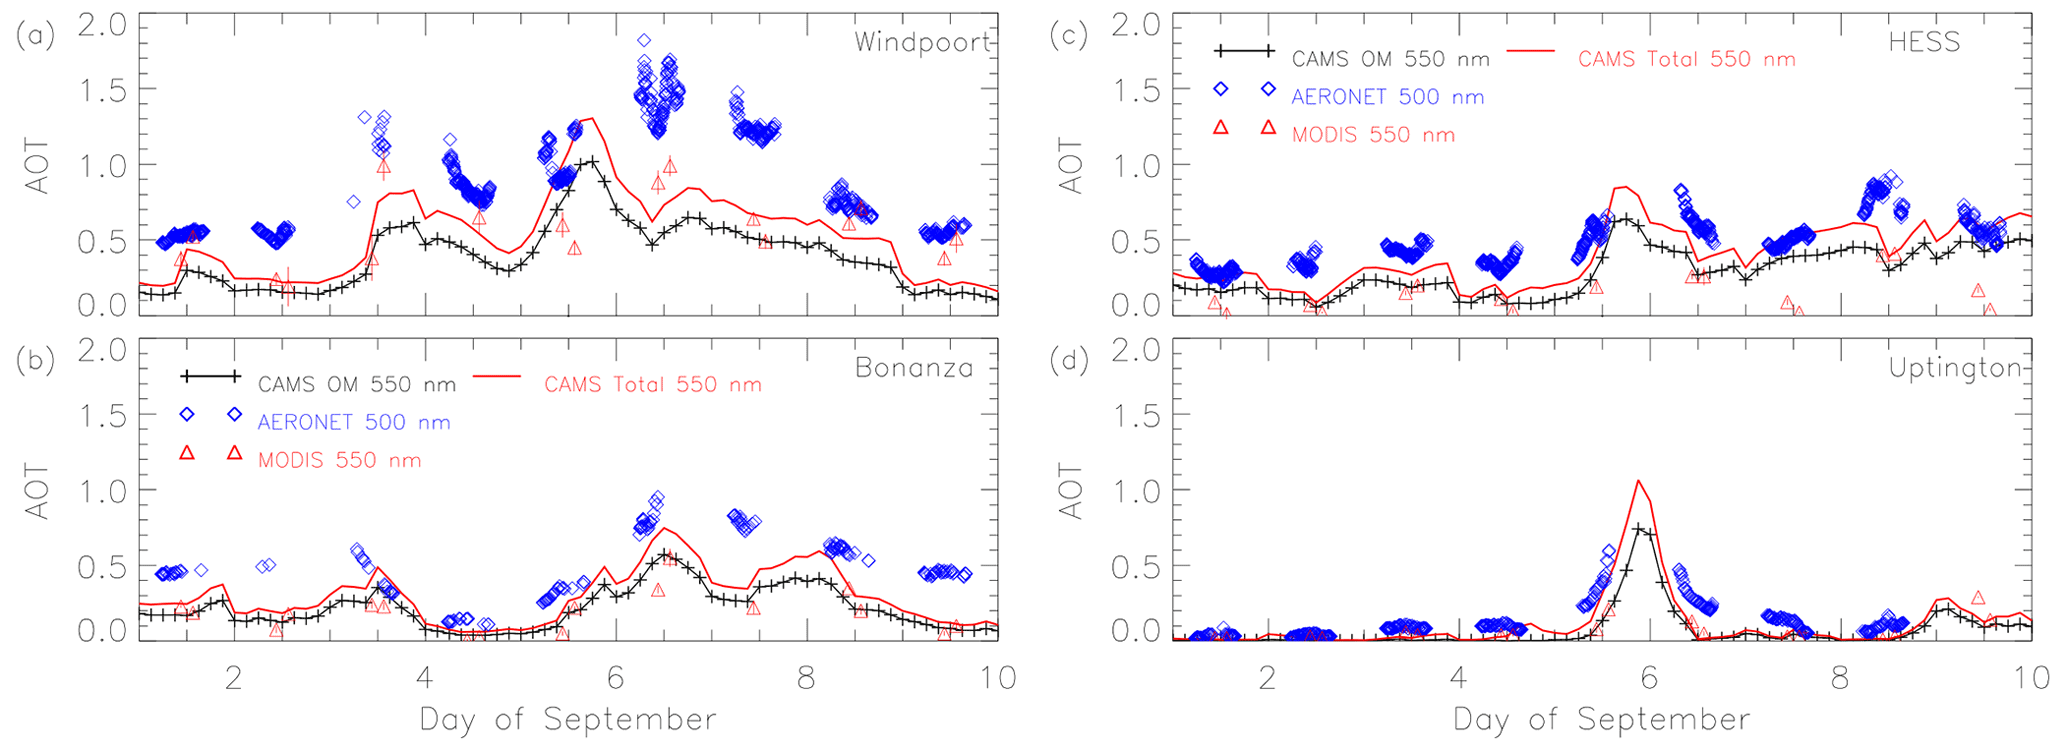
Figure 8Time evolution of AERONET Sun-photometer-derived total AOT at 500 nm (blue diamonds), MODIS AOT at 550 nm from Terra and Aqua (red triangles) and CAMS-derived total AOT (red solid line) and organic matter AOT at 550 nm (solid black line with black crosses) over (a) Windpoort, (b) Bonanza, (c) the HESS site and (d) Upington from 1 to 10 September 2017. A robust linear relationship is observed between the natural logarithm of the AOT at 500 and 550 nm (see Denjean et al., 2020, and Gaetani et al., 2021); therefore, CAMS and MODIS products at 550 nm can be used as reliable proxies for the AOT at 500 nm at the AERONET stations.
The river of smoke is anchored over Angola and northern Namibia, the latter location being where most airborne and ground-based observations were acquired in the course of the AEROCLO-sA campaign. While the CATS observations suggest that further south the BBA layer is advected eastward, it appears from the CAMS reanalysis and MODIS observations that the region where BBA feeds into the river of smoke does not move significantly. This is confirmed by the fact that large AOTs are observed over northern Namibia (AERONET Sun-photometer station in Windpoort, Fig. 8a) between 3 and 7 September, as opposed to the other AERONET stations further south (Bonanza, HESS, Upington, Fig. 8b–d) where more sporadic AOT peaks are observed, suggesting a propagating BBA feature over this area. Large BBA-related AOT values are seen with CAMS in the vicinity of the Etosha pan region (Fig. 4c and d) that correspond to the maximum in AOT seen with AERONET over the station of Windpoort (Fig. 8a). The aerosol load is seen to increase over Windpoort from 1 to 6 September (when it reaches 1.75 at 500 nm) and to decrease thereafter. The AOT values in Windpoort are systematically higher than AOTs derived from other AERONET stations further south. The timing of the AOT peaks obtained with CAMS is consistent with its Sun-photometer-derived counterpart. The AOT peak in the CAMS reanalysis suggests that the smoke river overpassed the HESS site at around 12:00 UTC on 5 September, the Upington site at 00:00 UTC on 6 September and the Bonanza site at 18:00 UTC on the same day, suggesting an eastward drift of the smoke river. The data from the AERONET sites are consistent with the MODIS data in both magnitude and timing of the increased AOT values (Fig. 6c and e). The river of smoke is clearly observed as an identifiable isolated feature sweeping through Upington, i.e., away from the fire emissions, as opposed to what is observed further north in Windpoort, which is closer to Angola and Zambia. The good agreement between the AOT from MODIS and CAMS at Windpoort and Bonanza (Fig. 8a and b) is expected as MODIS AOTs are assimilated in the CAMS retrieval algorithm. Good agreement is also found between CAMS and AERONET AOTs at Upington (Fig. 8d) and to a lesser extent at HESS and Bonanza (Fig. 8b and c, especially before 6 September). Windpoort (Fig. 8a) is an exception, with AERONET AOTs differing significantly at times from the MODIS and CAMS retrievals. The higher Sun-photometer AOTs are most likely to be BBA dominated, a fact that is highlighted by the average Angström coefficient values derived from the AERONET observations in Windpoort of 1.7 (between 440 and 870 nm), which is consistent with previous findings evidencing that the absorption Angström exponent of biomass smoke is typically between 1.5 and 2 (e.g., Bergstrom et al., 2007).
4.2 Airborne observations and model simulation
In the latter stage of the CoL intrusion over Namibia (5 and 6 September), a large-scale mid-level cloud band is visible along the southern Africa western coastline at 09:00 UTC on 5 September, as already highlighted using MODIS (Fig. 6c) and confirmed using SEVIRI (Fig. S3a), i.e., around the time the Falcon 20 aircraft flew on that day. The presence of this cloud band is related to the presence of the TTT (Ratna et al., 2013) and is triggered by the arrival of an upper-level trough over southern Africa associated with the band of divergence east of its leading edge. Nearly cloud-free conditions are observed over northern continental Namibia at this time. The mid-level cloud band moved inland rapidly, together with the river of smoke, and covered a large part of Namibia in the afternoon as shown with SEVIRI at 16:00 UTC (Fig. S3b). It sweeps through Namibia overnight and is observed over eastern Namibia at 06:00 UTC on 6 September (Fig. S3c) before starting to disintegrate. Almost cloud-free conditions are seen after 12:00 UTC (the cloud band is no longer visible in Fig. S3d) at the time of the Falcon 20 aircraft flight on that day. On 5 September, airborne observations acquired in the morning are representative of conditions ahead of the cloud band sweeping across Namibia, while the airborne data acquired on the afternoon of 6 September were acquired over Namibia after its passage.
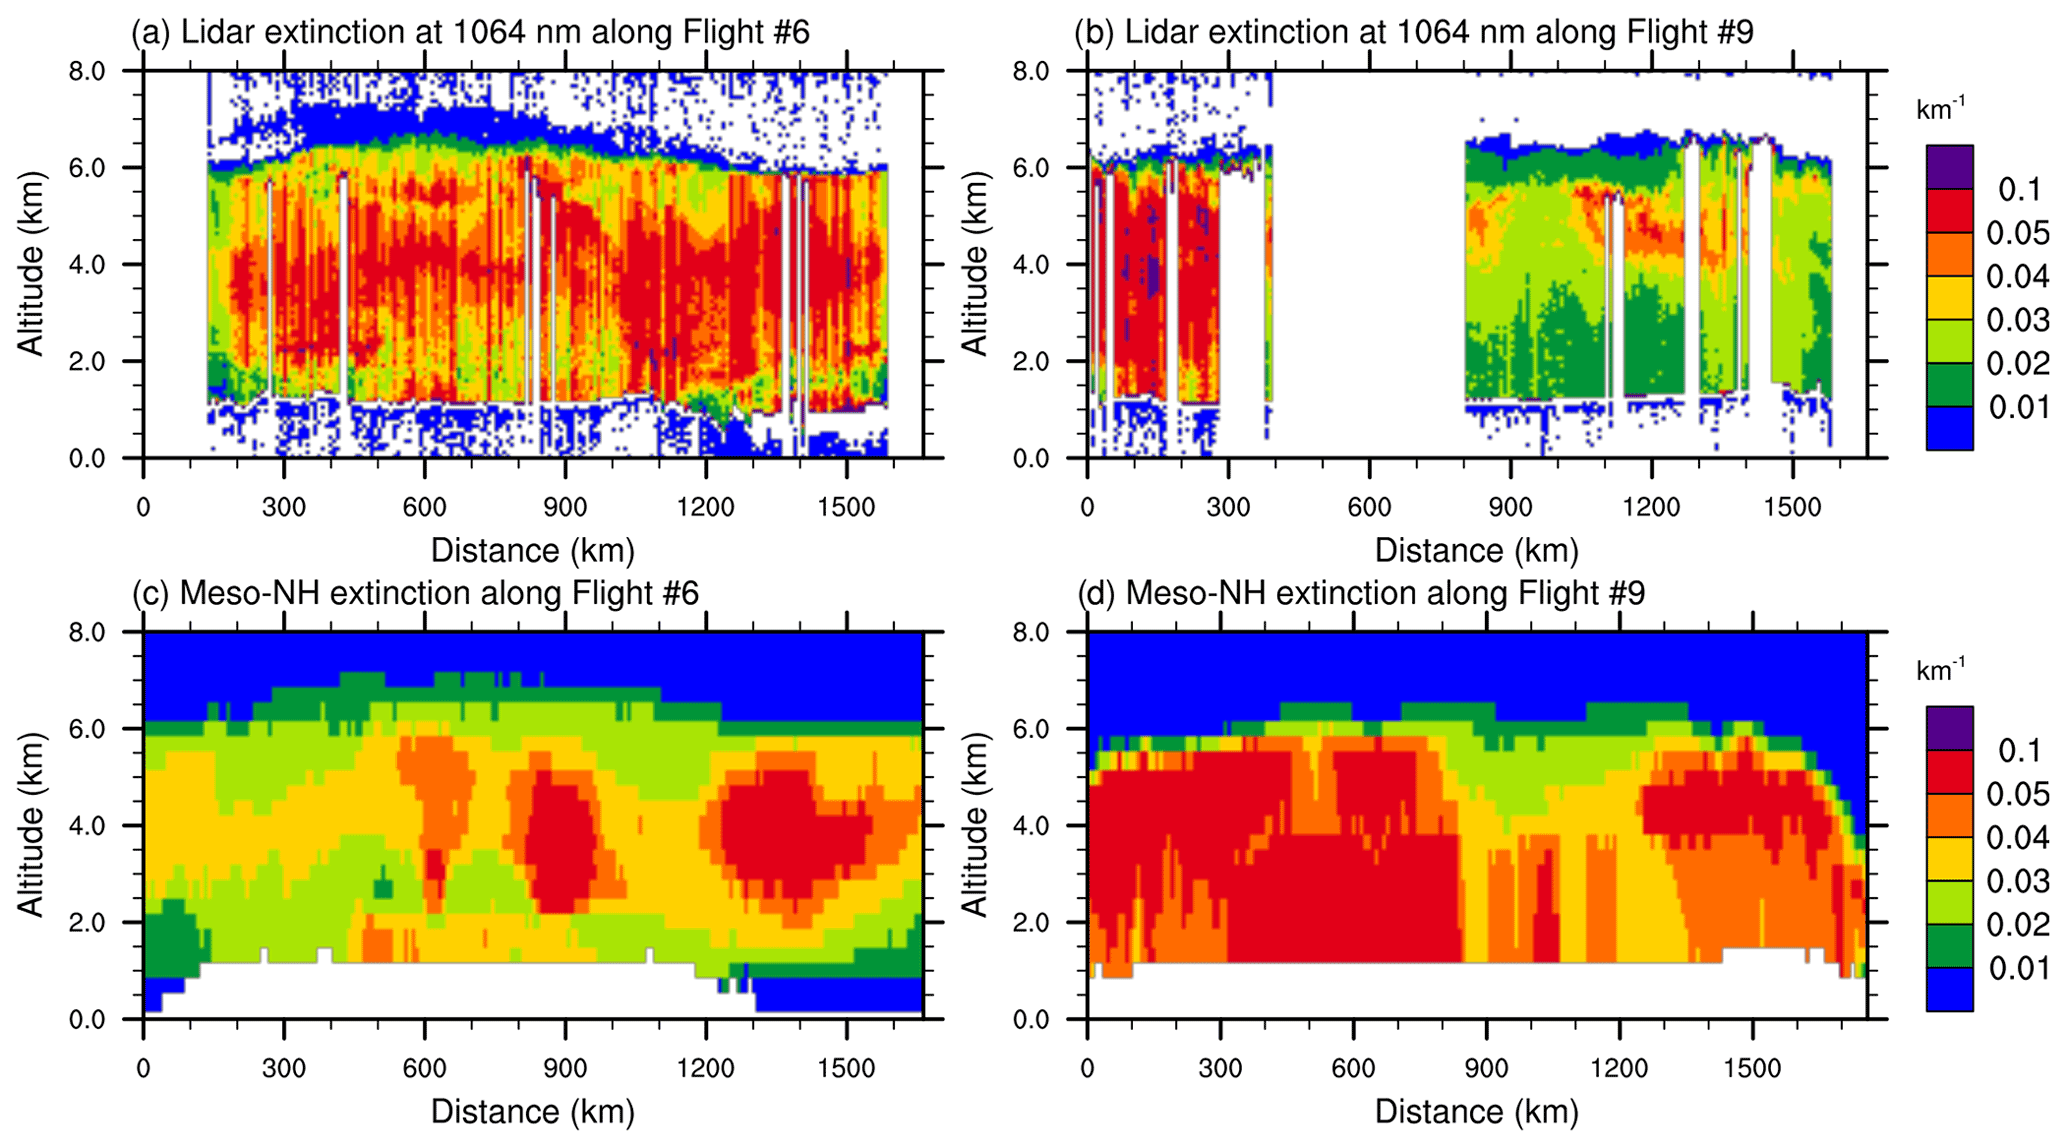
Figure 9(a) Distance–height cross section of the extinction coefficient derived at 1064 nm from LNG along the flight track of the Falcon 20 on 5 September from 07:36 to 10:14 UTC (see Fig. 1b). (b) Same as (a) but on 6 September from 10:55 to 14:01 UTC. (c) BB carbon tracer concentration as simulated with Meso-NH at 09:00 UTC 5 September 2017 along the Falcon 20 flight track. (d) Same as (c) but at 12:00 UTC on 6 September.
The observations made with the airborne lidar LNG over Windpoort and the Etosha region on 5 and 6 September (Fig. 9a and b, respectively) clearly evidence the complexity of the layering within the BBA-laden air masses. On 5 September, the BBA layer is observed between ∼2 and 6 km a.m.s.l. and is separated from the surface (reaching an elevation of 1.5 km a.m.s.l. over the plateau) by a shallow developing convective boundary layer in which dust emissions from the Etosha pan are observed (Formenti et al., 2019). On the other hand, the BBA layer is separated from the surface away from the plateau and over the ocean (beginning and end of flight). On 6 September, the BBA layer is clearly observed to be mixed all the way down to the surface over the plateau and to reach ∼6 km a.m.s.l., thereby extending over a depth of nearly 4.5 km. The vertical structure of the Meso-NH-derived BB carbon tracer along the flight tracks on both days is given in Fig. 9c and d. On 5 September, the greater vertical extent of the BBA layer over the continental plateau (with respect to the surrounding lower lands and ocean) at the beginning and end of the flight is well captured in the model (Fig. 9c). Likewise, the decrease in the BBA layer over the sloping terrain towards the ocean at the end of the flight on 6 September is also well represented (Fig. 9d). On 6 September, large concentrations of BB carbon tracers are mixed all the way to the surface, as in the observations, in the northern part of the flight (i.e., overpassing the Etosha pan). In contrast, the larger BB carbon tracer concentrations do not reach the surface in the morning, which was also observed with the airborne lidar.
4.3 Analysis of BBA transport on 5 September
Meso-NH-derived backward trajectories ending at 09:00 UTC 5 September 2017 along the F06 flight track and at altitudes between 1 and 5 km a.m.s.l. (Fig. 10a, c and d) show that over the previous 3 d the air masses documented with the airborne lidar LNG during the flight had traveled over regions with detectable active fires (Fig. 5) and where BB carbon emissions are high in the GFED4s inventory (Fig. S4). The trajectories are transport emissions from Angola, Zambia, Zimbabwe and Mozambique, where fires are identified with MODIS (Fig. 6). Airborne observations and simulations show unambiguously that the atmospheric composition below 5 km a.m.s.l. along the aircraft flight track is dominated by BBA from Angola and Mozambique (see Fig. 6) coming from altitudes below 5 km a.m.s.l. and swirling anticyclonically around a high pressure in the lower troposphere (Fig. 10). It is worth noting that the air masses ending at 4–5 km a.m.s.l. along the aircraft track all experience upgliding in the previous 24 h (Fig. S5a), while the BB carbon tracer concentration is gradually increasing over the 3 d for all air masses below 5 km a.m.s.l. (Fig. S5b). At higher altitudes (i.e., 6–7 km a.m.s.l.), backward trajectories ending north of the Etosha pan also start from Angola and Zambia below 5 km a.m.s.l. (Fig. 10b), while those ending south of the Etosha pan originate from higher altitudes (between 8 and 11 km a.m.s.l.) and from the southeast, having traveled over Botswana, Mozambique and South Africa, and swirl cyclonically around the location of the CoL while descending along its poleward fringes (recall that the CoL is located between Henties Bay, Bonanza and Windpoort on 3–4 September; Fig. 3c and d). The downgliding experienced by the air masses occurs in the previous 2 d (Fig. S5a). The ERA5 data show the presence of ascending motion to the north and east of the CoL center and descending motion to the south and west of the CoL center (see Sect. 3).
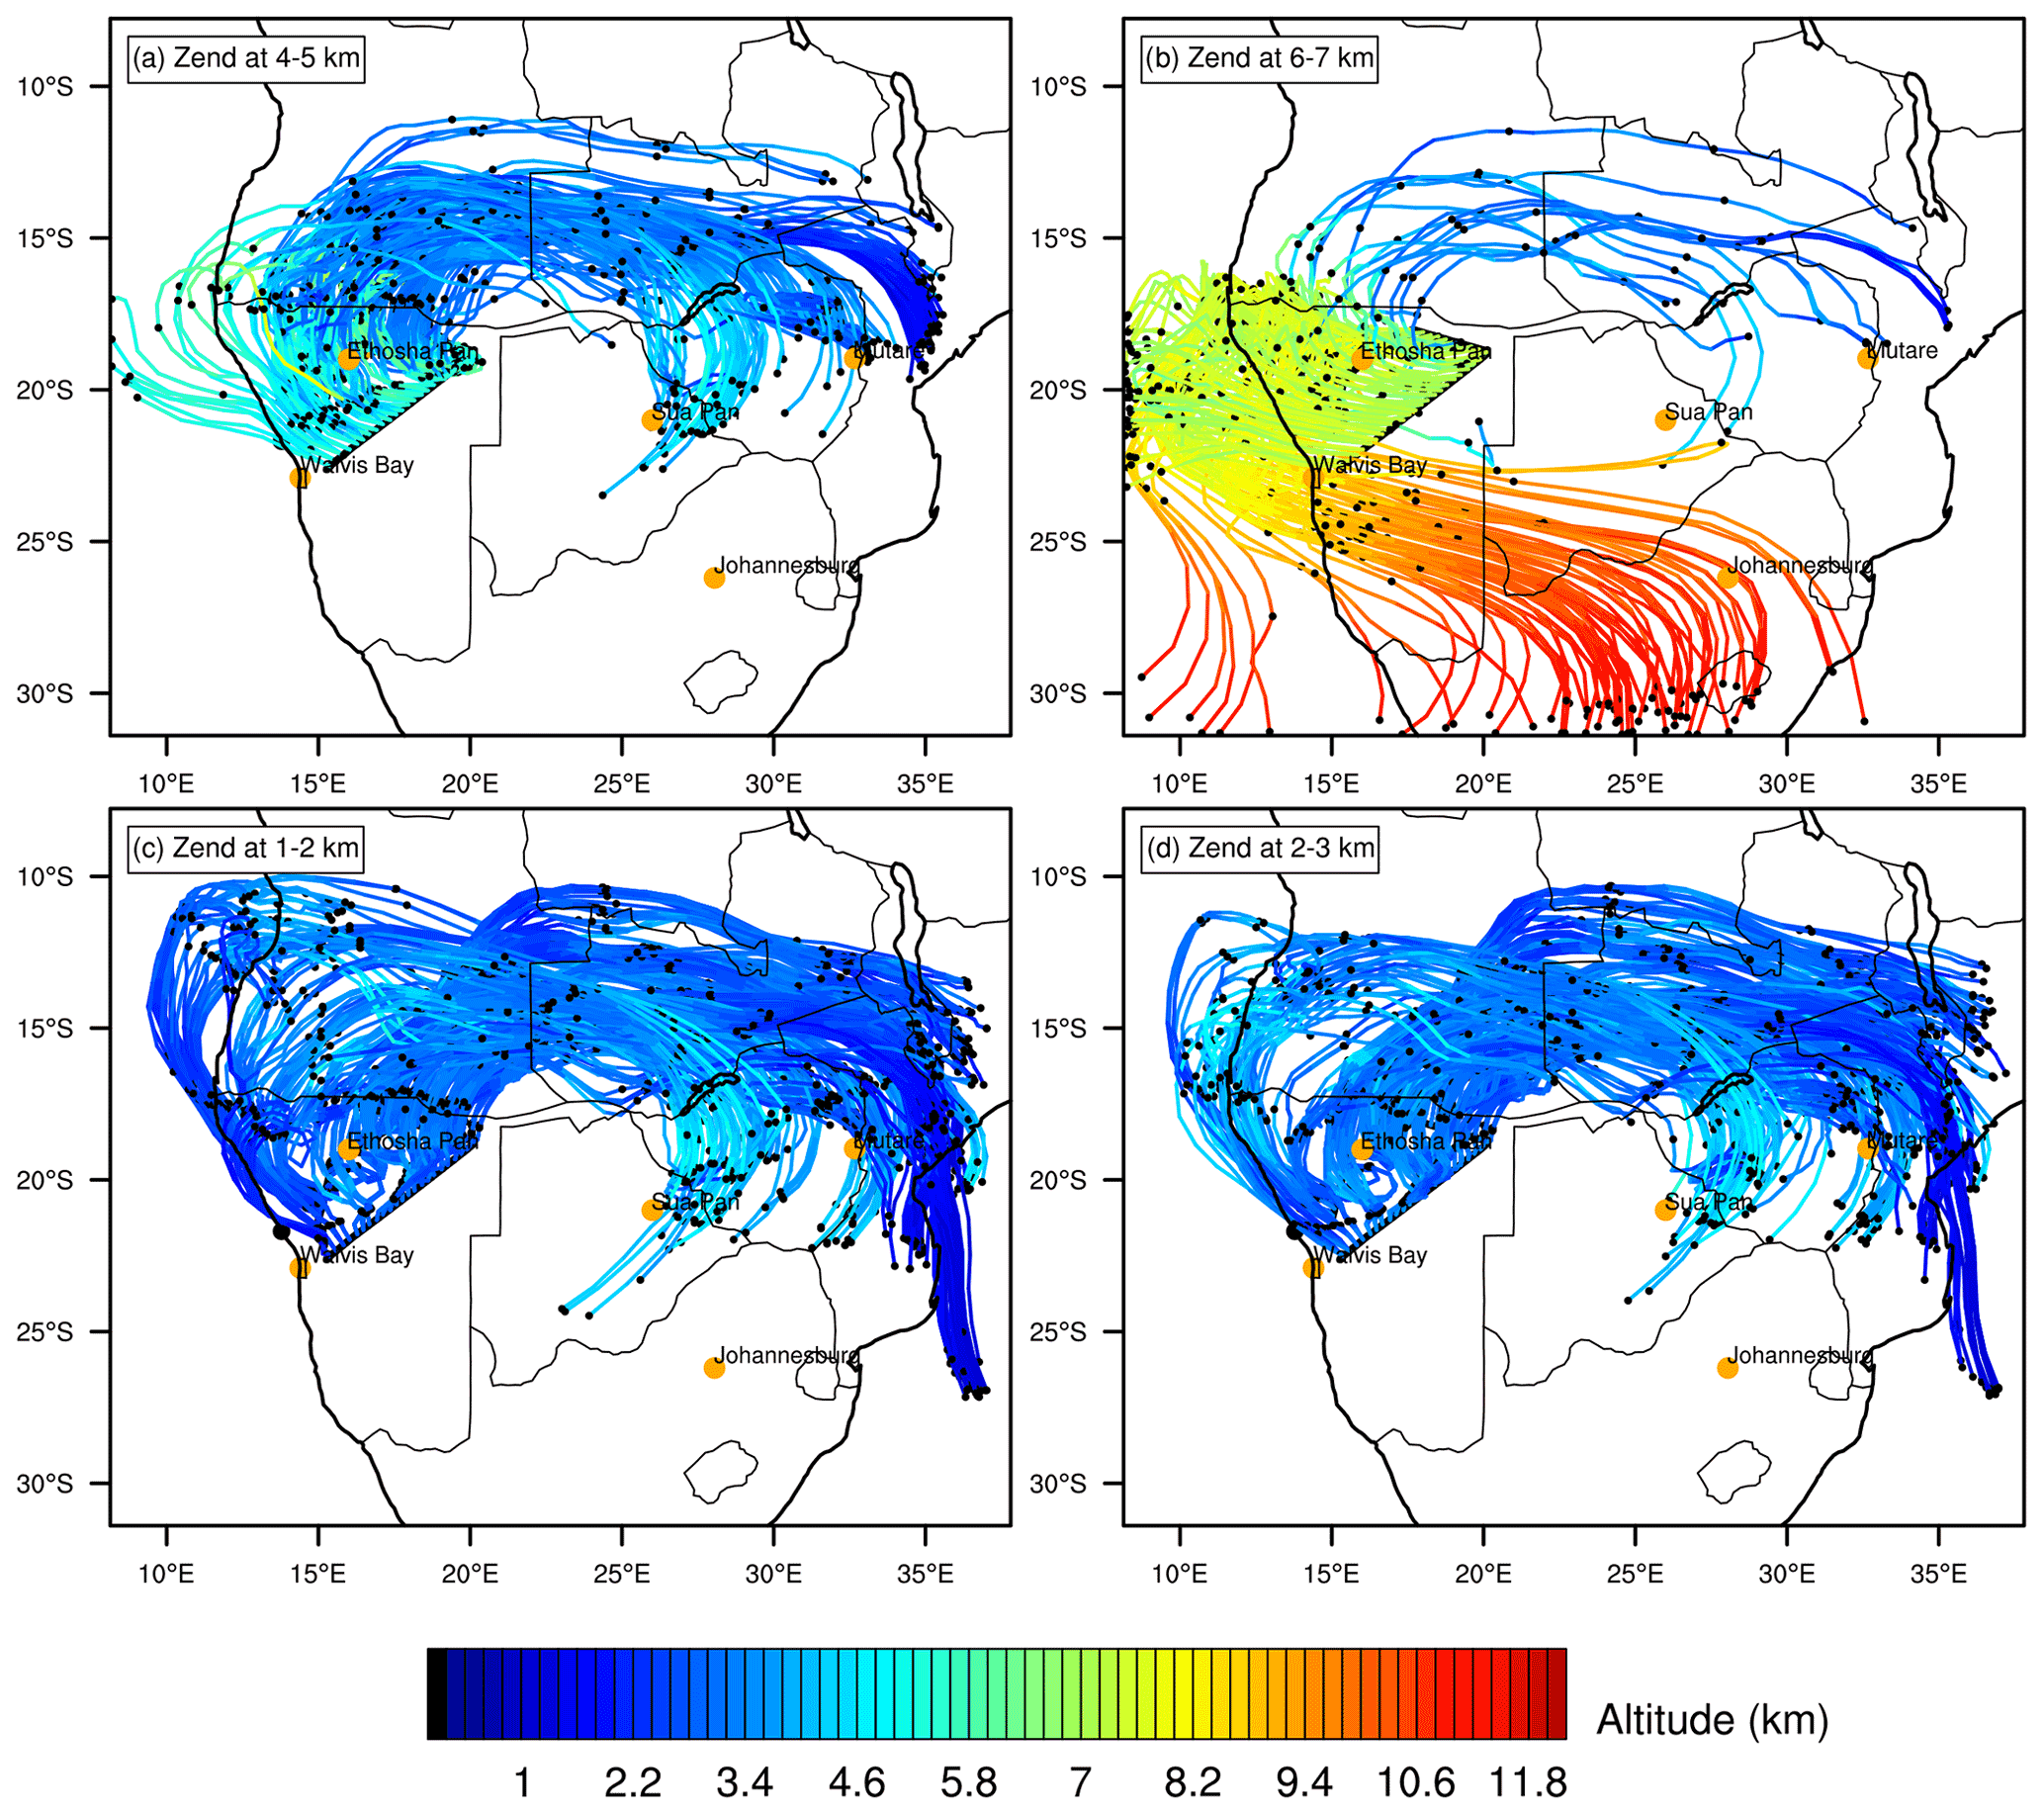
Figure 10102 h backward trajectories ending at 09:00 UTC 5 September 2017 along the F06 flight track and at altitudes between (a) 4 and 5 km a.m.s.l., (b) 6 and 7 km a.m.s.l., (c) 1 and 2 km a.m.s.l. and (d) 2 and 3 km a.m.s.l. Dots on the backward trajectories are spaced at 24 h intervals. One backward trajectory out of 20 is plotted.
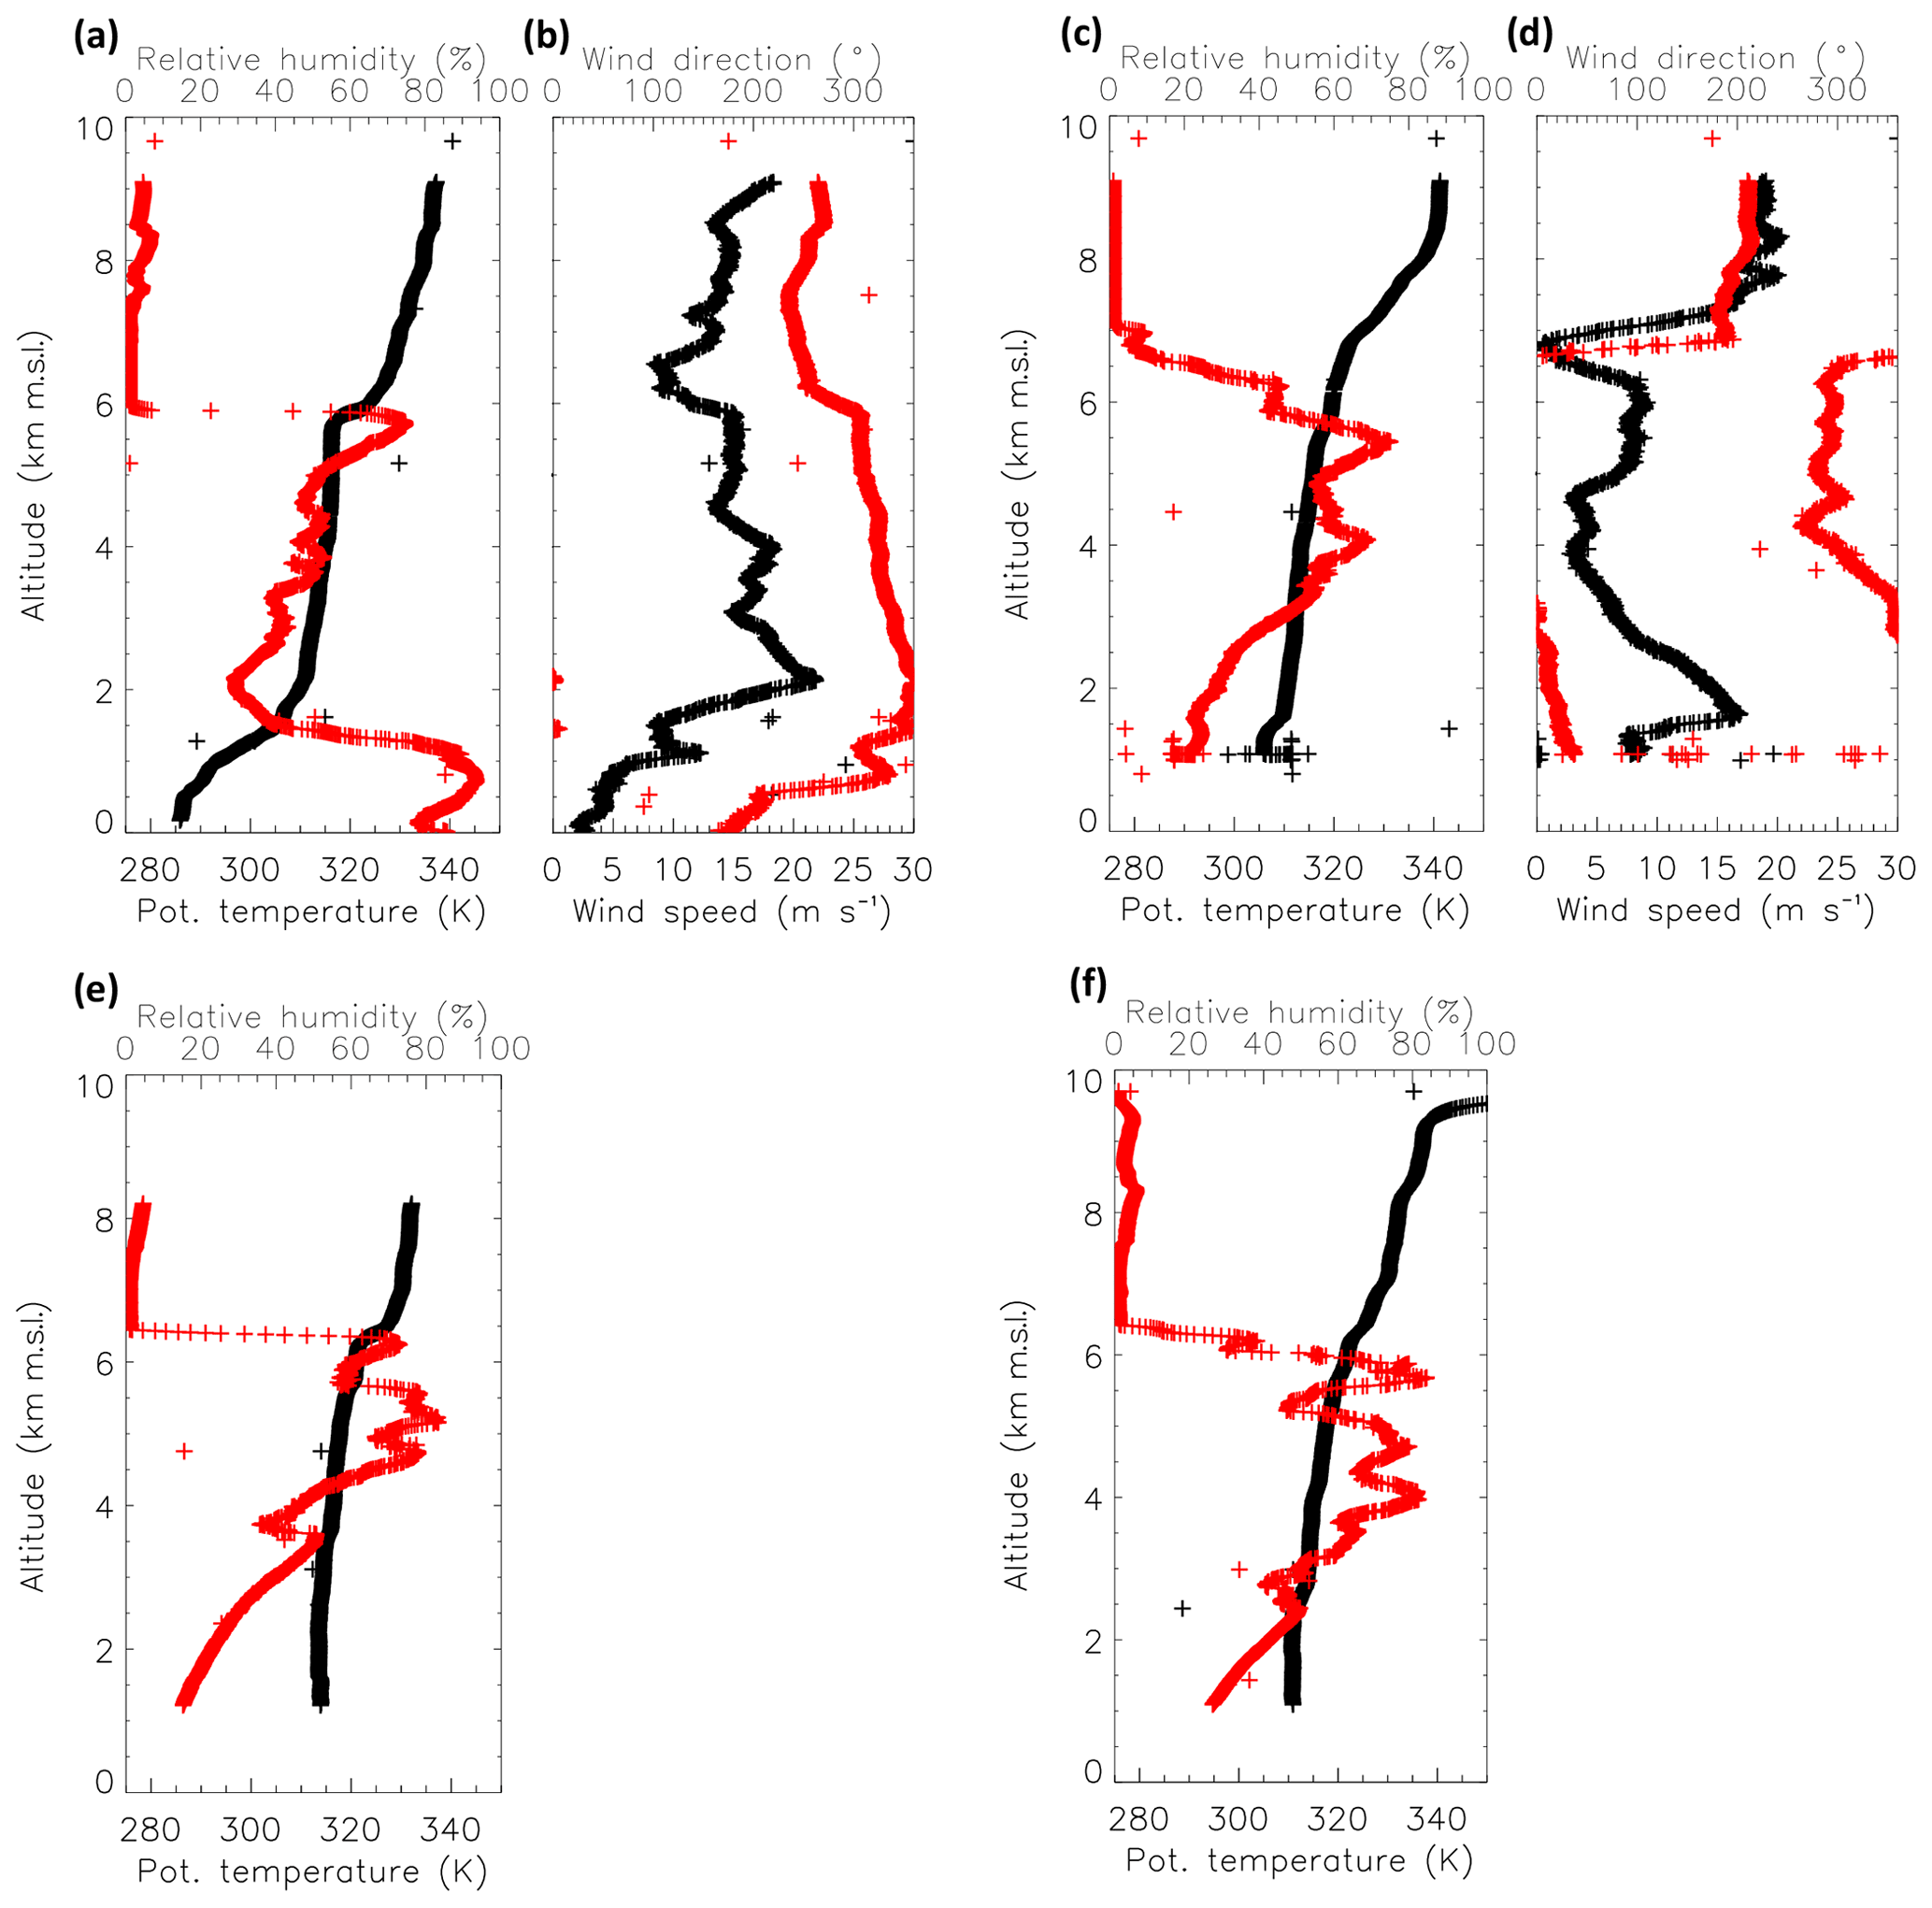
Figure 11(a) Potential temperature (black) and relative humidity (red) profiles and (b) wind speed (black) and wind direction (red) profiles derived from the dropsonde launched at 09:51 UTC on 5 September. (c) and (d): same as (a) and (c), respectively, but for the dropsonde released at 08:39 UTC. (e) Same as (a) but for the dropsonde released at 13:37 UTC on 6 September. (f) Same as (e) but for the dropsonde released at 11:46 UTC.
Airborne lidar observations evidence that, over the ocean, the height of the cumulus clouds is observed to coincide with the top of the BBA layer (Fig. 9a). The dropsonde-derived RH and potential temperature profiles acquired over the ocean (Fig. 11a) show the presence of a strong RH and temperature inversion at 6 km a.m.s.l., topped by extremely dry air layer from the west (270∘), consistent with the backward trajectories seen in the southern part of the F06 flight track (Fig. 10b). This suggests a descent of upper tropospheric air along the southern fringes of the CoL. Directional wind shear is observed in the BBA layer with northerly winds at the bottom (∼2 km a.m.s.l.) and north-northwesterly winds near the top (∼6 km a.m.s.l., Fig. 11b), with the BBA layer being advected towards the ocean at a speed of ∼15 m s−1. Over the Etosha pan, dry upper tropospheric air is observed above 7 km a.m.s.l., with significant RH above 6 km a.m.s.l. (Fig. 11c). This, together with the lidar-derived ABC observations, suggests that the BBA layer top can reach almost 7 km a.m.s.l. (enhanced ABC is observed above 6 km a.m.s.l., i.e., above isolated cumulus-type clouds forming over land). The wind direction in the air mass encompassing the upper part of the BBA layer is seen to be remarkably consistent with winds from north-northwest between 4 and 7 km a.m.s.l. (Fig. 11d), in agreement with the backward trajectories in the northern part of the F06 flight track (Fig. 10a). In conclusion, the dropsonde-derived RH profile over Etosha between 5.5 and 7 km a.m.s.l. suggests large-scale ascending motion above the BBA layer over the continental plateau, as opposed to the nearby ocean, where the RH profile suggests strong subsidence associated with the South Atlantic high. Enhanced ABC above 6 km a.m.s.l. is not related to differential transport of BBA layers of different origin but rather to the lifting of the top of the BBA layer (with non-negligible RH values contributing an increased lidar backscatter signal by hydroscopic growth of aerosols). The presence of BB carbon tracers above 6 km a.m.s.l. is also seen in the Meso-NH simulation (Fig. 9c). Backward trajectories computed between 6 and 7 km a.m.s.l. in that area (between kilometers 400 and 1000 in Fig. 9a) are nearly all associated with air masses from the northeast, i.e., the fire-prone regions of Angola and Zambia. These backward trajectories are seen to upglide to almost 8.5 km a.m.s.l. in the 24 h preceding their arrival over the Etosha pan region (not shown). This provides further confirmation of ascending motion above the BBA layer over the Etosha pan region, consistent with air moving in the easterly low wave.
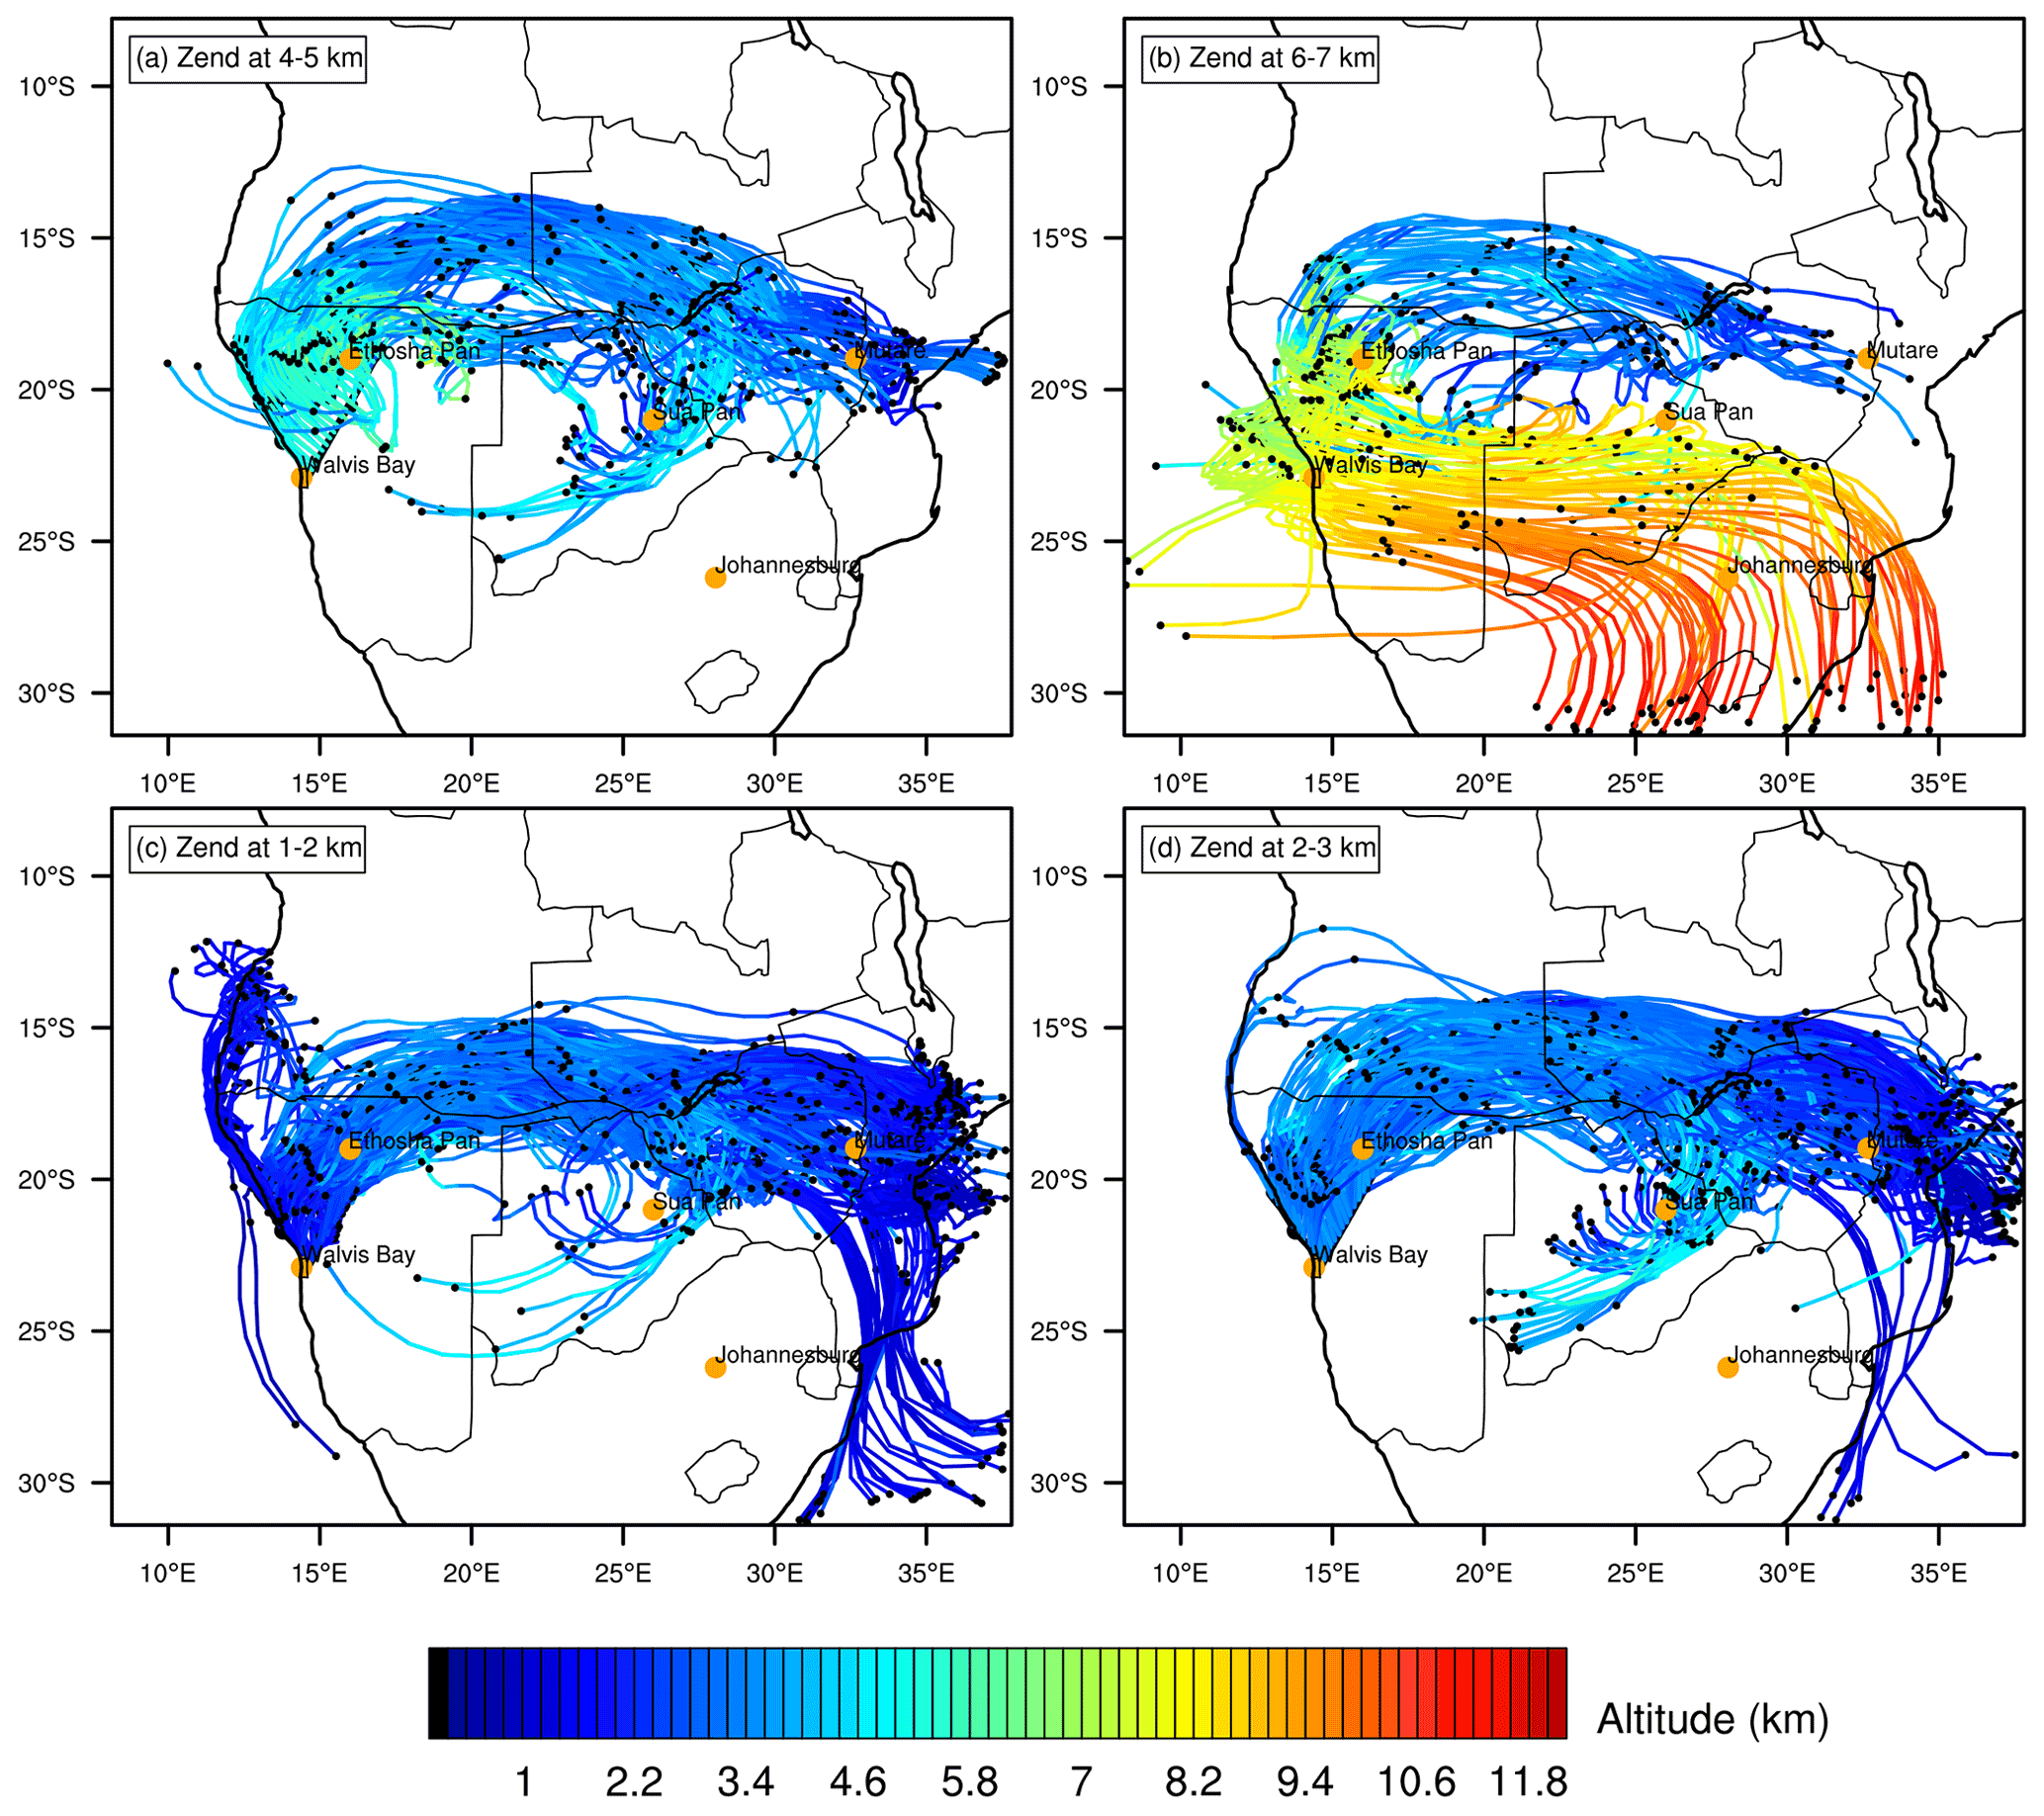
Figure 12As in Fig. 10 but ending at 12:00 UTC 6 September 2017 for the F09 flight track.
4.4 Analysis of BBA transport on 6 September
Figure 12 shows the backward trajectories ending at 12:00 UTC between 1 and 7 km a.m.s.l. along the F09 flight track on 6 September. Backward trajectories between 1 and 5 km a.m.s.l. (Fig. 12a, c and d) are very similar to those seen on 5 September, with air masses having traveled over Angola, Zambia, Zimbabwe and Mozambique before reaching northern Namibia. The BB carbon tracer concentrations increase along the path of the trajectories towards Namibia (Fig. S5d). On both 5 and 6 September, the air masses originate from the northeast (Fig. 12), ending between 4 and 5 km a.m.s.l. All trajectories show significant lofting in the previous 24 h prior to reaching the area of the Falcon flight. Above, the backward trajectories ending along the flight track are essentially coming from the southeast and are descending from 11 to 7 km upon reaching the area of interest (Fig. 12b). Only a few trajectories ending in the Etosha pan region originate from the northeast (as opposed to the previous day, when a significant number of such trajectories were seen). On this day, vertical motion above the BBA layer is dominated by subsiding dry air masses traveling along the southern fringes of the CoL during the previous 3 d (Fig. S5c). On 6 September, these descending trajectories extend much further over the ocean than on the previous day (compare Figs. 10b and 12b). This is consistent with the fact that the CoL was well established over the area of the flight 2 d prior to the flight (i.e., on 4 September, Fig. 3d), more so than the CoL on 3 September (Fig. 3c) 2 d prior to the flight on 5 September. As a result of the dominance of the descending air masses over northern Namibia, a sharp RH transition to very dry conditions is observed at the top of the BBA layer, above 6.5 km a.m.s.l., along the southern part of the F09 flight track (Fig. 11e). Likewise, the top of the BBA layer over Etosha is significantly lower than on the previous day, even though the structure of the RH profile in the upper part of the BBA layer suggests weaker ascending motion (Fig. 11f) than on 5 September. The RH and potential temperature profiles acquired over the Etosha pan confirm the presence of a deeper convective boundary layer on 6 September (with a top at 4 km a.m.s.l.) due to the fact that the flight took place later in the day than on 5 September (the top of the convective boundary layer being observed at 2 km a.m.s.l.). The maxima of RH are observed to be slightly higher on 6 September (∼80 %, Fig. 11f) than on the previous day (∼70 %, Fig. 11c).
In the previous section, we showed that the mid-tropospheric circulation associated with the presence of the CoL potentially modulates the depth of the underlying widespread layer of the smoke layer over northern Namibia. The modulation appears to be forced by the vertical motion associated with the CoL, i.e., subsiding air parcels to the south and west of its center and ascending motion to the north and east of it. In the following, we provide further evidence of this modulation over northern Namibia, where the CoL was observed to be intense during 2 d (3 and 4 September) by looking at the evolution of the vertical distribution of BB carbon tracers and potential vorticity, among other variables, using Meso-NH simulations and ERA5 reanalysis.

Figure 13Time–height cross section of (a) potential vorticity (K m2 kg−1,s−1), (b) vertical velocity (Pa s−1), (c) relative humidity (%) and (d) cloud cover over Windpoort between 1 and 6 September 2017 from hourly ERA5 reanalysis. Ascending motions are associated with negative ω values.
The horizontal extent of the CoL over northern Namibia and more particularly above three Sun-photometer stations (namely Henties Bay, Windpoort and Bonanza) on 3 and 4 September 2017 was highlighted using ERA5-derived PV in Fig. 3. The time–height cross section of the PV over Windpoort from 1 to 6 September (Fig. 13a) evidences the presence of the CoL from midday on 2 September until the end of 4 September, associated with negative PV (less than K m2 kg−1 s−1) and cyclonic circulation, between 400 and 300 hPa. In the lower troposphere, the shallow nocturnal boundary layer is also associated with negative PV and cyclonic circulation. The top of the nocturnal boundary layer is found around 875 hPa. In comparison, the deeper daytime PBL is associated with positive PV and anticyclonic circulation. The strongest ascending motions in the mid troposphere (800–400 hPa) are seen between 12:00 UTC on 2 September and 12:00 UTC on 3 September (Fig. 13b). This strong vertical motion is associated with the sloping negative PV structure related to the incoming CoL (Fig. 13a). Concomitantly, RH above 600 hPa increases dramatically up to 400 hPa at 12:00 UTC on 3 September (Fig. 13c), together with the cloud cover (Fig. 13d). The cloud cover is found to decrease after 3 September, unlike RH, which remains high above 600 hPa in the following days. The peak in cloud cover over Windpoort on 3 September is consistent with the space-borne observations made with SEVIRI (Fig. S6b), which shows the presence of an isolated patch of mid-level clouds south of the Etosha pan region on 2 September at 12:00 UTC and over the area of Etosha on 3 September at 12:00 UTC (Fig. S6a and b). Overall, the mid-level cloud cover above continental Namibia is low, and the isolated nature of the mid-level cloud patches on 2 and 3 September suggests that they are formed locally rather than being advected from another area. On 4 September, the space-borne lidar CATS overpassed northern Namibia, just to the north of the Etosha pan during the daytime and across the CoL (Fig. 6a). The CATS observations evidence that the PBL is the deepest seen over the continental plateau along the transect (Fig. S6d) and that mid-level clouds are forming on top of the PBL to the north of the center of the CoL. This is also strong evidence that the CoL generates strong local ascending motion in the lower troposphere, leading to the formation of an isolated cloud patch, also visible on the SEVIRI images (Fig. S6c).
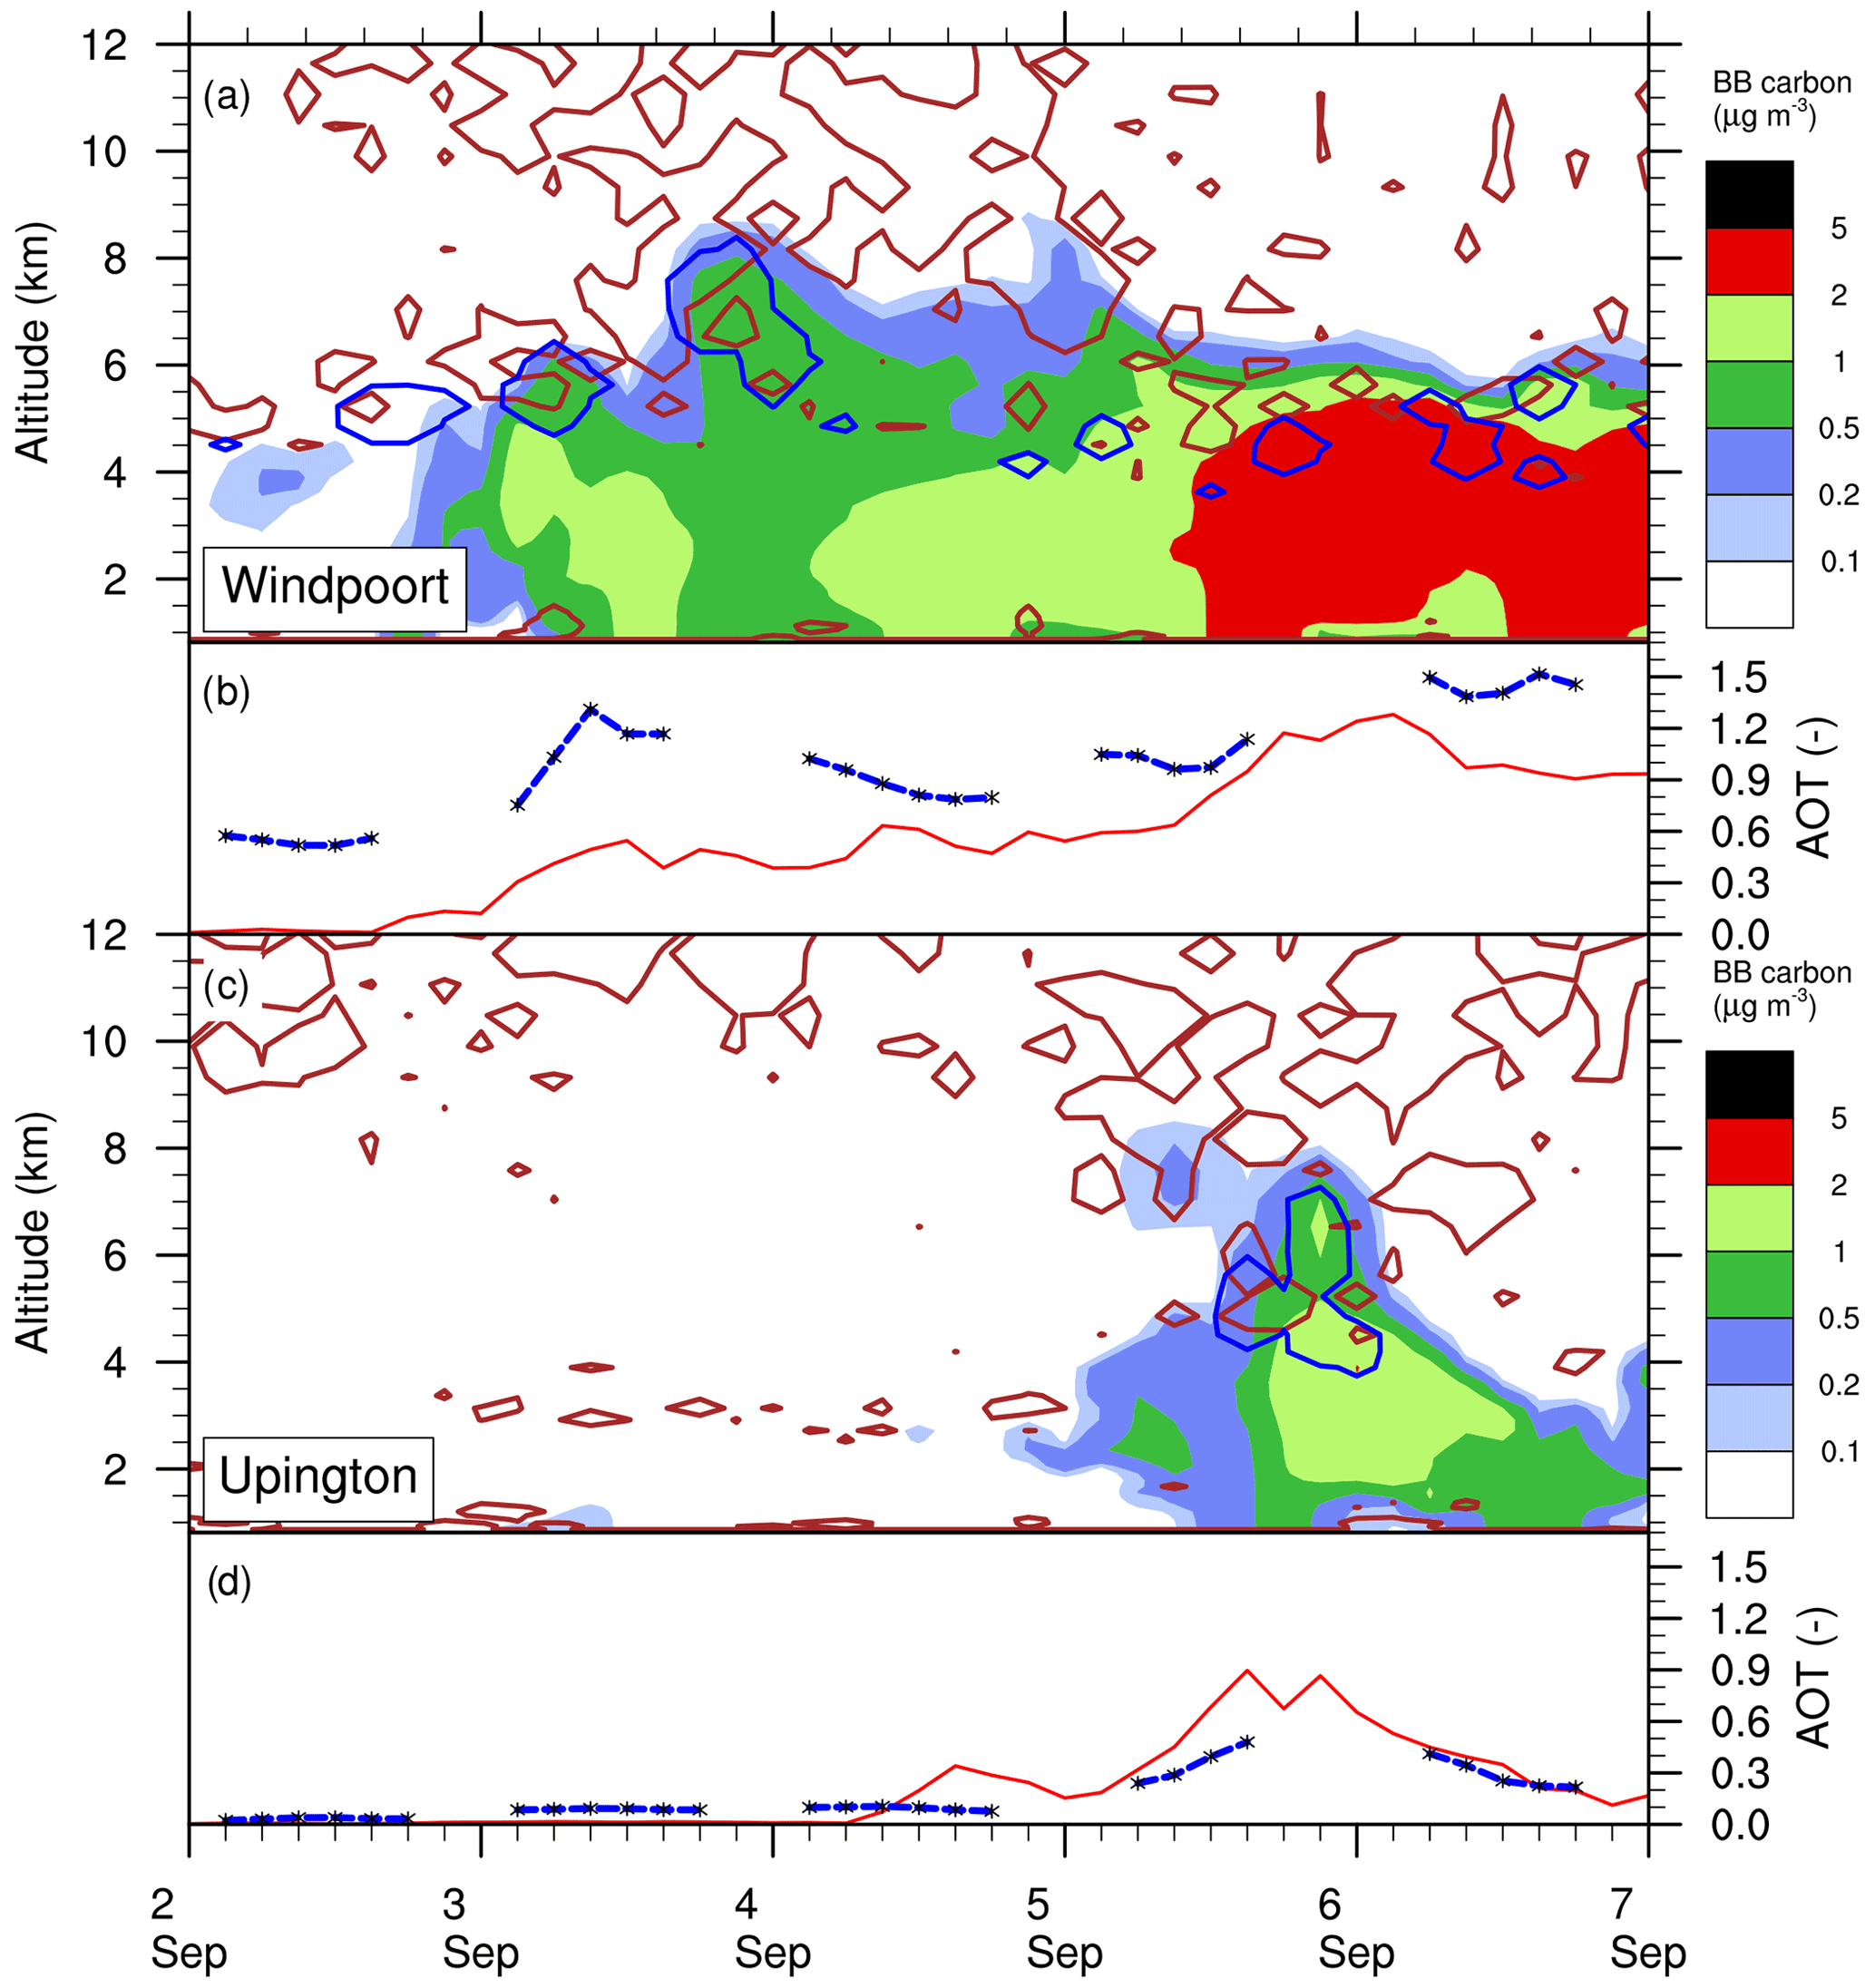
Figure 14(a) Time–height evolution of BB carbon tracer concentration (color) between 1 and 6 September 2017 from the Meso-NH simulation over Windpoort. Blue contours represent liquid water every 0.1 g kg−1, while brown contours represent potential vorticity every −1.5 PVU (potential vorticity unit, PVU = 10−6 K kg−1 m2 s−1). (c, d) AOT derived from Meso-NH (550 nm, solid line, BBA only) and Sun-photometer (500 nm, blue crosses). (b) Same as (a) but for Upington.
The Meso-NH-derived time–height evolution of smoke tracer concentrations, vorticity and cloud liquid water over Windpoort between 1 and 6 September 2017 is shown in Fig. 14a. Even though the largest BB carbon tracer concentrations are seen after 12:00 UTC on 5 September (i.e., the time when the airborne observations discussed above were acquired), the simulation shows that the deepest BBA layer over Windpoort occurred late on 3 September (12:00–21:00 UTC) as well as late on 4 September (18:00–21:00 UTC) in connection with the presence of CoL-related potential vorticity in the upper troposphere, reaching towards the surface to altitudes between 6 and 7 km a.m.s.l. On this occasion, the top of the BBA layer reaches at least 8 km a.m.s.l., while later on, i.e., on 5 and 6 September, the top of the BBA layer is between 6 and 6.5 km a.m.s.l., as with the airborne lidar measurements in the area of Windpoort (∼900 km into the flight in Fig. 9a and ∼250 km into the flight in Fig. 9b). The liquid water content at the top of the BBA layer increases from 1 to 3 September, together with the height of the condensation level (Fig. 14a), both variables reaching their maximum values late on 3 September, i.e., shortly after the descent of mid-tropospheric vorticity on that day. On 4 and 5 September, the level of condensation is much lower (between 4 and 6 km a.m.s.l.) and within the BBA layer, in accordance with the lidar observations (∼400 and 850 km into flight no. 6 in Fig. 9a). Further south, in Upington (Fig. 14b), the presence of mid-tropospheric potential vorticity is at altitudes as low as 7 km a.m.s.l. around midday on 5 September. Later that day, Meso-NH simulates the deepest BBA layer of the period, the top of the layer reaching between 7 and 8 km a.m.s.l. The simulation reproduces consistently the sporadic nature of the event in Upington associated with the advection of the river of smoke observed in Sect. 4, with large BB carbon tracer concentrations occurring late on 5 September over a large depth in the lower troposphere. It is worth noting that liquid water is seen to extend from 4 to 7 km a.m.s.l., thereby suggesting thick clouds embedded in the river of smoke, in accordance with observations from MODIS (horizontal distribution, Fig. 6) and from CATS (vertical distribution, Fig. 7) as well as from SEVIRI regarding clouds (Fig. S6). For instance, Hennigan et al. (2012) discuss how the production of secondary organic aerosol in BBA plumes significantly enhances cloud condensation nuclei concentrations and how global model simulations predict that nucleation in photochemically aging fire plumes produces dramatically higher cloud condensation nuclei concentrations over widespread areas of the Southern Hemisphere during the dry, burning season (September–October).
The characteristics of the river of smoke (timing, vertical extent of the BBA layer) seen in Upington based on Meso-NH simulations cannot be seen further north (e.g., in Windpoort), as northern Namibia was under the influence of a well-formed, stationary, isolated CoL on 3 and 4 September (Fig. 3c and d), unlike South Africa, over which the fast-evolving CoL traveled southeastward between 5 and 6 September while merging back with the main westerly flow (Fig. 3e and f). Hence, the picture emerges that the characteristics of the river of smoke are very much tied to the later (fast-evolving) stage of the evolution of the CoL than the earlier (stationary) stage. The model results discussed in this section highlight the mechanisms by which the CoL observed over southern Africa at the beginning of September 2017 influences the vertical structure of the BBA layer, essentially through the CoL-related ascending/descending motion above the BBA layer. The deepest BBA layers over northern Namibia could not be observed with the airborne platform operated during AEROCLO-sA. Nevertheless, the Meso-NH simulation for the period 5–6 September being very consistent with the observations gathered during the campaign, we are confident that the Meso-NH-derived structure of the BBA layer over northern Namibia during the stationary phase of the CoL is realistic.
The formation of a river of smoke crossing southern Africa was investigated during the Aerosols, Radiation and Clouds in southern Africa (AEROCLO-sA) campaign for 2 to 6 September 2017 in connection with a mid-level TTT and a CoL, using a complementary set of global and mesoscale numerical simulations as well as ground-based, airborne and space-borne observations.
Numerical simulations performed with the high-resolution Meso-NH model together with space-borne lidar observation made with CATS provide evidence that the top of the BBA layer over northern Namibia (where the CoL remained stationary for 2 d) may reach altitudes higher than 8 km a.m.s.l. This is much higher that the height of the top of the BBA layer over the regions where the smoke originates from (Angola, Zambia, Zimbabwe, Mozambique), i.e., ∼5 to 6 km a.m.s.l. The impact of the CoL-driven TTT on the vertical distribution of BBA was also felt further south, over South Africa, in the form of a river of smoke as the CoL was rapidly traveling southwestward before merging with the westerlies. The TTT created favorable conditions for efficiently transporting BBA-prone tropical air masses towards the southwestern Indian Ocean. The temporal evolution of the river of smoke was found to be connected to the fast-evolving stage of the CoL. Besides favoring the increase in the BBA layer top, the ascending motion associated with the CoL also promoted the occurrence of mid-level clouds over northern Namibia in the early (stationary) phase of the CoL evolution (2–4 September, Fig. 15a), while cloud-free conditions were observed everywhere else over the continent. In the fast-evolving stage of the CoL (5 and 6 September, Fig. 15b and c, respectively), a band of mid-level clouds was embedded in the river of smoke that were related to the circulation in the lee of the CoL.
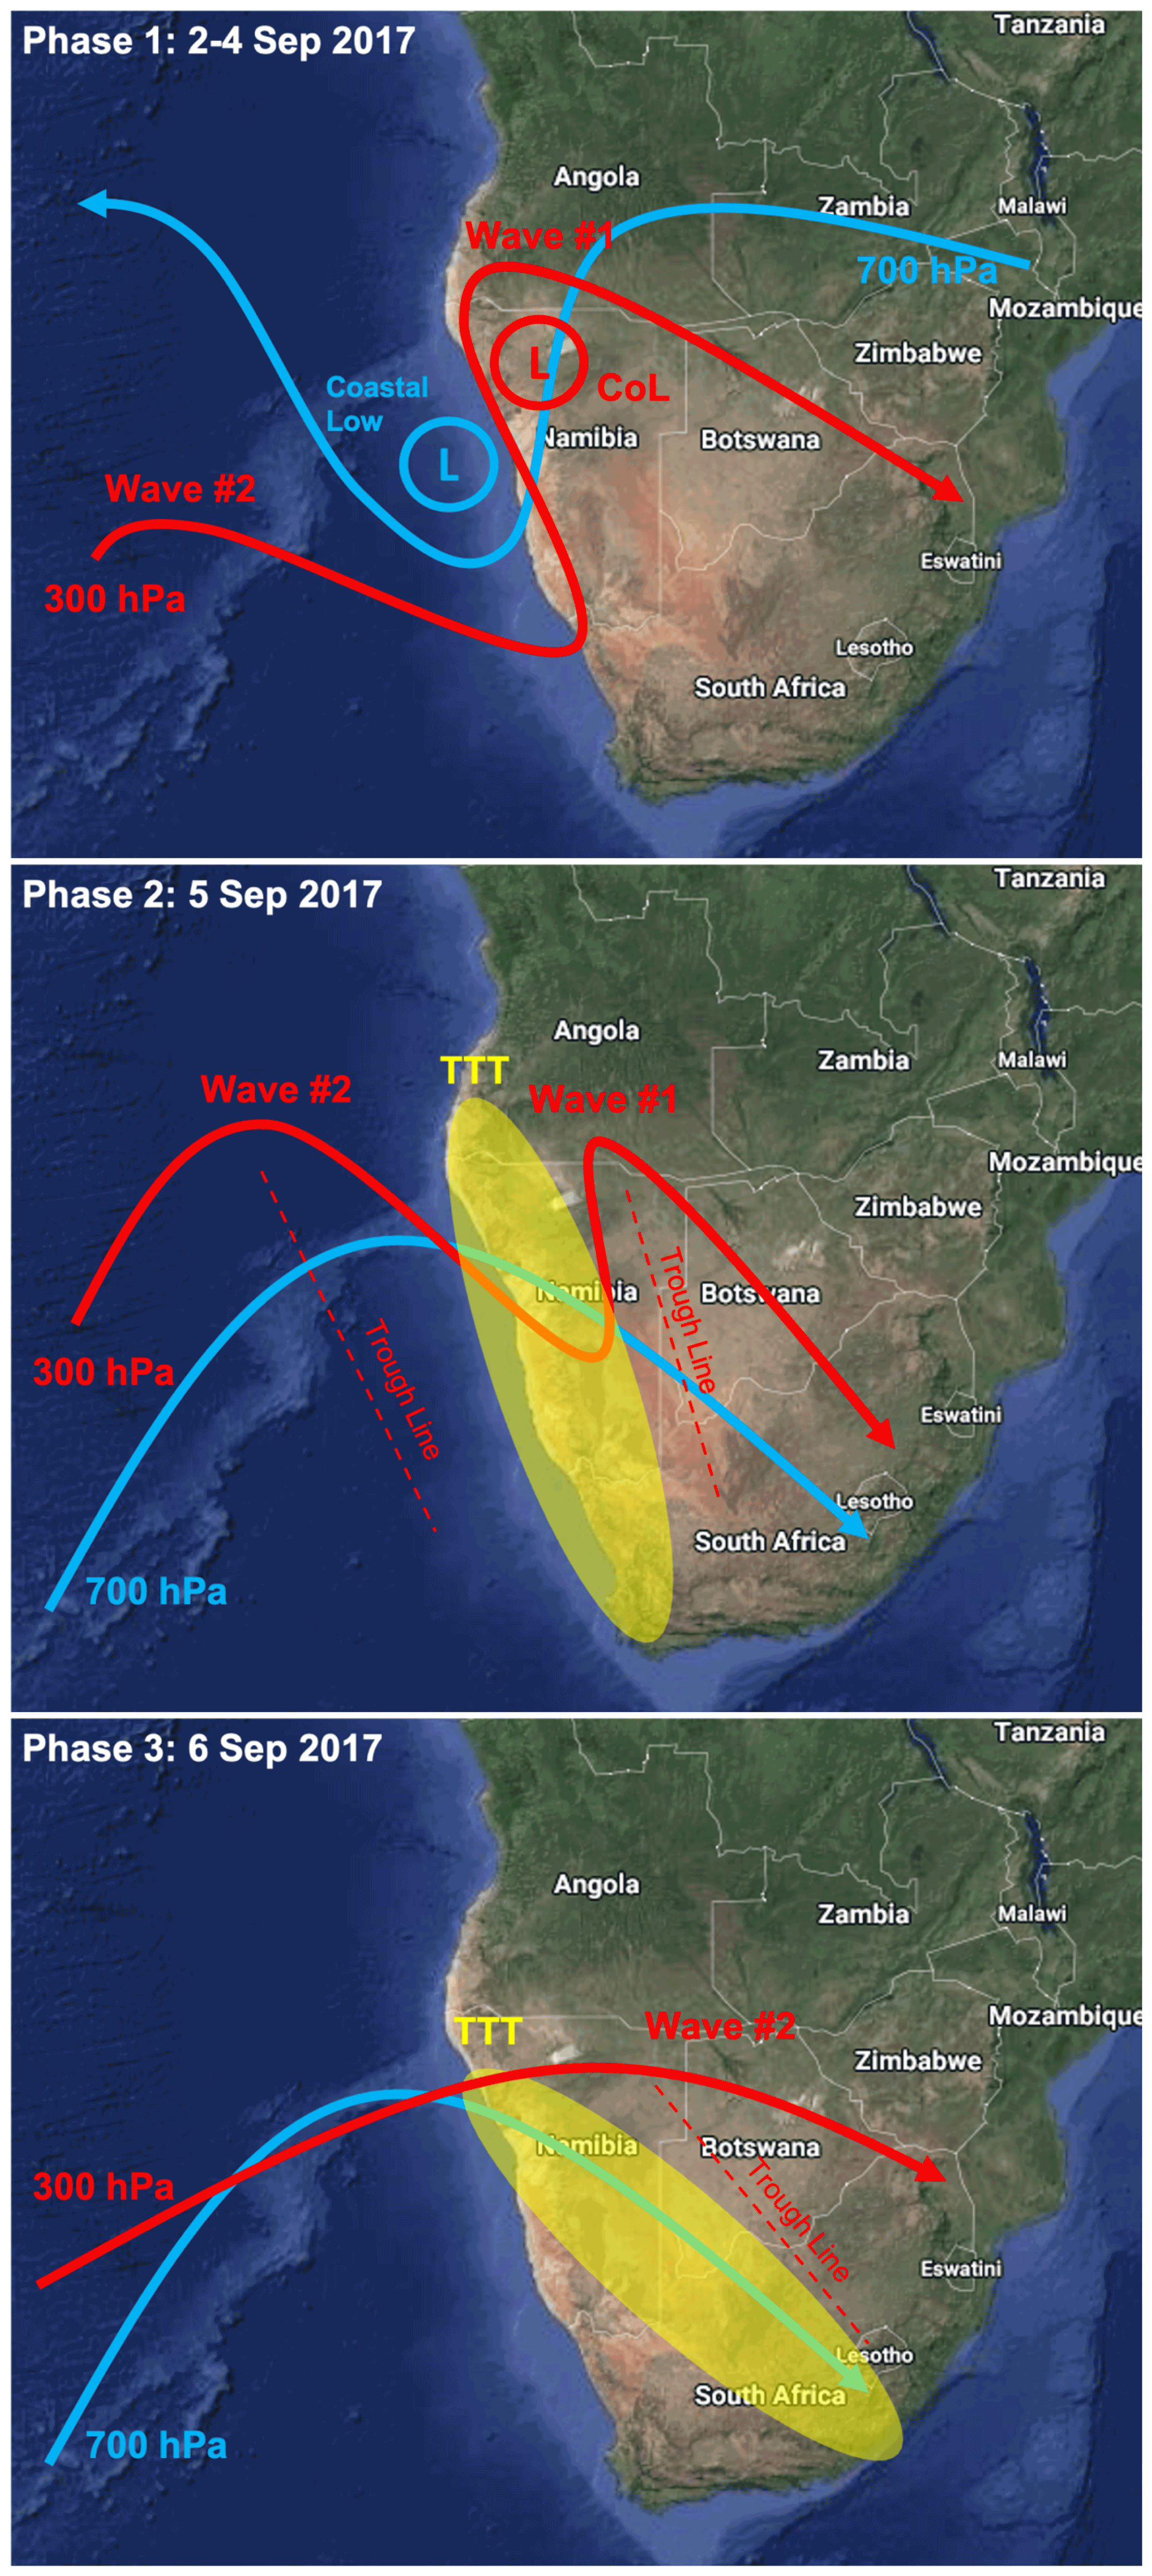
Figure 15Map of southern Africa with the main dynamical features described in the text during the period 2–6 September 2017. (a) Phase 1 (2–4 September) with the easterly flow at 700 hPa (blue line with arrow) and the imbedded coastal low (blue L), together with the westerly waves at 300 hPa (red line with arrow) and the imbedded CoL (red L). (b) Phase 2 (5 September) with the location of the two westerly waves and associated trough lines (red dashed lines), the westerly mid-level flow at 700 hPa (blue line with arrow) and the location of the formed TTT (yellow-shaded area). (c) Phase 3 (6 September) with the passage of the second westerly wave and the associated trough line over the continent and the eastward displacement of the TTT. Map credit: © Google Earth 2021.
Even though the CoL observed on 3–6 September 2017 did not impact the circulation at the surface directly, the Meso-NH simulation provides unambiguous evidence that the river of smoke event that swept through western South Africa (i.e., away from the region of fires) not only had a mid-tropospheric signature, but also that air quality associated with the transported BBA was reaching the surface, as illustrated in Upington. Such behavior was also observed during SAFARI 2000 by Magi et al. (2003) and Schmid et al. (2003). These authors have also shown that the height of the top of the BBA layer decreased significantly from northwest to southeast, i.e., between fire-prone regions in the tropics and the exit region of the river of smoke. The altitude of the top of the BBA layer observed during AEROCLO-sA is consistent with that measured over Zambia during SAFARI 2000 (Schmid et al., 2003).
To the authors' knowledge, this is the first time the link between the CoL dynamics and the formation of a river of smoke is established. The CoL was an essential ingredient of the TTT that developed across southern Africa. TTTs are known to comprise the dominant rainfall-producing weather system over southern Africa during the austral summer. Here, we demonstrate that TTTs also play a role in the transport of BBA during the winter.
Future research will aim at consolidating our understanding of the impact of the main dynamical features highlighted in this study (CoL, TTT, Angola low) on the formation and the evolution of rivers of smoke over the southern African subcontinent. Among overarching open questions to be investigated using ERA5/CAMS reanalysis and satellite aerosols products, we shall assess (1) what is the frequency of “rivers of smoke” during the austral winter, (2) how important is this mechanism for the transport of CO and aerosols out of southern Africa compared with the other transport patterns identified by Garstang et al. (1996), (3) whether CoLs and/or TTTs are systematically associated with rivers of smoke and (4) what is the importance/role of the Angola low in promoting the accumulation of BBA in the tropical band prior to their injection in smoke rivers.
The aircraft data acquired specifically in the framework of the project and used here can be accessed via the AEROCLO-sA database at https://doi.org/10.6096/AEROCLO.1754 (Perrin and Richard, 2018) and now have DOIs. The LNG lidar data DOI is https://doi.org/10.6096/AEROCLO.1774 (Flamant, 2018). The dropsonde data DOI is https://doi.org/10.6096/AEROCLO.1777 (Perrin and Etienne, 2019). The Meso-NH-derived fields and back trajectories data can be obtained upon request to the corresponding author of the paper. AERONET products can be accessed at https://aeronet.gsfc.nasa.gov/ (NASA, 2022a). IASI data can be obtained via the AERIS data center (https://iasi.aeris-data.fr; IASI Portal, 2022). SEVIRI imagery can be accessed via http://aeroclo.sedoo.fr/ (AEROCLO, 2022). MODIS data are accessible via https://giovanni.gsfc.nasa.gov/giovanni/ (NASA, 2022b). SEVIRI images are available via EUMETSAT (European Organisation for the Exploitation of Meteorological Satellites).
The supplement related to this article is available online at: https://doi.org/10.5194/acp-22-5701-2022-supplement.
CF processed and analyzed the airborne lidar data and the dropsonde data as well as the Meso-NH simulations and ERA5 and CAMS reanalysis and wrote the paper. MG assembled the material from ECMWF (ERA5 and CAMS), prepared the related figures, and contributed to the interpretation of the atmospheric dynamic and composition data. PC gathered the CATS lidar data and the MODIS data and produced the related figures. JPC performed the Meso-NH simulation and produced the related figures. SJP contributed to the analysis of the synoptic conditions. JC collected CO data from IASI and produced the corresponding figure. PF coordinated the AEROCLO-sA project. All contributed to the writing of the paper.
One of the authors is a guest editor for the ACP Special Issue “New observations and related modelling studies of the aerosol–cloud–climate system in the Southeast Atlantic and southern Africa regions”. The remaining authors declare that they have no conflicts of interests.
Publisher's note: Copernicus Publications remains neutral with regard to jurisdictional claims in published maps and institutional affiliations.
This article is part of the special issue “New observations and related modelling studies of the aerosol–cloud–climate system in the Southeast Atlantic and southern Africa regions (ACP/AMT inter-journal SI)”. It is not associated with a conference.
The authors thank the AERIS data center for their support during the campaign and for managing the AEROCLO-sA database. Airborne data were obtained using the aircraft managed by SAFIRE, the French facility for airborne research, an infrastructure of the French National Center for Scientific Research (CNRS), Météo-France and the French space agency (Centre National d'Etudes Spatiales – CNES). The authors thank Frédéric Blouzon and Abdelkader Abchiche (DT-INSU) as well as Pascal Genau and Mathilde van Haecke (LATMOS) for their support in operating and processing the LNG data. The invaluable diplomatic assistance of the French Embassy in Namibia, the administrative support of the Service Partnership and Valorisation of the Regional Delegation of the Paris-Villejuif Region of the CNRS, and the cooperation of the Namibian National Commission on Research, Science and Technology (NCRST) are greatly appreciated. The authors thank the MODIS science, processing and data support teams for producing and providing MODIS data (at https://modis.gsfc.nasa.gov/data/dataprod/, last access: 27 April 2022). The authors thank the AERONET network for Sun-photometer products. IASI is a joint mission of EUMETSAT and the CNES (France). The authors thank the AERIS data center for providing access to the CO IASI data in this study as well as the Université Libre de Bruxelles and LATMOS for the development of the retrieval algorithms. The authors would like to thank two anonymous reviewers for their time and their thoughtful comments that helped improve the paper.
This work was supported by the French National Research Agency under grant agreement no. ANR-15-CE01-0014-01, the French national program LEFE/INSU, the Programme national de Télédétection Spatiale (PNTS, http://programmes.insu.cnrs.fr/pnts/, last access: 27 April 2022), grant no. PNTS-2016-14, the French National Agency for Space Studies (CNES), and the South African National Research Foundation (NRF) under grant UID 105958. The research leading to these results received funding from the European Union's 7th Framework Programme (FP7/2014–2018) under EUFAR2 contract no. 312609. Computer resources for running Meso-NH were allocated by GENCI through project 90569.
This paper was edited by Jérôme Riedi and reviewed by two anonymous referees.
AEROCLO: AEROCLO Operating Center – day: 2022-May-02, http://aeroclo.sedoo.fr/, last access: 27 April 2022.
Annegarn, H. J., Otter, L., Swap, R. J., and Scholes, R. J.: Southern Africa's ecosystem in a test-tube: A perspective on the Southern African Regional Science Initiative (SAFARI 2000), S. Afr. J. Sci., 98, 111–113, 2002.
Bergstrom, R. W., Pilewskie, P., Russell, P. B., Redemann, J., Bond, T. C., Quinn, P. K., and Sierau, B.: Spectral absorption properties of atmospheric aerosols, Atmos. Chem. Phys., 7, 5937–5943, https://doi.org/10.5194/acp-7-5937-2007, 2007.
Bruneau, J., Pelon, J., Blouzon, F., Spatazza, J., Genau, P., Buchholtz, G., Amarouche, N., Abchiche, A., and Aouji, O.: 355-nm high spectral resolution airborne lidar LNG: system description and first results, Appl. Optics, 54, 8776–8785, https://doi.org/10.1364/AO.54.008776, 2015.
Chaboureau, J.-P. and Bechtold, P.: A simple cloud parameterization from cloud resolving model data: Theory and application, J. Atmos. Sci., 59, 2362–2372, https://doi.org/10.1175/1520-0469(2002)059<2362:ASCPDF>2.0.CO;2, 2002.
Chapman, S. and Lindzen, R. S.: Atmospheric Tides, Gordon and Breach, New York, 200 pp., https://doi.org/10.1007/978-94-010-3399-2, 1970.
Chazette, P., Flamant, C., Totems, J., Gaetani, M., Smith, G., Baron, A., Landsheere, X., Desboeufs, K., Doussin, J.-F., and Formenti, P.: Evidence of the complexity of aerosol transport in the lower troposphere on the Namibian coast during AEROCLO-sA, Atmos. Chem. Phys., 19, 14979–15005, https://doi.org/10.5194/acp-19-14979-2019, 2019.
Clerbaux, C., Boynard, A., Clarisse, L., George, M., Hadji-Lazaro, J., Herbin, H., Hurtmans, D., Pommier, M., Razavi, A., Turquety, S., Wespes, C., and Coheur, P.-F.: Monitoring of atmospheric composition using the thermal infrared IASI/MetOp sounder, Atmos. Chem. Phys., 9, 6041–6054, https://doi.org/10.5194/acp-9-6041-2009, 2009.
Colella, P. and Woodward, P. R.: The Piecewise Parabolic Method (PPM) for gas-dynamical simulations, J. Comput. Phys., 54, 174–201, https://doi.org/10.1016/0021-9991(84)90143-8, 1984.
Cuxart, J., Bougeault, P., and Redelsperger, J. L.: A turbulence scheme allowing for mesoscale and large-eddy simulations, Q. J. Roy. Meteorol. Soc., 126, 1–30, https://doi.org/10.1002/qj.49712656202, 2000.
Denjean, C., Brito, J., Libois, Q., Mallet, M., Bourrianne, T., Burnet, F., Colomb, A., Dupuy, R., Flamant, C., Knippertz, P., and Schwarzenboeck, A.: Unexpected biomass burning aerosol absorption enhancement explained by black carbon mixing state, Geophys. Res. Lett., 47, e2020GL089055, https://doi.org/10.1029/2020GL089055, 2020.
De Wachter, E., Barret, B., Le Flochmoën, E., Pavelin, E., Matricardi, M., Clerbaux, C., Hadji-Lazaro, J., George, M., Hurtmans, D., Coheur, P.-F., Nedelec, P., and Cammas, J. P.: Retrieval of MetOp-A/IASI CO profiles and validation with MOZAIC data, Atmos. Meas. Tech., 5, 2843–2857, https://doi.org/10.5194/amt-5-2843-2012, 2012.
Duflot, V., Dils, B., Baray, J. L., De Mazière, M., Attié, J. L., Vanhaelewyn, G., Senten, C., Vigouroux, C., Clain, G., and Delmas, R.: Analysis of the origin of the distribution of CO in the subtropical southern Indian Ocean in 2007, J. Geophys. Res., 115, D22106, https://doi.org/10.1029/2010JD013994, 2010.
Favre, A., Hewitson, B., Tadross, M., Lennard, C., and Cerezo-Mota, R.: Relationships between cut-off lows and the semiannual and southern oscillations, Clim. Dynam., 38, 1473–1482, https://doi.org/10.1007/s00382-011-1030-4, 2012.
Flamant, C.: AEROCLO-sA F20 Lidar LNG aerosols, baobab-sedoo repository [data set], https://doi.org/10.6096/AEROCLO.1774, 2018.
Formenti, P., D'Anna, B., Flamant, C., Mallet, M., Piketh, S. J., Schepanski, K., Waquet, F., Auriol, F., Brogniez, G., Burnet, F., Chaboureau, J.-P., Chauvigné, A., Chazette, P., Denjean, C., Desboeufs, K., Doussin, J.-F., Elguidi, N., Feuerstein, S., Gaetani, M., Giorio, C., Klopper, D., Mallet, M. D., Monod, A., Nabat, P., Solmon, F., Namwoonde, A., Chikwililwa, C., Mushi, R., Welton, E. J., and Holben, B.: The Aerosols, Radiation and Clouds in southern Africa (AEROCLO-sA) field campaign in Namibia: overview, illustrative observations and way forward, B. Am. Meteorol. Soc., 100, 1277–1298, https://doi.org/10.1175/BAMS-D-17-0278.1, 2019.
Fouquart, Y. and Bonnel, B.: Computations of solar heating of the earth's atmosphere: A new parametrization, Beitr. Phys. Atmos., 53, 35–62, 1980.
Gaetani, M., Pohl, B., Alvarez Castro, M. C., Flamant, C., and Formenti, P.: A weather regime characterisation of winter biomass aerosol transport from southern Africa, Atmos. Chem. Phys., 21, 16575–16591, https://doi.org/10.5194/acp-21-16575-2021, 2021.
Garstang, M., Tyson, P. D., Swap, R., Edwards, M., Kallberg, P., and Lindesay, J. A.: Horizontal and vertical transport of air over southern Africa, J. Geophys. Res., 101, 23721–23736, https://doi.org/10.1029/95JD00844, 1996.
George, M., Clerbaux, C., Hurtmans, D., Turquety, S., Coheur, P.-F., Pommier, M., Hadji-Lazaro, J., Edwards, D. P., Worden, H., Luo, M., Rinsland, C., and McMillan, W.: Carbon monoxide dis- tributions from the IASI/METOP mission: evaluation with other space-borne remote sensors, Atmos. Chem. Phys., 9, 8317–8330, https://doi.org/10.5194/acp-9-8317-2009, 2009.
Gheusi, F., and Stein, J.: Lagrangian description of airflows using Eulerian passive tracers, Q. J. Roy. Meteorol. Soc., 128, 337–360, https://doi.org/10.1256/00359000260498914, 2002.
Grini, A., Tulet, P., and Gomes, L.: Dusty weather forecasts using the MesoNH mesoscale atmospheric model, J. Geophys. Res., 111, D19205, https://doi.org/10.1029/2005JD007007, 2006.
Haywood, J. M., Abel, S. J., Barrett, P. A., Bellouin, N., Blyth, A., Bower, K. N., Brooks, M., Carslaw, K., Che, H., Coe, H., Cotterell, M. I., Crawford, I., Cui, Z., Davies, N., Dingley, B., Field, P., Formenti, P., Gordon, H., de Graaf, M., Herbert, R., Johnson, B., Jones, A. C., Langridge, J. M., Malavelle, F., Partridge, D. G., Peers, F., Redemann, J., Stier, P., Szpek, K., Taylor, J. W., Watson-Parris, D., Wood, R., Wu, H., and Zuidema, P.: The CLoud–Aerosol–Radiation Interaction and Forcing: Year 2017 (CLARIFY-2017) measurement campaign, Atmos. Chem. Phys., 21, 1049–1084, https://doi.org/10.5194/acp-21-1049-2021, 2021.
Hennigan, C. J., Westervelt, D. M., Riipinen, I., Engelhart, G. J., Lee, T., Collett Jr., J. L., Pandis, S. N., Adams, P. J., and Robinson, A. L.: New particle formation and growth in biomass burning plumes: An important source of cloud condensation nuclei, Geophys. Res. Lett., 39, L09805, https://doi.org/10.1029/2012GL050930, 2012.
Hersbach, H., Bell, B., Berrisford, P., Biavati, G., Horányi, A., Muñoz Sabater, J., Nicolas, J., Peubey, C., Radu, R., Rozum, I., Schepers, D., Simmons, A., Soci, C., Dee, D., and Thépaut, J.-N.: ERA5 hourly data on single levels from 1979 to present, Copernicus Climate Change Service (C3S) Climate Data Store (CDS), https://doi.org/10.24381/cds.adbb2d47, 2018.
Howard, E., Washington, R., and Hodges, K. I.: Tropical lows in southern Africa: Tracks, rainfall contributions, and the role of ENSO, J. Geophys. Res.-Atmos., 124, 11009–11032, https://doi.org/10.1029/2019JD030803, 2019.
Hurtmans, D., Coheur, P. F., Wespes, C., Clarisse, L., Scharf, O., Clerbaux, C., Hadji-Lazaro, J., George, M., and Turquety, S.: FORLI radiative transfer and retrieval code for IASI, J. Quant. Spectrosc. Ra., 113, 1391–1408, https://doi.org/10.1016/j.jqsrt.2012.02.036, 2012.
IASI Portal: Atomospheric composition data products, https://iasi.aeris-data.fr, last acces: 27 April 2022.
Inness, A., Ades, M., Agustí-Panareda, A., Barré, J., Benedictow, A., Blechschmidt, A., Dominguez, J., Engelen, R., Eskes, H., Flemming, J., Huijnen, V., Jones, L., Kipling, Z., Massart, S., Parrington, M., Peuch, V.-H., Razinger, M., Remy, S., Schulz, M., and Suttie, M.: CAMS global reanalysis (EAC4), Copernicus Atmosphere Monitoring Service (CAMS) Atmosphere Data Store (ADS) [data set], https://ads.atmosphere.copernicus.eu/cdsapp#!/dataset/cams-global-reanalysis-eac4?tab=overview (last access: 8 November 2020), 2019.
Jury, M. R. and Freiman, T.: The climate of tropical southern Africa during the SAFARI 2000 campaign, S. Afr. J. Sci., 98, 527–533, 2002.
King, M. D., Kaufman, Y. J., Menzel, W. P., and Tanré, D.: Remote sensing of cloud, aerosol, and water-vapor properties from the Moderate Resolution Imaging Spectrometer (MODIS), IEEE T. Geosci. Remote, 30, 2–27, https://doi.org/10.1109/36.124212, 1992.
Labonne, M., Breon, F.-M., and Chevallier, F.: Injection height of biomass burning aerosols as seen from a spaceborne lidar, Geophys. Res. Lett., 34, L11806, https://doi.org/10.1029/2007GL029311, 2007.
Lac, C., Chaboureau, J.-P., Masson, V., Pinty, J.-P., Tulet, P., Escobar, J., Leriche, M., Barthe, C., Aouizerats, B., Augros, C., Aumond, P., Auguste, F., Bechtold, P., Berthet, S., Bielli, S., Bosseur, F., Caumont, O., Cohard, J.-M., Colin, J., Couvreux, F., Cuxart, J., Delautier, G., Dauhut, T., Ducrocq, V., Filippi, J.-B., Gazen, D., Geoffroy, O., Gheusi, F., Honnert, R., Lafore, J.-P., Lebeaupin Brossier, C., Libois, Q., Lunet, T., Mari, C., Maric, T., Mascart, P., Mogé, M., Molinié, G., Nuissier, O., Pantillon, F., Peyrillé, P., Pergaud, J., Perraud, E., Pianezze, J., Redelsperger, J.-L., Ricard, D., Richard, E., Riette, S., Rodier, Q., Schoetter, R., Seyfried, L., Stein, J., Suhre, K., Taufour, M., Thouron, O., Turner, S., Verrelle, A., Vié, B., Visentin, F., Vionnet, V., and Wautelet, P.: Overview of the Meso-NH model version 5.4 and its applications, Geosci. Model Dev., 11, 1929–1969, https://doi.org/10.5194/gmd-11-1929-2018, 2018.
Lunet, T., Lac, C., Auguste, F., Visentin, F., Masson, V., and Escobar, J.: Combination of WENO and Explicit Runge–Kutta Methods for Wind Transport in the Meso-NH Model, Mon. Weather Rev., 145, 3817–3838, https://doi.org/10.1175/MWR-D-16-0343.1, 2017.
Luo, C., Mahowald, N., Bond, T., Chuang, P. Y., Artaxo, P., Siefert, R., Chen, Y., and Schauer, J.: Combustion iron distribution and deposition, Global Biogeochem. Cy., 22, GB1012, https://doi.org/10.1029/2007GB002964, 2008.
Lyons, S. W.: Origins of convective variability over equatorial southern Africa during austral summer, J. Climate, 4, 23–39, https://doi.org/10.1175/1520-0442(1991)004<0023:OOCVOE>2.0.CO;2, 1991.
Macron, C., Pohl, B., Richard, Y., and Bessafi, M.: How do Tropical Temperate Troughs Form and Develop over Southern Africa?, J. Climate, 27, 1633–1647, https://doi.org/10.1175/JCLI-D-13-00175.1, 2014.
Magi, B. I., Hobbs, P. V., Schmid, B., and Redemann, J.: Vertical profiles of light scattering, light absorption, and single scattering albedo during the dry, biomass burning season in southern Africa and comparisons of in situ and remote sensing measurements of aerosol optical depths, J. Geophys. Res., 108, 8504, https://doi.org/10.1029/2002JD002361, 2003.
Mallet, M., Nabat, P., Zuidema, P., Redemann, J., Sayer, A. M., Stengel, M., Schmidt, S., Cochrane, S., Burton, S., Ferrare, R., Meyer, K., Saide, P., Jethva, H., Torres, O., Wood, R., Saint Martin, D., Roehrig, R., Hsu, C., and Formenti, P.: Simulation of the transport, vertical distribution, optical properties and radiative impact of smoke aerosols with the ALADIN regional climate model during the ORACLES-2016 and LASIC experiments, Atmos. Chem. Phys., 19, 4963–4990, https://doi.org/10.5194/acp-19-4963-2019, 2019.
Mallet, M., Solmon, F., Nabat, P., Elguindi, N., Waquet, F., Bouniol, D., Sayer, A. M., Meyer, K., Roehrig, R., Michou, M., Zuidema, P., Flamant, C., Redemann, J., and Formenti, P.: Direct and semi-direct radiative forcing of biomass-burning aerosols over the southeast Atlantic (SEA) and its sensitivity to absorbing properties: a regional climate modeling study, Atmos. Chem. Phys., 20, 13191–13216, https://doi.org/10.5194/acp-20-13191-2020, 2020.
Masson, V., Le Moigne, P., Martin, E., Faroux, S., Alias, A., Alkama, R., Belamari, S., Barbu, A., Boone, A., Bouyssel, F., Brousseau, P., Brun, E., Calvet, J.-C., Carrer, D., Decharme, B., Delire, C., Donier, S., Essaouini, K., Gibelin, A.-L., Giordani, H., Habets, F., Jidane, M., Kerdraon, G., Kourzeneva, E., Lafaysse, M., Lafont, S., Lebeaupin Brossier, C., Lemonsu, A., Mahfouf, J.-F., Marguinaud, P., Mokhtari, M., Morin, S., Pigeon, G., Salgado, R., Seity, Y., Taillefer, F., Tanguy, G., Tulet, P., Vincendon, B., Vionnet, V., and Voldoire, A.: The SURFEXv7.2 land and ocean surface platform for coupled or offline simulation of earth surface variables and fluxes, Geosci. Model Dev., 6, 929–960, https://doi.org/10.5194/gmd-6-929-2013, 2013.
McMillan, W., McCourt, M. L., Revercomb, H. E., Knuteson, R. O., Christian, T. J., Doddridge, B. G., Hobbs, P. V., Lukovich, J. V., Novelli, P. C., Piketh, S. J., Sparling, L., Stein, D., Swap, R. J., and Yokelson, R. J.: Tropospheric carbon monoxide measurements from the Scanning High-resolution Interferometer Sounder on 7 September 2000 in southern Africa during SAFARI 2000, J. Geophys. Res., 108, 8492, https://doi.org/10.1029/2002JD002335, 2003.
Menut, L., Flamant, C., Turquety, S., Deroubaix, A., Chazette, P., and Meynadier, R.: Impact of biomass burning on pollutant surface concentrations in megacities of the Gulf of Guinea, Atmos. Chem. Phys., 18, 2687–2707, https://doi.org/10.5194/acp-18-2687-2018, 2018.
Mlawer, E. J., Taubman, S. J., Brown, P. D., Iacono, M. J., and Clough, S. A.: Radiative transfer for inhomogeneous atmospheres: RRTM, a validated correlated-k model for the longwave, J. Geophys. Res., 102, 16663–16682, https://doi.org/10.1029/97JD00237, 1997.
Müller, R.: The performance of classical versus modern finite-volume advection schemes for atmospheric modelling in a one-dimensional test-bed, Mon. Weather Rev., 120, 1407–1415, https://doi.org/10.1175/1520-0493(1992)120<1407:TPOCVM>2.0.CO;2, 1992.
NASA: AERONET, https://aeronet.gsfc.nasa.gov/ (last access: 27 April 2022), 2022a.
NASA: GIOVANNI, https://giovanni.gsfc.nasa.gov/giovanni/ (last access: 27 April 2022), 2022b.
Pak, B. C., Langenfelds, L., Young, S. A., Francey, R. J., Meyer, C. P., Kivlighon, L. M., Cooper, L. N., Dunse, B. L., Allison, C. E., Steele, L. P., Galbally, I. E., and Weeksm=, I. A.: Measurements of biomass burning influences in the troposphere over southeast Australia during the SAFARI 2000 dry season campaign, J. Geophys. Res., 108, 8480, https://doi.org/10.1029/2002JD002343, 2003.
Pergaud, J., Masson, V., Malardel, S., and Couvreux, F.: A parameterization of dry thermals and shallow cumuli for mesoscale numerical weather prediction, Bound.-Layer. Meteorol., 132, 83–106, https://doi.org/10.1007/s10546-009-9388-0, 2009.
Perrin, T. and Etienne, J.-L.: AEROCLO-sA F20 Dropsondes, baobab-sedoo repository [data set], https://doi.org/10.6096/AEROCLO.1777, 2019.
Perrin, T and Richard, P.: AEROCLO-sA F20 Core Instruments, baobab-sedoo repository [data set], https://doi.org/10.6096/AEROCLO.1754, 2018.
Pinty, J.-P. and Jabouille, P.: A mixed-phase cloud parameterization for use in mesoscale non-hydrostatic model: simulations of a squall line and of orographic precipitations, in: Proc. Conf. of Cloud Physics, Everett, WA, USA, Amer. Meteor. Soc., 217–220, 1998.
Randriamiarisoa, H., Chazette, P., Couvert, P., Sanak, J., and Mégie, G.: Relative humidity impact on aerosol parameters in a Paris suburban area: Atmos. Chem. Phys., 6, 1389–1407, https://doi.org/10.5194/acp-6-1389-2006, 2006.
Ratna, S .B., Behera, S., Ratnam, J. V., Takahashi, K., and Yamagata, T.: An index for tropical temperate troughs over southern Africa, Clim. Dynam., 41, 421–441, https://doi.org/10.1007/s00382-012-1540-8, 2013.
Redemann, J., Wood, R., Zuidema, P., Doherty, S. J., Luna, B., LeBlanc, S. E., Diamond, M. S., Shinozuka, Y., Chang, I. Y., Ueyama, R., Pfister, L., Ryoo, J.-M., Dobracki, A. N., da Silva, A. M., Longo, K. M., Kacenelenbogen, M. S., Flynn, C. J., Pistone, K., Knox, N. M., Piketh, S. J., Haywood, J. M., Formenti, P., Mallet, M., Stier, P., Ackerman, A. S., Bauer, S. E., Fridlind, A. M., Carmichael, G. R., Saide, P. E., Ferrada, G. A., Howell, S. G., Freitag, S., Cairns, B., Holben, B. N., Knobelspiesse, K. D., Tanelli, S., L'Ecuyer, T. S., Dzambo, A. M., Sy, O. O., McFarquhar, G. M., Poellot, M. R., Gupta, S., O'Brien, J. R., Nenes, A., Kacarab, M., Wong, J. P. S., Small-Griswold, J. D., Thornhill, K. L., Noone, D., Podolske, J. R., Schmidt, K. S., Pilewskie, P., Chen, H., Cochrane, S. P., Sedlacek, A. J., Lang, T. J., Stith, E., Segal-Rozenhaimer, M., Ferrare, R. A., Burton, S. P., Hostetler, C. A., Diner, D. J., Seidel, F. C., Platnick, S. E., Myers, J. S., Meyer, K. G., Spangenberg, D. A., Maring, H., and Gao, L.: An overview of the ORACLES (ObseRvations of Aerosols above CLouds and their intEractionS) project: aerosol–cloud–radiation interactions in the southeast Atlantic basin, Atmos. Chem. Phys., 21, 1507–1563, https://doi.org/10.5194/acp-21-1507-2021, 2021.
Roberts, G., Wooster, M. J., and Lagoudakis, E.: Annual and diurnal African biomass burning temporal dynamics, Biogeosciences, 6, 849–866, https://doi.org/10.5194/bg-6-849-2009, 2009.
Schmid, B., Redemann, J., Russell, P. B., Hobbs, P. V., Hlavka, D. L., McGill, M. J., Holben, B. N., Welton, E. J., Campbell, J. R., Torres, O., Kahn, R. A., Diner, D. J., Helmlinger, M. C., Chu, D. A., Robles-Gonzalez, C., and de Leeuw, G.: Coordinated airborne, spaceborne, and ground-based measurements of massive, thick aerosol layers during the dry season in southern Africa, J. Geophys. Res., 108, 8496, https://doi.org/10.1029/2002JD002297, 2003.
Sinha, P., Jaeglé, L., Hobbs, P., and Liang, Q.: Transport of biomass burning emissions from southern Africa, J. Geophys. Res., 109, D20204, https://doi.org/10.1029/2004JD005044, 2004.
Stein, D. C., Swap, R. J., Greco, S., Piketh, S. J., Macko, S. A., Doddridge, B. G., Elias, T., and Bruintjes, R. T.: Haze layer characterization and associated meteorological controls along the eastern coastal region of southern Africa, J. Geophys. Res., 108, 8506, https://doi.org/10.1029/2002JD003237, 2003.
Swap, R. J., Annegarn, H. J., Suttles, J. T., King, M. D., Platnick, S., Privette, J. L., and Scholes, R. J.: Africa burning: A thematic analysis of the Southern African Regional Science Initiative (SAFARI 2000), J. Geophys. Res.-Atmos., 108, 8465–8479, https://doi.org/10.1029/2003JD003747, 2003.
van der Werf, G. R., Randerson, J. T., Giglio, L., van Leeuwen, T. T., Chen, Y., Rogers, B. M., Mu, M., van Marle, M. J. E., Morton, D. C., Collatz, G. J., Yokelson, R. J., and Kasibhatla, P. S.: Global fire emissions estimates during 1997–2016, Earth Syst. Sci. Data, 9, 697–720, https://doi.org/10.5194/essd-9-697-2017, 2017.
von Storch, H. and Zwiers, F. W.: Statistical Analysis in Climate Research, Cambridge University Press, Cambridge, ISBN 978-0-5116-1233-6, https://doi.org/10.1017/CBO9780511612336, 1999.
Yorks, J. E., McGill, M. J., Palm, S. P., Hlavka, D. L., Selmer, P. A., Nowottnick, E. P., Vaughan, M. A., Rodier, S. D., and Hart, W. D.: An overview of the CATS level 1 processing algorithms and data products, Geophys. Res. Lett., 43, 4632–4639, https://doi.org/10.1002/2016GL068006, 2016.
Zuidema, P., Chang, P., Medeiros, B., Kirtman, B. P., Mechoso, R., Schneider, E. K., Toniazzo, T., Richter, I., Small, R. J., Bellomo, K., Brandt, P., de Szoeke, S., Farrar, J. T., Jung, E., Kato, S., Li, M., Patricola, C., Wang, Z., Wood, R., and Xu, Z: Challenges and Prospects for Reducing Coupled Climate Model SST Biases in the Eastern Tropical Atlantic and Pacific Oceans: The U.S. CLIVAR Eastern Tropical Oceans Synthesis Working Group, B. Am. Meteorol. Soc., 97, 2305–2328, 2016a.
Zuidema, P., Redemann, J., Haywood, J., Wood, R., Piketh, S., Hipondoka, M., and Formenti, P.: Smoke and Clouds above the Southeast Atlantic: Upcoming Field Campaigns Probe Absorbing Aerosol's Impact on Climate, B. Am. Meteorol. Soc., 97, 1131–1135, 2016b.
- Abstract
- Introduction
- Data
- Synoptic conditions over southern Africa: a tale of two features
- Smoke and clouds over southern Africa
- The impact of the CoL on the tropospheric composition over the subcontinent
- Summary and conclusions
- Data availability
- Author contributions
- Competing interests
- Disclaimer
- Special issue statement
- Acknowledgements
- Financial support
- Review statement
- References
- Supplement