the Creative Commons Attribution 4.0 License.
the Creative Commons Attribution 4.0 License.
 | 21 Apr 2022
In situ observation of warm atmospheric layer and the heat contribution of suspended dust over the Tarim Basin
Chenglong Zhou
Qingzhe Zhu
Qing He
Tianliang Zhao
Fan Yang
Xinghua Yang
Ali Mamtimin
Based on radiosonde observations from the spring and summer of 2016–2017, we verified the existence of an anomalously warm atmospheric layer and quantified the heat contribution of suspended dust over the Tarim Basin (TB) in northwest China. The atmospheric layer was identified between 300 and 500 hPa over the TB, with 2.53 and 1.39 K average intensities in spring and summer, respectively. The Taklimakan Desert (TD), i.e., the world's second-largest moving desert, is contained in the TB and emits large amounts of dust particles, which remain suspended over the TB. Using Cloud–Aerosol Lidar and Infrared Pathfinder Satellite Observations (CALIPSO) data, we found that dust can be lifted as high as the upper atmospheric layer, i.e., between 3.0 and 5.5 km above mean sea level, over the TB. Consequently, suspended dust can exert a maximum heating effect of approximately +0.45 and +0.25 K in spring and summer, respectively. The heat contributions of dust to the anomalously warm atmospheric layer over the TB in spring and summer were 13.77 % and 10.25 %, respectively. With regard to topographical feature, the TB is adjacent to the Tibetan Plateau (TP), which acts as an elevated heat source in spring and summer. The warm atmospheric layer over the TB seems a northward extension of Tibet heat source, the concept of which is proposed in this study. Such a northward “extension” of the elevated heating by the Tibetan Plateau may be a controlling factor of the regional climate, especially in the western section of the Silk Road Economic Belt, and therefore requires further investigations.
- Article
(5927 KB) - Full-text XML
- BibTeX
- EndNote


The Tarim Basin (TB), is situated north of the Tibetan Plateau (TP), covers an area of 5.3 × 10⁵ km2, and contains the Taklimakan Desert (TD), which occupies the main part of the TB and is a major dust source in Asia (Gong et al., 2003; Wang et al., 2005). Based on Cloud–Aerosol Lidar and Infrared Pathfinder Satellite Observations (CALIPSO) data, Liu et al. (2019) identified high emissions of dust particles from the TD; these dust particles can remain suspended over the TB for a long time (Huang et al., 2008; Ge et al., 2014; Cheng et al., 2020). Therefore, it is important to investigate the distribution of suspended dust and its impact on the Earth's climate system.
Dust is a heat-absorbing aerosol that heats the atmosphere (Yang et al., 2009; Yang et al., 2021a, b, c); it can change the vertical radiation distribution in the atmosphere and affect the regional and global climate (Huang et al., 2011; Sun and Zhao, 2020). When dust is suspended, it heats the atmospheric layers containing it (Huang et al., 2006a, b, 2015; Liu et al., 2014; Jia et al., 2018; Xie et al., 2013; Su et al., 2020). The radiative forcing of dust over the TB and its contribution to climate change in Central Asia are scientific topics that require further clarification, and it is necessary to quantify the heating induced by dust in the upper atmosphere over the TB.
Previous studies that investigated the radiative effect of suspended dust over the TB were mainly based on satellite observations and numerical models. Using CALIPSO data, Huang et al. (2009) found that dust induced significant radiative forcing and heating over part of the TB. Gu et al. (2006, 2016) and Lau et al. (2006), based on numerical results, elucidated the impact of dust on air temperature in the upper layers; nevertheless, regarding this aspect, in situ observations are sparse.
In this study, we used ground-based and radiosonde observations, as well as reanalysis and satellite data, from the spring and summer of 2016–2017 for investigating the vertical air-temperature distribution and the three-dimensional structure of suspended dust over the TB, while quantifying the heating effect of suspended dust on the atmosphere. Based on our findings, we propose the concept of the northward extension of the Tibetan heat source.
The rest of the paper is organized as follows: Sect. 2 describes the data and methodology used in the study. Section 3 presents the main results and discussion. Conclusions are given in Sect. 4.
2.1 Radiosonde observations
We used radiosonde observations from six radiosonde stations situated in the TB for the spring and summer of 2016–2017 (Fig. 1), namely Kashi (KS), Akesu (AKS), Kuerle (KEL), Ruoqiang (RQ), Minfeng (MF), and Hetian (HT); from these data, we deduced the air-temperature profiles, which were measured twice per day (08:00 and 20:00 UTC + 8). The observations were automatic and continuous, with 1 min temporal resolution, and the original data were processed into averages with a 25 hPa interval. We also used in situ observations from six meteorological stations (i.e., KS, AKS, KEL, RQ, MF, and HT) for classifying and statistically describing events with dusty conditions.
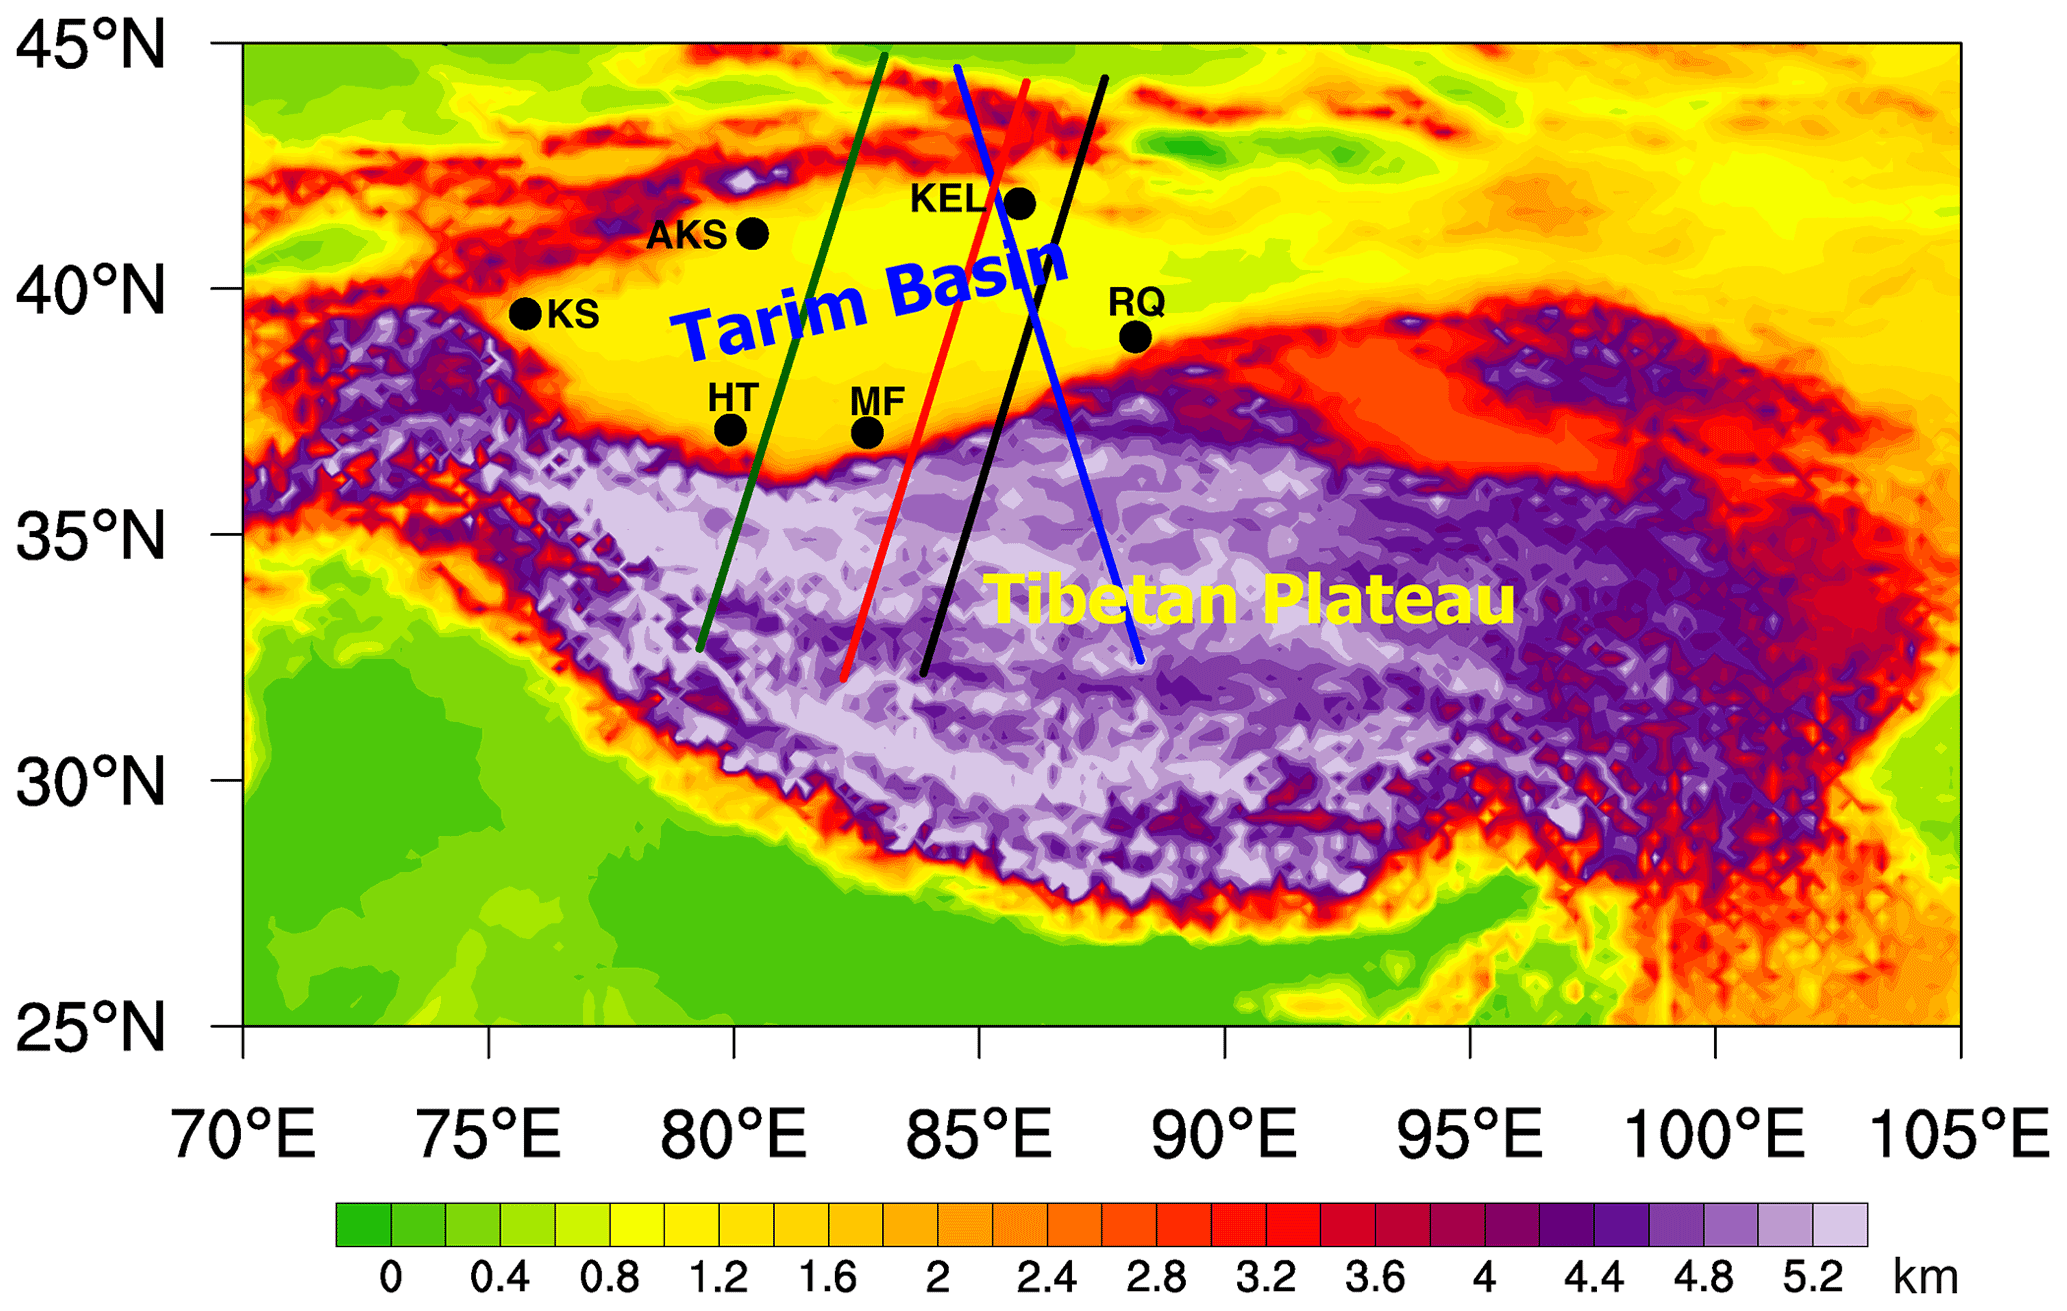
Figure 1Topographical map of the study domain and distribution of the stations in the Tarim Basin (TB). The contours of the terrain height are in kilometers above mean sea level (). The solid lines indicate the trajectory of the CALIPSO satellite over the TB on 4 July (20:22 UTC; black line), 5 July (07:02 UTC; red line), 25 July (20:40 UTC; blue line), and 27 July (20:28 UTC; green line) 2016, of which 4 and 5 July were characterized by dusty weather, while 25 and 27 July were clear days.
2.2 Reanalysis data
We also used The Fifth-Generation European Centre for Medium-Range Weather Forecasts (ECMWF) Reanalysis (ERA-5), and Modern-Era Retrospective Analysis for Research and Applications, Version 2 (MERRA-2) reanalysis data for the spring and summer of 2016–2017 are used. The ERA-5 reanalysis data in this study have a 0.5∘ × 0.5∘ latitude/longitude spatial resolution and 37 pressure levels in the vertical direction. The MERRA-2 data are collected on a regular latitude-by-longitude grid of 0.500∘ × 0.625∘ with 42 pressure levels in the vertical direction. The temporal resolutions of air temperature from the two sets of reanalysis are 1 month. The ERA-5 data are the latest global atmospheric reanalysis produced by the ECMWF based on the Integrated Forecasting System (IFS) Cy41r2 (Hersbach et al., 2020). Notably, ERA-5 data were generated from an ECMWF IFS spectral model and did not yet assimilate the impact of aerosols on meteorology (Simmons, 2006). Therefore, if the effects of aerosols are not considered in the reanalysis model, the modeling error will be underestimated, which could somehow reflect the error induced by dust aerosols in the reanalysis field. The MERRA-2 data are an update of NASA's previous satellite reanalysis system and include additional observations and improvements on the Goddard Earth Observing System, Version 5 (GEOS-5) Earth-system model. The MERRA-2 data are different from the ERA-5 data, since aerosols and their interactions with weather and climate have been considered (Randles et al., 2017).
2.3 Satellite data
CALIPSO was launched on 28 April 2006, for studying the impact of clouds and aerosols on the Earth's radiation budget and climate. The CALIPSO satellite includes the following three instruments: the Cloud–Aerosol Lidar with Orthogonal Polarization (CALIOP), the Imaging Infrared Radiometer (IIR), and the Wide Field Camera (WFC). In this study, the CALIPSO Level 1B and Level 2 Vertical Feature Mask (VFM) datasets (i.e., aerosol profile), containing the half-orbit (i.e., day or night) of calibrated and geolocated single-shot (i.e., highest resolution) lidar profiles, were used for detecting dust events. The CALIPSO Level 1B product provides profiles of the total attenuated backscatter at 532 and 1064 nm; the feature classification from CALIPSO Level 2 VFM was used for distinguishing the types of aerosols. The seasonally averaged CALIPSO Level 2 VFM product was used for identifying the top height of the dust profile.
2.4 Method for distinguishing the anomalously warm atmospheric layer
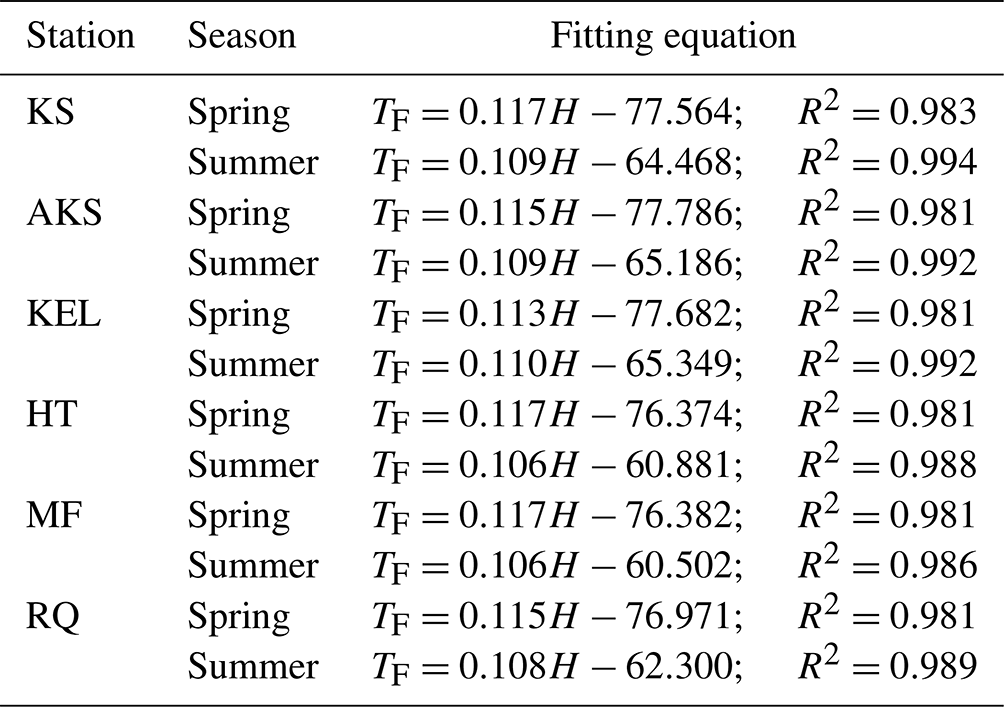
First, based on the radiosonde air-temperature observations from each station in the TB in the spring and summer of 2016–2017, we fitted the air temperature using the following equation:
where TF is the fitted air temperature in ∘C, a is the mean slope, H is the altitude in hPa, and b is a constant. Second, according to Eq. (1), the fitted air-temperature profile was calculated from the altitude data. Table 1 presents the fitting equations for each station.
The air-temperature difference ΔT was calculated by comparing the radiosonde observations with the fitted air temperature:
where TO is the radiosonde air temperature and TF is the fitted air temperature based on Eq. (1). This method serves as a good indicator of anomalous air-temperature variations: positive and negative ΔT values indicate that the atmosphere is heating and cooling, respectively, while the absolute values indicate the warming/cooling intensity.
2.5 Method for estimating the dust effect on the air temperature
In the analysis, the dust effect on temperature was estimated based on the observation minus reanalysis (OMR) method proposed by Ding et al. (2013, 2016), which assumes that differences between observations and reanalysis models reflect the impact of unresolved processes. In this sense, investigating the differences between the observations and ERA-5 reanalysis data can provide an opportunity to reveal the heating effect of dust aerosols.
where TO is the radiosonde air temperature and TR is the ERA-5 air temperature, which does not include the impact of dust aerosols and assimilates only limited upper-atmosphere observations (Simmons, 2006); hence, this method is a good indicator of dust heating. The signs and magnitudes of the OMR values have the same meanings as those of ΔT.
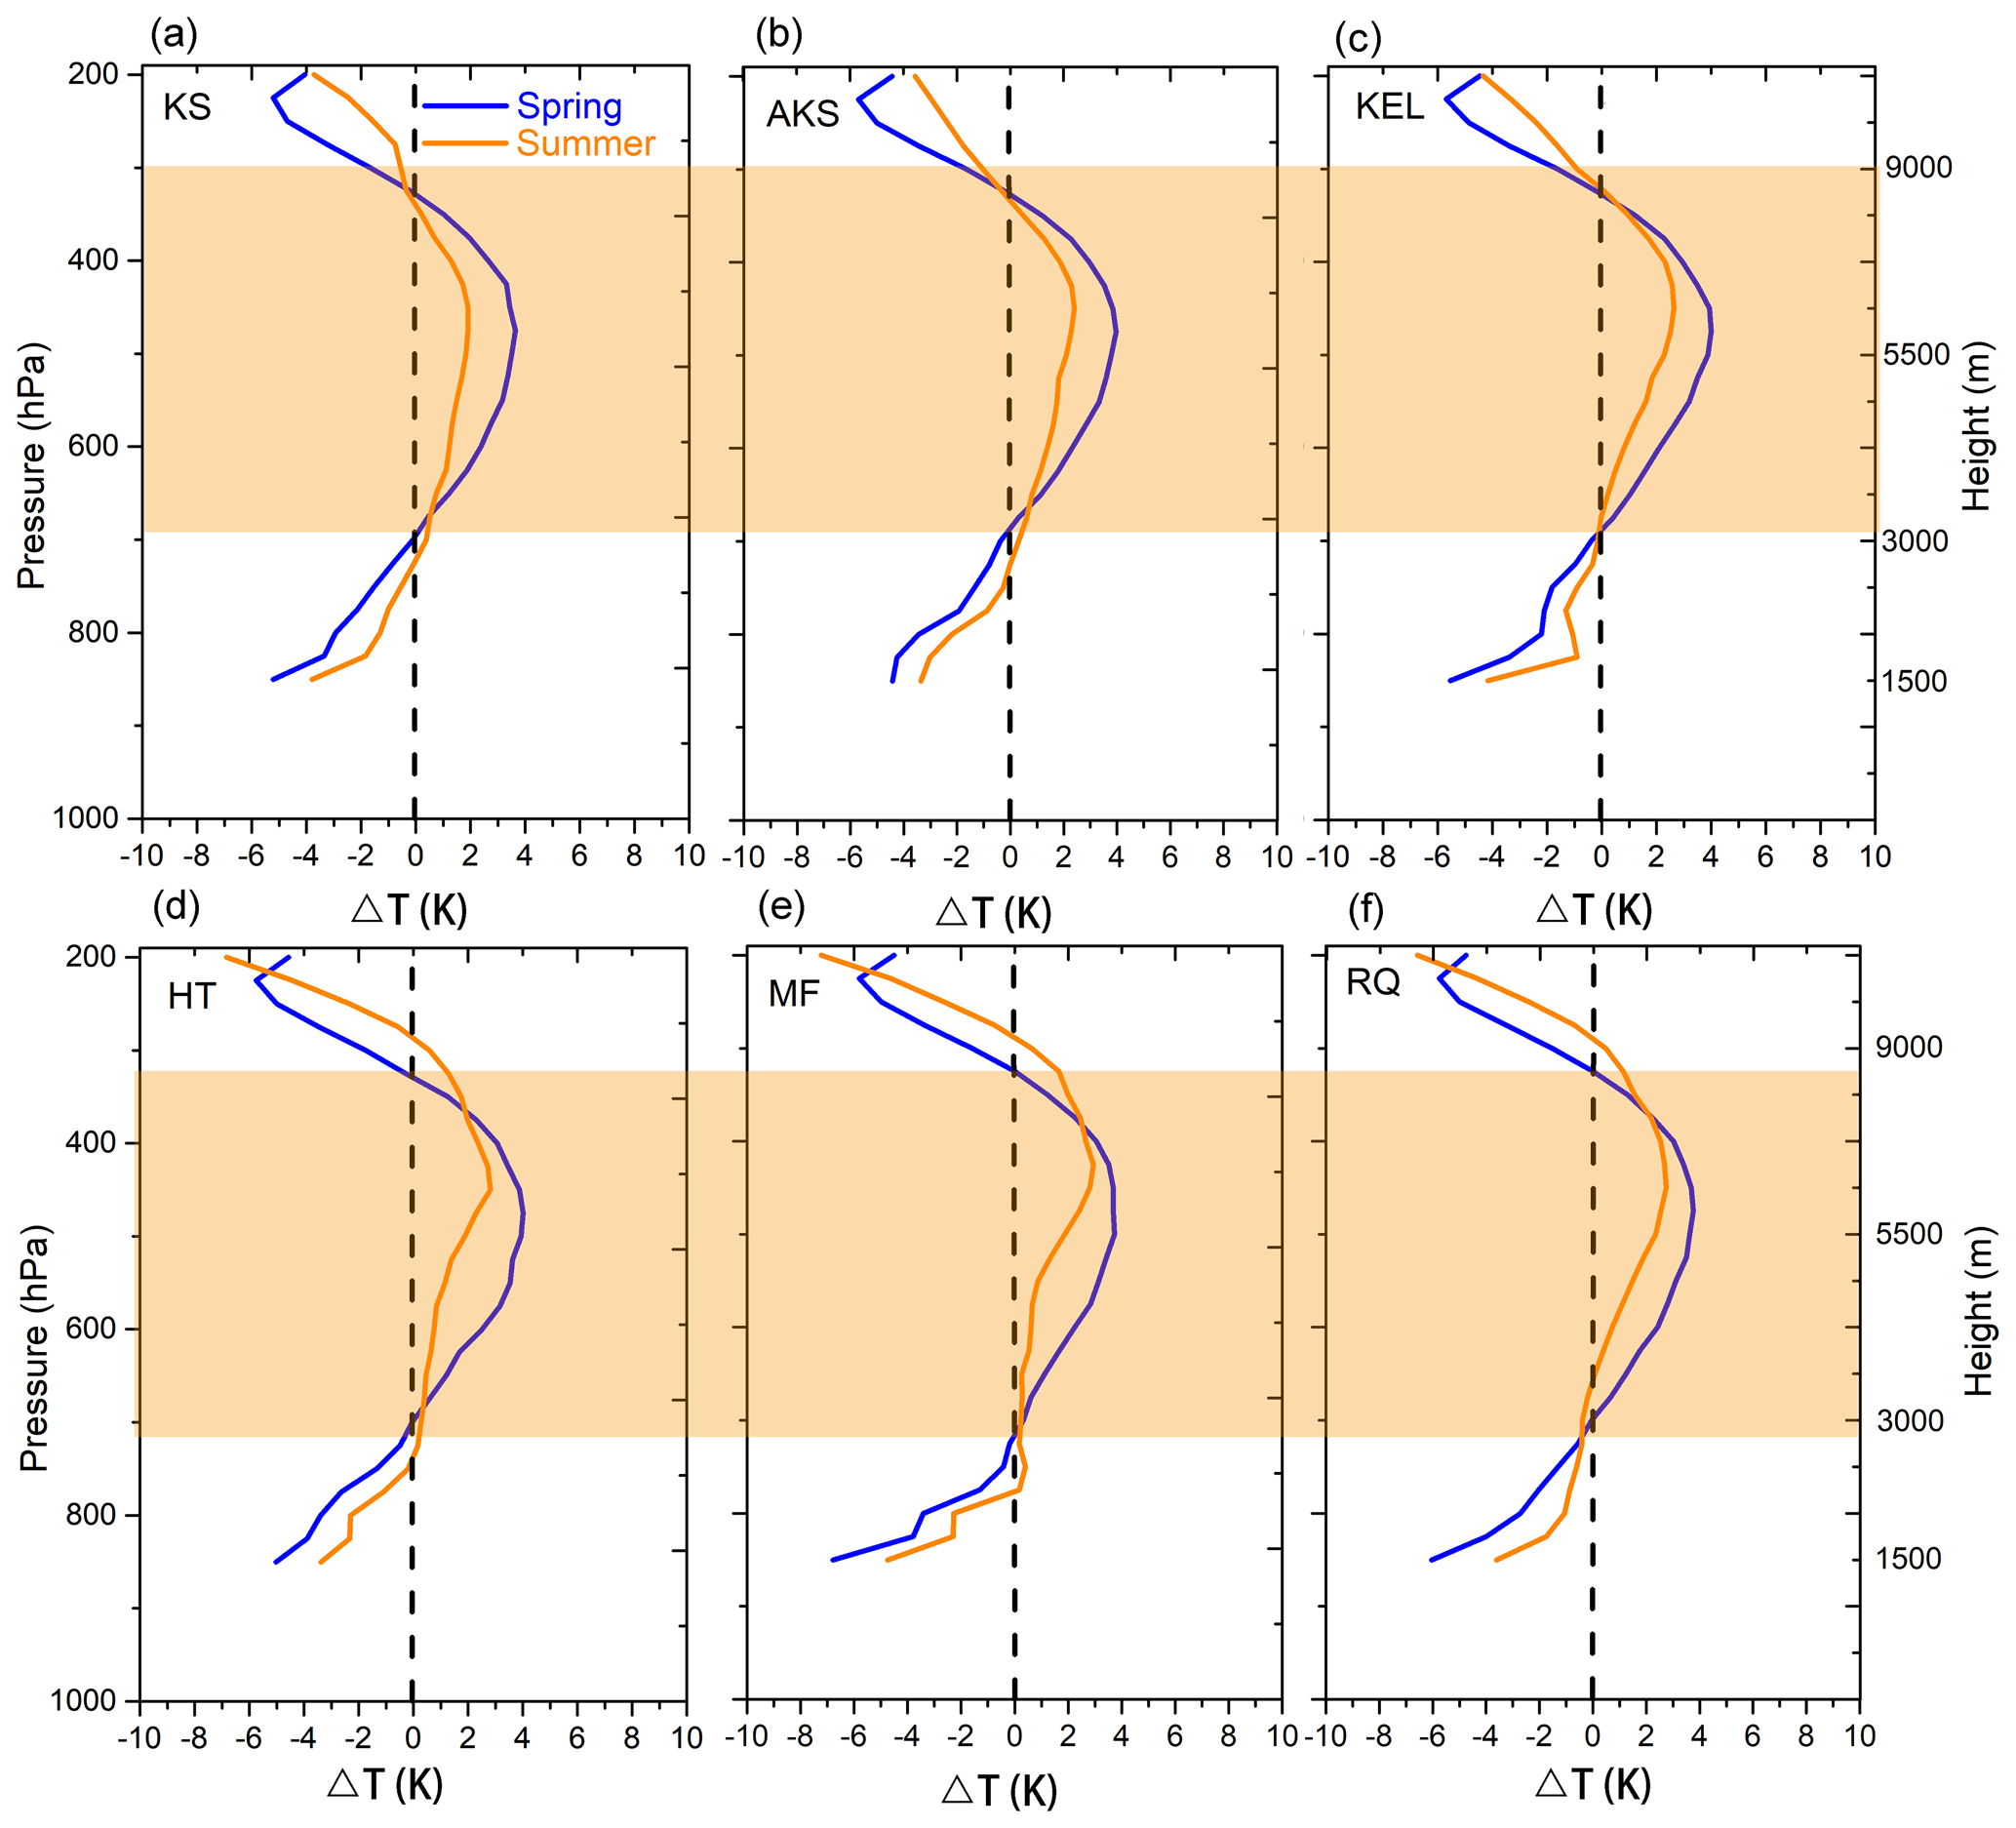
Figure 2Temperature-difference (ΔT) profiles in the spring and summer of 2016–2017 at the (a) Kashi (KS), (b) Akesu (AKS), (c) Kuerle (KEL), (d) Hetian (HT), (e) Minfeng (MF), and (f) Ruoqiang (RQ) radiosonde stations. Shadings indicate the layer with positive ΔT.
3.1 Anomalously warm layer over the TB
In the troposphere, air temperature (hereinafter referred to simply as temperature) generally decreases linearly with increasing altitude; however, temperature exhibited an anomalous lapse rate over the TB. Figure 2a–f present profiles of the temperature difference (ΔT) between the radiosonde observations (TO) and the fitted air temperature (TF) (see Sect. 2) at the KS, AKS, KEL, HT, MF, and RQ stations in the spring and summer of 2016–2017. A relatively warm layer is observed between 700 and 300 hPa in the spring and summer over the TB (shading in Fig. 2a–f); however, the temperature differences exhibit obvious discrepancies among the stations. According to the locations of the six observational stations (Fig. 1), we divided the TB into northern (i.e., KS, AKS, and KEL) and southern (i.e., HT, MF, and RQ). In the northern TB, although the height of the warm layer was consistent between the two seasons, the warming in spring was more intense than the one in summer. Conversely, in the southern TB, the warming in summer extended to altitudes beyond the ones it reached in spring, with more pronounced warming at altitudes higher than 400 hPa.
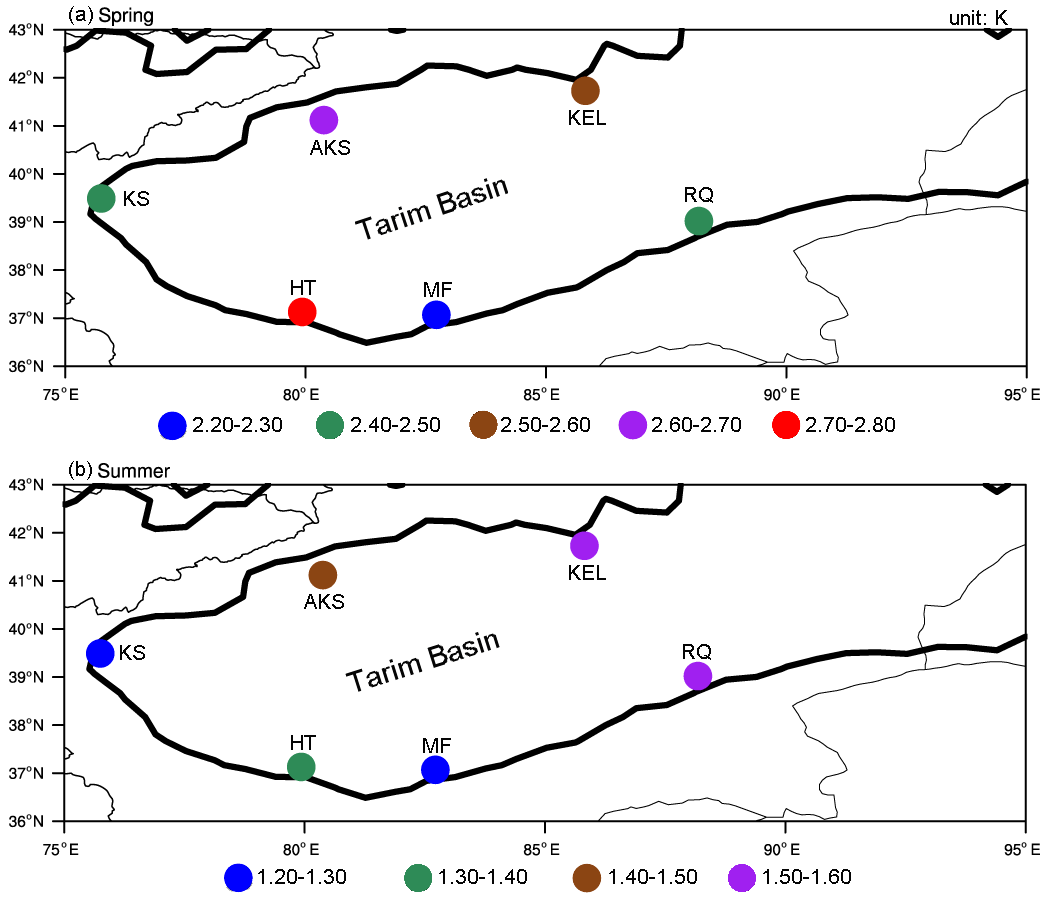
Figure 3Average ΔT between 500 and 300 hPa in (a) spring and (b) summer. Dots indicate the site locations, while different colors indicate different heating intensities.
In this study, we focused mainly on temperature anomalies at 500–300 hPa altitude. The mean ΔT values between 500 and 300 hPa at each station in spring and summer are shown in Fig. 3a and b, respectively. In spring, the ΔT values at each station were positive and ranged from 2.29 to 2.73 K, with a 2.53 K mean; in summer, the ΔT values were smaller than those in spring, varying from 1.21 to 1.57 K, with a 1.39 K mean. Overall, an anomalously warm layer was identified between 500 and 300 hPa over the TB.
3.2 Distribution of dust aerosols in the warm layer over the TB
Dust aerosols are the principal particulate type in the atmosphere over the TB (Cheng et al., 2020). The distribution of dust aerosols is key for evaluating their radiative forcing. We analyzed the vertical distribution and variation in dust based on the CALIPSO Level 1B and 2 VFM datasets over the TB and determined the distribution of the top height of the dust profile over the TB.
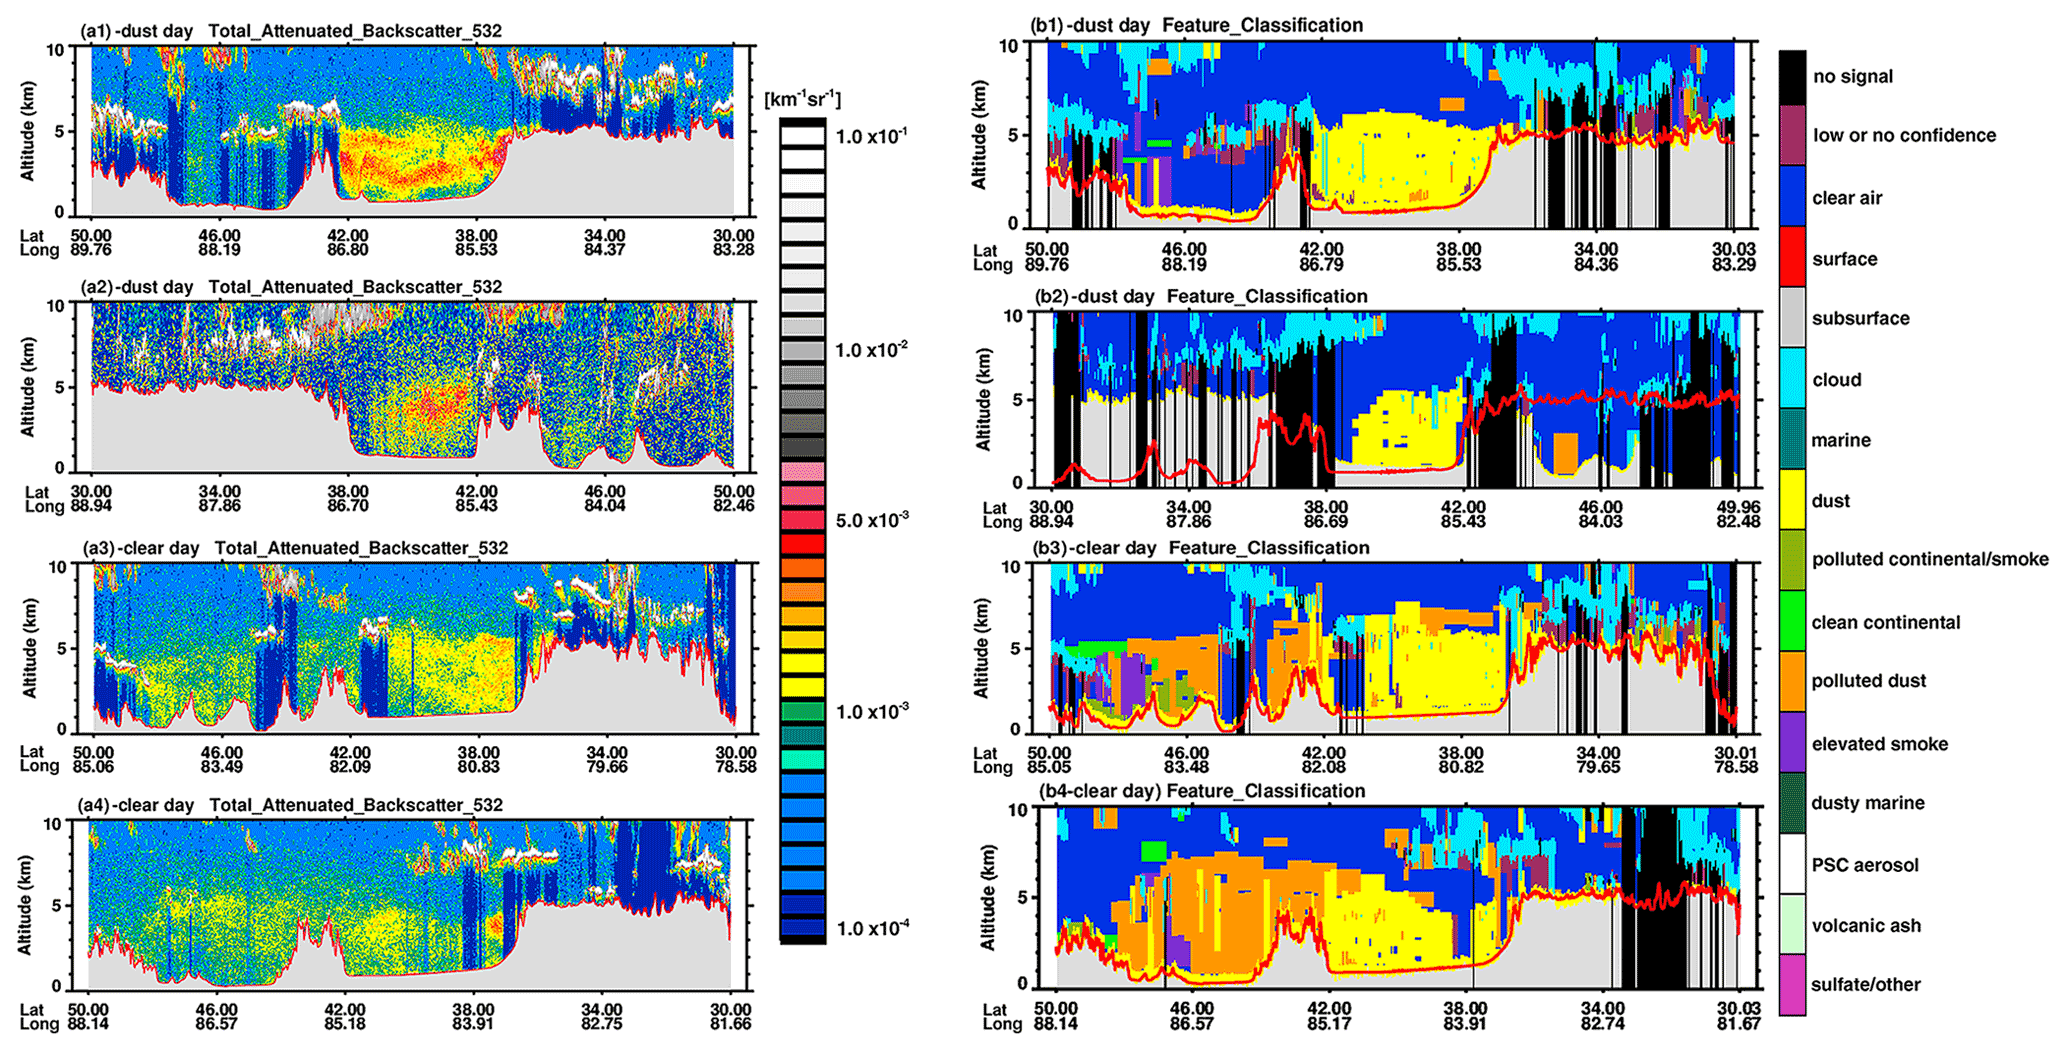
Figure 4The altitude–orbit cross section of the 532 nm total attenuated backscattering intensity (left panels) and classified particles (right panels) on (a1 and b1) 4 July, (a2 and b2) 5 July, (a3 and b3) 25 July, and (a4 and b4) 27 July 2016, along the trajectory of the CALIPSO satellite over the Tibetan Plateau, as presented in Fig. 1. Gray shadings indicate the topography.
The CALIPSO product, which documents aerosols over bright surfaces and beneath thin clouds in clear skies (Vaughan et al., 2004; Winker et al., 2006), was used for identifying dust aerosols. We used the total attenuated backscatter coefficient at 532 nm for classifying particles from CALIPSO and identifying dust aerosols. To identify dust aerosols, values of 0.0008–0.0480 were chosen as the thresholds for the total attenuated backscatter (Liu et al., 2015; Jia et al., 2015). The left panels of Fig. 4 show the CALIPSO orbit–altitude cross section of the 532 nm total attenuated backscattering coefficient on 4, 5, 25, and 27 July 2016, along the CALIPSO trajectory presented in Fig. 1. The gray shading in Fig. 4 indicates the topography, while the deep blue area denotes the absence of a signal owing to clouds, which the laser could not penetrate. As shown in Fig. 4 (left panels), the total attenuated backscatter ranged from 0.002–0.005 . Based on the thresholds for identifying dust aerosols, 4 and 5 July 2016 were 2 severely dusty days. Meanwhile, the dust layer was also evident on clear days; however, its range and intensity were reduced compared with dusty days.
CALIPSO data revealed that vertically extended dust layers were widespread throughout the TB with peak lidar returns between 2.5 and 5.5 km above mean sea level due to strong convective activity during dusty as well as clear days (Cheng et al., 2020); this is consistent with other studies (Huang et al., 2009; Liu et al., 2015). The right panels of Fig. 4 also show that thick dust plumes were present over the entire TB. Moreover, the geographic setting of the TB, which is surrounded by high mountains, generates atmospheric circulation that favors the formation of long-lasting suspended dust (Tsunematsu et al., 2005).
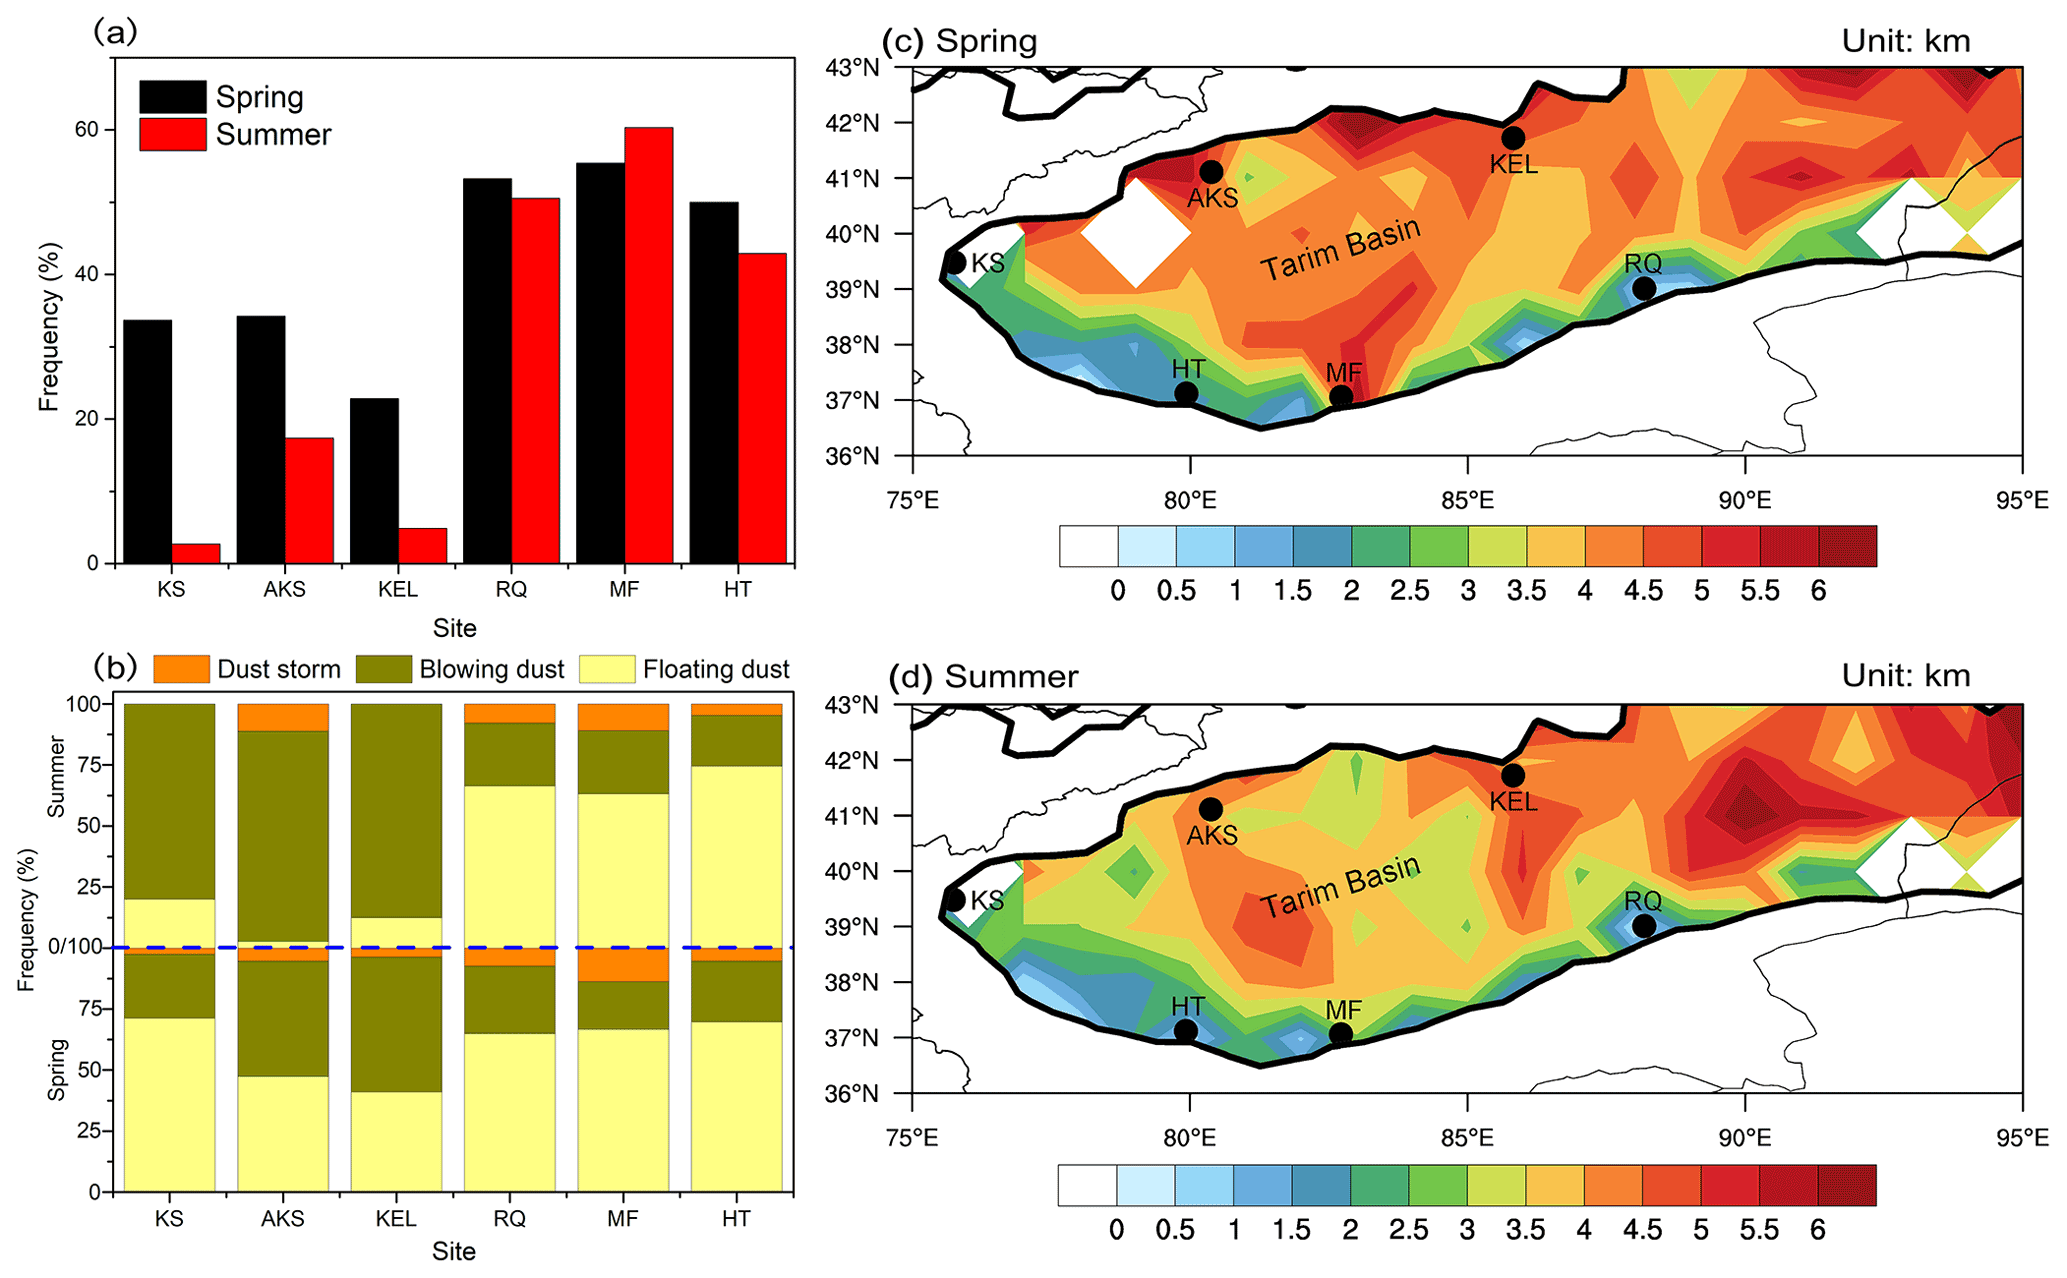
Figure 5Frequencies of (a) dust events and (b) dust events including dust storms and cases of blowing and floating dust at the Kashi (KS), Akesu (AKS), Kuerle (KEL), Hetian (HT), Minfeng (MF), and Ruoqiang (RQ) stations in the spring and summer of 2016–2017; the blue dashed line represents the boundary between spring and summer. Seasonal distribution of the dust-top height in kilometers over the Tarim Basin in (c) spring and (d) summer, inferred from CALIPSO.
Figure 5a presents the frequencies of dust events observed by ground stations in the spring and summer of 2016–2017 throughout the TB. The frequencies of dust events at the MF, HT, RQ, KS, KEL, and AKS stations were 55.43 %, 50.00 %, 53.26 %, 33.70 %, 22.83 %, and 34.24 % in spring and 60.33 %, 42.93 %, 50.54 %, 2.72 %, 4.89 %, and 17.39 % in summer, respectively. Therefore, the frequencies of dust events in the southern TB were obviously higher than those in the northern TB. Here, dust events include dust storms and cases of blowing and floating dust; of these dust events, cases of floating dust constitute the majority, accounting for more than 50 % in the southern TB (Fig. 5b). These results are consistent with the findings of Zhou et al. (2020). This is because when cold air streams with different intensities intrude into the TB, the wind fields converge strongly and rise in the areas of the HT and MF stations; hence, these areas experience dusty weather more frequently than the other areas (Han et al., 2005).
Information on the dust-top height (DTH) can elucidate the vertical structure of dust. The DTH is defined as the height above the surface elevation and exhibits significant seasonal variations over the TB, as shown in Fig. 5c–d, where the blank area represents the default observed value. Over the TB, DTH in spring was higher than that in summer, with a 3.0–5.5 km range. We note that the variations here resemble those of the boundary-layer height (BLH) (Luo et al., 2017). A previous study suggested that the BLH is essential for determining the vertical distribution of dust in the TB (Li et al. 2021). In contrast to urban districts (Ding et al. 2016; Huang et al. 2018), the BLH in the TD was especially high, i.e., higher than 5 km, according to sounding data obtained from a month-long intensive field campaign conducted in July 2016 (Wang et al., 2019).
According to the above, spring and summer are the seasons when dusty weather occurs more frequently in the TB, especially in its southern part, while dust can be suspended in the upper layer for a long time. As an important component of absorbing aerosols, dust aerosols constitute an elevated heat source in the atmosphere (Lau et al., 2006), and we reveal the contribution of suspended dust to the anomalously warm layer over the TB based on in situ observations in the following.
3.3 Spatial and temporal features of the heating effect of dust aerosols
Previous studies reported that the dust emitted from the TD has anomalously strong optical absorption properties and, thus, pronounced heating ability (Ge et al., 2010; Huang et al., 2015). Based on the OMR method (see Sect. 2), we estimated the effects of dust aerosols on the temperature; for this, we used radiosonde observations and ERA-5 reanalysis data. The ERA-5 reanalysis data likely involve a certain amount of errors; however, they are widely used and are considered to be reliable (Hersbach et al., 2020).
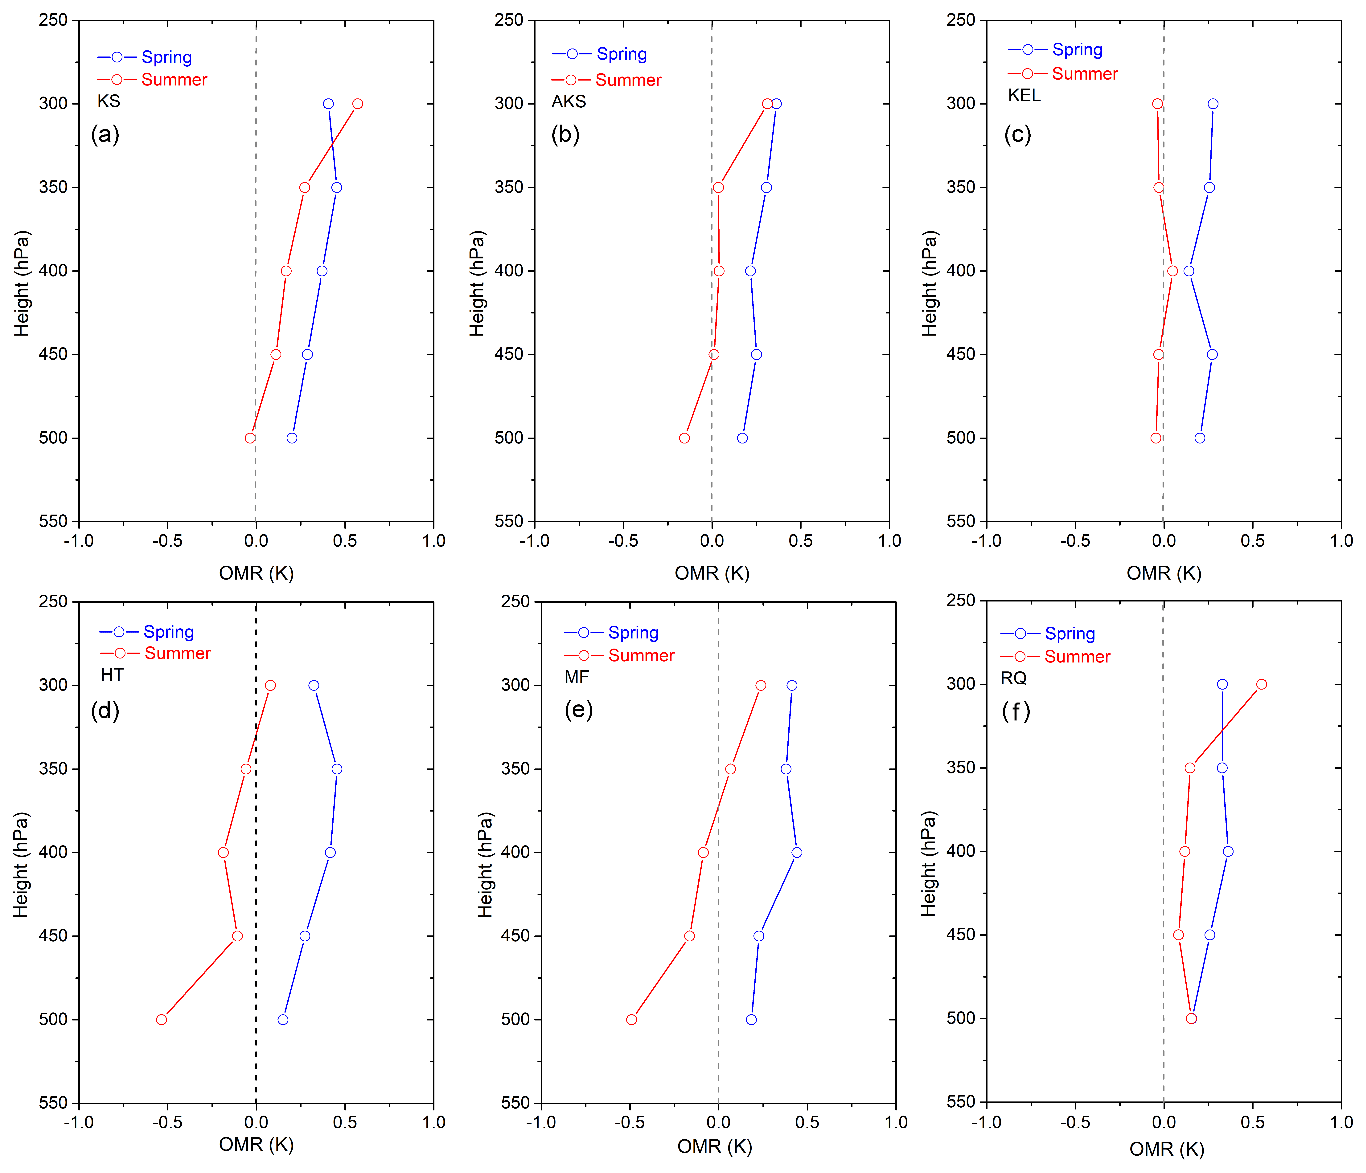
Figure 6Profiles of the temperature difference (radiosonde observations minus ERA-5 data) in the spring and summer of 2016–2017 at the (a) Kashi (KS), (b) Akesu (AKS), (c) Kuerle (KEL), (d) Hetian (HT), (e) Minfeng (MF), and (f) Ruoqiang (RQ) radiosonde stations.
In this study, we focused mainly on temperature anomalies at 500–300 hPa altitude. Figure 6 presents the vertical profiles of the temperature difference between the radiosonde observations and ERA-5 data at 500–300 hPa altitude in the spring and summer of 2016–2017. As mentioned in Sect. 2, the effect of aerosols on the temperature can somehow be inferred by calculating the OMR value. As shown in Fig. 6, dust can heat the atmosphere between 500 and 300 hPa over the TB in spring and summer; however, there are clear temporal and spatial variations.
In spring, all stations recorded heating between 500 and 300 hPa with a 0.30 K mean OMR value. The initial height of the warm layer in summer was higher than that in spring, particularly at the HT and MF stations. The average OMR values indicated that the warm layer was between 400 and 300 hPa, with a 0.13 K mean intensity. Results showed that the heating intensity in summer was significantly weaker than that in spring. In the southern TB, the average OMR values of the warm layer in spring and summer were 0.31 and 0.17 K, respectively; in the northern TB, the average OMR values of the heating layer in spring and summer were 0.28 and 0.12 K, respectively. Therefore, the heating intensity in the southern TB was stronger than that in the northern TB.
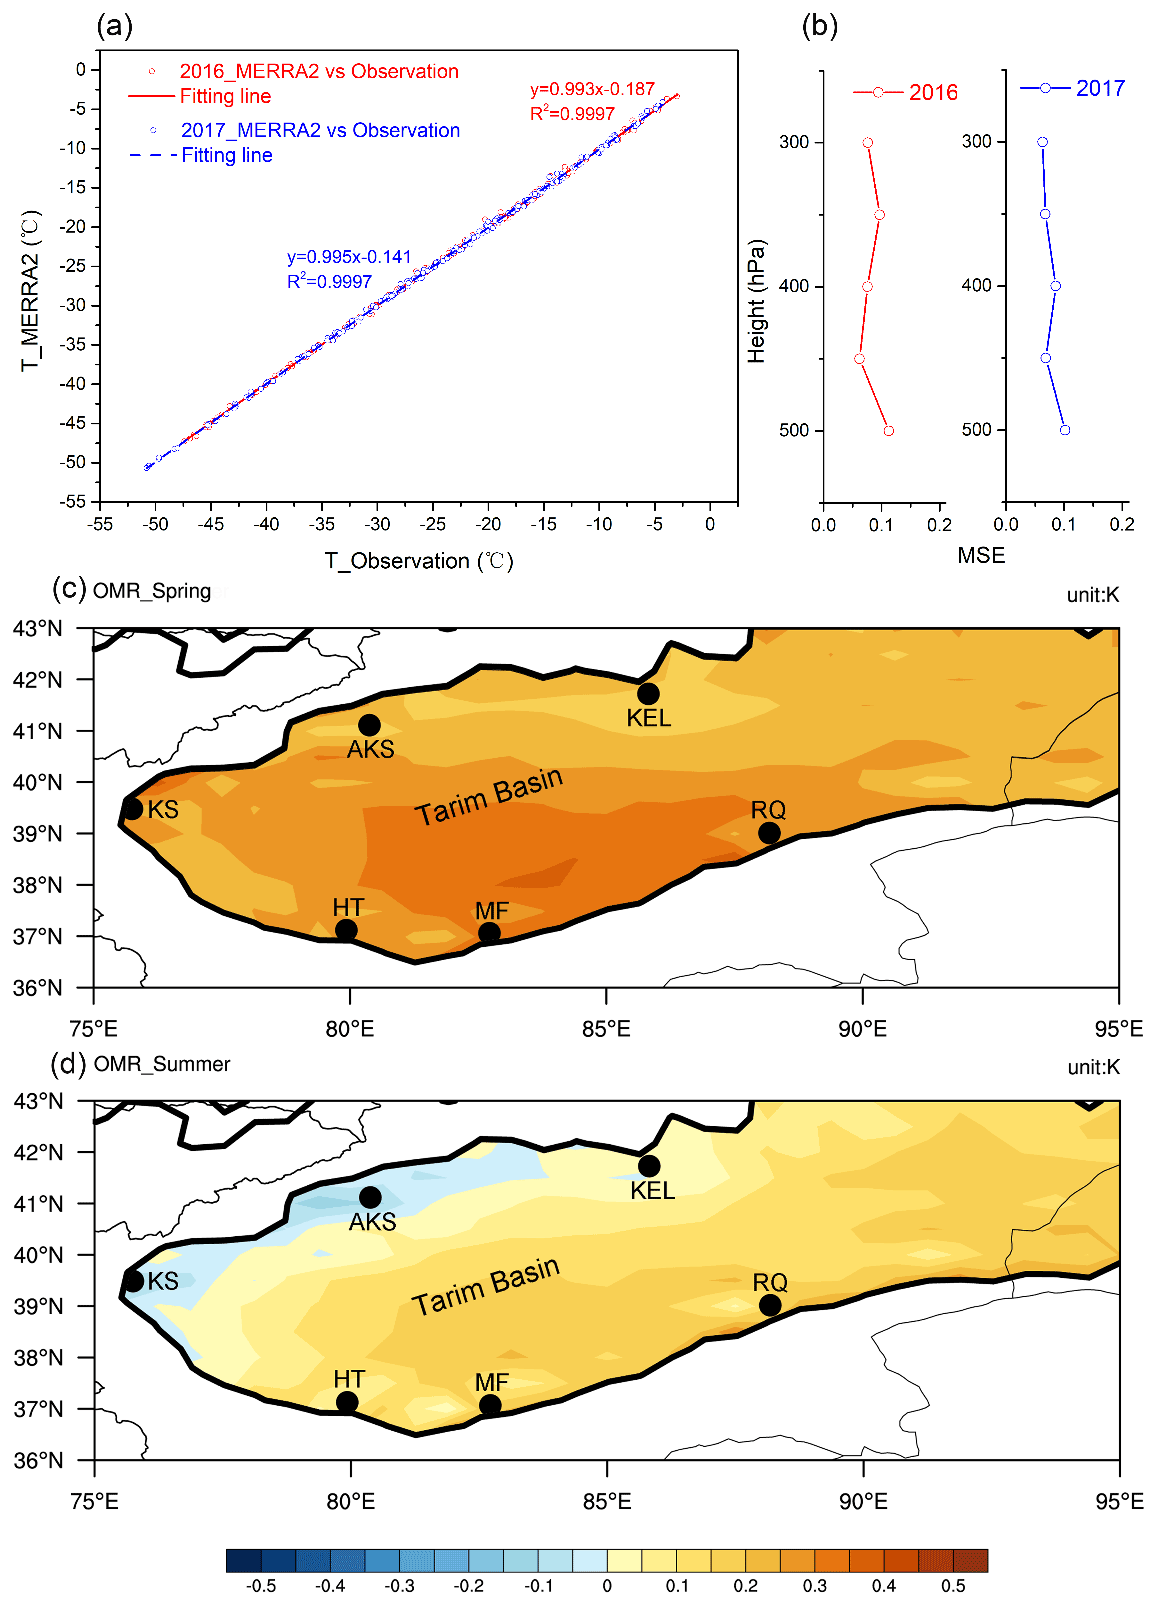
Figure 7(a) Relationship between radiosonde temperature observations and MERRA-2 data at 500–300 hPa altitude in the spring and summer of 2016–2017. (b) Mean square errors (MSEs) between the radiosonde observations and MERRA-2 data at each layer between 500 and 300 hPa. Distributions of the temperature difference between MERRA-2 and ERA-5 data (OMR) averaged over 500–300 hPa in the (c) spring and (d) summer of 2016–2017. Black dots indicate the site locations.
Although the heating effect of suspended dust over the TB was confirmed through the in situ observations, we were unable to evaluate it in its entirety due to the limited number of stations. To address this issue, we used the MERRA-2 reanalysis data to supplement the observation data. The main reasons for this were the following: first, one of the advantages of the MERRA-2 data is the assimilation of aerosol observations, which provides a multidecadal reanalysis in which aerosol and meteorological observations are jointly assimilated within a global data-assimilation system (Gelaro et al., 2017); more importantly, MERRA-2 considers the interactions of aerosols with weather and climate (Randles et al., 2017). Then, Fig. 7a shows the relationship between radiosonde temperature observations and MERRA-2 data at 500–300 hPa altitude in the spring and summer of 2016–2017. The linear fitting slopes between the radiosonde temperature observations and MERRA-2 reanalysis data were 0.993 and 0.995 in 2016 and 2017, respectively, with coefficients of determination (R2) equal to 0.997. In addition, we calculated the mean square error (MSE) between the radiosonde observations and MERRA-2 data for each layer between 500 and 300 hPa in 2016–2017 (Fig. 7b). We used the MSE for measuring the deviation of the two datasets and found that the MSE of each layer was between 0.06 and 0.10. Therefore, it is feasible to use MERRA-2 data as observations for analyzing the heating effect of suspended dust over the entire TB.
Figure 7c and d show the distributions of the OMR values averaged over 500 and 300 hPa in the spring and summer of 2016–2017. The mean OMR values between 500 and 300 hPa were relatively high in the southern TD both in spring and summer, which is consistent with the dust occurrence frequency (Fig. 5a and b). Accordingly, the heating intensity by dust was greater in spring (with approximately +0.45 K maximum) than in summer (with approximately +0.25 K maximum). In summary, dust aerosols can exert a heating effect and are responsible for the atmospheric warming between 500 and 300 hPa over almost the entire TB. The results demonstrate clearly that dust can heat the upper atmosphere over the TB; suspended dust serves as a critical “bridge”. This is a unique atmospheric phenomenon in China.
Table 2Contribution of suspended dust to the anomalously warm atmospheric layer at 500–300 hPa altitude over the TB.
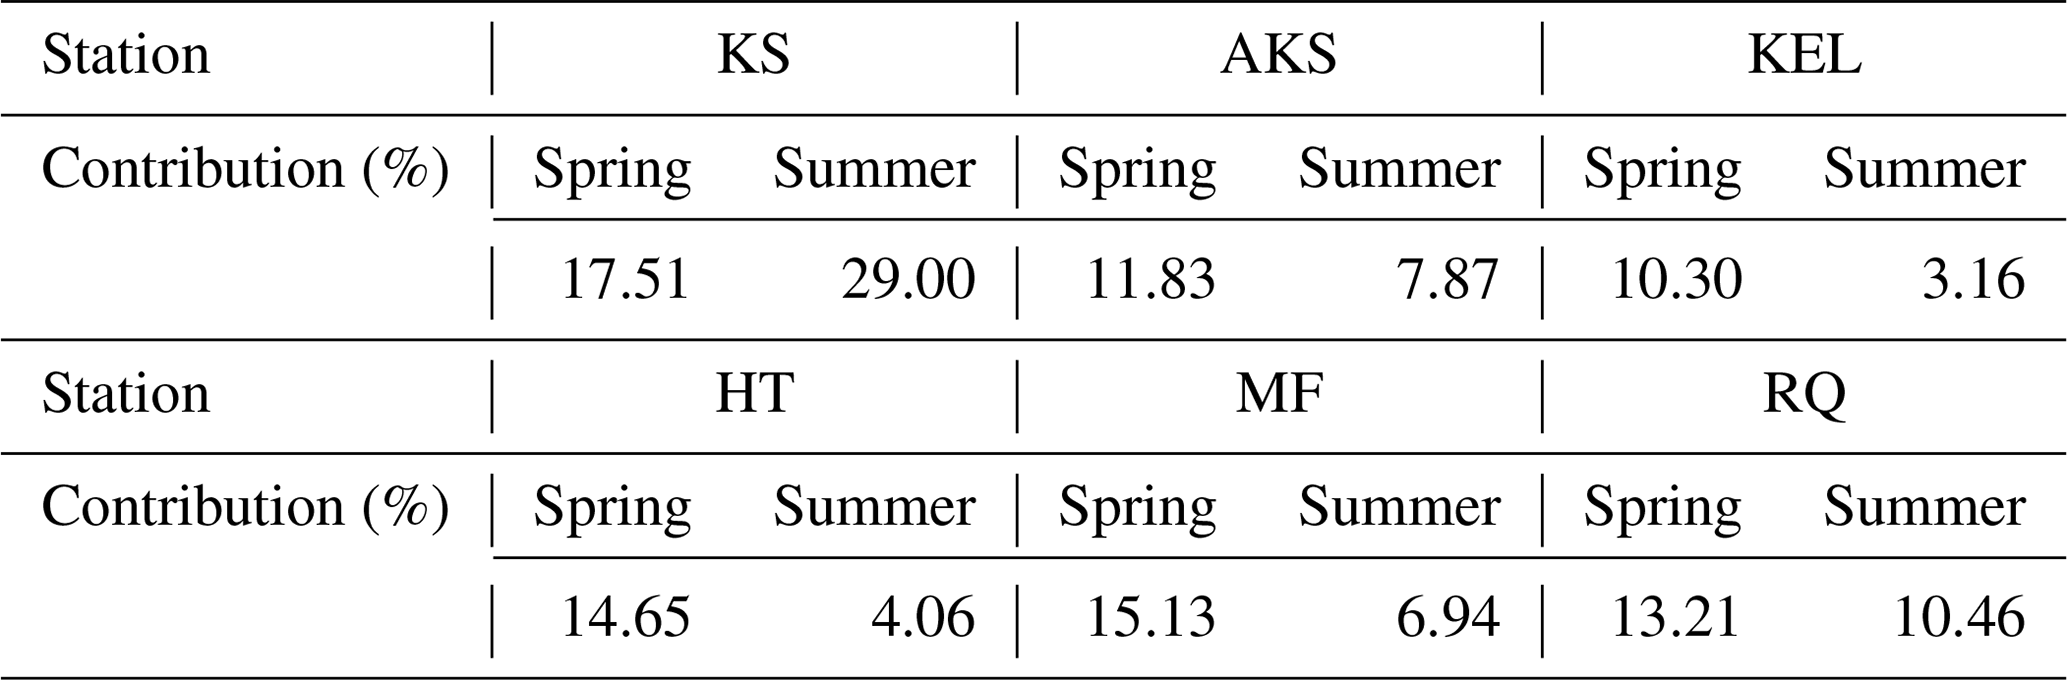
Combined with Figs. 2 and 6, Table 2 shows the contribution of suspended dust to the abnormal heating layer at 500–300 hPa altitude over the TB, with 13.77 % and 10.25 % average contributions in spring and summer, respectively. It is clear that the dust radiative forcing contributes heat to the warm layer over the TB. In fact, we found that the water vapor at 4–7 km altitude (i.e., almost at the same height as that of the dust layer) was nearly saturated during the daytime over the TB (not shown). The water vapor would absorb solar radiation and heat the atmosphere; hence, it may be an important heat contributor to the warm layer over the TB. Furthermore, the radiative properties of the surface, atmospheric trace gases, and clouds also influence the aerosol–radiation interactions (IPCC, 2013). Therefore, the warm layer over the TB is likely a result of multiple factors. There are still many unknown issues that warrant further research.
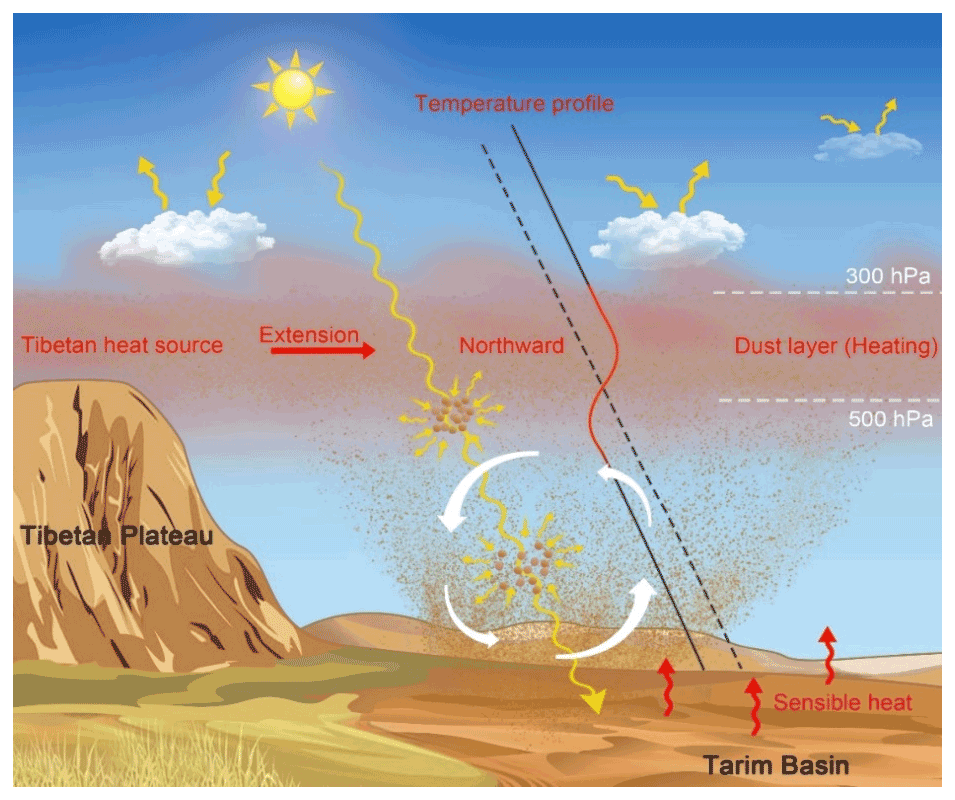
Figure 8Conceptual scheme of the northward extension of the Tibetan heat source, which is partially attributed to the heating effect of suspended dust aerosols over the Tarim Basin. Solid and dashed lines represent the dust-influenced and dust-free temperature profiles, respectively. Yellow arrows denote solar radiation, including the components reflected and absorbed by clouds, dust aerosols, and the surface. Red arrows at the surface denote sensible heat. White solid arrows denote turbulent and convective mixing in the planetary boundary layer. White dashed lines indicate the altitude.
3.4 Concept of the northward extension of the Tibetan heat source
The above results show that there is a suspended dust layer over the TB in spring and summer (Figs. 4 and 5), which changes the temperature stratification (Fig. 6), and a heating layer appears between 300 and 500 hPa with approximately +0.45 and +0.25 K maximums in spring and summer, respectively, covering almost the entire basin (Fig. 7c and d). Topographically, the TB is adjacent to the TP (Fig. 1), which acts as an elevated heat source in spring and summer (Duan et al., 2013; Wonsick et al., 2014). The warm atmospheric layer over the TB seems a northward extension of the Tibetan heat source; therefore, we propose the concept of the northward extension of the Tibetan heat source, as illustrated in Fig. 8. Considering the important roles of TP and TB in affecting the climate along the Silk Road Economic Belt (Liu et al., 2020; Zhao et al., 2020), more attention is required regarding the impact of the northward extension of the Tibetan heat source on the regional climate. Moreover, the northward extension of the Tibetan heat source can be attributed to extreme weather conditions. In recent years, heavy precipitation events have occurred frequently in Xinjiang; e.g., the KS, AKS, and HT stations recorded an extreme precipitation event, lasting for more than 100 h from 15 to 21 May 2018, during which precipitation broke the annual historical extremum in many places, while seriously endangering the local economy and people's lives. The northward extension of the Tibetan heat source and its thermal effect on regional precipitation anomalies in spring and summer require further analysis. Therefore, a comprehensive study of the influence of the northward extension of the Tibetan heat source on regional weather and climate is necessary.
Dust aerosols can warm the climate, but the net influence of dust aerosols on global climate is rather uncertain (Penner, 2019). Aerosol–radiation interactions require knowledge of the spectrally varying aerosol extinction coefficient, single-scattering albedo, and phase function (McComiskey and Feingold, 2008; Loeb and Su, 2010; Kahn, 2012), which can, in principle, be estimated from the aerosol size distribution, shape, chemical composition, and mixing state (Sicard et al., 2014; Lacagnina et al., 2015; Li and Sokolik, 2018). This leads to large uncertainties in quantifying the dust radiative effect in models. In contrast to other studies (Gu et al., 2006, 2016; Lau et al., 2006; Huang et al., 2009), this is the first in situ observational evidence on the heating effect of dust aerosols over the Tarim Basin (TB). Although we avoided these complex processes, it is undeniable that errors still exist. The main conclusions are as follows.
A relatively warm layer was observed between 700 and 300 hPa in spring and summer over the TB. We focused on the temperature anomalies at 500–300 hPa altitude, and found that, in spring, the ΔT values at each station were positive, ranging between 2.29 and 2.73 K; in summer, the ΔT values were smaller than those in spring, ranging between 1.21 and 1.57 K.
Dust can heat the layer between 500 and 300 hPa in spring and summer over the TB; this heating effect exhibits clear temporal and spatial variations. The heating intensity in summer (i.e., 0.13 K mean OMR value) was significantly weaker than that in spring (i.e., 0.30 K mean OMR value). In the southern TB, the average OMR values of the heating layer were 0.31 and 0.17 K in spring and summer, respectively; in the northern TB, the average OMR values of the heating layer were 0.28 and 0.12 K in spring and summer, respectively. Dust radiative forcing was one of the heat contributors to the warm layer over the TB. Topographically, the TB is adjacent to the Tibetan Plateau, which acts as an elevated heat source in spring and summer. The warm atmospheric layer over the TB seems to be a northward extension of the Tibetan heat source. Therefore, in this study, we proposed the concept of the northward extension of the Tibetan heat source.
The data and data analysis method are available upon request.
The ERA-5 reanalysis data are available from ECMWF at https://cds.climate.copernicus.eu/cdsapp#!/dataset/reanalysis-era5-pressure-levels-monthly-means?tab=form (CSD, 2022). MERRA-2 reanalysis data were provided by the NASA Goddard Earth Science Data and Information Services Center through the NASA GES DISC online archive at https://gmao.gsfc.nasa.gov/reanalysis/MERRA-2 (GMAO, 2015). The CALIPSO data were obtained from the National Aeronautics and Space Administration (NASA) Langley Research Center Atmospheric Sciences Data Center at https://asdc.larc.nasa.gov/project/CALIPSO/CAL_LID_L1-Standard-V4-10_V4-10 and https://asdc.larc.nasa.gov/project/CALIPSO/CAL_LID_L2_VFM-Standard-V4-20_V4-20 (Winker, 2016, 2018). The meteorological observation date were supplied by the National Meteorological Information Center at http://data.cma.cn under license and so cannot be made freely available (NMIC, 2021).
YL designed the study and contributed ideas. QZ, QH, and FY conducted the long-term measurements and provided the data. CZ, YL, and TZ interpreted the data. CZ contributed to the interpretation and writing of the paper with contributions from the coauthors.
The contact author has declared that neither they nor their co-authors have any competing interests.
Publisher's note: Copernicus Publications remains neutral with regard to jurisdictional claims in published maps and institutional affiliations.
The authors are grateful to the science teams for providing the accessible data products used in this study.
This work was supported by the National Natural Science Foundation of China (grant no. 42030612) and jointly supported by the Strategic Priority Research Program of the Chinese Academy of Sciences (grant no. XDA2006010301), National Natural Science Foundation of China (grant nos. 41905009, 91744311, 41991231, 91937302, 41975010, 41875019, and 41830968), and the Fundamental Research Funds for the Central Universities (grant no. lzujbky-2020-kb02).
This paper was edited by Aijun Ding and reviewed by two anonymous referees.
Cheng, Y., Dai, T., Li, J., and Shi, G.: Measurement Report: Determination of aerosol vertical features on different timescales over East Asia based on CATS aerosol products, Atmos. Chem. Phys., 20, 15307–15322, https://doi.org/10.5194/acp-20-15307-2020, 2020.
CDS (Copernicus Climate Change Service Climate Data Store): Climate reanalysis, CDS [data set], https://climate.copernicus.eu/climate-reanalysis (last access: 1 September 2021), 2022.
Ding, A. J., Fu, C. B., Yang, X. Q., Sun, J. N., Petäjä, T., Kerminen, V.-M., Wang, T., Xie, Y., Herrmann, E., Zheng, L. F., Nie, W., Liu, Q., Wei, X. L., and Kulmala, M.: Intense atmospheric pollution modifies weather: a case of mixed biomass burning with fossil fuel combustion pollution in eastern China, Atmos. Chem. Phys., 13, 10545–10554, https://doi.org/10.5194/acp-13-10545-2013, 2013.
Ding, A. J., Huang X., Nie, W., Sun, J. N., Kerminen, V. M., Petäjä, T., Su, H., Cheng, Y. F., Yang, X. Q., Wang, M. H., Chi, X. G., Wang, J. P., Virkkula, A., Guo, W. D., Yuan, J., Wang, S. Y., Zhang, R. J., Wu, Y. F., Song, Y., Zhu, T., Zilitinkevich, S., Kulmala, M., and Fu, C. B.: Enhanced haze pollution by black carbon in megacities in China, Geophys. Res. Lett., 43, 2873–2879, https://doi.org/10.1002/2016GL067745, 2016.
Duan, A. M., Wang, M. R., Lei, Y. H., and Cui, Y. F.: Trends in summer rainfall over china associated with the Tibetan Plateau sensible heat source during 1980–2008, J. Climate, 26, 261–275, https://doi.org/10.1175/JCLI-D-11-00669.1, 2013.
Ge, J. M., Su, J., Ackerman, T. P., Fu, Q., Huang, J. P., and Shi, J. S.: Dust aerosol optical properties retrieval and radiative forcing over northwestern China during the 2008 China–U. S. joint field experiment, J Geophys. Res., 115, D00K12, https://doi.org/10.1029/2009JD013263, 2010.
Ge, J. M., Huang, J. P., Xu, C. P., Qi, Y. L., and Liu, H. Y.: Characteristics of Taklimakan dust emission and distribution: a satellite and reanalysis field perspective, J. Geophys. Res., 119, 11772–11783, https://doi.org/10.1002/2014JD022280, 2014.
Gelaro, R., Mccarty, W., Suárez, M., Todling, R., Molod, A., Takacs, L., Randles, C., Darmenov, A., Bosilovich, M., Reichle, R., Wargan, K., Coy, L., Cullather, R., Draper, C., Akella, S., Buchard, V., Conaty, A., Silva, A., Gu, W., Kim, G., Koster, R., Lucchesi, R., Merkova, D., Nielsen, J., Partyka, G., Pawson, S., Putman, W., Rienecker, M., Schubert, S., Sienkiewicz, M., and Zhao, B.: The Modern-Era Retrospective Analysis for Research and Applications, Version 2 (MERRA-2), J. Climate, 30, 5419–5454, https://doi.org/10.1175/JCLI-D-16-0758.1, 2017.
GMAO (Global Modeling and Assimilation Office): Climate reanalysis, GMAO [data set], https://doi.org/10.5067/VJAFPLI1CSIV, 2015.
Gong, S. L., Zhang, X. Y., Zhao, T. L., Mckendry, I. G., Jaffe, D. A., and Lu, N. M.: Characterization of soil dust aerosol in China and its transport and distribution during 2001 ACE-Asia: 2. model simulation and validation, J. Geophys. Res., 108, 4262, https://doi.org/10.1029/2002JD002633, 2003.
Gu, Y., Liou, K. N., Xue, Y., Mechoso, C. R., Li, W., and Luo, Y.: Climatic effects of different aerosol types in China simulated by UCLA general circulation model, J. Geophys. Res., 111, D15201, https://doi.org/10.1029/2005JD006312, 2006.
Gu, Y., Xue, Y., De Sales, F., and Liou, K. N.: A GCM investigation of dust aerosol impact on the regional climate of North Africa and South/East Asia, Clim. Dynam., 46, 2353–2370, https://doi.org/10.1007/s00382-015-2706-y, 2016.
Han, Y. X., Fang, X. M., Song, L. C., Zhang, Q., and Yang, S. L.: A Study of Atmospheric Circulation and Dust Storm Causes of Formation in the Tarim Basin-The Restructured Wind Field by Shapes of Dune and Observed Prevailing Wind, J. Atmos. Sci., 29, 627–635, https://doi.org/10.3878/j.issn.1006-9895.2005.04.14, 2005 (in Chinese).
Hersbach, H., Bell, B., Berrisford, P., Hirahara, S., Horányi, A., Muñoz-Sabater, J., Nicolas. J., Peubey, C., Radu, R., Schepers, D., Simmons, A., Soci, C., Abdalla, S., Abellan, X., Balsamo, G., Bechtold, P., Biavati, G., Bidlot, J., Bonavita, M., Chiara, G., Dahlgren, P., Dee, D., Diamantakis, M., Dragani, R., Flemming, J., Forbes, R., Fuentes, M., Geer, A., Haimberger, L., Healy, S., Hogan, R., Hólm, E., Janisková, M., Keeley, S., Laloyaux, P., Lopez, P., Lupu, C., Radnoti, G., Rosnay, P., Rozum, I., Vamborg, F., Villaume, S., and Thépaut, J.: The ERA5 global reanalysis, Q. J. Roy. Meteor. Soc., 146, 1999–2049, https://doi.org/10.1002/qj.3803, 2020.
Huang, J., Bing, L., Minnis, P., Wang, T., Xin, W., Hu, Y., Yi, Y., and Ayers, J. K.: Satellite-based assessment of possible dust aerosols semi-direct effect on cloud water path over East Asia, Geophys. Res. Lett., 33, L19802, https://doi.org/10.1029/2006GL026561, 2006a.
Huang, J., Minnis, P., Lin, B., Yi, Y., Sunmack, S., and Ayers, K.: Possible influences of Asian dust aerosols on cloud properties and radiative forcing observed from MODIS and CERES, Geophys. Res. Lett., 33, L06824, https://doi.org/10.1029/2005GL024724, 2006b.
Huang, J., Minnis, P., Chen, B., Huang, Z., Liu, Z., Zhao, Q., Yi, Y., and Ayers, J.: Long-range transport and vertical structure of Asian dust from CALIPSO and surface measurements during PACDEX, J. Geophys. Res., 113, D23212, https://doi.org/10.1029/2008JD010620, 2008.
Huang, J., Fu, Q., Su, J., Tang, Q., Minnis, P., Hu, Y., Yi, Y., and Zhao, Q.: Taklimakan dust aerosol radiative heating derived from CALIPSO observations using the Fu-Liou radiation model with CERES constraints, Atmos. Chem. Phys., 9, 4011–4021, https://doi.org/10.5194/acp-9-4011-2009, 2009.
Huang, J., Wang, T., Wang, W., Li, Z., and Yan, H.: Climate effects of dust aerosols over east Asian arid and semiarid regions, J. Geophys. Res., 119, 11398–11416, https://doi.org/10.1002/2014JD021796, 2015.
Huang, J. P., Fu, Q., Zhang, W., Zhang, R., Ye, H., and Warren, S.: Dust and black carbon in seasonal snow across Northern China, B. Am. Meteorol. Soc., 92, 175–181, https://doi.org/10.1175/2010BAMS3064.1, 2011.
Huang X., Wang, Z. L., and Ding, A. J.: Impact of aerosol-PBL interaction on haze pollution: Multiyear observational evidences in North China, Geophys. Res. Lett., 45, 8596–8603, https://doi.org/10.1029/2018GL079239, 2018.
IPCC: Climate Change 2013: The Physical Science Basis. Cambridge University Press, Cambridge, UK, 604 pp., https://doi.org/10.1017/CBO9781107415324, 2013.
Jia, R., Liu, Y., Chen, B., Zhang, Z., and Huang, J.: Source and transportation of summer dust over the Tibetan Plateau, Atmos. Environ., 123, 210–219, https://doi.org/10.1016/j.atmosenv.2015.10.038, 2015.
Jia, R., Liu, Y., Hua, S., Zhu, Q., and Shao, T.: Estimation of the aerosol radiative effect over the Tibetan Plateau based on the latest CALIPSO product, J. Meteorol. Res., 32, 707–722, https://doi.org/10.1007/s13351-018-8060-3, 2018.
Kahn, R.: Reducing the uncertainties in direct aerosol radiative forcing, Surv. Geophys., 33, 701–721, https://doi.org/10.1007/s10712-011-9153-z, 2012.
Lacagnina, C., Hasekamp, O., Bian, H., Curci, G., Myhre, G., van Noije, T., Schulz, M., Skeie, R., Takemura, T., and Zhang, K.: Aerosol single-scattering albedo over the global oceans: Comparing PARASOL retrievals with AERONET, OMI, and AeroCom models estimates, J. Geophys. Res., 120, 9814–9836, https://doi.org/10.1002/2015JD023501, 2015.
Lau, K. M., Kim, M. K., and Kim, K. M.: Asian summer monsoon anomalies induced by aerosol direct forcing: the role of the Tibetan Plateau, Clim. Dynam., 26, 855–864, https://doi.org/10.1007/s00382-006-0114-z, 2006.
Li, L. and Sokolik, I. N.: The dust direct radiative impact and its sensitivity to the land surface state and key minerals in the WRF-Chem-DuMo model: A case study of dust storms in Central Asia, J. Geophys. Res., 123, 4564–4582, https://doi.org/10.1029/2017JD027667, 2018.
Li, Q. H., Zhang, H. S., Cai, X. H., Song, Y., and Zhu, T.: The impacts of the atmospheric boundary layer on regional haze in North China, npj Clim. Atmos Sci., 4, 9, https://doi.org/10.1038/s41612-021-00165-y, 2021.
Liu, D., Zhao, T. L., Richard, B., Chen, S. Y., Lu, Z. Q., Wu, Y., and Zhao, Y.: Vertical Structures of Dust Aerosols over East Asia Based on CALIPSO Retrievals, Remote. Sens.-Basel, 11, 701, https://doi.org/10.3390/rs11060701, 2019.
Liu, Y., Jia, R., Dai, T., Xie, Y., and Shi, G.: A review of aerosol optical properties and radiative effects, J. Meteorol. Res., 8, 1003–1028, https://doi.org/10.1007/s13351-014-4045-z, 2014.
Liu, Y., Sato, Y., Jia, R., Xie, Y., Huang, J., and Nakajima, T.: Modeling study on the transport of summer dust and anthropogenic aerosols over the Tibetan Plateau, Atmos. Chem. Phys., 15, 12581–12594, https://doi.org/10.5194/acp-15-12581-2015, 2015.
Liu, Y. Z., Li, Y. H., Huang, J. P., Zhu, Q. Z., and Wang, S. S.: Attribution of the Tibetan Plateau to northern drought, Natl. Sci. Rev., 7, 489–492, https://doi.org/10.1093/nsr/nwz191, 2020.
Loeb, N. G. and Su, W. Y.: Direct aerosol radiative forcing uncertainty based on a radiative perturbation analysis, J. Climate, 23, 5288–5293, https://doi.org/10.1175/2010JCLI3543.1, 2010.
Luo, H., Han, Y., and Li, Y.: Temporal evolution of the boundary layer height and contribution of dust devils to dust aerosols, China Environ. Sci., 37, 2438–2442, 2017.
McComiskey, A. and Feingold, G.: Quantifying error in the radiative forcing of the first aerosol indirect effect, Geophys. Res. Lett., 35, L02810, https://doi.org/10.1029/2007GL032667, 2008.
NMIC (National Meteorological Information Center): China Meteorological Administration: Surface Observations [data set], http://data.cma.cn (last access: 8 August 2021), 2021.
Penner, J.: Soot, sulfate, dust and the climate—Three ways through the fog, Nature, 570, 158–159, https://doi.org/10.1038/d41586-019-01791-6, 2019.
Randles, C., Silva, A., Buchard, V., Colarco,P., Darmenov, A., Govindaraju, R., Smirnov, A., Holben, B., Ferrare, R., Hair, J., Shinozuka, Y., and Flynn, C.: The MERRA-2 Aerosol Reanalysis, 1980–onward, Part I: System Description and Data Assimilation Evaluation, J. Climate, 30, 6823–6850, https://doi.org/10.1175/JCLI-D-16-0609.1, 2017.
Sicard, M., Bertolín, S., Mallet, M., Dubuisson, P., and Comerón, A.: Estimation of mineral dust long-wave radiative forcing: sensitivity study to particle properties and application to real cases in the region of Barcelona, Atmos. Chem. Phys., 14, 9213–9231, https://doi.org/10.5194/acp-14-9213-2014, 2014.
Simmons, A.: ERA-Interim: New ECMWF reanalysis products from 1989 onwards, ECMWF Newsletter, 110, 25–36, 2006.
Su, Y., Zhao, C., Wang, Y., and Ma, Z.: Spatiotemporal variations of precipitation in China from surface gauge observations from 1961 to 2016, Atmosphere, 11, 303, https://doi.org/10.3390/atmos11030303, 2020.
Sun, Y. and Zhao, C.: Influence of Saharan Dust on the Large-Scale Meteorological Environment for Development of Tropical Cyclone Over North Atlantic Ocean Basin, J. Geophys. Res., 125, E33454, https://doi.org/10.1029/2020jd033454, 2020.
Tsunematsu, N., Sato, T., Kimura, F., Kai, K., Kurosaki, Y., Nagai, T., Zhou, H., and Mikami, M.: Extensive dust outbreaks following the morning inversion breakup in the Taklimakan Desert, J. Geophys. Res., 110, D21207, https://doi.org/10.1029/2005JD005994, 2005.
Vaughan, M. A., Young, S. A., Winker, D. M., Powell, K. A., Omar, A. H., Liu, Z., Hu, Y., and Hostetler, C. A.: Fully automated analysis of space-based lidar data: an overview of the CALIPSO retrieval algorithms and data products, Laser Radar Tech. Atmos. Sens., 5575, 16–30, https://doi.org/10.1117/12.572024, 2004.
Wang, M. Z., Xu, X. D., Xu, H. X., Lenschow, D. H., Zhou, M. Y., Zhang, J. T., and Wang, Y. J.: Features of the deep atmospheric boundary layer over the Taklimakan Desert in the summertime and its influence on regional circulation, J. Geophys. Res., 124, 12755–12772, https://doi.org/10.1029/2019JD030714, 2019.
Wang, S., Wang, J., Zhou, Z., and Shang, K.: Regional characteristics of three kinds of dust storm events in China, Atmos. Environ., 39, 509–520, https://doi.org/10.1016/j.atmosenv.2004.09.033, 2005.
Winker, D.: CALIPSO LID L1 Standard HDF File – Version 4.10, Earth data [data set], https://doi.org/10.5067/CALIOP/CALIPSO/LID_L1-STANDARD-V4-10, 2016.
Winker, D.: CALIPSO Lidar Level 2 Vertical Feature Mask Data V4-20, Earth data [data set], https://doi.org/10.5067/CALIOP/CALIPSO/LID_L2_VFM-STANDARD-V4-20, 2018.
Winker, D., Vaughan, M., and Hunt, B.: The CALIPSO mission and initial results from CALIOP, Proc. SPIE, 6409, 604902, https://doi.org/10.1117/12.698003, 2006.
Wonsick, M. M., Pinker, R. T., and Ma, Y.: Investigation of the “elevated heat pump” hypothesis of the Asian monsoon using satellite observations, Atmos. Chem. Phys., 14, 8749–8761, https://doi.org/10.5194/acp-14-8749-2014, 2014.
Xie, S., Liu, X., Zhao, C., and Zhang, Y.: Sensitivity of CAM5 simulated Arctic clouds and radiation to ice nucleation parameterization, J. Climate, 26, 5981–5999. https://doi.org/10.1175/JCLI-D-12-00517.1, 2013.
Yang, M., Howell, S. G., Zhuang, J., and Huebert, B. J.: Attribution of aerosol light absorption to black carbon, brown carbon, and dust in China – interpretations of atmospheric measurements during EAST-AIRE, Atmos. Chem. Phys., 9, 2035–2050, https://doi.org/10.5194/acp-9-2035-2009, 2009.
Yang, X., Zhao, C., Yang, Y., Yan, X., and Fan, H.: Statistical aerosol properties associated with fire events from 2002 to 2019 and a case analysis in 2019 over Australia, Atmos. Chem. Phys., 21, 3833–3853, https://doi.org/10.5194/acp-21-3833-2021, 2021a.
Yang, X., Zhao, C., Yang, Y., and Fan, H.: Long-term multi-source data analysis about the characteristics of aerosol optical properties and types over Australia, Atmos. Chem. Phys., 21, 3803–3825, https://doi.org/10.5194/acp-21-3803-2021, 2021b.
Yang, Y., Zhao, C., Wang, Q., Cong, Z., Yang, X., and Fan, H.: Aerosol characteristics at the three poles of the Earth as characterized by Cloud–Aerosol Lidar and Infrared Pathfinder Satellite Observations, Atmos. Chem. Phys., 21, 4849–4868, https://doi.org/10.5194/acp-21-4849-2021, 2021c.
Zhao, C., Yang, Y., Fan, H., Huang, J., Fu, Y., Zhang, X., Kang, S., Cong, Z., Husi, L., and Menenti, M.: Aerosol characteristics and impacts on weather and climate over the Tibetan Plateau, Natl. Sci. Rev., 7, 492–495, https://doi.org/10.1093/nsr/nwz184, 2020.
Zhou, C., Yang, F., Mamtimin, A., Huo, W., Liu, X., He, Q., Zhang, J., and Yang, X.: Wind erosion events at different wind speed levels in the Tarim Basin, Geomorphology, 107386, https://doi.org/10.1016/j.geomorph.2020.107386, 2020.