the Creative Commons Attribution 4.0 License.
the Creative Commons Attribution 4.0 License.
 | 05 Apr 2022
Seasonal characteristics of atmospheric peroxyacetyl nitrate (PAN) in a coastal city of Southeast China: Explanatory factors and photochemical effects
Taotao Liu
Gaojie Chen
Lingling Xu
Mengren Li
Youwei Hong
Yanting Chen
Xiaoting Ji
Chen Yang
Yuping Chen
Weiguo Huang
Quanjia Huang
Hong Wang
Peroxyacetyl nitrate (PAN) acting as a typical indicator of photochemical pollution can redistribute NOx and modulate O3 production. Coupled with the observation-based model (OBM) and a generalized additive model (GAM), the intensive observation campaigns were conducted to reveal the pollution characteristics of PAN and its impact on O3, the contributions of influencing factors to PAN formation were also quantified in this paper. The F values of GAM results reflecting the importance of the influencing factors showed that ultraviolet radiation (UV; F value = 60.64), Ox (Ox = NO2 + O3, 57.65), and air temperature (T, 17.55) were the main contributors in the PAN pollution in spring, while the significant effects of Ox (58.45), total VOCs (TVOCs, 21.63), and T (20.46) were found in autumn. The PAN formation rate in autumn was 1.58 times higher than that in spring, relating to the intense photochemical reaction and meteorological conditions. Model simulations revealed that acetaldehyde oxidation (46 %±4 %) contributed to the dominant formation pathway of PA (hence PAN), followed by methylglyoxal oxidation (28 %±3 %) and radical cycling (19 %±3 %). The PAN formation was highly VOC sensitive, as surplus NOx (compared with VOCs abundance) prevented NOx from being the limiting factor photochemical formation of secondary pollution. At our site, PAN promoted and inhibited O3 formation under high and low ROx levels, respectively. The PAN promoting O3 formation mainly occurred during the periods of 11:00–16:00 (local time) when the favourable meteorological conditions (high UV and T) stimulated the photochemical reactions to offer ROx radicals, which accounted for 17 % of the whole monitoring periods in spring and 31 % in autumn. The analysis of PAN formation mechanism and its positive or negative effect on ozone provided scientific insights into photochemical pollution mechanisms under various pollution scenarios in coastal areas.
- Article
(5743 KB) - Full-text XML
-
Supplement
(1785 KB) - BibTeX
- EndNote


Peroxyacetyl nitrate (CH3C(O)O2NO2, PAN) is a key product of photochemical smog (Penkett and Brice, 1986; Li et al., 2019). PAN is generated through photochemical reactions of precursors emitted by human activities only, and the atmospheric PAN is a reliable and scientific indicator of photochemical pollution (Lonneman et al., 1976; Han et al., 2017). In the surface atmosphere, the level of PAN is much lower than that of ozone (O3), but its biological toxicity is about one or two magnitudes greater than that of O3 (Temple and Taylor, 1983). Additionally, PAN acts as a temporary reservoir for NOx and radicals, and can transport to remote regions to redistribute NOx and intervene in O3 production at regional or even global scale (Kleindienst, 1994; Atkinson et al., 2006; Fischer et al., 2010).
The reaction of peroxyacetyl radical (CH3C(O)O2, PA) with NO2 is the only formation pathway of PAN (Han et al., 2017; Xue et al., 2014). PAN affects radical chemistry and modulates O3 production mainly by affecting PA radical, which is one of the most abundant organic peroxy radicals in the troposphere (Tyndall et al., 2001). Only a small group of oxygenated volatile organic compounds (OVOCs), i.e. acetaldehyde (CH3CHO), methacrolein (MACR), methyl vinyl ketone (MVK), methyl ethyl ketone (MEK), and methylglyoxal (MGLY), can directly produce PA radical to generate PAN (Xue et al., 2014; Zhang et al., 2015). A large proportion of these OVOCs (the second-generation precursors of PAN) are mainly transformed by oxidation reactions from some hydrocarbons such as ethane, propene, isoprene, and aromatics (the first-generation precursors of PAN; Xu et al., 2021; Qian et al., 2019). The main and direct PAN destruction is thermal decomposition, and the indirect sinks of PAN were the reactions of PA with NO, HO2, and RO2 (Wolfe et al., 2014; Zeng et al., 2019).
Some studies on the distribution and sources of PAN have been conducted in urban, suburban, and remote regions around the world (Grosjean et al., 2002; Marley et al., 2007; Roberts et al., 2001). The PAN levels in cities are higher than those in rural and remote areas, and those in background areas such as oceans and mountains can be as low as tens of parts per trillion by volume (pptv; Gaffney et al., 1999; Moore and Remedios, 2010). Despite the growing concerns about photochemical pollution in China, PAN measurements and analysis of its photochemical mechanism are still sparse (Zeng et al., 2019). At present, the observations of PAN were mainly distributed in Beijing, Guangzhou, and Hong Kong (Xue et al., 2014; Yuan et al., 2018; Zeng et al., 2019). Xue et al. (2014) reported that anthropogenic VOCs were the most important precursors of PAN in urban areas, and isoprene was the predominant precursor in suburban regions. In the study by Zeng et al. (2019), carbonyls were the most significant contributors to PAN production, followed by aromatics and BVOCs. In addition, some researchers found that atmospheric PAN suppressed local O3 formation in autumn (Zeng et al., 2019). Recently, negative and positive impacts of PAN photochemistry on O3 production were captured under the low and high NOx conditions, respectively (Zeng et al., 2019; Liu et al., 2021). However, the PAN formation and its influencing mechanism on O3 production are still complex and unclear (Hu et al., 2020; Zhang et al., 2019; Xu et al., 2018). Long-term field measurements and model simulations could help to verify the mechanisms under various pollution scenarios and environmental conditions.
Xiamen is located in the coastal region of Southeast China under the East Asian monsoon control, belonging to the subtropical marine climate (Liu et al., 2020a, b). In spring, north cold airflow and south warm airflow formed the quasi-stationary front causing atmospheric stagnation. In autumn, under the control of the West Pacific subtropical high (WPSH), favourable meteorological conditions enhanced the formation and accumulation of photochemical pollutants (Wu et al., 2020). Our previous studies focused on the occurrence and pollution characteristics of PAN (Hu et al., 2020). In this study, an observation-based model coupled to the Master Chemical Mechanism (OBM-MCM) was used to better understand PAN photochemistry in spring and autumn, and a generalized additive model (GAM) was adopted to quantify the complex non-linear relationships of PAN with its precursors and environmental factors (Hua et al., 2021). The study aims to explore (1) the PAN formation mechanism and sensitivity analysis, (2) the impacts of PAN on O3 formation and radical chemistry, and (3) the relationship between PAN and influencing factors under different pollution scenarios.
2.1 Observation site
Observations were carried out at the Atmospheric Environment Observation Supersite (AEOS, 24.61∘ N, 118.06∘ E; Fig. 1), located on the rooftop of an approximately 70 m high building in the Institute of Urban Environment, Chinese Academy of Sciences. The observation site is surrounded by highways, educational institutions, and residential buildings, all of which characterize rapid urbanization development. When the prevailing wind direction was southerly, our observation site was downwind of the densely populated downtown (i.e. Xiamen Island; Hu et al., 2020; Liu et al., 2022). The field observations were continuously conducted from 15 March to 4 November 2020. The photochemical pollution events mainly appeared during spring and autumn in Xiamen, and we preferred to choose the periods with relatively high O3 and PAN levels, then the measured data of 53 d in each season was chosen after excluding some special circumstances, such as extreme synoptic situations and instrument calibration.

Figure 1Location of Xiamen and the observation site.
2.2 Measurement techniques
PAN was monitored using a PAN analyser (PANs-1000, Focused Photonics Inc., Hangzhou, China) containing gas chromatography with electron capture detector (GC-ECD). During the observation period, multi-point standard curve calibration was conducted once a month, and single-point calibration was conducted every week, respectively. In the calibration mode of the PAN analyser, the mass flow controller (MFC) controls the flow rate of NO, acetone, and zero gas separately. The PAN standard gas is generated by the reaction of NO and acetone under ultraviolet light irradiation, and the sample is diluted to the required calibration mixing ratio for injection analysis. PAN was detected every 5 min and the detection limit was 50 pptv. The uncertainty and precision of PAN measurement were ±10 % and 3 %, respectively.
A gas chromatography mass spectrometer (GC-FID/MS, TH-300B, Wuhan, China) was used for monitoring the atmospheric VOCs with a 1 h time resolution. The instrument conducted sampling with a 30 L min−1 sampling rate, then samples were pre-concentrated by cooling to −160 ∘C in a cryogenic trap followed by heating to 100 ∘C, and subsequently transferred to the secondary trap by high-purity helium (He). The flame ionization detector (FID) detected the low-carbon (C2−C5) hydrocarbons by a PLOT () column (15 m × 0.32 mm × 6.0 µm); the other species were quantified using a DB-624 column (60 m × 0.25 mm × 1.4 µm). The instrument system can quantitatively analyse 106 VOCs in the ambient atmosphere, including 29 alkanes, 11 alkenes, 1 alkyne, 17 aromatics, 35 halogenated hydrocarbons, and 13 OVOCs. Nine compounds (acetaldehyde, propanal, crotonaldehyde, methacrolein, n-butanal, benzaldehyde, valeraldehyde, m-tolualdehyde, and hexanal) could not be determined due to lack of aldehyde and ketone calibration gases, and Table S2 in the Supplement shows all VOC compounds that we used in the OBM model. The single-point calibration was performed every day at 23:00 local time with the standard mixtures of PAMS and TO15, and multi-point calibration was performed for 1 month. The detection limits of the measured VOCs were in the range of 0.02–0.30 parts per billion by volume (ppbv), and the measurement precision was ≤10 %.
Criteria air pollutants of O3, CO, SO2, and NOx were monitored by using Thermo Instruments TEI 49i, 48i, 43i, and 42i (Thermo Fisher Scientific, Waltham, MA, USA), respectively. HONO was monitored using an analyser for Monitoring Aerosols and Gases in Ambient Air (MARGA, ADI 2080, Applikon Analytical B.V., the Netherlands). Particulate matters (PM2.5) were monitored by oscillating microbalance with tapered element (TEOM1405, Thermo Scientific Corp., MA, USA). The meteorological parameters (i.e. wind speed (WS), wind direction (WD), pressure (P), air temperature (T), and relative humidity (RH)) were measured by a weather station with sonic anemometer (150WX, Airmar, Milford, NH, USA). Ultraviolet radiation (UV) was determined by a UV radiometer (KIPP & ZONEN, SUV5 Smart UV Radiometer). Photolysis frequencies including J(O1D), J(NO2), J(HONO), J(NO3), J(HCHO), and J(H2O2) were analysed by a photolysis spectrometer (PFS-100, Focused Photonics Inc., Hangzhou, China), and the uncertainty and detection limit of photolysis rate measurement were ±5 % and around , respectively.
Table S1 in the Supplement shows the detailed uncertainty and detection limit of instruments for trace gas observation. A schedule was applied to operate and inspect the AEOS monitoring station regularly and strictly to ensure the validity of the data. The detailed applications of the atmospheric monitoring procedure were shown in our previous studies (Wu et al., 2020; Liu et al., 2020a, b; Hu et al., 2020).
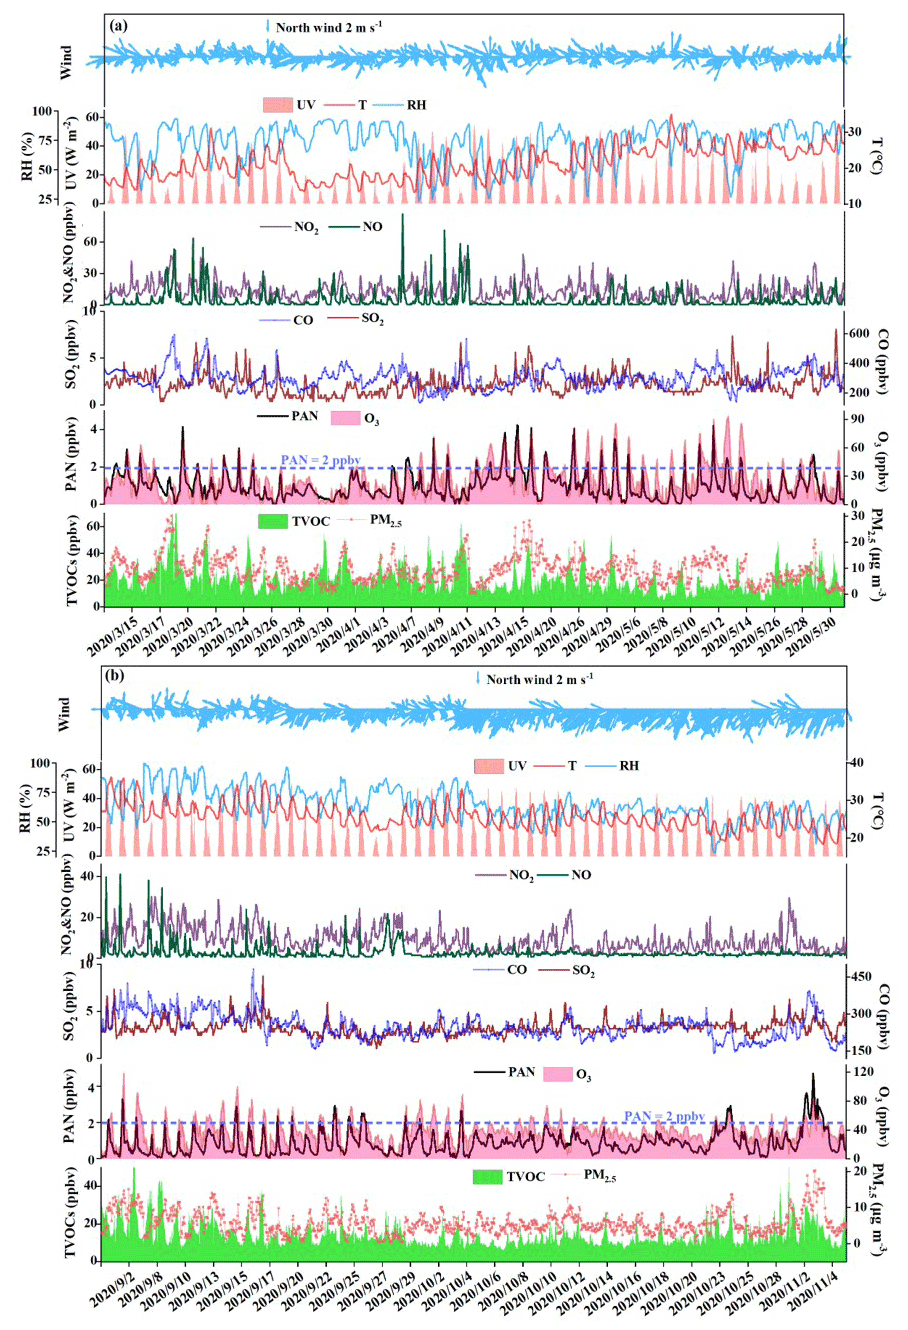
Figure 2Time series of PAN, O3, NOx, CO, SO2, TVOCs, PM2.5, and meteorological parameters in (a) spring and (b) autumn.
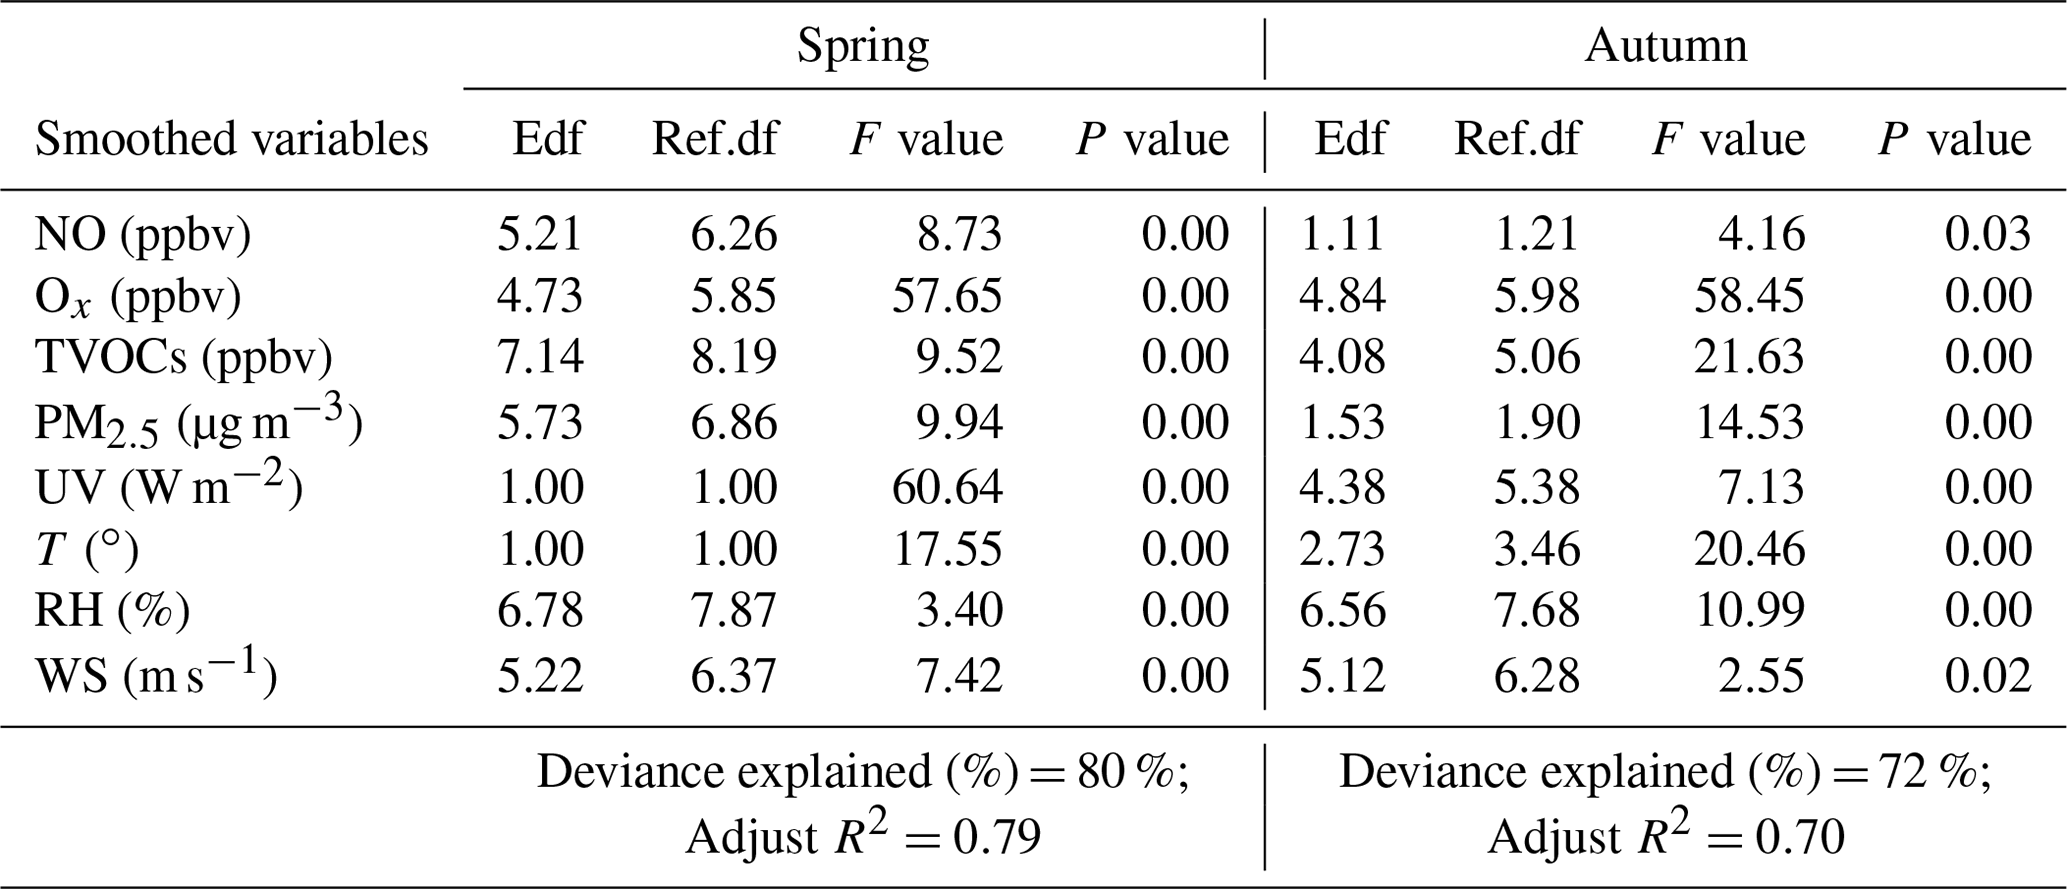
Table 1Estimated degree (during promotion effect scenarios in spring and autumn) of freedom (Edf), degree of 530 reference (Ref. df), P value, F value, deviance explained (%), adjusted R2, deviance contribution (%) for the 531 smoothed variables (including NO, Δ ROx, TVOCs, PM2.5, UV, T, RH, and WS) in the multiple-factor GAM model.
2.3 Observation-based model
The OBM-MCM model is successfully used in the simulation of photochemical processes and the quantification of the reaction rates, such as O3, PAN, and alkyl nitrates (RONO2; Zeng et al., 2019). In our study, the PAN photochemistry mechanism was simulated using this box model, and the incorporated chemical mechanism was the latest version of MCM-v3.3.1 (http://mcm.leeds.ac.uk/MCM/, last access: 19 October 2021), which introduced 142 non-methane VOCs and about 20 000 elementary reactions (Jenkin et al., 2003; Saunders et al., 2003). The physical process including dilution effect and dry deposition within the boundary layer height was considered, avoiding the excessive accumulation of pollutants in the model (Li et al., 2018; Liu et al., 2021; Xue et al., 2016). The observed data with a time resolution of 1 h of pollutants (i.e. O3, CO, NO, NO2, HONO, SO2, and VOCs), meteorological parameters (i.e. T, P, and RH), and photolysis rate constants (J(O1D), J(NO2), J(H2O2), J(HONO), J(HCHO), and J(NO3)), which were mentioned in Sect. 2.1, were input into the OBM-MCM model as constraints. The photolysis rates of other molecules were driven by the solar zenith angle and were scaled by measured JNO2 (Saunders et al., 2003). Pre-ran for 2 d before running the model helped to constrain the unmeasured compounds reaching a steady state (Xue et al., 2014; Liu et al., 2022).
PAN affects atmospheric photochemistry by acting as a temporary source or sinks of PA radical (Xue et al., 2014; Liu et al., 2021); hence, the production and sink of PA radical reflecting the PAN formation were discussed in our study. Furthermore, relative incremental reactivity (RIR) was used to analyse the sensitivity of O3 (Eq. 1) and PAN (Eq. 2) to their precursors, and was calculated as the ratio of the differences in O3 or PAN net production rate to variety in precursors (Chen et al., 2020; Liu et al., 2021). The production pathways of O3 include HO2+NO and RO2+NO reactions, and the destruction pathways of O3 involve reactions of O3 photolysis, O3+OH, O3+HO2, O3+VOCs, NO2+OH, and NO3+VOCs. The net O3 production rate (P(O3)) is calculated by the difference of O3 production rate and destruction rate, and the detailed net production rate of O3 (P(O3)) was introduced in our previous study (Liu et al., 2022). The net production of PAN (P(PAN)) involved the production pathway of PA + NO2, and the loss of PAN was thermal decomposition and PAN + OH (Zeng et al., 2019):
where represents the reduction in the input mixing ratios of each target O3, and the PAN precursor group was 20 % (Liu et al., 2021).
2.4 Generalized additive model
The generalized additive model (GAM) is an extension of the additive model proposed. Different from traditional regression models, GAM is a non-parametric regression model driven by data rather than statistical distribution models (He et al., 2017). The GAM does not need to set the parameter model in advance, and it can adjust the functional form of the explained variable according to the specific situation. The GAM has been widely used in air pollution research, such as for O3 and PM2.5, and can effectively deal with the complex non-linear relationship between air pollutants and influencing factors (Ma et al., 2020; Hua et al., 2021; Guan et al., 2019). It is the first time that the GAM has been used to analyse the relationship between PAN and its influencing factors, and the combined effect of multiple influencing factors on the PAN mixing ratio was discussed in our study. Its form is:
where y is the response variable; g(y) is the connection function; x1, x2, and xn are the explanatory variables; f1(x1), f2(x2), and fn(xn) are the non-parametric smoothing functions; and β is the intercept; and α is the truncation error.
The F value, P value, adjust R2, and deviance explained given by the GAM model are used to judge the significance of the influencing factors on PAN and the accuracy of the model simulation. Among them, a high F value indicates the great importance of the influencing factor, the P value is used to judge the significance of the model result, the adjusted R2 is the value of the regression square ranging from 0 to 1, and the deviance explained represents the fitting effect. In addition, when the degree of freedom (edf, ref.df) of the explanatory variable is 1, it indicates that the explanatory variable and the response variable are linear. When the degree is > 1, it is a non-linear relationship.
3.1 Overview of observation
The time series of air pollutants and meteorological parameters are shown in Fig. 2. The average levels of PAN in autumn (0.87±0.66 ppbv) were comparable to those in spring (0.96±0.73 ppbv), while O3 mixing ratios in autumn (37.22±16.89 ppbv) were 1.39 times higher than those in spring (26.73±18.63 ppbv). PAN and O3 are produced by the photochemical reactions of VOCs and NOx; thus, they usually show a relatively close relationship (R2≥0.49, Fig. S3). The PAN level (0.92±0.69 ppbv) in Xiamen was lower than that of megacities such as Beijing (3.79±3.26 ppbv; Xu et al., 2021), Jinan (2.54 ppbv; Liu et al., 2018), Santiago (6.4 ppbv; Rubio et al., 2005), and Chongqing (2.05 ppbv; Sun et al., 2020), and was comparable to the coastal cities with relatively clean air, including Shenzhen (1.01±0.94 ppbv; Xia et al., 2021) and Qingdao (0.81 ppbv; Liu et al., 2021).

Figure 3Response curves (spring) in the multiple-factor model of PAN to changes in (a) NO, (b) Ox (Ox = O3 + NO2), (c) TVOCs, (d) PM2.5, (e) ultraviolet radiation (UV), (f) air temperature (T), (g) relative humidity (RH), and (h) wind speed (WS). The y axis is the smoothing function values. For example, s(NO, df) shows the trend in PAN when NO changes, and the number of df is the degree of freedom. The x axis is the influencing factor, and the shaded area around the solid blue line indicates the 95 % confidence interval of PAN. The vertical short blue lines represent the concentration distribution characteristics of the explanatory variables (units: NO (ppbv), Ox (O3+NO2; ppbv), TVOCs (ppbv), PM2.5 (µg m−3), UV (W m−2), T (∘), RH (%), WS (m s−1)).
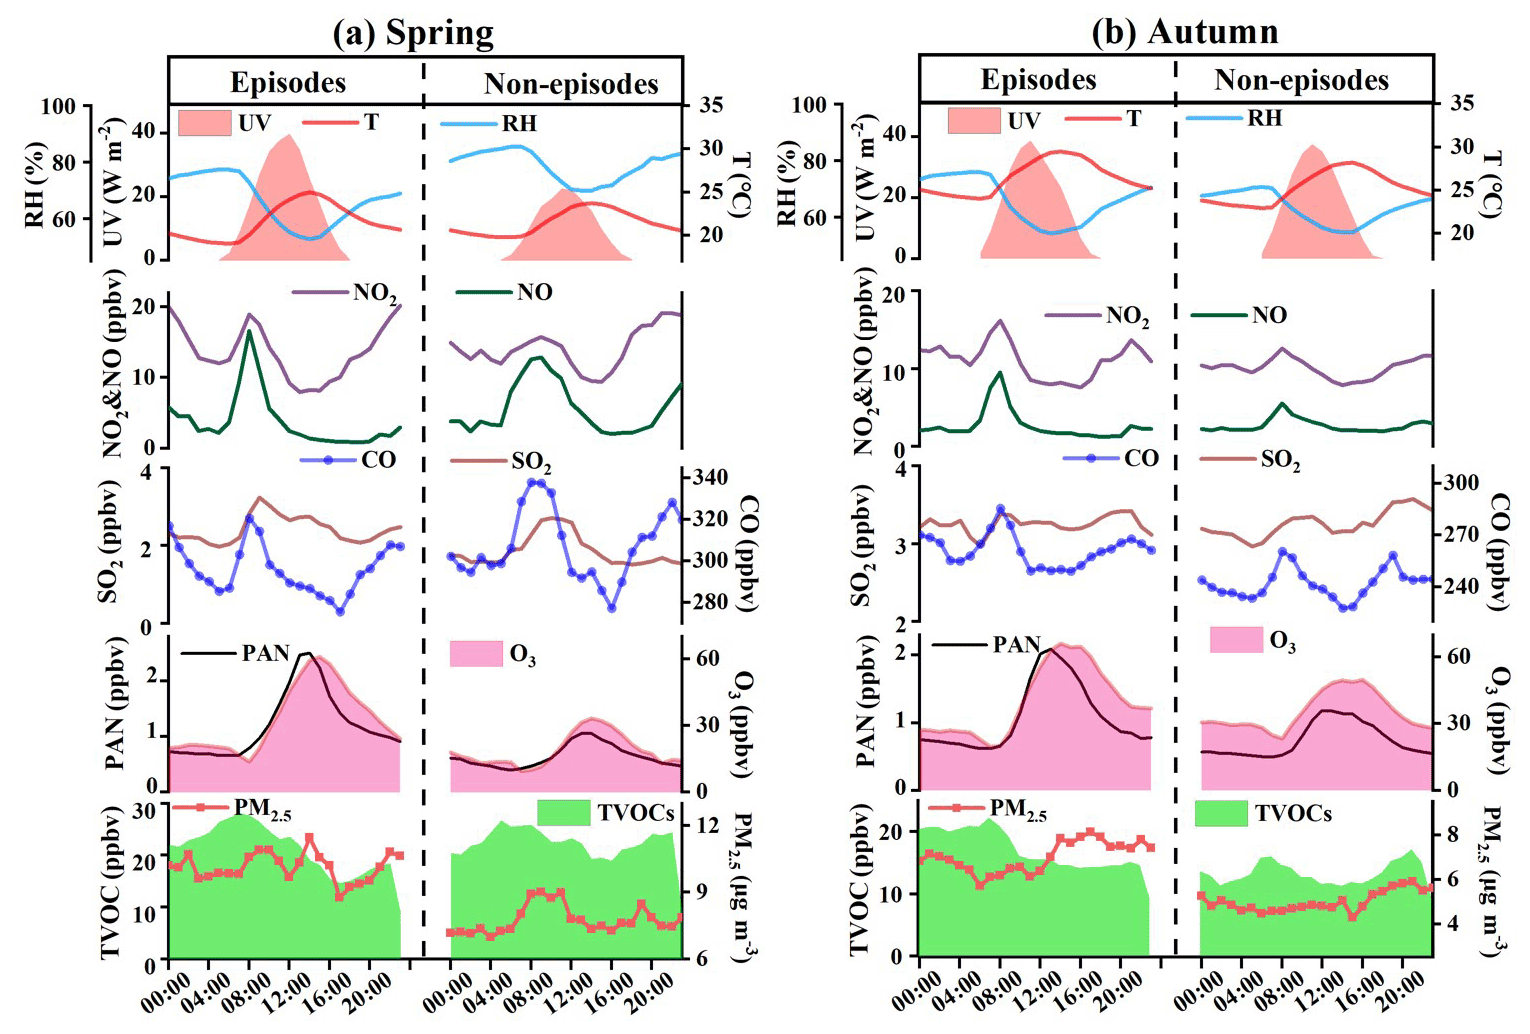
Figure 4Diurnal trends of PAN, O3, TVOCs, PM2.5, other trace gases, and meteorological parameters during episodes and non-episodes in (a) spring and (b) autumn, respectively.
The averaged values of PAN and NO, NO2, CO, and TVOCs in spring were 1.70, 1.32, 1.21, and 1.46 times higher, respectively, than those in autumn. The details of measured VOCs are provided in Table S2 in the Supplement. Alkanes, OVOCs, aromatics, and halocarbons accounted for about 90 % of total VOCs, suggesting the impacts of atmospheric oxidation capacity and marine emissions in coastal regions (Liu et al., 2020a, b). During the transition from spring to summer the wind direction fluctuated between northwest and southeast, while during the transition from summer to autumn the wind direction fluctuated from southeast to northeast. The wind rose charts showed that the wind direction frequencies with relatively high wind speed (>3 m s−1) in spring and autumn were southeast wind and northeast wind (Fig. S4 in the Supplement), respectively. Although the frequency of northwest wind (NNW) also accounted for a certain proportion, the NNW speeds were generally slow, and the direction of the NNW was mainly rural residential and mountainous areas with less anthropogenic emissions, so it was not the focus of this research. The ultraviolet radiation (UV), WS, and T in spring (15.32 W m−2; 1.96 m s−1; 21.51∘) were weaker than those in autumn (18.43 W m−2; 3.01 m s−1; 25.85∘), and RH and P in spring (73.25 %; 1010.71 hPa) were higher than those in autumn (65.21 %; 1008.71 hPa). These meteorological conditions carried by the WPSH (high T, low RH, and stagnant weather conditions) were conducive to the photochemical reaction and accumulation of air pollutants in autumn (Wu et al., 2019; Xia et al., 2021). High precursor levels of PAN in spring were conducive to the continuous and stable production of PAN, and the high air temperature in autumn accelerated the thermal decomposition of PAN. However, the O3 levels in autumn were higher than those in spring, attributing to the influence of strong photochemical reaction conditions, regional transport from the Yangtze River Delta region, or increased atmospheric background levels (Monks, 2000). High O3 values in both seasons were concentrated on the wind direction of southeast and northeast (Fig. S5 in the Supplement). High PAN values in spring easily happened in the wind direction of the southeast with low wind speed (<3 m s−1), showing the influence of urban plumes from the downtown of Xiamen Island. High PAN values in autumn also appeared in the wind direction of the southeast, as well as the northeast with a relatively high wind speed (from Quangzhou city, an industrial city adjacent to Xiamen). Moreover, PAN lifetimes in our observation site were relatively short due to the high ambient temperature, and the PAN lifetimes in autumn (2.02 h) were significantly lower than those in spring (6.39 h), which was not conducive to regional transport (Hu et al., 2020; Liu et al., 2018). Accordingly, O3 showed obvious characteristics of long-range transport, and PAN pollution was mainly from local production and/or accumulation in spring and autumn, but short-range transport from adjacent cities might contribute to the high PAN concentrations in autumn to a certain extent.
Based on the above analysis, we found that the photochemical reactions were still intense and even stronger under the low precursor mixing ratios. Although the precursor mixing ratios of PAN and O3 in spring were significantly higher than those in autumn (P<0.01), the PAN mixing ratios in autumn were comparable to those in spring, while the O3 mixing ratios in autumn were much higher than those in spring. Therefore, it is very necessary to further explore the key influencing factors and their formation mechanisms.
3.2 The influencing factors of PAN using the GAM
PAN levels are not only related to chemical reactions in the boundary layer, but also affected by meteorological conditions (Hu et al., 2020). According to the collinearity analysis (He and Lin, 2017), the meteorological parameters (UV, T, RH, and WS) and other air pollutants (NO, TVOCs, PM2.5, and Ox) were considered into the multiple-factor GAM model (Table S3 in the Supplement). As shown in Table 1, the adjusted R2 and deviance explained for the smoothed variables of the multiple-factor GAM model were 0.70 % and 72 % in spring, 0.60 % and 63 % in autumn. According to the F values, the orders of the explanatory variables in spring and autumn were UV (60.64) > Ox (57.65) > T (17.55) > PM2.5 (9.94) > TVOCs (9.52) > NO (8.73) > WS (7.42) > RH (3.4) and Ox (58.45) > TVOCs (21.63) > T (20.46) > PM2.5 (14.53) > RH (10.99) > UV (7.13) > NO (4.16) > WS (2.55), respectively.
Response curves of the PAN to explanatory factors in the multiple-factor model were presented (Fig. 3 and Fig. S6 in the Supplement). Except for UV and T in spring, the degrees of freedom (df) of the explanatory variables were greater than 1, indicating the non-linear relationships between explanatory variables and PAN. The PAN in both seasons showed a downward trend with the increase of NO. PAN in spring was constant with NO fluctuation between 10 and 23 ppbv, and the confidence interval (CI) of NO concentration was relatively narrow. As we all know, the reaction of PA + NO is one of the most important loss pathways of PA, and the NO2 production by NO oxidation in the O3 formation cycle can react with PA radical to produce PAN, suggesting that NO can consume and produce PAN indirectly (Liu et al., 2021). The consumption of NO to PAN was basically equal to the production when the NO levels were relatively high (>10 ppbv), and the consumption of NO to PAN was greater than the production when the NO levels were low in spring. High values of NO mainly happened during rush hour traffic; thus, controlling vehicle emissions can effectively alleviate PAN pollution. Ox had a positive correlation with PAN, representing the promotion effects of atmospheric oxidation capacity on PAN formation. The Ox levels < 70 ppbv (with narrow CI) played a significant promotion role in PAN formation (Fig. 3b and Fig. S4b in the Supplement). High Ox > 70 ppbv showed little influence on PAN, which could be explained as high Ox with relatively high air temperature leading to intense PAN thermal decomposition. When TVOCs were between 10 and 30 ppbv and PM2.5 levels were < 17 µg m−3, PAN showed an upward trend with narrow CI. According to our previous study (Liu et al., 2022; Hu et al., 2020), the results of sensitivity analysis in Xiamen was VOC sensitive; the relatively low PM2.5 concentrations in Xiamen showed limited influence on solar radiation through scattering and absorption, but promoted heterogeneous reactions producing radicals to a certain extent. UV and T had significant positive and negative non-linear correlations with PAN, respectively. When UV changed between 0 and 50 W m−2 and T changed between 15 and 35 W m−2, the CIs barely increased. In addition, when RH was more than 40 %, the increase in RH was unfavourable for PAN production in both seasons. Some studies also found that high water vapour content could remove PAN and its precursors (Yan et al., 2018; Ma et al., 2020). Overall, the multiple-factor GAM analysis could better simulate the variations of PAN under real atmospheric conditions and evaluate the contributions of the influence factors to PAN formation.
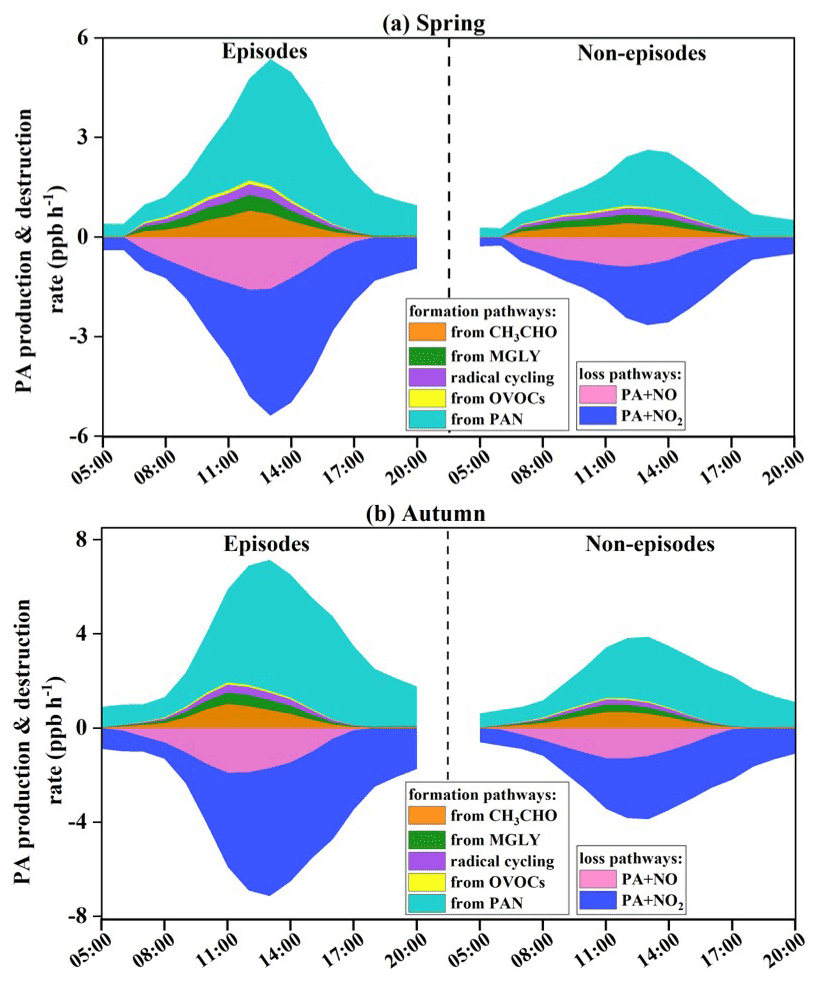
Figure 5Formation and destruction rates of PA radical (hence PAN) during episodes and non-episodes in (a) spring and (b) autumn, respectively.
3.3 Formation mechanism of PAN
3.3.1 Diurnal variation during episodes and non-episodes
Throughout the 53 d campaign, 30 and 21 d (i.e. 57 % and 40 %) with the peak values of PAN exceeding 2 ppbv were observed in spring and autumn, respectively. The scenarios of episodes and non-episodes were classified according to the previous method (Xue et al., 2014). Diurnal variations of air pollutants and meteorological parameters during episodes and non-episodes are shown in Fig. 4, which could be explained by the evolution of the planetary boundary layer, local emissions, and atmospheric photochemistry. PAN reached a maximum value at 12:00–14:00, then decreased with weak solar radiation and reached the lowest values in the early morning. Similar diurnal patterns of PAN and O3 were observed, indicating the dominance of local photochemistry during the observation period (Zeng et al., 2019). CO, NOx, and TVOCs showed the highest values in the morning and the lowest values in the afternoon.
In autumn, averaged PAN and O3 during episodes (PAN: 1.08±0.87 ppbv, and O3: 40.06±20.27 ppbv) were higher than those during non-episodes (PAN: 0.74±0.41 ppbv, and O3: 35.36±13.95 ppbv). Meanwhile, some air pollutants and meteorological parameters during episodes were 1.03–1.40 times higher than those during non-episodes. The rainfall in Xiamen is more frequent in spring (Hu et al., 2020), leading to the obvious differences in UV and RH levels between episodes and non-episodes. In spring, the precursors (CO, NOx, TVOCs) of PAN during episodes were 1.04–1.49 times lower than those during non-episodes. Moreover, the PAN and O3 mixing ratios during episodes (PAN: 1.20±0.81 ppbv, and O3: 32.92±19.81 ppbv) were still significantly higher than those during non-episodes (PAN: 0.64±0.43 ppbv, and O3: 18.65±13.16 ppbv), attributing to the favourable meteorological conditions of photochemical reactions (strong UV, high T, and low RH). These results further explained that UV, Ox, and T in spring and Ox, TVOCs, T, and PM2.5 in autumn played important roles in the formation of PAN based on the GAM analysis.
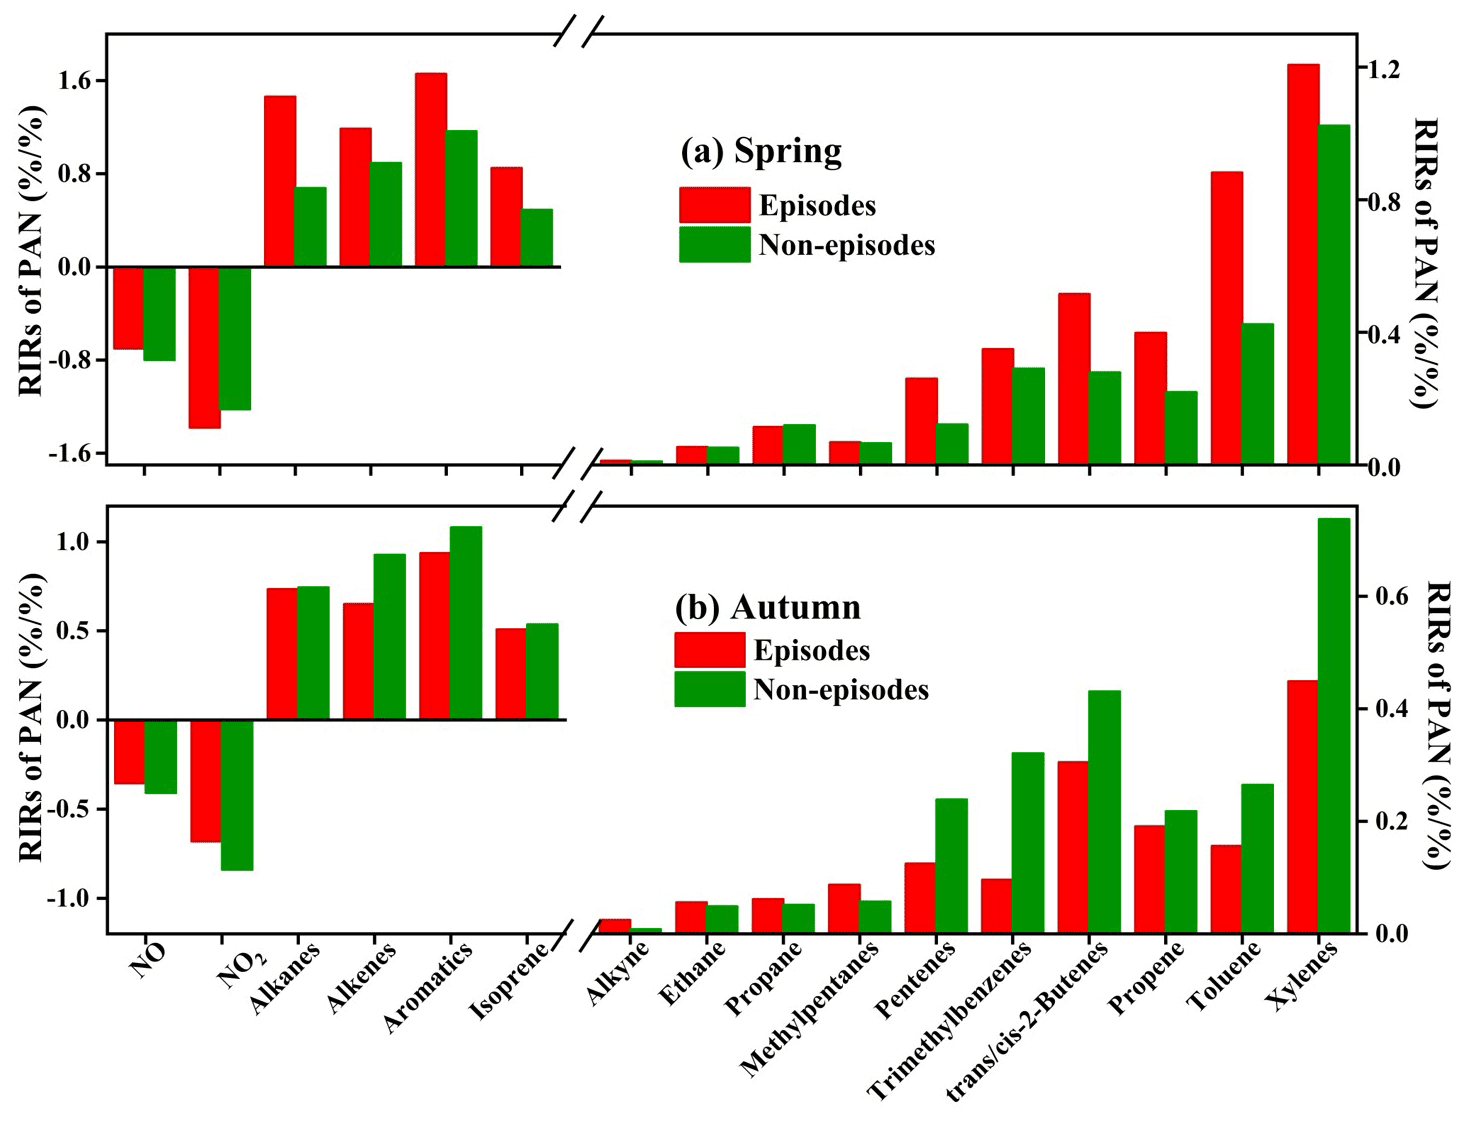
Figure 6The OBM-MCM calculated relative incremental reactivity (RIR) for major PAN precursor groups and the top 10 specific species in (a) spring and (b) autumn during the day (06:00–17:00 local time).
3.3.2 Formation and loss of PA radical
The formation and sink pathways of PA radical were further explored under different pollution scenarios (Fig. 5). Both the PA (hence PAN) production and destruction rates during episodes were 1.80 times higher than those during non-episodes. Combined with the analysis of Sect. 3.3.1, PA production rates during the day (06:00–17:00 local time) in autumn were 1.58 times higher than those in spring, even though the precursor levels in autumn were much lower compared with those in spring. These results indicated that favourable meteorological conditions were the dominant factor to produce PAN through accelerating its production rate and accumulation. The thermal decomposition of PAN to PA radical in autumn accounted for 77 %±12 % (episodes) and 73 %±16 % (non-episodes) of total PA production, as well as 70 %±12 % (episodes) and 64 %±15 % (non-episodes) in spring, attributing to the relatively high air temperature and UV intensity. The thermal decomposition of PAN peaked at around 13:00–14:00 local time, when the air temperature was the highest in the day, and the pathways without considering the transform between PA and PAN peaked around noon (12:00 local time), when the solar radiation was the highest and photochemical reactions became the most intensive.
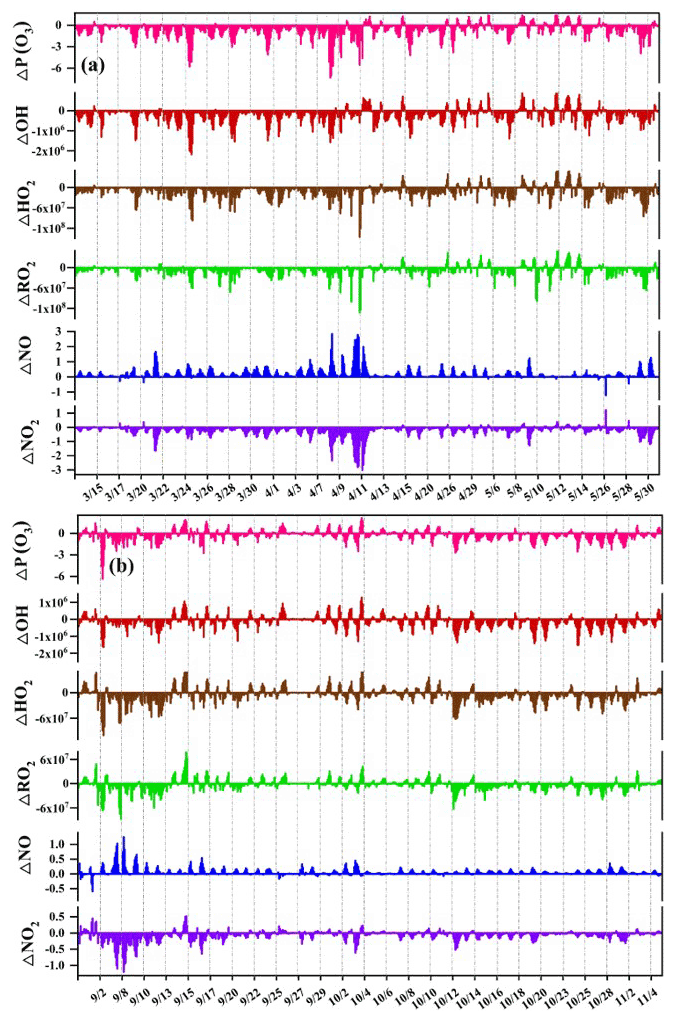
Figure 7The differences of O3 net production ΔP(O3), ΔOH, ΔHO2, ΔRO2, ΔNO, and ΔNO2 between the SC1 and the SC2 during the daytime (06:00–17:00) in (a) spring and (b) autumn (Unit: ppbv h−1 for ΔP(O3); ppbv for ΔNO and ΔNO2; molecules cm−3 for ΔOH, ΔHO2, and ΔRO2). The SC1 scenario was the base scenario putting all detected data (i.e. VOCs, trace gases, and meteorological parameters) into the model with all reaction pathways of the MCM mechanism, and the SC2 disabled the PAN chemistry, which is the only difference between SC1 and SC2.
The average day PAN production rate from CH3CHO by reacting with OH and NO3 contributed 0.36±0.25 ppb h−1 and 0.24±0.13 ppb h−1 during episodes and non-episodes in spring. While the rate of 0.46±0.35 ppb h−1 and 0.34±0.24 ppb h−1 during episodes and non-episodes were observed in autumn. The second production reaction was photolysis and oxidation by OH and NO3 of MGLY (episodes: 0.25±0.15 ppb h−1 and non-episodes: 0.17±0.08 ppb h−1 in spring; episodes: 0.24±0.17 ppb h−1 and non-episodes: 0.16±0.11 ppb h−1 in autumn). Then, the processes of radical cycling, including RO radical decomposition and reactions of acyl peroxy radicals with NO, were also the important sources to produce PA, with the contributions of 20 %±3 % and 18 %±3 % in spring and autumn, respectively. PA from the other OVOCs (not including CH3CHO, MGLY, MVK, MACR, and acetone) through reactions of photolysis and oxidation by OH, NO3, and O3, accounted for 7 %±2 % and 6 %±1 % in spring and autumn, respectively. Other reactions of acetone, MVK, MACR, MPAN, and isoprene had a minor contribution (around 1 % in total) to PA formation. In contrast, the major contributor of PAN destruction rate was PA + NO2 (69 %±16 % in spring and 73 %±14 % in autumn), followed by PA + NO (31 %±17 % and 27 %±13 %), while the other reactions with NO3, HO2, and RO2 contributed limitedly (around 0.1 % of the total).
The second-generation precursors of PAN of CH3CHO and MGLY have both primary and secondary sources, and the other OVOCs are mainly oxidation products of hydrocarbons (Pallavi, Sinha and Sinha, 2019; Sarkar et al., 2017). Consequently, the contribution and importance of first-generation precursors of PAN are necessary to identify to better control photochemical pollution, which will be discussed in the next section.
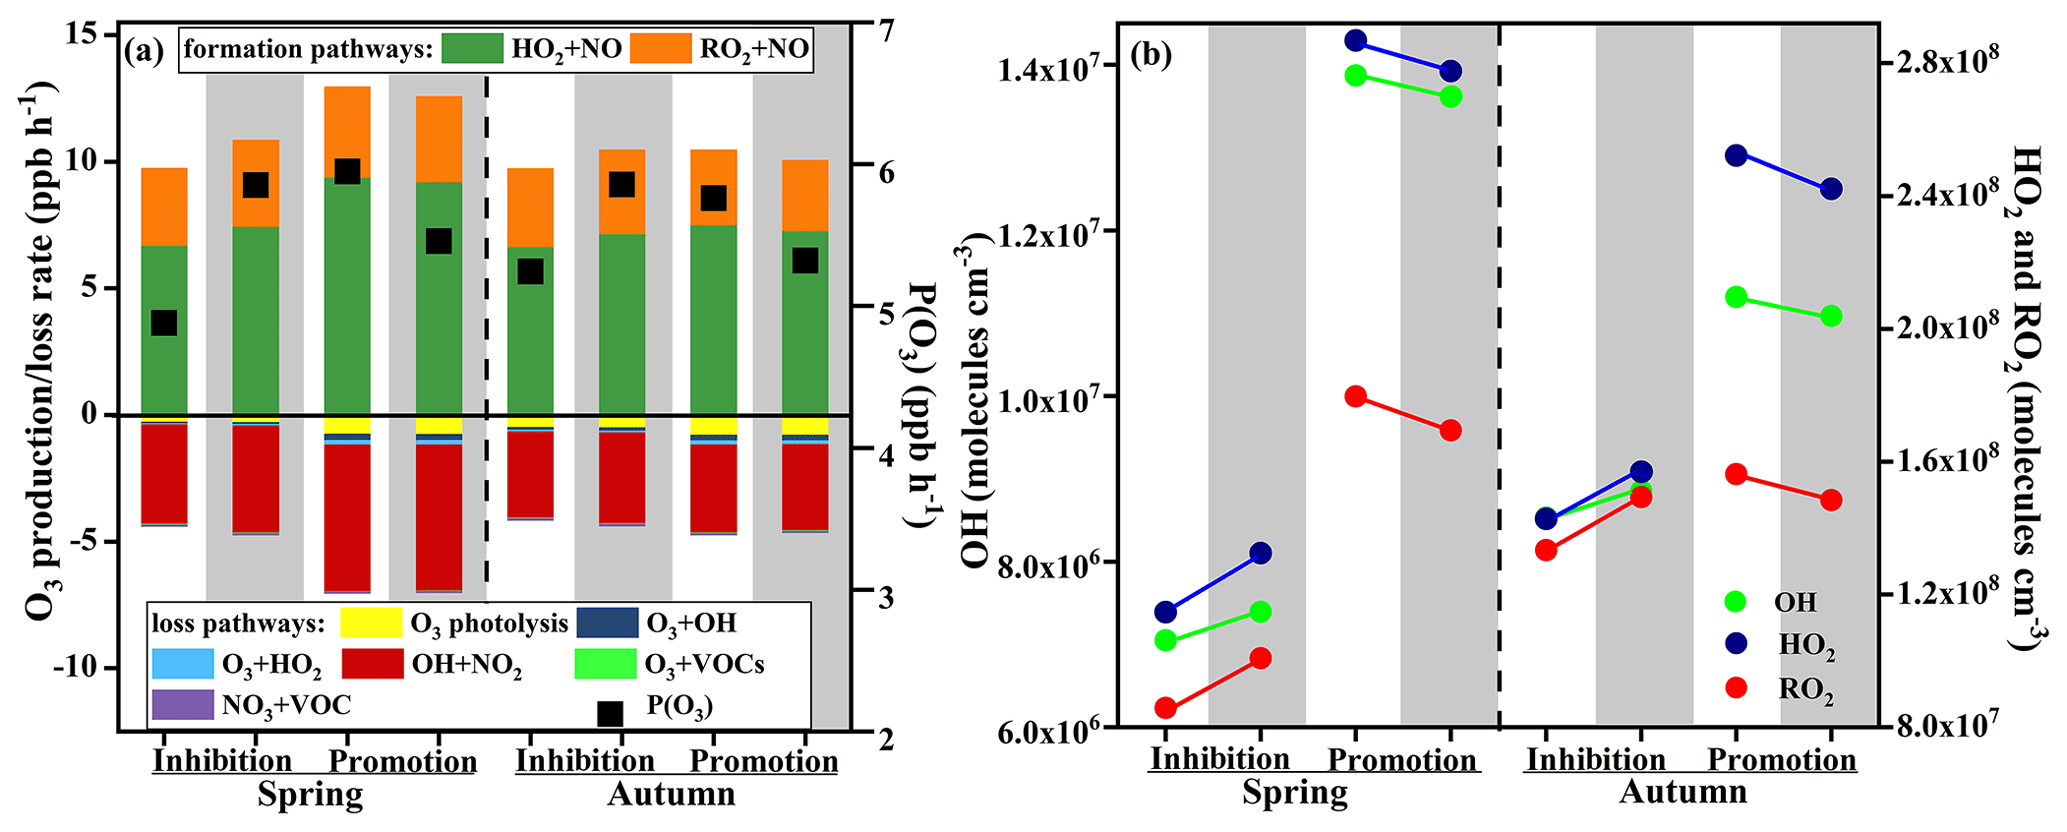
Figure 8Model-simulated (a) net O3 production rate and O3 budgets, (b) OH, HO2, and RO2 on the inhibition effect stages and promotion effect stages. Note: the white background parts represent the SC1 scenarios using the MCM mechanism, and the grey background parts represent the SC2 scenarios using the MCM mechanism with PAN chemistry disabled.
3.3.3 Sensitivity of PAN precursors
The OBM-MCM model analysis could be used to examine the relationship between PAN and its precursors, and quantify the contribution of first-generation precursors (Liu et al., 2021; Cardelino and Chameides, 1995). During these simulations (except for NO and NO2), the model was not constrained by the OVOC measurements considering that these first-generation precursors contribute to PAN production through formation of OVOCs. The relative incremental reactivities (RIRs) for O3 and PAN are shown in Fig. 6 and Fig. S7 in the Supplement. The PAN production was highly VOC sensitive, while the RIRs of NO and NO2 were negative ranging from −0.17 to −1.94 during the day (06:00–17:00 local time). The result was consistent with the actual situation that vehicle exhausts were very important pollution sources in Xiamen. The ratio of (1.11±0.32) also convinced us that NOx was not the limiting factor on the photochemical reaction (Tan et al., 2019). In suburban or rural areas, the transition regime and NOx-sensitive for PAN and O3 production were usually found (Xue et al., 2014; Liu et al., 2021). Zeng et al. (2019) found NO2-positive and NO-negative to PAN formation in a suburban area of Hong Kong, consistent with the fact that NO2 directly produced PAN and NO consumed PA radical inhibiting PAN formation.
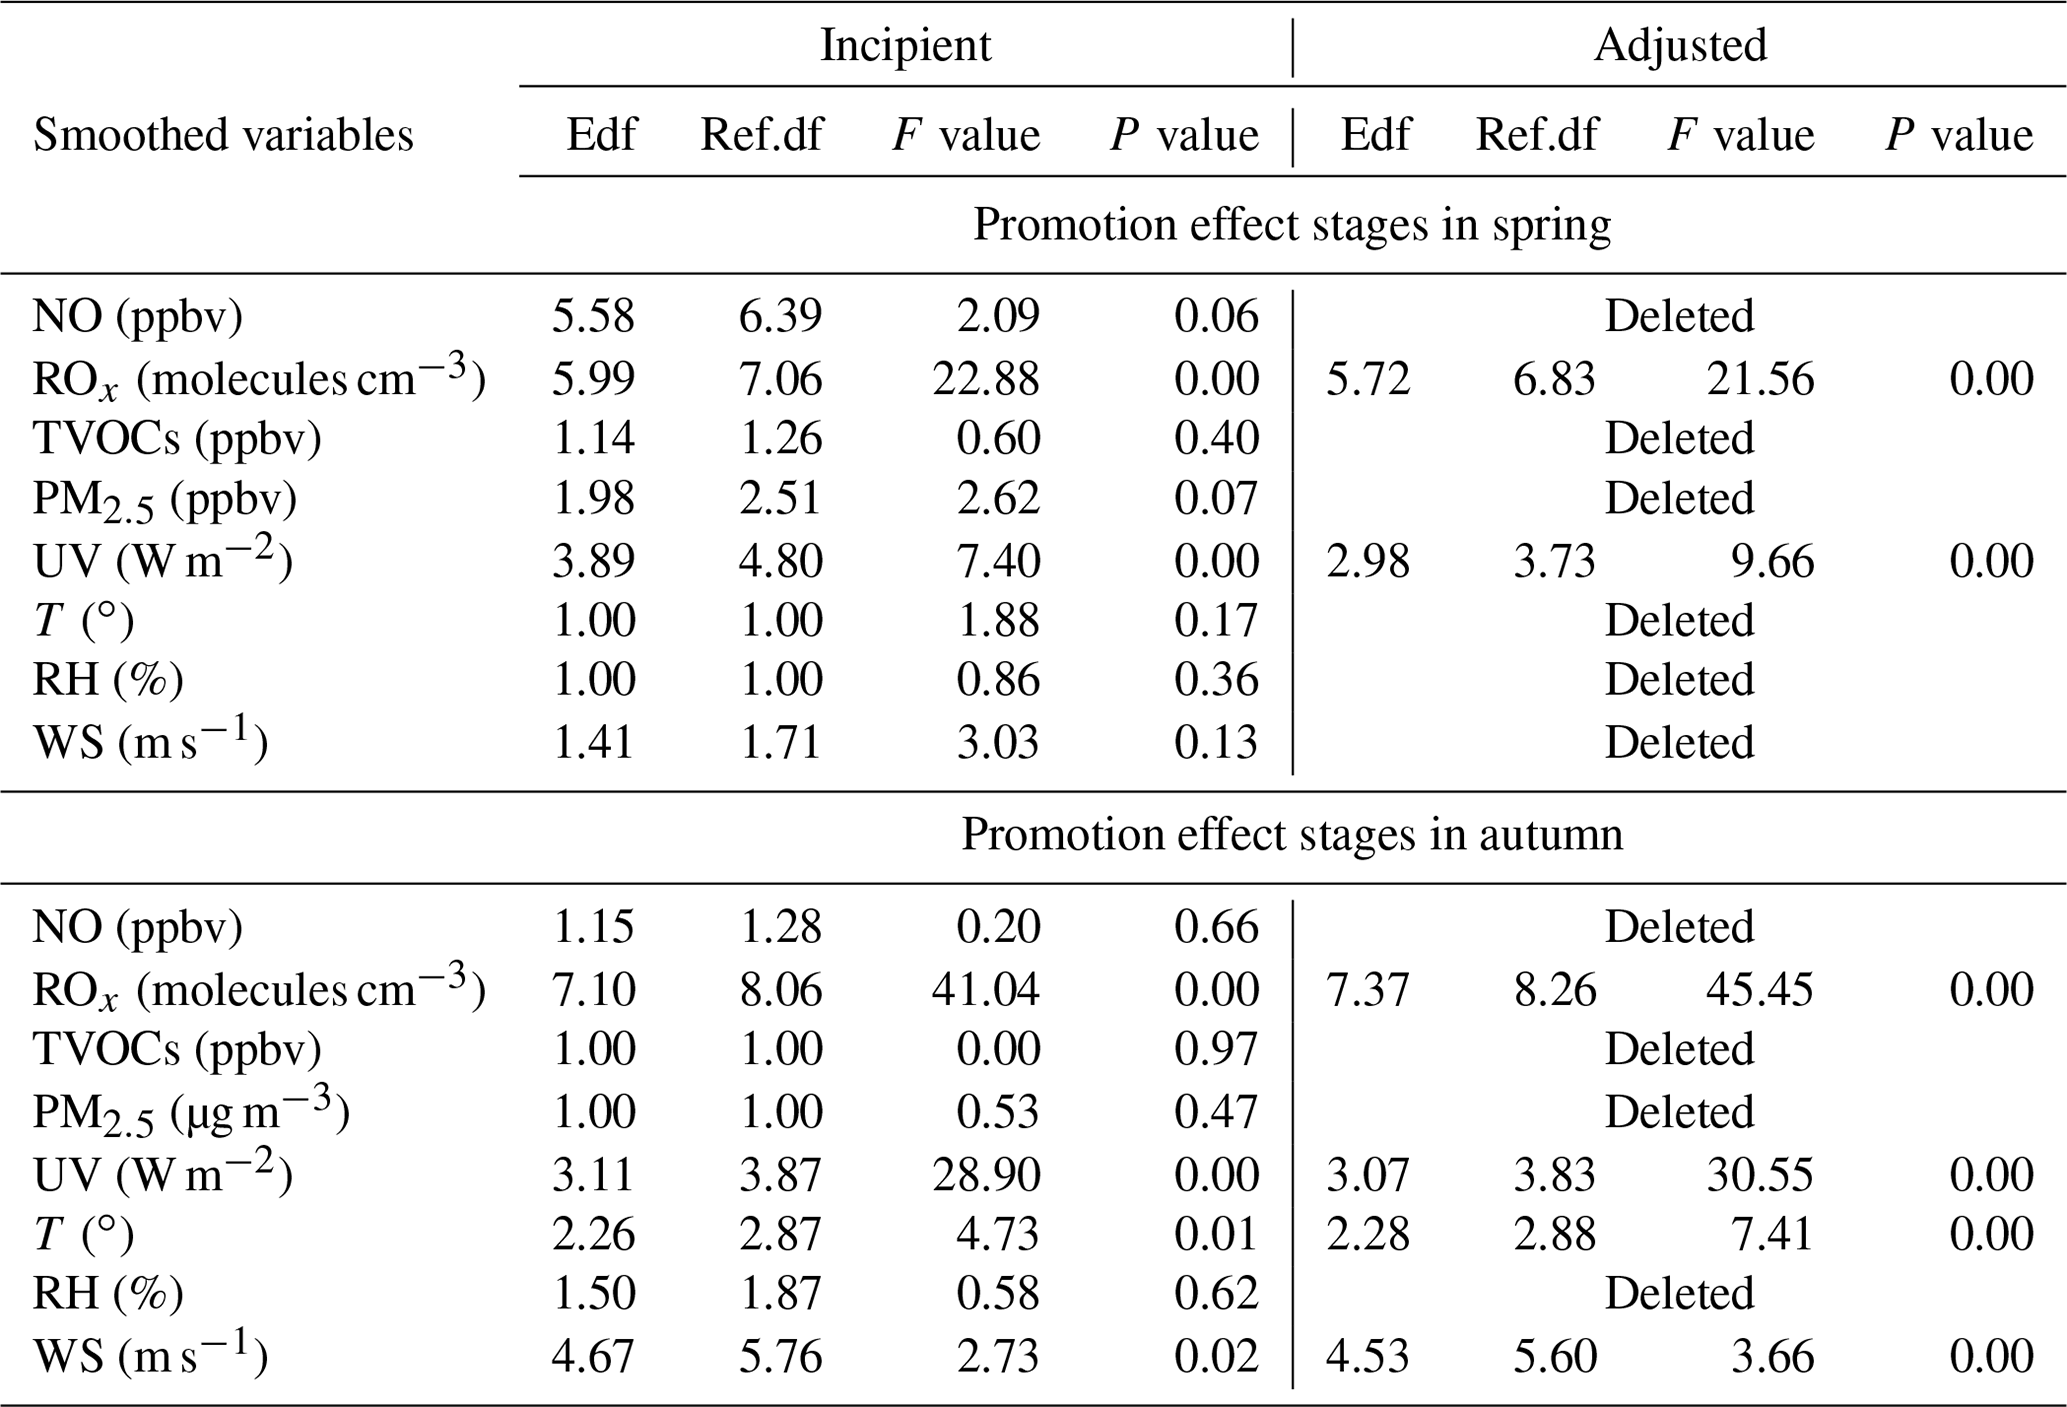
Table 2Estimated degree (during promotion effect scenarios in spring and autumn) of freedom (Edf), degree of reference (Ref.df), P value, F value, deviance explained (%), adjusted R2, and deviance contribution (%) for the smoothed variables (including NO, ROx, TVOCs, PM2.5, UV, T, RH, and WS) in the multiple-factor GAM model.
As shown in Fig. 6, aromatics showed the largest RIRs for PAN in spring (1.41) and autumn (1.03), followed by alkanes (1.04 in spring and 0.78 in autumn), alkenes (1.04 and 0.74), and isoprene (0.67 and 0.52). The sensitivities of PAN precursors in spring were 1.37–2.07 times higher than those in autumn, due to the large percentages of PAN decomposition at high air temperatures in autumn. In spring, the weak solar radiation led to poor photochemical reactions, so the RIRs of PAN during non-episodes were lower than that during episodes. However, the PAN sensitivities during episodes were lower than those during non-episodes, attributed to the rapid PAN decomposition in autumn (Liu et al., 2021). In addition, RIRs of VOCs and NOx for PAN were significantly higher than those of O3 (Fig. S5 in the Supplement). For RIRs of VOCs, except for air temperature, the different formation mechanisms of PAN and O3 should be considered. Only a small part of the VOCs could produce PA to form PAN; therefore, the VOCs were insufficient to produce PAN (Fischer et al., 2014). For RIRs of NOx, O3 was produced from the NO2 conversion process, and was also rapidly consumed by NO titration. High levels of VOCs and NOx enhanced the PAN formation, even though a pathway of NO destructed PAN, which was negligible compared with thermal decomposition. For this reason, the RIRs of NOx for PAN were higher than those for O3.
In addition, the top 10 VOCs species (including xylenes, toluene trans/cis-2-butenes, trimethylbenzenes, propene, pentenes, and methypentanes) governing PAN production were further identified (Fig. 6). The results suggested that the reduction of aromatics, alkenes, and alkanes with ≤5 carbons could effectively decrease PAN pollution.
3.4 Impacts of PAN on O3 formation
3.4.1 Inhibition and promotion effect of PAN on O3 formation
PAN could affect O3 production by acting as a temporary source of NOx or sink of PA radical to affect precursors and radical chemistry in the troposphere (Xia et al., 2021). To quantify the changes of O3 in response to PAN chemistry in the coastal city, two parallel scenarios (SC1 and SC2) were conducted based on the OBM model. The SC1 was the base scenario putting all detected data (i.e. VOCs, trace gases, and meteorological parameters) into the model with all reaction pathways (as described in Sect. 2.2), and the SC2 disabled the PAN chemistry, which is the only difference between SC2 and SC1. Figure 7 shows the differences of O3 net production rates P(O3), OH, HO2, RO2, NO, and NO2 between the SC1 and the SC2. Negative and positive values represented the inhibition and promotion effects of PAN photochemistry on O3 formation, respectively. Overall, PAN mostly inhibited the O3 formation during the observation days. P(O3) had significantly positive correlations with OH (R2=0.96 in spring and 0.95 in autumn), HO2 (R2=0.91 and 0.96), RO2 (R2=0.86 and 0.86), and NO2 (R2=0.72 and 0.85), and negative correlation with NO ( and −0.65). As shown in Fig. S8 in the Supplement, the promotion effects of PAN on O3 mainly happened during the periods of 11:00–16:00 local time, and most of them concentrated on PAN pollution episodes. The percentage of negative P(O3) values were 83 % and 69 % in spring and autumn, defined as “inhibition effect stages”, while the positive P(O3) values accounted for 17 % and 31 % in spring and autumn, defined as “promotion effect stages”.
Figure 8 shows the variations of modelled P(O3), O3 budgets, and ROx on the inhibition and promotion effect stages in spring and autumn. The abundance of ROx in autumn (2.85×10⁸ molecules cm−3) was higher than that in spring (2.08×10⁸ molecules cm−3) during inhibition effect stages, while the P(O3) value in autumn (5.24 ppbv h−1) was higher than that in spring (4.88 ppbv h−1). On the contrary, the level of ROx in spring (4.81×10⁸ molecules cm−3) was higher than that in autumn (4.20×10⁸ molecules cm−3) during promotion effect stages, and the P(O3) value (5.95 ppbv h−1) in spring was higher than that in autumn (5.76 ppbv h−1). The results indicated that high ROx concentration was an important factor for the formation of O3. In the case of closing PAN photochemistry, the P(O3) increased 1.20 and 1.12 times during inhibition effect stages and decreased 1.09 and 1.08 times during promotion effect stages in spring and autumn, respectively (Fig. 8a). This was consistent with the corresponding changes in ROx radical (Fig. 8b). During the inhibition effect stages, the averaged concentrations of OH, HO2, and RO2 increased 1.05, 1.16, and 1.17 times in spring, and increased 1.04, 1.10, and 1.12 times in autumn. During the promotion effect stages, the averaged concentrations of OH, HO2, and RO2 decreased 1.02, 1.03, and 1.06 times in spring, and decreased 1.02, 1.04, and 1.05 times in autumn. These results indicated that the changes in ROx dominated the P(O3) trend without PAN photochemistry. Furthermore, the P(O3) level during promotion effect stages (5.95 ppbv h−1 in spring, 5.76 ppbv h−1 in autumn) was higher than that during inhibition effect stages (4.88 ppbv h−1 in spring, 5.24 ppbv h−1 in autumn). For model-simulated P(O3) and O3 budgets (Fig. 8a), HO2+NO (account for 70 %±4 %) and RO2+NO (30 %±6 %) were the main pathways of O3 formation, and the main loss reactions were OH + NO2 (83 %±12 %).
PAN competed with O3 precursors and terminated the radical chain to suppress O3 formation by decreasing the ROx production during the inhibition effect stages. During the promotion effect stages, the intensive atmospheric oxidation capacity and photochemical reaction enhance the ROx formation rates from PAN to promote O3 formation (Fig. 8b).
3.4.2 The influencing factors during inhibition and promotion stages
Table S4 in the Supplement shows the air pollutants and meteorological parameters during the inhibition effect stages and promotion effect stages. In detail, the levels of CO and the precursors of O3 and PAN during the inhibition effect stages were significantly higher than those during the promotion effect stages. However, the PM2.5 level during the inhibition effect stages was relatively lower than that during the promotion effect stages, reflecting the influence of heterogeneous reactions on PM2.5 by supplying key photochemical oxidants to enhance PAN production (Xu et al., 2021). In addition, SO2 and wind speed were comparable during the two scenarios. During the promotion effect stages, UV and T were significantly high, while P and RH were significantly low (P<0.01). Meanwhile, the PAN (1.89 in spring, 1.58 ppbv in autumn) and O3 (50.26 ppbv in spring and 53.51 in autumn) under the promotion effects were higher than those under the inhibition effects (PAN: 1.04 and 0.84 ppbv; O3: 27.32 and 36.42 ppbv in spring and autumn, respectively).
In general, ROx radicals dominated the atmospheric oxidative capacity and were the indicators of atmospheric photochemical reaction (Li et al., 2018). According to Sect. 3.2 of the GAM analysis, we chose the factors of NO, TVOCs, PM2.5, UV, T, RH, WS, and ROx (ROx = OH + HO2 + RO2), to discuss the key influencing factors under promotion effect stages. Here, the P(O3) rate and the relevant influencing factors were set as the response and explanatory variables, respectively. Table 2 shows the influencing factors on P(O3) under promotion effects in spring and autumn. The factors that did not pass the significance test were deleted. As the adjusted model shows, the adjusted R2 and deviance explained for the smoothed variables in four GAM models ranged from 0.67 to 0.78 and 70 % to 80 %, respectively, verifying the good fitting effect of the multiple-factor GAM model. According to the F values, the effects of ROx (21.56 in spring; 45.45 in autumn) and UV (9.66 in spring; 30.55 in autumn) were the main factors leading to the promotion effect in both seasons. Both ROx and UV had significant positive non-linear relationships with P(O3) during promotion effect stages in both seasons (Figs. S9 and S10 in the Supplement). The minor influences of WS and T were observed in autumn. The promotion effects easily happened during periods of favourable meteorological conditions for photochemical reactions.
Liu et al. (2021) found that PAN photochemistry inhibited O3 production under low-NOx and low-ROx conditions, and promoted O3 formation under high-NOx conditions. However, in our study, surplus NOx prevented NOx from being the limiting factor photochemical formation of secondary pollution and the change in NOx could be ignored. Whether PAN photochemistry suppressed or enhanced O3 production mainly depended on the meteorological conditions of photochemical reaction and the ROx levels.
Field observation was continuously conducted in spring and autumn in a coastal city of Southeast China. We clarified the seasonal variations of PAN pollution, formation mechanisms, influencing factors, and impacts on O3 production. The average levels of PAN in autumn were lower than those in spring, while the O3 showed the opposite characteristics. The multiple-factor GAM model showed that the key factors on the PAN mixing ratio were UV, Ox, and T in spring, while Ox, TVOCs, T, and PM2.5 played important roles in PAN formation in autumn. The MCM model is an ideal tool to explore PAN photochemical formation and its key precursors at the species level and provides more relevant suggestions for reducing photochemical pollution. The controlling emissions of aromatics and alkenes with ≤5 carbons were beneficial for PAN pollution mitigation, and carbonyl compounds, especially acetaldehyde, were dominant in the PAN production mechanism. PAN presented the inhibition or promotion effects on O3 under different environmental conditions. The promotion effects of PAN on O3 mainly happened during the periods of 11:00–16:00 local time, most of which concentrated on PAN pollution episodes. According to the GAM analysis, the levels of ROx and UV were the main factors leading to the promotion effects in both seasons. Overall, PAN stimulated O3 formation under high levels of UV, T, and ROx in the coastal city. These results indicate that the monitoring of PAN and its precursors, and the quantification of its impacts on O3 formation, have significant guidance on photochemical pollution control. The scientific analysis methods used in this study provide a reference for the research on the formation mechanism of PAN and O3 in other regions.
The observation data at this site are available from the authors upon request.
The supplement related to this article is available online at: https://doi.org/10.5194/acp-22-4339-2022-supplement.
TL performed chemical modelling analyses of OBM-MCM and wrote the paper. TL collected the data and contributed to the data analysis. JC and YH designed and revised the paper. JC supported funding of observation and research. GC, LX, ML, YC, XJ, CY, and YC contributed to discussions of results. WH, QH, and HW provided part of the data in Xiamen.
The contact author has declared that neither they nor their co-authors have any competing interests.
Publisher’s note: Copernicus Publications remains neutral with regard to jurisdictional claims in published maps and institutional affiliations.
This study was funded by the Cultivating Project of Strategic Priority Research Program of the Chinese Academy of Sciences (XDPB1903), the FJIRSM&IUE Joint Research Fund (RHZX-2019-006), the Center for Excellence in Regional Atmospheric Environment, CAS (E0L1B20201), the Xiamen Youth Innovation Fund Project (3502Z20206094), the foreign cooperation project of Fujian Province (2020I0038), and Xiamen Atmospheric Environment Observation and Research Station of Fujian Province.
This research has been supported by the Cultivating Project of Strategic Priority Research Program of the Chinese Academy of Sciences (XDPB1903), the FJIRSM&IUE Joint Research Fund (RHZX-2019-006), the Center for Excellence in Regional Atmospheric Environment, CAS (E0L1B20201), the Xiamen Youth Innovation Fund Project (3502Z20206094), the foreign cooperation project of Fujian Province (2020I0038), and Xiamen Atmospheric Environment Observation and Research Station of Fujian Province.
This paper was edited by Tanja Schuck and reviewed by two anonymous referees.
Atkinson, R., Baulch, D. L., Cox, R. A., Crowley, J. N., Hampson, R. F., Hynes, R. G., Jenkin, M. E., Rossi, M. J., Troe, J., and IUPAC Subcommittee: Evaluated kinetic and photochemical data for atmospheric chemistry: Volume II – gas phase reactions of organic species, Atmos. Chem. Phys., 6, 3625–4055, https://doi.org/10.5194/acp-6-3625-2006, 2006.
Cardelino, C. A. and Chameides, W. L.: An observation-based model for analyzing ozone precursor relationships in the urban atmosphere, J. Air Waste Manag. Assoc., 45, 161–180, 1995.
Chen, T., Xue, L., Zheng, P., Zhang, Y., Liu, Y., Sun, J., Han, G., Li, H., Zhang, X., Li, Y., Li, H., Dong, C., Xu, F., Zhang, Q., and Wang, W.: Volatile organic compounds and ozone air pollution in an oil production region in northern China, Atmos. Chem. Phys., 20, 7069–7086, https://doi.org/10.5194/acp-20-7069-2020, 2020.
Fischer, E. V., Jaffe, D. A., Reidmiller, D. R., and Jaegle, L.: Meteorological controls on observed peroxyacetyl nitrate at Mount Bachelor during the spring of 2008, J. Geophys. Res.-Atmos., 115, D03302, https://doi.org/10.1029/2009jd012776, 2010.
Fischer, E. V., Jacob, D. J., Yantosca, R. M., Sulprizio, M. P., Millet, D. B., Mao, J., Paulot, F., Singh, H. B., Roiger, A., Ries, L., Talbot, R. W., Dzepina, K., and Pandey Deolal, S.: Atmospheric peroxyacetyl nitrate (PAN): a global budget and source attribution, Atmos. Chem. Phys., 14, 2679–2698, https://doi.org/10.5194/acp-14-2679-2014, 2014.
Gaffney, J. S., Marley, N., Cunningham, M. M., and Doskey, P. V.: Measurements of peroxyacyl nitrates (PANS) in Mexico city: implications for megacity air quality impacts on regional scales, Atmos. Environ., 33, 5003–5012, 1999.
Grosjean, E., Grosjean, D., Woodhouse, L. F., and Yang, Y. J.: Peroxyacetyl nitrate and peroxypropionyl nitrate in Porto Alegre, Brazil, Atmos. Environ., 36, 2405–2419, 2002.
Guan, L., Liang, Y., Tian, Y., Yang, Z., Sun, Y., and Feng, Y.: Quantitatively analyzing effects of meteorology and PM2.5 sources on low visual distance, Sci. Total Environ., 659, 764–772, 2019.
Han, J., Lee, M., Shang, X., Lee, G., and Emmons, L. K.: Decoupling peroxyacetyl nitrate from ozone in Chinese outflows observed at Gosan Climate Observatory, Atmos. Chem. Phys., 17, 10619–10631, https://doi.org/10.5194/acp-17-10619-2017, 2017.
He, X. and Lin, Z. S.: Interactive effects of the influencing factors on the changes of PM2.5 concentration based on GAM model, Environ. Sci., 38, 22–32, 2017.
Hu, B., Liu, T., Hong, Y., Xu, L., Li, M., Wu, X., Wang, H., Chen, J., and Chen, J.: Characteristics of peroxyacetyl nitrate (PAN) in a coastal city of southeastern China: Photochemical mechanism and pollution process, Sci. Total Environ., 719, 137493, doi:10.1016/j.scitotenv.2020.137493, 2020.
Hua, J., Zhang, Y., de Foy, B., Shang, J., Schauer, J. J., Mei, X., Sulaymon, I. D., and Han, T.: Quantitative estimation of meteorological impacts and the COVID-19 lockdown reductions on NO2 and PM2.5 over the Beijing area using Generalized Additive Models (GAM), J. Environ. Manage., 291, 112676, https://doi.org/10.1016/j.jenvman.2021.112676, 2021.
Jenkin, M. E., Saunders, S. M., Wagner, V., and Pilling, M. J.: Protocol for the development of the Master Chemical Mechanism, MCM v3 (Part B): tropospheric degradation of aromatic volatile organic compounds, Atmos. Chem. Phys., 3, 181–193, https://doi.org/10.5194/acp-3-181-2003, 2003.
Kleindienst, T. E.: Recent developments in the chemistry and biology of peroxyacetyl nitrate, Res. Chem. Intermed., 20, 335–384, 1994.
Li, B., Ho, S. S. H., Gong, S., Ni, J., Li, H., Han, L., Yang, Y., Qi, Y., and Zhao, D.: Characterization of VOCs and their related atmospheric processes in a central Chinese city during severe ozone pollution periods, Atmos. Chem. Phys., 19, 617–638, https://doi.org/10.5194/acp-19-617-2019, 2019.
Li, Z., Xue, L., Yang, X., Zha, Q., Tham, Y. J., Yan, C., Louie, P. K. K., Luk, C. W. Y., Wang, T., and Wang, W.: Oxidizing capacity of the rural atmosphere in Hong Kong, Southern China, Sci. Total Environ., 612, 1114–1122, https://doi.org/10.1016/j.scitotenv.2017.08.310, 2018.
Liu, L., Wang, X., Chen, J., Xue, L., Wang, W., Wen, L., Li, D., and Chen, T.: Understanding unusually high levels of peroxyacetyl nitrate (PAN) in winter in Urban Jinan, China, J. Environ. Sci. (China), 71, 249–260, https://doi.org/10.1016/j.jes.2018.05.015, 2018.
Liu, T., Hong, Y., Li, M., Xu, L., Chen, J., Bian, Y., Yang, C., Dan, Y., Zhang, Y., Xue, L., Zhao, M., Huang, Z., and Wang, H.: Atmospheric oxidation capacity and ozone pollution mechanism in a coastal city of southeastern China: analysis of a typical photochemical episode by an observation-based model, Atmos. Chem. Phys., 22, 2173–2190, https://doi.org/10.5194/acp-22-2173-2022, 2022.
Liu, T., Hu, B., Xu, X., Hong, Y., Zhang, Y., Wu, X., Xu, L., Li, M., Chen, Y., Chen, X., and Chen, J.: Characteristics of PM2.5-bound secondary organic aerosol tracers in a coastal city in Southeastern China: Seasonal patterns and pollution identification, Atmos. Environ., 237, 117710, https://doi.org/10.1016/j.atmosenv.2020.117710, 2020a.
Liu, T., Hu, B., Yang, Y., Li, M., Hong, Y., Xu, X., Xu, L., Chen, N., Chen, Y., Xiao, H., and Chen, J.: Characteristics and source apportionment of PM2.5 on an island in Southeast China: Impact of sea-salt and monsoon, Atmos. Res., 235, 104786, https://doi.org/10.1016/j.atmosres.2019.104786, 2020b.
Liu, Y., Shen, H., Mu, J., Li, H., Chen, T., Yang, J., Jiang, Y., Zhu, Y., Meng, H., Dong, C., Wang, W., and Xue, L.: Formation of peroxyacetyl nitrate (PAN) and its impact on ozone production in the coastal atmosphere of Qingdao, North China, Sci. Total Environ., 778, 146265, https://doi.org/10.1016/j.scitotenv.2021.146265, 2021.
Lonneman, W. A., Bufalini, J. J., and Seila, R. L.: PAN and oxidant measurement in ambient atmospheres, Environ. Sci. Technol., 10, 374–380, 1976.
Ma, Y., Ma, B., Jiao, H., Zhang, Y., Xin, J., and Yu, Z.: An analysis of the effects of weather and air pollution on tropospheric ozone using a generalized additive model in Western China: Lanzhou, Gansu, Atmos. Environ., 224, 117342, https://doi.org/10.1016/j.atmosenv.2020.117342, 2020.
Marley, N. A., Gaffney, J. S., Ramos-Villegas, R., and Cárdenas González, B.: Comparison of measurements of peroxyacyl nitrates and primary carbonaceous aerosol concentrations in Mexico City determined in 1997 and 2003, Atmos. Chem. Phys., 7, 2277–2285, https://doi.org/10.5194/acp-7-2277-2007, 2007.
Monks, P. S.: A review of the observations and origins of the spring ozone maximum, Atmos. Environ., 34, 3545–3561, 2000.
Moore, D. P. and Remedios, J. J.: Seasonality of Peroxyacetyl nitrate (PAN) in the upper troposphere and lower stratosphere using the MIPAS-E instrument, Atmos. Chem. Phys., 10, 6117–6128, https://doi.org/10.5194/acp-10-6117-2010, 2010.
Pallavi, Sinha, B., and Sinha, V.: Source apportionment of volatile organic compounds in the northwest Indo-Gangetic Plain using a positive matrix factorization model, Atmos. Chem. Phys., 19, 15467–15482, https://doi.org/10.5194/acp-19-15467-2019, 2019.
Penkett, S. A. and Brice, K. A.: The spring maximum in Photooxidants in the northern hemisphere troposphere, Nature, 319, 655–657, 1986.
Qian, X., Shen, H., and Chen, Z.: Characterizing summer and winter carbonyl compounds in Beijing atmosphere, Atmos. Environ., 214, 116845, https://doi.org/10.1016/j.atmosenv.2019.116845, 2019.
Roberts, J. M., Stroud, C. A., Jobson, B. T., Trainer, M., Hereid, D., Williams, E., Fehsenfeld, F., Brune, W., Martinez, M., and Harder, H.: Application of a sequential reaction model to PANs and aldehyde measurements in two urban areas, Geophys. Res. Lett., 28, 4583–4586, 2001.
Rubio, M. A., Lissi, E., Villena, G., Caroca, V., Gramsch, E., and Ruiz, A.: Estimation of hydroxyl and hydroperoxyl radicals concentrations in the urban atmosphere of Santiago, J. Chil. Chem. Soc., 50, 471–476, 2005.
Sarkar, C., Sinha, V., Sinha, B., Panday, A. K., Rupakheti, M., and Lawrence, M. G.: Source apportionment of NMVOCs in the Kathmandu Valley during the SusKat-ABC international field campaign using positive matrix factorization, Atmos. Chem. Phys., 17, 8129–8156, https://doi.org/10.5194/acp-17-8129-2017, 2017.
Saunders, S. M., Jenkin, M. E., Derwent, R. G., and Pilling, M. J.: Protocol for the development of the Master Chemical Mechanism, MCM v3 (Part A): tropospheric degradation of non-aromatic volatile organic compounds, Atmos. Chem. Phys., 3, 161–180, https://doi.org/10.5194/acp-3-161-2003, 2003.
Sun, M., Cui, J. N., Zhao, X. M., and Zhang, J. B.: Impacts of precursors on peroxyacetyl nitrate (PAN) and relative formation of PAN to ozone in a southwestern megacity of China, Atmos. Environ., 231, 117542, https://doi.org/10.1016/j.atmosenv.2020.117542, 2020.
Tan, Z., Lu, K., Jiang, M., Su, R., Wang, H., Lou, S., Fu, Q., Zhai, C., Tan, Q., Yue, D., Chen, D., Wang, Z., Xie, S., Zeng, L., and Zhang, Y.: Daytime atmospheric oxidation capacity in four Chinese megacities during the photochemically polluted season: a case study based on box model simulation, Atmos. Chem. Phys., 19, 3493–3513, https://doi.org/10.5194/acp-19-3493-2019, 2019.
Temple, P. J. and Taylor, O. C.: World-wide ambient measurements of peroxyacetyl nitrate (PAN) and implications for plant injury, Atmos. Environ., 17, 1583–1587, 1983.
Tyndall, G. S., Cox, R.A., Granier, C., Lesclaux, R., Moortgat, G. K., Pilling, M. J., Ravishankara, A. R., and Wallington, T. J.: Atmospheric chemistry of small organic peroxy radicals, J. Geophys. Res.-Atmos., 106, 12157–12182, 2001.
Wolfe, G. M., Cantrell, C., Kim, S., Mauldin III, R. L., Karl, T., Harley, P., Turnipseed, A., Zheng, W., Flocke, F., Apel, E. C., Hornbrook, R. S., Hall, S. R., Ullmann, K., Henry, S. B., DiGangi, J. P., Boyle, E. S., Kaser, L., Schnitzhofer, R., Hansel, A., Graus, M., Nakashima, Y., Kajii, Y., Guenther, A., and Keutsch, F. N.: Missing peroxy radical sources within a summertime ponderosa pine forest, Atmos. Chem. Phys., 14, 4715–4732, https://doi.org/10.5194/acp-14-4715-2014, 2014.
Wu, X., Xu, L., Hong, Y., Chen, J., Qiu, Y., Hu, B., Hong, Z., Zhang, Y., Liu, T., Chen, Y., Bian, Y., Zhao, G., Chen, J., and Li, M.: The air pollution governed by subtropical high in a coastal city in Southeast China: Formation processes and influencing mechanisms, Sci. Total Environ., 692, 1135–1145, https://doi.org/10.1016/j.scitotenv.2019.07.341, 2019.
Wu, X., Li, M., Chen, J., Wang, H., Xu, L., Hong, Y., Zhao, G., Hu, B., Zhang, Y., Dan, Y., and Yu, S.: The characteristics of air pollution induced by the quasi-stationary front: Formation processes and influencing factors, Sci. Total Environ., 707, 136194, https://doi.org/10.1016/j.scitotenv.2019.136194, 2020.
Xia, S. Y., Zhu, B., Wang, S. X., Huang, X. F., and He, L. Y.: Spatial distribution and source apportionment of peroxyacetyl nitrate (PAN) in a coastal region in southern China, Atmos. Environ., 260, 118553, https://doi.org/10.1016/j.atmosenv.2021.118553, 2021.
Xu, W., Zhang, G., Wang, Y., Tong, S., Zhang, W., Ma, Z., Lin, W., Kuang, Y., Yin, L., and Xu, X.: Aerosol Promotes Peroxyacetyl Nitrate Formation During Winter in the North China Plain, Environ. Sci. Technol., 55, 3568–3581, https://doi.org/10.1021/acs.est.0c08157, 2021.
Xu, X., Zhang, H., Lin, W., Wang, Y., Xu, W., and Jia, S.: First simultaneous measurements of peroxyacetyl nitrate (PAN) and ozone at Nam Co in the central Tibetan Plateau: impacts from the PBL evolution and transport processes, Atmos. Chem. Phys., 18, 5199–5217, https://doi.org/10.5194/acp-18-5199-2018, 2018.
Xue, L., Wang, T., Wang, X., Blake, D. R., Gao, J., Nie, W., Gao, R., Gao, X., Xu, Z., Ding, A., Huang, Y., Lee, S., Chen, Y., Wang, S., Chai, F., Zhang, Q., and Wang, W.: On the use of an explicit chemical mechanism to dissect peroxy acetyl nitrate formation, Environ. Pollut., 195, 39–47, 2014.
Xue, L., Gu, R., Wang, T., Wang, X., Saunders, S., Blake, D., Louie, P. K. K., Luk, C. W. Y., Simpson, I., Xu, Z., Wang, Z., Gao, Y., Lee, S., Mellouki, A., and Wang, W.: Oxidative capacity and radical chemistry in the polluted atmosphere of Hong Kong and Pearl River Delta region: analysis of a severe photochemical smog episode, Atmos. Chem. Phys., 16, 9891–9903, https://doi.org/10.5194/acp-16-9891-2016, 2016.
Yan, R. E., Ye, H., Lin, X., He, X., Chen, C., Shen, J. D., Xu, K. E., Zhen, X. Y., and Wang, L. J.: Characteristics and influence factors of ozone pollution in Hangzhou, Acta Sci. Circumstantiae, 38, 1128–1136, 2018.
Yuan, J., Ling, Z., Wang, Z., Lu, X., Fan, S., He, Z., Guo, H., Wang, X., and Wang, N.: PAN–Precursor Relationship and Process Analysis of PAN Variations in the Pearl River Delta Region, Atmosphere, 9, 372, https://doi.org/10.3390/atmos9100372, 2018.
Zeng, L. W., Fan, G. J., Lyu, X. P., Guo, H., Wang, J. L., and Yao, D. W.: Atmospheric fate of peroxyacetyl nitrate in suburban Hong Kong and its impact on local ozone pollution, Environ. Pollut., 252, 1910–1919, 2019.
Zhang, B. Y., Zhao, X. M., and Zhang, J. B.: Characteristics of peroxyacetyl nitrate pollution during a 2015 winter haze episode in Beijing, Environ. Pollut., 244, 379–387, 2019.
Zhang, G., Mu, Y. J., Zhou, L. X., Zhang, C. L., Zhang, Y. Y., Liu, J. F., Fang, S. X., and Yao, B.: Summertime distributions of peroxyacetyl nitrate (PAN) and peroxypropionyl nitrate (PPN) in Beijing: understanding the sources and major sink of PAN, Atmos. Environ., 103, 289–296, 2015.