the Creative Commons Attribution 4.0 License.
the Creative Commons Attribution 4.0 License.
 | 30 Mar 2022
Direct observations indicate photodegradable oxygenated volatile organic compounds (OVOCs) as larger contributors to radicals and ozone production in the atmosphere
Wenjie Wang
Yuwen Peng
Yafang Cheng
Suxia Yang
Caihong Wu
Jipeng Qi
Fengxia Bao
Yibo Huangfu
Chaomin Wang
Chenshuo Ye
Zelong Wang
Baolin Wang
Xinming Wang
Wei Song
Weiwei Hu
Peng Cheng
Manni Zhu
Junyu Zheng
Min Shao
Volatile organic compounds (VOCs) regulate atmospheric oxidation capacity, and the reactions of VOCs are key in understanding ozone formation and its mitigation strategies. When evaluating their impact, most previous studies did not fully consider the role of oxygenated VOCs due to limitations of measurement technology. By using a proton-transfer-reaction time-of-flight mass spectrometer (PTR-ToF-MS) combined with a gas chromatograph–mass spectrometer (GC–MS), a large number of oxygenated VOCs (OVOCs) have been quantified in Guangzhou city, China. Based on the new dataset, we demonstrate that constraints using OVOC observations are essential in modeling radical and ozone production, as modeled OVOCs can be substantially lower than measurements, potentially due to primary emissions and/or missing secondary sources. Non-formaldehyde (HCHO) OVOCs can contribute large fractions (22 %–44 %) of total ROx radical production, which are comparable to or larger than the contributions from nitrous acid and formaldehyde. Our results show that models without OVOC constraints using ambient measurements will underestimate the production rates of ROx and ozone, and they may also affect the determination of sensitivity regime in ozone formation. Therefore, a thorough quantification of photodegradable OVOC species is in urgent need to understand accurately the ozone chemistry and to develop effective control strategies.
- Article
(2130 KB) - Full-text XML
-
Supplement
(931 KB) - BibTeX
- EndNote


Ground-level ozone is generated by photochemical oxidation of volatile organic compounds (VOCs) under the catalysis of nitrogen oxides (NOx) and hydrogen oxide radicals (HOx = OH + HO2) (Atkinson, 2000; Monks et al., 2015). In this process, photolysis reactions are a crucial driving force (Wang et al., 2019). Photolysis of O3, nitrous acid (HONO), and oxygenated VOCs (OVOCs) can contribute to primary production of ROx (OH + HO2 + RO2) radicals, thereby accelerating the recycling of radicals to generate ozone (Volkamer et al., 2010). The strong dependence of OH concentration on j(O1D) was found in a number of field measurements (Ehhalt and Rohrer, 2000; Rohrer et al., 2014b; Stone et al., 2012), implying the dominant role of ultraviolet radiation and photolysis reactions in the production of HOx radicals. Edwards et al. (2014) found that the high ozone pollution in an oil and gas producing basin in the USA in winter was caused by the photolysis of high concentrations of OVOCs to generate sufficient oxidants. A recent model simulation with limited OVOC measurements by Qu et al. (2021) indicated that OVOC species are the largest free-radical source in the boundary layer. Another study indicated that fast ozone production during winter haze episodes in China was driven by HOx radicals derived from photolysis of formaldehyde (HCHO), overcoming radical titration induced by NOx emissions (Li et al., 2021). Furthermore, high loading of aerosols can largely influence the production of radicals and ozone through altering photolysis reaction rate (W. Wang et al., 2019, 2020, 2021a). Therefore, an accurate quantification of numerous photolysis reactions is necessary to understand the mechanism of ROx radical and ozone production.
However, only a limited number of photodegradable OVOC species, such as formaldehyde, acetaldehyde, and acetone, have been measured in the field campaigns in China due to the limitations on available instrumentation (Lu et al., 2013, 2012; Tan et al., 2018, 2019a). Many important photodegradable OVOCs, such as larger aldehydes and ketones, carboxylic acids, nitrophenols, organic peroxides, and multifunctional species, have been rarely quantified accurately in ambient environments. In such cases, the quantification of the primary production of ROx radicals induced by photolysis reactions may not be adequately accurate. Many studies used photochemical models to simulate unmeasured OVOC species (Tan et al., 2019b; Volkamer et al., 2010; Ling et al., 2014; Edwards et al., 2014). However, large uncertainties in the simulation of OVOCs remain due to primary emissions of OVOCs (McDonald et al., 2018; Karl et al., 2018; Gkatzelis et al., 2021), missing secondary sources (Bloss et al., 2005; Ji et al., 2017), heterogenous uptake on aerosols, and unknown dilution and transmission processes (Li et al., 2014). For instance, chamber experiments of the oxidation of aromatics by OH radical indicated that the Master Chemical Mechanism (MCM) generally underestimated the formation of aldehydes, ketones, and phenols by 10 %–70 % (Bloss et al., 2005; Ji et al., 2017), implying the existence of an unknown production pathways for these OVOC species. Furthermore, model simulations frequently underestimated observed ROx radicals in ambient studies of ROx radicals (Hofzumahaus et al., 2009; Tan et al., 2018; Lelieveld et al., 2008; Rohrer et al., 2014a; Sheehy et al., 2010; Emmerson et al., 2005; Ma et al., 2019). Given that only limited photodegradable OVOC species were measured in these studies, the lack of comprehensive measurements of OVOCs to constrain the model is likely to be a cause of the underestimation.
Thus far, the concrete effects of photodegradable OVOCs on radical and ozone production remains unexplored in China. Based on comprehensive field observations in a mega-city in southern China, a variety of important photodegradable OVOC species were measured. The contributions of these photodegradable OVOC species to the production of ROx radicals are quantified, and the effect of photolysis reactions on ozone production is quantitatively assessed.
2.1 OVOC measurements
Field measurements were conducted at an urban site in Guangzhou (23∘ N, 113.2∘ E) from 14 September to 20 November 2018. The sampling site is located on the ninth floor of a building on the campus of Guangzhou Institute of Geochemistry, Chinese Academy of Sciences, 25 m above the ground level. This site is regarded as a typical urban site in Guangzhou and is influenced by industrial and vehicle emissions.
During this campaign, an online proton-transfer-reaction time-of-flight mass spectrometer (PTR-ToF-MS, Ionicon Analytic GmbH, Innsbruck, Austria) with H3O+ and NO+ chemistry was used to measure ambient volatile organic compounds (VOCs) (C. Wang et al., 2020; Wu et al., 2020). The PTR-ToF-MS automatically switches between H3O+ and NO+ modes every 10–20 min. In each mode, the background and ambient measurements were automatically switched to a custom-built platinum catalytic converter heated to 365 ∘C for 3 min to determine the background of the instrument. The time resolution of the measurement of PTR-ToF-MS was 10 s. A total of 31 VOCs species were calibrated using either gas cylinders or liquid standards. For other measured VOCs, we used the method proposed by Sekimoto et al. (2017) to determine the relationship between VOC sensitivity and kinetic rate constants for proton transfer reactions of H3O+ with VOCs. The fitted line was used to determine the concentrations of those uncalibrated species. Following the discussions in Sekimoto et al. (2017), the uncertainties of the concentrations for uncalibrated species were about 50 %. Humidity dependencies of various VOCs were determined in the laboratory with absolute humidity in the range of 0–30 mmol mol−1 (relative humidity of 0 %–92 % at 25∘), which fully covered the humidity range encountered during the entire campaign. The detailed introduction of this method has been reported by Wu et al. (2020).
Notably, PTR-ToF-MS is not capable of distinguishing isomers (Yuan et al., 2017). The GC–MS technique was used to measure several carbonyls that PTR-ToF-MS cannot distinguish, including acetaldehyde, propionaldehyde, n-butanal, n-pentanal, n-hexanal, methacrolein (MACR), and methyl vinyl ketone (MVK). We compared concentrations of common OVOC species measured by both GC–MS and PTR-ToF-MS. The agreement of measurement results from the two instruments is quite consistent (Fig. S1 in the Supplement). In addition to GC–MS, an iodide time-of-flight chemical ionization mass spectrometer (ToF-CIMS) was used to measure propionic acid. Combined with the measurements of GC–MS and CIMS, the isomers measured by PTR-ToF-MS can be distinguished. In OVOC species, hydroxyacetone and propionic acid (C3H6O2), acetone and propanal (C3H6O), methyl ethyl ketone and butanal (C4H8O), and MVK and MACR (C4H6O) are all isomers. The average concentration of propionic acid measured by CIMS was 0.23 ppb, which is significantly lower than the concentrations of C3H6O2 measured by PTR-ToF-MS (∼ 1.5 ppb). The hydroxyacetone concentrations were determined by the difference between PTR-ToF-MS and CIMS measurements. Meanwhile, the concentration of propanal (average of 0.35 ppb) and n-butanal (average of 0.17 ppb) measured by GC–MS were also respectively far lower than the concentration of C3H6O (average of 4.4 ppb) and C4H8O (average of 1.8 ppb) measured by PTR-ToF-MS. The concentrations of acetone and methyl ethyl ketone were determined by the difference between PTR-ToF-MS and GC–MS measurements. The concentrations of MVK and MACR were determined according to C4H6O concentration measured by PTR-ToF-MS and the ratio of MVK to MACR measured by GC–MS. In this way, the uncertainty of PTR-ToF-MS induced by isomers is greatly reduced.
Concentrations of CH4O2 and CH4O3 were quantified by PTR-ToF-MS, which were tentatively attributed to methyl hydroperoxide (CH3OOH) and hydroxymethyl hydroperoxide (HOCH2OOH), respectively. Furthermore, concentrations of several small-carbon-number acids, including formic acid, acetic acid, and propionic acid, were measured by PTR-ToF-MS (Fig. S2). However, the photolysis wavelength bands of these species are all less than 260 nm. Given that the sunlight wavelengths that can reach the ground are generally longer than 290 nm, these small-carbon-number acids cannot photolyze significantly near the ground. One exception is pyruvic acid which is also a small-carbon-number acid but with a wide photolysis band that can reach 460 nm because of its additional carbonyl functional group (Horowitz et al., 2001; Mellouki and Mu, 2003; Berges and Warneck, 1992). Therefore, the photolysis of pyruvic acid was included in the analysis as it can significantly contribute to the production of ROx radicals.
In addition to the specific species mentioned above, PTR-ToF-MS measured carbonyls with higher carbon number including CnH2nO (n > 5), CnH2n−2O (n > 3), CnH2n−2O2 (n > 3), CnH2n−4O2 (n > 3), and CnH2n−4O3 (n > 3). Apparently, multiple isomers that cannot be distinguished specifically may contribute to these species. The measured photodegradable OVOC species and their concentrations are summarized in Table S1.
2.2 Other measurements
HONO was measured by a custom-built LOPAP (LOng Path Absorption Photometer) based on wet chemical sampling and photometric detection (Yu et al., 2021). HCHO was measured by a custom-built instrument based on the Hantzsch reaction and absorption photometry. Total OH reactivity was measured by the comparative reactivity method (CRM) (Sinha et al., 2008; Wang et al., 2021b). In this method, pyrrole (C4H5N) was used as the reference substance and was quantified by a quadrupole PTR-MS (Ionicon Analytic, Austria). Non-methane hydrocarbons (NMHCs) were measured using a gas chromatograph–mass spectrometer system with flame ionization detector (GC–MS/FID), coupled with a cryogen-free preconcentration device. Nitrogen oxides (NOx = NO + NO2), ozone (O3), sulfur dioxide (SO2), and carbon monoxide (CO) were measured by a NOx analyzer (Thermo Scientific, model 42i), O3 analyzer (Thermo Scientific, model 49i), SO2 analyzer (Thermo Scientific, model 43i), and CO analyzer (Thermo Scientific, model 48i), respectively. The meteorological data, including temperature (T), relative humidity (RH), and wind speed and direction (WS, WD) were recorded by a Vantage Pro2 Weather Station (Davis Instruments Inc., Vantage Pro2) with the time resolution of 1 min. Photolysis frequencies including j(HONO), j(NO2), j(H2O2), j(HCHO) and j(O1D) were measured by a spectrometer (Focused Photonics Inc., PFS-100).
2.3 Observation-based box model
A zero-dimensional box model coupled with the Master Chemical Mechanism (MCM) v3.3.1 (Jenkin et al., 2003; Saunders et al., 2003) was used to simulate ROx production and losses, and O3 production rates during the field campaign. The model simulation was constrained to the observations of meteorological parameters; photolysis frequencies; and concentrations of non-methane hydrocarbons (NMHCs), OVOCs, NO, NO2, O3, CO, SO2, and nitrous acid (HONO). All constraints were averaged to generate a synchronized 1 h time resolution dataset. The model runs were performed in a time-dependent mode with time resolution of 1 h and spin-up of 2 d. There is no significant difference in simulated OH and HO2 concentrations between 1 h and 5 min time resolution (Fig. S3). A 24 h lifetime was introduced for all simulated species, including secondary species and radicals, to approximately simulate dry deposition and other losses of these species (Lu et al., 2013; W. Wang et al., 2020). Sensitivity tests show that this assumed physical loss lifetime has a relatively small influence on the reactivity of modeled oxidation products, ROx radicals, and ozone production rates. A 50 % change in the physical loss lifetime leads to 3 %, 6 %, and 10 % changes in OH concentration, HO2 concentration, and ozone production rate, respectively. The ozone production rate (P(O3)) was calculated according to Eq. (1):
The production rate of ROx radicals (P(ROx)) is equal to the sum of the rates at which all photodegradable species generate ROx radicals through the photolysis reactions, as shown in Eq. (2).
where θ is the fraction of O1D from ozone photolysis that reacts with water vapor. OVOCi represents each OVOC species, ji represents the photolysis frequency of each OVOC species, and ki represents the number of ROx radicals generated from the photolysis of each OVOC molecule. For most OVOC species, ki is equal to 2 or 1.
The photolysis frequencies of measured photodegradable species were calculated based on measured actinic flux combined with absorption cross sections and photolysis quantum yields reported in Jet Propulsion Laboratory (JPL) publication (Burkholder et al., 2015). Note that absorption cross sections and quantum yields all correspond to radical formation channles, and they do not include contributions from channels forming stable molecules. However, absorption cross sections and photolysis quantum yields for nitrophenol and methyl nitrophenol are unavailable from the JPL publication. Yuan et al. (2016) have reported that photolysis was the most efficient loss pathway for nitrophenol in the gas phase. Different values of absorption cross sections and quantum yields for nitrophenol have been reported (Chen et al., 2011; Sangwan and Zhu, 2018; Bejan et al., 2006). In this study, we used the values from Chen et al. (2011), which can reproduce well the observed concentrations of nitrophenol and methyl nitrophenol during the measurement period.
Absorption cross sections and quantum yields are not available for carbonyls with large carbon number, and absorption cross sections and quantum yields of species with similar structure are used as a surrogate, following the method described in Jenkin et al. (1997) (e.g., C2H5C(O)CH3 is used as a surrogate for aliphatic ketones with more carbons). Another issue is that carbonyls with large carbon number (CnH2nO, n > 5; CnH2n−2O, n > 3; CnH2n−2O2, n > 3; CnH2n−4O2, n > 3; CnH2n−4O3, n > 3) measured by PTR-ToF-MS may include contributions from multiple isomers, and the fraction of each individual species cannot be obtained. Hence, each molecular formula corresponds to multiple molecular structures and thus corresponds to multiple photolysis frequencies. Here, we calculate the P(ROx) of these species in two scenarios: (1) each molecular formula corresponds to minimum photolysis frequency of all potential species (e.g., aliphatic ketones); (2) each molecular formula corresponds to maximum photolysis frequency of all potential species (e.g., aldehydes). As a result, photolysis frequencies of these carbonyls with large carbon number were assigned to the ranges of 1.2 × 10⁻⁶–6.5 × 10⁻⁶, 1.2 × 10⁻⁶–6.5 × 10⁻⁶, 1.2 × 10⁻⁶–1.2 × 10⁻⁴, 1.2 × 10⁻⁶–3.0 × 10⁻⁴, and 1.2 × 10⁻⁶–1.8 × 10⁻⁴ s−1 (Jenkin et al., 1997) (Table S1). The lowest and highest values of these photolysis frequencies were separately used to determine the lower and upper limits of P(ROx). Therefore, the total P(ROx) contributed by all these OVOC species could be investigated.
3.1 Overview of the observations
During the observation period, we used PTR-ToF-MS and GC–MS instruments to measure more than 20 photodegradable OVOC species. The concentrations and photolysis frequencies of measured photodegradable OVOC species are summarized in Table S1 and Fig. 1. Previous studies have reported that these species have relatively large absorption cross section and quantum yield (Burkholder et al., 2015). The measured daytime average photolysis frequencies for these species were generally larger than 1.3 × 10⁻⁶ s−1.
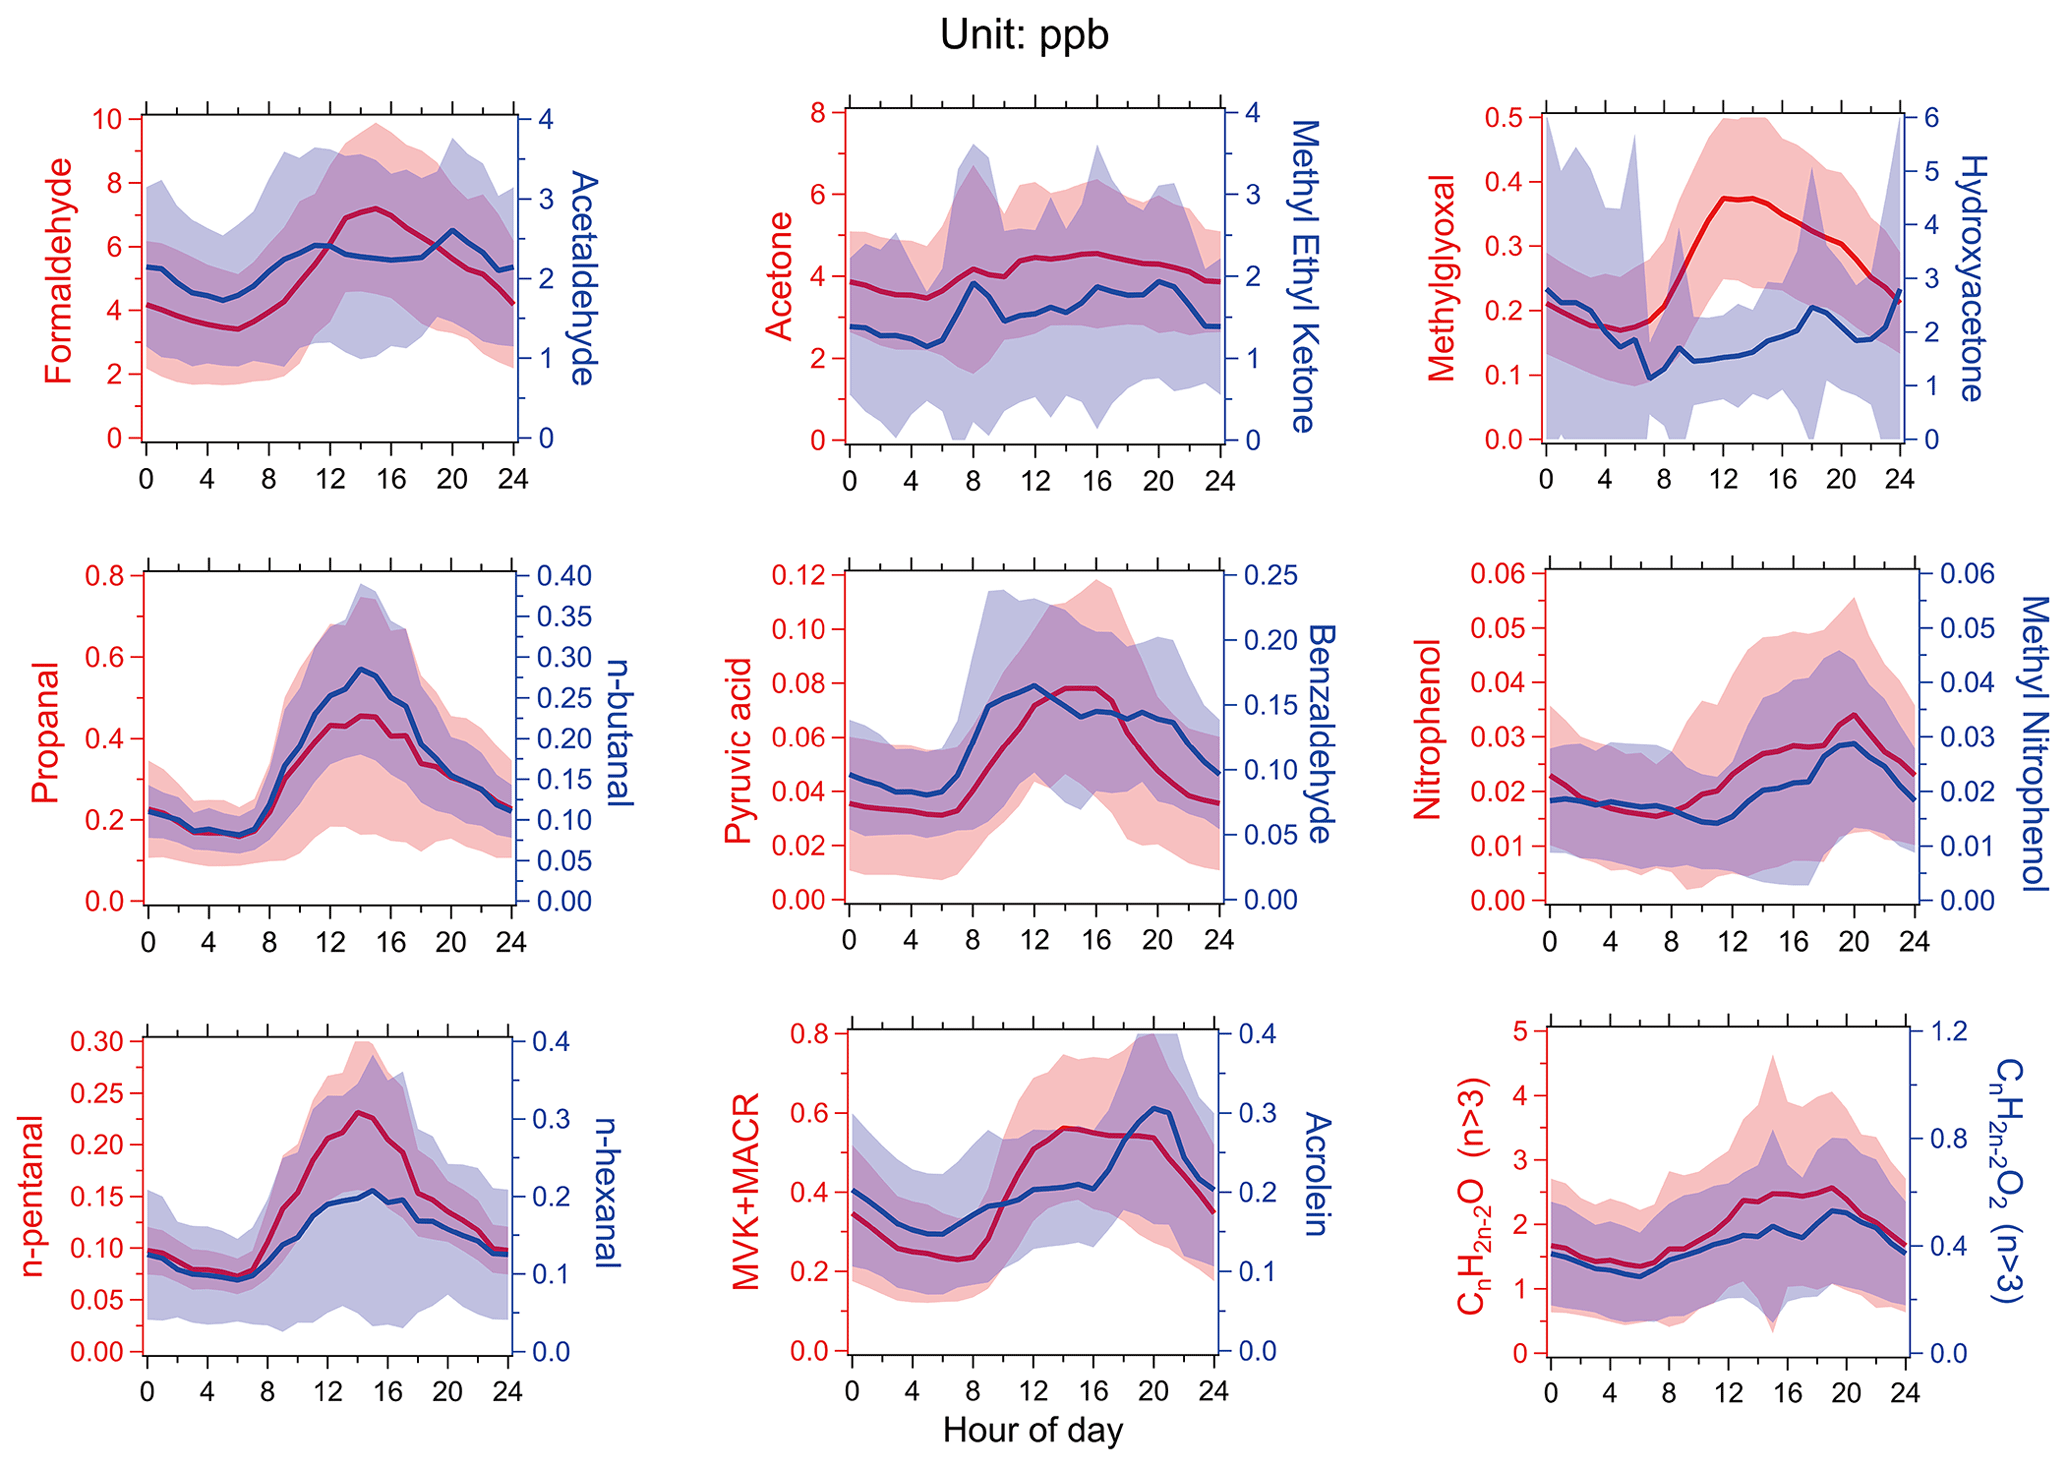
Figure 1The average diurnal variations of the concentrations of photodegradable OVOC species during the field campaign in Guangzhou. Lines and shading represent averages and standard deviations, respectively.
Figure 1 presents the average diurnal variation of photodegradable OVOC species during the measurement period. The concentrations of these species ranged from 0.01 to 10 ppb. HCHO, methylglyoxal, propionaldehyde, n-butanal, n-pentanal, MVK + MACR, pyruvic acid, formic acid, acetic acid, and CH3OOH had similar diurnal variation patterns. The concentrations of these species started to increase from about 06:00 China Standard Time (CST, GMT+8) in the morning and peaked during 13:00–16:00 CST, after which the concentrations gradually decreased. This diurnal variation pattern is a typical secondary production pattern; thus, we deduce that these species primarily came from secondary production. Acetaldehyde, acetone, and acrolein showed diurnal variations without significant variations throughout the day, as these species were contributed to by both secondary generation and primary emissions or background contribution (Wu et al., 2020). It is notable that acrolein, nitrophenol and methylnitrophenol all peaked at 20:00 CST in the evening, which is likely due to primary emissions, e.g., biomass burning due to wild or agricultural fires (Ye et al., 2021) and vehicle emissions.
The ratio of secondary OVOCs to NMHCs can characterize the degree of the conversion of emitted NMHC to secondary OVOCs through oxidation reactions. Figure S4 presents the correlation between daily daytime average of HCHO (and pyruvic acid) concentration versus OH reactivity from hydrocarbons, i.e., HCHO ROH_NMHC ratio (and pyruvic acid ROH_NMHC ratio) and j(NO2). Both HCHO ROH_NMHC and pyruvic acid ROH_NMHC ratios displayed significant positive correlation with j(NO2). These results suggest that the enhancement of the photolysis rates converted more NMHCs into secondary OVOCs, suggesting the crucial role of photolysis reactions in the air mass aging and the occurrence of secondary pollution.
3.2 Contribution of photolysis reactions to the production of ROx radicals
The photolysis of O3, HONO, and OVOCs are the most important contributors to the production of ROx radicals. All observed photodegradable species, including O3, HONO, and OVOCs, were constrained in the box model to calculate P(ROx). The simulated total P(ROx) contains the contributions from all observed photodegradable species and several simulated OVOCs that was not measured such as glyoxal. Using the possible ranges of photolysis frequencies of carbonyls with larger carbon number that are not possible to assign into specific individual species, we can obtain the possible widest variation range of P(ROx). As shown in Fig. 2a, the minimum (red solid line) and maximum (red dashed line) of P(ROx) calculated during the campaign peaked at 3.6 and 5.4 ppb h−1, respectively. The P(ROx) determined in this study is very close to those reported in the Autumn 2014 in Pearl River Delta with peak values of 3–4 ppb h−1 (Tan et al., 2019a) and the summer 2014 in Wangdu, Hebei (peak value of 5 ppb h−1) (Tan et al., 2017); lower than those in the summer 2006 in Beijing (peak value of about 7 ppb h−1) (Lu et al., 2013) and the summer 2006 in Guangzhou (peak value of about 10 ppb h−1) (Lu et al., 2012); and higher than those in the winter of 2016 in Beijing (peak value of about 1 ppb h−1) (Tan et al., 2018) and the winter in the oil and gas basin of Utah, USA (daytime average value of 0.77 ppb h−1) (Edwards et al., 2014). Note that these previous studies mentioned above usually only measured a few simple carbonyls such as HCHO, acetaldehyde, and acetone, and the P(ROx) contributed by photolysis of other OVOCs was calculated by model simulations, which may lead to large uncertainties, due to various possibilities in modeling errors, including missing primary emissions of OVOCs (McDonald et al., 2018), unknown secondary sources of OVOCs (Bloss et al., 2005; Ji et al., 2017), heterogenous uptake on aerosols, and unknown dilution and transport processes (Li et al., 2014).
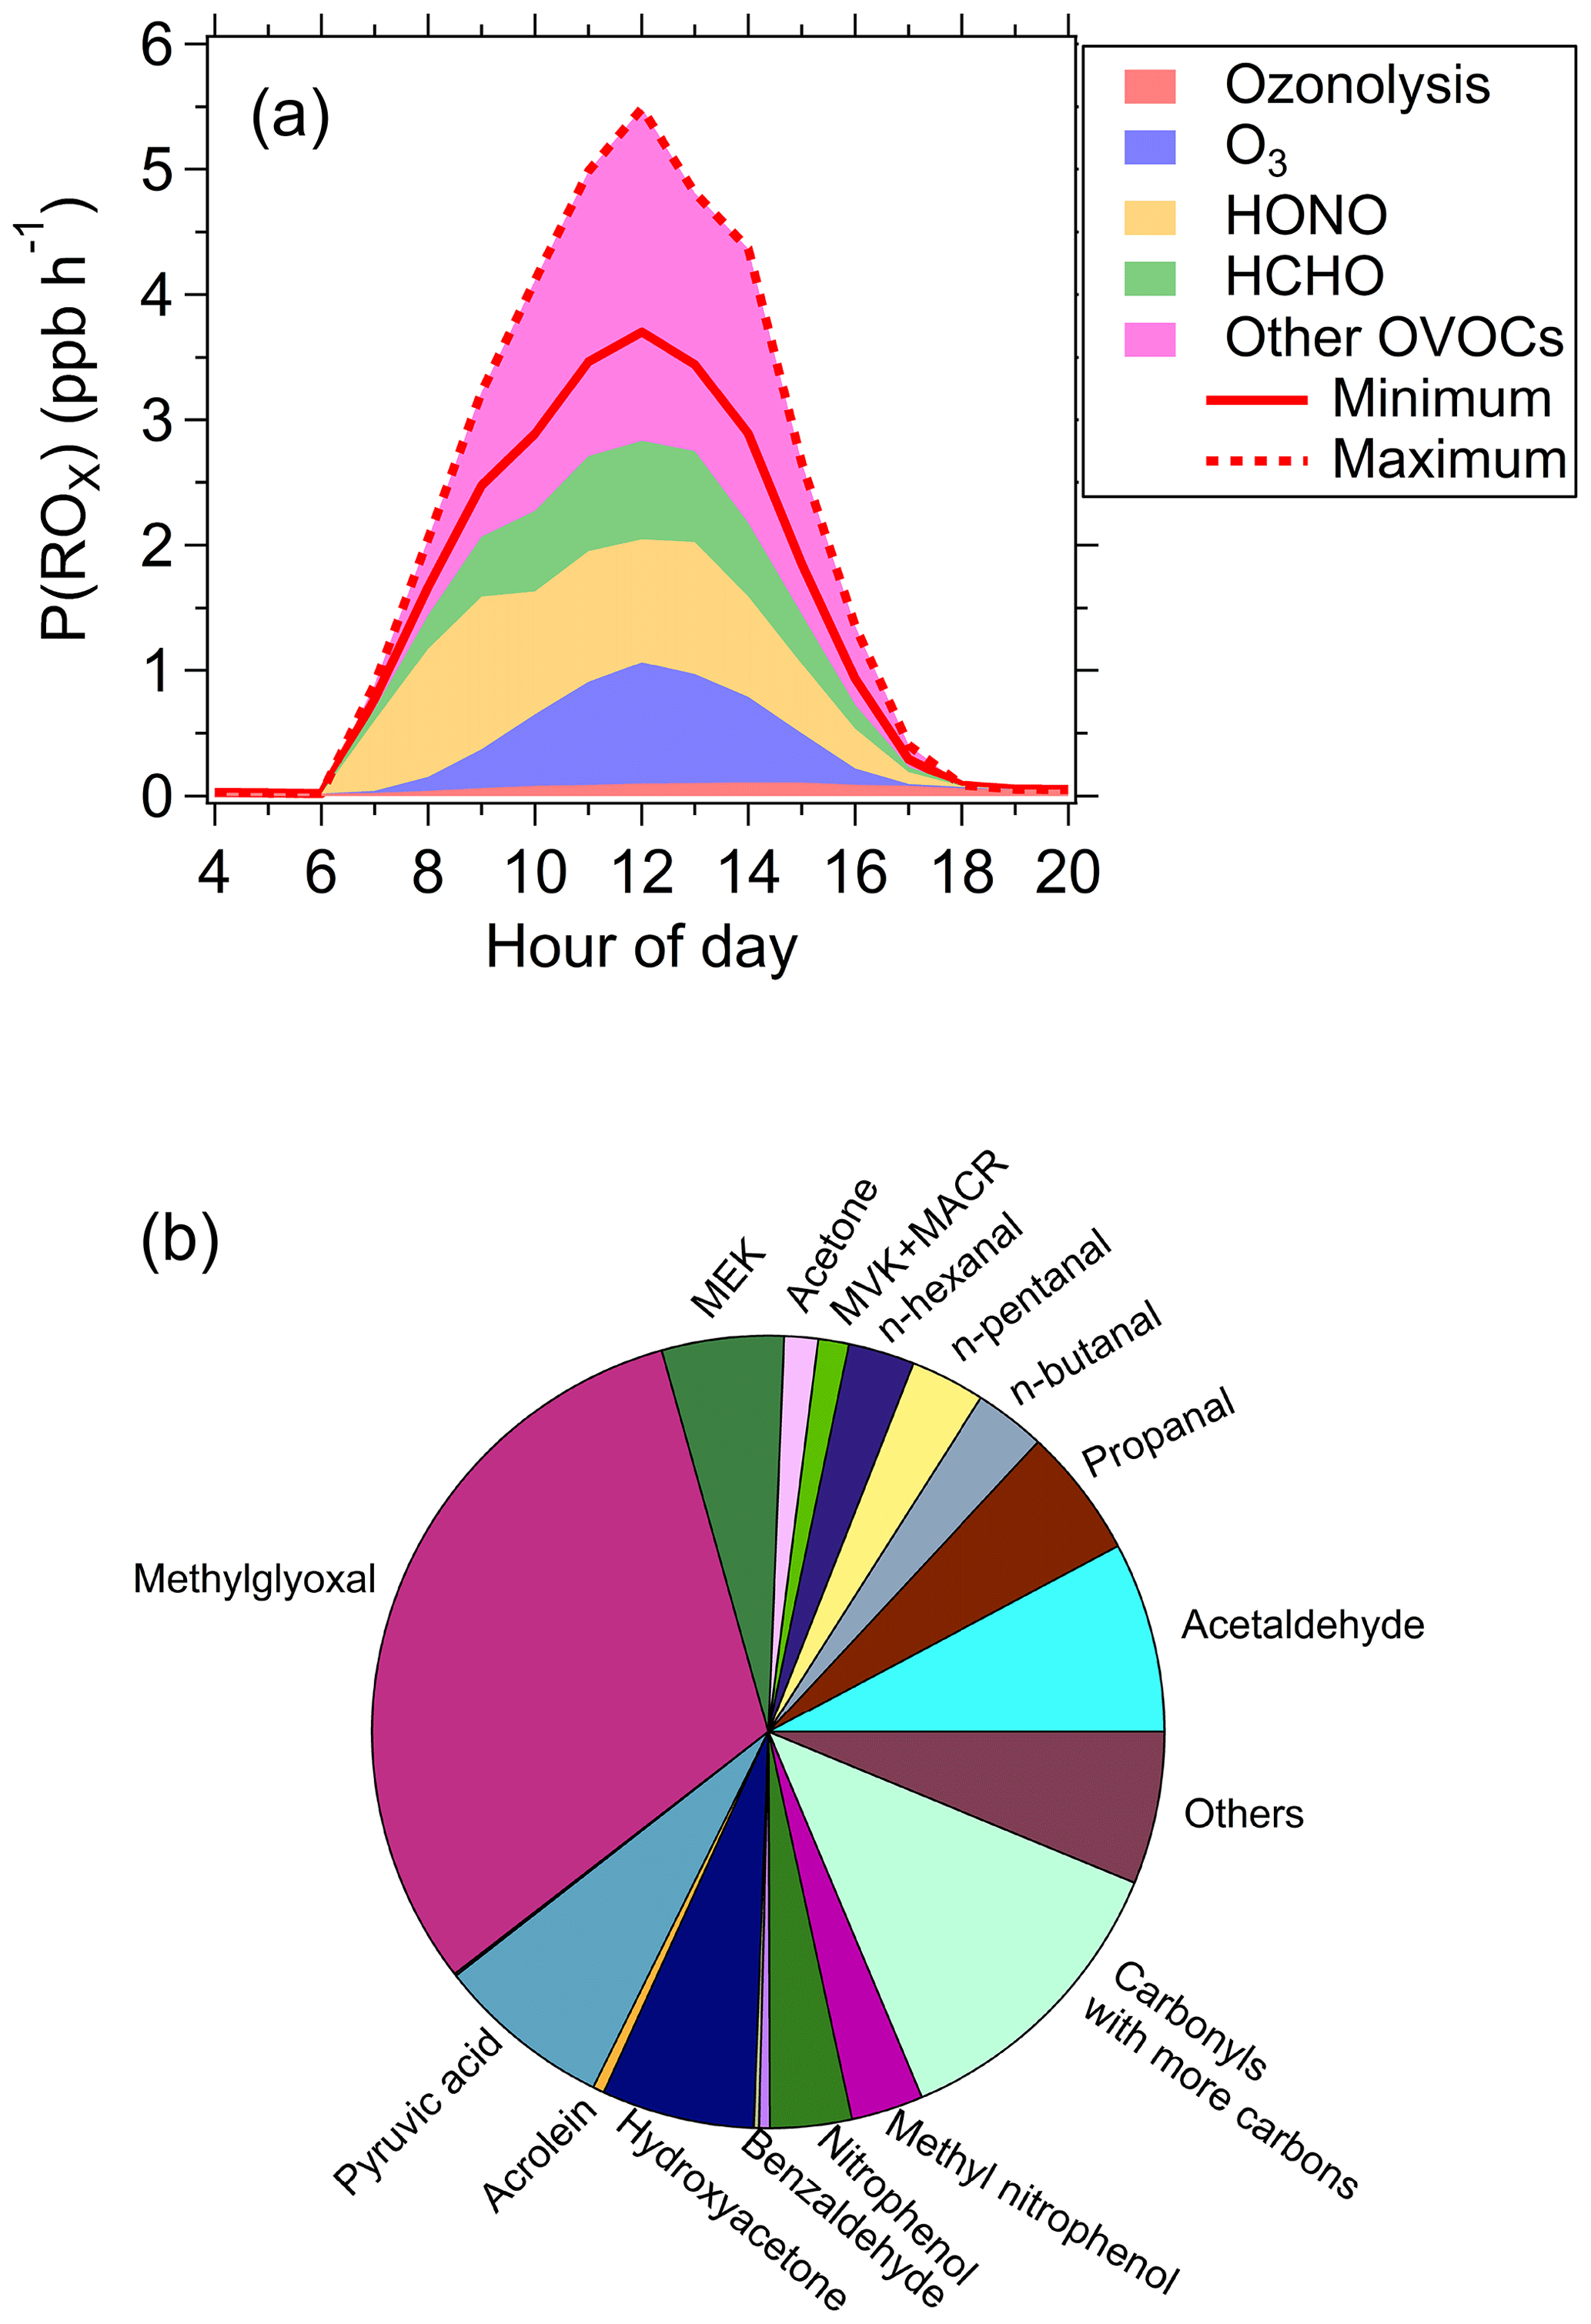
Figure 2The P(ROx) calculated by the box model with all observed photodegradable species constrained. (a) The source composition of total P(ROx) during the campaign; the solid and dashed lines represent the scenarios with minimum and maximum OVOC contributions to P(ROx), respectively. (b) The relative contributions of non-HCHO OVOC species to P(ROx) for the scenarios with minimum OVOC contribution to P(ROx).
For the scenario of minimum OVOC contribution, HONO contributed the most to P(ROx) (37 %), followed by O3 (20 %) and HCHO (20 %). The contribution of non-HCHO OVOCs was 21 % (Fig. 2a). Figures 2b and S5 show the relative contributions of different non-HCHO OVOC species to P(ROx) for the scenarios with minimum and maximum OVOC contribution, respectively. Ozonolysis of alkenes played a minor role in P(ROx). For the scenario of maximum OVOCs contribution, the contribution of non-HCHO OVOCs increased to 44 %. In total, OVOCs contributed 43 %–59 % of P(ROx), which is higher than previous studies that reported that OVOCs contributed 17 %–40 % of P(ROx) in major cities in China and the USA (Tan et al., 2019a, 2017, 2018, 2019b; Young et al., 2012; Griffith et al., 2016). In this study the contribution of OVOCs to P(ROx) was higher than that of HONO. This is different from previous studies reporting HONO contributed more to P(ROx) than OVOCs in China (Tan et al., 2019a, 2017, 2018, 2019b). Nevertheless, it is notable that the contributions of HONO to P(ROx) in the early morning were higher than those of OVOCs due to the accumulation of HONO in nighttime, while OVOCs dominate P(ROx) at noon when photochemistry was most active (Fig. 2a). Furthermore, those previous studies in China indicated that HCHO was the dominant contributor to P(ROx) among OVOC species and the contributions of other OVOC species was generally smaller than that of HCHO (Tan et al., 2019a, 2017, 2018, 2019b). In contrast, the results of this study suggest that non-HCHO OVOCs have a potential to be a larger contributor than HCHO and HONO, revealing the importance of non-HCHO OVOCs in radical production. The difference between this study and previous studies in China is primarily attributed to more OVOC species measured in this study than previous studies. Nevertheless, the existing isomers of carbonyls with more carbons lead to large uncertainties in the quantification of P(ROx) as shown in Fig. 2a. Therefore, precise distinction of these isomers in the future is crucial to accurately quantify P(ROx). In addition, absorption cross sections and quantum yields of many photodegradable OVOC species with large carbon numbers, especially multifunctional species, are not experimentally determined. As a result, the photolysis frequencies of these species are not available, which also leads to uncertainties in quantifying P(ROx). As measurements of many organic compounds may not be possible at least in the near future, construction of a parameterization method for photolysis frequencies of oxygenated VOCs either based on chemical formula or functional groups at isomeric level will help to reduce this uncertainty in the future.
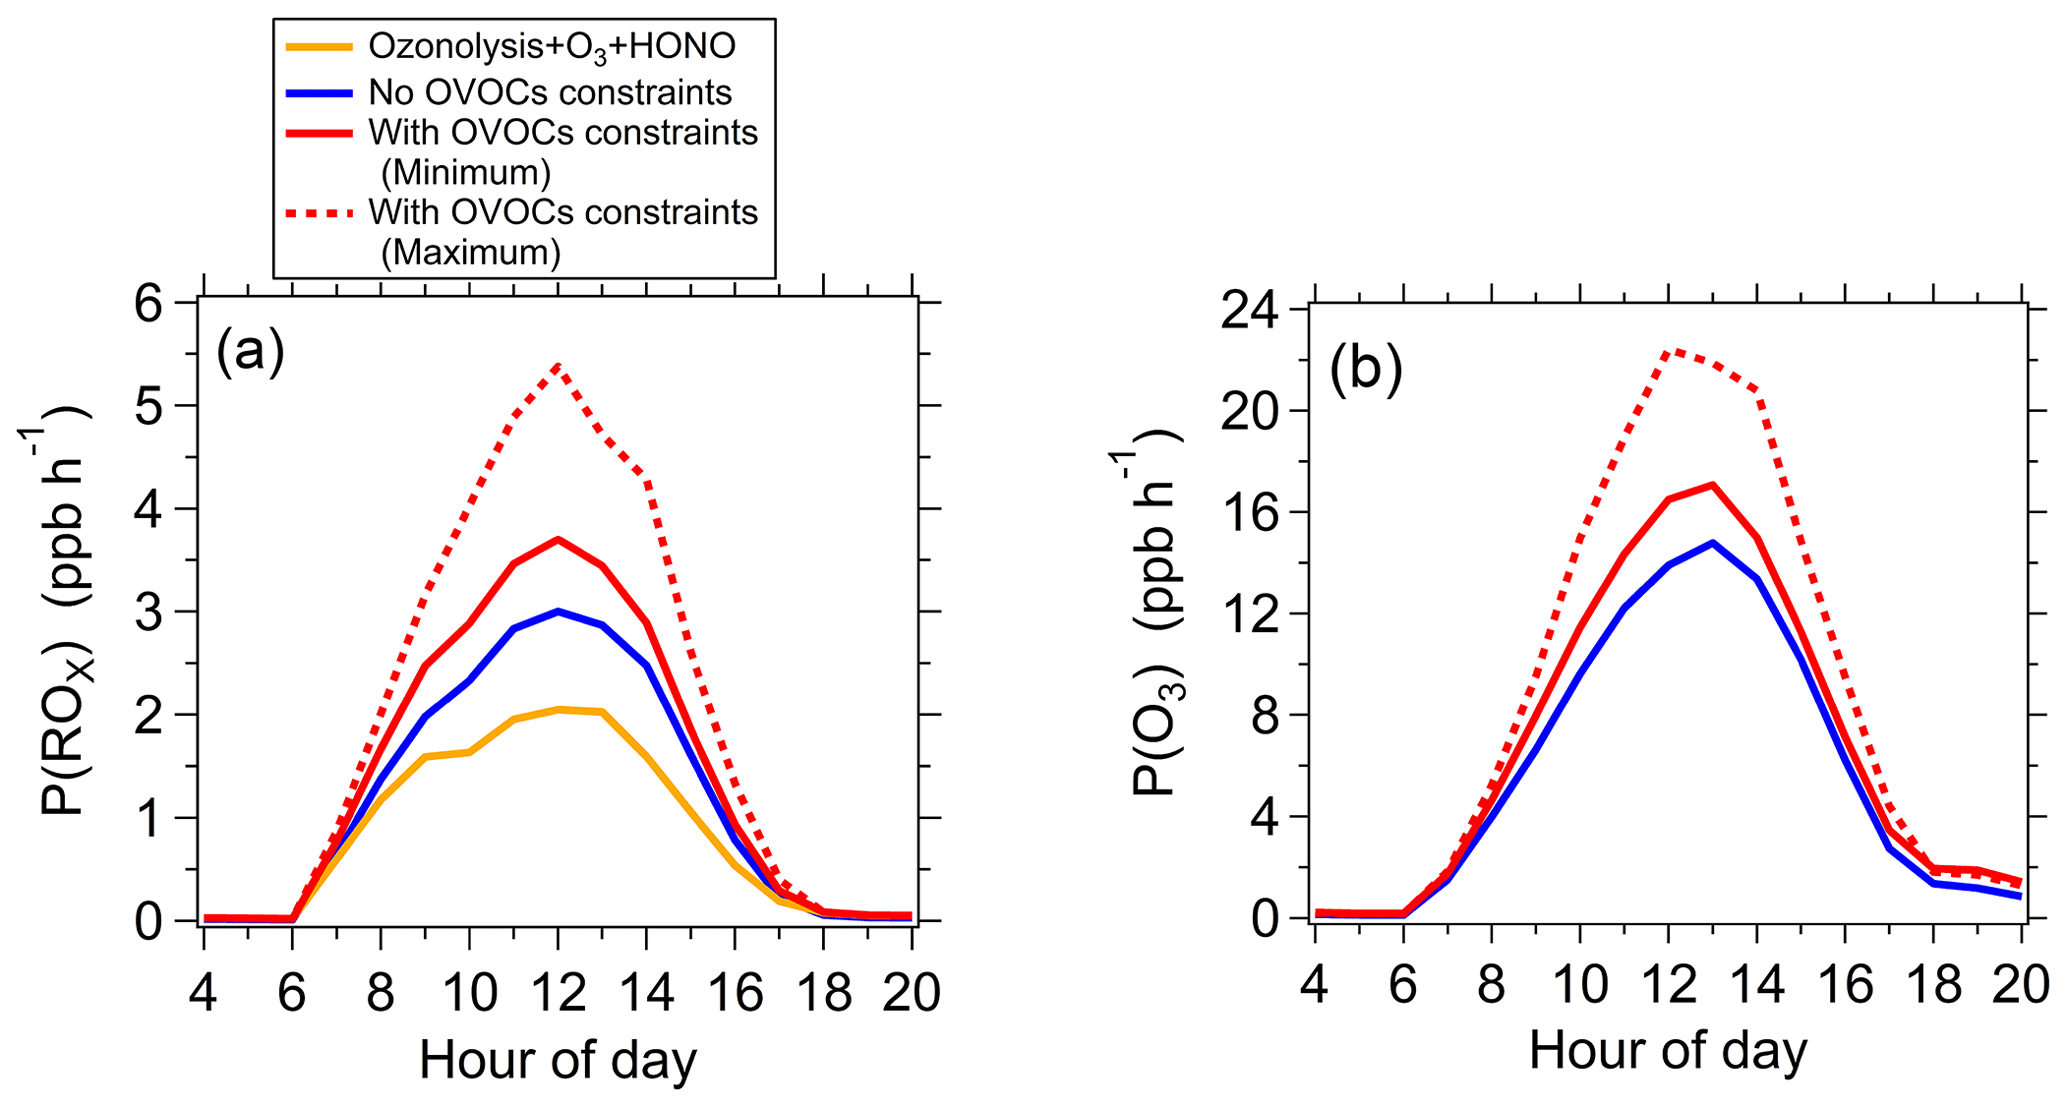
Figure 3Model simulated P(ROx) (a) and P(O3) (b) without and with all observed photodegradable OVOCs constrained. (a) Model simulated P(ROx) without (blue line) and with (red lines) all observed photodegradable OVOCs constrained. The sum contribution of O3 photolysis, HONO photolysis, and ozonolysis is also displayed (yellow line). (b) Model simulated P(O3) without (blue line) and with (red lines) observed photodegradable OVOCs constrained. The red solid and red dashed lines represent the scenarios with minimum and maximum OVOC contributions to P(ROx), respectively.
As a comparison with the scenario with all observed OVOC species constrained in the box model, P(ROx) was also simulated by the box model without observed OVOC species constrained. As shown in Fig. 3a, the simulation of the box model without observed OVOC species constrained (blue line in Fig. 3a) underestimated P(ROx) significantly compared to the scenario with all observed OVOC species constrained (red lines in Fig. 3a). The underestimation of P(ROx) was 16 % and 44 % when using the lower and higher limits of OVOC photolysis frequencies, respectively (red solid line and red dashed line in Fig. 3a). In this case, the underestimation of OH and HO2 concentrations was 15 %–38 % and 25 %–64 %, respectively. The underestimation of P(ROx) and radical concentrations was due to the underestimation of photodegradable OVOCs simulated by the photochemical model (Table S2). In general, most photodegradable OVOCs were underestimated by 10 %–100 % by a box model except for MVK and MACR. The underestimation of photodegradable OVOCs can be caused by missing primary emissions (McDonald et al., 2018; Karl et al., 2018; Gkatzelis et al., 2021) or unknown secondary sources of these OVOC species (Bloss et al., 2005; Ji et al., 2017). Direct flux measurements of VOCs based on the eddy covariance technique showed that the contribution of typical urban emission sources comprised of a surprisingly large portion of OVOCs (Karl et al., 2018). In addition, some experimental studies indicated that MCM generally underestimated formation of aldehydes, ketones, and phenols from the oxidation of aromatics by OH radical (Bloss et al., 2005; Ji et al., 2017), suggesting the existence of unknown secondary source of these OVOC species. This evidence suggests that it is essential to use ambient measurements of OVOCs as constraints in models at least until primary and secondary sources of OVOCs are better understood.
Previous studies in the Pearl River Delta and North China Plain of China found that photochemical models significantly underestimated measured concentrations of OH radicals, indicating the existence of unknown sources of ROx radicals in the atmosphere (Lu et al., 2012, 2013; Tan et al., 2019a; Hofzumahaus et al., 2009; Ma et al., 2019). For instance, comprehensive measurements in winter in Beijing showed that the photochemical box model greatly underestimated OH and HO2 radicals by 50 % and ∼ 12 fold during the pollution periods (Ma et al., 2019; Tan et al., 2018). Through the budget analysis of the source and sink of radicals, the researchers believed that the missing P(ROx) was the primary cause of the underestimation of HO2 and RO2 concentrations (Tan et al., 2018). Given that most photodegradable OVOCs were not constrained in the box model used in these previous studies of ROx radicals, the results of our study provide a direction for solving this issue regarding underestimated ROx radical concentrations. Therefore, it is imperative to continuously improve measurement technologies to achieve accurate quantification of more photodegradable OVOC species, thereby improving our understanding of the issues with respect to the closure of ROx radicals in the atmosphere.
3.3 The role of photolysis reactions in ozone pollution
The box model was used to evaluate the effect of the photodegradable OVOC species on ozone production rate during the whole campaign. P(O3) values were simulated with and without all of measured photodegradable OVOC species constrained in the box model. As shown in Fig. 3b, compared to the scenario with observed photodegradable OVOC species constrained in the box model (red lines in Fig. 3b), the scenario without constraining observed OVOCs (blue line in Fig. 3b) underestimated the peak value of P(O3) by 15 %–38 %. The underestimation of P(O3) was due to the underestimation of OVOCs by the box model (Table S2).
As shown in Fig. 4, the dependence of daily peak O3 concentrations on NOx concentrations was calculated by the box model with and without all of measured photodegradable OVOC species constrained. The NOx concentration level corresponding to maximum of ozone concentration (NOx (O3 max)) was determined. In reality, this NOx concentration level is the threshold to distinguish between VOC-limited and NOx-limited regimes (Edwards et al., 2014; Womack et al., 2019). Ozone production is NOx limited if the ambient NOx concentration is lower than the threshold of NOx, but it is in a VOC-limited regime if ambient NOx concentration is higher than the threshold of NOx. The larger threshold of NOx represents higher possibility of ozone production in the NOx-limited regime. The threshold of NOx for the scenario with observed photodegradable OVOC species constrained is 21 %–52 % higher than that without observed photodegradable OVOC species constrained (Fig. 4). This suggests that the box model simulation without constraining OVOCs will overestimate the VOC-limited degree due to the underestimation of OVOCs and thus overestimate the effect of VOCs reduction in reducing ozone pollution, which in turn may not determine the ozone control strategy correctly. Therefore, it is necessary to constrain these important photodegradable species in photochemical models to calculate the P(O3) level and to diagnose ozone sensitivity regimes accurately.
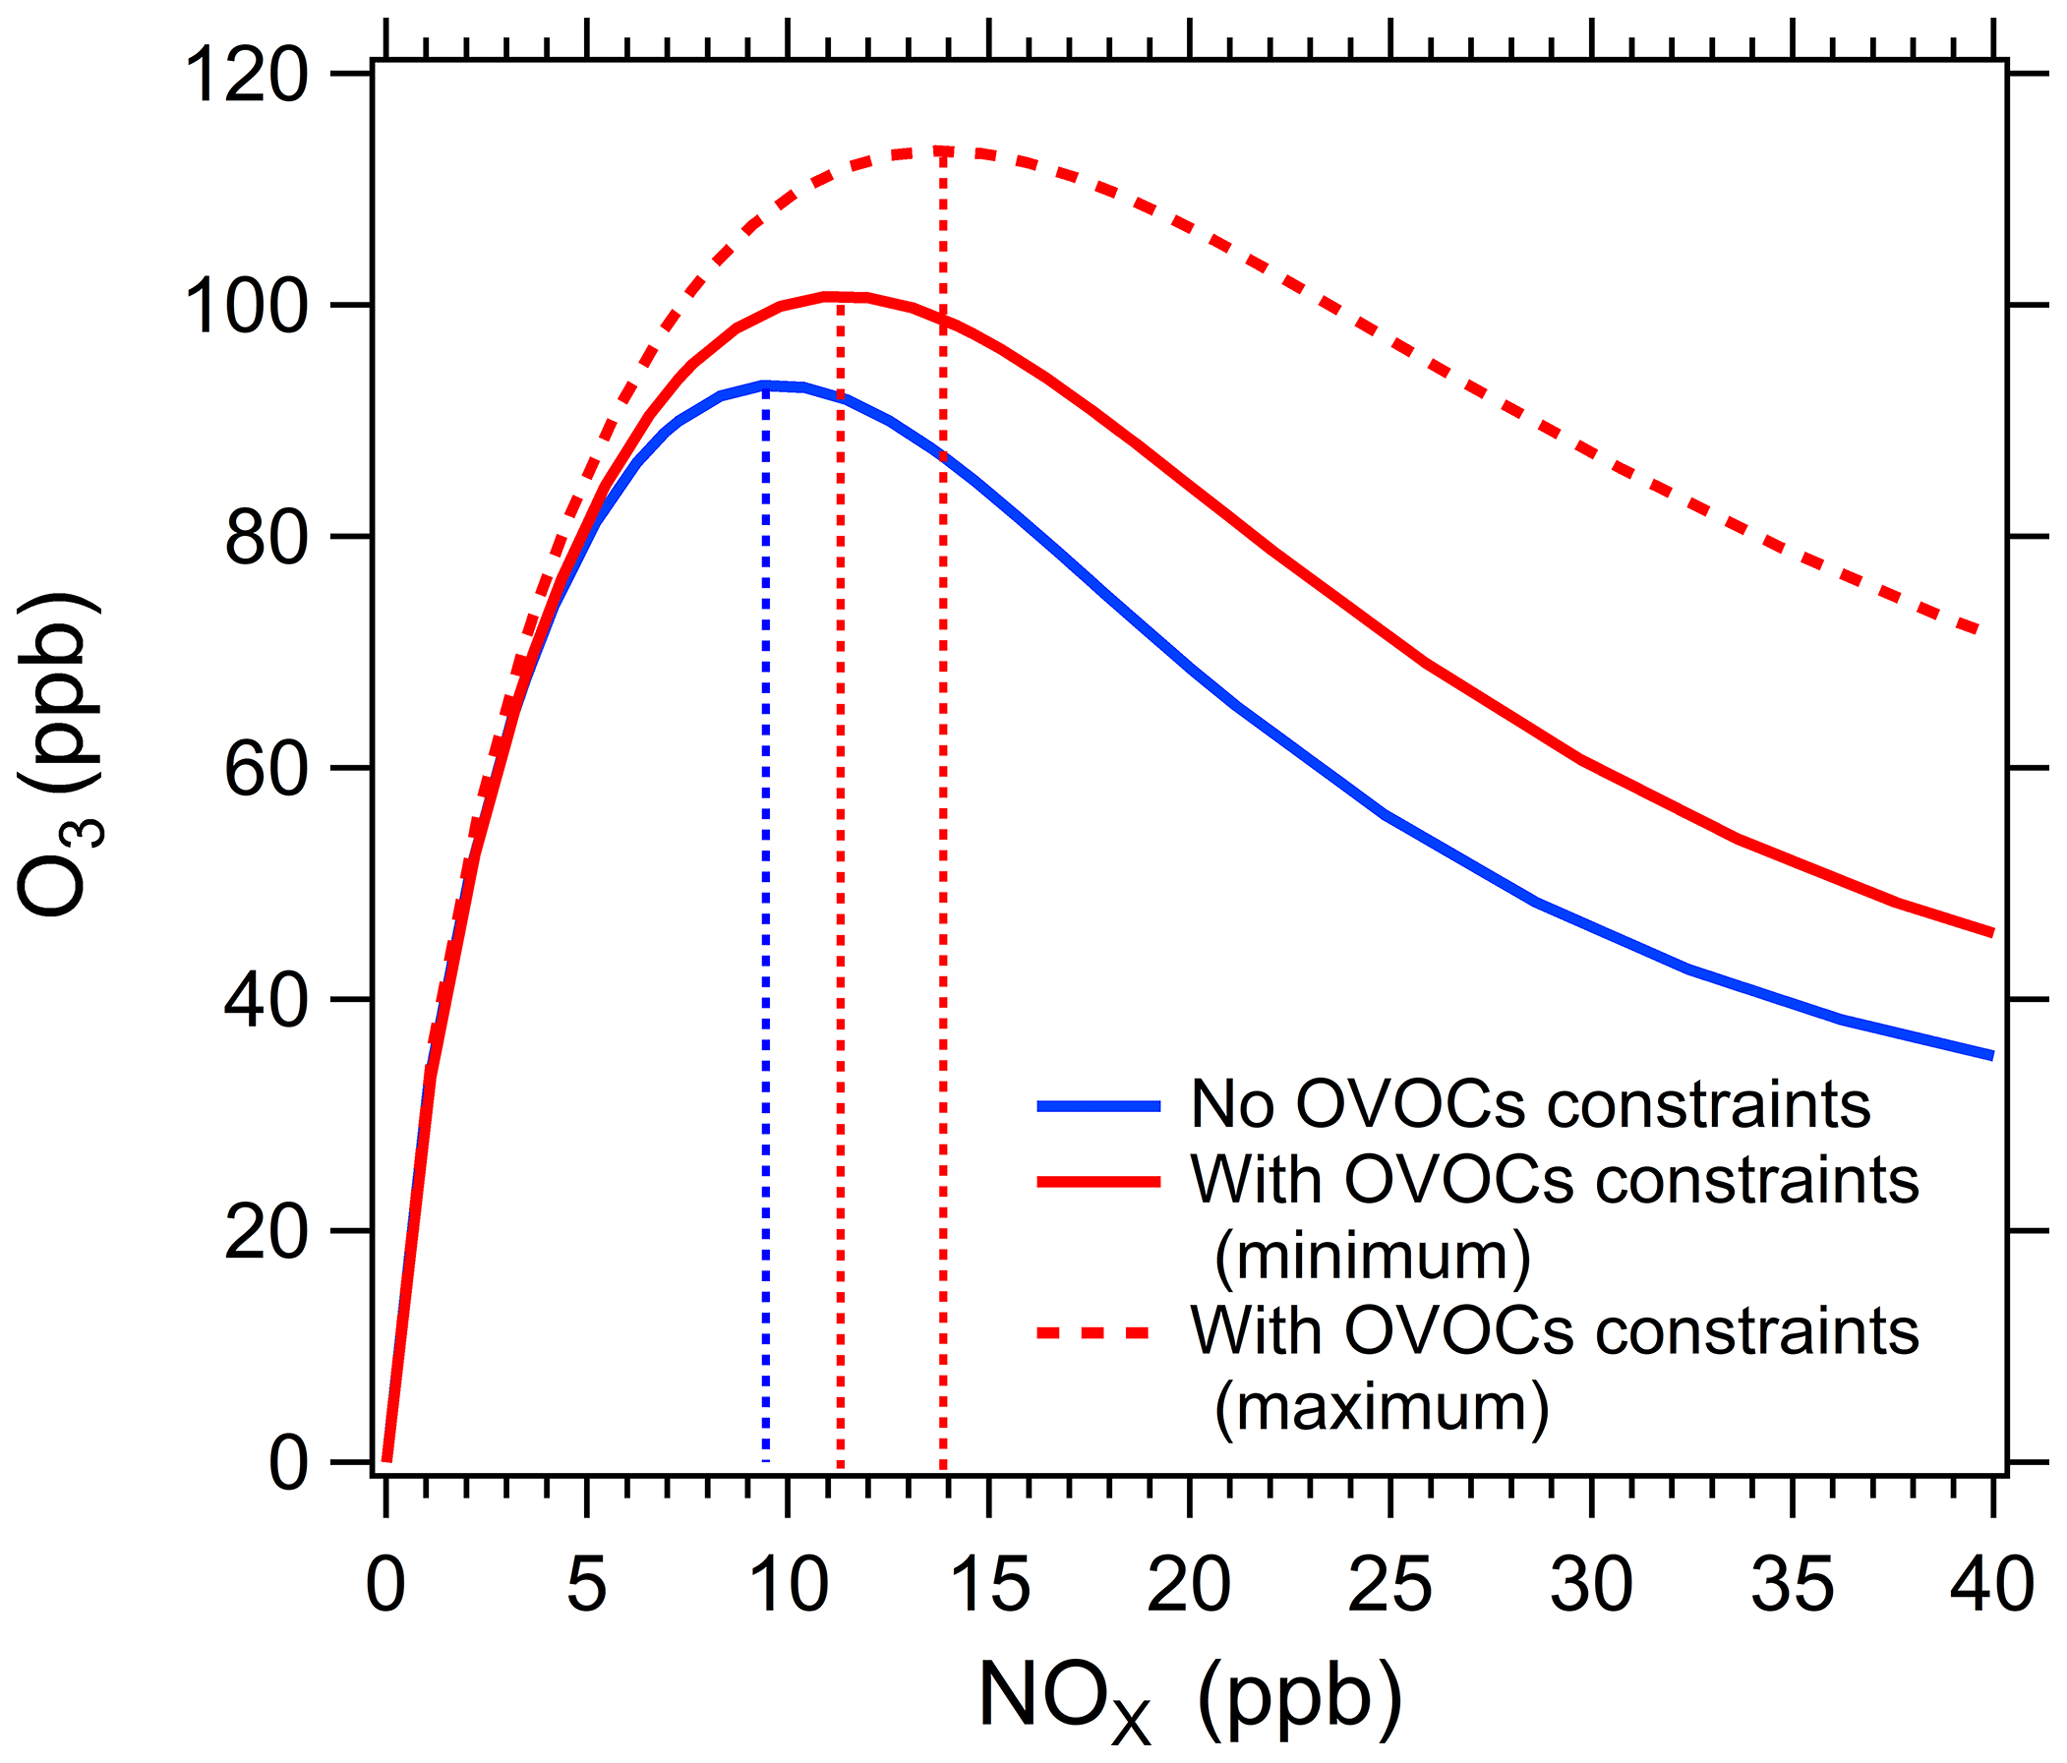
Figure 4Model simulated dependence of daily peak O3 concentrations on NOx concentrations without (blue curve) and with (red curves) all observed photodegradable OVOCs constrained . The red solid and red dashed curves represent the scenarios with minimum and maximum OVOC contributions to P(ROx), respectively. The dashed lines parallel to y-axis represent the threshold of NOx levels to distinguish between VOC-limited and NOx-limited regimes.
O3 production rate can be expressed as the product of P(ROx) and radical chain length (ChL) as shown in Eq. (3) (Tonnesen and Dennis, 2000).
where Rate (HO2 + NO) and Rate (RO2 + NO) represent the reaction rates between HO2 and NO and between RO2 and NO, respectively. ChL characterizes the number of iterations each ROx radical makes prior to termination. It is equal to the ratio between the radical recycling rate and primary production rate (or equivalently, termination rate), indicating the efficiency of radical propagation.
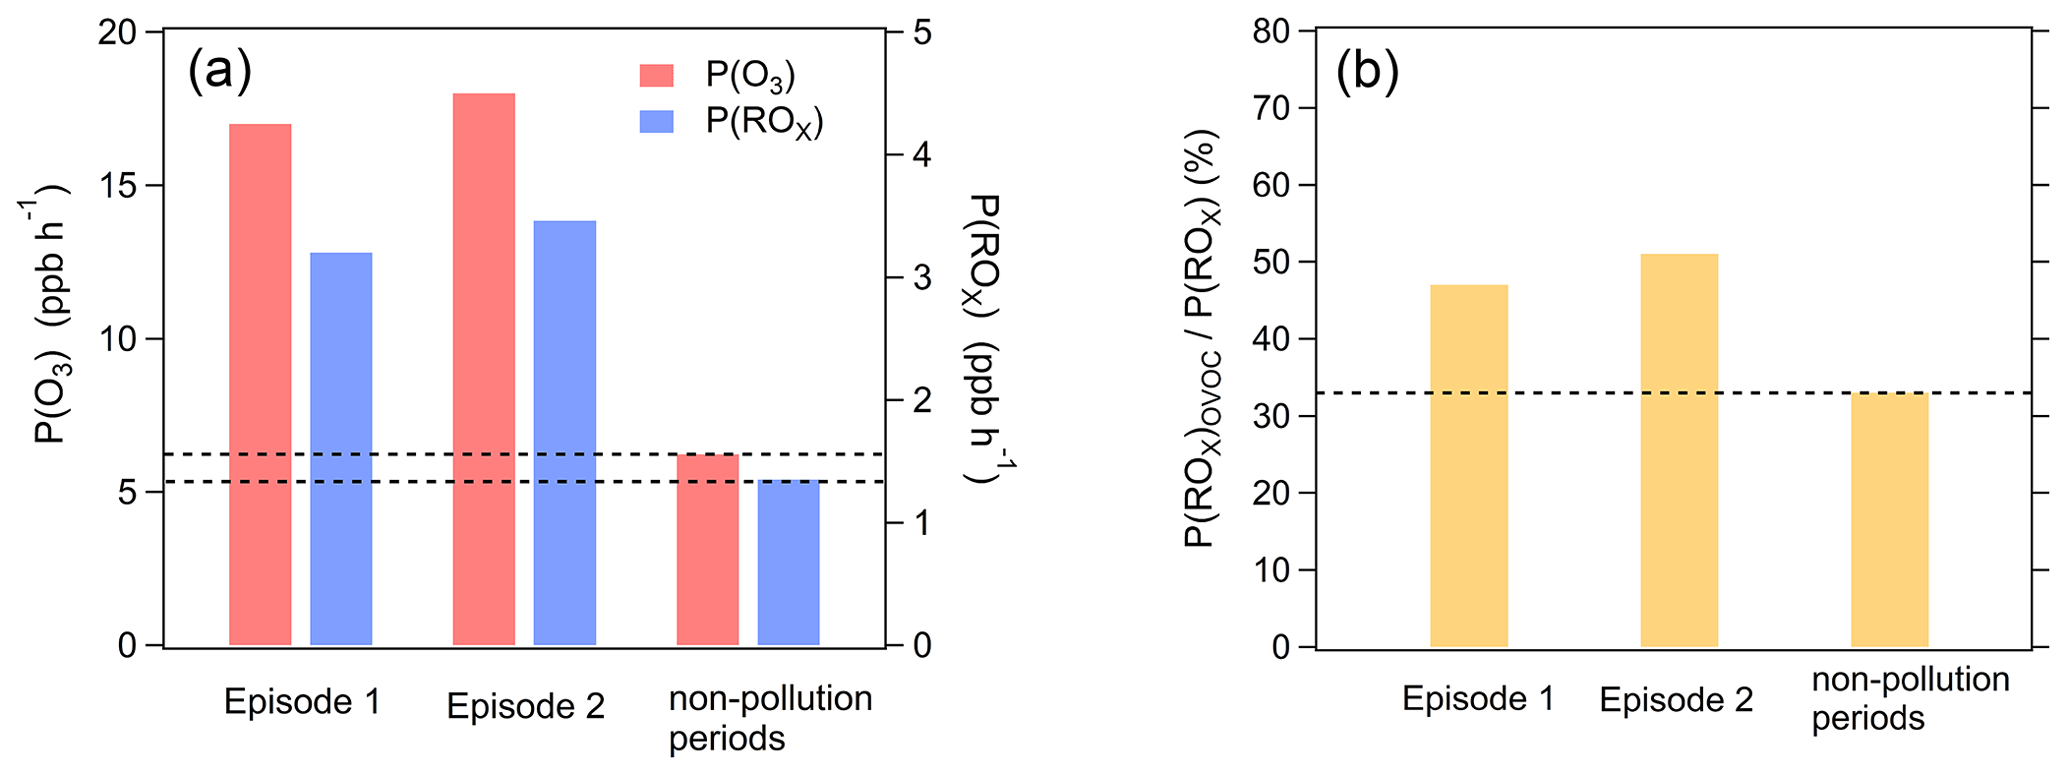
Figure 5Averaged P(O3), P(ROx), and the ratio of P(ROx) contributed by OVOCs to total P(ROx) (P(ROx)OVOC P(ROx)) during two ozone pollution episodes (episode 1, episode 2) and non-pollution periods. Both P(O3) and P(ROx) correspond to the scenarios with minimum OVOC contributions to P(ROx).
Two ozone pollution episodes (from 19 to 27 September and from 30 September to 9 October, respectively) were identified during the campaign from 14 September to 20 November 2018 (Fig. S6, Table S3). The temporal variations of P(O3) and P(ROx) overall showed good consistency with those of ozone concentrations (Fig. S7). P(O3) in the two ozone pollution episodes was a factor of 2.6–2.8 higher than that in the non-pollution period (Figs. 5, S8). P(ROx) in the two ozone pollution episodes was a factor of 2.2–2.6 higher than that in the non-pollution period. ChL in episode 2 was similar to that in the non-pollution period, while ChL for episode 1 was a factor of 1.7 higher than that in non-pollution period (Fig. S8). Therefore, the substantial increase of P(ROx) in both ozone pollution episodes played a crucial role in the accelerated ozone production. Furthermore, the ratio of P(ROx) from OVOC photolysis to total P(ROx) in the two ozone pollution episodes is higher than that in the non-pollution period, denoting higher contribution of OVOC photolysis to P(ROx) in the ozone pollution episodes (Fig. 5b). These results indicate that the accelerating production of OVOCs had a significant positive feedback effect on ozone pollution (Qu et al., 2021). This is broadly consistent with the wintertime observations in an oil and gas basin in Utah, USA, which found that a very high VOC to NOx ratio optimized production of secondary OVOCs, leading to OVOC photolysis as a dominant oxidant source (Edwards et al., 2014).
In summary, comprehensive measurements of photodegradable species advance our understanding of radical sources and ozone production in an urban environment. By using PTR-ToF-MS in a representative urban environment, a large number of photodegradable OVOCs were measured. These measurements make it possible to directly quantify their contribution to ROx radical production. We found that non-HCHO OVOCs can be a larger contributor to P(ROx) than HCHO and HONO. Photochemical models without constrained OVOC species will significantly underestimate P(ROx) and ozone production rates and overestimate the effect of VOC reduction in reducing ozone pollution. Therefore, it is important to measure these photodegradable species and use these observations as constraints to better quantify radical and ozone production.
Thanks to the improvement of technology in recent years, large numbers of OVOC species in the atmosphere can be measured by emerging online chemical ionization mass spectrometers, including PTR-ToF-MS and CIMS. However, photolysis frequencies of these OVOC species, especially those with multiple functional groups, are still not available or difficult to quantify using current existing information, which poses large uncertainties in the quantification of P(ROx) and ozone production. Hence, more laboratory studies on photolysis of organic compounds, better parameterization of photolysis frequencies using chemical formula or functional groups, and measurements of oxygenated VOCs at isomeric level will help to decrease this uncertainty in the future.
The observational data and model code used in this study are available from the corresponding authors upon request (byuan@jnu.edu.cn).
The supplement related to this article is available online at: https://doi.org/10.5194/acp-22-4117-2022-supplement.
BY, WW, and HS designed the research. WW and BY prepared the article with contributions from other authors. WW performed data analysis with contributions from YP, YC, SY, and FB. CaW, JQ, YH, ChW, CY, ZW, BW, XW, WS, WH, PC, MZ, JZ, and MS collected data.
At least one of the (co-)authors is a member of the editorial board of Atmospheric Chemistry and Physics. The peer-review process was guided by an independent editor, and the authors have also no other competing interests to declare.
Publisher’s note: Copernicus Publications remains neutral with regard to jurisdictional claims in published maps and institutional affiliations.
The authors appreciate valuable comments from two anonymous reviewers.
This research has been supported by the National Key R&D Plan of China (grant no. 2019YFE0106300), the National Natural Science Foundation of China (grant no. 42121004), Guangdong Natural Science Funds for Distinguished Young Scholar (grant no. 2018B030306037), and Guangdong Innovative and Entrepreneurial Research Team Program (grant no. 2016ZT06N263). This work was also supported by Special Fund Project for Science and Technology Innovation Strategy of Guangdong Province (grant no. 2019B121205004).
The article processing charges for this open-access publication were covered by the Max Planck Society.
This paper was edited by John Orlando and reviewed by two anonymous referees.
Atkinson, R.: Atmospheric chemistry of VOCs and NOx, Atmos. Environ., 34, 2063–2101, 2000.
Bejan, I., Abd El Aal, Y., Barnes, I., Benter, T., Bohn, B., Wiesen, P., and Kleffmann, J.: The photolysis of ortho-nitrophenols: a new gas phase source of HONO, Phys. Chem. Chem. Phys., 8, 2028–2035, 2006.
Berges, M. G. and Warneck, P.: Product quantum yields for the 350 nm photodecomposition of pyruvic acid in air, Ber. Bunsen Phys. Chem., 96, 413–416, 1992.
Bloss, C., Wagner, V., Bonzanini, A., Jenkin, M. E., Wirtz, K., Martin-Reviejo, M., and Pilling, M. J.: Evaluation of detailed aromatic mechanisms (MCMv3 and MCMv3.1) against environmental chamber data, Atmos. Chem. Phys., 5, 623–639, https://doi.org/10.5194/acp-5-623-2005, 2005.
Burkholder, J., Sander, S., Abbatt, J., Barker, J., Cappa, C., Crounse, J., Dibble, T., Huie, R., Kolb, C., and Kurylo, M.: Chemical kinetics and photochemical data for use in atmospheric studies; evaluation number 18, Jet Propulsion Laboratory, National Aeronautics and Space JPL Publication 15-10, Jet Propulsion Laboratory, Pasadena, CA, http://jpldataeval.jpl.nasa.gov (last access: 29 March 2022), 2015.
Chen, J., Wenger, J. C., and Venables, D. S.: Near-ultraviolet absorption cross sections of nitrophenols and their potential influence on tropospheric oxidation capacity, J. Phys. Chem. A, 115, 12235–12242, 2011.
Edwards, P. M., Brown, S. S., Roberts, J. M., Ahmadov, R., Banta, R. M., deGouw, J. A., Dubé, W. P., Field, R. A., Flynn, J. H., Gilman, J. B., Graus, M., Helmig, D., Koss, A., Langford, A. O., Lefer, B. L., Lerner, B. M., Li, R., Li, S.-M., McKeen, S. A., Murphy, S. M., Parrish, D. D., Senff, C. J., Soltis, J., Stutz, J., Sweeney, C., Thompson, C. R., Trainer, M. K., Tsai, C., Veres, P. R., Washenfelder, R. A., Warneke, C., Wild, R. J., Young, C. J., Yuan, B., and Zamora, R.: High winter ozone pollution from carbonyl photolysis in an oil and gas basin, Nature, 514, 351–354, https://doi.org/10.1038/nature13767, 2014.
Ehhalt, D. H. and Rohrer, F.: Dependence of the OH concentration on solar UV, J. Geophys. Res.-Atmos., 105, 3565–3571, https://doi.org/10.1029/1999jd901070, 2000.
Emmerson, K. M., Carslaw, N., Carpenter, L. J., Heard, D. E., Lee, J. D., and Pilling, M. J.: Urban Atmospheric Chemistry During the PUMA Campaign 1: Comparison of Modelled OH and HO2 Concentrations with Measurements, J. Atmos. Chem., 52, 143–164, https://doi.org/10.1007/s10874-005-1322-3, 2005.
Gkatzelis, G. I., Coggon, M. M., McDonald, B. C., Peischl, J., Gilman, J. B., Aikin, K. C., Robinson, M. A., Canonaco, F., Prevot, A. S., and Trainer, M.: Observations confirm that volatile chemical products are a major source of petrochemical emissions in US cities, Environ. Sci. Technol., 55, 4332–4343, 2021.
Griffith, S. M., Hansen, R., Dusanter, S., Michoud, V., Gilman, J., Kuster, W., Veres, P., Graus, M., de Gouw, J., and Roberts, J.: Measurements of hydroxyl and hydroperoxy radicals during CalNex-LA: Model comparisons and radical budgets, J. Geophys. Res.-Atmos., 121, 4211–4232, 2016.
Hofzumahaus, A., Rohrer, F., Lu, K., Bohn, B., Brauers, T., Chang, C.-C., Fuchs, H., Holland, F., Kita, K., and Kondo, Y.: Amplified trace gas removal in the troposphere, Science, 324, 1702–1704, 2009.
Horowitz, A., Meller, R., and Moortgat, G. K.: The UV–VIS absorption cross sections of the α-dicarbonyl compounds: pyruvic acid, biacetyl and glyoxal, J. Photoch. Photobio. A, 146, 19–27, 2001.
Jenkin, M. E., Saunders, S. M., and Pilling, M. J.: The tropospheric degradation of volatile organic compounds: a protocol for mechanism development, Atmos. Environ., 31, 81–104, 1997.
Jenkin, M. E., Saunders, S. M., Wagner, V., and Pilling, M. J.: Protocol for the development of the Master Chemical Mechanism, MCM v3 (Part B): tropospheric degradation of aromatic volatile organic compounds, Atmos. Chem. Phys., 3, 181–193, https://doi.org/10.5194/acp-3-181-2003, 2003.
Ji, Y., Zhao, J., Terazono, H., Misawa, K., Levitt, N. P., Li, Y., Lin, Y., Peng, J., Wang, Y., Duan, L., Pan, B., Zhang, F., Feng, X., An, T., Marrero-Ortiz, W., Secrest, J., Zhang, A. L., Shibuya, K., Molina, M. J., and Zhang, R.: Reassessing the atmospheric oxidation mechanism of toluene, P. Natl. Acad. Sci. USA, 114, 8169–8174, https://doi.org/10.1073/pnas.1705463114, 2017.
Karl, T., Striednig, M., Graus, M., Hammerle, A., and Wohlfahrt, G.: Urban flux measurements reveal a large pool of oxygenated volatile organic compound emissions, P. Natl. Acad. Sci. USA, 115, 1186–1191, 2018.
Lelieveld, J., Butler, T. M., Crowley, J. N., Dillon, T. J., Fischer, H., Ganzeveld, L., Harder, H., Lawrence, M. G., Martinez, M., Taraborrelli, D., and Williams, J.: Atmospheric oxidation capacity sustained by a tropical forest, Nature, 452, 737–740, https://doi.org/10.1038/nature06870, 2008.
Li, K., Jacob, D. J., Liao, H., Qiu, Y., Shen, L., Zhai, S., Bates, K. H., Sulprizio, M. P., Song, S., and Lu, X.: Ozone pollution in the North China Plain spreading into the late-winter haze season, P. Natl. Acad. Sci. USA, 118, e2015797118, https://doi.org/10.1073/pnas.2015797118, 2021.
Li, X., Rohrer, F., Brauers, T., Hofzumahaus, A., Lu, K., Shao, M., Zhang, Y. H., and Wahner, A.: Modeling of HCHO and CHOCHO at a semi-rural site in southern China during the PRIDE-PRD2006 campaign, Atmos. Chem. Phys., 14, 12291–12305, https://doi.org/10.5194/acp-14-12291-2014, 2014.
Ling, Z., Guo, H., Lam, S., Saunders, S., and Wang, T.: Atmospheric photochemical reactivity and ozone production at two sites in Hong Kong: Application of a master chemical mechanism–photochemical box model, J. Geophys. Res.-Atmos., 119, 10567–10582, 2014.
Lu, K. D., Rohrer, F., Holland, F., Fuchs, H., Bohn, B., Brauers, T., Chang, C. C., Häseler, R., Hu, M., Kita, K., Kondo, Y., Li, X., Lou, S. R., Nehr, S., Shao, M., Zeng, L. M., Wahner, A., Zhang, Y. H., and Hofzumahaus, A.: Observation and modelling of OH and HO2 concentrations in the Pearl River Delta 2006: a missing OH source in a VOC rich atmosphere, Atmos. Chem. Phys., 12, 1541–1569, https://doi.org/10.5194/acp-12-1541-2012, 2012.
Lu, K. D., Hofzumahaus, A., Holland, F., Bohn, B., Brauers, T., Fuchs, H., Hu, M., Häseler, R., Kita, K., Kondo, Y., Li, X., Lou, S. R., Oebel, A., Shao, M., Zeng, L. M., Wahner, A., Zhu, T., Zhang, Y. H., and Rohrer, F.: Missing OH source in a suburban environment near Beijing: observed and modelled OH and HO2 concentrations in summer 2006, Atmos. Chem. Phys., 13, 1057–1080, https://doi.org/10.5194/acp-13-1057-2013, 2013.
Ma, X., Tan, Z., Lu, K., Yang, X., Liu, Y., Li, S., Li, X., Chen, S., Novelli, A., and Cho, C.: Winter photochemistry in Beijing: Observation and model simulation of OH and HO2 radicals at an urban site, Sci. Total Environ., 685, 85–95, 2019.
McDonald, B. C., De Gouw, J. A., Gilman, J. B., Jathar, S. H., Akherati, A., Cappa, C. D., Jimenez, J. L., Lee-Taylor, J., Hayes, P. L., and McKeen, S. A.: Volatile chemical products emerging as largest petrochemical source of urban organic emissions, Science, 359, 760–764, 2018.
Mellouki, A. and Mu, Y.: On the atmospheric degradation of pyruvic acid in the gas phase, J. Photoch. Photobio. A, 157, 295–300, 2003.
Monks, P. S., Archibald, A. T., Colette, A., Cooper, O., Coyle, M., Derwent, R., Fowler, D., Granier, C., Law, K. S., Mills, G. E., Stevenson, D. S., Tarasova, O., Thouret, V., von Schneidemesser, E., Sommariva, R., Wild, O., and Williams, M. L.: Tropospheric ozone and its precursors from the urban to the global scale from air quality to short-lived climate forcer, Atmos. Chem. Phys., 15, 8889–8973, https://doi.org/10.5194/acp-15-8889-2015, 2015.
Qu, H., Wang, Y., Zhang, R., Liu, X., Huey, L. G., Sjostedt, S., Zeng, L., Lu, K., Wu, Y., and Shao, M.: Chemical Production of Oxygenated Volatile Organic Compounds Strongly Enhances Boundary-Layer Oxidation Chemistry and Ozone Production, Environ. Sci. Technol., 55, 13718–13727, 2021.
Rohrer, F., Lu, K., Hofzumahaus, A., Bohn, B., Brauers, T., Chang, C.-C., Fuchs, H., Häseler, R., Holland, F., and Hu, M.: Maximum efficiency in the hydroxyl-radical-based self-cleansing of the troposphere, Nat. Geosci., 7, 559–563, 2014a.
Rohrer, F., Lu, K., Hofzumahaus, A., Bohn, B., Brauers, T., Chang, C.-C., Fuchs, H., Häseler, R., Holland, F., Hu, M., Kita, K., Kondo, Y., Li, X., Lou, S., Oebel, A., Shao, M., Zeng, L., Zhu, T., Zhang, Y., and Wahner, A.: Maximum efficiency in the hydroxyl-radical-based self-cleansing of the troposphere, Nat. Geosci., 7, 559–563, https://doi.org/10.1038/ngeo2199, 2014b.
Sangwan, M. and Zhu, L.: Role of methyl-2-nitrophenol photolysis as a potential source of OH radicals in the polluted atmosphere: implications from laboratory investigation, J. Phys. Chem. A, 122, 1861–1872, 2018.
Saunders, S. M., Jenkin, M. E., Derwent, R. G., and Pilling, M. J.: Protocol for the development of the Master Chemical Mechanism, MCM v3 (Part A): tropospheric degradation of non-aromatic volatile organic compounds, Atmos. Chem. Phys., 3, 161–180, https://doi.org/10.5194/acp-3-161-2003, 2003.
Sekimoto, K., Li, S.-M., Yuan, B., Koss, A., Coggon, M., Warneke, C., and de Gouw, J.: Calculation of the sensitivity of proton-transfer-reaction mass spectrometry (PTR-MS) for organic trace gases using molecular properties, Int. J. Mass Spectrom., 421, 71–94, https://doi.org/10.1016/j.ijms.2017.04.006, 2017.
Sheehy, P. M., Volkamer, R., Molina, L. T., and Molina, M. J.: Oxidative capacity of the Mexico City atmosphere – Part 2: A ROx radical cycling perspective, Atmos. Chem. Phys., 10, 6993–7008, https://doi.org/10.5194/acp-10-6993-2010, 2010.
Sinha, V., Williams, J., Crowley, J. N., and Lelieveld, J.: The Comparative Reactivity Method – a new tool to measure total OH Reactivity in ambient air, Atmos. Chem. Phys., 8, 2213–2227, https://doi.org/10.5194/acp-8-2213-2008, 2008.
Stone, D., Whalley, L. K., and Heard, D. E.: Tropospheric OH and HO2 radicals: field measurements and model comparisons, Chem. Soc. Rev., 41, 6348–6404, https://doi.org/10.1039/c2cs35140d, 2012.
Tan, Z., Fuchs, H., Lu, K., Hofzumahaus, A., Bohn, B., Broch, S., Dong, H., Gomm, S., Häseler, R., He, L., Holland, F., Li, X., Liu, Y., Lu, S., Rohrer, F., Shao, M., Wang, B., Wang, M., Wu, Y., Zeng, L., Zhang, Y., Wahner, A., and Zhang, Y.: Radical chemistry at a rural site (Wangdu) in the North China Plain: observation and model calculations of OH, HO2 and RO2 radicals, Atmos. Chem. Phys., 17, 663–690, https://doi.org/10.5194/acp-17-663-2017, 2017.
Tan, Z., Rohrer, F., Lu, K., Ma, X., Bohn, B., Broch, S., Dong, H., Fuchs, H., Gkatzelis, G. I., Hofzumahaus, A., Holland, F., Li, X., Liu, Y., Liu, Y., Novelli, A., Shao, M., Wang, H., Wu, Y., Zeng, L., Hu, M., Kiendler-Scharr, A., Wahner, A., and Zhang, Y.: Wintertime photochemistry in Beijing: observations of ROx radical concentrations in the North China Plain during the BEST-ONE campaign, Atmos. Chem. Phys., 18, 12391–12411, https://doi.org/10.5194/acp-18-12391-2018, 2018.
Tan, Z., Lu, K., Hofzumahaus, A., Fuchs, H., Bohn, B., Holland, F., Liu, Y., Rohrer, F., Shao, M., Sun, K., Wu, Y., Zeng, L., Zhang, Y., Zou, Q., Kiendler-Scharr, A., Wahner, A., and Zhang, Y.: Experimental budgets of OH, HO2, and RO2 radicals and implications for ozone formation in the Pearl River Delta in China 2014, Atmos. Chem. Phys., 19, 7129–7150, https://doi.org/10.5194/acp-19-7129-2019, 2019a.
Tan, Z., Lu, K., Jiang, M., Su, R., Wang, H., Lou, S., Fu, Q., Zhai, C., Tan, Q., Yue, D., Chen, D., Wang, Z., Xie, S., Zeng, L., and Zhang, Y.: Daytime atmospheric oxidation capacity in four Chinese megacities during the photochemically polluted season: a case study based on box model simulation, Atmos. Chem. Phys., 19, 3493–3513, https://doi.org/10.5194/acp-19-3493-2019, 2019b.
Tonnesen, G. S. and Dennis, R. L.: Analysis of radical propagation efficiency to assess ozone sensitivity to hydrocarbons and NOx: 1. Local indicators of instantaneous odd oxygen production sensitivity, J. Geophys. Res.-Atmos., 105, 9213–9225, 2000.
Volkamer, R., Sheehy, P., Molina, L. T., and Molina, M. J.: Oxidative capacity of the Mexico City atmosphere – Part 1: A radical source perspective, Atmos. Chem. Phys., 10, 6969–6991, https://doi.org/10.5194/acp-10-6969-2010, 2010.
Wang, C., Yuan, B., Wu, C., Wang, S., Qi, J., Wang, B., Wang, Z., Hu, W., Chen, W., Ye, C., Wang, W., Sun, Y., Wang, C., Huang, S., Song, W., Wang, X., Yang, S., Zhang, S., Xu, W., Ma, N., Zhang, Z., Jiang, B., Su, H., Cheng, Y., Wang, X., and Shao, M.: Measurements of higher alkanes using NO+ chemical ionization in PTR-ToF-MS: important contributions of higher alkanes to secondary organic aerosols in China, Atmos. Chem. Phys., 20, 14123–14138, https://doi.org/10.5194/acp-20-14123-2020, 2020.
Wang, W., Li, X., Shao, M., Hu, M., Zeng, L., Wu, Y., and Tan, T.: The impact of aerosols on photolysis frequencies and ozone production in Beijing during the 4-year period 2012–2015, Atmos. Chem. Phys., 19, 9413–9429, https://doi.org/10.5194/acp-19-9413-2019, 2019.
Wang, W., Parrish, D. D., Li, X., Shao, M., Liu, Y., Mo, Z., Lu, S., Hu, M., Fang, X., Wu, Y., Zeng, L., and Zhang, Y.: Exploring the drivers of the increased ozone production in Beijing in summertime during 2005–2016, Atmos. Chem. Phys., 20, 15617–15633, https://doi.org/10.5194/acp-20-15617-2020, 2020.
Wang, W., Li, X., Kuang, Y., Su, H., Cheng, Y., Hu, M., Zeng, L., Tan, T., and Zhang, Y.: Exploring the Drivers and Photochemical Impact of the Positive Correlation between Single Scattering Albedo and Aerosol Optical Depth in the Troposphere, Environ. Sci. Technol. Lett., 8, 504–510, 2021a.
Wang, W., Qi, J., Zhou, J., Yuan, B., Peng, Y., Wang, S., Yang, S., Williams, J., Sinha, V., and Shao, M.: The improved comparative reactivity method (ICRM): measurements of OH reactivity under high-NOx conditions in ambient air, Atmos. Meas. Tech., 14, 2285–2298, https://doi.org/10.5194/amt-14-2285-2021, 2021b.
Womack, C. C., McDuffie, E. E., Edwards, P. M., Bares, R., de Gouw, J. A., Docherty, K. S., Dubé, W. P., Fibiger, D. L., Franchin, A., Gilman, J. B., Goldberger, L., Lee, B. H., Lin, J. C., Long, R., Middlebrook, A. M., Millet, D. B., Moravek, A., Murphy, J. G., Quinn, P. K., Riedel, T. P., Roberts, J. M., Thornton, J. A., Valin, L. C., Veres, P. R., Whitehill, A. R., Wild, R. J., Warneke, C., Yuan, B., Baasandorj, M., and Brown, S. S.: An Odd Oxygen Framework for Wintertime Ammonium Nitrate Aerosol Pollution in Urban Areas: NOx and VOC Control as Mitigation Strategies, Geophys. Res. Lett., 46, 4971–4979, https://doi.org/10.1029/2019gl082028, 2019.
Wu, C., Wang, C., Wang, S., Wang, W., Yuan, B., Qi, J., Wang, B., Wang, H., Wang, C., Song, W., Wang, X., Hu, W., Lou, S., Ye, C., Peng, Y., Wang, Z., Huangfu, Y., Xie, Y., Zhu, M., Zheng, J., Wang, X., Jiang, B., Zhang, Z., and Shao, M.: Measurement report: Important contributions of oxygenated compounds to emissions and chemistry of volatile organic compounds in urban air, Atmos. Chem. Phys., 20, 14769–14785, https://doi.org/10.5194/acp-20-14769-2020, 2020.
Ye, C., Yuan, B., Lin, Y., Wang, Z., Hu, W., Li, T., Chen, W., Wu, C., Wang, C., Huang, S., Qi, J., Wang, B., Wang, C., Song, W., Wang, X., Zheng, E., Krechmer, J. E., Ye, P., Zhang, Z., Wang, X., Worsnop, D. R., and Shao, M.: Chemical characterization of oxygenated organic compounds in the gas phase and particle phase using iodide CIMS with FIGAERO in urban air, Atmos. Chem. Phys., 21, 8455–8478, https://doi.org/10.5194/acp-21-8455-2021, 2021.
Young, C. J., Washenfelder, R. A., Roberts, J. M., Mielke, L. H., Osthoff, H. D., Tsai, C., Pikelnaya, O., Stutz, J., Veres, P. R., and Cochran, A. K.: Vertically resolved measurements of nighttime radical reservoirs in Los Angeles and their contribution to the urban radical budget, Environ. Sci. Technol., 46, 10965–10973, 2012.
Yu, Y., Cheng, P., Li, H., Yang, W., Han, B., Song, W., Hu, W., Wang, X., Yuan, B., Shao, M., Huang, Z., Li, Z., Zheng, J., Wang, H., and Yu, X.: Budget of nitrous acid (HONO) and its impacts on atmospheric oxidation capacity at an urban site in the fall season of Guangzhou, China, Atmos. Chem. Phys. Discuss. [preprint], https://doi.org/10.5194/acp-2021-178, in review, 2021.
Yuan, B., Liggio, J., Wentzell, J., Li, S.-M., Stark, H., Roberts, J. M., Gilman, J., Lerner, B., Warneke, C., Li, R., Leithead, A., Osthoff, H. D., Wild, R., Brown, S. S., and de Gouw, J. A.: Secondary formation of nitrated phenols: insights from observations during the Uintah Basin Winter Ozone Study (UBWOS) 2014, Atmos. Chem. Phys., 16, 2139–2153, https://doi.org/10.5194/acp-16-2139-2016, 2016.
Yuan, B., Koss, A. R., Warneke, C., Coggon, M., Sekimoto, K., and de Gouw, J. A.: Proton-Transfer-Reaction Mass Spectrometry: Applications in Atmospheric Sciences, Chem. Rev., 117, 13187–13229, https://doi.org/10.1021/acs.chemrev.7b00325, 2017.