the Creative Commons Attribution 4.0 License.
the Creative Commons Attribution 4.0 License.
 | 23 Mar 2022
Odds and ends of atmospheric mercury in Europe and over the North Atlantic Ocean: temporal trends of 25 years of measurements
Danilo Custódio
Katrine Aspmo Pfaffhuber
T. Gerard Spain
Fidel F. Pankratov
Iana Strigunova
Koketso Molepo
Henrik Skov
Johannes Bieser
Ralf Ebinghaus
The global monitoring plan of the Minamata Convention on Mercury was established to generate long-term data necessary for evaluating the effectiveness of regulatory measures at a global scale. After 25 years of monitoring (since 1995), Mace Head is one of the atmospheric monitoring stations with the longest mercury record and has produced sufficient data for the analysis of temporal trends of total gaseous mercury (TGM) in Europe and the North Atlantic. Using concentration-weighted trajectories for atmospheric mercury measured at Mace Head as well as another five locations in Europe, Amderma, Andøya, Villum, Waldhof and Zeppelin, we identify the regional probabilistic source contribution factor and its changes for the period of 1996 to 2019.
Temporal trends indicate that concentrations of mercury in the atmosphere in Europe and the North Atlantic have declined significantly over the past 25 years at a non-monotonic rate averaging 0.03 . Concentrations of TGM at remote marine sites were shown to be affected by continental long-range transport, and evaluation of reanalysis back trajectories displays a significant decrease in TGM in continental air masses from Europe in the last 2 decades. In addition, using the relationship between mercury and other atmospheric trace gases that could serve as a source signature, we perform factorization regression analysis, based on positive rotatable factorization to solve probabilistic mass functions. We reconstructed atmospheric mercury concentration and assessed the contribution of the major natural and anthropogenic sources. The results reveal that the observed downward trend in the atmospheric mercury is mainly associated with a factor with a high load of long-lived anthropogenic species.
- Article
(1928 KB) - Full-text XML
-
Supplement
(2222 KB) - BibTeX
- EndNote


Mercury is a toxic pollutant of crucial concern to public health globally. Due to its neurotoxicity, bioaccumulation, and long-range atmospheric transport, mercury was added to the priority list of several international agreements and conventions dealing with environmental protection, including the Minamata Convention on Mercury (e.g. Driscoll et al., 2013). Following the entry into force of the Stockholm Convention (SC) in 2004 accompanied by the Minamata Convention in 2013 to restrict releases of mercury and its compounds into the environment, a global monitoring plan was devised to evaluate the effectiveness of regulatory measures at regional and global scales. At this time, regions such as western Europe and North America have already established monitoring networks for mercury in air and precipitation, some of which have been in operation since the 1990s (Schmeltz et al., 2011; Gay et al., 2013; EMEP, 2020; http://www.gmos.eu, last access: August 2021; http://www.gos4m.org, last access: August 2021).
During the past decades, atmospheric mercury concentrations in the Northern Hemisphere decreased substantially (Slemr et al., 2003; Cole et al., 2014; Steffen et al., 2015; Weigelt et al., 2015; Weiss-Penzias et al., 2016; Marumoto et al., 2019; Custodio et al., 2020). This downward trend has been attributed to decreasing emissions from the North Atlantic Ocean due to decreasing mercury concentrations in subsurface water (Soerensen et al., 2012) and more recently to decreasing global anthropogenic emissions, mainly due to the decline in mercury release from commercial products (Horowitz et al., 2014) and the changes in Hg0/Hg2+ speciation in flue gas of coal-fired utilities after implementation of NOx and SO2 emission controls (Zhang et al., 2016). Mercury uptake by terrestrial vegetation has also been recently proposed as a contributor to the downward trend (Jiskra et al., 2018).
As reported by Lyman et al. (2020), the mercury emission into the atmosphere is continuously changing. Its monitoring is needed to track the trends, identify persistent and new sources, and assess the efficacy of mercury pollution control policies.
In a 5-year source apportionment study, Custodio et al. (2020) show that a factor with a high load of long-lived anthropogenic atmospheric species could explain the decrease in total gaseous mercury (TGM) at Mace Head. This decrease is consistent with a decrease in the anthropogenic mercury emissions inventory in Europe and North America (Horowitz et al., 2014). Wu et al. (2016) estimated that China's emissions also decreased since 2012, which could have a hemispheric effect. However, the downward trend of global anthropogenic mercury emissions needs to be confirmed by atmospheric observations, and a long-term evaluation of the time series of still not unknown sources and its implication should be assessed.
This study reports continuous long-term temporal trends of TGM in the North Atlantic, Arctic, and Europe, reporting mercury atmospheric concentrations at Mace Head (1995–2019), Amderma (2001–2017), Andøya (2010–2019), Villum (1999–2019), Waldhof (2005–2019), and Zeppelin (2000–2019). Here, we combine a long-time series of atmospheric mercury observed at these sites with calculated 120 h reanalysis backward trajectories in order to investigate transport and long-term changes in concentration patterns on the regional scale.
This paper aims to evaluate the TGM trend on a continental scale and the contribution of the baseline factor as a driver of the downward trend in mercury for the North Atlantic and Europe.
Based on long-range Lagrangian reanalysis backward trajectories and receptor modelling, we investigate the trends and sources of mercury in the atmosphere, assessing the inter-annual variability in the light of atmospheric transport patterns and changes in the regional emissions. In addition, we exploit atmospheric mercury temporal variability, which can be used as additional constraints to improve the ability of models to predict the cycling of mercury in the atmosphere.
Sampling sites
Data from six sites in Europe and Greenland with the longest records of atmospheric mercury concentrations were selected for this study: Mace Head (data available for 1995–2019), Zeppelin (2000–2019), Waldhof (2006–2019), Villum (2008–2019), Andøya (2010–2019), and Amderma (2001–2013). Mace Head and Waldhof are mid-latitude stations, and Zeppelin, Amderma, and Villum can be classified as Arctic ones. Andøya, though at a latitude comparable to that of Amderma, behaves more like a mid-latitude station because the ocean around it is ice-free for most of the year. At all sites mercury had been measured by a Tekran instrument (Tekran Inc, Toronto, Canada). More details will be given at the end of the section.
The Mace Head Global Atmosphere Watch (GAW) station (53∘20′ N and 9∘32 W; 8 ; air-sampling inlet 18 ) is located on the western coast of Ireland on the shore of the North Atlantic Ocean, offering ideal conditions to evaluate both natural and anthropogenic pollutants in oceanic and continental air masses as described by Stanley et al. (2018). The station was part of the GMOS network, and mercury measurements are described in detail by Weigelt et al. (2015).
The Zeppelin GAW station is located on the ridge of the Zeppelin mountain (78∘54′ N, 11∘52′ E) at 474 , about 2 km from Ny Ålesund on the western coast of Spitsbergen, which is the largest of the Svalbard islands. Mercury measurements are described by Aspmo et al. (2005).
Waldhof (52∘48′ N, 10∘45′ E; 74 ) is a rural background site located in the northern German lowlands in a flat terrain, 100 km south-east of Hamburg. The site and analytical method are described in detail by Weigelt et al. (2013).
Villum Research Station is located at the military outpost Station Nord. It is located in the furthermost north-eastern corner of Greenland on the north–south-oriented peninsula of Princess Ingeborg Halvø (81∘36′ N, 16∘40′ W; 25 ), whose northern end is a 20 km × 15 km Arctic lowland plain. The air observatory is located 2 km south of the central complex of Station Nord that is manned year-round by five soldiers. The monitoring site is upwind of the dominant wind direction for Station Nord, and thus any effect of local pollution is minimized. Atmospheric measurements at Villum are described in detail by Skov et al. (2004 and 2020).
Andøya Observatory (69.3∘ N, 16∘ E; 380 ) is situated a few hundred metres away from ALOMAR (Arctic Lidar Observatory for Middle Atmosphere Research), which is located on the western coast on a mountain on the island of Andøya in northern Norway. ALOMAR is part of the Andøya Space Center. More details about measurements at Andøya are available in Berg et al. (2008).
Amderma Polar Station is located near the Amderma settlement of the Arkhangelsk Arctic region of Russia near the coast of the Kara Sea (69∘43′ N, 61∘37′ E; 49 ; Yugor Peninsula, Russia). Gaseous mercury was measured from 2001 until 2017. The site and the mercury measurements are described by Pankratov et al. (2013).
At all sites mercury was measured using a Tekran 2537 A and/or B instrument (Tekran Inc, Toronto, Canada, mostly Model A, at Mace Head and Villum also Model B), an automated dual-channel, single-amalgamation, cold vapour atomic fluorescence (CVAFS) analyser. The instrument has two gold cartridges. While mercury is collected on one of them during the sampling period, the other is being analysed by thermodesorption and CVAFS detection. The functions of the cartridges are then alternated, allowing for quasi-continuous measurement. The instruments are usually protected by an upstream polytetrafluorethylene (PTFE) filter against dust and aerosols.
As discussed by Slemr et al. (2016), gaseous oxidized mercury (GOM) compounds are collected on the gold cartridges and were found to be converted to elemental mercury (GEM), probably during the thermodesorption. The instrument is thus able to measure TGM provided that GOM compounds reach the cartridges. This is frequently not the case because the GOM compounds are sticky and can thus be removed on the way from the inlet to the cartridges (Lyman et al., 2020). The instruments are usually protected by an upstream PTFE filter (mostly 0.2 µm, 0.4 µm at Zeppelin, 0.45 µm at Andøya) against dust and aerosols. Additional soda-lime filters are frequently used to remove free halogens that can shorten the lifetime of the gold cartridges (GMOS Standard Operating Procedure, 2019, http://www.gmos.eu, last access: March 2022) and were implemented at Villum, Amderma, Zeppelin, and Andøya. They are suspected of capturing GOM, although this has not been adequately tested so far (Gustin et al., 2021). Sea salt on the walls of the sampling tubing and on the PTFE filter at coastal stations, such as Mace Head, Andøya, Amderma, and possibly Zeppelin, is also likely to remove GOM. We conclude that GEM is being measured at Mace Head (Weigelt et al., 2015), Villum (Skov et al., 2020), Andøya, Amderma, and Zeppelin (Durnford et al., 2010), and Waldhof (Weigelt et al., 2013). We thus treat all data as GEM. All instruments have been operated according to the standard operating procedures (Steffen and Schroeder, 1999; GMOS Standard Operating Procedure, 2019, http://www.gmos.eu, last access: 18 March 2022). The instruments at Villum, Zeppelin, and Andøya were run with 5 min resolution at a sampling flow rate of 1.5 L min−1. At Waldhof and Mace Head the temporal resolution was 15 min and at Amderma 30 min. The detection limit of the Tekran has a detection limit of 0.04 ng m−3.
Speciated mercury measurements made at Waldhof between 2009 and 2011 provided median concentrations of 6.3 pg m−3 for particulate-bound mercury (PBM) and 1.0 pg m−3 for GOM, while the median GEM concentration was 1.6 ng m−3, representing > 99,5 % of the TGM (Weigelt et al., 2013). GOM measurements using the Tekran speciation system are considered to be underestimated (Jaffe et al., 2014; Lyman et al., 2020). Other speciation measurements show that with the exception of polar depletion events and the upper troposphere, GEM is the dominant form of atmospheric mercury, accounting mostly for more than 95 % of the TGM (Mao et al., 2016).
Back-trajectory analysis, concentration-weighted trajectories, and probability mass function models
To evaluate the spatial coverage and sources of air sampled at the six stations, three-dimensional reanalysis air mass back trajectories at arrival heights of 50 and 500 m above ground were calculated at each site for 120 h using HYSPLIT (v.4.2.0, NOAA https://www.arl.noaa.gov/hysplit/hysplit/, last access: December 2021) as described by Stein et al. (2015). Two trajectories were calculated per day, each representing an average trajectory for the period of 12 h. All individual back trajectories generated by HYSPLIT were converted to text shape files and imported into R (R Project for Statistical Computing), merged with concentration files and used for spatial analysis. To account for the speed and atmospheric residence time of air masses, each continuous back-trajectory line was transformed into 120 hourly points.
Concentration-weighted trajectories (CWTs) are an approach which can be used to indicate the probability of a grid cell contribution to pollution events (Cheng et al., 2013). It is based on a statistical model and can incorporate meteorological information into its analysis scheme to identify the average concentration in areas for pollutants based on a conditional probability that an air parcel that passed through a cell with a gradient concentration displays a high concentration at the trajectory end point (Ashbaugh et al., 1985; Byčenkienė et al., 2014). The CWTs obtained at this study are a function of average mercury concentrations that were obtained every 12 h and of the residence time of a trajectory in each grid cell. The 12 h trajectory segment end points for each back trajectory that corresponds to each 12 h TGM or GEM were retained. For a 120 h trajectory duration, 84 trajectory segment end points were calculated. This transformation of trajectories into hourly segments allowed the subsequent application of a kernel density tool to the combined back-trajectory air mass points from all sampling sites in order to create a density map of the continental concentration and spatial coverage of concentration airflows sampled at the sampling site over the course of an entire year. Seasonal back-trajectory maps were also generated for evaluation of potential seasonal changes in the coverage and sources of airflows (with seasons defined as summer, June, July, and August, autumn, September, October, and November, winter, December, January, and February, and spring, March, April, and May).
The source apportionment for Mace Head was performed based on the mass conservation principle with the inclusion of potential rotated infinity matrix transformation producing factors with a chemical profile signed by tracer species linked to its source. The full description of positive matrix factorization (PMF) and its reconstruction consideration, chemical species considered, uncertainties, and constraining of factors are presented in Custodio et al. (2020). In this study, the PMF was applied to the Mace Head daily data. The species considered in the factorization and their mass loaded in each factor are displayed in Fig. S3 in the Supplement in the article supplement section. In addition, the reconstructed gaseous mercury and the observation displayed an r2 of 0.9949. The mercury mass solved by factorization agree in the 10th/90th percentile quantile regression, as shown in Fig. S4 in the Supplement to the article.
In this study, the assessment was performed on annual bases, and the concentrations in grid cells were calculated by counting the average concentration of trajectory segment end points that terminate within each cell as described by Byčenkienė et al. (2014) and Tang et al. (2018).
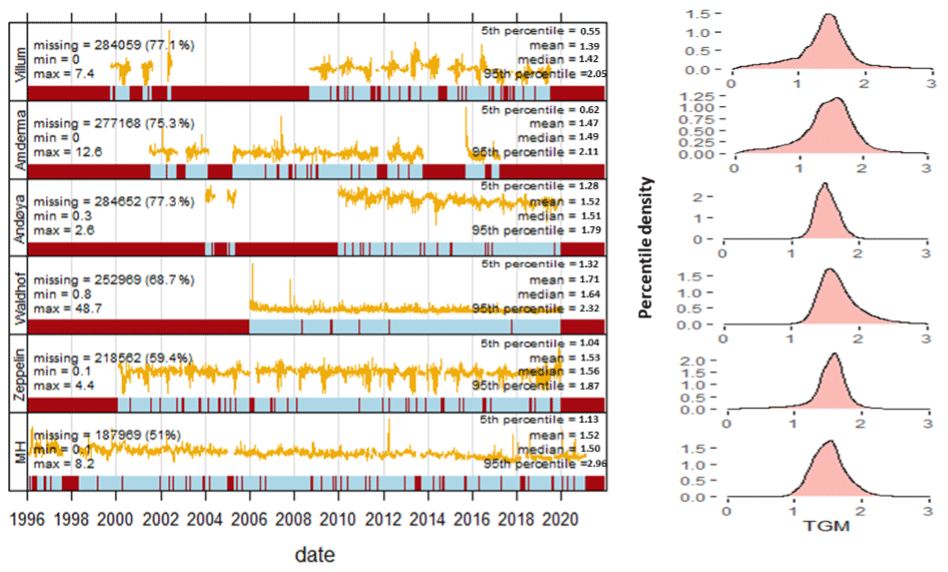
Figure 1Summary of time series of GEM (ng m−3) measured at Mace Head, Zeppelin, Waldhof, Andøya, Amderma and Villum on the left-hand side. Distribution density of the measured concentrations on the left-hand side. The red and blue bars on the time axis represent the missing and available data periods, respectively.
In this section, we present the time series and trends of GEM concentrations from a data set covering the periods from February 1996 to December 2019 (Mace Head), July 2001 to March 2017 (Amderma), February 2000 to December 2019 (Zeppelin), January 2006 to December 2019 (Waldhof), January 2004 to December 2019 (Andøya), and June 1999 to December 2019 (Villum). At Villum the measurements covered only 6 months (spring, summer, and early autumn) in 1999–2002, and no measurements are available for the years 2003–2008 (Skov et al., 2020). The data are summarized in Fig. 1.
GEM concentrations and their frequency distributions shown in Fig. 1 display distinct differences between the stations. GEM concentrations at Villum, Amderma, and Zeppelin decrease frequently to values near 0 (minima of 0.0, 0.0, and 0.1 ng m−3 at Villum, Amderma, and Zeppelin, respectively), and their frequency distribution is skewed to lower values as documented by somewhat lower average than median GEM concentrations and the lowest 5th percentiles of all sites with 0.55, 0.62, and 1.04 ng m−3 at Villum, Amderma, and Zeppelin, respectively. The seasonal occurrence of the polar depletion events at these three stations is characteristic of the Arctic sites with ice and snow coverage (Steffen et al., 2008). The GEM frequency distribution at Zeppelin is less skewed than at Villum and Amderma, perhaps because of the Zeppelin altitude of almost 500 m a.s.l., which is above the layer with the most intensive halogen chemistry within the first 100–200 m above snow (Tackett et al., 2007).
The distribution of GEM concentrations at Waldhof, a mid-latitude station in central Europe, is by contrast skewed to higher values because of frequent events with local and regional pollution (Weigelt et al., 2013). The average and median GEM concentrations at Waldhof are the highest of all the investigated stations, and the average GEM concentration is substantially higher than the median one.
The frequency distribution at Andøya is nearly symmetric, neither skewed to low nor to high GEM concentrations, although a pronounced seasonal variation can be observed. At a latitude comparable to that of Amderma, there are no pronounced depletion events at Andøya because it is exposed to the gulf stream and as such is free of ice for most of the year. Events with local and regional pollution are also largely missing at Andøya (95th percentile of 1.79 ng m−3 is lower when compared with 2.32 and 2.96 ng m−3 at Waldhof and Mace Head). GEM frequency distribution at Mace Head is similar to that at Andøya, and the average and median GEM concentrations are nearly the same as both stations are exposed to air originating mostly from the Atlantic Ocean. In contrast to Andøya, GEM frequency distribution at Mace Head is slightly skewed to a higher concentration because of the local pollution and occasional air transport from Europe (Weigelt et al., 2015).
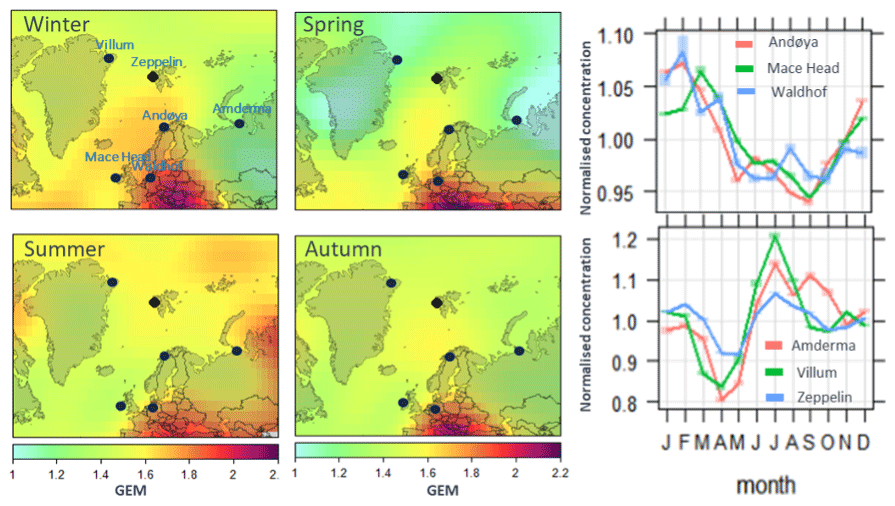
Figure 2Left panels: the density map of atmospheric mercury concentrations in different seasons. Right panels: normalized annual variation of the mercury concentrations at Arctic stations (Amderma, Villum, Zeppelin) and at the mid-latitude ones (Mace Head, Waldhof, Andøya). The shaded areas are the 95 % confidence intervals for the monthly mean.
3.1 Seasonal variation
Figure 2 shows similar seasonal variations at Mace Head, Waldhof, and Andøya, with the maximum GEM concentrations in late winter and early spring and the minimum ones in late summer and early autumn. Similar seasonal variation has been observed at most of the mid-latitude sites in the Northern Hemisphere (e.g. Cole et al., 2014; Weigelt et al., 2015; Sprovieri et al., 2016, Angot et al., 2016). It is usually accompanied by a summer maximum in wet deposition (Gratz et al., 2009; Prestbo and Gay, 2009; Zhang and Jaeglé, 2013; Sprovieri et al., 2017), which is caused by faster oxidation of Hg0 to Hg2+ in summer providing more Hg2+ for scavenging by rain (Holmes et al., 2010; Zhang et al., 2012; Zhang and Jaeglé, 2013; Horowitz et al., 2017). GEM uptake by vegetation can also contribute to summer minimum of GEM concentrations at mid latitudes (Jiskra et al., 2018).
Seasonal variations in mercury at Amderma, Villum, and Zeppelin are influenced by polar depletion events in spring and the subsequent re-emission of the deposited mercury from snow in summer, which result in pronounced GEM minima in April and May and maxima in July (Steffen et al., 2008, 2015; Dommergue et al., 2010; Cole and Steffen, 2010; Cole et al., 2014; Angot et al., 2016; Skov et al., 2020). A similar pattern is also observed at Alert (Cole et al., 2014). Note the larger amplitude of seasonal variation at Arctic stations (0.8–1.2 ng m−3) when compared to the mid-latitude ones (0.95–1.07 ng m−3). Zeppelin has a substantially smaller amplitude of seasonal variation than Amderma and Villum, probably because of its altitude, as already noted in the discussion of the frequency distributions. Andøya, although located at a comparable latitude to Amderma, is only slightly influenced by the polar depletion events because it is ice-free for most of the year, as already mentioned.
Figure 2 shows density maps which are based on the seasonal mean mercury concentration associated with respective trajectories which arrived synchronously at all six stations. The northern parts of the spring and summer panels show over the Arctic Ocean the lowest and highest mercury concentrations, respectively, which is consistent with the spring polar mercury depletion and summer emission of the mercury deposited during the depletion events. The highest GEM concentrations over the middle of the North Atlantic occur in winter and the lowest ones in summer and autumn, which is consistent with the seasonal variations at Mace Head and Andøya. High GEM levels over large parts of Europe occur in all seasons. The highest concentrations by level and extension occur in winter and spring and are somewhat lower in summer and autumn.
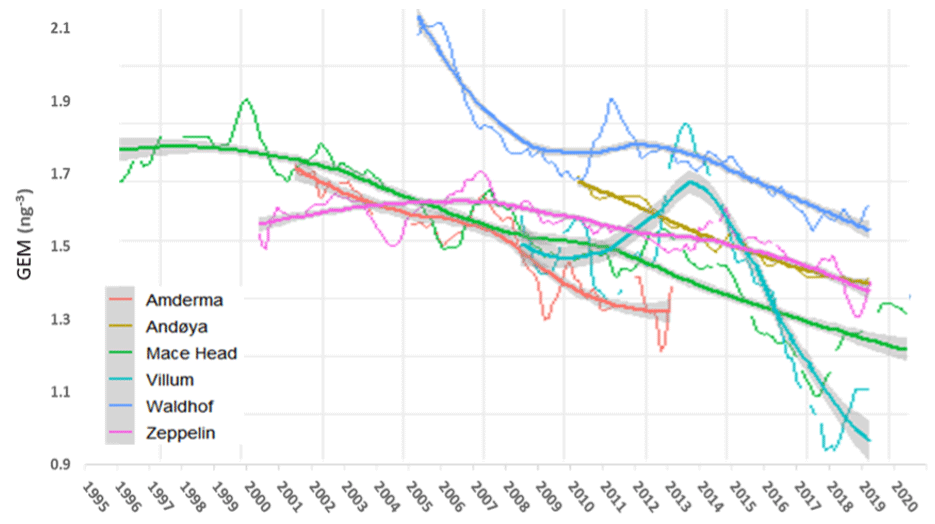
Figure 3Kernel regression of GEM at Amderma, Andøya, Mace Head, Villum, Waldhof, and Zeppelin for the periods of 2001–2013, 2010–2019, 1995–2019, 2008–2019, 2006–2019, and 2000–2019, respectively. The smooth lines and shaded areas represent the kernel regression at the 95 % significance level. The thin lines show the monthly time series of GEM after removing annual cycles with amplitudes of 0.49, 0.23, 0.17, 0.30, 22, and 0.25 ng m−3, respectively, for Amderma, Andøya, Mace Head, Villum, Waldhof, and Zeppelin. The annual cycle was calculated based on seasonality of the time series decomposition. ∗ An individual plot regression for each station is presented in Fig. S1.
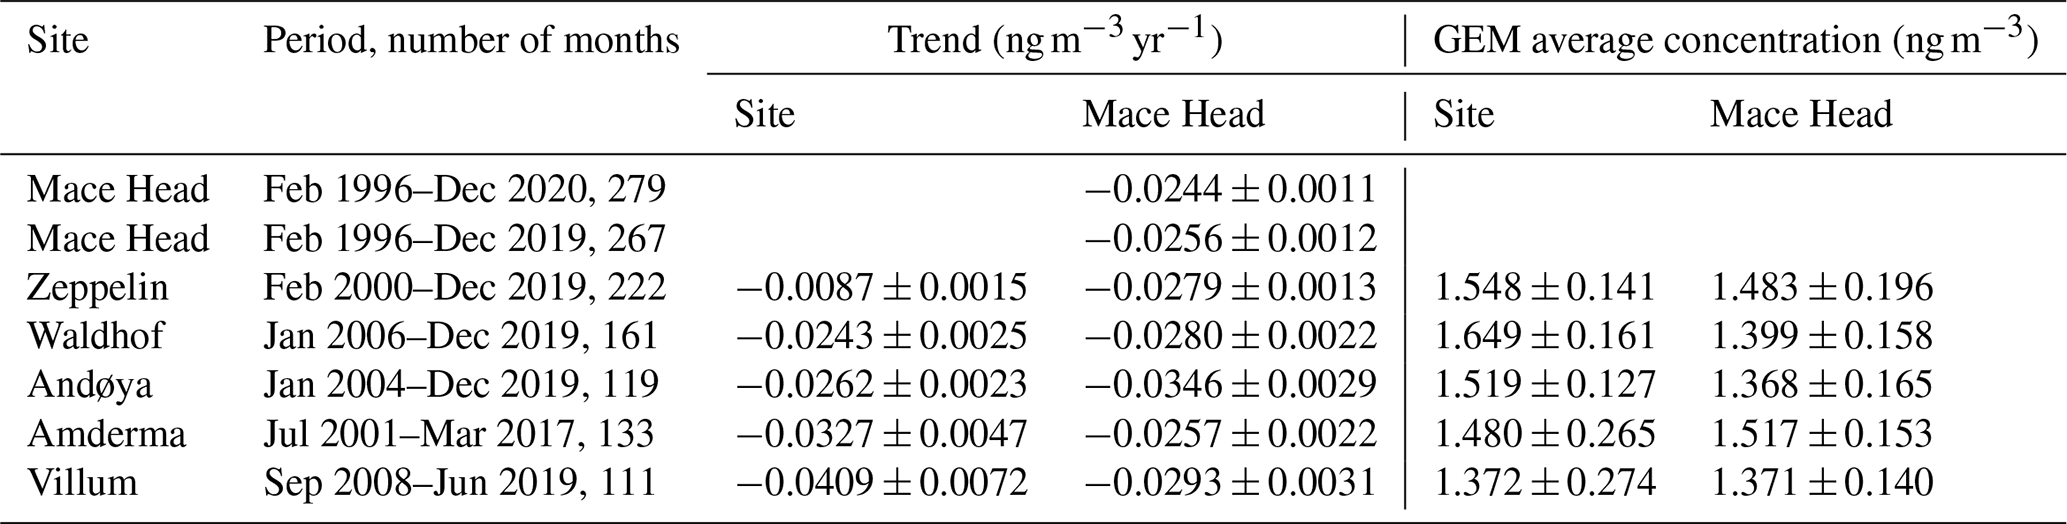
Table 1Comparison of GEM trends and average concentrations at Zeppelin, Waldhof, Andøya, Amderma, and Villum with those at Mace Head. The trends (± confidence interval at the 95 % level) were calculated by the least square fit (LSQF) of monthly medians over the same months for which the measurements are available. Average GEM concentrations were calculated as the average of monthly medians over months with synchronous measurements.
3.2 Temporal trends and regional sources of GEM
Figure 3 and Fig. S1 in the Supplement show the kernel regression of mercury concentrations at Mace Head, Amderma, Andøya, Villum, Waldhof, and Zeppelin. Both figures show a non-monotonic concentration change with temporary increases to intermediate maxima at Waldhof and Zeppelin and the most pronounced ones at Villum with a maximum in 2013. The overall trend of GEM concentrations at all sites points in the downward direction. Table 1 summarizes the overall trends calculated by least square fit (LSQF) from monthly medians and compares them with those at Mace Head over the same periods of available measurements. Averages of monthly medians over the same periods are also listed. Monthly medians were chosen to reduce the influence of depletion events at polar stations and of pollution events at mid-latitude stations. Mace Head was taken as a benchmark because of the longest and most complete data record. In addition, the trend at Mace Head represents the baseline trend (Weigelt et al., 2015). All trends in the table are significant at the > 99.9 % level, as are the differences between the trends at the sites and those at Mace Head.
GEM concentration at Mace Head decreased with an annual rate of −0.0244 ± 0.0011 in 25 years (−0.0256 ± 0.0012 in 24 years). For different periods within these long-term measurements, the decrease rate at Mace Head varied between −0.0244 and −0.0346 , as illustrated by Fig. 3. The average GEM concentrations at Waldhof are substantially higher than those at Mace Head, demonstrating the continuing presence of regional emissions. The downward trend at Andøya is comparable to that at Waldhof but is substantially smaller than at Mace Head for the period of Andøya measurements. The average GEM concentration at Andøya is somewhat higher than at Mace Head.
Of the Arctic stations, GEM concentration at Zeppelin decreased by only −0.0087 when compared to −0.279 for the same period at Mace Head. Cole et al. (2013) reported a trend of +0.002 (−0.007 to + 0.012 , 95 % confidence range) for Zeppelin in the decade 2000–2009, which is consistent with the trend value presented here for 2000–2019. The average GEM concentration of 1.57 ± 0.24 ng m−3 for the decade 2000–2009 (Cole et al., 2013) is almost identical to the 1.55 ± 0.14 ng m−3 reported here for the years 2000–2019 too. A somewhat higher but comparable decrease rate of −0.012 (−0.021 to 0.000 , 95 % confidence interval) was reported for Alert for the 2000–2009 period (Cole et al., 2013). The average GEM concentration of 1.50 ± 0.35 ng m−3 at Alert is also comparable to that of Zeppelin in the 2000–2009 period (Cole et al., 2013). Figure 3 shows at Zeppelin a broad maximum around 2006.
Based on LSQF, the GEM at the Arctic stations Amderma and Villum behaves differently. The downward trends of −0.0327 ± 0.0047 and −0.0409 ± 0.0072 at Amderma and Villum, respectively, are roughly comparable, and both are substantially larger than those at Mace Head for the respective periods. Their trend uncertainties are substantially larger than the uncertainties at the other stations. On the other hand, the average GEM concentrations at Amderma and Villum are comparable to those at Mace Head for the respective periods, albeit with substantially higher standard deviations. This is partly due to the short periods with varying trends at Amderma and even a pronounced temporal maximum at Villum.
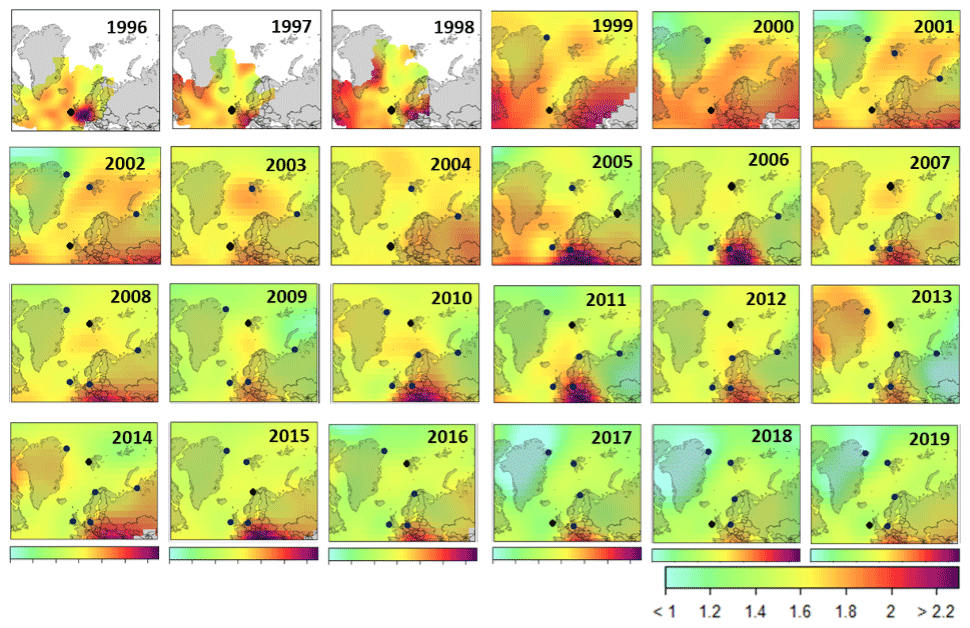
Figure 4Concentration level (concentration-weighted trajectory) of GEM (ng m−3) based on the mercury concentration associated with its reanalysis backward trajectory at Amderma, Andøya, Mace Head, Villum, Waldhof, and Zeppelin. ∗ The black dots show the arriving point (stations) considered for each year.
The higher level of atmospheric mercury at Villum in 2013 is consistent with an elevated mercury level over Greenland in that year, as deduced from back-trajectory analyses shown in Fig. 4. A large subglacial source of mercury at Greenland was recently reported by Hawkings et al. (2021). The increase in GEM at Villum in 2010 and 2013, which drives the trend up during this period, corresponds to two periods of negative extremes at Arctic Oscillation (AO). The extreme on AO and North Atlantic Oscillation (NAO) can enhance the mercury discharge from ice to the atmosphere. Bevis et al. (2019) report an anomalous ice mass loss at Greenland in the 2010–2014 epoch. The abrupt ice melting was driven mainly by changes in air temperature and solar radiation caused by atmospheric circulation anomalies.
In addition, the negative phase of the summertime NAO index increases the prevalence of high-pressure, clear-sky conditions, enhancing surface absorption of solar radiation and decreasing snowfall, and it causes the advection of warm air from southern latitudes into Greenland. These changes promote higher air temperatures, a more extended ablation season, and enhanced melt ice (Fettweis et al., 2013). In 2014/2015, when the AO indexes again turned positive and NAO negative, significant ice loss was reestablished (Bevis et al., 2019).
The back trajectories of air masses calculated for each site were combined with the measured concentration at a 12 h time resolution. The results were used to identify possible regional sources and also to assess temporal variations. Figure 4 shows that calculated air mass back trajectories for the five monitoring sites mainly reflect air masses transported from the ocean; however, they also indicated elevated concentrations in continental trajectories such as from central Europe which are due to anthropogenic emission sources. Despite a shift to the south that can be associated with uncertainties in the Lagrangian approach, the air flow patterns and concentration hotspot were consistent with the current knowledge of geolocation of GEM sources in Europe. Figure 4 also shows a high level of mercury associated with air masses coming from the north-west (Canada and Greenland) during the 1997–2000, 2005, 2010, and 2014 epochs, besides 2013 already mentioned.
The most revealing detail in the observed trend of GEM is displayed in Fig. 4, where it is noticeable that the downward trend is ongoing on a regional scale. This decrease could represent a change in the balance between sources and sinks of mercury in the atmosphere.
The downward trend seems to be driven by decreasing concentrations in continental Europe. This phenomenon is observed mainly after 2005, when data from Waldhof are considered. The downward trend in mercury concentration is observed in all trajectories, even in remote areas, indicated by the yellow fades to green. This phenomenon can be explained only by reductions in global atmospheric mercury sources. In addition, Fig. 4 also shows that the decrease is more pronounced in the hotspot areas identified as anthropogenic sources, where the colour shifts from dark to light red in plots from 2005 to 2019.
The later downward trend at Zeppelin and Villum (Figs. 3 and S1) suggests that these remote, high-latitude stations are less affected by direct European continental emission.
The seemingly non-monotonic downward trends with inter-annual ups and downs observed in this study are not well explained. However, an inspection of the Mace Head data (e.g. in Figs. 3 and 4) reveals that this trend is composed of two segments: one starting in 1999 and ending approximately in 2010 and a second one in 2014 after a biennial upward tendency. It could be premature to assume that the atmospheric mercury trend can be driven simply by a political decision. However, it can be seen that the two important GEM trend deflections in 1999 and 2014 coincide with COUNCIL DIRECTIVE 1999/31/EC, a European Union (EU) directive that regulates waste management of landfills in the EU, and the mercury international treaty (Minamata Convention on Mercury) designed to protect human health and the environment from anthropogenic emissions and releases of mercury approved on 10 October 2013. Continental and international environmental treaties are the result of long political and societal debate, and commitment to such a deal could reflect an already established control policy at the national level.
For example, in 1990 the United States Clean Air Act put mercury on a list of toxic pollutants that needed to be controlled to the greatest possible extent, forcing industries that release high concentrations of mercury into the environment to install maximum achievable control technologies (MACT). In 2005, the EPA promulgated a regulation that added power plants to the list of sources that should be controlled and instituted in the nation, and in 2011 new rules for coal-fired power plants were announced by the EPA (State of New Jersey et al., 2008; Castro and Sherwell, 2015).
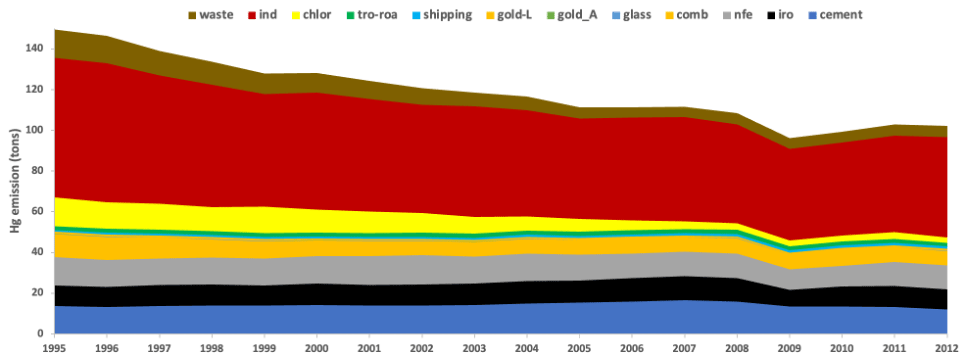
Figure 5Time series of Europe and North Atlantic mercury emission. Emission inventory provided by the Emissions Database for Global Atmospheric Research (EDGARv4.tox2, 2018). The inventory data are available at https://edgar.jrc.ec.europa.eu/dataset_tox4#sources (last access: January 2022). The time series displays the time variability of 12 sectors reported as cement production (cement), combustion in residential and other combustion (comb), glass production (glass), artisanal and small-scale gold production (gold_A), large-scale gold production (gold_L), shipping emission (shipping), road transportation (tro-roa), chloralkali industry mercury cell technology (chlor), combustion in power generation and industry (ind), and solid waste incineration and agricultural waste burning (waste).
Additionally, in 2007 the European Union implemented new mercury control measures, banning mercury in new non-electrical measuring devices, such as thermometers and barometers (Jones, 2007).
We note that Waldhof, a continental station close to anthropogenic sources in Europe, corroborates the interpretation of an anthropogenic emission-driven mercury trend. This station shows a more pronounced GEM decrease between 2005 and 2010 compared to the years since then.
An accurate emissions inventory is essential for interpreting trends in atmospheric concentrations and assessing the effectiveness of mercury pollution control policies (Lyman et al., 2020). However, the trends in GEM concentrations have not always been consistent with those of global anthropogenic emissions inventories, whose uncertainties ranged from −33 % to 60 % (Lyman et al., 2020, and references therein). Besides a conundrum in the global emission inventories, which displays an upwards trend, as shown in Fig. S5 in the Supplement, the Emissions Database for Global Atmospheric Research (EDGARv4.tox2, 2018) also displays a downward trend for Europe and the North Atlantic (Fig. 5).
Zhang et al. (2016) presented a revised inventory of Hg emissions for the estimation of artisanal and small-scale gold mining emissions, and, accounting for the change in Hg0/HgII speciation of emissions from coal-fired utilities after implementation of emission controls targeted at SO2 and NOx, those authors estimate a factor of 20 % decrease in atmospheric emission from 1990 to 2010. As shown in Fig. 5, anthropogenic emissions in Europe and North Atlantic decreased by 31 % from 1995 to 2012 (EDGARv4.tox2, 2018); the displayed decrease was mainly associated with the industrial sectors as chloralkali and combustion power.
Natural sources can contribute up to 40 % of the atmospheric mercury budget (Pirrone et al., 2010); however, a trend in such a source has not been observed or reported in the literature so far.
Based on the GEM associated with each air mass trajectory, we investigated the impact of atmospheric circulation on continental Europe and the North Atlantic Ocean and observe distinct concentration patterns for the ocean and continental regions. We observed for example that air masses arriving at Mace Head from central Europe show distinct trends. We compared the regional patterns of GEM with other pollutants (CO, CO2, CH4, O3, CHCl3, CCl4, and CFCs) also measured at Mace Head and find that GEM shows a similar pattern concerning source locations to the other species closely related to anthropogenic sources. However, GEM displays a downward trend, with decreasing concentrations in air masses from central Europe and England.
Figure 4 shows the concentration-weighted trajectory maps for GEM measurements over Mace Head, Amderma, Andøya, Villum, Waldhof, and Zeppelin. It can be seen that the highest concentrations are almost exclusively from air masses over central Europe. Exceptions are 1997 to 2000, which indicate high levels of GEM in air masses coming from the north-west. However, it should be mentioned that CWTs for this period computed only Mace Head and Villum (1999–2000) data.
The results also show a lower level of GEM in air mass segments over the North Atlantic region. This region is constantly associated with a sink of anthropogenic pollutants.
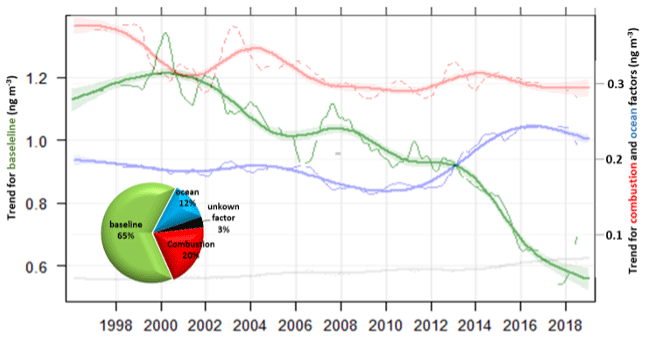
Figure 6Time series (thin lines) and percentile average contribution (pie) of factors solved by PMF in the GEM reconstruction for Mace Head from 1996 to 2019, baseline (green) combustion (red), ocean (blue) and unknown factor (grey). The smooth lines and shaded areas represent the kernel regression at the 95 % significance level. The thin lines show the monthly time series with annual cycles removed.
3.3 Probability of source contribution
Based on our analysis so far, our hypothesis is that the mercury concentration in North Atlantic air masses is affected by the intensity of transport from important regional and global sources and also by temporal changes in these sources. For example, the high mercury concentrations observed in the late 1990s coincide with higher contributions from continental air masses. During 2001, a noticeable reduction in the Mace Head GEM concentration was observed, corresponding to a lesser influence of continental European air masses. This was due not only to a lower frequency of air masses from continental Europe, but also lower concentrations of GEM in those air masses compared to previous years. A similar phenomenon was observed in the trend during 2005/2006 and 2008 to 2010, when an increase and decrease in the inter-annual trend corresponded to higher and lower CWTs in air masses coming from continental Europe (Fig. S2 in the Supplement).
In a 5-year source apportionment of mercury at Mace Head, Custodio et al. (2020) show that a factor with a high load of anthropogenic species could explain downward trends of atmospheric mercury. The downward trend of that factor was associated with a reduction in emissions due to cleaner manufacturing processes involving mercury and regulations limiting the emissions from coal-fired power plants since the 1980s as well as a reduction in the release of mercury from commercial products since the 1990s (Streets et al., 2011; Zhang et al., 2016).

Figure 7Downward trend of GEM (blue) and baseline factor (red) at Mace Head. The smooth lines and shaded areas represent the kernel regression and 95 % significance level. The thin lines show the monthly time series with annual cycles removed. On the bottom right the correlation regression is shown with the distribution of each variable and the value of the correlation plus the significance level as stars. p values (0.001) ↔ symbols (“”).
Here we extend the source apportionment analysis back to 1996. The extended reconstruction of the main sources of mercury back to 1996, shown in Fig. 6, displays a similar apportionment pattern to that reported by Custodio et al. (2020). The source apportionment indicates a baseline factor characterized by a high load of anthropogenic species accounting for 65 % of GEM mass. The baseline factor has already been proposed as the driving factor for mercury trends at Mace Head by Custodio et al. (2020). In this study, this factor displays a downward trend of 2.7 % yr−1 and correlates (r=0.97) with the mercury trend (Fig. 7). A factor with a load of anthropogenic species driving the Mace Head GEM trend down by a strength of 97 % at the level of 0.001 (p values) is also supported by Fig. 4, which displays a temporal decrease in mercury level in the reanalysis backward trajectory.
One important consideration to take into account is that the baseline factor is interpreted as a global mercury budget from several sources which were not solved by PMF; such a factor could also take into account the strength of non-modulated extreme events or periodic oscillations such as El Niño–Southern Oscillation (ENSO) as speculated by Slemr et al. (2020) and references therein. Those events can be a reason for increased rotation in the mercury trend, imposing significance and raising the correlation.
The Global Mercury Assessment inventory (AMAP/UNEP, 2019) estimates a contribution of combustion sources to atmospheric mercury at 24 %. In this study the combustion factor, which was indicated by a high load of CO, accounted for 20 % of total GEM mass at Mace Head (Fig. 6). A slight decreasing trend was observed in this factor, which could be associated with the implementation of emission controls on coal-fired utilities as proposed by Zhang et al. (2016) in a revised inventory of Hg emissions.
However, as reported by Custodio et al. (2020), this trend should be taken with caution since the combustion factor was fingerprinted by CO, a short-lived species (1–3 months) with significant seasonal and atmospheric transport dependence, although the trend in the combustion factor solved by PMF complies with the decrease in the emission in the sector “combustion in residential and other combustion”, provided the EDGAR inventory, and is shown in Fig. 5.
The ocean factors account for 12 % of total GEM mass at Mace Head and were identified by a high load of CHCl3 (Fig. 5). CHCl3, used to trace sign ocean factors, is a trace atmospheric gas originating 90 % from a natural source, offshore seawater being the largest issuer (McCulloch, 2003).
As reported by Custodio et al. (2020) and references therein, the residence time of mercury in the ocean is substantially longer than in the atmosphere, ranging from years to decades or millennia. Human activity has substantially increased the oceanic mercury reservoir and consequently is affecting the fluxes of mercury between the sea and atmosphere (Strode et al., 2007).
The acidification of oceans, climate change, excess nutrient inputs, and pollution are fundamentally changing the ocean's biogeochemistry (Doney, 2010) and will certainly also influence mercury ocean–air fluxes in a still unknown direction.
This study shows an upward trend in the oceanic factor after 2010, as can be seen in Fig. 6; however, its significance, implication, and causes remain to be determined.
Due to a lack of source markers that could allow the propagation of the eigenvector from axis rotation to reconstruct more realistically the complexity of mercury sources, only four factors solved our factorization. However, such an approach provided a valuable method to evaluate mercury fluxes.
A conundrum in the observed negative trend in mercury in Europe and North Atlantic over the past 2 decades is explained in this study by a decrease in anthropogenic emissions. The significant decline in concentrations of GEM over the past 2 decades demonstrates that regulatory measures across Europe have been successful in reducing the atmospheric concentration of this species, although an extensive fossil fuel use and a legacy of stockpiles in the environment continue to pose a challenge.
These results show the transport pattern of atmospheric mercury, reveal that a baseline factor with a high load of long-lived anthropogenic species dominates the source of mercury in the North Atlantic, and highlights the need for continued monitoring of the GEM and its sources. This study brings a monitoring concept for mercury on a continental scale which can be extended to a global monitoring plan by integration of the mercury monitoring network, potentially identifying hotspot concentration areas and their change over time.
This large-scale, long-term trend data evaluation can be used for assessing the effectiveness of the Minamata Convention.
More specific conclusions include the following.
-
Enhancement of mercury in the air masses over Greenland in summer during epochs of atmospheric circulation anomalies
-
Mercury downward trends of 2 ± 3 % yr−1, 2.1 ± 1.5 % yr−1, 1.6 ± 3.9 % yr−1, 4 ± 16 % yr−1, 2 ± 4 % yr−1, and 3 ± 3 % yr−1 at Amaderma, Andøya, Mace Head, Villum, Waldhof, and Zeppelin, respectively, are influenced by regional sources and then biased by atmosphere transport.
-
The observed GEM downward trend in the North Atlantic and Arctic seems to be driven by decreasing concentration in continental Europe.
-
A baseline factor with a high load of anthropogenic species drives the mercury trend down by a strength of 97 % at the level of 0.001 (p values) based on source reconstruction at Mace Head.
-
Combustion sources could account for 20 % of GEM with a decreasing trend, and ocean sources account for 12 % with a slightly increasing trend.
Codes used in this study are available by request to the corresponding author.
Data from this study are publicly available, as described in the experimental section.
The supplement related to this article is available online at: https://doi.org/10.5194/acp-22-3827-2022-supplement.
DC proposed the article, processed data, and wrote the article. KAP provided data and evaluated the findings. TGS provided data and supported the writing and discussions. FFP provided data and participated in the discussion. IS supported the calculation in scripts and data assimilation besides providing meteorological and Lagrangian analysis. KAP supported the trajectory calculation and discussion. HS provided data and discussion in its interpretation. JB and RE endorsed and supported the article preparation, respectively.
The contact author has declared that neither they nor their co-authors have any competing interests.
Publisher's note: Copernicus Publications remains neutral with regard to jurisdictional claims in published maps and institutional affiliations.
This article is part of the special issue “Research results from the 14th International Conference on Mercury as a Global Pollutant (ICMGP 2019), MercOx project, and iGOSP and iCUPE projects of ERA-PLANET in support of the Minamata Convention on Mercury (ACP/AMT inter-journal SI)”. It is not associated with a conference.
The authors are grateful to the Amderma, Andøya, Mace Head, Villum, Waldhof, and Zeppelin Observatory for all data provided. The authors are grateful to the NOAA Air Resources Laboratory (ARL) for the provision of the HYSPLIT transport and dispersion model and the READY website (http://www.ready.noaa.gov, last access: January 2022). We would like to thank the associate editor and the two anonymous reviewers, whose critical evaluation of our manuscript helped us strengthen our results.
This research has been supported by the European Commission's Horizon 2020 Framework Programme (iGOSP ERA-PLANET and e-shape “EUROGEOSS” Showcase projects).
The article processing charges for this open-access publication were covered by the Helmholtz-Zentrum Hereon.
This paper was edited by Aurélien Dommergue and reviewed by two anonymous referees.
AMAP/UNEP: Technical background report for the Global Mercury Assessment 2018, Arctic Monitoring and Assessment Programme, Oslo, Norway/UNEP Chemicals and Health Branch, Geneva, Switzerland, ISBN 978-82-7971-108-7, 2019.
Angot, H., Dastoor, A., De Simone, F., Gardfeldt, K., Gencarelli, C. N., Hedgecock, I. M., Langer, S., Magand, O., Mastromonaco, M. N., Nordstrøm, C., Pfaffhuber, K. A., Pirrone, N., Ryjkov, A., Selin, N. E., Skov, H., Song, S., Sprovieri, F., Steffen, A., Toyota, K., Travnikov, O., Yang, X., and Dommergue, A.: Chemical cycling and deposition of atmospheric mercury in polar regions: review of recent measurements and comparison with models, Atmos. Chem. Phys., 16, 10735–10763, 2016.
Ashbaugh, L. L., Malm, W. C., and Sadeh, W. Z.: A residence time probability analysis of sulfur concentrations at Grand Canyon National Park, Atmos. Environ. A-Gen., 19, 1263–1270, 1985.
Aspmo, K., Gauchard, P.-A., Steffen, A., Temme, C., Berg, T., Bahlmann, E., Banic, C., Dommergue, A., Ebinghaus, R., Ferrari, C., Pirrone, N., Sprovieri, F., and Wibetoe, G.: Measurements of atmospheric mercury species during an international study of mercury depletion events at Ny-Ålesund, Svalbard, spring 2003. How reproducible are our present methods?, Atmos. Environ., 39, 7607–7619, 2005.
Berg, T., Aspmo, K., and Eiliv Steinnes, E.: Transport of Hg from Atmospheric mercury depletion events to the mainland of Norway and its possible influence on Hg deposition, Geophys. Res. Lett., 35, L09802, https://doi.org/10.1029/2008GL033586, 2008.
Bevis, M., Harig, C., Khan, S. A., Brown, A., Simons, F. J., Willis, M., Fettweis, X., van den Broeke, M. R., Madsen, F. B., Kendrick, E., Caccamise II, D. J., van Dam, T., Knudsen, P., and Nylen, T.: Accelerating changes in ice mass within Greenland, and the ice sheet's sensitivity to atmospheric forcing, Proc. Natl. Acad. Sci. USA, 116, 116, https://doi.org/10.1073/pnas.1806562116, 2019.
Byčenkienė, S., Dudoitis, V., and Ulevicius, V.: The Use of Trajectory Cluster Analysis to Evaluate the Long-Range Transport of Black Carbon Aerosol in the South-Eastern Baltic Region, Hindawi Advances in Meteorology, 11, 137694, https://doi.org/10.1155/2014/137694, 2014.
Castro, S. and Sherwell, J.: Effectiveness of Emission Controls to Reduce the Atmospheric Concentrations of Mercury, Environ. Sci. Technol., 49, 14000–14007, https://doi.org/10.1021/acs.est.5b03576, 2015.
Cheng, I., Zhang, L., Blanchard, P., Dalziel, J., and Tordon, R.: Concentration-weighted trajectory approach to identifying potential sources of speciated atmospheric mercury at an urban coastal site in Nova Scotia, Canada, Atmos. Chem. Phys., 13, 6031–6048, https://doi.org/10.5194/acp-13-6031-2013, 2013.
Cole, A. S. and Steffen, A.: Trends in long-term gaseous mercury observations in the Arctic and effects of temperature and other atmospheric conditions, Atmos. Chem. Phys., 10, 4661–4672, https://doi.org/10.5194/acp-10-4661-2010, 2010.
Cole, A. S., Steffen, A., Pfaffhuber, K. A., Berg, T., Pilote, M., Poissant, L., Tordon, R., and Hung, H.: Ten-year trends of atmospheric mercury in the high Arctic compared to Canadian sub-Arctic and mid-latitude sites, Atmos. Chem. Phys., 13, 1535–1545, https://doi.org/10.5194/acp-13-1535-2013, 2013.
Cole, A. S., Steffen, A., Eckley, C. S., Narayan, J., Pilote, M., Tordon, R., Graydon, J. A., St. Louis, V. L., Xu, X., and Branfireun, B. A.: A survey of mercury in air and precipitation across Canada: patterns and trends, Atmosphere, 5, 635–668, 2014.
Custodio, D., Ebinghaus, R., Spain, T. G., and Bieser, J.: Source apportionment of atmospheric mercury in the remote marine atmosphere: Mace Head GAW station, Irish western coast, Atmos. Chem. Phys., 20, 7929–7939, https://doi.org/10.5194/acp-20-7929-2020, 2020.
Dommergue, A., Larose, C., Fain, X., Clarisse, O., Foucher, D., Hintelmann, H., Schneider, D., and Ferrari, C. P.: Deposition of mercury species in the Ny Alesund area (79∘ N) and their transfer during snowmelt, Environ. Sci. Technol., 44, 901–907, 2010.
Doney, S. C.: The growing human footprint on coastal and openocean biogeochemistry, Science, 328, 1512–1516, 2010.
Driscoll, C. T., Mason, R. P., Chan, H. M., Jacob, D. J., and Pirrone, N.: Mercury as a global pollutant: Sources, pathways, and effects, Environ. Sci. Technol., 47, 4967–4983, 2013.
Durnford, D., Dastoor, A., Figueras-Nieto, D., and Ryjkov, A.: Long range transport of mercury to the Arctic and across Canada, Atmos. Chem. Phys., 10, 6063–6086, https://doi.org/10.5194/acp-10-6063-2010, 2010.
EDGARv4tox2: Emissions Database for Global Atmospheric Research, https://edgar.jrc.ec.europa.eu/dataset_tox4#sources (last access: February 2022), European Commission, 2018.
EMEP: CCC-Report 3/2020, ISBN 978-82-425-3014-1, Norwegian Institute for Air Research, Kjeller, Norway, 2020.
Fettweis, X., Hanna, E., Lang, C., Belleflamme, A., Erpicum, M., and Gallée, H.: Brief communication “Important role of the mid-tropospheric atmospheric circulation in the recent surface melt increase over the Greenland ice sheet”, The Cryosphere, 7, 241–248, https://doi.org/10.5194/tc-7-241-2013, 2013.
Gay, D. A., Schmeltz, D., Prestbo, E., Olson, M., Sharac, T., and Tordon, R.: The Atmospheric Mercury Network: measurement and initial examination of an ongoing atmospheric mercury record across North America, Atmos. Chem. Phys., 13, 11339–11349, https://doi.org/10.5194/acp-13-11339-2013, 2013.
GMOS Standard Operating Procedure: Methods for the determination of TGM and GEM, Global Mercury Observation System, http://www.gmos.eu (last access: November 2021), 2019.
Gratz, L. E., Keeler, G. J., and Miller, E. K.: Long-term relationships between mercury wet deposition and meteorology, Atmos. Environ., 43, 6218–6229, 2009.
Gustin, M. S., Dunham-Cheatham, S. M., Huang, J., Lindberg, S., and Lyman, S. N.: Development of an understanding of reactive mercury in ambient air: A review, Atmosphere, 12, 73, https://doi.org/10.3390/atmos12010073, 2021.
Hawkings, J. R., Linhoff, B. S., Wadham, J. L., Stibal, M., Lamborg, C. H., Carling, G. T., Lamarche-Gagnon, G., Kohler, T. J., Ward, R., Hendry, K. R., Falteisek, L., Kellerman, A. M., Cameron, K. A., Hatton, J. E., Tingey, S., Holt, A. D., Vinšová, P., Hofer, S., Bulínová, M., Větrovský, T., Meire, L., and Spencer, R. G. M.: Large subglacial source of mercury from the southwestern margin of the Greenland Ice Sheet, Nat. Geosci., 14, 496–502, https://doi.org/10.1038/s41561-021-00753-w, 2021.
Holmes, C. D., Jacob, D. J., Corbitt, E. S., Mao, J., Yang, X., Talbot, R., and Slemr, F.: Global atmospheric model for mercury including oxidation by bromine atoms, Atmos. Chem. Phys., 10, 12037–12057, https://doi.org/10.5194/acp-10-12037-2010, 2010.
Horowitz, H. M., Jacob, D. J., Amos, H. M., Streets, D. G., and Sunderland, E. M.: Historical mercury releases from commercial products: Global environmental implications, Environ. Sci. Technol., 48, 10242–10250, 2014.
Horowitz, H. M., Jacob, D. J., Zhang, Y., Dibble, T. S., Slemr, F., Amos, H. M., Schmidt, J. A., Corbitt, E. S., Marais, E. A., and Sunderland, E. M.: A new mechanism for atmospheric mercury redox chemistry: implications for the global mercury budget, Atmos. Chem. Phys., 17, 6353–6371, https://doi.org/10.5194/acp-17-6353-2017, 2017.
Jaffe, D. A., Lyman, S., Amos, H. M., Gustin, M. S., Huang, J., Selin, N. E., Levin, L., ter Shure, A., Mason, R. P., Talbot, R., Rutter, A., Finley, B., Jaeglé, L., Shah, V., McClure, C., Ambrose, J., Gratz, L., Lindberg, S., Weiss-Penzias, P., Sheu, G.-R., Feddersen, D., Horvat, M., Dastoor, A., Hynes, A. J., Mao, H., Sonke, J. E., Slemr, F., Fisher, J. A., Ebinghaus, R., Zhang, Y., and Edwards, G.: Progress on understanding atmospheric mercury hampered by uncertain measurements, Environ. Sci. Technol., 48, 7204–7206, 2014.
Jiskra, M., Sonke, J. E., Obrist, D., Bieser, J., Ebinghaus, R., Lund Myhre, C., Pfaffhuber, K. A., Wängberg, I., Kyllönen, K., Worthy, D., Martin, L. G., Labuschagne, C., Mkololo, T., Ramonet, M., Magand, O., and Dommergue, A.: A vegetation control on seasonal variations in global atmospheric mercury concentrations, Nat. Geosci., 11, 244–250, 2018.
Jones, H.: EU bans mercury in barometers, thermometers, Reuters, 10 July 2007, https://www.reuters.com/article/environment-mercury-eu-dc-idUSL0988544920070710 (last access: January 2022), 2007.
Lyman, S. N., Cheng, I., Gratz, L. E., Weiss-Penzias, P., and Zhang, L.: An updated review of atmospheric mercury, Sci. Total Environ., 707, 135575, https://doi.org/10.1016/j.scitotenv.2019.135575, 2020.
Mao, H., Cheng, I., and Zhang, L.: Current understanding of the driving mechanisms for spatiotemporal variations of atmospheric speciated mercury: a review, Atmos. Chem. Phys., 16, 12897–12924, https://doi.org/10.5194/acp-16-12897-2016, 2016.
Marumoto, K., Suzuki, N., Shibata, Y., Takeuchi, A., Takami, A., Fukuzaki, N., Kawamoto, K., Mizohata, A., Kato, S., Yamamoto, T., Chen, J., Hattori, T., Nagasaka, H., and Saito, M.: Long-term observation of speciated atmospheric mercury during 2007–2018 at Cape Hedo, Okinawa, Japan, Atmosphere, 10, 362, https://doi.org/10.3390/atmos10070362, 2019.
McCulloch, A.: Chloroform in the environment: occurrence, sources, sinks and effects, Chemosphere, 50, 1291–1308, https://doi.org/10.1016/S0045-6535(02)00697-5, 2003.
Pankratov, F. F., Konoplev, A. V., Makhura, A., and Kats, O. V.: Analysis of the Data of Long-term Monitoring of Atmospheric Mercury Content and Meteorological Parameters at Amderma Polar Station, Russ. Meteorol. Hydro.+, 38, 405–413, Allerton Press, Inc., ISSN 1068-3739, 2013.
Pirrone, N., Cinnirella, S., Feng, X., Finkelman, R. B., Friedli, H. R., Leaner, J., Mason, R., Mukherjee, A. B., Stracher, G. B., Streets, D. G., and Telmer, K.: Global mercury emissions to the atmosphere from anthropogenic and natural sources, Atmos. Chem. Phys., 10, 5951–5964, https://doi.org/10.5194/acp-10-5951-2010, 2010.
Prestbo, E. M. and Gay, D. A.: Wet deposition of mercury in the U.S., and Canada, 1996–2005: Results and analysis of the NADP mercury deposition network (MDN), Atmos. Environ., 43, 4223–4233, 2009.
Schmeltz, D., Evers, D. C., Driscoll, C. T., Artz, R., Cohen, M., Gay, D., Haeuber, R., Krabbenhoft, D. P., Mason, R., Morris, K., and Wiener, J. G.: MercNet: A national monitoring network to assess responses to changing mercury emissions in the United States, Ecotoxicology, 20, 1713–1725, 2011.
Skov, H., Christensen, J., Goodsite, M. E., Heidam, N. Z., Jensen, B., Wåhlin, P., and Geernaert, G.: The fate of elemental mercury in Arctic during atmospheric mercury depletion episodes and the load of atmospheric mercury to Arctic, Environ. Sci. Technol., 38, 2373–2382, 2004.
Skov, H., Hjorth, J., Nordstrøm, C., Jensen, B., Christoffersen, C., Bech Poulsen, M., Baldtzer Liisberg, J., Beddows, D., Dall'Osto, M., and Christensen, J. H.: Variability in gaseous elemental mercury at Villum Research Station, Station Nord, in North Greenland from 1999 to 2017, Atmos. Chem. Phys., 20, 13253–13265, https://doi.org/10.5194/acp-20-13253-2020, 2020.
Slemr, F., Brunke, E.-G., Ebinghaus, R., Temme, C., Munthe, J., Wängberg, I., Schroeder, W., Steffen, A., and Berg, T.: Worldwide trend of atmospheric mercury since 1977, Geophys. Res. Lett., 30, 1516, https://doi.org/10.1029/2003GL016954, 2003.
Slemr, F., Weigelt, A., Ebinghaus, R., Kock, H. H., Bödewadt, J., Brenninkmeijer, C. A. M., Rauthe-Schöch, A., Weber, S., Hermann, M., Becker, J., Zahn, A., and Martinsson, B.: Atmospheric mercury measurements onboard the CARIBIC passenger aircraft, Atmos. Meas. Tech., 9, 2291–2302, https://doi.org/10.5194/amt-9-2291-2016, 2016.
Slemr, F., Martin, L., Labuschagne, C., Mkololo, T., Angot, H., Magand, O., Dommergue, A., Garat, P., Ramonet, M., and Bieser, J.: Atmospheric mercury in the Southern Hemisphere – Part 1: Trend and inter-annual variations in atmospheric mercury at Cape Point, South Africa, in 2007–2017, and on Amsterdam Island in 2012–2017, Atmos. Chem. Phys., 20, 7683–7692, https://doi.org/10.5194/acp-20-7683-2020, 2020.
Soerensen, A. L., Jacob, D. J., Streets, D. G., Witt, M. L. I., Ebinghaus, R., Mason, R. P., Andersson, M., and Sunderland, E. M.: Multi-decadal decline of mercury in the North Atlantic atmosphere explained by changing subsurface seawater concentrations, Geophys. Res. Lett., 39, L21810, https://doi.org/10.1029/2012GL053736, 2012.
Sprovieri, F., Pirrone, N., Bencardino, M., D'Amore, F., Carbone, F., Cinnirella, S., Mannarino, V., Landis, M., Ebinghaus, R., Weigelt, A., Brunke, E.-G., Labuschagne, C., Martin, L., Munthe, J., Wängberg, I., Artaxo, P., Morais, F., Barbosa, H. D. M. J., Brito, J., Cairns, W., Barbante, C., Diéguez, M. D. C., Garcia, P. E., Dommergue, A., Angot, H., Magand, O., Skov, H., Horvat, M., Kotnik, J., Read, K. A., Neves, L. M., Gawlik, B. M., Sena, F., Mashyanov, N., Obolkin, V., Wip, D., Feng, X. B., Zhang, H., Fu, X., Ramachandran, R., Cossa, D., Knoery, J., Marusczak, N., Nerentorp, M., and Norstrom, C.: Atmospheric mercury concentrations observed at ground-based monitoring sites globally distributed in the framework of the GMOS network, Atmos. Chem. Phys., 16, 11915–11935, https://doi.org/10.5194/acp-16-11915-2016, 2016.
Sprovieri, F., Pirrone, N., Bencardino, M., D'Amore, F., Angot, H., Barbante, C., Brunke, E.-G., Arcega-Cabrera, F., Cairns, W., Comero, S., Diéguez, M. D. C., Dommergue, A., Ebinghaus, R., Feng, X. B., Fu, X., Garcia, P. E., Gawlik, B. M., Hageström, U., Hansson, K., Horvat, M., Kotnik, J., Labuschagne, C., Magand, O., Martin, L., Mashyanov, N., Mkololo, T., Munthe, J., Obolkin, V., Ramirez Islas, M., Sena, F., Somerset, V., Spandow, P., Vardè, M., Walters, C., Wängberg, I., Weigelt, A., Yang, X., and Zhang, H.: Five-year records of mercury wet deposition flux at GMOS sites in the Northern and Southern hemispheres, Atmos. Chem. Phys., 17, 2689–2708, https://doi.org/10.5194/acp-17-2689-2017, 2017.
Stanley, K. M., Grant, A., O'Doherty, S., Young, D., Manning, A. J., Stavert, A. R., Spain, T. G., Salameh, P. K., Harth, C. M., Simmonds, P. G., Sturges, W. T., Oram, D. E., and Derwent, R. G.: Greenhouse gas measurements from a UK network of tall towers: technical description and first results, Atmos. Meas. Tech., 11, 1437–1458, https://doi.org/10.5194/amt-11-1437-2018, 2018.
State of New Jersey, et al.: Petitioners vs. Environmental Protection Agency (Case No. 05-1097), United States Court of Appeals for the District of Columbia Circuit, argued 6 December 2007, decided 8 February 2008, https://www.cadc.uscourts.gov/internet/opinions.nsf/68822E72677ACBCD8525744000470736/$file/05-1097a.pdf (last access: March 2022), 2008.
Steffen, A. and Schroeder, W. H.: Standard operating procedures manual for total gaseous mercury measurements, Toronto, Canada, Canadian Atmospheric Mercury Measurements Network (CAMNet), Environment Canada, 1999.
Steffen, A., Douglas, T., Amyot, M., Ariya, P., Aspmo, K., Berg, T., Bottenheim, J., Brooks, S., Cobbett, F., Dastoor, A., Dommergue, A., Ebinghaus, R., Ferrari, C., Gardfeldt, K., Goodsite, M. E., Lean, D., Poulain, A. J., Scherz, C., Skov, H., Sommar, J., and Temme, C.: A synthesis of atmospheric mercury depletion event chemistry in the atmosphere and snow, Atmos. Chem. Phys., 8, 1445–1482, https://doi.org/10.5194/acp-8-1445-2008, 2008.
Steffen, A., Lehnherr, I., Cole, A., Ariya, P., Dastoor, A., Durnford, D., Kirk, J., and Pilote, M.: Atmospheric mercury in the Canadian Arctic. Part 1: A review of recent field measurements, Sci. Total Environ., 509–510, 3–15, 2015.
Stein, A. F., Draxle, R. R., Rolph, G. D., Stunder, B. J. B., Cohen, M. D., and Ngain, F.: NOAA'S HYSPLIT Atmospheric Transport and Dispersion Modeling System, TS40, B. Am. Meteorol. Soc., 96, 2059–2077, https://doi.org/10.1175/BAMS-D-14-00110.1, 2015.
Streets, D. G., Devane, M. K., Lu, Z., Bond, T. C., Sunderland, E. M., and Jacob, D. J.: All-time releases of mercury to the atmosphere from human activities, Environ. Sci. Technol., 45, 10485–10491, https://doi.org/10.1021/es202765m, 2011.
Strode, S. A., Jaeglé, L., Selin, N. E., Jacob, D. J., Park, R. J., Yantoska, R. M., Mason, R. P., and Slemr, F.: Air–sea exchange in the global mercury cycle, Global Biogeochem. Cy., 21, GB1017, https://doi.org/10.1029/2006GB002766, 2007.
Tackett, P. J., Cavender, A., Shepson, P. D., Bottenheim, J. W., Morin S., Deary, J., and Steffen, A.: A study of the vertical scale of halogen chemistry in the Arctic troposphere during polar sunrise at Barrow, AK, J. Geophys. Res., 112, D07306, https://doi.org/10.1029/2006JD007785, 2007.
Tang, Y., Wang, S., Wu, Q., Liu, K., Wang, L., Li, S., Gao, W., Zhang, L., Zheng, H., Li, Z., and Hao, J.: Recent decrease trend of atmospheric mercury concentrations in East China: the influence of anthropogenic emissions, Atmos. Chem. Phys., 18, 8279–8291, https://doi.org/10.5194/acp-18-8279-2018, 2018.
Weigelt, A., Temme, C., Bieber, E., Schwerin, A., Schuetze, M., Ebinghaus, R., and Kock, H. H.: Measurements of atmospheric mercury species at a German rural background site from 2009 to 2011 – methods and results, Environ. Chem., 10, 102–110, 2013.
Weigelt, A., Ebinhaus, R., Manning, A. J., Derwent, R. G., Simmonds, P. G., Spain, T. G., Jennings, S. G., and Slemr, F.: Analysis and interpretation of 18 years of mercury observations since 1996 at Mace Head, Ireland, Atmos. Environ., 100, 85–93, 2015.
Weiss-Penzias, P. S., Gay, D. A., Brigham, M. E., Parsons, M. T., Gustin, M. S., and ter Schure, A.: Trends in mercury wet deposition and mercury air concentrations across the U.S. and Canada, Sci. Total Environ., 568, 546–556, 2016.
Wu, Q. R., Wang, S. X., Li, G. L., Liang, S., Lin, C.-J., Wang, Y. F., Cai, S., Liu, K., and Hao, J.: Temporal trend and spatial distribution of speciated atmospheric mercury emissions in China during 1978–2014, Environ. Sci. Technol., 50, 13428–13435, https://doi.org/10.1021/acs.est.6b04308, 2016.
Zhang, Y. and Jaeglé, L.: Decreases in mercury wet deposition over the United States 2004–2010: Roles of domestic and global background emission reductions, Atmosphere, 4, 113–131, 2013.
Zhang, Y., Jaeglé, L., van Donkelaar, A., Martin, R. V., Holmes, C. D., Amos, H. M., Wang, Q., Talbot, R., Artz, R., Brooks, S., Luke, W., Holsen, T. M., Felton, D., Miller, E. K., Perry, K. D., Schmeltz, D., Steffen, A., Tordon, R., Weiss-Penzias, P., and Zsolway, R.: Nested-grid simulation of mercury over North America, Atmos. Chem. Phys., 12, 6095–6111, https://doi.org/10.5194/acp-12-6095-2012, 2012.
Zhang, Y., Jacob, D. J., Horowitz, H. M., Chen, L., Amos, H. M., Krabbenhoft, D. P., Slemr, F., St. Louis, V. L., and Sunderland, E. M.: Observed decrease in atmospheric mercury explained by global decline in anthropogenic emissions, P. Natl. Acad. Sci. USA, 113, 526–531, 2016.