the Creative Commons Attribution 4.0 License.
the Creative Commons Attribution 4.0 License.
 | 03 Mar 2022
Relative importance of high-latitude local and long-range-transported dust for Arctic ice-nucleating particles and impacts on Arctic mixed-phase clouds
Xiaohong Liu
Mingxuan Wu
Ziming Ke
Hunter Brown
Dust particles, serving as ice-nucleating particles (INPs), may impact the Arctic surface energy budget and regional climate by modulating the mixed-phase cloud properties and lifetime. In addition to long-range transport from low-latitude deserts, dust particles in the Arctic can originate from local sources. However, the importance of high-latitude dust (HLD) as a source of Arctic INPs (compared to low-latitude dust, LLD) and its effects on Arctic mixed-phase clouds are overlooked. In this study, we evaluate the contribution to Arctic dust loading and INP population from HLD and six LLD source regions by implementing a source-tagging technique for dust aerosols in version 1 of the US Department of Energy's Energy Exascale Earth System Model (E3SMv1). Our results show that HLD is responsible for 30.7 % of the total dust burden in the Arctic, whereas LLD from Asia and North Africa contributes 44.2 % and 24.2 %, respectively. Due to its limited vertical transport as a result of stable boundary layers, HLD contributes more in the lower troposphere, especially in boreal summer and autumn when the HLD emissions are stronger. LLD from North Africa and East Asia dominates the dust loading in the upper troposphere with peak contributions in boreal spring and winter. The modeled INP concentrations show better agreement with both ground and aircraft INP measurements in the Arctic when including HLD INPs. The HLD INPs are found to induce a net cooling effect (−0.24 W m−2 above 60∘ N) on the Arctic surface downwelling radiative flux by changing the cloud phase of the Arctic mixed-phase clouds. The magnitude of this cooling is larger than that induced by North African and East Asian dust (0.08 and −0.06 W m−2, respectively), mainly due to different seasonalities of HLD and LLD. Uncertainties of this study are discussed, which highlights the importance of further constraining the HLD emissions.
- Article
(12597 KB) - Full-text XML
-
Supplement
(12251 KB) - BibTeX
- EndNote


The Arctic has experienced long-term climate changes, including rapid warming and shrinking sea ice extent. Arctic mixed-phase clouds (AMPCs), which occur frequently throughout the year, strongly impact the surface and atmospheric energy budget and are one of the main components driving the Arctic climate (Morrison et al., 2012; Shupe and Intrieri, 2004; Tan and Storelvmo, 2019). The AMPC lifetime, properties, and radiative effects are closely connected to the primary ice formation process, as the formed ice crystals grow at the expense of cloud liquid droplets due to the lower saturation vapor pressure with respect to ice than liquid water (the so-called Wegener–Bergeron–Findeisen process or, in short, WBF process; Liu et al., 2011; M. Zhang et al., 2019). Large ice crystals with higher fall speeds than liquid droplets can readily initiate precipitation and further deplete cloud liquid through the riming process. All these processes can also interact with each other nonlinearly and impact the phase partitioning of mixed-phase clouds (Tan and Storelvmo, 2016).
Primary ice formation in mixed-phase clouds only occurs heterogeneously with the aid of ice-nucleating particles (INPs). According to Vali (1985), heterogeneous ice nucleation is classified into four different modes: through the collision of an INP with a supercooled liquid droplet (contact freezing), by an INP immersed in a liquid droplet (immersion freezing), when the INP also serves as a cloud condensation nucleus (condensation freezing), or by the direct deposition of water vapor to a dry INP (deposition nucleation). Immersion freezing is usually treated together with condensation freezing in models, as instruments cannot distinguish between them (Vali et al., 2015). This immersion or condensation freezing is generally thought to be the most important ice nucleation mode in the mixed-phase clouds (de Boer et al., 2011; Prenni et al., 2009; Westbrook and Illingworth, 2013). It remains a significant challenge to characterize the INP types and concentrations, partially because only a very small fraction of aerosols can serve as INPs (DeMott et al., 2010). This is especially the case for the clean environment in the Arctic. Therefore, the potential sources and numbers of Arctic INPs are still largely unknown.
Mineral dust aerosols are identified as one of the most important types of INPs in the atmosphere due to their high ice nucleation efficiency (DeMott et al., 2003; Hoose and Möhler, 2012; Murray et al., 2012; Atkinson et al., 2013) and their abundance in the atmosphere (Kinne et al., 2006). They are mainly emitted from arid and semi-arid regions located at low latitudes to midlatitudes, such as North Africa, the Middle East, and Asia. Observational studies found that LLD can be transported to the Arctic (Bory et al., 2003; VanCuren et al., 2012; Huang et al., 2015) and act as a key contributor to the Arctic INP population (Si et al., 2019). A modeling study also suggested that low-latitude dust (LLD) has a large contribution to dust concentrations in the upper troposphere of the Arctic (Groot Zwaaftink et al., 2016), since LLD is usually lifted by convection and topography and then transported poleward following slantwise isentropes. This finding confirms the potential of LLD to serve as INPs in AMPCs. The impact of LLD INPs on clouds was further investigated by Shi and Liu (2019), who found that LLD INPs induce a net cooling cloud radiative effect in the Arctic due to their impacts on cloud water path and cloud fraction.
Although LLD has attracted much attention in the past, it is recognized that 2 %–3 % of the global dust emission is produced by local Arctic sources above 50∘ N (Bullard et al., 2016), which include Iceland (Arnalds et al., 2016; Dagsson-Waldhauserova et al., 2014; Prospero et al., 2012), Svalbard (Dörnbrack et al., 2010), Alaska (Crusius et al., 2011), and Greenland (Bullard and Austin, 2011). Groot Zwaaftink et al. (2016) found that high-latitude dust (HLD) contributes 27 % of the total dust burden in the Arctic. Different from LLD, most of the emitted HLD is restricted at the lower altitudes in the Arctic because of the stratified atmosphere in the cold environment (Bullard, 2017; Groot Zwaaftink et al., 2016).
It is also noted that HLD is likely an important source for the observed INPs in the Arctic, especially during the warm seasons. For example, Irish et al. (2019) suggested that mineral dust from Arctic bare lands (likely eastern Greenland or northwestern continental Canada) was an important contributor to the INP population in the Canadian Arctic marine boundary layer during summer 2014. Attempts have been made to quantify the ice-nucleating ability of HLD. Paramonov et al. (2018) found that Icelandic glaciogenic silt had a similar ice-nucleating ability as LLD at temperatures below −30 ∘C. Similarly, Sanchez-Marroquin et al. (2020) suggested that the ice-nucleating ability of aircraft-collected Icelandic dust samples is slightly lower but comparable with that of the LLD. Some other studies also noticed that HLD can act as efficient INPs at warm temperatures. As early as the 1950s, the airborne dry dust particles from permafrost ground at Thule, Greenland, were found to nucleate ice at temperatures as warm as −5 ∘C (Fenn and Weickmann, 1959). This is corroborated by a more recent study which investigated the glacial outwash sediments in Svalbard and ascribed the remarkably high ice-nucleating ability to the presence of soil organic matter (Tobo et al., 2019).
Despite their potential importance, HLD sources are largely underestimated or even omitted in global models (Zender et al., 2003). Fan (2013) noticed that the autumn peak in measured surface dust concentrations at Alert was underestimated by the model, likely due to a lack of local dust emission. Similarly, Shi and Liu (2019) also mentioned that the distinction of simulated and satellite-retrieved dust vertical extinction in the Arctic became larger near the surface.
In this study, we account for the HLD emission by replacing the default dust emission scheme (Zender et al., 2003) with the Kok et al. (2014a, b) scheme in the Energy Exascale Earth System Model version 1 (E3SMv1). We further explicitly track the dust aerosols emitted from the Arctic (HLD) and six major LLD sources using a newly developed source-tagging technique in E3SMv1. The objectives of this study are to (1) examine the source attribution of the Arctic dust aerosols in the planetary boundary layer and in the free troposphere, (2) examine the contribution of dust from various sources to the Arctic dust INPs, and (3) quantify the subsequent influence of dust INPs from various sources on the Arctic mixed-phase cloud radiative effects. We are particularly interested in the relative importance of local HLD versus long-range-transported LLD.
The paper is organized as follows. The E3SMv1 model and experiment setup are introduced in Sect. 2. Section 3 presents model results and comparisons with observations. The uncertainties are discussed in Sect. 4, and Sect. 5 summarizes the results.
2.1 Model description and experiment setup
Experiments in this study are performed using the atmosphere component (EAMv1) of the US Department of Energy (DOE) E3SMv1 model (Rasch et al., 2019). The model predicts the number and mass mixing ratios of seven aerosol species (i.e., mineral dust, black carbon – BC, primary organic aerosol, secondary organic aerosol, sulfate, sea salt, and marine organic aerosol – MOA) through a four-mode version of the modal aerosol module (MAM4) (Liu et al., 2016; Wang et al., 2020). The four aerosol modes are Aitken, accumulation, coarse, and primary carbon, while dust aerosols are carried in accumulation and coarse modes. Aerosol optical properties in each mode are parameterized following Ghan and Zaveri (2007). The dust optics used in this study are updated according to Albani et al. (2014).
EAMv1 includes a two-moment stratiform cloud microphysics scheme (MG2) (Gettelman and Morrison, 2015). We note that the WBF process rate in EAMv1 is tuned down by a factor of 10, which results in more prevalent supercooled liquid water clouds in high latitudes than observations and many other global climate models (Y. Zhang et al., 2019; Zhang et al., 2020). In addition, the Cloud Layers Unified By Binormals (CLUBB) parameterization (Bogenschutz et al., 2013; Golaz et al., 2002; Larson et al., 2002) is used to unify the treatments of planetary boundary layer turbulence, shallow convection, and cloud macrophysics. Deep convection is treated by the Zhang and McFarlane (1995) scheme.
In EAMv1, the heterogeneous ice nucleation in mixed-phase clouds follows the classical nucleation theory (CNT) (Hoose et al., 2010; Y. Wang et al., 2014). CNT holds the stochastic hypothesis, which treats the ice nucleation process as a function of time. Immersion, contact, and deposition nucleation on dust and BC are treated in the CNT scheme. More details about CNT parameterization are provided in Sect. S2.1 in the Supplement.
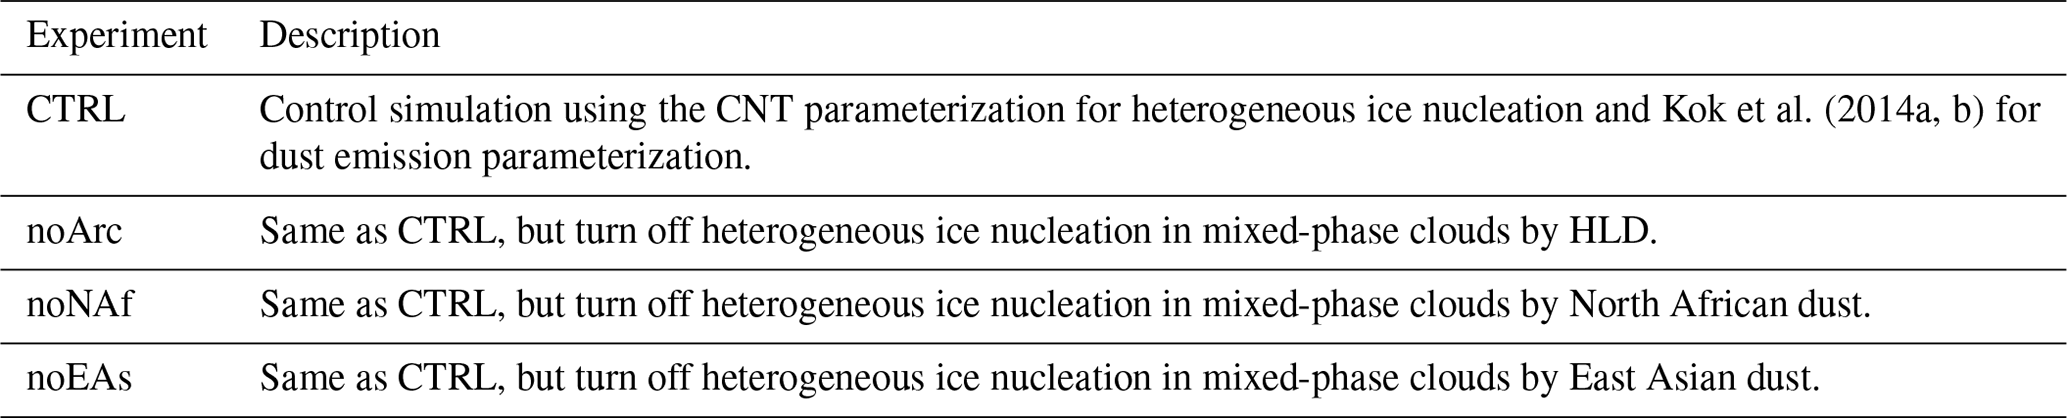
The experiments we conducted for this study are shown in Table 1. For the control experiment (hereafter CTRL), the EAMv1 was integrated from July 2006 to the end of 2011 at 1∘ horizontal resolution and 72 vertical layers. The first 6 months of the experiment were treated as model spin-up, and the last 5 years of results were used in analyses. The horizontal wind components were nudged to the Modern-Era Retrospective Analysis for Research and Applications version 2 (MERRA-2) (Gelaro et al., 2017) meteorology with a relaxation timescale of 6 h (Zhang et al., 2014). In addition to CTRL, we conducted three sensitivity experiments to investigate the INP effect of dust from major source regions. In these sensitivity experiments, heterogeneous ice nucleation in the mixed-phase clouds by dust from local Arctic sources, North Africa, and East Asia is turned off (i.e., noArc, noNAf, and noEAs, respectively). The other settings of these three experiments are identical to CTRL. Analyses related to the sensitivity experiments are provided in Sect. 3.4.
2.2 Dust emission parameterization and source-tagging technique
Dust emission in the default EAMv1 is parameterized following Zender et al. (2003, Z03), which uses semi-empirical dust source functions to address the spatial variability in soil erodibility. The HLD emission is omitted in the Z03 scheme, since it was thought to be dubious (Zender et al., 2003). In this study, we replaced the Z03 scheme with another dust emission parameterization (Kok et al., 2014a, b, K14) that avoids using a source function (see more details about K14 in Sect. S1). The K14 scheme is able to produce the HLD emission over Iceland, the Greenland coast, Canada, Svalbard, and northern Eurasia (Fig. 1a). Furthermore, to address the overestimation of dust emission in clay size (< 2 µm diameter) (Kok et al., 2017), we changed the size distribution of emitted dust particles from Z03 to that based on the brittle fragmentation theory (Kok, 2011). 1.1 % of the total dust mass is emitted to the accumulation mode and 98.9 % of that is emitted to the coarse mode based on the brittle fragmentation theory, whereas the fractions are 3.2 % and 96.8 %, respectively, in Z03.
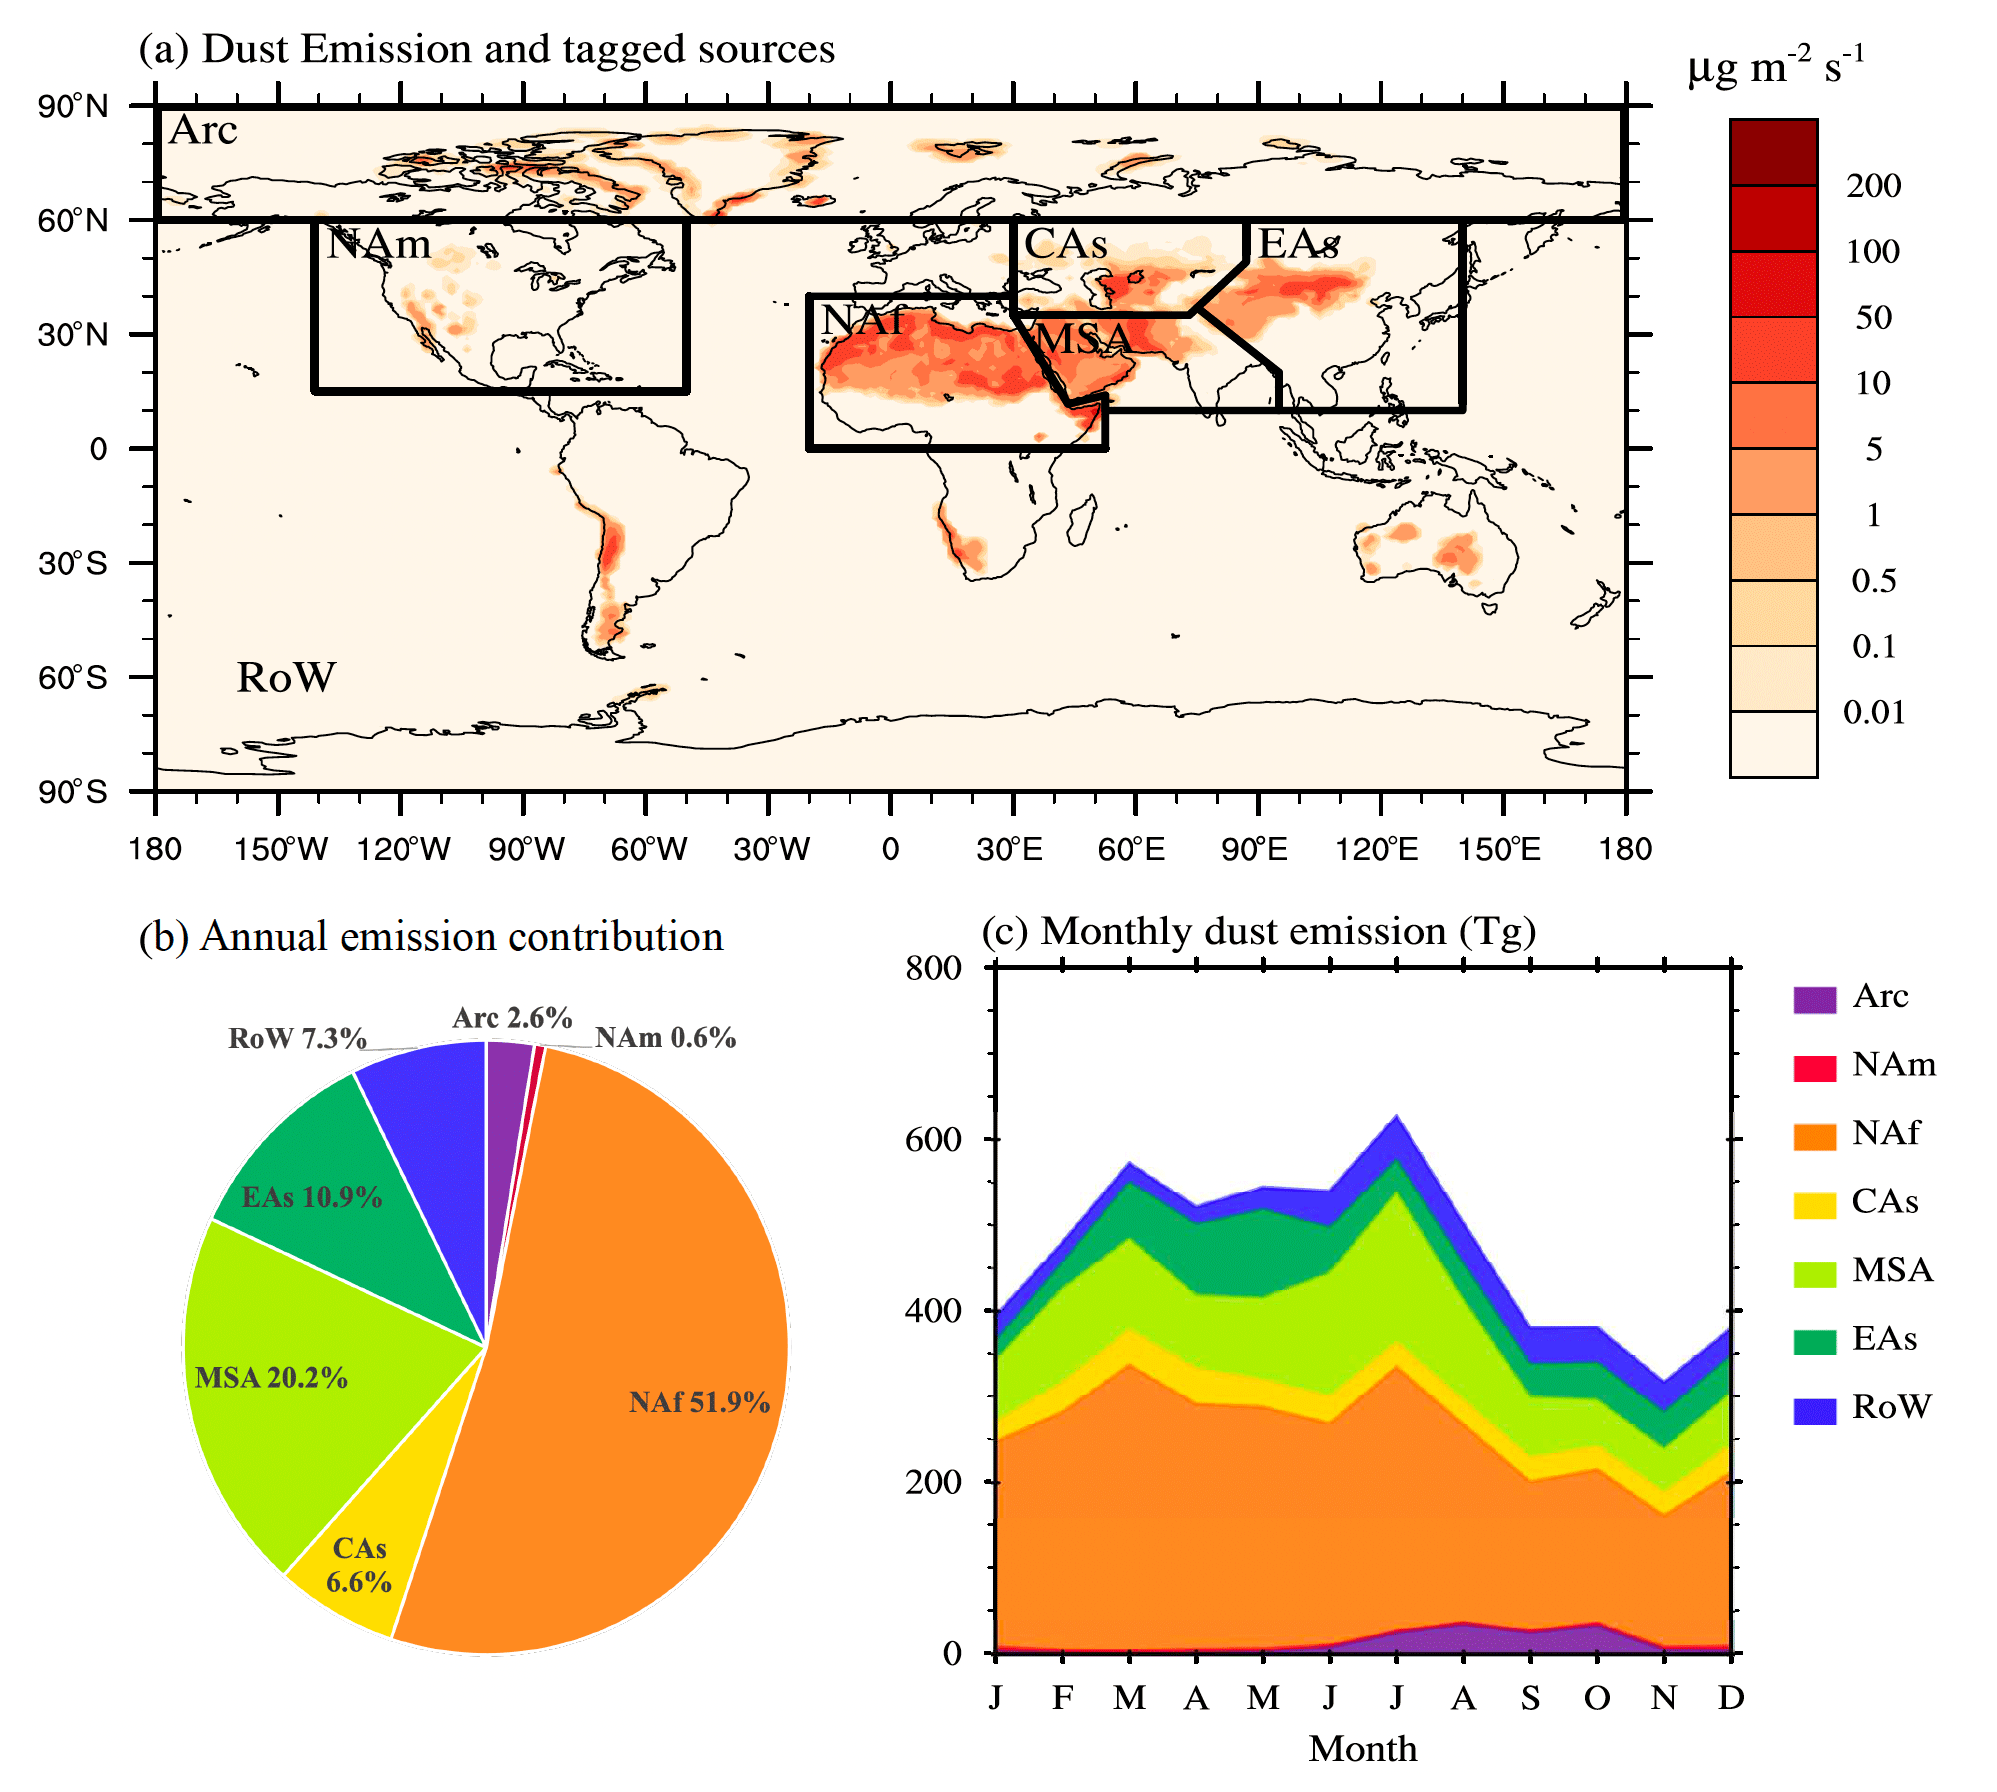
Figure 1(a) Simulated global annual mean dust emission with seven tagged source regions (Arc: Arctic; NAm: North America; NAf: North Africa; CAs: Central Asia; MSA: the Middle East and South Asia; EAs: East Asia; RoW: rest of the world). (b) The respective percentage contributions to the global annual mean dust emission from the individual source regions. (c) Seasonal cycle of global dust emission.
To quantify the source attribution of dust, we implemented a dust source-tagging technique in EAMv1. This modeling tool was previously applied to BC (H. Wang et al., 2014; Yang et al., 2017b), sulfate (Yang et al., 2017a), and primary organic aerosol (Yang et al., 2018) in the Community Atmosphere Model version 5 (CAM5). In this method, dust emission fluxes from different sources are assigned to separate tracers and transport independently so that dust originating from different sources can be tracked and tuned separately in a single model experiment. As shown in Fig. 1a, dust emissions from seven source regions are tagged: Arctic (Arc; above 60∘ N, HLD source), North America (NAm), North Africa (NAf), Central Asia (CAs), Middle East and South Asia (MSA), East Asia (EAs), and the rest of the world (RoW). The Arctic source is further divided into four sub-sources: Alaska (Ala), northern Canada (NCa), Greenland and Iceland (GrI), and northern Eurasia (NEu) (Fig. S1), which are used in the analysis of INP sources in Sect. 3.3. RoW represents the three major dust sources in the Southern Hemisphere (South America, South Africa, and Australia), along with very low emissions from Europe and the Antarctic.
The global dust emission for CTRL is 5640 Tg yr−1, which is tuned so that the global average dust aerosol optical depth (DOD) is 0.031. This is within the range of the observational estimate (0.030 ± 0.005) by Ridley et al. (2016). To maintain the magnitude of the global averaged DOD, our tuned global dust emission exceeds the range of the AeroCom (Aerosol Comparisons between Observations and Models) models (500 to 4400 Tg yr−1; Huneeus et al., 2011), likely due to a short lifetime caused by dust dry deposition that is too strong at the bottom layer near the dust source regions in EAMv1 (Wu et al., 2020). It is also about 2000 Tg yr−1 higher than the previous EAMv1 studies (Shi and Liu, 2019; Wu et al., 2020) because we distribute less dust mass into the accumulation mode and more dust mass into the coarse mode based on Kok (2011). The HLD emission is further tuned up by 10 times so that it accounts for 2.6 % (144 Tg yr−1) of the global dust emission (Fig. 1b), which is comparable with the recent estimates of 2 %–3 % above 50∘ N by Bullard et al. (2016) and of 3 % above 60∘ N by Groot Zwaaftink et al. (2016). The majority of global dust emission is contributed from North Africa (51.9 %, 2929 Tg yr−1) and Asia (37.7 %, 2124 Tg yr−1), with Asian emissions composed of MSA (20.2 %, 1140 Tg yr−1), EAs (10.9 %, 613 Tg yr−1), and CAs (6.6 %, 371 Tg yr−1). NAm has a weak dust emission of 33.4 Tg yr−1 that only contributes 0.6 % to the global emission, while the RoW has a combined contribution of 7.3 % (410 Tg yr−1). In addition, the seasonal variations between HLD and LLD emissions are different – the HLD (Arctic) source is more active in late summer and autumn, while the LLD sources (e.g., NAf, MSA, EAs) peak in spring and early summer (Fig. 1c).
3.1 Model validation
To evaluate the model performance in simulating the dust cycle, we compare the model predictions with measured aerosol optical depth (AOD), dust surface concentrations, and dust deposition fluxes from global observation networks (Fig. 2). We select and process the level 2.0 AOD data (2007–2011) at 40 “dust-dominated” AErosol RObotic NETwork (AERONET; Holben et al., 1998) stations following Kok et al. (2014b). We note that the AERONET AOD measurements are biased towards clear-sky conditions due to the cloud-screening procedure (Smirnov et al., 2000). For dust surface concentrations, we use the same measurements at 22 sites, which Huneeus et al. (2011) used for the AeroCom comparison, and further extend the dataset with measurements at three high-latitude stations: Heimaey (Prospero et al., 2012), Alert (Sirois and Barrie, 1999), and Trapper Creek (Interagency Monitoring of Protected Visual Environments, IMPROVE; Malm et al., 1994). It is noted that the measurements at Trapper Creek only include dust particles smaller than 2.5 µm and are only compared with simulated dust concentrations at the same size range. All other concentration measurements capture dust particles below 40 µm and are compared with simulated dust over the whole size range (< 10 µm). The dust deposition flux dataset, which includes 84 stations, is also the same as Huneeus et al. (2011). The locations of the observation network are shown in Fig. 2d, with the AOD data taken close to source regions and the dust surface concentrations and deposition fluxes measured at relatively remote regions. The Pearson correlation coefficient (r) is provided for each comparison. We note that the comparisons are subject to representative biases caused by comparing an observational station with a global model grid point (with a horizontal resolution of ∼ 100 km). The comparisons of dust concentration and deposition flux also have systematic errors because the measurements were for a different time period than that of the model simulation.
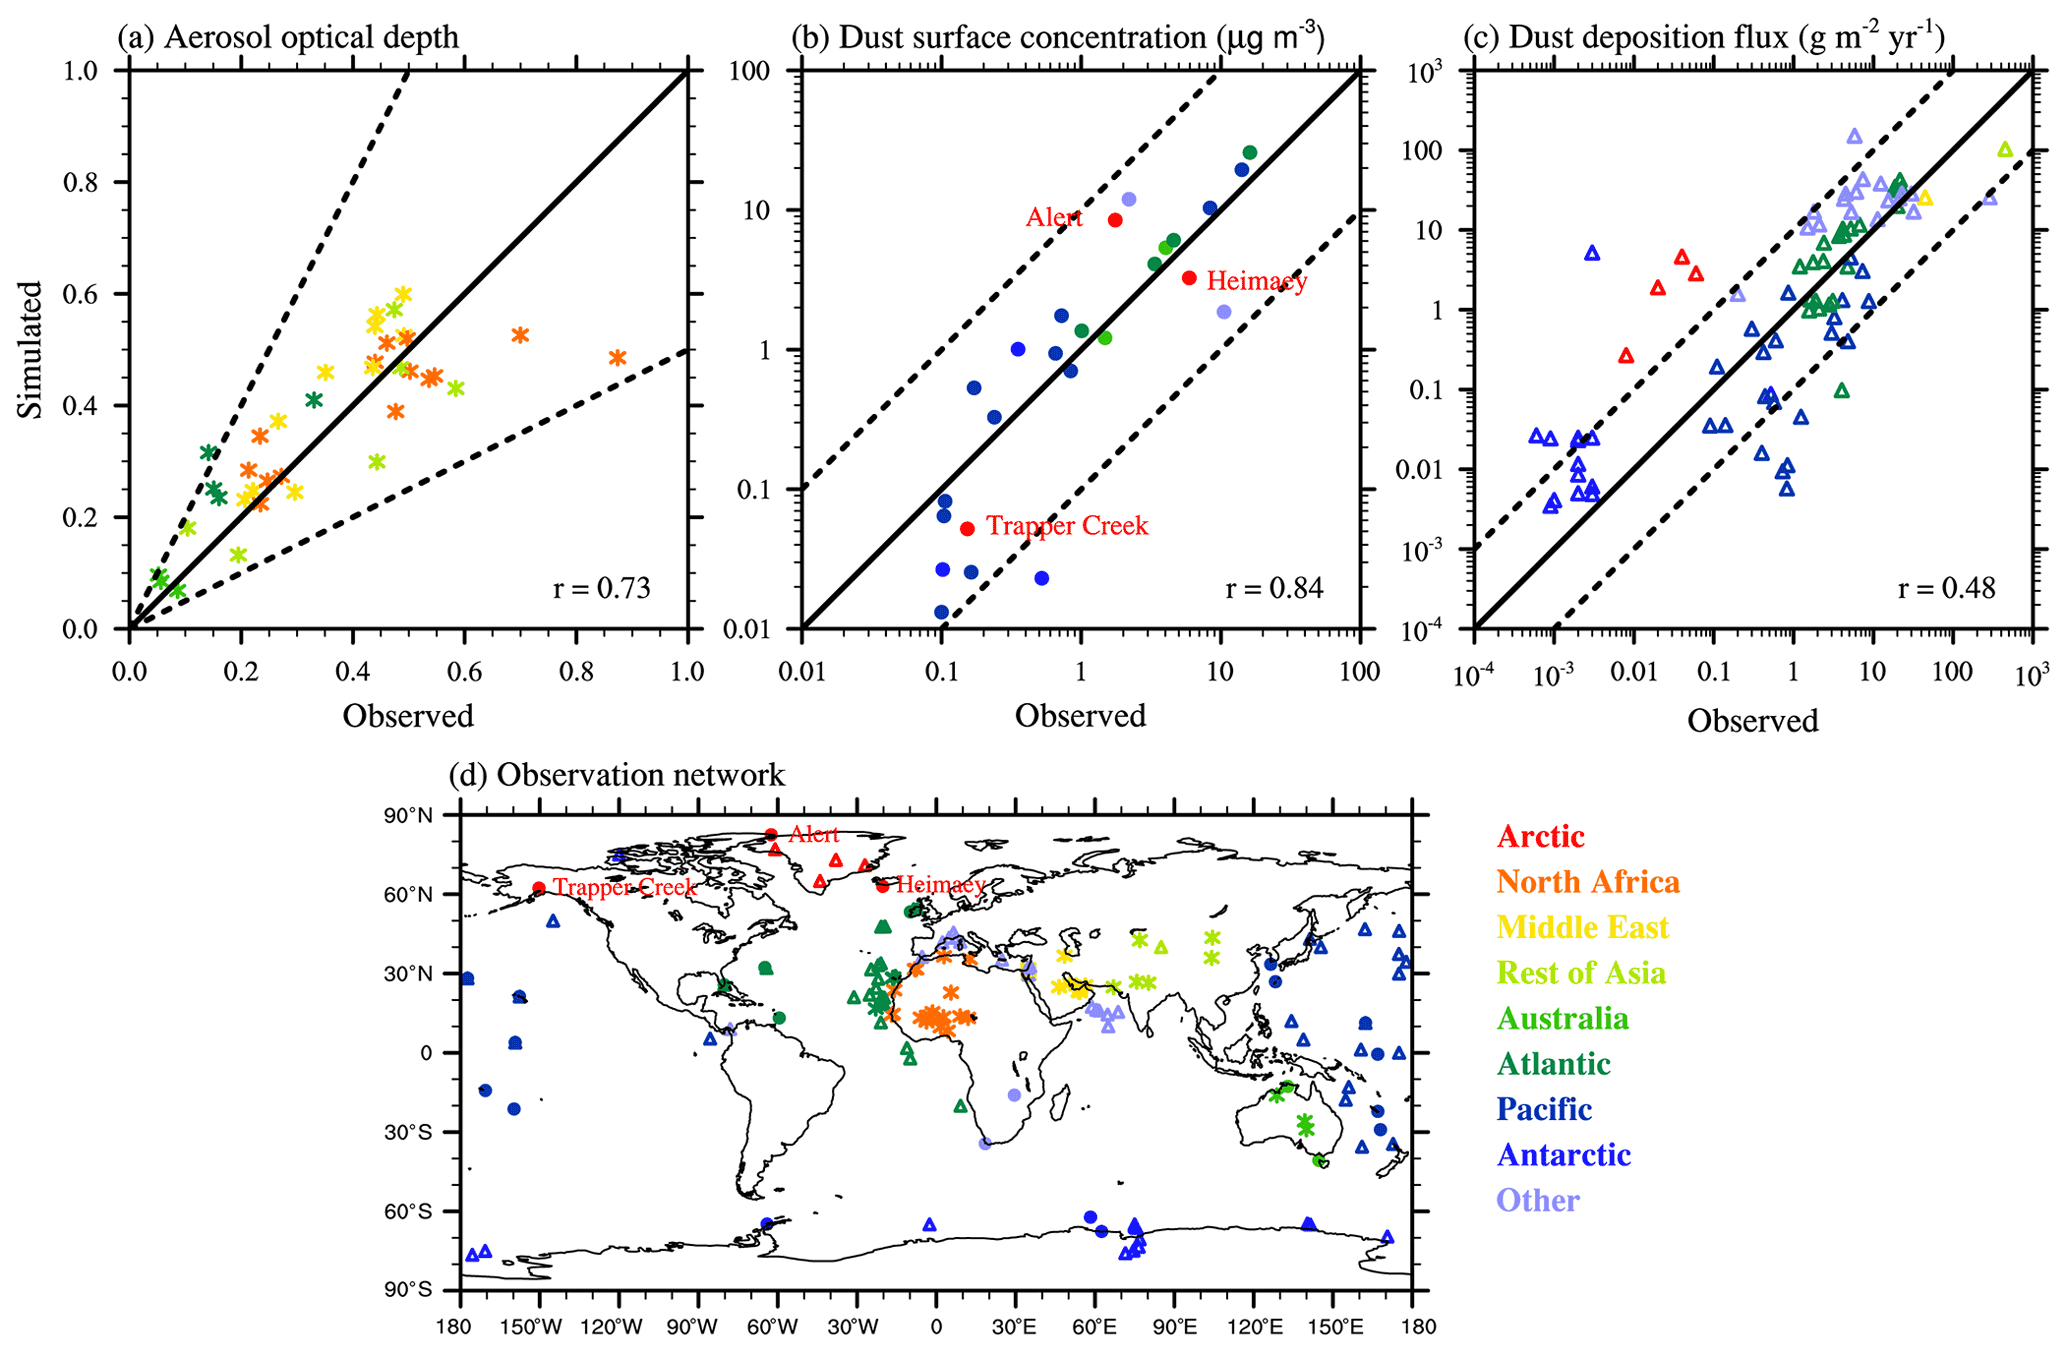
Figure 2Comparison of observed and simulated (a) averaged AOD at 40 dust-dominated stations (stars), (b) dust surface concentration at 25 sites (circles), and (c) dust deposition flux at 84 sites (triangles). Solid lines represent 1 : 1 comparison. Dashed lines represent a factor of 2 bias in panel (a) and 1 order of magnitude differences in panels (b) and (c). For each comparison, the correlation coefficient (r) is noted. The AOD data are conducted by AERONET. The dust surface concentration measurements include 20 stations managed by the Rosenstiel School of Marine and Atmospheric Science at the University of Miami (Prospero et al., 1989; Prospero, 1996; Arimoto et al., 1995), two Australia stations (Maenhaut et al., 2000a, b), and three Arctic stations (Heimaey – Prospero et al., 2012, Alert – Sirois and Barrie, 1999, and Trapper Creek – IMPROVE). The deposition flux data are a compilation of measurements from Ginoux et al. (2001), Mahowald et al. (2009), and the Dust Indicators and Records in Terrestrial and Marine Paleoenvironments (DIRTMAP) database (Tegen et al., 2002; Kohfeld and Harrison, 2001). Stations are grouped regionally and classified by different colors. The locations of the measurements are shown in panel (d).
In general, the three comparisons indicate that our CTRL simulation is capable of capturing the global dust cycle in both near-source and remote regions. As shown in Fig. 2a, the modeled AOD is within a factor of 2 of the observations over most of the stations. The correlation of the AOD comparison is 0.73, which is comparable to the best-performing simulation (r = 0.72) in Kok et al. (2014b). Our model also does a fairly good job in simulating the dust surface concentrations (Fig. 2b) and produces a correlation coefficient of 0.84. For the three high-latitude sites, the model shows moderate underestimation at Heimaey and Trapper Creek and large positive bias at Alert (see discussion below). The correlation coefficient for simulated dust deposition fluxes (r = 0.48) is also within the range of the AeroCom comparisons (0.08 to 0.84) in Huneeus et al. (2011). The model results over most of the sites are within 1 order of magnitude difference, except at the polar regions. In particular, the model overestimates the dust deposition flux in Greenland (red triangles in Fig. 2c and d) by around 2 orders of magnitude, likely due to local emissions simulated near the coast of Greenland that are too strong (Fig. 1a).
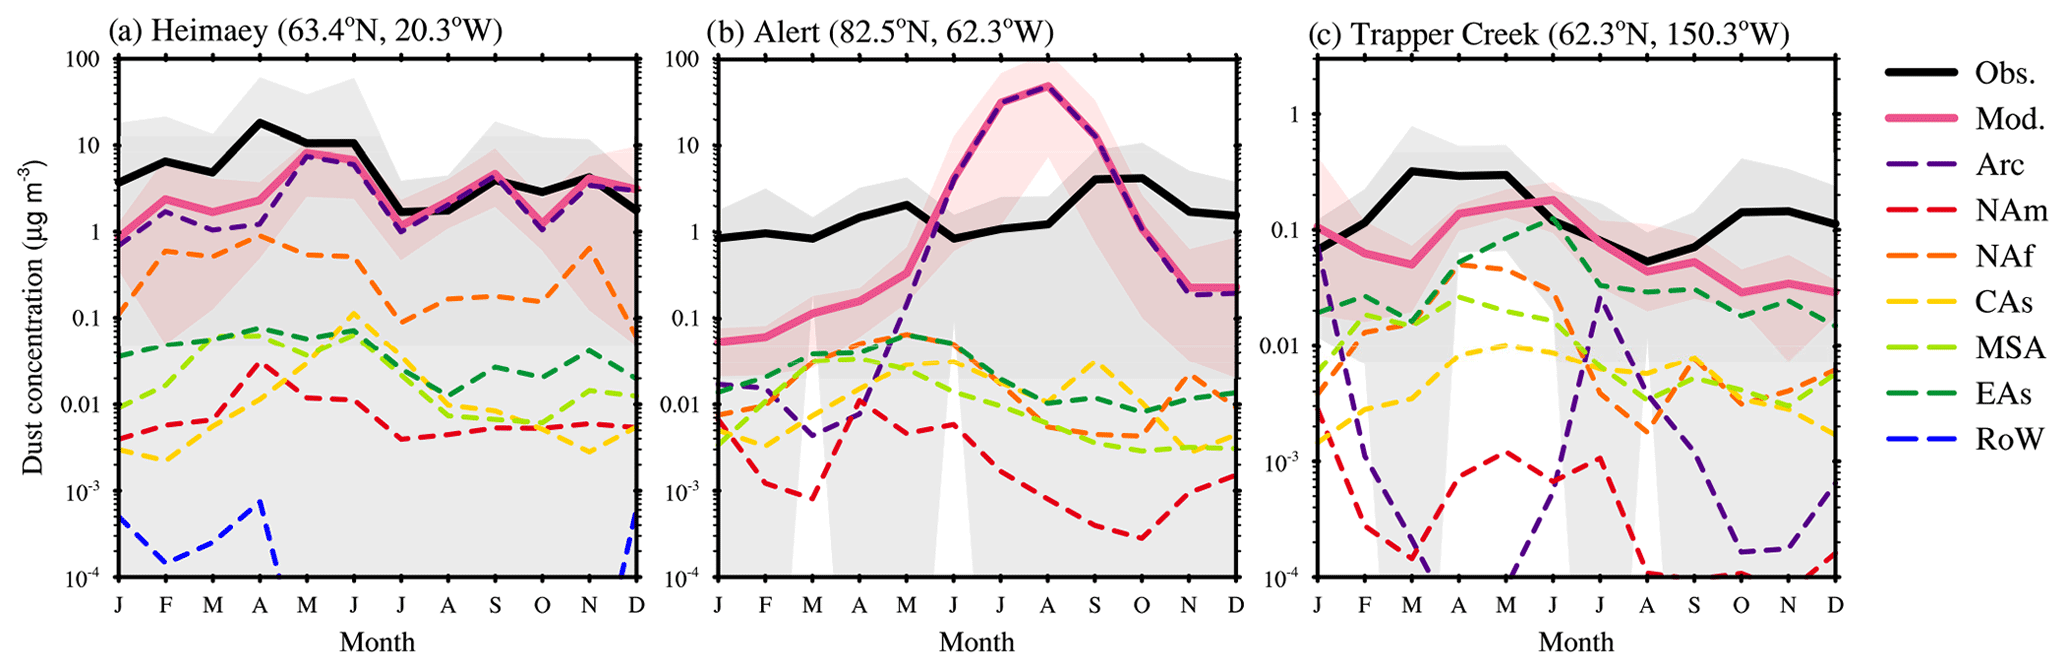
Figure 3Comparison of measured (black solid line, with gray shading representing standard deviation) and simulated (pink solid line, with pink shading representing year-to-year variability) monthly mean dust surface concentration at three high-latitude stations – (a) Heimaey, (b) Alert, and (c) Trapper Creek. The model results are averaged from the year 2007 to 2011. Contributions from seven tagged sources are shown by colored dashed lines. The locations of the three stations are shown in Fig. 2d. The measurements at Heimaey (Prospero et al., 2012), Alert (Sirois and Barrie, 1999), and Trapper Creek (IMPROVE) are averaged for the years 1997 to 2002, 1980 to 1995, and 2007 to 2011, respectively. The dust concentrations at Trapper Creek only include particles with diameter less than 2.5 µm. The other two stations include dust over the whole size range.
The seasonal cycle of dust surface concentrations at the three Arctic stations (Heimaey, Alert, and Trapper Creek) is shown in Fig. 3, along with the contribution from seven tagged sources. The simulated dust concentrations at Heimaey are dominated by HLD and agree well with the observation in late summer and autumn (Fig. 3a). Its annually averaged low bias shown in Fig. 2b mainly comes from the springtime, when Prospero et al. (2012) found the observed dust to be related to dust storms in Iceland, indicating a possible underestimation in the simulated Icelandic dust during this time. The HLD also dominates the surface dust concentrations at Alert (Fig. 3b), leading to a large overestimation from June to August in our simulation, which possibly implies a high bias and wrong seasonal cycle of HLD emission over Greenland and northern Canada. The Trapper Creek station is instead dominated by LLD from East Asia and shows an underestimation for most of the year. It is noted that we only include fine dust (diameter < 2.5 µm) for the comparison at Trapper Creek. A larger size range is likely to be more influenced by HLD sources. The low bias here, especially that during the autumn, can be related to missing local emissions from the coast of southern Alaska (Fig. 1a) that occurs most frequently in autumn (Crusius et al., 2011). An underestimation of the transport from Saharan dust may also contribute slightly, as the influence from Saharan dust is found during mid-May at Trapper Creek (Breider et al., 2014).
The simulated Arctic dust vertical profiles are also compared with the measured dust concentrations during the Arctic Research of the Composition of the Troposphere from Aircraft and Satellites (ARCTAS) flight campaign (Fig. 4) (Jacob et al., 2010). The ARCTAS campaign was conducted over the North American Arctic in April and July 2008. The simulated profiles are averaged over the regions where the aircraft flew, in accordance with Groot Zwaaftink et al. (2016). In April, the model does a good job in capturing the Arctic dust vertical profiles (Fig. 4a). However, in July, the model underestimates dust by a factor of 2 to 5 between 3 and 10 km (Fig. 4b). It also shows an overestimation near the surface in July, which agrees with the surface concentration comparison at Alert station (Fig. 3b). The underestimation in the upper troposphere and overestimation near the surface likely imply a vertical transport of HLD that is too weak in the North American Arctic in summertime. The high bias in the upper troposphere may also be related to an underrepresentation of LLD transport.
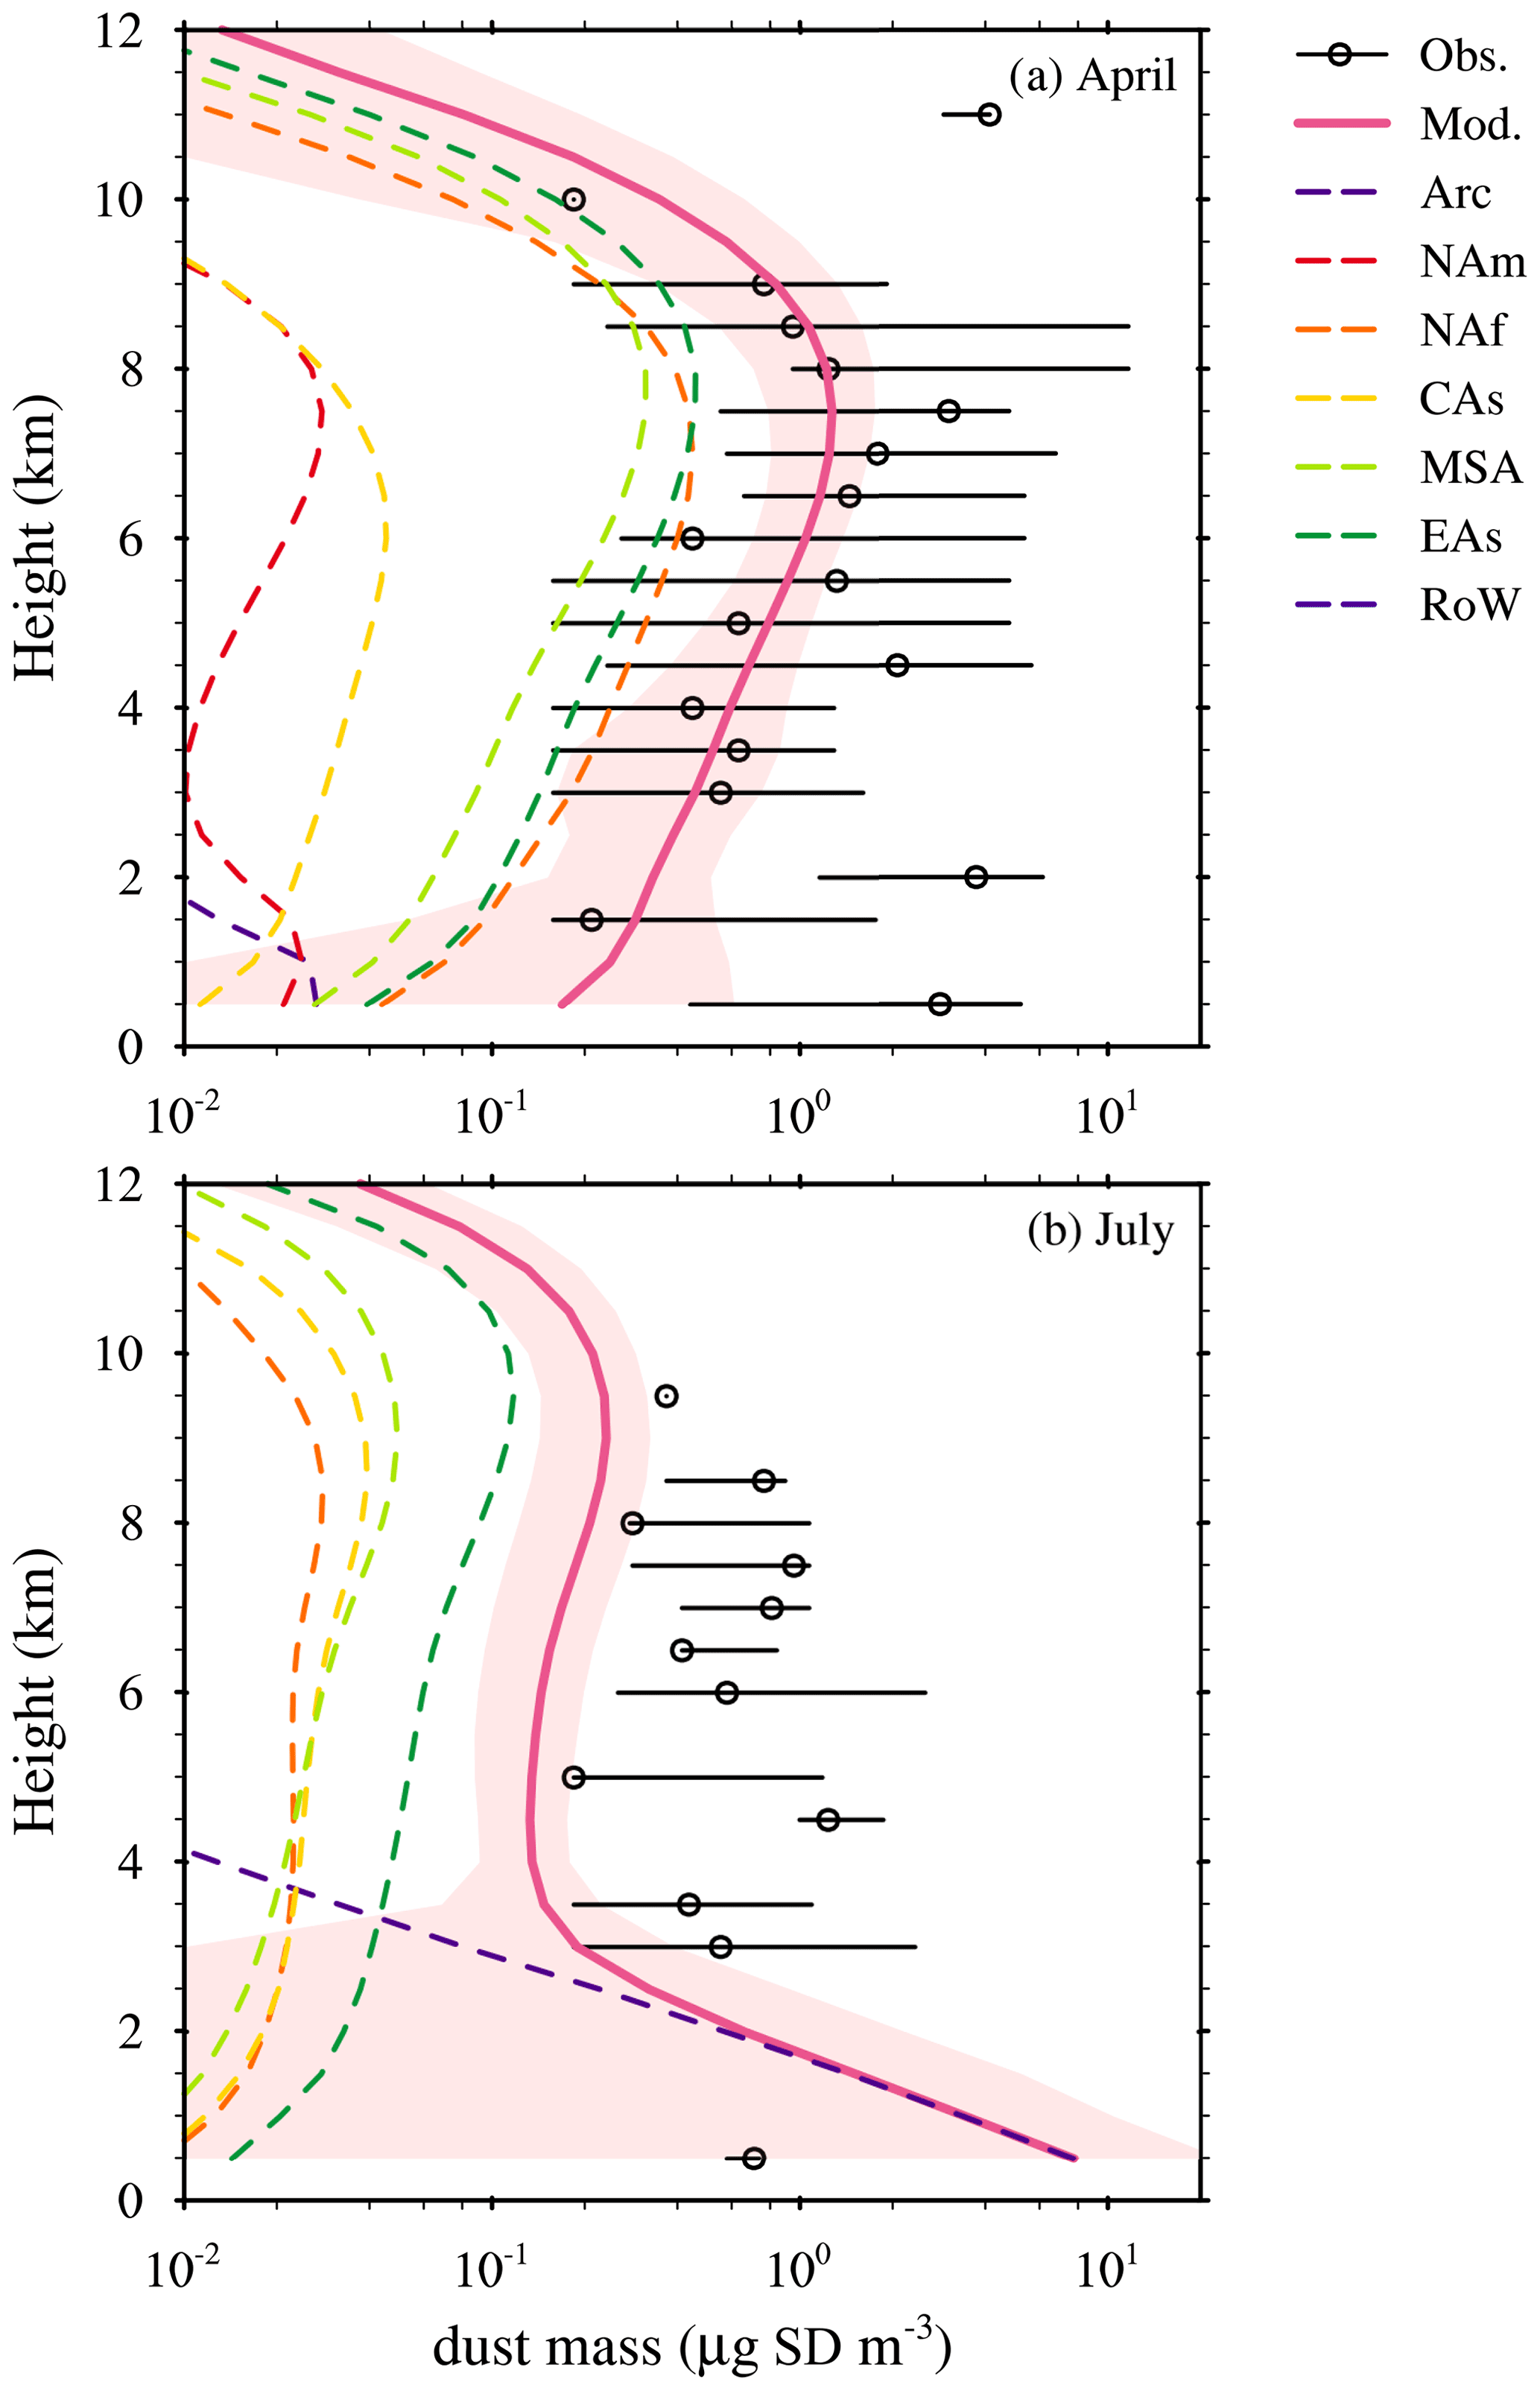
Figure 4Comparison of vertical dust concentrations from ARCTAS flight observations (Jacob et al., 2010) (black circle) and the CTRL simulation (pink solid line) in (a) April and (b) July. We show median values for observations at each level. The maximum and minimum of the measurements at each level are shown by black lines. Contributions from the seven tagged sources in CTRL are shown by colored dashed lines. The ARCTAS dust mass concentrations are derived from measured calcium and sodium concentrations. The measurement data are processed using the same method as Breider et al. (2014). Briefly, we assume a calcium to dust mass ratio of 6.8 % and further correct the calcium concentrations for sea salt by assuming a calcium to sodium ratio of 4 %. Only measurements obtained north of 60∘ N are used for the analyses. The low-altitude observations near Fairbanks, Barrow, and Prudhoe Bay are removed. Also, data from below 1 km on 1, 4, 5, and 9 July are removed to exclude the influence of wildfire. The ARCTAS flight campaign was conducted in 2008, while the modeled vertical profiles are averaged for each April and July from 2007 to 2011, respectively. Following Groot Zwaaftink et al. (2016), the simulation profiles are averaged for the regions north of 60∘ N and 170 to 35∘ W in April and 135 to 35∘ W in July. Also, the observations have a cutoff size of 4 µm and are thus only compared with simulated dust concentrations in the same size range. The pink shading in each panel represents the standard deviation with respect to time and space for the simulated total dust concentrations.
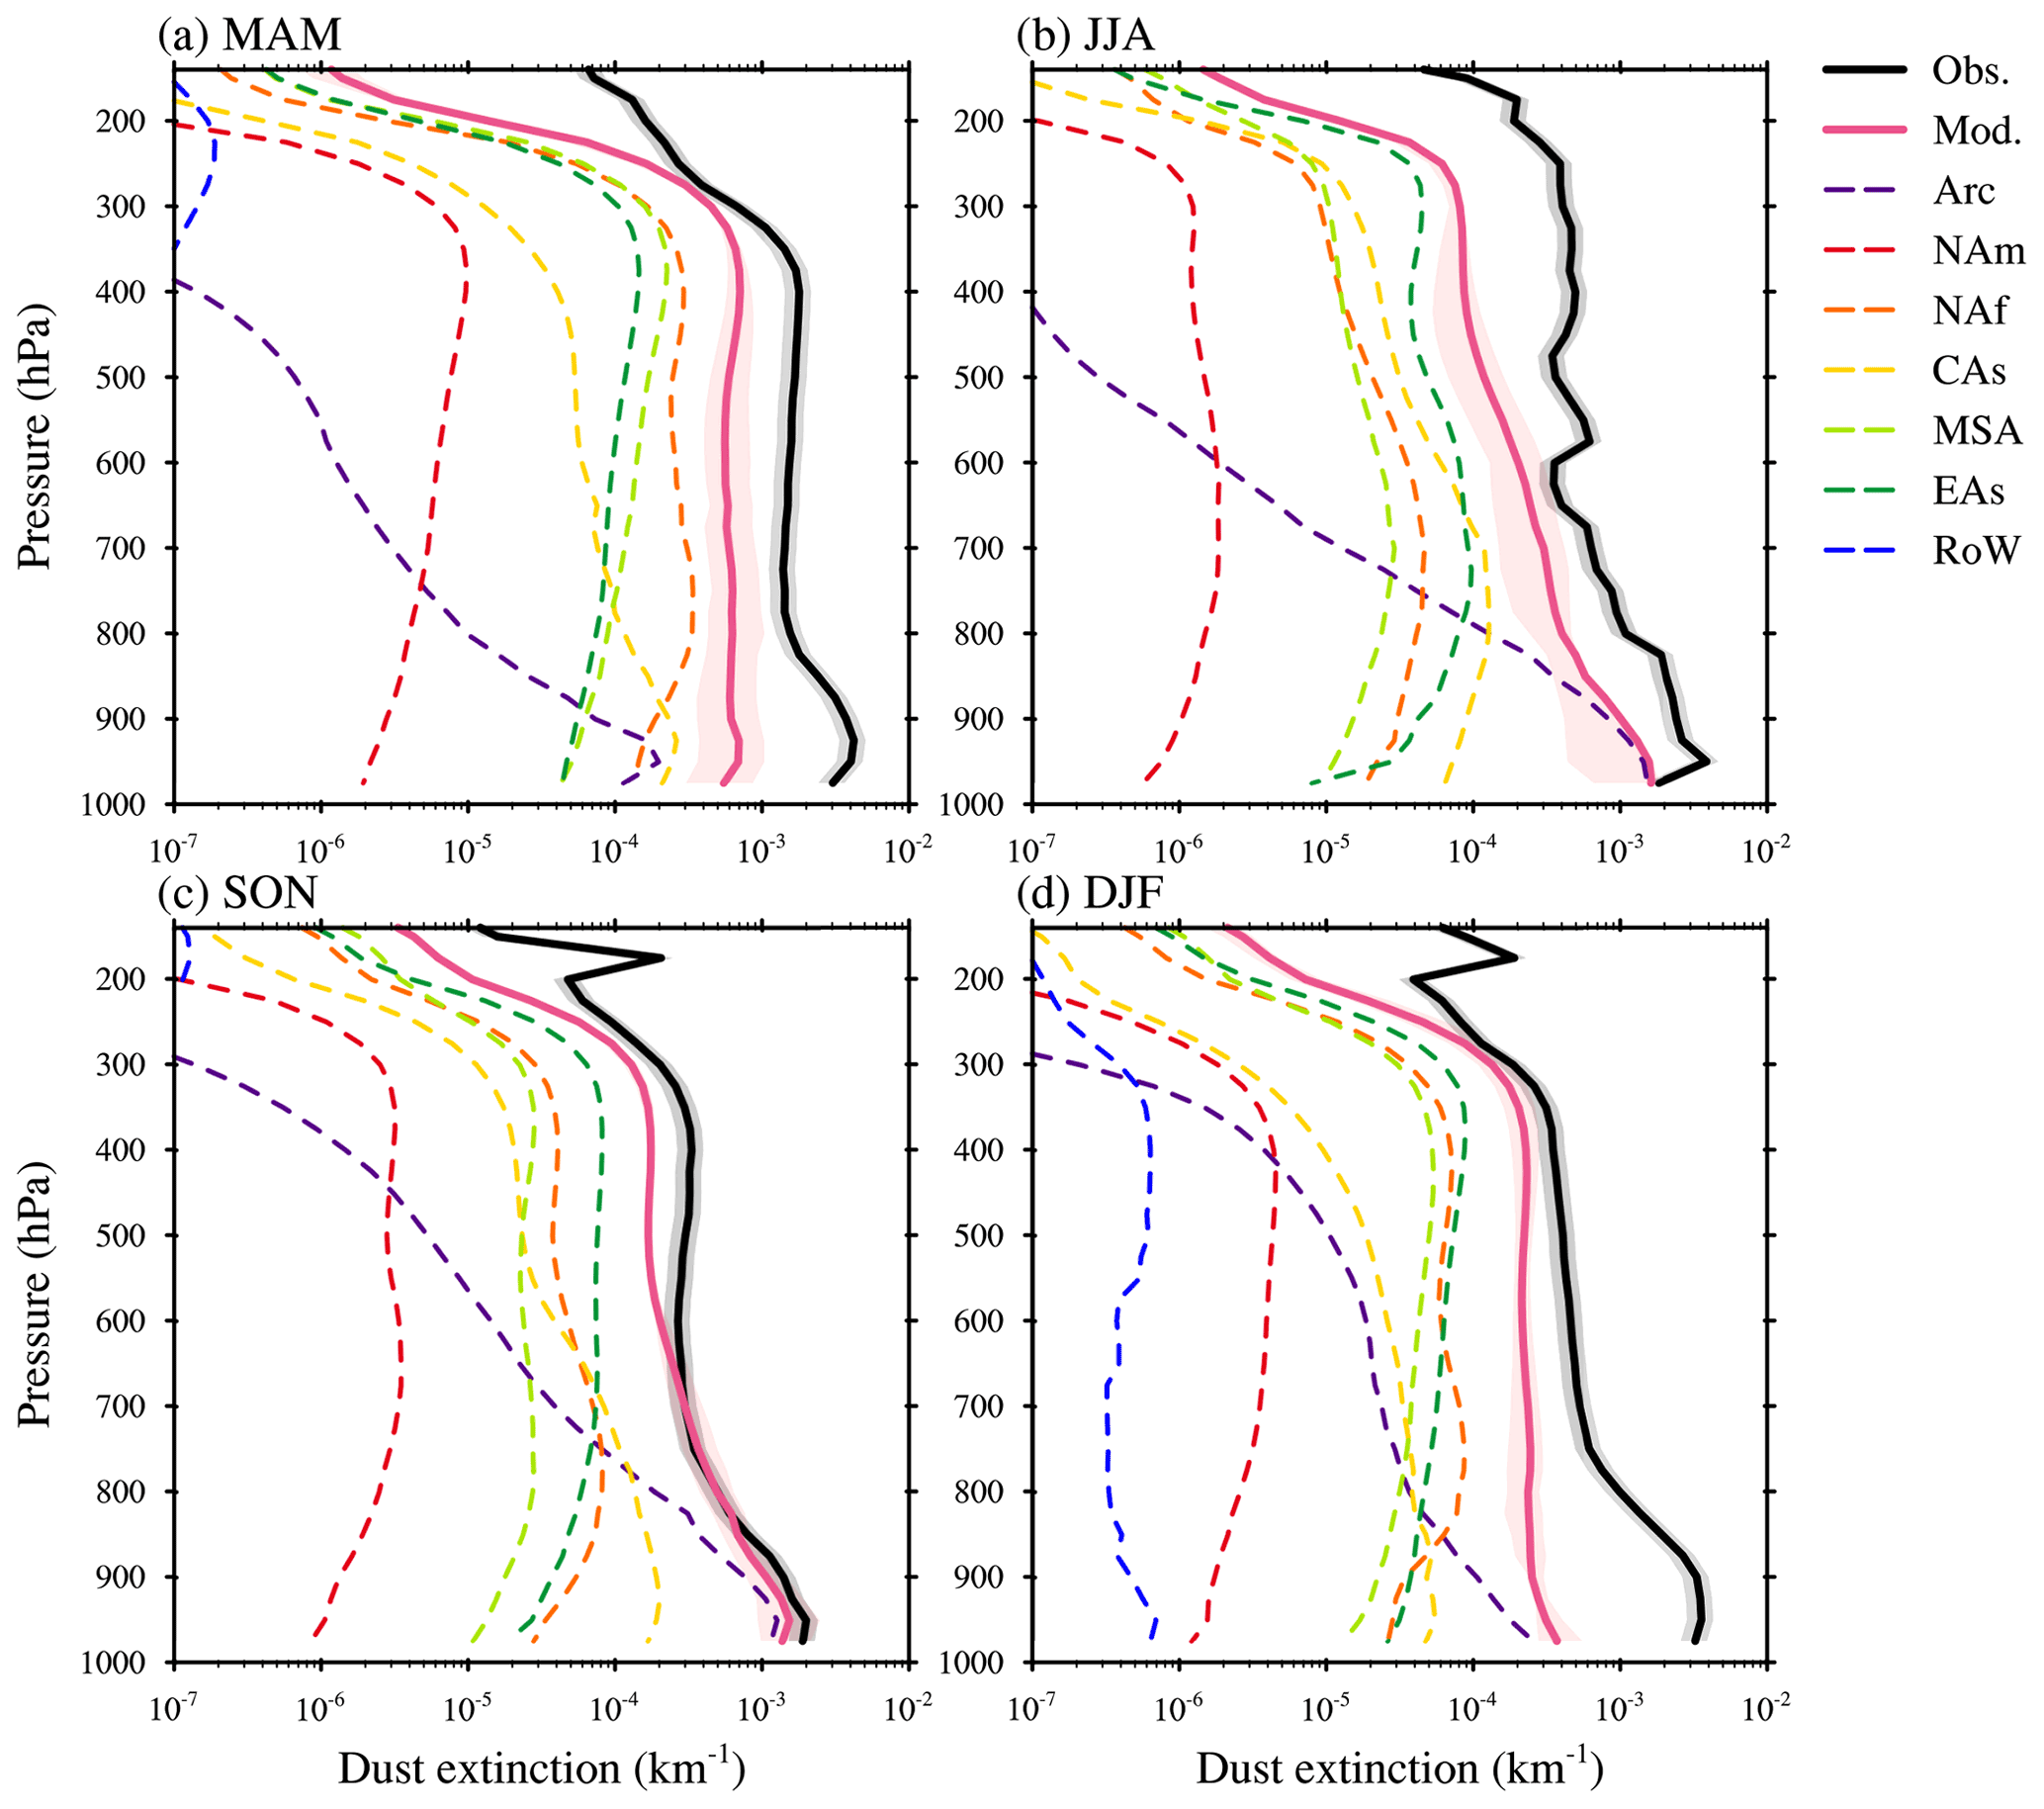
Figure 5Comparison of seasonal CALIPSO-retrieved (Luo et al., 2015a, b; Yang et al., 2022) (black solid line; with gray shading representing uncertainty) and model-simulated (pink solid line; with pink shading representing year-to-year variability) dust extinction vertical profiles in the Arctic (above 60∘ N). Contributions from seven tagged sources are shown by colored dashed lines. The CALIPSO retrievals are for the year 2007 to 2009, while the model results are averaged over the same years. The uncertainties of the CALIPSO retrievals are assumed to be 20 % following Yang et al. (2022).
Finally, we evaluate the simulated dust extinction against the Cloud–Aerosol Lidar and Infrared Pathfinder Satellite Observation (CALIPSO) retrieval (Luo et al., 2015a, b; Yang et al., 2022), which includes nighttime dust extinction for the period of 2007 to 2009. This dataset has improvements in dust separation from other aerosol types and thin dust layer detection in the Arctic compared to the standard Cloud–Aerosol Lidar with Orthogonal Polarization (CALIOP) level 2 product (Winker et al., 2013). To make an apples-to-apples comparison, the modeled dust extinction is sampled along the CALIPSO tracks and screened by cloud fraction (Wu et al., 2020). For this comparison, we only use the first 3 years (2007 to 2009) of the CTRL simulation to be consistent with the observation period. Overall, the model does a good job in capturing the Arctic dust extinction vertical profiles (Fig. 5). We notice that the simulated dust extinction is lower than CALIPSO retrievals at the upper troposphere in summer, which agrees with the ARCTAS comparisons. The simulated dust extinction also shows a consistent underestimation in springtime (MAM) and a near-surface underestimation in wintertime (DJF). Since the Arctic is mostly covered by ice and snow in these two seasons, the impacts of HLD are expected to be limited and the low biases are most likely due to the underprediction of LLD transport. The near-surface underestimation in DJF may indicate an LLD transport that is too weak in the lower troposphere (e.g., the transport of dust emitted from Central Asia; see Fig. 7 and the corresponding discussions in Sect. 3.2). Moreover, the HLD has a large contribution in the lower troposphere in boreal summer and autumn, which is consistent with its strong emission at that time. In contrast, LLD plays a more dominant role in the upper troposphere, where African dust contributes the most in the springtime and East Asian dust has a larger contribution in the other seasons.
3.2 Arctic dust mass source attribution
Table 2 summarizes the relative contributions from individual sources to the total Arctic dust burden. The transport pathways can be identified from the dust burden spatial distribution for each source in Fig. 6, while the relative contribution of each source to the total dust burden is shown in Fig. S2. We also calculate the regional burden efficiency for each source (Table S1), which is defined as the mean contribution to the Arctic dust column burden divided by the corresponding dust emission (H. Wang et al., 2014). This metric represents the sensitivity of Arctic dust loading to per-unit changes in dust emission from each source (i.e., the poleward transport efficiency of each source).
Table 2Annual and seasonal mean Arctic (60–90∘ N) dust burden (mg m−2) from different sources. The numbers in parentheses are the relative contributions (%) of each source to the total Arctic dust burden. The total Arctic dust burden is shown in the last row.
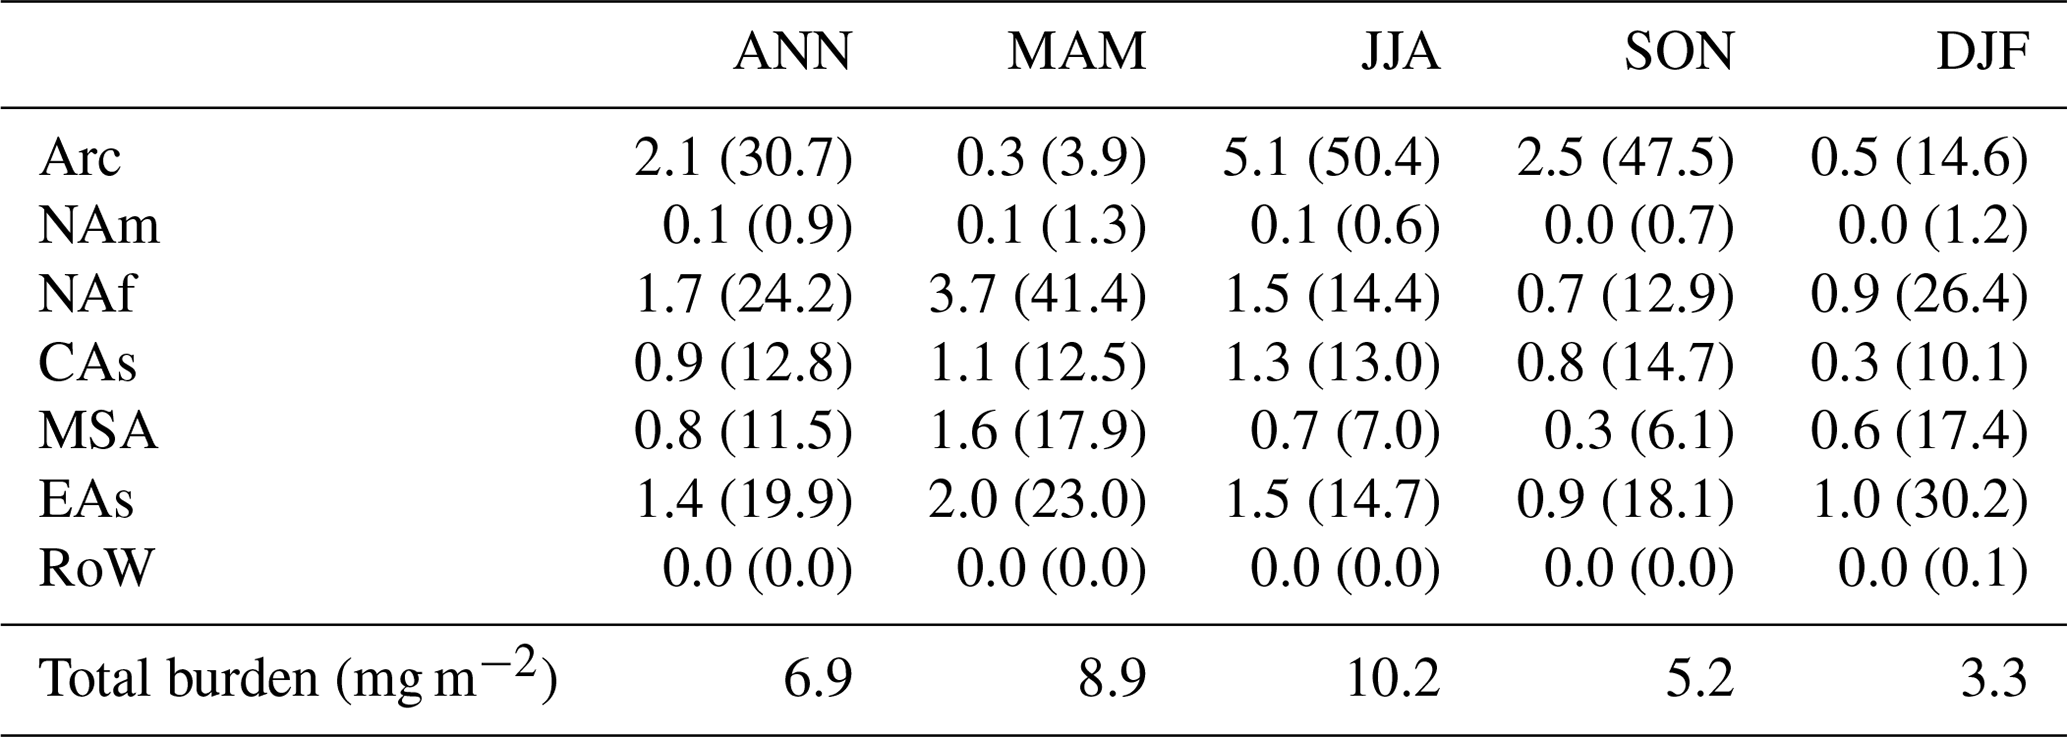
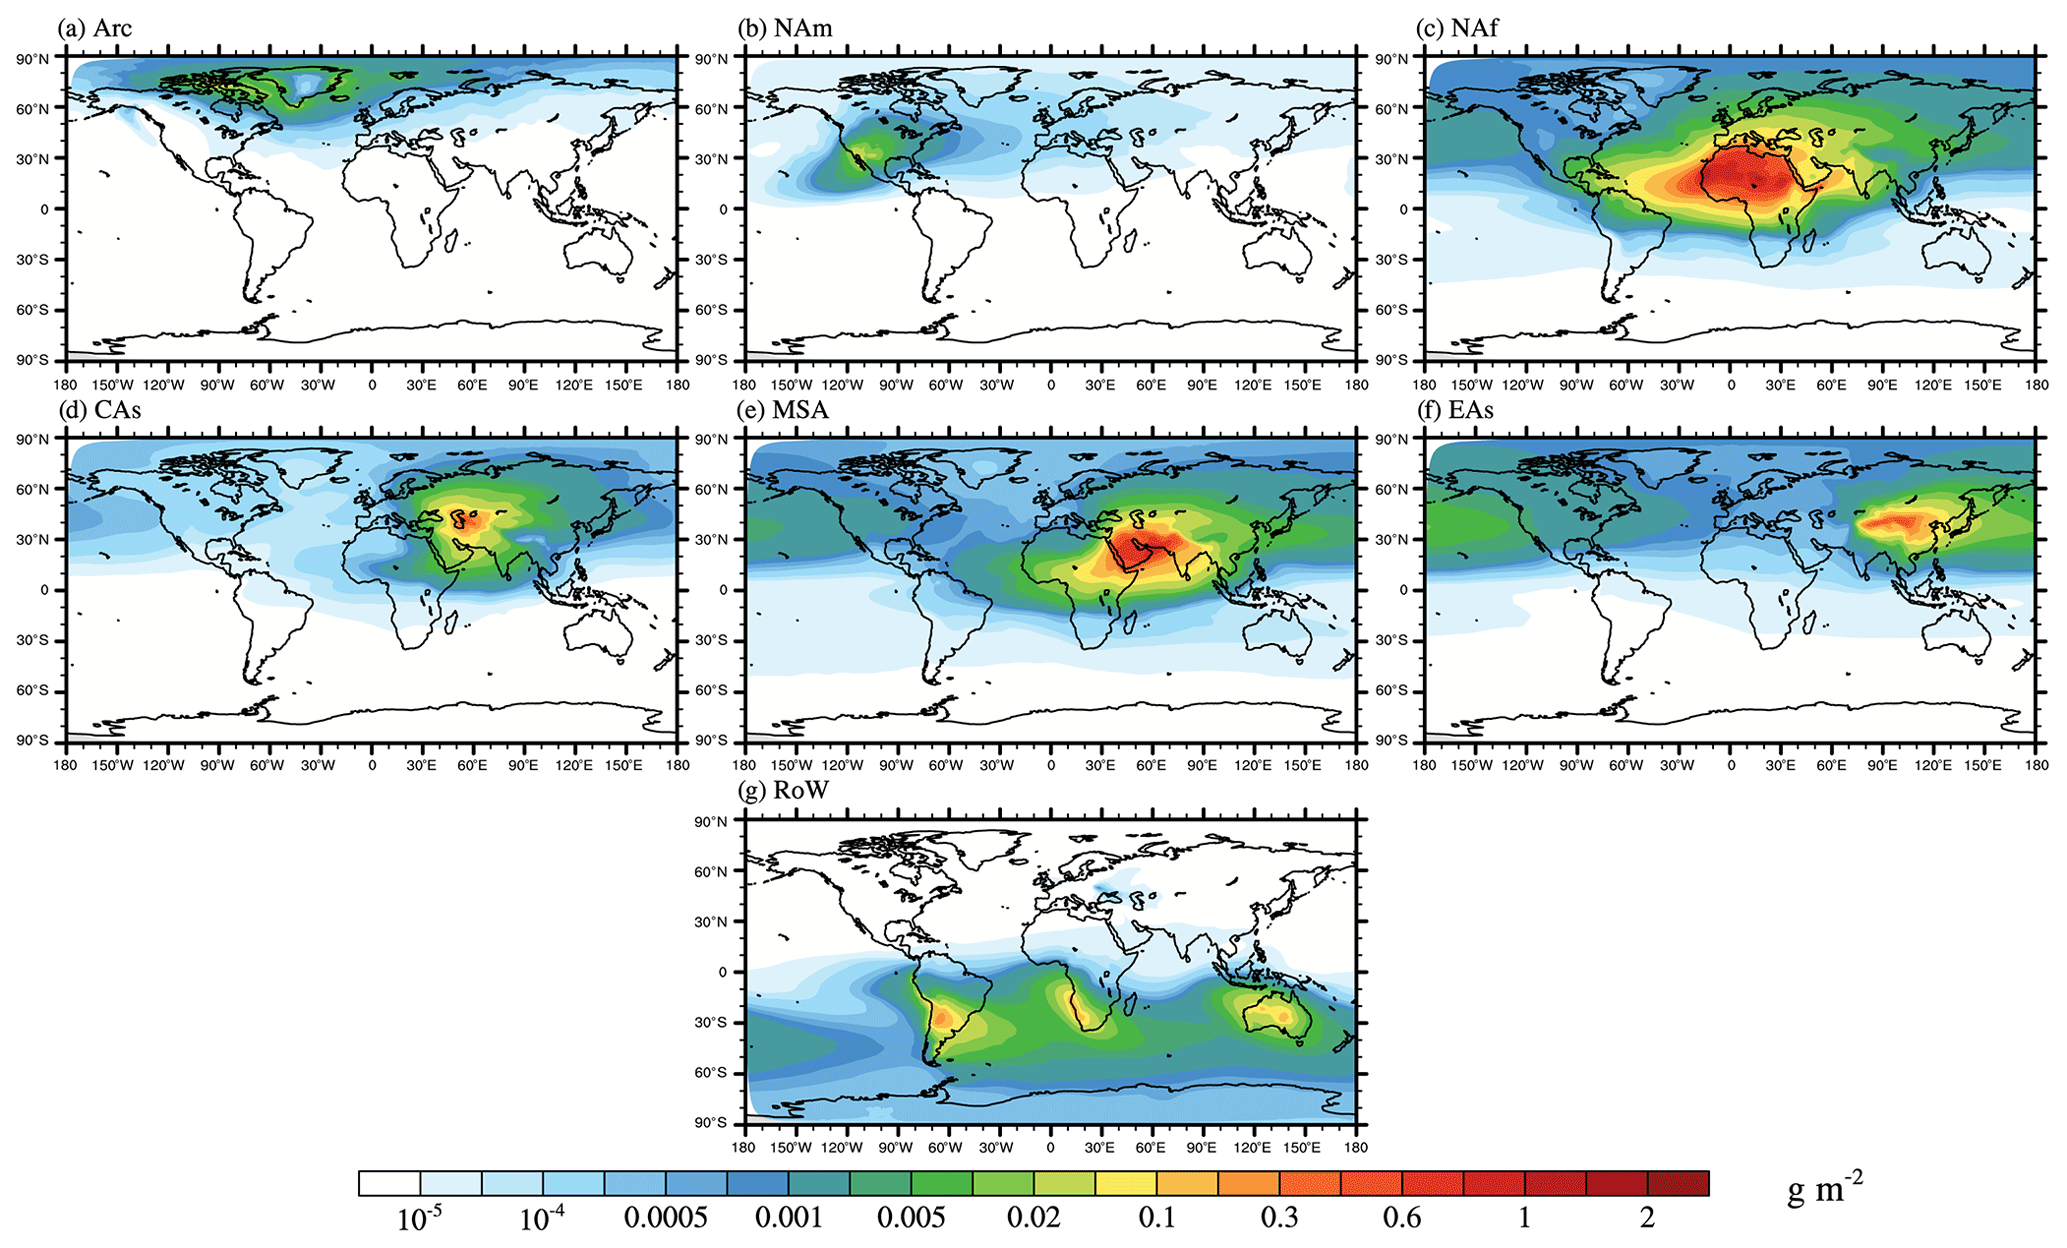
Figure 6Spatial distribution of annual mean (year 2007 to 2011) dust column burdens for various tagged sources.
Our model results suggest that the HLD (Arc) is the largest contributor (30.7 %) to the annual mean Arctic dust burden among all the tagged sources. As shown in Figs. 6a and S2a, the local dust is confined within the high latitudes, with higher amounts and higher contributions to the total dust burden near the sources in northern Canada as well as Iceland and the coast of Greenland. The interior of the Greenland ice sheet, with its higher elevations, is more influenced by LLD from North Africa and East Asia than HLD (Fig. S2c and f). This is due to the weak vertical transport of local emissions in the Arctic (see more discussion below).
On the other hand, all LLD sources are responsible for 69.3 % of the dust loading in the Arctic, with considerable contributions from North Africa (24.2 %) and Asia (in total 44.2 %; EAs: 19.9 %, CAs: 12.8 %, MSA: 11.5 %), as well as minor contributions from NAm (0.9 %) and RoW (nearly 0). The North African dust is primarily transported westward to the Atlantic and southward to the Sahel, with a smaller fraction transported directly northward or northeastward across Eurasia to the Arctic (Fig. 6c; Shao et al., 2011). The westward trajectory can also bring dust to the Arctic through the Azores high (e.g., VanCuren et al., 2012), but this pathway is not clearly seen in Fig. 6c, likely due to the strong wet removal process over the North Atlantic. As evident by the low transport efficiency in Table S1, the significant contribution of the North African dust to the Arctic dust burden is mainly due to its massive emission. However, this is not the case for EAs. The East Asian dust is first lifted vertically by topography and convection (Shao et al., 2011) and is widely spread over the Northern Hemisphere midlatitude and high-latitude regions through the westerly flow in the upper troposphere (Fig. 6f). The high elevation of East Asian dust plumes results in weaker removal processes and thus an efficient poleward transport. As shown in Table S1, the annual transport efficiency of the East Asian dust is relatively high among the LLD sources, which is nearly 3 times larger than that of the North African dust. The poleward transport of dust from CAs and MSA takes the pathway across Siberia (Fig. 6d and e). The transport efficiency of the CAs dust is 2 times higher than that of the MSA dust (Table S1). This is attributed to CAs being closer to the Arctic and having less southward dust transport than MSA. Overall, the LLD from North Africa and Asia contributes more to Eurasia and the Pacific sector of the Arctic (Fig. S2c to f). The impact of NAm dust is limited by its weak emission (Fig. 6b), while dust emitted in the Southern Hemisphere (RoW) can hardly pass the Equator (Fig. 6g).
Earlier modeling studies (Breider et al., 2014; Groot Zwaaftink et al., 2016; Luo et al., 2003; Tanaka and Chiba, 2006) also quantify the relative contributions of dust from various regions to the Arctic dust loading. Among these studies, only Groot Zwaaftink et al. (2016) include HLD. Our estimate about the HLD percent contribution is close to that from their study (27 %). For LLD, our conclusion about the dominant role of African and Asian dust in the Arctic dust burden is also corroborated by these previous studies. However, the relative importance of African and Asian dust is uncertain. Based on our results, the Asian dust is responsible for 65 % of the LLD transport to the Arctic, while the African dust only contributes 35 %. Other studies find that 50 % (Groot Zwaaftink et al., 2016; Luo et al., 2003; Tanaka and Chiba, 2006) to as much as 65 % (Breider et al., 2014) of the LLD in the Arctic is attributed to North Africa. These discrepancies may be explained by the different dust emission and scavenging, dust size distribution, meteorological fields, and/or time periods for the model simulation. For example, the wet removal process is expected to have large discrepancies among different models because of the large uncertainties in the model representation of clouds and precipitation. The different spatial distributions of dust emission due to the use of different emission parameterizations may also contribute to the discrepancies (e.g., North Africa dust in our study contributes slightly less at 51.9 % to the global dust emission than the other studies: from 57 % to 67 %). Isotopic analysis (Bory et al., 2002, 2003) and case studies (Huang et al., 2015; Stone et al., 2005; VanCuren et al., 2012) have proven that both Asian and African dust can be transported to the Arctic. However, it remains unclear which of them contributes more to the Arctic dust loading due to limited observational constraints.

Figure 7Annual and seasonal mean (year 2007 to 2011) Arctic (60–90∘ N) vertical dust concentrations (left panels) and percentage contributions from tagged sources (right panels). Different tagged sources are classified by different colors.
HLD and LLD source regions also have very distinct vertical distributions in the Arctic. Figure 7a and b show the annual mean vertical profiles of Arctic dust concentrations from various sources and their percentage contributions, respectively. The Arctic dust in the lower atmosphere is dominated by the local source. HLD accounts for more than 30 % of the Arctic dust concentrations below 800 hPa, with up to 85 % contribution near the surface. However, the HLD contribution decreases rapidly with height and is less than 10 % above 700 hPa. This is because the lower troposphere of the Arctic is more stratified than the middle and low latitudes, which suppresses the vertical transport of HLD. The lower tropospheric stability (LTS) from the CTRL simulation and comparison with the MERRA-2 reanalysis data are shown in Fig. S3. The weak HLD vertical transport in the Arctic is also reported by previous studies (Groot Zwaaftink et al., 2016; Baddock et al., 2017; Bullard, 2017). Moreover, the LTS over the Arctic sea ice is much larger than that over open-ocean surface (Schweiger et al., 2008), which may lead to a stronger vertical transport of HLD over open waters. This suggests that the vertical transport of HLD may change with the sea ice reduction in a warming future.
In contrast, LLD has a higher contribution in the middle and upper troposphere than near the surface. Such a vertical distribution of LLD is consistent with Stohl (2006) and Groot Zwaaftink et al. (2016). As Stohl (2006) found, aerosols originating from the warm subtropics are transported poleward following the uplifted isentropes and the Arctic lower atmosphere is dominated by the nearly impenetrable cold polar dome. Therefore, there is a slantwise lifting of low-latitude aerosols during their poleward transport. NAf and EAs are the two key contributors to the Arctic dust vertical concentrations, each of which contributes up to one-third of the total dust concentrations above 700 hPa. Dust emission from MSA also has a moderate contribution (15 %–20 %) that increases gradually with height, while the contribution from CAs peaks at 700 to 800 hPa, indicating a lower-altitude transport pathway than the EAs and MSA dust.
In addition, the Arctic dust undergoes a strong seasonal cycle (Table 2 and Fig. 7c–j). Because of the strong local emissions (Fig. 1c), about half of the Arctic dust burden in summer and autumn comes from HLD, with more than 50 % contribution of Arctic dust concentrations below 850 hPa in these two seasons. In contrast, LLD plays a dominant role in spring and winter. The North African dust has the largest contribution in spring, which accounts for about 45 % of the total dust concentrations above 700 hPa. The East Asian dust is more important in the other three seasons. Due to its high emission height, the relative contribution from EAs tends to increase with height and reaches 30 % to 50 % of the total dust concentration above 500 hPa in summer, spring, and winter.
3.3 Immersion freezing on dust in the AMPCs
We are particularly interested in the contribution of various dust sources to the Arctic INP populations. Therefore, we compare the simulated INP concentrations with nine Arctic field measurements, which are summarized in Table 3. The modeled dust INP concentrations are diagnosed from monthly averaged aerosol properties using the default CNT scheme and two empirical ice nucleation parameterizations: DeMott et al. (2015; hereafter D15) and Sanchez-Marroquin et al. (2020; hereafter SM20). The D15 parameterization, which is representative of Saharan and Asian desert dust, relates dust INP number concentrations to the number concentration of dust particles larger than 0.5 µm diameter and is found to produce the most reasonable LLD INP concentrations in EAMv1 (Shi and Liu, 2019). CNT and D15 are applied to LLD only and all the dust aerosols (LLD and HLD) in Fig. 8a–b and d–e, respectively. The SM20 parameterization, which is derived for the HLD Icelandic dust, describes the dust INP number concentrations as a function of surface-active site density and total dust surface area. Considering the possibly different ice nucleation ability between HLD and LLD, we only applied the SM20 parameterization to HLD, and the CNT and D15 parameterizations are still applied to LLD in Fig. 8c and f, respectively. To account for the contributions from other aerosol types, we also calculate the INP concentrations from BC (Fig. 8g) and sea spray aerosol (SSA; includes MOA and sea salt) (Fig. 8h) following Schill et al. (2020; hereafter Sc20) and McCluskey et al. (2018; hereafter M18), respectively. More details about the ice nucleation parameterizations are provided in Sect. S2. We discuss the choice of dust ice nucleation schemes in Sect. S2.6 in the Supplement.
Table 3Summary of the nine Arctic INP measurements used for INP comparisons in Fig. 8.
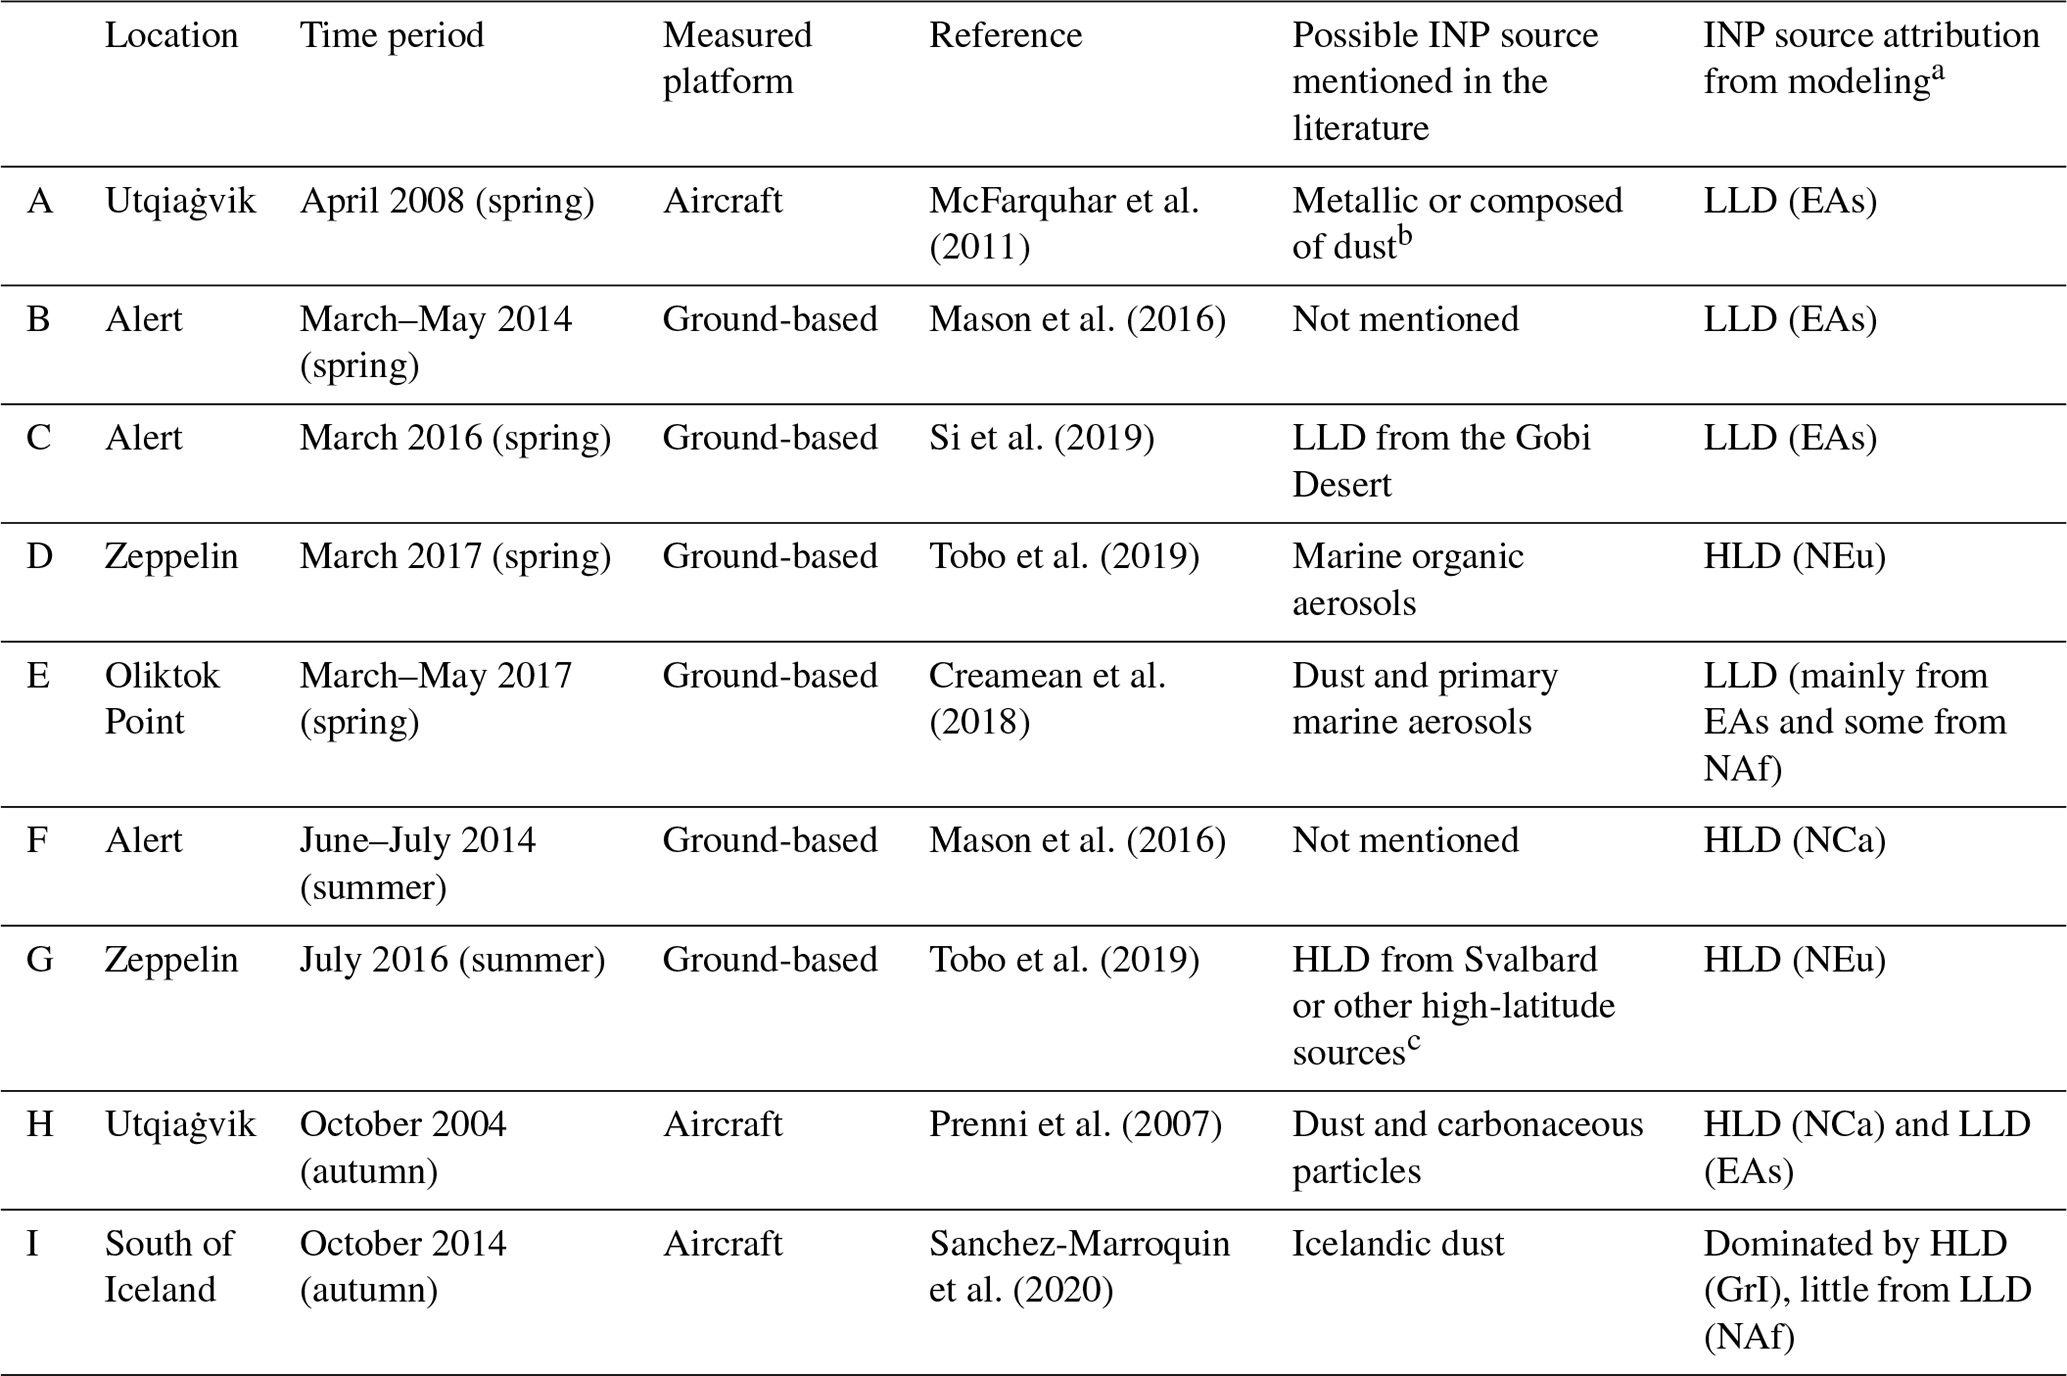
a The modeling analyses include INP contribution from HLD (using SM20), LLD (using D15), BC, and SSA. b Carbonate, black carbon, and organic matter may also contribute, according to Hiranuma et al. (2013). c The HLD in this campaign is reported to have remarkably high ice-nucleating ability, which may be related to the presence of organic matter.
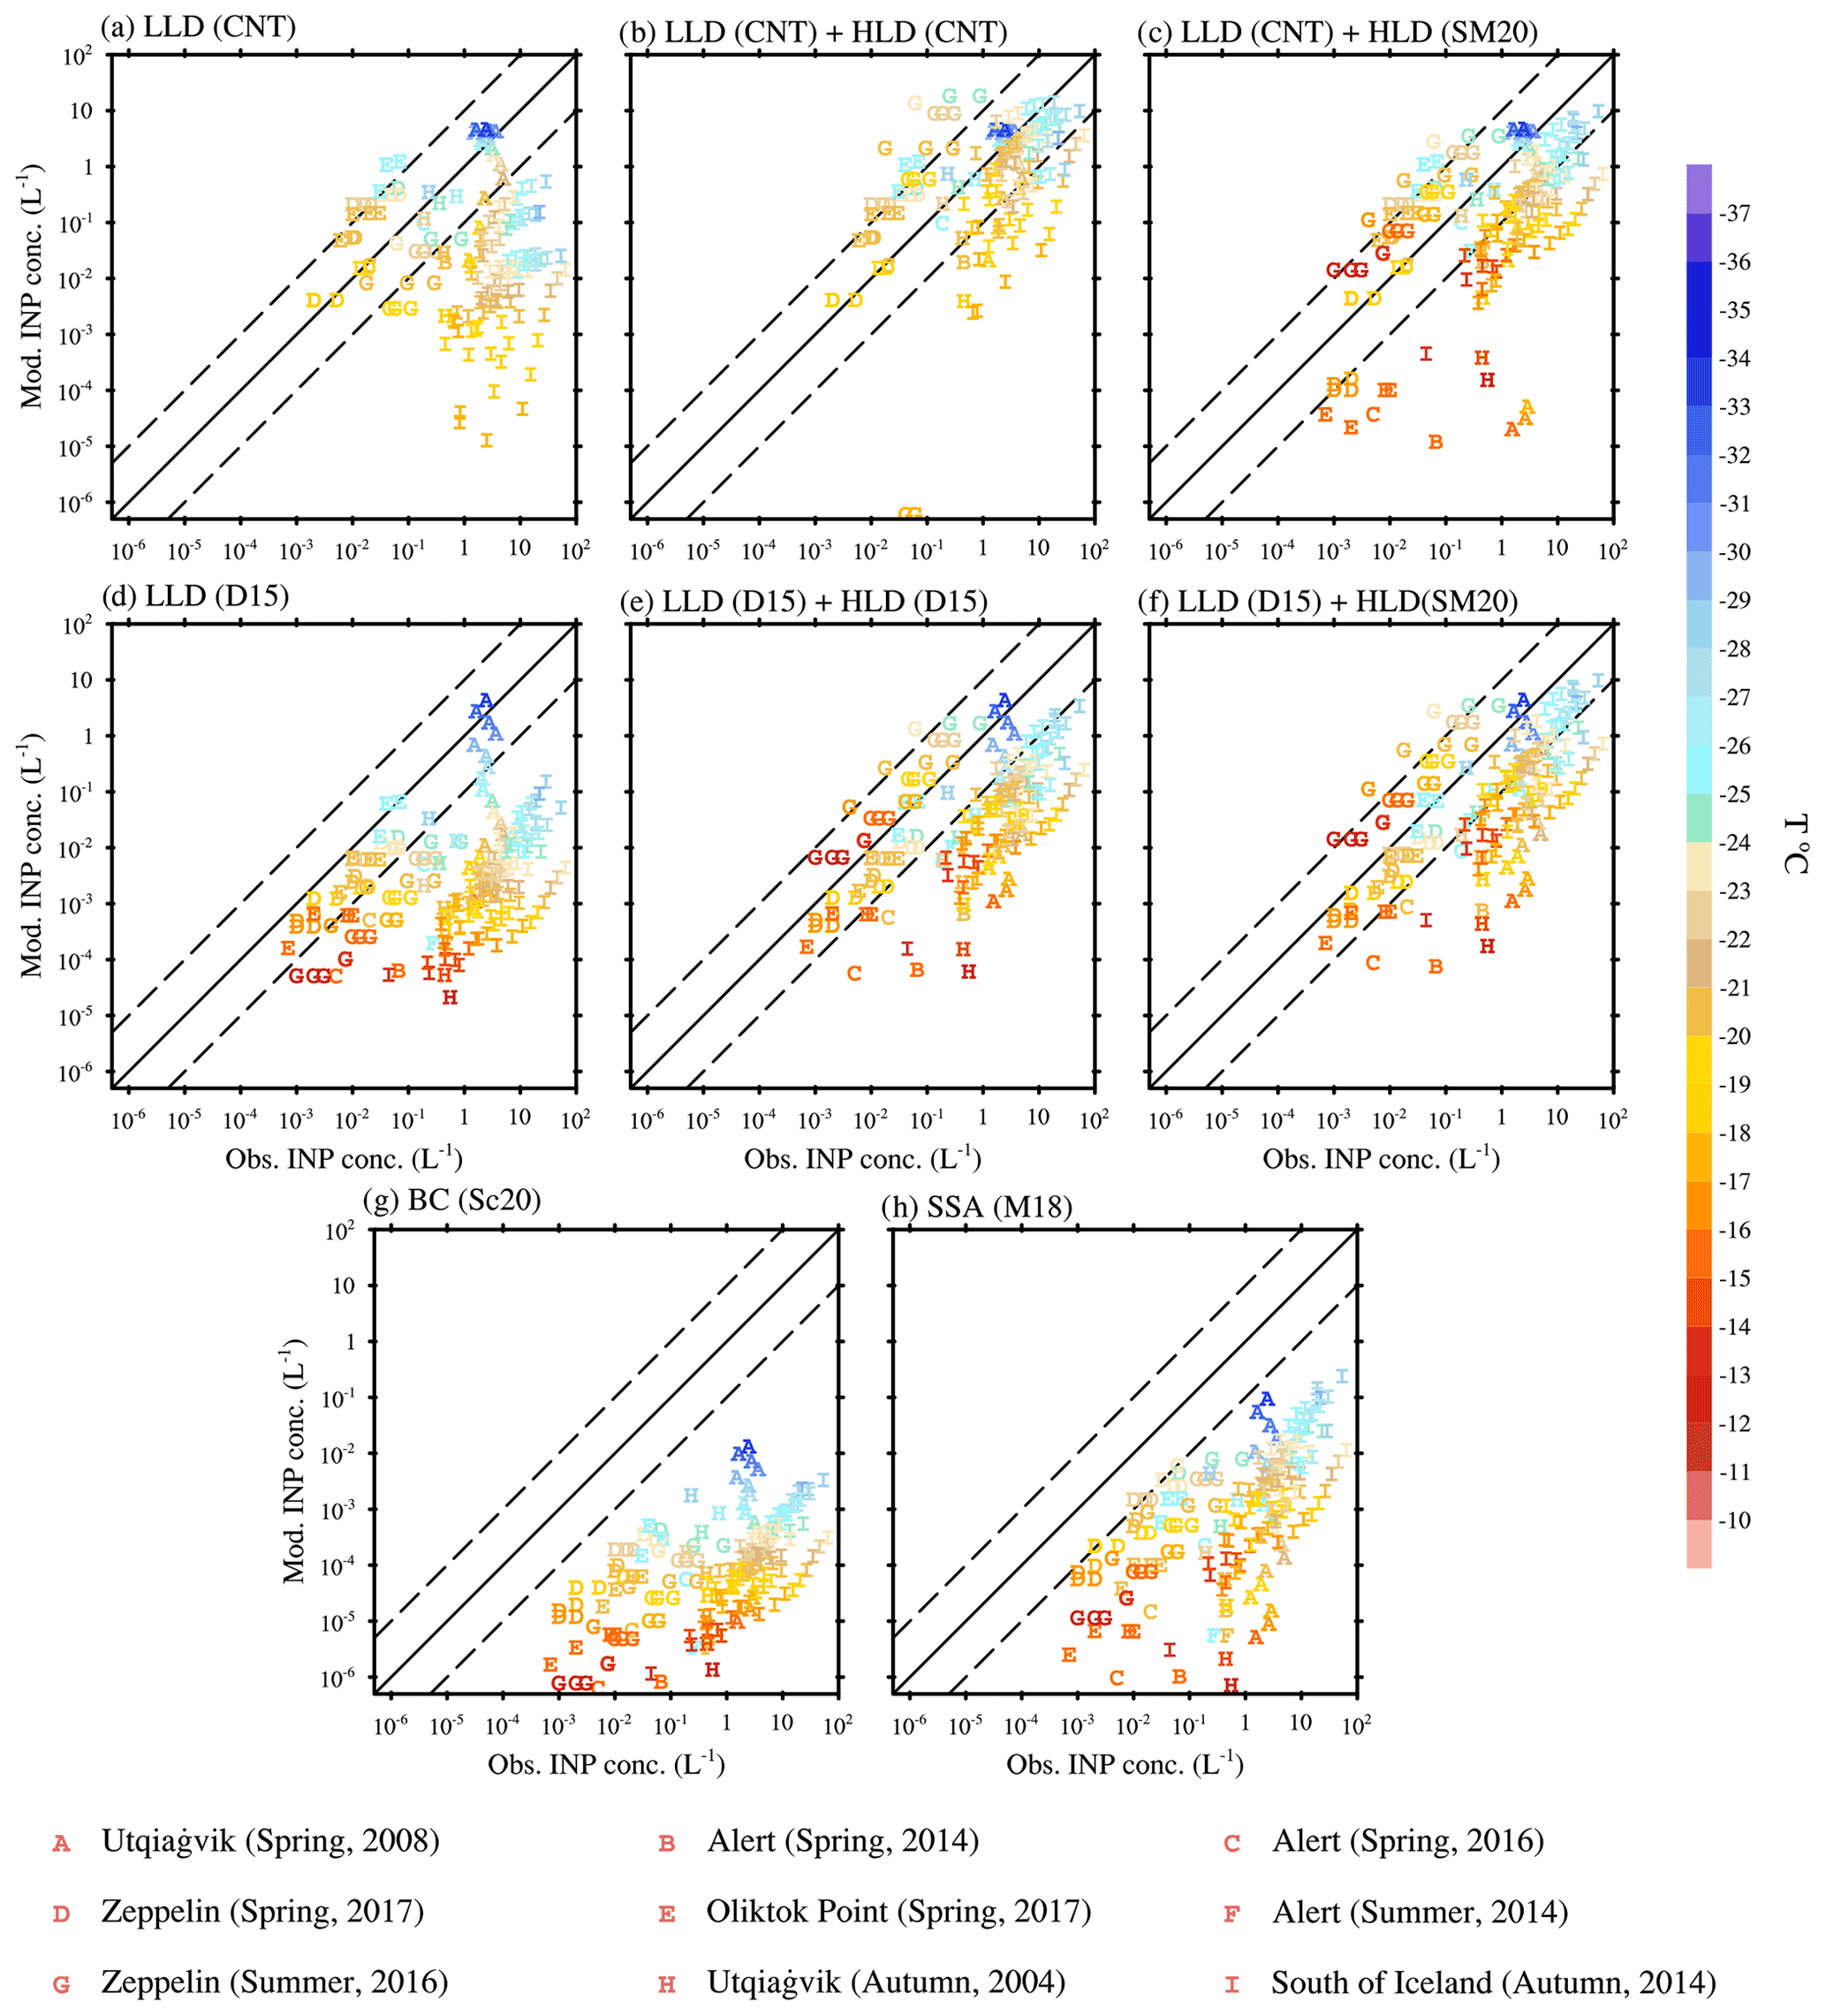
Figure 8Comparison of predicted versus observed INP concentrations in the Arctic. The predicted INP concentrations are derived from (a) LLD using classical nucleation theory (CNT), (b) LLD and HLD both using CNT, (c) LLD using CNT and HLD using Sanchez-Marroquin et al. (2020; SM20), (d) LLD using DeMott et al. (2015; D15), (e) LLD and HLD both using D15, (f) LLD using D15 and HLD using SM20, (g) BC using Schill et al. (2020; Sc20), and (h) SSA using McCluskey et al. (2018; M18). SSA includes both marine organic aerosol and sea salt. Nine INP datasets are classified by symbols A to I, the color of which represents the temperature reported in the observations. The observations for datasets A, C, E, and H are monthly mean values. Samples for datasets D, G, and I are selected randomly and only 15 % of them are plotted. Details of each campaign are summarized in Table 3. The modeled INP concentrations are diagnosed using the observed temperatures and monthly averaged aerosol properties of the corresponding month from the year 2007 to 2011. The INP concentrations for CNT are defined as the CNT immersion freezing rate integrated by 10 s, following Hoose et al. (2010) and Y. Wang et al. (2014). The solid line in each panel represents 1 : 1 comparison, while dashed lines outline 1 order of magnitude differences (unit for INP concentration: L−1).
Overall, only including LLD as INPs results in up to 4 orders of magnitude underprediction compared to observations (Fig. 8a and d), while taking into account the contribution from HLD greatly improves the model performance by increasing the simulated dust INP concentrations (Fig. 8b, c, e, and f). The CNT parameterization produces 5 to 10 times more INP concentrations than the other two schemes at moderately cold temperatures (−22 to −28∘), while it has a significant underestimation of observed INP concentrations at warm temperatures (T > −18∘) (also see Fig. S4). D15 and SM20 agree well with each other in simulating HLD INPs, with SM20 producing slightly higher results than D15. Our modeling results also indicate that BC and SSA have much less of a contribution to INP than dust in all nine field campaigns (Fig. 8g and h).
A detailed analysis of sources of the INPs for the nine datasets based on modeling analyses and the corresponding observations in the literature is provided in Table 3. Modeling results indicate that HLD has larger contributions to the INPs for the campaigns conducted in summer and autumn than spring, in agreement with the observations. Also, ground-based measurements are more influenced by the nearby HLD sources, while LLD from EAs and NAf contributes more to the aircraft measurements.
Our modeling analyses about the INP sources agree well with the observational studies at Alert in spring 2016 and near Iceland in autumn 2014 (symbols C and I in Fig. 8, respectively), while the model underestimates the observed INP concentrations in both cases. The low bias in dataset C indicates an underprediction in the long-range transport of Asian dust to the Arctic surface in springtime. The underestimation in dataset I is more likely due to the fact that some of the aircraft measurements were taken inside the Icelandic dust plumes (Sanchez-Marroquin et al., 2020), which cannot be resolved by the monthly mean model output and the coarse model horizontal resolution (1∘). Such uncertainties exist in all the model–observation comparisons.
Some other comparisons in INP sources reveal the lack of marine and carbonaceous INPs in the model. The model results show a dominance of dust INPs in spring 2017 at Zeppelin and Oliktok Point (symbols D and E in Fig. 8) and in autumn 2004 at Utqiaġvik (symbol H in Fig. 8), while the observational studies suggested the importance of marine sources at the first two locations and of carbonaceous aerosols at Utqiaġvik. Therefore, it is likely that the model underestimates the contribution of MOA (Wilson et al., 2015; Zhao et al., 2021a) and does not account for terrestrial biogenic INPs (Creamean et al., 2020) due to the lack of treatments in the model. In addition, both D15 and SM20 schemes cannot represent the high ice-nucleating ability of HLD at warm temperatures at Zeppelin in summer 2016 (symbol G in Fig. 8), which is attributed to soil organic matter by Tobo et al. (2019). When these organics are taken into account in the model, model overestimation for site G will get even worse, implying an overestimation of surface dust concentrations and/or HLD emission at Svalbard in the summertime. In summary, the model's INP biases in the Arctic are likely due to biases in the simulated aerosol fields (e.g., dust, MOA, and BC) and uncertainties in current ice nucleation parameterizations or missing representations of other INP sources (e.g., terrestrial biogenic aerosols).
In addition, we do not explicitly represent the potential ice nucleation ability differences in freshly emitted HLD and long-range-transported LLD caused by aging and the coatings of pollutants (Kulkarni et al., 2014; Boose et al., 2016). However, D15 and SM20 may already take the aging effect into account implicitly. D15 is based on the Saharan and Asian dust data collected over the Pacific Ocean basin and US Virgin Islands, respectively, which are far away from the corresponding LLD sources, while SM20 is derived from the freshly emitted Icelandic HLD, which is subjected to less of an aging effect.
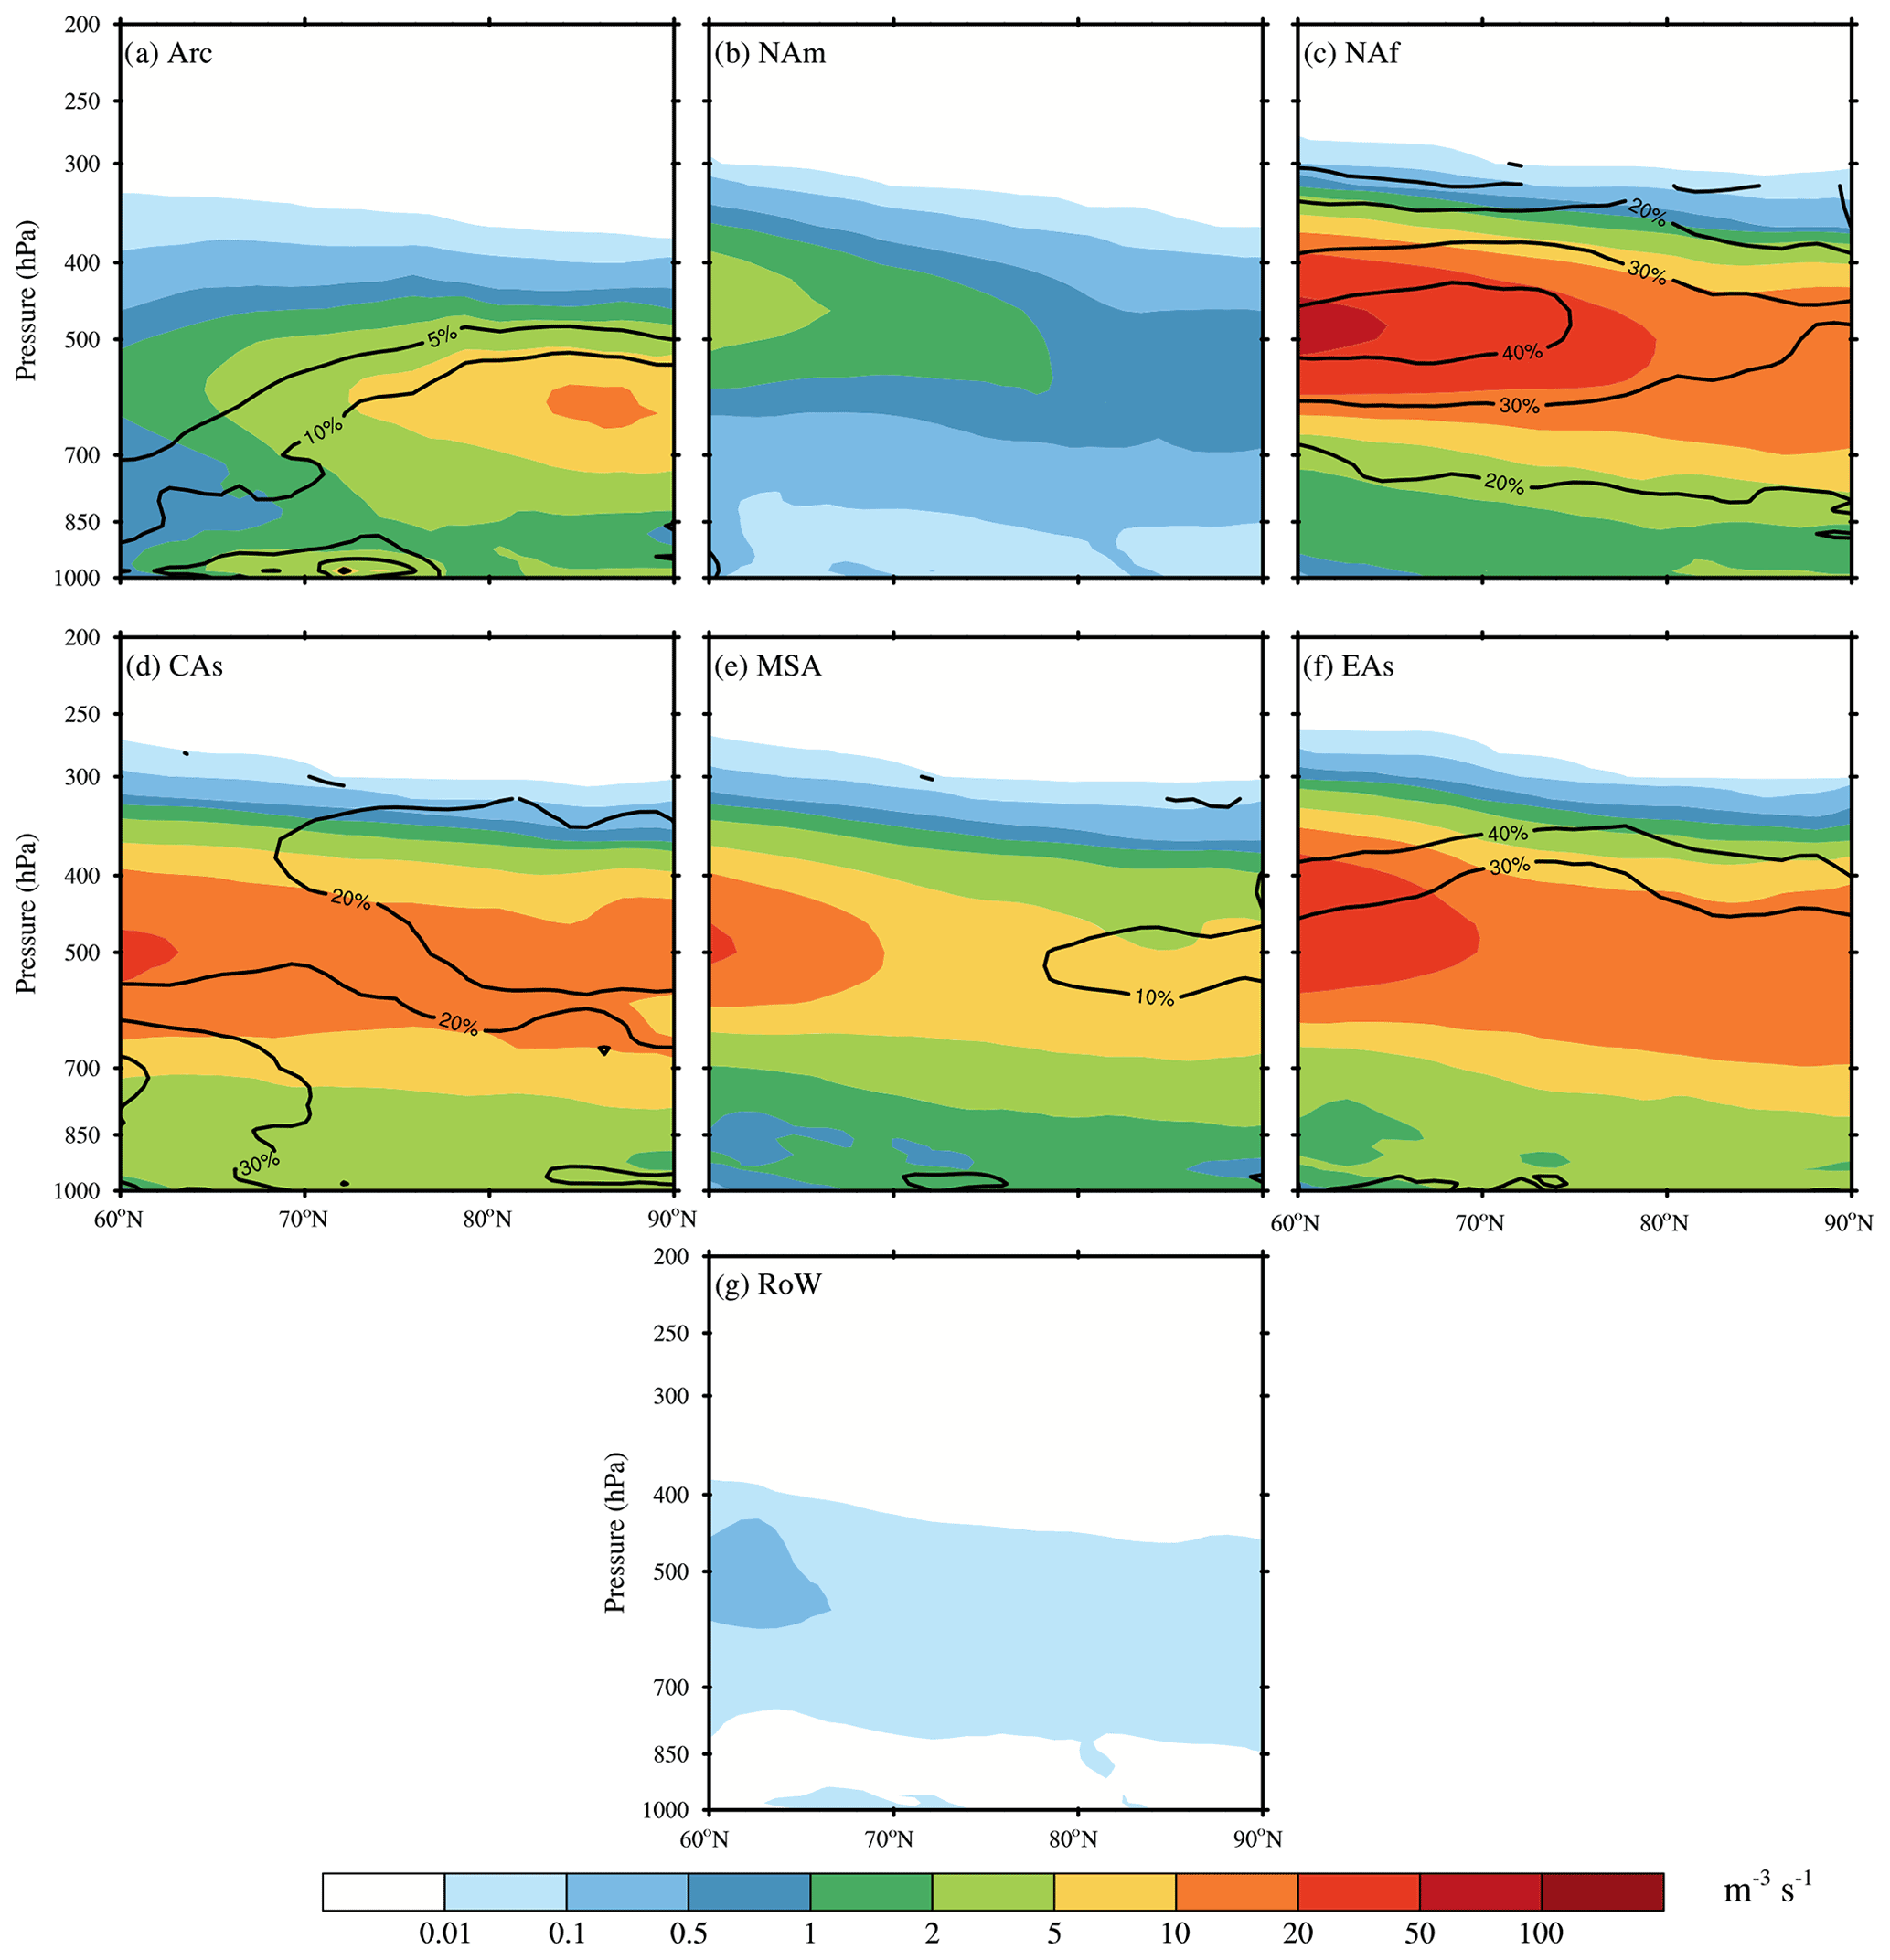
Figure 9Annual and zonal mean (year 2007 to 2011) ambient mixed-phase cloud immersion freezing rates (unit: m−3 s−1) in the Arctic for the seven dust sources. Black contours are the percentage contributions from each dust source to the total immersion freezing rate.
The comparisons above are based on INP concentrations at a given temperature set by the INP instruments, which reflects the potential INP populations under ambient aerosol conditions. Next, we examine the immersion freezing rate of dust originating from the seven tagged sources (Fig. 9) to evaluate the influences of HLD and LLD on ice nucleation processes in mixed-phase clouds. It is noted that the immersion freezing rate here is calculated online in the model using the ambient temperature and the default CNT ice nucleation parameterization.
Compared with its contribution to the dust burdens, the contribution of the HLD to the annual mean mixed-phase cloud immersion freezing rate is relatively small (∼ 10 % below 600 hPa) (Fig. 9a). This is because the HLD is mainly located in the lower troposphere and not a lot of HLD can reach the mixed-phase cloud levels (or the freezing level), especially in the case that the HLD tends to be more prevalent in the warm seasons (see more discussion below). Among the LLD sources, North African dust (Fig. 9c) and East Asian dust (Fig. 9f) are the two major contributors, both of which are responsible for more than 20 % of the annual mean immersion freezing rate in the mixed-phase clouds. Consistent with the vertical distribution of dust concentrations, the North African dust has its maximum contribution (30 %–40 %) at around 500 hPa, while the East Asian dust plays a more important role at higher altitudes (above 400 hPa). Dust from Central Asia also has a moderate contribution (∼ 20 %) to the immersion freezing rate in the Arctic (Fig. 9d).
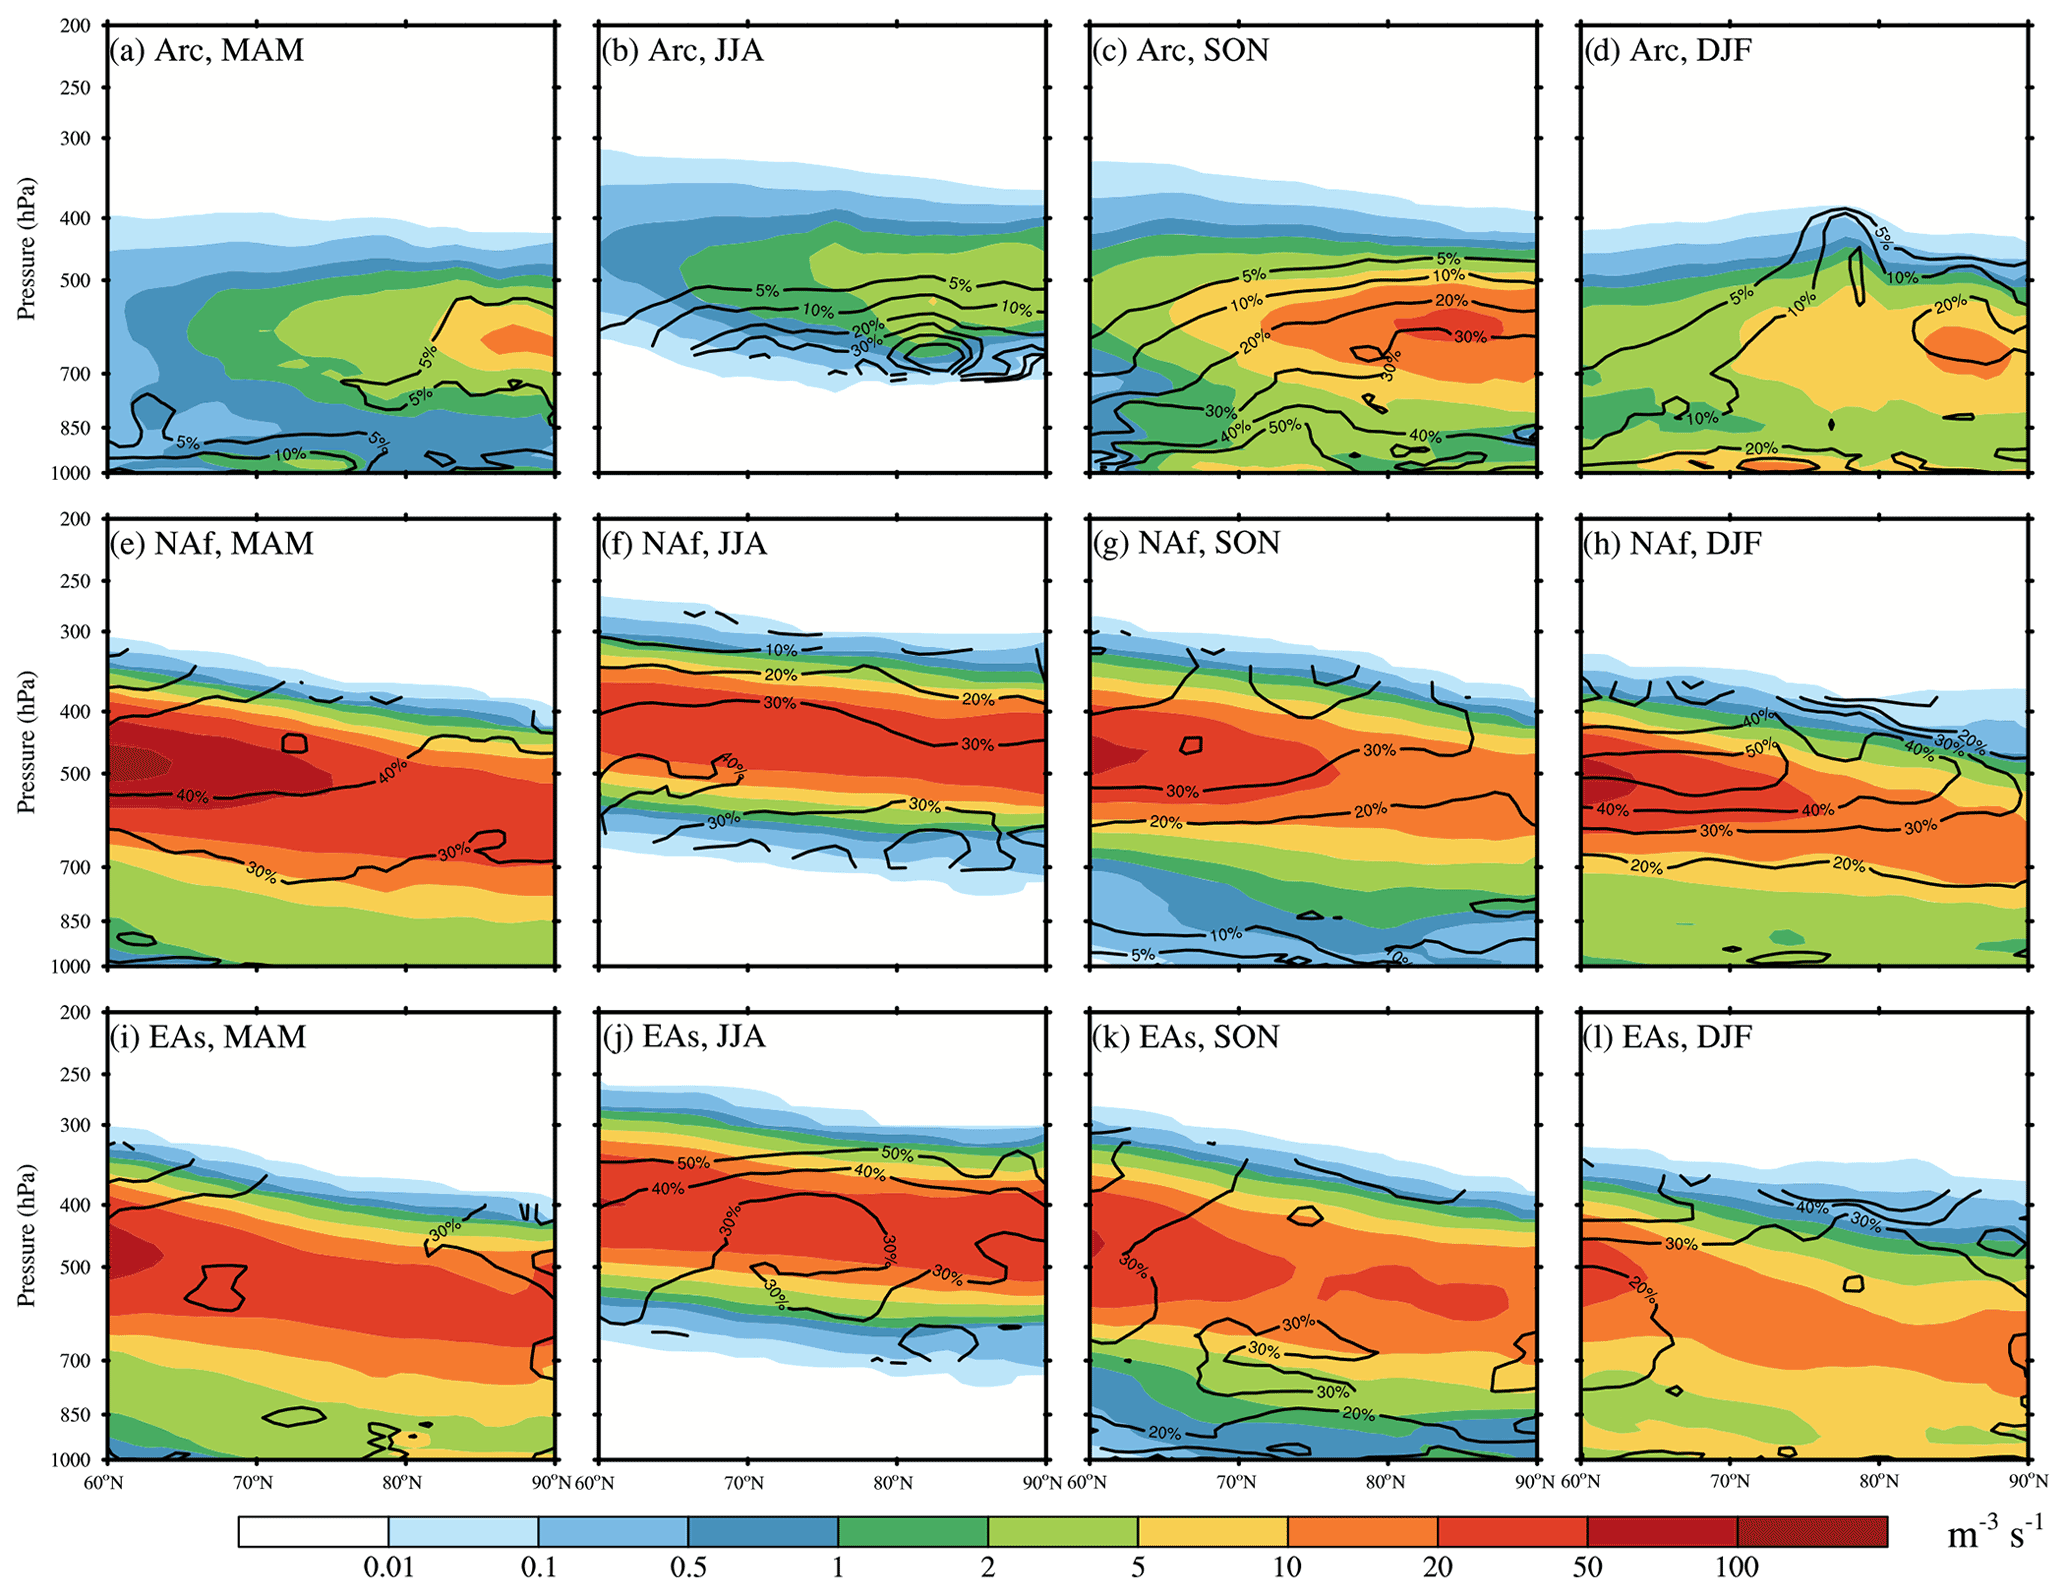
Figure 10Seasonal variations (year 2007 to 2011) of the mixed-phase clouds immersion freezing rates (unit: m−3 s−1) over the Arctic for dust emitted from the Arctic (a–d), North Africa (e–h), and East Asia (i–l). Black contours are the percentage contributions from each dust source to the total immersion freezing rate in the corresponding season.
Considering the different seasonality of HLD and LLD in the Arctic, we next investigate the seasonal variations of the immersion freezing rate in the Arctic mixed-phase clouds from HLD and two dominating LLD sources (NAf and EAs) (Fig. 10). HLD has the largest contribution to the Arctic immersion freezing rate in boreal autumn, with more than 30 % below 700 hPa and up to 50 % near the surface (Fig. 10c). It is related to the prevalence of HLD and relatively cold temperatures during this time in the Arctic. This is not the case for the summer, when the freezing level is relatively high. Although it is responsible for 50 % of the total Arctic dust burden in the boreal summer, HLD has a limited contribution to the immersion freezing rate in the clouds (Fig. 10b) because its weak vertical transport makes it hard to reach the freezing line. The contrasting results in summer and autumn suggest that the immersion freezing rate in the Arctic clouds is influenced by air temperature in addition to the aerosols. It also implies that the surface INP measurements may not reflect the complete picture of INP effects, and more aircraft INP measurements are needed in the future. The seasonal variations of the immersion freezing rate from NAf and EAs are weaker than that from HLD but are still subjected to the vertical temperature change with season. The North African dust contributes more in spring and winter, while the East Asian dust is more important in summer and autumn.
3.4 Impact on cloud properties and radiative fluxes
Dust INPs can freeze the supercooled liquid droplets, which impacts the cloud microphysical and macrophysical properties and modulates the Earth's radiative balance. To examine such impacts, we conduct three sensitivity experiments that turn off the heterogeneous ice nucleation in the mixed-phase clouds by dust from Arctic local sources, North Africa, and East Asia, respectively (i.e., noArc, noNAf, and noEAs in Table 1). The impacts of dust INPs from each source are determined by subtracting the respective sensitivity experiment from CTRL. Due to the feedbacks in dust emission and wet scavenging caused by changing cloud properties, the dust concentrations in the sensitivity experiments are not identical to CTRL, but the absolute differences are mostly within 5 % (Fig. S5 in the Supplement).

Figure 11Annual and zonal mean differences (year 2007 to 2011) in total liquid water mass mixing ratio (TLIQ), total ice mixing ratio (TICE), cloud droplet number concentration (NUMLIQ), and cloud ice number concentration (NUMICE) in the Arctic. Black contours are zonally averaged temperatures (∘C). Top, middle, and bottom panels show the differences between CTRL and noArc, noNAf, and noEAs, respectively.
The cloud liquid and ice changes caused by dust INPs from each source are shown in Fig. 11. Due to the strengthening of heterogeneous ice nucleation processes, INPs from all three sources consistently reduce the total liquid mass mixing ratio (TLIQ) (Fig. 11, first column) and cloud liquid droplet number concentration (NUMLIQ) (Fig. 11, third column). The influence of HLD is mainly in the lower troposphere (Fig. 11, top row), and the influence of LLD extends to higher altitudes (Fig. 11, bottom two rows). Moreover, the cloud ice number concentration (NUMICE) decreases in the upper troposphere (Fig. 11, fourth column), likely due to fewer cloud droplets available for the homogeneous freezing in cirrus cloud after introducing dust INPs in the mixed-phase clouds. With fewer ice crystals falling from the cirrus clouds to the mixed-phase clouds, the WBF process in the mixed-phase clouds is inhibited (Fig. S6). Other ice-phase processes such as the accretion of cloud water by snow and the growth of ice crystals by vapor deposition also become less efficient, which decreases the total ice mass mixing ratio (TICE) above 600–700 hPa of altitude (Fig. 11, second column). TICE in the lower troposphere is increased because of immersion freezing and snow sedimentation from above.
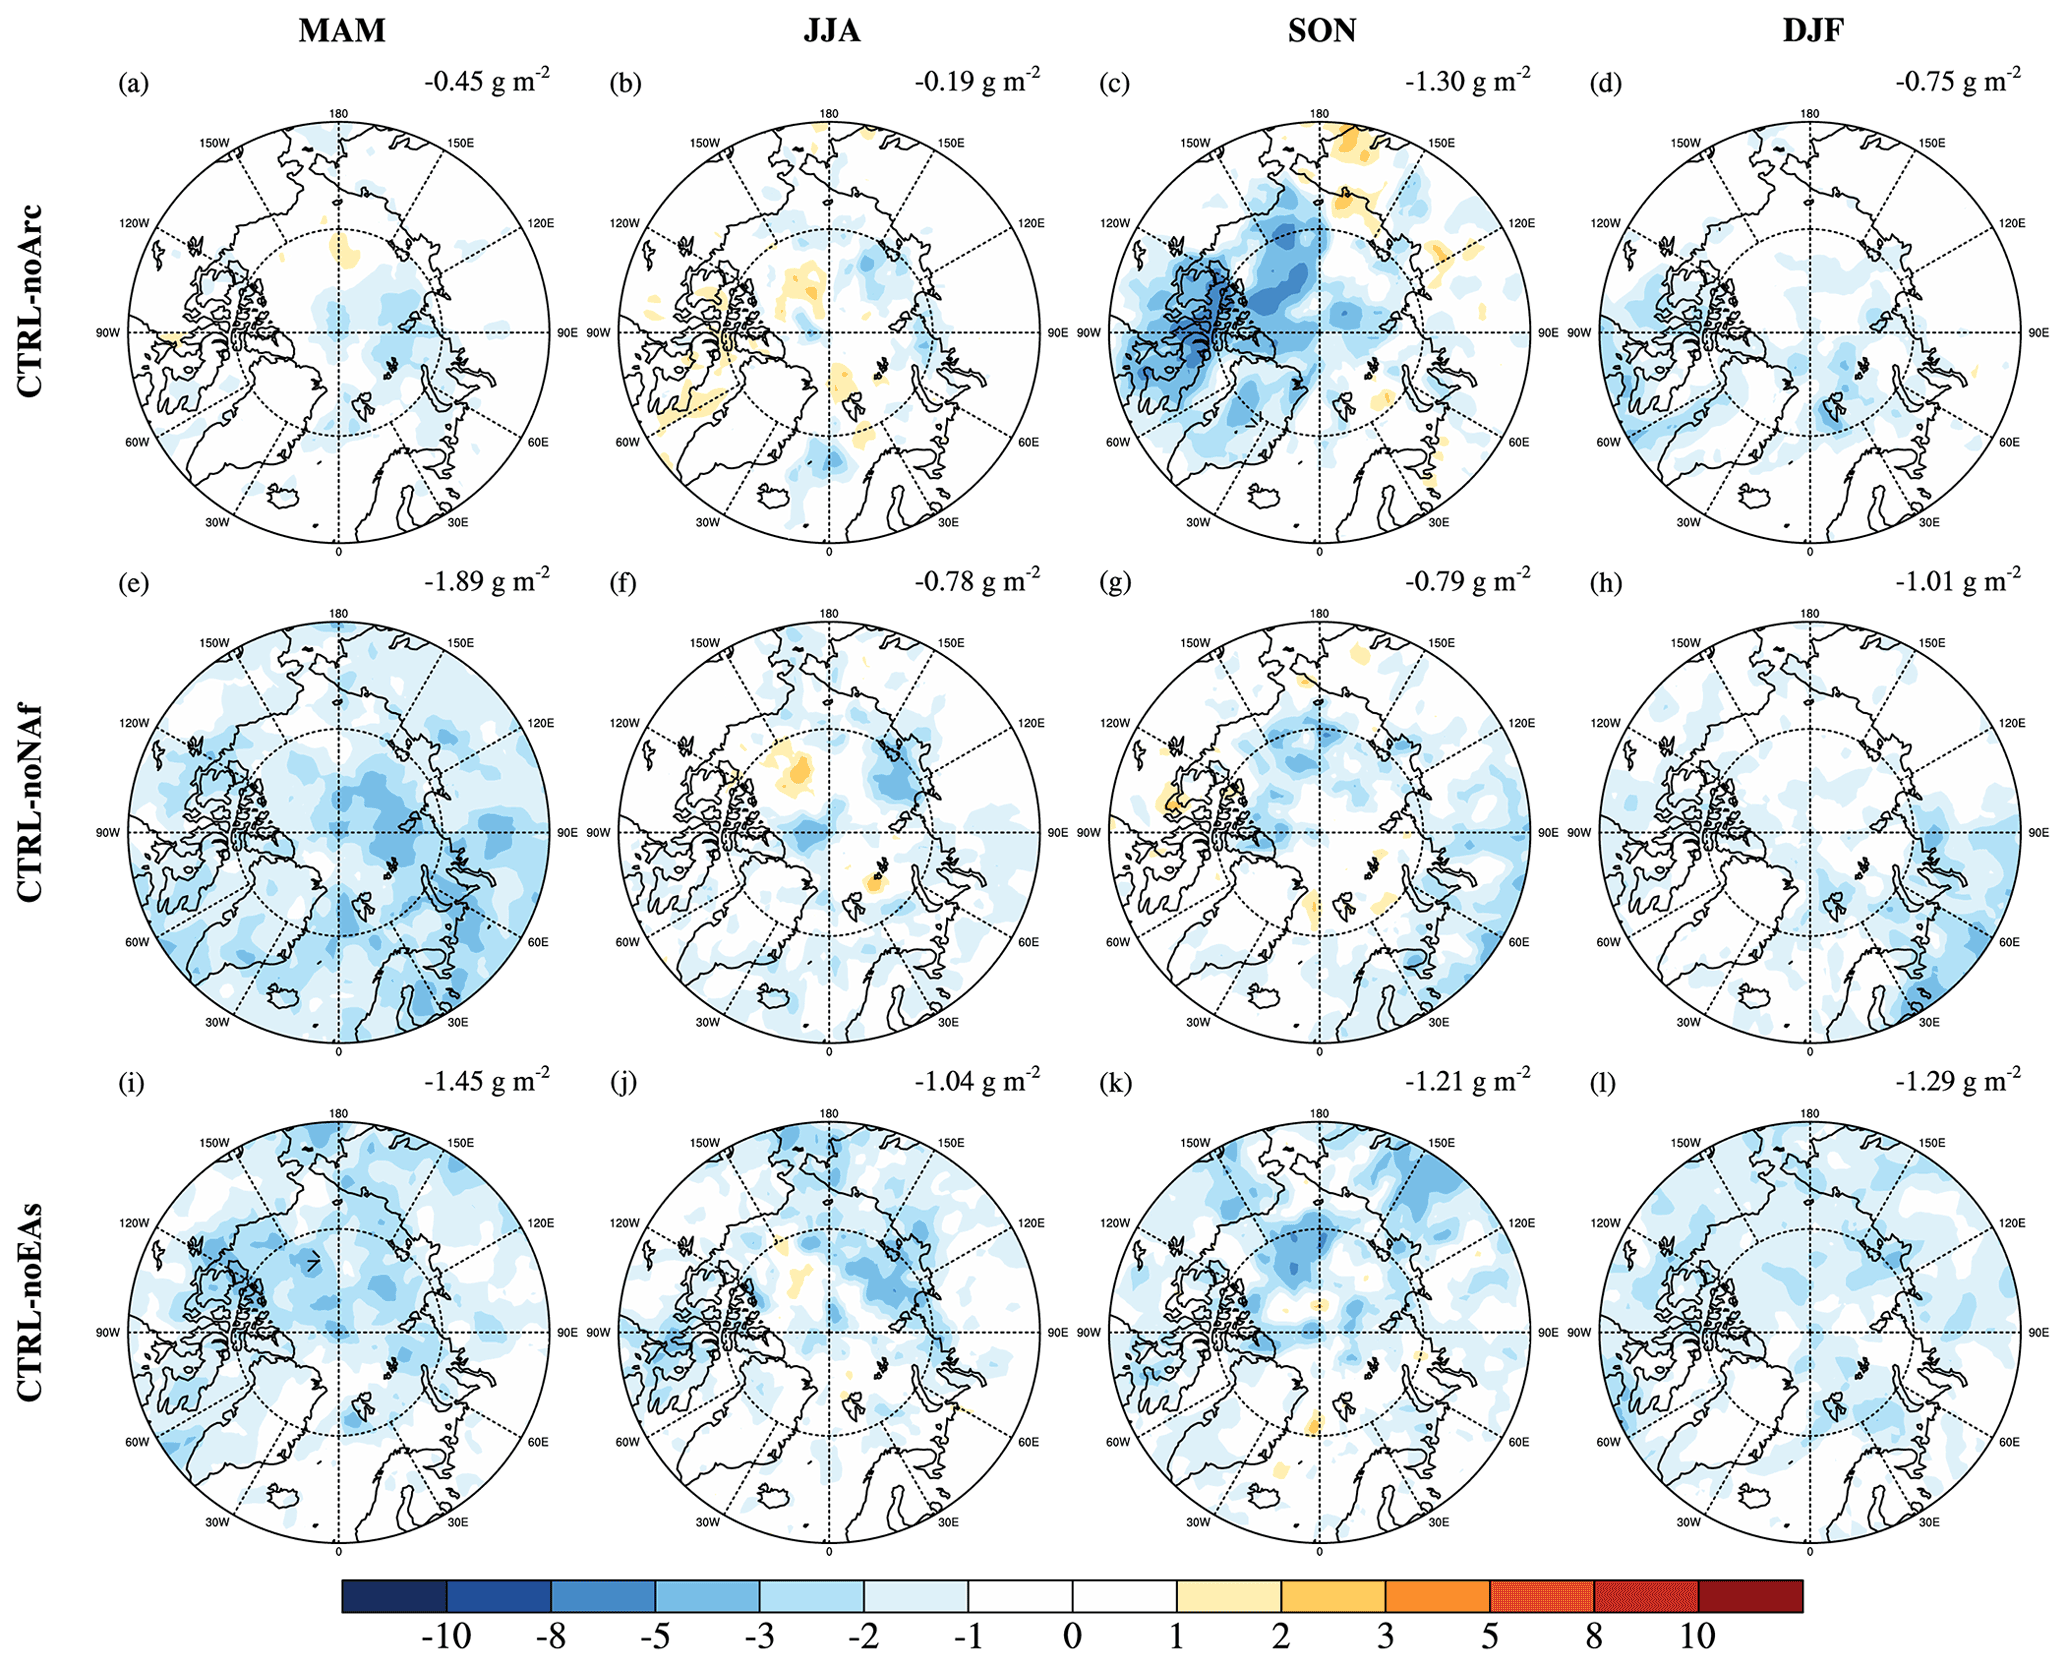
Figure 12Seasonal changes (year 2007 to 2011) in LWP (unit: g m−2) caused by dust INPs from the Arctic (a–d), North Africa (e–h), and East Asia (i–l). The numbers are averaged LWP differences in the Arctic.
Since liquid water path (LWP) is found to play a critical role in the Arctic radiative budget (e.g., Dong et al., 2010; Hofer et al., 2019; Shupe and Intrieri, 2004), we further investigate the seasonal variations of LWP changes caused by dust INPs from the three sources (Fig. 12). Corroborated by their large contribution to the immersion freezing rate during this time (Fig. 10c), HLD INPs produce the strongest LWP decrease (−1.3 g m−2) in boreal autumn (Fig. 12c), especially over northern Canada and Greenland. The influence of LLD INPs on LWP peaks in spring and winter. North African dust tends to have a larger impact on northern Eurasia, while East Asian dust impacts the western Arctic more.
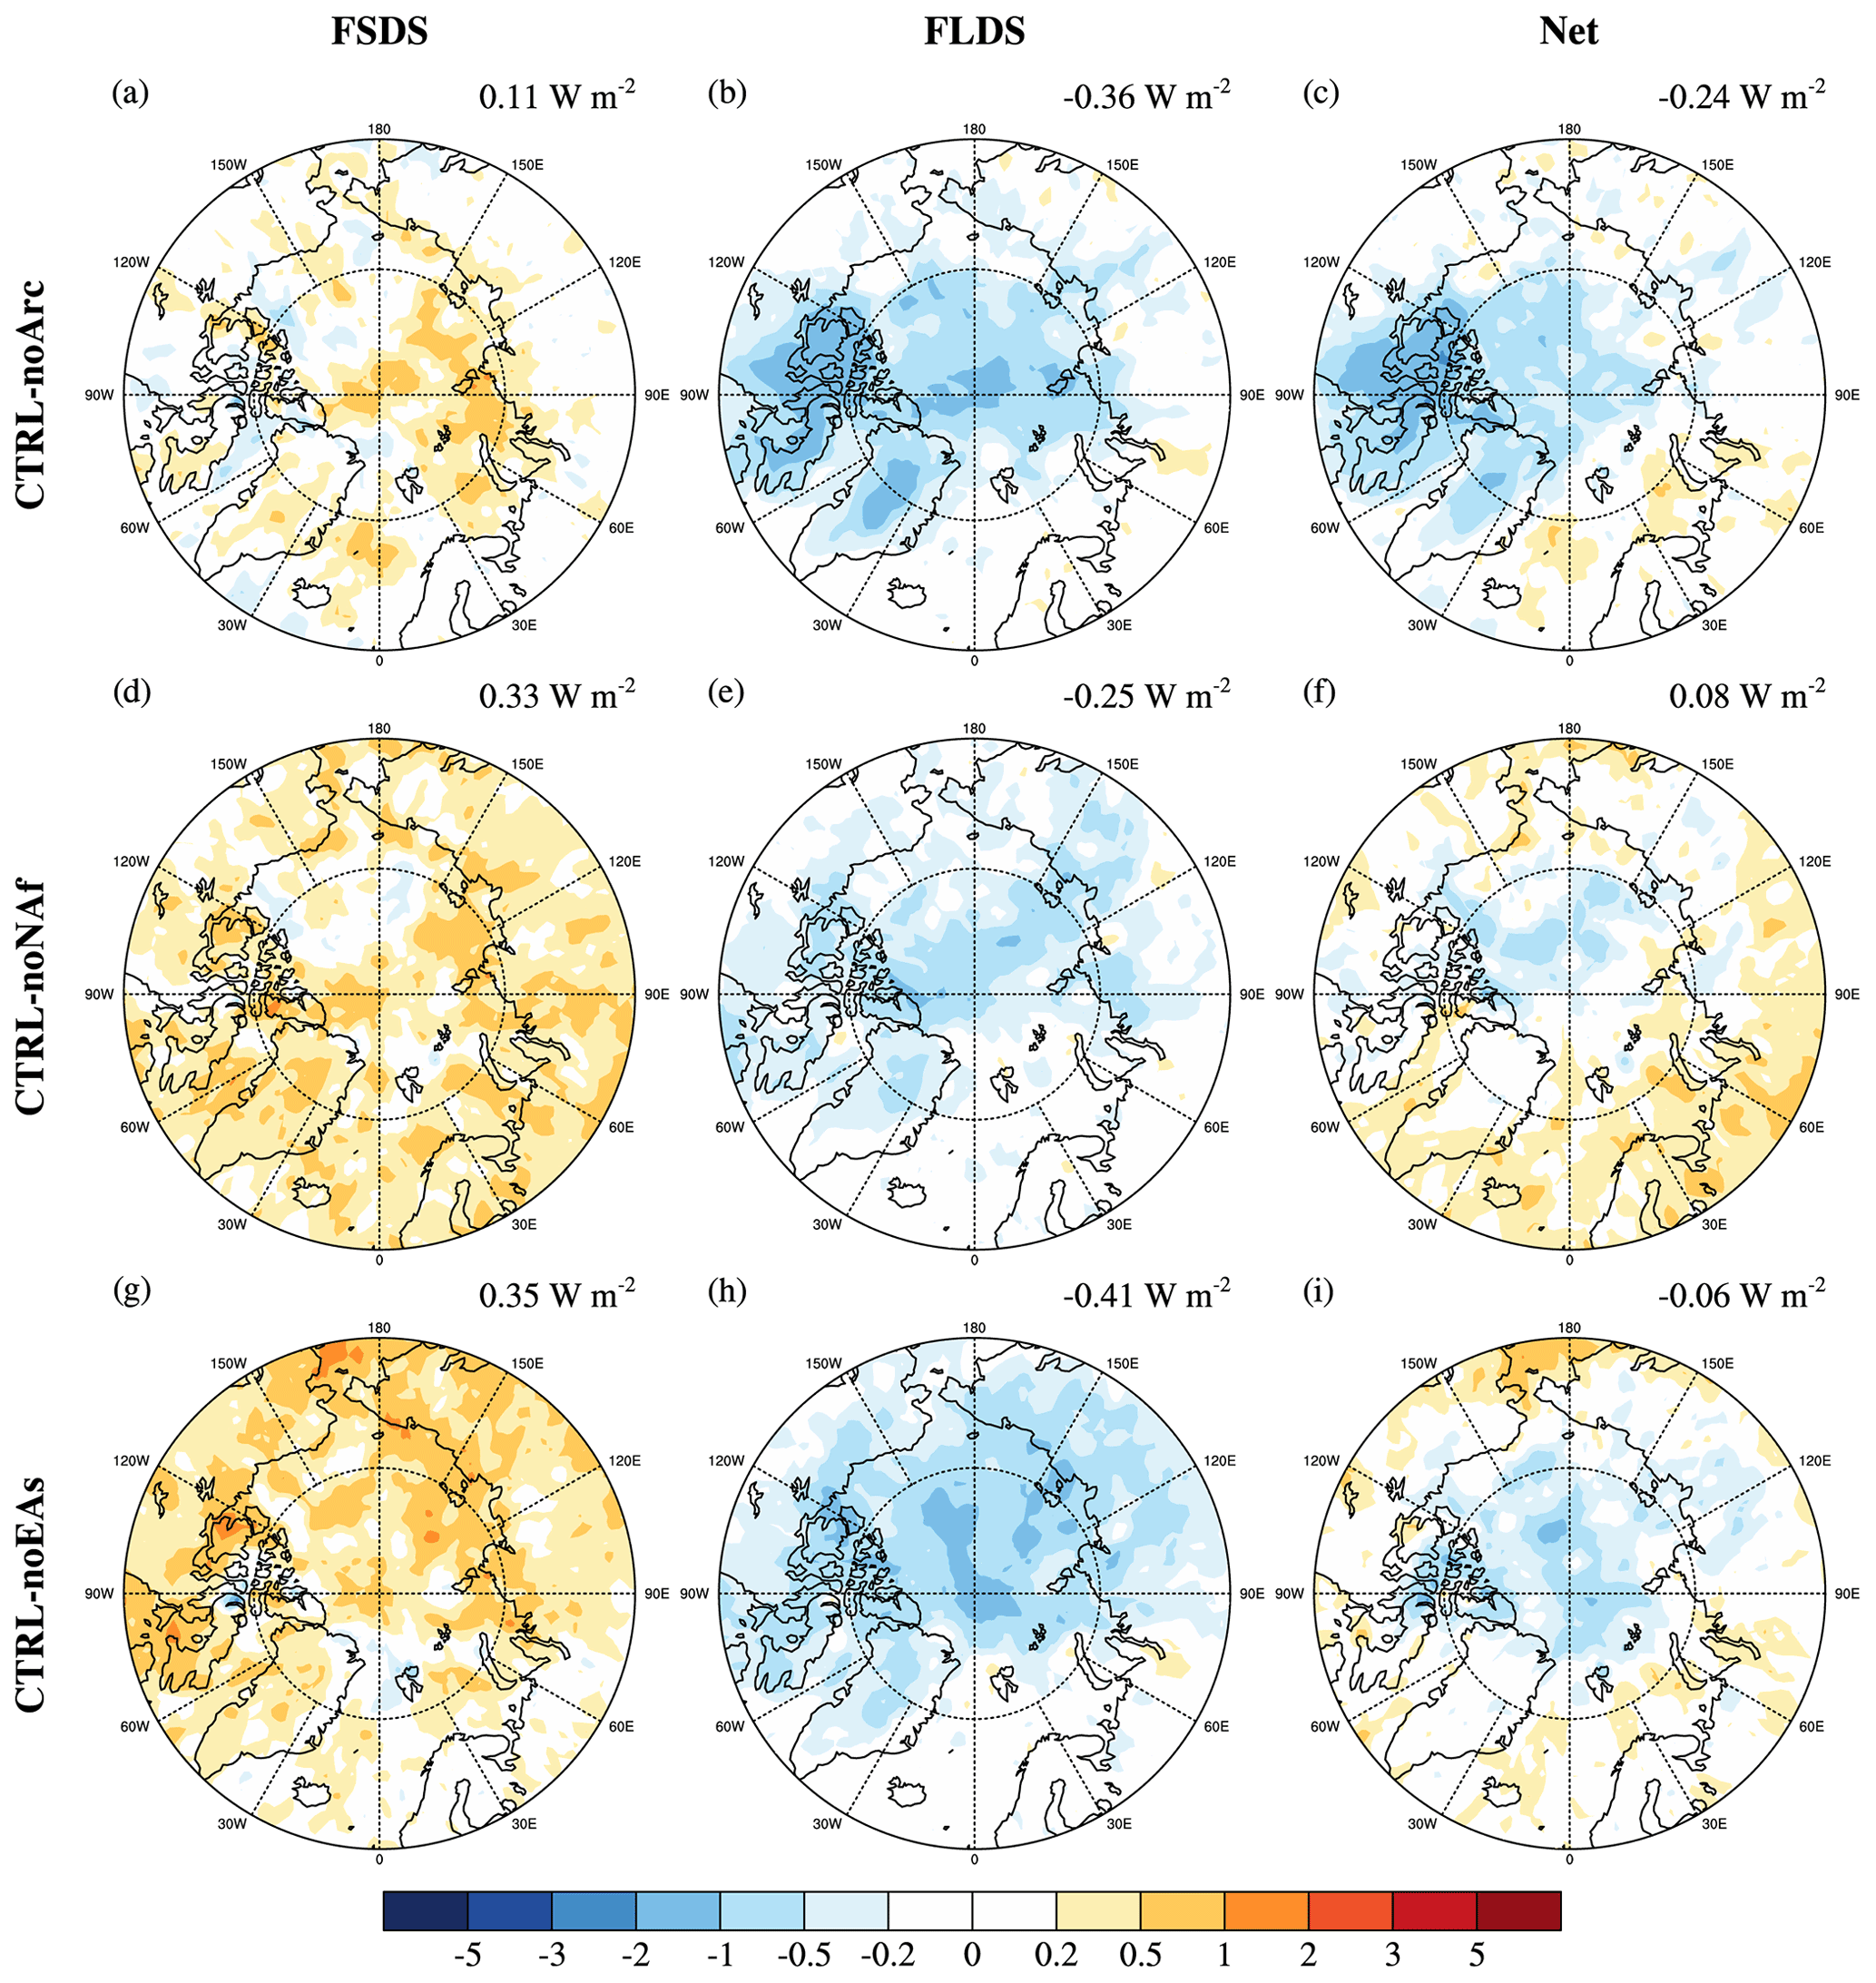
Figure 13Changes in annual mean (year 2007 to 2011) downwelling radiative fluxes at the surface (unit: W m−2) caused by dust INPs from the Arctic (a–c), North Africa (d–f), and East Asia (g–i). Left, middle, and right panels are downwelling shortwave (FSDS), longwave (FLDS), and net (FSDS + FLDS) radiative fluxes, respectively. The numbers are averaged radiative flux differences in the Arctic.
Table 4Arctic (60–90∘ N) averaged surface downwelling radiative fluxes and TOA cloud radiative forcing changes caused by dust INPs originating from local Arctic sources (Arc), North Africa (NAf), and East Asia (EAs) (W m−2).
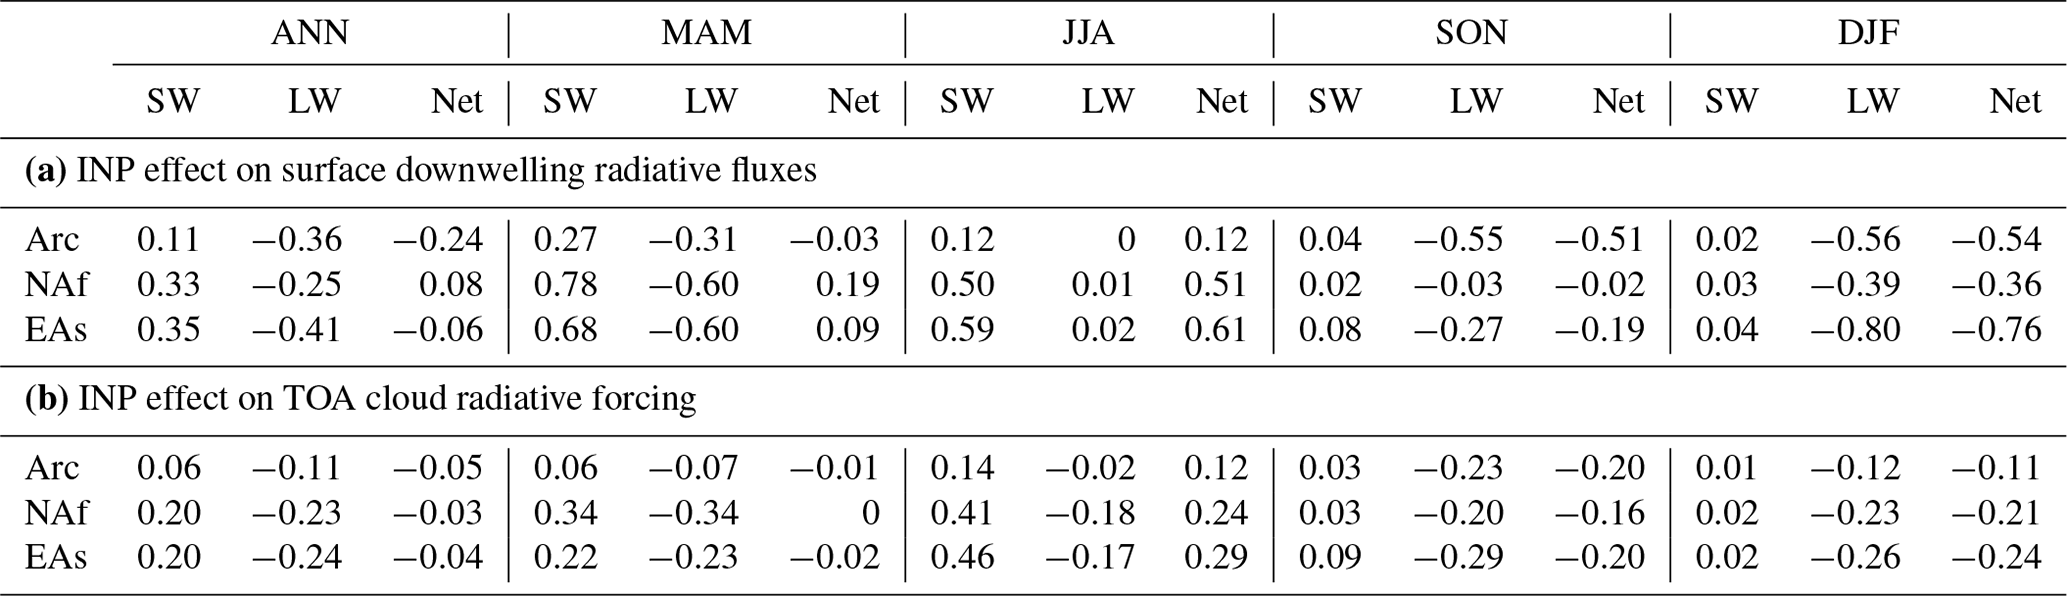
Dust INPs from the three sources consistently increase (decrease) the annual mean downwelling shortwave (longwave) radiative flux (FSDS and FLDS) at the surface (Fig. 13, left and middle columns). This is mainly due to the LWP decrease, which reduces the cloud albedo and longwave cloud emissivity. For HLD INPs, the FLDS reduction dominates over the FSDS increase and causes a net cooling effect at the Arctic surface (−0.24 W m−2) (Fig. 13c). In contrast, FSDS and FLDS changes related to the LLD INPs are comparable, which cancel each other and yield a small net radiative effect (0.08 W m−2 for NAf and −0.06 W m−2 for EAs) (Fig. 13, bottom two rows). These differences in the net radiative effect are associated with different seasonalities of HLD and LLD. The insolation in the Arctic is strong in spring and summer but very limited in autumn and winter. Since the HLD INPs have a much stronger influence on LWP in autumn and winter than spring and summer (Fig. 12), their contribution to the FSDS warming is weak, and the FLDS cooling in autumn and winter dominates the annual mean effect (Table 4a; also seen in Figs. S7 to S9). LLD INPs are also important in spring and summer, so their FSDS warming effect is comparable to, and compensates for, the FLDS cooling effect.
We also examined the dust INP effect on cloud radiative forcing (CRF) at the top of the atmosphere (TOA) (Table 4b). Dust INPs from the three sources induce a small net cooling (from −0.03 to −0.05 W m−2) in the Arctic, with SW warming and LW cooling effects. The net cooling persists throughout the year, except for the summertime when the sufficient insolation results in a strong SW warming and, consequently, a net warming effect. Shi and Liu (2019) also found that LLD can induce a general net cooling effect above 70∘ N (0.18 to −1.95 W m−2), but at a much higher magnitude than the sum of NAf and EAs dust INP effects (−0.15 W m−2 above 70∘ N, not shown in Table 4), which implies that the aerosol glaciation effect on mixed-phase clouds is highly nonlinear.
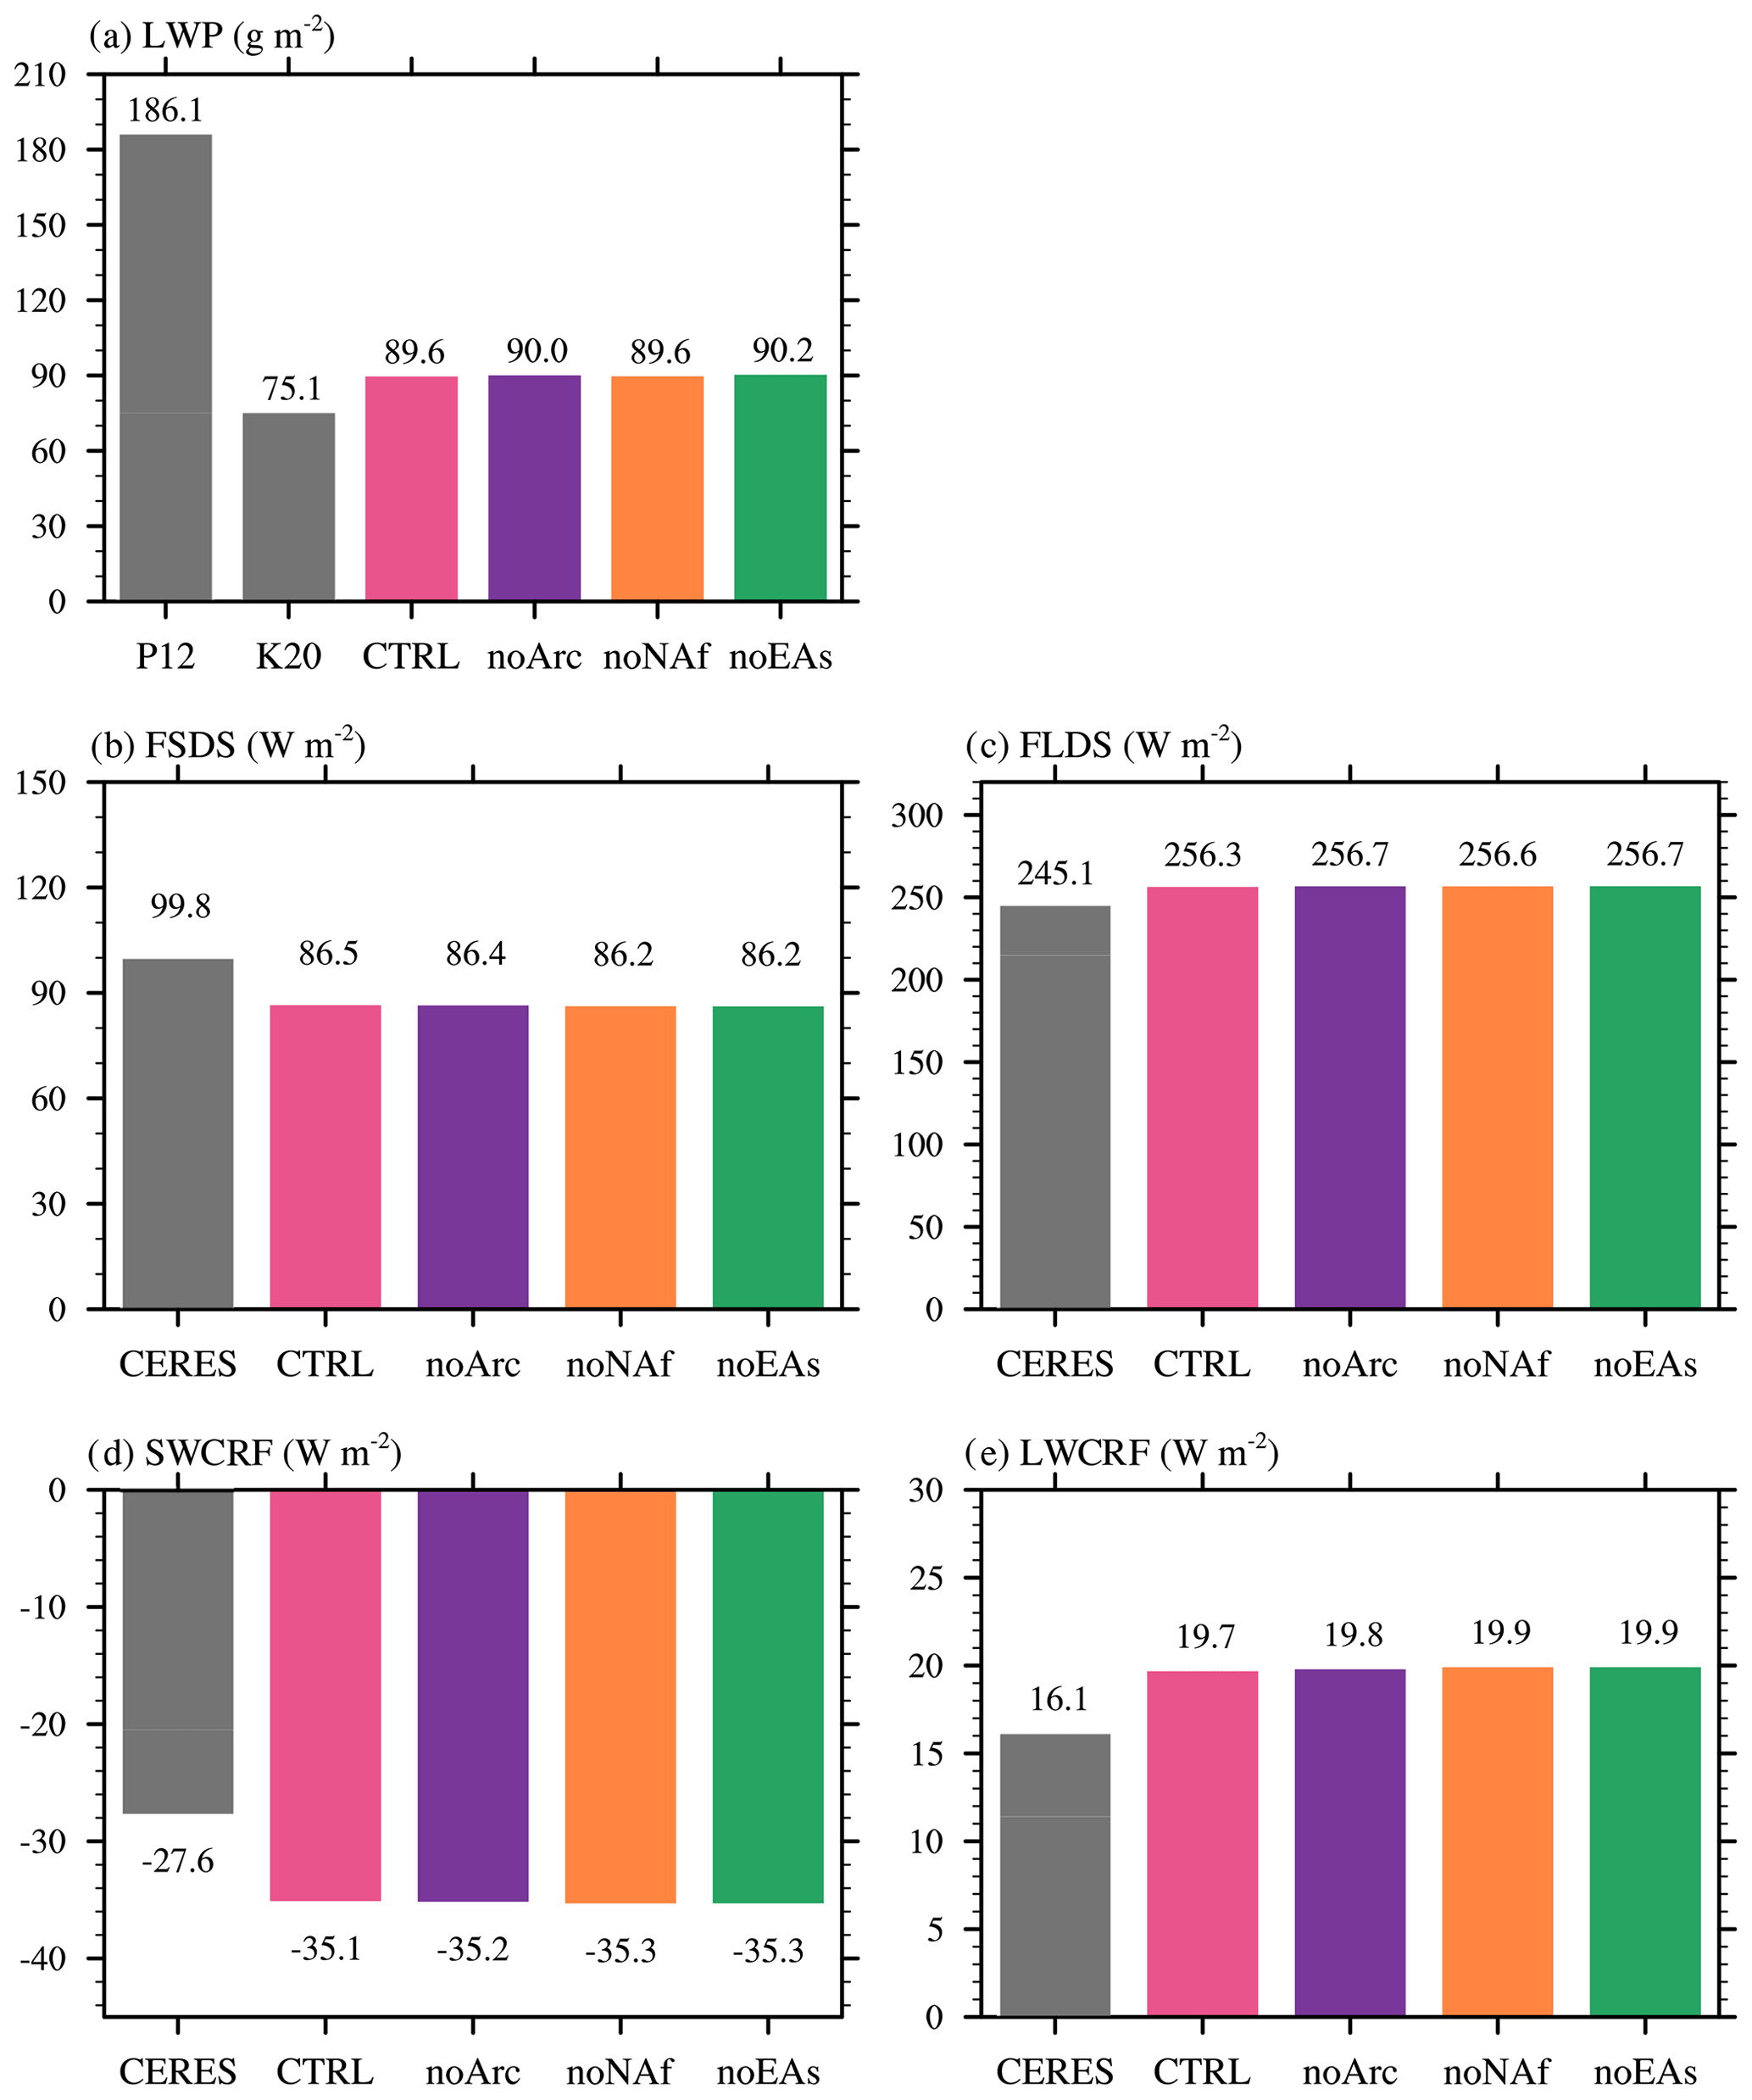
Figure 14(a) Annual mean Arctic (60 to 80∘ N here) averaged LWP over ocean for the MODIS observations and the four simulations (2007–2008). Two MODIS datasets are used, including the standard product (Pincus et al., 2012, P12; averaged from 2007 to 2008) and an improved one (Khanal et al., 2020, K20; averaged from 2007 to 2009). The MODIS simulator is used to calculate the simulated LWP. (b–e) Annual mean Arctic (60 to 90∘ N in these panels) averaged (b) FSDS, (c) FLDS, (d) SWCRF, and (e) LWCRF for the CERES observation (2007–2011) and the four simulations (2007–2011).
Finally, we evaluate the model performance in simulating the Arctic LWP and radiative fluxes against the Moderate Resolution Imaging Spectroradiometer (MODIS) LWP and the Clouds and the Earth's Radiant Energy System Energy Balanced and Filled Edition 4.1 (CERES-EBAF Ed4.1) products (Loeb et al., 2018; Kato et al., 2018), respectively (Fig. 14). Two MODIS datasets are used, including the standard Collection 6.1 product (Pincus et al., 2012 – P12; Khanal et al., 2020 – K20). The P12 product combines MODIS observations from Terra and Aqua and is designed for apples-to-apples comparisons with modeling results from the Cloud Feedback Model Intercomparison Project (CFMIP) Observation Simulator Package (COSP). The standard product has a well-known positive zonal bias near the poles that is strongly correlated with the solar zenith angle (SZA). The K20 product largely reduces this bias by utilizing the SZA and cloud heterogeneity index in the retrieval algorithm. The MODIS simulator is used to calculate the simulated LWP. According to Fig. 14, the simulated LWP from the four experiments is lower than P12 but higher than K20. All four experiments also underestimate FSDS with shortwave cloud radiative forcing (SWCRF) that is too strong and overestimate FLDS with longwave cloud radiative forcing (LWCRF) that is too strong, which likely points to the biases of modeled clouds (e.g., LWP that is too large compared to K20). The differences among the model experiments are very small compared to their discrepancies with observations. We notice that including dust INPs from the three sources decreases the simulated LWP (i.e., CTRL has smaller LWP than the other experiments) (Fig. 14a), which makes the model performance better if compared to K20. Moreover, it shows noticeable improvements in simulating both surface and TOA radiative fluxes after including dust INPs from each of the three sources (i.e., the results from CTRL are closer to the CERES results than the other three experiments) (Fig. 14b–e).
Overall, including HLD or LLD INPs does not contribute a lot to the reduction of biases in simulating the LWP and radiative fluxes in the AMPCs. However, the representation of AMPCs in global climate models is associated with multiple cloud macrophysical and microphysical processes, as well as large-scale dynamics (Morrison et al., 2012) (see more discussion in Sect. 4), which interact with one another nonlinearly. Therefore, even though including HLD or LLD INPs does not improve the representation of AMPCs significantly in our model, a good representation of dust INPs, especially including HLD INPs, could still be of great importance for parameterizing AMPCs in the model.
The HLD emission in our CTRL simulation is manually tuned up by 10 times to match the estimate by Bullard et al. (2016), which is derived by compiling field measurements in Iceland and Alaska. Since the instruments were operated under extreme Arctic conditions and the sampling is very scarce, this estimate may have large uncertainties. Therefore, the tuned HLD emission can be biased as well. Considering the overestimation of Greenland dust deposition, summertime surface dust concentrations at Alert station, and surface INP concentrations at Svalbard, our tuning may cause a regional and temporal high bias in HLD dust emissions. We examine this uncertainty by conducting a sensitivity experiment halving HLD emissions in CTRL (i.e., HLD_half) and analyzing the interannual variability of CTRL and HLD_half simulations (Table S2 and Figs. S10–S11). The HLD_half simulation indeed has a better performance than CTRL. However, the high bias for Greenland deposition and the summertime overestimation of Alert dust surface concentration still exist, which reflects the limitation of the dust emission parameterization we use. This parameterization may not be able to capture the spatial distribution of dust emissions across the Arctic, considering that the model performance at other sites is much better (e.g., Heimaey, Fig. 3a). Also, the HLD emissions and their regional distributions have large interannual variabilities. Therefore, as we mentioned in Sect. 3.1, comparing model simulations with measurements conducted in different years may result in large uncertainties.
The overestimation of surface dust and INP concentrations may also imply a vertical transport of HLD that is too weak, considering the low biases of dust in the upper troposphere compared with ARCTAS measurements and CALIPSO retrievals. The weak vertical transport at the source regions in EAMv1 was also found in Wu et al. (2020), which was related to the dry deposition at the surface layer that is too strong. If this bias is addressed, HLD would contribute less (more) to the Arctic dust concentrations in the lower (upper) troposphere, which suggests a larger contribution of HLD to the heterogeneous ice nucleation in the mixed-phase clouds in the summertime. As a result, the HLD would induce a more positive net downwelling radiative flux at the surface in summer and a less negative annual mean radiative effect. It is also noted that the underprediction in the upper troposphere dust may come from a weak long-range transport of LLD. If this is the case, the HLD would have a weaker contribution to the upper-level dust concentrations and likely less of an impact on mixed-phase cloud heterogeneous ice nucleation in the summertime.
In addition, EAMv1 has intrinsic biases in its cloud microphysics parameterizations. As mentioned in Sect. 2.1, the WBF process rate in EAMv1 is tuned down by a factor of 10, which results in too many supercooled liquid clouds in high latitudes (Y. Zhang et al., 2019; Zhang et al., 2020). Shi and Liu (2019) found that the sign and magnitude of dust INP cloud radiative effect in the Arctic would change after removing the tuning factor for the WBF process in EAMv1. Moreover, EAMv1 does not account for several secondary ice production mechanisms, which are suggested to have a large impact on the ice crystal number concentrations and thus cloud phase (Zhao and Liu, 2021; Zhao et al., 2021b). All these uncertainties in the cloud microphysical processes would interact nonlinearly and influence our estimate of INP radiative effect, and it should be addressed in future studies.
In this study, we investigate the source attribution of dust aerosols in the Arctic and quantify the relative importance of Arctic local dust versus long-range-transported LLD in the Arctic dust loading and INP population. We found that HLD is responsible for 30.7 % of the total dust burden in the Arctic, whereas LLD from Asia and North Africa contributes 44.2 % and 24.2 %, respectively. The vertical transport of HLD is limited due to the stable cold air in the Arctic, and thus it contributes more to the dust burden in the lower troposphere. In boreal summer and autumn when the contribution of HLD is at a maximum because of stronger local dust emissions, HLD is responsible for more than 30 % of the Arctic dust loading below 800 hPa but less than 10 % above 700 hPa. In contrast, LLD from North African and East Asian dust dominates the dust burden in the free troposphere, since the poleward transport of LLD follows the uplifted isentropes. The North African and East Asian dust accounts for about two-thirds of the dust loading above 700 hPa, with the remaining one-third from other LLD sources. The North African dust contributes more between 500 and 700 hPa, while the East Asian dust dominates in the upper troposphere (above 400 hPa) because of its high emission heights. In addition, the North Africa source has a larger contribution in springtime, while the other three seasons are more influenced by the East Asian source.
Modeled dust INP concentrations are investigated following three ice nucleation parameterizations: CNT, D15, and SM20. Compared with INP measurements, our results show that including HLD as INPs significantly improves the model performance in simulating Arctic INP concentrations, especially for the ground measurements and measurements conducted in summer and autumn. We also examine the INP contributions from BC and SSA based on Sc20 and M18, respectively. The model suggests that both of them are only weak sources compared with dust. We note that the model may underestimate SSA INPs and currently misses the representation of terrestrial biological INPs. The model biases of INPs can also be due to bias in simulating Arctic dust concentrations and/or the uncertainties in ice nucleation parameterizations.
We examine the contribution of dust from the three sources (Arctic, North Africa, and East Asia) to the ambient immersion freezing rate in the Arctic. The contribution from HLD shows a strong seasonal variation, with the peak contribution in boreal autumn (above 20 % below 500 hPa). In summer, although HLD has strong contributions to the dust loading and INP concentrations in the lower troposphere, its impact on the ambient immersion freezing rate is limited due to the warm temperatures and weak vertical transport. This finding implies that surface INP measurements may not be sufficient in representing the INP population in the Arctic mixed-phase clouds, and more measurements of INP vertical profiles are needed in the future. North African dust and East Asian dust are the two major LLD contributors to the ambient immersion freezing rate. The annual mean contribution (30 %–40 %) from North African dust peaks at around 500 hPa, while the immersion freezing is dominated by East Asian dust (more than 40 %) in the upper troposphere (above 400 hPa).
The cloud glaciation effects of dust INPs from local Arctic sources, as well as North African and East Asian sources, are further examined. It is found that INPs from all the three sources consistently result in a reduction in TLIQ and NUMLIQ. TICE and NUMICE at higher altitude also decrease, likely due to the weakening of homogeneous freezing in cirrus clouds. LWP reduction caused by HLD INPs is evident in autumn and winter, while those by dust INPs from the two LLD sources peak in spring. HLD INPs also drive a net cooling effect of −0.24 W m−2 in the downwelling radiative flux at the surface in the Arctic, while the net radiative effects of the two LLD INP sources are relatively small (0.08 W m−2 for NAf and −0.06 W m−2 for EAs). This variation in radiative effect reflects the seasonal difference between HLD and LLD. Our results also suggest that all three dust sources result in a weak negative net cloud radiative effect (−0.03 to −0.05 W m−2) in the Arctic, which is consistent with Shi and Liu (2019).
Overall, our study shows that the Arctic local dust, which has been overlooked in previous studies, may have large contributions to the Arctic dust loading and INP population. It can also influence the Arctic mixed-phase cloud properties by acting as INPs. Considering the climate impacts of local Arctic dust emissions will be important given a warming climate, wherein reduction in snow coverage and more exposure of dry land in the Arctic may lead to increased HLD emissions.
The E3SMv1 source code is available at https://github.com/E3SM-Project/E3SM (last access: October 2019; https://doi.org/10.11578/E3SM/dc.20180418.36, E3SM project, 2018). The modified model source code can be obtained upon request from the corresponding author.
The model output is archived at the NERSC Cori supercomputer, which can be made available upon request. The AERONET AOD data are available online at https://aeronet.gsfc.nasa.gov (NASA, 2020). The dust surface concentration and deposition flux data are available online at https://aerocom-classic.met.no/DATA/download/DUST_BENCHMARK_HUNEEUS2011/ (Huneeus et al., 2011). The IMPROVE data are available online at http://vista.cira.colostate.edu/Improve/data-page/ (Malm et al., 1994). The data for the ARCTAS flight campaign are available online at https://www-air.larc.nasa.gov/missions/arctas/arctas.html (NASA, 2021a). The MODIS LWP data can be obtained online at https://ladsweb.modaps.eosdis.nasa.gov/missions-and-measurements/science-domain/cloud/ (last access: November 2021; https://doi.org/10.5067/MODIS/MOD06_L2.061, https://doi.org/10.5067/MODIS/MYD06_L2.061, Platnick et al., 2017a, b). CERES data can be obtained online at https://ceres.larc.nasa.gov/data/#ebaf-level-3 (NASA, 2021b).
The supplement related to this article is available online at: https://doi.org/10.5194/acp-22-2909-2022-supplement.
YS and XL conceived the project. YS modified the code, conducted the simulations, and led the analyses with suggestions from XL, MW, XZ, ZK, and HB. XL supervised the study. YS wrote the first draft of the paper. All co-authors were involved in helpful discussions and revised the paper.
At least one of the (co-)authors is a member of the editorial board of Atmospheric Chemistry and Physics. The peer-review process was guided by an independent editor, and the authors also have no other competing interests to declare.
Publisher's note: Copernicus Publications remains neutral with regard to jurisdictional claims in published maps and institutional affiliations.
The authors would like to thank Kang Yang and Zhien Wang for providing the CALIPSO dust extinction retrievals and Meng Zhang and Sarah Brooks for their comments and suggestions. Mingxuan Wu is supported by the US Department of Energy (DOE), Office of Biological and Environmental Research, Earth and Environmental System Modeling program as part of the Energy Exascale Earth System Model (E3SM) project. The Pacific Northwest National Laboratory (PNNL) is operated for the DOE by the Battelle Memorial Institute under contract DE-AC05-76RLO1830. This research used resources of the National Energy Research Scientific Computing Center, a DOE Office of Science User Facility supported by the Office of Science of the US Department of Energy under contract DE-AC02-05CH11231.
This research has been supported by the Department of Energy (DOE) Atmospheric System Research (ASR) Program (grants DE-SC0020510 and DE-SC0021211).
This paper was edited by Jianzhong Ma and reviewed by two anonymous referees.
Albani, S., Mahowald, N. M., Perry, A. T., Scanza, R. A., Zender, C. S., Heavens, N. G., Maggi, V., Kok, J. F., and Otto-Bliesner, B. L.: Improved dust representation in the Community Atmosphere Model, J. Adv. Model. Earth Syst., 6, 541–570, https://doi.org/10.1002/2013MS000279, 2014.
Arimoto, R., Duce, R. A., Ray, B. J., Ellis Jr, W. G., Cullen, J. D., and Merrill, J. T.: Trace elements in the atmosphere over the North Atlantic, J. Geophys. Res.-Atmos., 100, 1199–1213, https://doi.org/10.1029/94JD02618, 1995.
Arnalds, O., Dagsson-Waldhauserova, P., and Olafsson, H.: The Icelandic volcanic aeolian environment: Processes and impacts – A review, Aeolian Res., 20, 176–195, https://doi.org/10.1016/j.aeolia.2016.01.004, 2016.
Atkinson, J. D., Murray, B. J., Woodhouse, M. T., Whale, T. F., Baustian, K. J., Carslaw, K. S., Dobbie, S., O'Sullivan, D., and Malkin, T. L.: The importance of feldspar for ice nucleation by mineral dust in mixed-phase clouds, Nature, 498, 355–358, https://doi.org/10.1038/nature12278, 2013.
Baddock, M. C., Mockford, T., Bullard, J. E., and Thorsteinsson, T.: Pathways of high-latitude dust in the North Atlantic, Earth Planet. Sci. Lett., 459, 170–182, https://doi.org/10.1016/j.epsl.2016.11.034, 2017.
Bogenschutz, P. A., Gettelman, A., Morrison, H., Larson, V. E., Craig, C., and Schanen, D. P.: Higher-order turbulence closure and its impact on climate simulations in the community atmosphere model, J. Climate, 26, 9655–9676, https://doi.org/10.1175/JCLI-D-13-00075.1, 2013.
Boose, Y., Sierau, B., García, M. I., Rodríguez, S., Alastuey, A., Linke, C., Schnaiter, M., Kupiszewski, P., Kanji, Z. A., and Lohmann, U.: Ice nucleating particles in the Saharan Air Layer, Atmos. Chem. Phys., 16, 9067–9087, https://doi.org/10.5194/acp-16-9067-2016, 2016.
Bory, A. J.-M., Biscaye, P. E., Svensson, A., and Grousset, F. E.: Seasonal variability in the origin of recent atmospheric mineral dust at NorthGRIP, Greenland, Earth Planet. Sci. Lett., 196, 123–134, https://doi.org/10.1016/S0012-821X(01)00609-4, 2002.
Bory, A. J.-M., Biscaye, P. E., and Grousset, F. E.: Two distinct seasonal Asian source regions for mineral dust deposited in Greenland (NorthGRIP), Geophys. Res. Lett., 30, 1167, https://doi.org/10.1029/2002GL016446, 2003.
Breider, T. J., Mickley, L. J., Jacob, D. J., Wang, Q., Fisher, J. A., Chang, R. Y.-W., and Alexander, B.: Annual distributions and sources of Arctic aerosol components, aerosol optical depth, and aerosol absorption, J. Geophys. Res.-Atmos., 119, 4107–4124, https://doi.org/10.1002/2013JD020996, 2014.
Bullard, J. E.: The distribution and biogeochemical importance of high-latitude dust in the Arctic and Southern Ocean-Antarctic regions, J. Geophys. Res.-Atmos., 122, 3098–3103, https://doi.org/10.1002/2016JD026363, 2017.
Bullard, J. E. and Austin, M. J.: Dust generation on a proglacial floodplain, West Greenland, Aeolian Res., 3, 43–54, https://doi.org/10.1016/j.aeolia.2011.01.002, 2011.
Bullard, J. E., Baddock, M., Bradwell, T., Crusius, J., Darlington, E., Gaiero, D., Gassó, S., Gisladottir, G., Hodgkins, R., McCulloch, R., McKenna-Neuman, C., Mockford, T., Stewart, H., and Thorsteinsson, T.: High-latitude dust in the Earth system, Rev. Geophys., 54, 447–485, https://doi.org/10.1002/2016RG000518, 2016.
Creamean, J. M., Kirpes, R. M., Pratt, K. A., Spada, N. J., Maahn, M., de Boer, G., Schnell, R. C., and China, S.: Marine and terrestrial influences on ice nucleating particles during continuous springtime measurements in an Arctic oilfield location, Atmos. Chem. Phys., 18, 18023–18042, https://doi.org/10.5194/acp-18-18023-2018, 2018.
Creamean, J. M., Hill, T. C. J., DeMott, P. J., Uetake, J., Kreidenweis, S., and Douglas, T. A.: Thawing permafrost: an overlooked source of seeds for Arctic cloud formation, Environ. Res. Lett., 15, 084022, https://doi.org/10.1088/1748-9326/ab87d3, 2020.
Crusius, J., Schroth, A. W., Gassó, S., Moy, C. M., Levy, R. C., and Gatica, M.: Glacial flour dust storms in the Gulf of Alaska: Hydrologic and meteorological controls and their importance as a source of bioavailable iron, Geophys. Res. Lett., 38, L06602, https://doi.org/10.1029/2010GL046573, 2011.
Dagsson-Waldhauserova, P., Arnalds, O., and Olafsson, H.: Long-term variability of dust events in Iceland (1949–2011), Atmos. Chem. Phys., 14, 13411–13422, https://doi.org/10.5194/acp-14-13411-2014, 2014.
de Boer, G., Morrison, H., Shupe, M. D., and Hildner, R.: Evidence of liquid dependent ice nucleation in high-latitude stratiform clouds from surface remote sensors, Geophys. Res. Lett., 38, L01803, https://doi.org/10.1029/2010GL046016, 2011.
DeMott, P. J., Sassen, K., Poellot, M. R., Baumgardner, D., Rogers, D. C., Brooks, S. D., Prenni, A. J., and Kreidenweis, S. M.: African dust aerosols as atmospheric ice nuclei, Geophys. Res. Lett., 30, 1732, https://doi.org/10.1029/2003GL017410, 2003.
DeMott, P. J., Prenni, A. J., Liu, X., Kreidenweis, S. M., Petters, M. D., Twohy, C. H., Richardson, M. S., Eidhammer, T., and Rogers, D. C.: Predicting global atmospheric ice nuclei distributions and their impacts on climate, P. Natl. Acad. Sci. USA, 107, 11217–11222, https://doi.org/10.1073/pnas.0910818107, 2010.
DeMott, P. J., Prenni, A. J., McMeeking, G. R., Sullivan, R. C., Petters, M. D., Tobo, Y., Niemand, M., Möhler, O., Snider, J. R., Wang, Z., and Kreidenweis, S. M.: Integrating laboratory and field data to quantify the immersion freezing ice nucleation activity of mineral dust particles, Atmos. Chem. Phys., 15, 393–409, https://doi.org/10.5194/acp-15-393-2015, 2015.
Dong, X., Xi, B., Crosby, K., Long, C. N., Stone, R. S., and Shupe, M. D.: A 10 year climatology of Arctic cloud fraction and radiative forcing at Barrow, Alaska, J. Geophys. Res.-Atmos., 115, D17212, https://doi.org/10.1029/2009JD013489, 2010.
Dörnbrack, A., Stachlewska, I. S., Ritter, C., and Neuber, R.: Aerosol distribution around Svalbard during intense easterly winds, Atmos. Chem. Phys., 10, 1473–1490, https://doi.org/10.5194/acp-10-1473-2010, 2010.
E3SM Project: Energy Exascale Earth System Model v1.0, Computer Software, E3SM Project, DOE [code], https://doi.org/10.11578/E3SM/dc.20180418.36, 2018.
Fan, S.-M.: Modeling of observed mineral dust aerosols in the arctic and the impact on winter season low-level clouds, J. Geophys. Res.-Atmos., 118, 11161–11174, https://doi.org/10.1002/jgrd.50842, 2013.
Fenn, R. W. and Weickmann, H. K.: Some results of aerosol measurements, Geofisica Pura e Applicata, 42, 53–61, https://doi.org/10.1007/BF02113389, 1959.
Gelaro, R., McCarty, W., Suárez, M. J., Todling, R., Molod, A., Takacs, L., Randles, C. A., Darmenov, A., Bosilovich, M. G., Reichle, R., Wargan, K., Coy, L., Cullather, R., Draper, C., Akella, S., Buchard, V., Conaty, A., Silva, A. M. da, Gu, W., Kim, G.-K., Koster, R., Lucchesi, R., Merkova, D., Nielsen, J. E., Partyka, G., Pawson, S., Putman, W., Rienecker, M., Schubert, S. D., Sienkiewicz, M., and Zhao, B.: The Modern-Era Retrospective Analysis for Research and Applications, Version 2 (MERRA-2), J. Climate, 30, 5419–5454, https://doi.org/10.1175/JCLI-D-16-0758.1, 2017.
Gettelman, A. and Morrison, H.: Advanced two-moment bulk microphysics for global models. Part I: off-line tests and comparison with other schemes, J. Climate, 28, 1268–1287, https://doi.org/10.1175/JCLI-D-14-00102.1, 2015.
Ghan, S. J. and Zaveri, R. A.: Parameterization of optical properties for hydrated internally mixed aerosol, J. Geophys. Res., 112, D10201, https://doi.org/10.1029/2006JD007927, 2007.
Ginoux, P., Chin, M., Tegen, I., Prospero, J. M., Holben, B., Dubovik, O., and Lin, S.-J.: Sources and distributions of dust aerosols simulated with the GOCART model, J. Geophys. Res., 106, 20255–20273, https://doi.org/10.1029/2000JD000053, 2001.
Golaz, J.-C., Larson, V. E., and Cotton, W. R.: A PDF-based model for boundary layer clouds. Part I: Method and model description, J. Atmos. Sci., 59, 3540–3551, https://doi.org/10.1175/1520-0469(2002)059<3540:APBMFB>2.0.CO;2, 2002.
Groot Zwaaftink, C. D., Grythe, H., Skov, H., and Stohl, A.: Substantial contribution of northern high-latitude sources to mineral dust in the Arctic, J. Geophys. Res.-Atmos., 121, 13678–13697, https://doi.org/10.1002/2016JD025482, 2016.
Hiranuma, N., Brooks, S. D., Moffet, R. C., Glen, A., Laskin, A., Gilles, M. K.m Liu, P., Macdonald, A. M., Strapp, J. W., and McFarquhar, G. M: Chemical characterization of individual particles and residuals of cloud droplets and ice crystals collected on board research aircraft in the ISDAC 2008 study, J. Geophys. Res.-Atmos., 118, 6564–6579, https://doi.org/10.1002/jgrd.50484, 2013.
Hofer, S., Tedstone, A. J., Fettweis, X., and Bamber, J. L.: Cloud microphysics and circulation anomalies control differences in future Greenland melt, Nat. Clim. Chang., 9, 523–528, https://doi.org/10.1038/s41558-019-0507-8, 2019.
Holben, B. N., Eck, T. F., Slutsker, I., Tanré, D., Buis, J. P., Setzer, A., Vermote, E., Reagan, J. A., Kaufman, Y. J., Nakajima, T., Lavenu, F., Jankowiak, I., and Smirnov, A.: AERONET – A Federated Instrument Network and Data Archive for Aerosol Characterization, Remote Sens. Environ., 66, 1–16, https://doi.org/10.1016/S0034-4257(98)00031-5, 1998.
Hoose, C. and Möhler, O.: Heterogeneous ice nucleation on atmospheric aerosols: a review of results from laboratory experiments, Atmos. Chem. Phys., 12, 9817–9854, https://doi.org/10.5194/acp-12-9817-2012, 2012.
Hoose, C., Kristjánsson, J. E., Chen, J.-P., and Hazra, A.: A classical-theory-based parameterization of heterogeneous ice nucleation by mineral dust, soot, and biological particles in a global climate model, J. Atmos. Sci., 67, 2483–2503, https://doi.org/10.1175/2010JAS3425.1, 2010.
Huang, Z., Huang, J., Hayasaka, T., Wang, S., Zhou, T., and Jin, H.: Short-cut transport path for Asian dust directly to the Arctic: a case study, Environ. Res. Lett., 10, 114018, https://doi.org/10.1088/1748-9326/10/11/114018, 2015.
Huneeus, N., Schulz, M., Balkanski, Y., Griesfeller, J., Prospero, J., Kinne, S., Bauer, S., Boucher, O., Chin, M., Dentener, F., Diehl, T., Easter, R., Fillmore, D., Ghan, S., Ginoux, P., Grini, A., Horowitz, L., Koch, D., Krol, M. C., Landing, W., Liu, X., Mahowald, N., Miller, R., Morcrette, J.-J., Myhre, G., Penner, J., Perlwitz, J., Stier, P., Takemura, T., and Zender, C. S.: Global dust model intercomparison in AeroCom phase I, Atmos. Chem. Phys., 11, 7781–7816, https://doi.org/10.5194/acp-11-7781-2011, 2011 (data available at: https://aerocom-classic.met.no/DATA/download/DUST_BENCHMARK_HUNEEUS2011/, last access: December 2018).
Irish, V. E., Hanna, S. J., Willis, M. D., China, S., Thomas, J. L., Wentzell, J. J. B., Cirisan, A., Si, M., Leaitch, W. R., Murphy, J. G., Abbatt, J. P. D., Laskin, A., Girard, E., and Bertram, A. K.: Ice nucleating particles in the marine boundary layer in the Canadian Arctic during summer 2014, Atmos. Chem. Phys., 19, 1027–1039, https://doi.org/10.5194/acp-19-1027-2019, 2019.
Jacob, D. J., Crawford, J. H., Maring, H., Clarke, A. D., Dibb, J. E., Emmons, L. K., Ferrare, R. A., Hostetler, C. A., Russell, P. B., Singh, H. B., Thompson, A. M., Shaw, G. E., McCauley, E., Pederson, J. R., and Fisher, J. A.: The Arctic Research of the Composition of the Troposphere from Aircraft and Satellites (ARCTAS) mission: design, execution, and first results, Atmos. Chem. Phys., 10, 5191–5212, https://doi.org/10.5194/acp-10-5191-2010, 2010.
Kato, S., Rose, F. G., Rutan, D. A., Thorsen, T. E., Loeb, N. G., Doelling, D. R., Huang, X., Smith, W. L., Su, W., and Ham, S.-H.: Surface irradiances of Edition 4.0 Clouds and the Earth's Radiant Energy System (CERES) Energy Balanced and Filled (EBAF) data product, J. Climate, 31, 4501–4527, https://doi.org/10.1175/JCLI-D-17-0523.1, 2018.
Khanal, S., Wang, Z., and French, J. R.: Improving middle and high latitude cloud liquid water path measurements from MODIS, Atmos. Res., 243, 105033, https://doi.org/10.1016/j.atmosres.2020.105033, 2020.
Kinne, S., Schulz, M., Textor, C., Guibert, S., Balkanski, Y., Bauer, S. E., Berntsen, T., Berglen, T. F., Boucher, O., Chin, M., Collins, W., Dentener, F., Diehl, T., Easter, R., Feichter, J., Fillmore, D., Ghan, S., Ginoux, P., Gong, S., Grini, A., Hendricks, J., Herzog, M., Horowitz, L., Isaksen, I., Iversen, T., Kirkevåg, A., Kloster, S., Koch, D., Kristjansson, J. E., Krol, M., Lauer, A., Lamarque, J. F., Lesins, G., Liu, X., Lohmann, U., Montanaro, V., Myhre, G., Penner, J., Pitari, G., Reddy, S., Seland, O., Stier, P., Takemura, T., and Tie, X.: An AeroCom initial assessment – optical properties in aerosol component modules of global models, Atmos. Chem. Phys., 6, 1815–1834, https://doi.org/10.5194/acp-6-1815-2006, 2006.
Kohfeld, K. E. and Harrison, S. P.: DIRTMAP: the geological record of dust, Earth-Sci. Rev., 54, 81–114, https://doi.org/10.1016/S0012-8252(01)00042-3, 2001.
Kok, J. F.: A scaling theory for the size distribution of emitted dust aerosols suggests climate models underestimate the size of the global dust cycle, P. Natl. Acad. Sci. USA, 108, 1016–1021, https://doi.org/10.1073/pnas.1014798108, 2011.
Kok, J. F., Mahowald, N. M., Fratini, G., Gillies, J. A., Ishizuka, M., Leys, J. F., Mikami, M., Park, M.-S., Park, S.-U., Van Pelt, R. S., and Zobeck, T. M.: An improved dust emission model – Part 1: Model description and comparison against measurements, Atmos. Chem. Phys., 14, 13023–13041, https://doi.org/10.5194/acp-14-13023-2014, 2014a.
Kok, J. F., Albani, S., Mahowald, N. M., and Ward, D. S.: An improved dust emission model – Part 2: Evaluation in the Community Earth System Model, with implications for the use of dust source functions, Atmos. Chem. Phys., 14, 13043–13061, https://doi.org/10.5194/acp-14-13043-2014, 2014b.
Kok, J. F., Ridley, D. A., Zhou, Q., Miller, R. L., Zhao, C., Heald, C. L., Ward, D. S., Albani, S., and Haustein, K.: Smaller desert dust cooling effect estimated from analysis of dust size and abundance, Nat. Geosci., 10, 274–278, https://doi.org/10.1038/ngeo2912, 2017.
Kulkarni, G., Sanders, C., Zhang, K., Liu, X., and Zhao, C.: Ice nucleation of bare and sulfuric acid-coated mineral dust particles and implication for cloud properties, J. Geophys. Res.-Atmos., 119, 9993–10011, https://doi.org/10.1002/2014JD021567, 2014.
Larson, V. E., Golaz, J.-C., and Cotton, W. R.: Small-Scale and Mesoscale Variability in Cloudy Boundary Layers: Joint Probability Density Functions, J. Atmos. Sci., 59, 3519–3539, https://doi.org/10.1175/1520-0469(2002)059<3519:SSAMVI>2.0.CO;2, 2002.
Liu, X., Xie, S., Boyle, J., Klein, S. A., Shi, X., Wang, Z., Lin, W., Ghan, S. J., Earle, M., Liu, P. S. K., and Zelenyuk, A.: Testing cloud microphysics parameterizations in NCAR CAM5 with ISDAC and M-PACE observations, J. Geophys. Res., 116, D00T11, https://doi.org/10.1029/2011JD015889, 2011.
Liu, X., Ma, P.-L., Wang, H., Tilmes, S., Singh, B., Easter, R. C., Ghan, S. J., and Rasch, P. J.: Description and evaluation of a new four-mode version of the Modal Aerosol Module (MAM4) within version 5.3 of the Community Atmosphere Model, Geosci. Model Dev., 9, 505–522, https://doi.org/10.5194/gmd-9-505-2016, 2016.
Loeb, N. G., Doelling, D. R., Wang, H., Su, W., Nguyen, C., Corbett, J. G., Liang, L., Mitrescu, C., Rose, F. G., and Kato, S.: Clouds and the Earth's Radiant Energy System (CERES) Energy Balanced and Filled (EBAF) Top-of-Atmosphere (TOA) Edition-4.0 Data Product, J. Climate, 31, 895–918, https://doi.org/10.1175/JCLI-D-17-0208.1, 2018.
Luo, C., Mahowald, N. M., and Corral, J. del: Sensitivity study of meteorological parameters on mineral aerosol mobilization, transport, and distribution, J. Geophys. Res., 108, 4447, https://doi.org/10.1029/2003JD003483, 2003.
Luo, T., Wang, Z., Ferrare, R. A., Hostetler, C. A., Yuan, R., and Zhang, D.: Vertically resolved separation of dust and other aerosol types by a new lidar depolarization method, Opt. Express, 23, 14095–14107, https://doi.org/10.1364/OE.23.014095, 2015a.
Luo, T., Wang, Z., Zhang, D., Liu, X., Wang, Y., and Yuan, R.: Global dust distribution from improved thin dust layer detection using A-train satellite lidar observations, Geophys. Res. Lett., 42, 620–628, https://doi.org/10.1002/2014GL062111, 2015b.
Maenhaut, W., Fernandez-Jimenez, M.-T., Rajta, I., Dubtsov, S., Meixner, F. X., Andreae, M. O., Torr, S., Hargrove, J. W., Chimanga, P., and Mlambo, J.: Long-term aerosol composi- tion measruments and source apportionment at Rukomechi, Zimbabwe, J. Aerosol Sci., 31, S469–S470, 2000a.
Maenhaut, W., Fernandez-Jimenez, M.-T., Vanderzalm, J. L., Hooper, B. M., Hooper, M. A., and Tapper, N. J.: Aerosol composition at Jabiru, Australia and impact of biomass burning, J. Aerosol Sci., 31, S745–S746, 2000b.
Mahowald, N. M., Engelstaedter, S., Luo, C., Sealy, A., Artaxo, P., Benitez-Nelson, C., Bonnet, S., Chen, Y., Chuang, P. Y., Cohen, D. D., Dulac, F., Herut, B., Johansen, A. M., Kubilay, N., Losno, R., Maenhaut, W., Paytan, A., Prospero, J. M., Shank, L. M., and Siefert, R. L.: Atmospheric iron deposition: global distribution, variability, and human perturbations, Ann. Rev. Mar. Sci., 1, 245–278, https://doi.org/10.1146/annurev.marine.010908.163727, 2009.
Malm, W. C., Sisler, J. F., Huffman, D., Eldred, R. A., and Cahill, T. A.: Spatial and seasonal trends in particle concentration and optical extinction in the United States, J. Geophys. Res.-Atmos., 99, 1347–1370, https://doi.org/10.1029/93JD02916, 1994 (data available at: http://vista.cira.colostate.edu/Improve/data-page/, last access: January 2021).
Mason, R. H., Si, M., Chou, C., Irish, V. E., Dickie, R., Elizondo, P., Wong, R., Brintnell, M., Elsasser, M., Lassar, W. M., Pierce, K. M., Leaitch, W. R., MacDonald, A. M., Platt, A., Toom-Sauntry, D., Sarda-Estève, R., Schiller, C. L., Suski, K. J., Hill, T. C. J., Abbatt, J. P. D., Huffman, J. A., DeMott, P. J., and Bertram, A. K.: Size-resolved measurements of ice-nucleating particles at six locations in North America and one in Europe, Atmos. Chem. Phys., 16, 1637–1651, https://doi.org/10.5194/acp-16-1637-2016, 2016.
McCluskey, C. S., Ovadnevaite, J., Rinaldi, M., Atkinson, J., Belosi, F., Ceburnis, D., Marullo, S., Hill, T. C. J., Lohmann, U., Kanji, Z. A., O'Dowd, C., Kreidenweis, S. M., and DeMott, P. J.: Marine and terrestrial organic ice-nucleating particles in pristine marine to continentally influenced Northeast Atlantic air masses, J. Geophys. Res.-Atmos., 123, 6196–6212, https://doi.org/10.1029/2017JD028033, 2018.
McFarquhar, G. M., Ghan, S., Verlinde, J., Korolev, A., Strapp, J. W., Schmid, B., Tomlinson, J. M., Wolde, M., Brooks, S. D., Cziczo, D., Dubey, M. K., Fan, J., Flynn, C., Gultepe, I., Hubbe, J., Gilles, M. K., Laskin, A., Lawson, P., Leaitch, W. R., Liu, P., Liu, X., Lubin, D., Mazzoleni, C., Macdonald, A.-M., Moffet, R. C., Morrison, H., Ovchinnikov, M., Shupe, M. D., Turner, D. D., Xie, S., Zelenyuk, A., Bae, K., Freer, M., and Glen, A.: Indirect and Semi-direct Aerosol Campaign: The Impact of Arctic Aerosols on Clouds, B. Am. Meteorol. Soc., 92, 183–201, https://doi.org/10.1175/2010BAMS2935.1, 2011.
Morrison, H., de Boer, G., Feingold, G., Harrington, J., Shupe, M. D., and Sulia, K.: Resilience of persistent Arctic mixed-phase clouds, Nat. Geosci., 5, 11–17, https://doi.org/10.1038/ngeo1332, 2012.
Murray, B. J., O'Sullivan, D., Atkinson, J. D., and Webb, M. E.: Ice nucleation by particles immersed in supercooled cloud droplets, Chem. Soc. Rev., 41, 6519–6554, https://doi.org/10.1039/c2cs35200a, 2012.
NASA: Aerosol Robotic Network (AERONET), https://aeronet.gsfc.nasa.gov, last access: December 2020.
NASA: Arctic Research of the Composition of the Troposphere from Aircraft and Satellites (ARCTAS), https://www-air.larc.nasa.gov/missions/arctas/arctas.html, last access: August 2021a.
NASA: CERES EBAF – Level 3b, https://ceres.larc.nasa.gov/data/#ebaf-level-3, last access: November 2021b.
Paramonov, M., David, R. O., Kretzschmar, R., and Kanji, Z. A.: A laboratory investigation of the ice nucleation efficiency of three types of mineral and soil dust, Atmos. Chem. Phys., 18, 16515–16536, https://doi.org/10.5194/acp-18-16515-2018, 2018.
Platnick, S., Ackerman, S., King, M., Wind, G., Meyer, K., Menzel, P., Frey, R., Holz, R., Baum, B., and Yang, P.: MOD06_L2 – MODIS/Terra Clouds 5-Min L2 Swath 1km and 5km, NASA MODIS Adaptive Processing System, Goddard Space Flight Center [data], https://doi.org/10.5067/MODIS/MOD06_L2.061, 2017a.
Platnick, S., Ackerman, S., King, M., Wind, G., Meyer, K., Menzel, P., Frey, R., Holz, R., Baum, B., and Yang, P.: MYD06_L2 – MODIS/Aqua Clouds 5-Min L2 Swath 1km and 5km, NASA MODIS Adaptive Processing System, Goddard Space Flight Center [data], https://doi.org/10.5067/MODIS/MYD06_L2.061, 2017b.
Pincus, R., Platnick, S., Ackerman, S. A., Hemler, R. S., and Hofmann, R. J. P.: Reconciling Simulated and Observed Views of Clouds: MODIS, ISCCP, and the Limits of Instrument Simulators, J. Climate, 25, 4699–4720, https://doi.org/10.1175/JCLI-D-11-00267.1, 2012.
Prenni, A. J., Harrington, J. Y., Tjernström, M., DeMott, P. J., Avramov, A., Long, C. N., Kreidenweis, S. M., Olsson, P. Q., and Verlinde, J.: Can ice-nucleating aerosols affect Arctic seasonal climate?, B. Am. Meteorol. Soc., 88, 541–550, https://doi.org/10.1175/BAMS-88-4-541, 2007.
Prenni, A. J., Demott, P. J., Rogers, D. C., Kreidenweis, S. M., Mcfarquhar, G. M., Zhang, G., and Poellot, M. R.: Ice nuclei characteristics from M-PACE and their relation to ice formation in clouds, Tellus B, 61, 436–448, https://doi.org/10.1111/j.1600-0889.2009.00415.x, 2009.
Prospero, J. M.: The Atmospheric Transport of Particles to the Ocean, in: Particle Flux in the Ocean, edited by: Ittekkot, V., Schäfer, P., Honjo, S., and Depetris, P. J., John Wiley & Sons Ltd., New York, ISBN 047196073X, 978-04-7196-073-7, 1996.
Prospero, J. M., Uematsu, M., and Savoie, D. L.: Mineral aerosol transport to the Pacific Ocean, edited by: Riley, J. P., Academic Press, New York, 187–218, ISBN 0125886101, 1989.
Prospero, J. M., Bullard, J. E., and Hodgkins, R.: High-Latitude Dust Over the North Atlantic: Inputs from Icelandic Proglacial Dust Storms, Science, 335, 1078–1082, https://doi.org/10.1126/science.1217447, 2012.
Rasch, P. J., Xie, S., Ma, P.-L., Lin, W., Wang, H., Tang, Q., Burrows, S. M., Caldwell, P., Zhang, K., Easter, R. C., Cameron-Smith, P., Singh, B., Wan, H., Golaz, J.-C., Harrop, B. E., Roesler, E., Bacmeister, J., Larson, V. E., Evans, K. J., Qian, Y., Taylor, M., Leung, L. R., Zhang, Y., Brent, L., Branstetter, M., Hannay, C., Mahajan, S., Mametjanov, A., Neale, R., Richter, J. H., Yoon, J. -H., Zender, C. S., Bader, D., Flanner, M., Foucar, J. G., Jacob, R., Keen, N., Klein, S. A., Liu, X., Salinger, A. G., Shrivastava, M., and Yang, Y.: An overview of the atmospheric component of the Energy Exascale Earth System Model, J. Adv. Model. Earth Syst., 11, 2377–2411, https://doi.org/10.1029/2019MS001629, 2019.
Ridley, D. A., Heald, C. L., Kok, J. F., and Zhao, C.: An observationally constrained estimate of global dust aerosol optical depth, Atmos. Chem. Phys., 16, 15097–15117, https://doi.org/10.5194/acp-16-15097-2016, 2016.
Sanchez-Marroquin, A., Arnalds, O., Baustian-Dorsi, K. J., Browse, J., Dagsson-Waldhauserova, P., Harrison, A. D., Maters, E. C., Pringle, K. J., Vergara-Temprado, J., Burke, I. T., McQuaid, J. B., Carslaw, K. S., and Murray, B. J.: Iceland is an episodic source of atmospheric ice-nucleating particles relevant for mixed-phase clouds, Sci. Adv., 6, eaba8137, https://doi.org/10.1126/sciadv.aba8137, 2020.
Schill, G. P., DeMott, P. J., Emerson, E. W., Rauker, A. M. C., Kodros, J. K., Suski, K. J., Hill, T. C. J., Levin, E. J. T., Pierce, J. R., Farmer, D. K., and Kreidenweis, S. M.: The contribution of black carbon to global ice nucleating particle concentrations relevant to mixed-phase clouds, P. Natl. Acad. Sci. USA, 117, 22705–22711, https://doi.org/10.1073/pnas.2001674117, 2020.
Schweiger, A. J., Lindsay, R. W., Vavrus, S., and Francis, J. A.: Relationships between Arctic sea ice and clouds dusting autumn, J. Climate, 21, 4799–4810, https://doi.org/10.1175/2008JCLI2156.1, 2008.
Shao, Y., Wyrwoll, K.-H., Chappell, A., Huang, J., Lin, Z., McTainsh, G. H., Mikami, M., Tanaka, T. Y., Wang, X., and Yoon, S.: Dust cycle: An emerging core theme in Earth system science, Aeolian Res., 2, 181–204, https://doi.org/10.1016/j.aeolia.2011.02.001, 2011.
Shi, Y. and Liu, X.: Dust Radiative Effects on Climate by Glaciating Mixed-Phase Clouds, Geophys. Res. Lett., 46, 6128–6137, https://doi.org/10.1029/2019GL082504, 2019.
Shupe, M. D. and Intrieri, J. M.: Cloud Radiative Forcing of the Arctic Surface: The Influence of Cloud Properties, Surface Albedo, and Solar Zenith Angle, J. Climate, 17, 616–628, https://doi.org/10.1175/1520-0442(2004)017<0616:CRFOTA>2.0.CO;2, 2004.
Si, M., Evoy, E., Yun, J., Xi, Y., Hanna, S. J., Chivulescu, A., Rawlings, K., Veber, D., Platt, A., Kunkel, D., Hoor, P., Sharma, S., Leaitch, W. R., and Bertram, A. K.: Concentrations, composition, and sources of ice-nucleating particles in the Canadian High Arctic during spring 2016, Atmos. Chem. Phys., 19, 3007–3024, https://doi.org/10.5194/acp-19-3007-2019, 2019.
Sirois, A. and Barrie, L. A.: Arctic lower tropospheric aerosol trends and composition at Alert, Canada: 1980–1995, J. Geophys. Res.-Atmos., 104, 11599–11618, https://doi.org/10.1029/1999JD900077, 1999.
Smirnov, A., Holben, B. N., Eck, T. F., Dubovik, O., and Slutsker, I.: Cloud screening and quality control algorithms for the AERONET database, Remote Sens. Environ., 73, 337–349, https://doi.org/10.1016/S0034-4257(00)00109-7, 2000.
Stohl, A.: Characteristics of atmospheric transport into the Arctic troposphere, J. Geophys. Res., 111, D11306, https://doi.org/10.1029/2005JD006888, 2006.
Stone, R., Anderson, G., Andrews, E., Dutton, E., Harris, J., Shettle, E., and Berk, A.: Asian dust signatures at Barrow: observed and simulated. Incursions and impact of Asian dust over Northern Alaska, Workshop on Remote Sensing of Atmospheric Aerosols, IEEE Workshop on Remote Sensing of Atmospheric Aerosols, 5–6 April 2005, Tucson, AZ, USA, 74–79, https://doi.org/10.1109/AERSOL.2005.1494152, 2005.
Tan, I. and Storelvmo, T.: Sensitivity study on the influence of cloud microphysical parameters on mixed-phase cloud thermodynamic phase partitioning in CAM5, J. Atmos. Sci., 73, 709–728, https://doi.org/10.1175/JAS-D-15-0152.1, 2016.
Tan, I. and Storelvmo, T.: Evidence of Strong Contributions from Mixed-Phase Clouds to Arctic Climate Change, Geophys. Res. Lett., 46, 2894–2902, https://doi.org/10.1029/2018GL081871, 2019.
Tanaka, T. Y. and Chiba, M.: A numerical study of the contributions of dust source regions to the global dust budget, Glob. Planet. Change, 52, 88–104, https://doi.org/10.1016/j.gloplacha.2006.02.002, 2006.
Tegen, I., Harrison, S. P., Kohfeld, K., Prentice, I. C., Coe, M., and Heimann, M.: Impact of vegetation and preferential source areas on global dust aerosol: Results from a model study, J. Geophys. Res.-Atmos., 107, AAC 14-1–AAC 14-27, https://doi.org/10.1029/2001JD000963, 2002.
Tobo, Y., Adachi, K., DeMott, P. J., Hill, T. C. J., Hamilton, D. S., Mahowald, N. M., Nagatsuka, N., Ohata, S., Uetake, J., Kondo, Y., and Koike, M.: Glacially sourced dust as a potentially significant source of ice nucleating particles, Nat. Geosci., 12, 253–258, https://doi.org/10.1038/s41561-019-0314-x, 2019.
Vali, G.: Nucleation terminology, B. Am. Meteorol. Soc., 66, 1426–1427, 1985.
Vali, G., DeMott, P. J., Möhler, O., and Whale, T. F.: Technical Note: A proposal for ice nucleation terminology, Atmos. Chem. Phys., 15, 10263–10270, https://doi.org/10.5194/acp-15-10263-2015, 2015.
VanCuren, R. A., Cahill, T., Burkhart, J., Barnes, D., Zhao, Y., Perry, K., Cliff, S., and McConnell, J.: Aerosols and their sources at Summit Greenland – First results of continuous size- and time-resolved sampling, Atmos. Environ., 52, 82–97, https://doi.org/10.1016/j.atmosenv.2011.10.047, 2012.
Wang, H., Rasch, P. J., Easter, R. C., Singh, B., Zhang, R., Ma, P.-L., Qian, Y., Ghan, S. J., and Beagley, N.: Using an explicit emission tagging method in global modeling of source-receptor relationships for black carbon in the Arctic: Variations, sources, and transport pathways, J. Geophys. Res.-Atmos., 119, 12888–12909, https://doi.org/10.1002/2014JD022297, 2014.
Wang, H., Easter, R. C., Zhang, R., Ma, P.-L., Singh, B., Zhang, K., Ganguly, D., Rasch, P. J., Burrows, S. M., Ghan, S. J., Lou, S., Qian, Y., Yang, Y., Feng, Y., Flanner, M., Leung, L. R., Liu, X., Shrivastava, M., Sun, J., Tang, Q., Xie, S., and Yoon, J.: Aerosols in the E3SM Version 1: New Developments and Their Impacts on Radiative Forcing, J. Adv. Model. Earth Syst., 12, e2019MS001851, https://doi.org/10.1029/2019MS001851, 2020.
Wang, Y., Liu, X., Hoose, C., and Wang, B.: Different contact angle distributions for heterogeneous ice nucleation in the Community Atmospheric Model version 5, Atmos. Chem. Phys., 14, 10411–10430, https://doi.org/10.5194/acp-14-10411-2014, 2014.
Westbrook, C. D. and Illingworth, A. J.: The formation of ice in a long-lived supercooled layer cloud: Ice Formation in Altocumulus, Q. J. R. Meteorol. Soc., 139, 2209–2221, https://doi.org/10.1002/qj.2096, 2013.
Wilson, T. W., Ladino, L. A., Alpert, P. A., Breckels, M. N., Brooks, I. M., Browse, J., Burrows, S. M., Carslaw, K. S., Huffman, J. A., Judd, C., Kilthau, W. P., Mason, R. H., McFiggans, G., Miller, L. A., Nájera, J. J., Polishchuk, E., Rae, S., Schiller, C. L., Si, M., Vergara-Temprado, J., Whale, T. F., Wong, J. P. S., Wurl, O., Yakobi-Hancock, J. D., Abbatt, J. P. D., Aller, J. Y., Bertram, A. K., Knopf, D. A., and Murray, B. J.: A marine biogenic source of atmospheric ice-nucleating particles, Nature, 525, 234–238, https://doi.org/10.1038/nature14986, 2015.
Winker, D. M., Tackett, J. L., Getzewich, B. J., Liu, Z., Vaughan, M. A., and Rogers, R. R.: The global 3-D distribution of tropospheric aerosols as characterized by CALIOP, Atmos. Chem. Phys., 13, 3345–3361, https://doi.org/10.5194/acp-13-3345-2013, 2013.
Wu, M., Liu, X., Yu, H., Wang, H., Shi, Y., Yang, K., Darmenov, A., Wu, C., Wang, Z., Luo, T., Feng, Y., and Ke, Z.: Understanding processes that control dust spatial distributions with global climate models and satellite observations, Atmos. Chem. Phys., 20, 13835–13855, https://doi.org/10.5194/acp-20-13835-2020, 2020.
Yang, K., Wang, Z., Luo, T., Liu, X., and Wu, M.: Upper troposphere dust belt formation processes vary seasonally and spatially in the Northern Hemisphere, Commun. Earth Environ., 3, 24, https://doi.org/10.1038/s43247-022-00353-5, 2022.
Yang, Y., Wang, H., Smith, S. J., Easter, R., Ma, P.-L., Qian, Y., Yu, H., Li, C., and Rasch, P. J.: Global source attribution of sulfate concentration and direct and indirect radiative forcing, Atmos. Chem. Phys., 17, 8903–8922, https://doi.org/10.5194/acp-17-8903-2017, 2017a.
Yang, Y., Wang, H., Smith, S. J., Ma, P.-L., and Rasch, P. J.: Source attribution of black carbon and its direct radiative forcing in China, Atmos. Chem. Phys., 17, 4319–4336, https://doi.org/10.5194/acp-17-4319-2017, 2017b.
Yang, Y., Wang, H., Smith, S. J., Zhang, R., Lou, S., Yu, H., Li, C., and Rasch, P. J.: Source Apportionments of Aerosols and Their Direct Radiative Forcing and Long-Term Trends Over Continental United States, Earth's Future, 6, 793–808, https://doi.org/10.1029/2018EF000859, 2018.
Zender, C. S., Bian, H., and Newman, D.: Mineral Dust Entrainment and Deposition (DEAD) model: Description and 1990s dust climatology, J. Geophys. Res., 108, 4416, https://doi.org/10.1029/2002JD002775, 2003.
Zhang, G. J. and McFarlane, N. A.: Sensitivity of climate simulations to the parameterization of cumulus convection in the Canadian climate centre general circulation model, Atmos.-Ocean, 33, 407–446, https://doi.org/10.1080/07055900.1995.9649539, 1995.
Zhang, K., Wan, H., Liu, X., Ghan, S. J., Kooperman, G. J., Ma, P.-L., Rasch, P. J., Neubauer, D., and Lohmann, U.: Technical Note: On the use of nudging for aerosol–climate model intercomparison studies, Atmos. Chem. Phys., 14, 8631–8645, https://doi.org/10.5194/acp-14-8631-2014, 2014.
Zhang, M., Liu, X., Diao, M., D'Alessandro, J. J., Wang, Y., Wu, C., Zhang, D., Wang, Z., and Xie, S.: Impacts of representing heterogeneous distribution of cloud liquid and ice on phase partitioning of Arctic mixed-phase clouds with NCAR CAM5, J. Geophys. Res.-Atmos., 124, 13071–13090, https://doi.org/10.1029/2019JD030502, 2019.
Zhang, M., Xie, S., Liu, X., Lin, W., Zhang, K., Ma, H.-Y., Zheng, X., and Zhang, Y.: Toward understanding the simulated phase partitioning of Arctic single-layer mixed-phase clouds in E3SM, Earth Space Sci., 7, e2020EA001125, https://doi.org/10.1029/2020EA001125, 2020.
Zhang, Y., Xie, S., Lin, W., Klein, S. A., Zelinka, M., Ma, P., Rasch, P. J., Qian, Y., Tang, Q., and Ma, H.: Evaluation of clouds in version 1 of the E3SM atmosphere model with satellite simulators, J. Adv. Model. Earth Syst., 11, 1253–1268, https://doi.org/10.1029/2018MS001562, 2019.
Zhao, X. and Liu, X.: Global Importance of Secondary Ice Production, Geophys. Res. Lett., 48, e2021GL092581, https://doi.org/10.1029/2021GL092581, 2021.
Zhao, X., Liu, X., Burrows, S. M., and Shi, Y.: Effects of marine organic aerosols as sources of immersion-mode ice-nucleating particles on high-latitude mixed-phase clouds, Atmos. Chem. Phys., 21, 2305–2327, https://doi.org/10.5194/acp-21-2305-2021, 2021a.
Zhao, X., Liu, X., Phillips, V. T. J., and Patade, S.: Impacts of secondary ice production on Arctic mixed-phase clouds based on ARM observations and CAM6 single-column model simulations, Atmos. Chem. Phys., 21, 5685–5703, https://doi.org/10.5194/acp-21-5685-2021, 2021b.