the Creative Commons Attribution 4.0 License.
the Creative Commons Attribution 4.0 License.
 | 16 Feb 2022
Importance of aerosols and shape of the cloud droplet size distribution for convective clouds and precipitation
Christian Barthlott
Amirmahdi Zarboo
Takumi Matsunobu
Christian Keil
The predictability of deep moist convection is subject to large uncertainties resulting from inaccurate initial and boundary data, the incomplete description of physical processes, or microphysical uncertainties. In this study, we investigate the response of convective clouds and precipitation over central Europe to varying cloud condensation nuclei (CCN) concentrations and different shape parameters of the cloud droplet size distribution (CDSD), both of which are not well constrained by observations. We systematically evaluate the relative impact of these uncertainties in realistic convection-resolving simulations for multiple cases with different synoptic controls using the new icosahedral non-hydrostatic ICON model. The results show a large systematic increase in total cloud water content with increasing CCN concentrations and narrower CDSDs, together with a reduction in the total rain water content. This is related to a suppressed warm-rain formation due to a less efficient collision–coalescence process. It is shown that the evaporation at lower levels is responsible for diminishing these impacts on surface precipitation, which lies between +13 % and −16 % compared to a reference run with continental aerosol assumption. In general, the precipitation response was larger for weakly forced cases. We also find that the overall timing of convection is not sensitive to the microphysical uncertainties applied, indicating that different rain intensities are responsible for changing precipitation totals at the ground. Furthermore, weaker rain intensities in the developing phase of convective clouds can allow for a higher convective instability at later times, which can lead to a turning point with larger rain intensities later on. The existence of such a turning point and its location in time can have a major impact on precipitation totals. In general, we find that an increase in the shape parameter can produce almost as large a variation in precipitation as a CCN increase from maritime to polluted conditions. The narrowing of the CDSD not only decreases the absolute values of autoconversion and accretion but also decreases the relative role of the warm-rain formation in general, independent of the prevailing weather regime.
We further find that increasing CCN concentrations reduce the effective radius of cloud droplets in a stronger manner than larger shape parameters. The cloud optical depth, however, reveals a similarly large increase with larger shape parameters when changing the aerosol load from maritime to polluted. By the frequency of updrafts as a function of height, we show a negative aerosol effect on updraft strength, leading to an enervation of deep convection. These findings demonstrate that both the CCN assumptions and the CDSD shape parameter are important for quantitative precipitation forecasting and should be carefully chosen if double-moment schemes are used for modeling aerosol–cloud interactions.
- Article
(9612 KB) - Full-text XML
- BibTeX
- EndNote


Despite recent improvements in numerical weather forecasting by, e.g., higher grid resolution, improved parameterizations of physical processes, ensemble modeling strategies, or post-processing techniques, the accurate forecast of convective precipitation is still a challenge for state-of-the-art numerical weather prediction (NWP) models. Cloud formation, and subsequent precipitation, results from a chain of complex processes in the atmosphere and is, therefore, accompanied by numerous uncertainties in its formation (e.g., Schneider et al., 2019). Many aspects influence the predictability of convective precipitation, e.g., the synoptic-scale flow, the presence of mountains, and the heterogeneity of the land surface. In current convection-permitting ensemble modeling systems, the uncertainties in the initial and lateral boundary conditions and uncertainties in the representation of physical processes are accounted for (e.g., Clark et al., 2016; Barthlott and Barrett, 2020, and references therein). Large uncertainties also arise from the nonlinear character of the microphysics and the complexity of the microphysical system with many possible process pathways (Seifert et al., 2012; Schneider et al., 2019).
Aerosol–cloud interactions are considered to be one of the most uncertain processes in NWP models (e.g., Tao et al., 2012; Altaratz et al., 2014; Fan et al., 2016; Barthlott and Hoose, 2018). In general, it is assumed that the activation of aerosol particles, acting as cloud condensation nuclei (CCN), into cloud droplets leads to more numerous and smaller cloud droplets in situations with high aerosol load. The smaller droplet size then suppresses the onset of precipitation in warm clouds due to a reduction of the collision–coalescence process, leading to a longer cloud lifetime (lifetime effect; Albrecht, 1989). In polluted conditions, the larger water load at the freezing level can result in an additional release of latent heat, which can lead to an invigoration of the convective clouds with increased precipitation amounts (Rosenfeld et al., 2008). The impact of aerosols on cloud formation and precipitation has been shown to differ between cloud types, the aerosol regime, and environmental conditions (e.g., Seifert and Beheng, 2006b; Khain et al., 2008; van den Heever et al., 2011; Tao et al., 2012; Barthlott et al., 2017). In a model intercomparison effort for a convective case near Houston (Texas), Marinescu et al. (2021) demonstrated that the participating models showed several consistent trends, but the change in the number of deep convective updrafts through varying CCN concentrations varies significantly. These differences may be related to the differences in the evolution of the environmental conditions within the models. By comparing the relative contributions of varied aerosol concentrations, soil moisture heterogeneities, and a stochastic boundary layer perturbation scheme for a 10 d period of high-impact weather in central Europe, Keil et al. (2019) found that perturbed aerosol concentrations impact the spatial precipitation variability already from the model start onwards but to a smaller degree than the other perturbations. In the study by Barthlott and Hoose (2018), a novel technique to modify the environmental atmospheric conditions in realistic simulations was introduced. They modified the initial and boundary temperature profiles with a linearly increasing increment for six cases classified into weak and strong synoptic-scale forcing. Results show that more accurate environmental conditions are more important than accurate aerosol assumptions, especially for weak forcing. The aerosol effect, however, is non-negligible and systematic for strongly forced cases but non-systematic and largest for weakly forced cases. The decrease in total precipitation with increasing aerosol load for strong synoptic forcing was due to the suppression of the warm-rain process, also documented by, e.g., Tao et al. (2012); Storer and van den Heever (2013). By means of idealized simulations, Grant and van den Heever (2015) showed that the altitude of dry layers is important for the development of deep convective clouds, and that the impact of aerosols varies inversely with the storm organization. Barthlott et al. (2017) similarly highlighted the importance of the evaporation of raindrops in simulations for the 2014 Pentecost storm over Germany. They found a systematic relationship among condensate amounts of cloud water, rain, and ice with increasing CCN but evaporation at lower levels led to a non-systematic response of accumulated precipitation.
Another source of uncertainty lies in the width of the cloud droplet size distribution (CDSD), as CCN conditions also influence the size distribution of the nucleated droplets. The underlying generalized Gamma distribution is as follows:
and depends on the shape parameter ν and dispersion parameter μ as a function of the particle mass x. A and λ can be calculated from the predicted mass and number densities. This function reduces to the classical Γ distribution with μ=1, to the Weibull distribution with , and to the exponential distribution with as a function of particle mass (Seifert and Beheng, 2006a). Instead of the particle mass x, the size distribution can also be formulated as a function of the diameter D, using the relation for spherical particles as follows (Khain et al., 2015):
with , , , and . N0 is the intercept parameter and ρ the bulk hydrometeor density. The shape parameter controls the width of the size distribution, which has important implications for the microphysical processes, e.g., autoconversion and evaporation. A higher shape parameter is supposed to suppress autoconversion (e.g., Seifert and Beheng, 2001), leading to higher droplet number concentrations. The droplet size distribution also plays a crucial role in determining the radiative properties of clouds. The width of the CDSD is not well constrained by observations but important for accurately predicting condensation and evaporation rates (Igel and van den Heever, 2017a). Previous observational studies showed the large range in shape parameters values of f(D) based on cloud type and environmental conditions ranging between 0–14 (e.g., Levin, 1958; Gossard, 1994; Miles et al., 2000; Martins and Silva Dias, 2009).
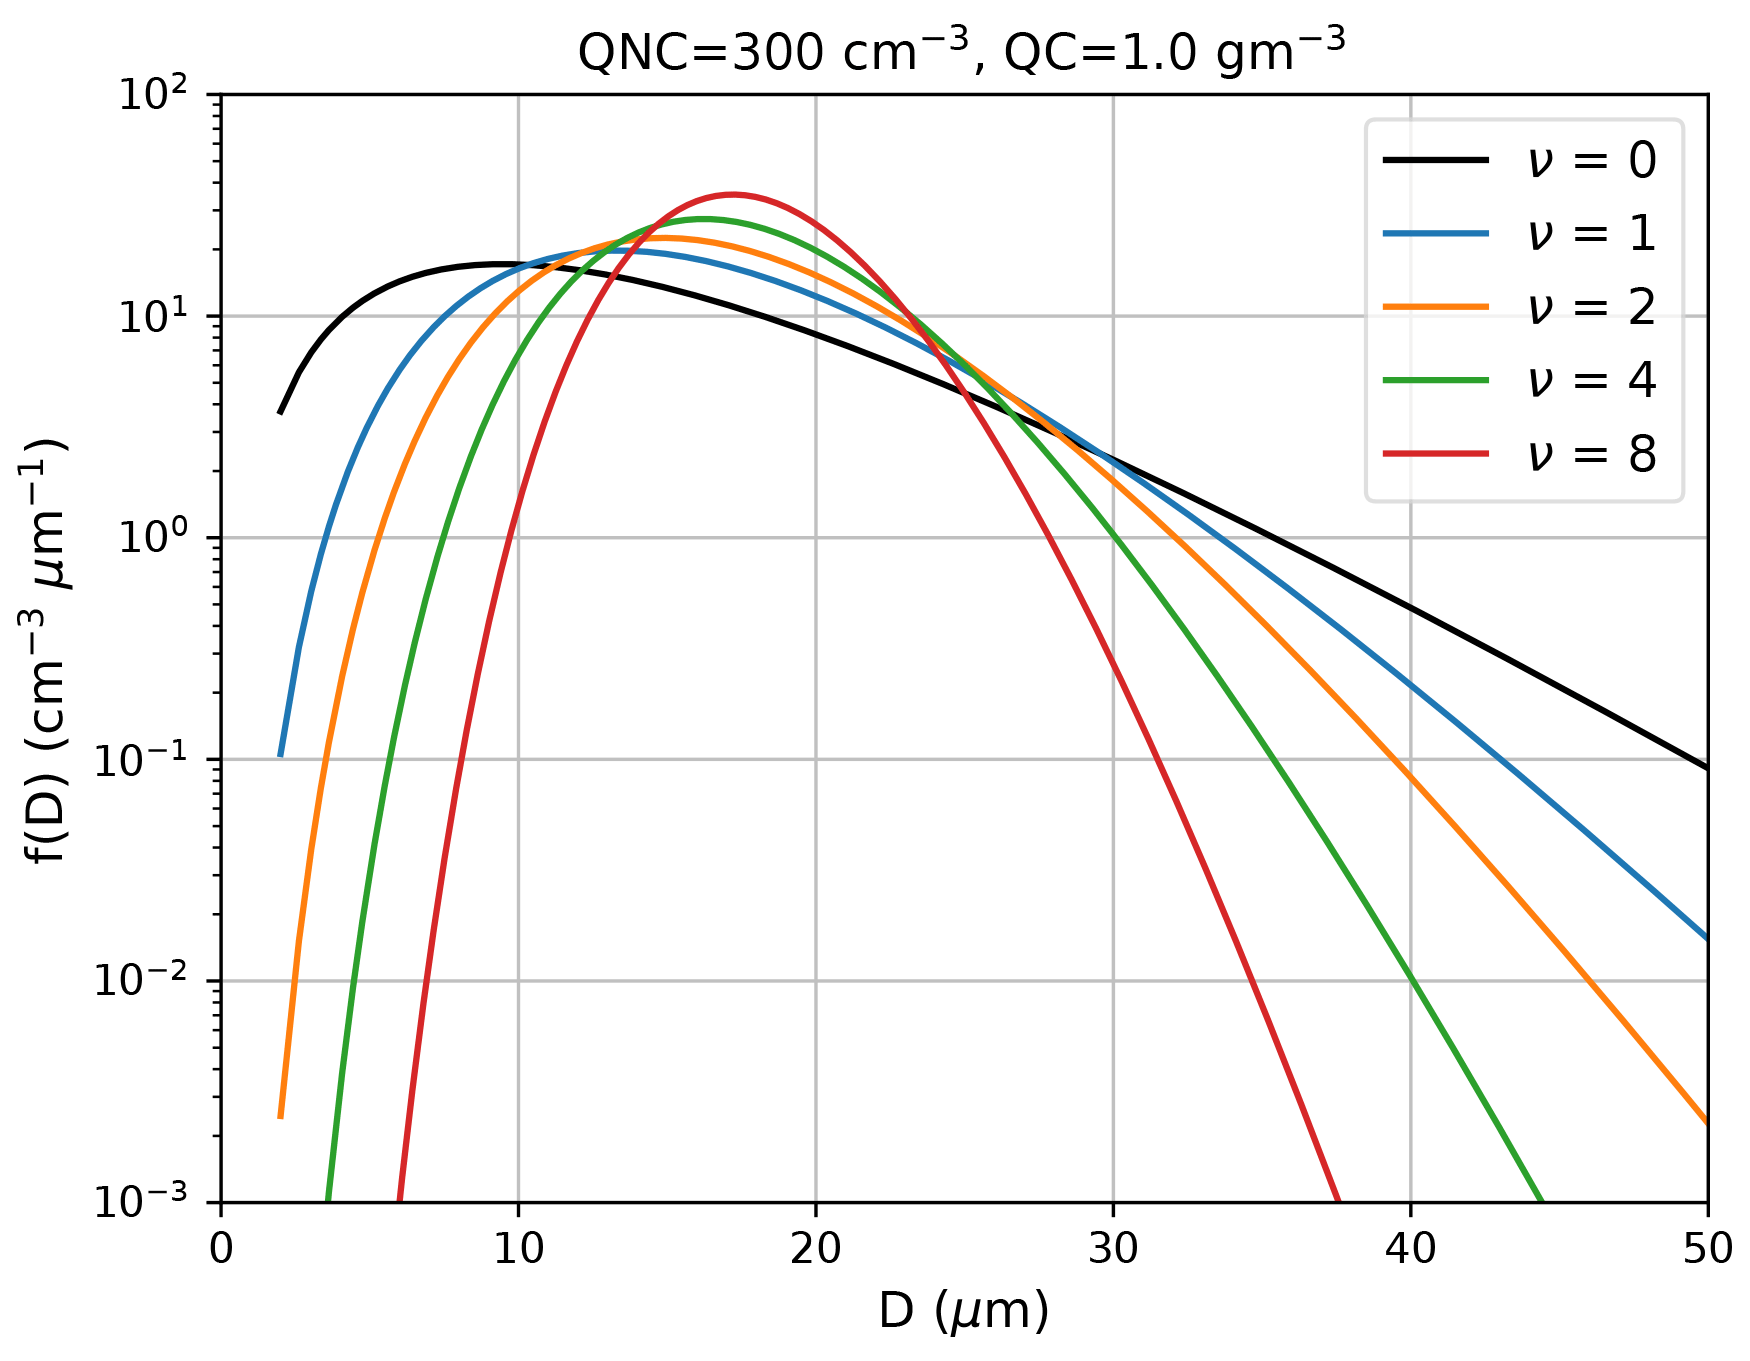
Figure 1Cloud droplet size distributions for different values of the shape parameter ν at fixed cloud water content (QC) and cloud droplet number concentration (QNC). D denotes the diameter of the droplets.
Figure 1 presents Gamma size distributions with different shape parameters for a fixed cloud water content (QC) and cloud droplet number concentration (QNC) as a function of particle diameter D, using a dispersion parameter μ=0.33. It can be seen that increasing the shape parameter narrows the size distribution. An important point is the fact that, with a low shape parameter, the curves show more small droplets but also more large droplets leading to a larger effective radius, which is the relevant parameter for determining the cloud optical properties. This was also documented by Morrison and Grabowski (2007), who found that higher shape parameters result in a decrease in the effective radius. Previous modeling studies on the impact of the shape parameter are rare and were mostly based on idealized simulations. For example, using large-eddy simulations of non-precipitating shallow cumulus clouds, Igel and van den Heever (2017c) have shown that evaporation rates are much more sensitive to the values of the shape parameter than to the condensation rates. As a result, cloud properties such as droplet number concentration, mean droplet diameter, and cloud fraction were strongly impacted, and changes were found to be of the same order of magnitude as changes, due to increasing or decreasing the aerosol concentration, by a factor of 16 (Igel and van den Heever, 2017c). This documents (i) a need to further assess the impacts of the chosen CDSD parameters on various cloud types in different weather regimes and (ii) to evaluate the suitability of including shape parameter uncertainties in ensemble forecasting.
In this study, we therefore expand this line of investigation by perturbing the shape parameter of the CDSD for precipitating clouds in real-case simulations. In addition, different aerosol amounts ranging from low CCN concentrations (representing maritime conditions) to very high CCN concentrations (representing continental polluted conditions) are assessed. By comparing the effect of the ambient aerosol amount to changes in the shape parameter, we can quantify their relative impact on the forecast of convective precipitation. To cover different weather regimes, these analyses will be conducted for situations with both weak and strong synoptic forcing. Another goal is to determine if and how the large range of possible shape parameters from observations (see, e.g., Table 1 in Igel and van den Heever, 2017b) impacts the simulation results. Moreover, we want to investigate if the sensitivity to the shape parameter can induce larger precipitation changes than the ones from different CCN concentrations. The unique aspect of this work is the fact that it is the first to systematically evaluate the relative impact of CCN concentrations and uncertainties in the CDSD for multiple cases with different synoptic controls.
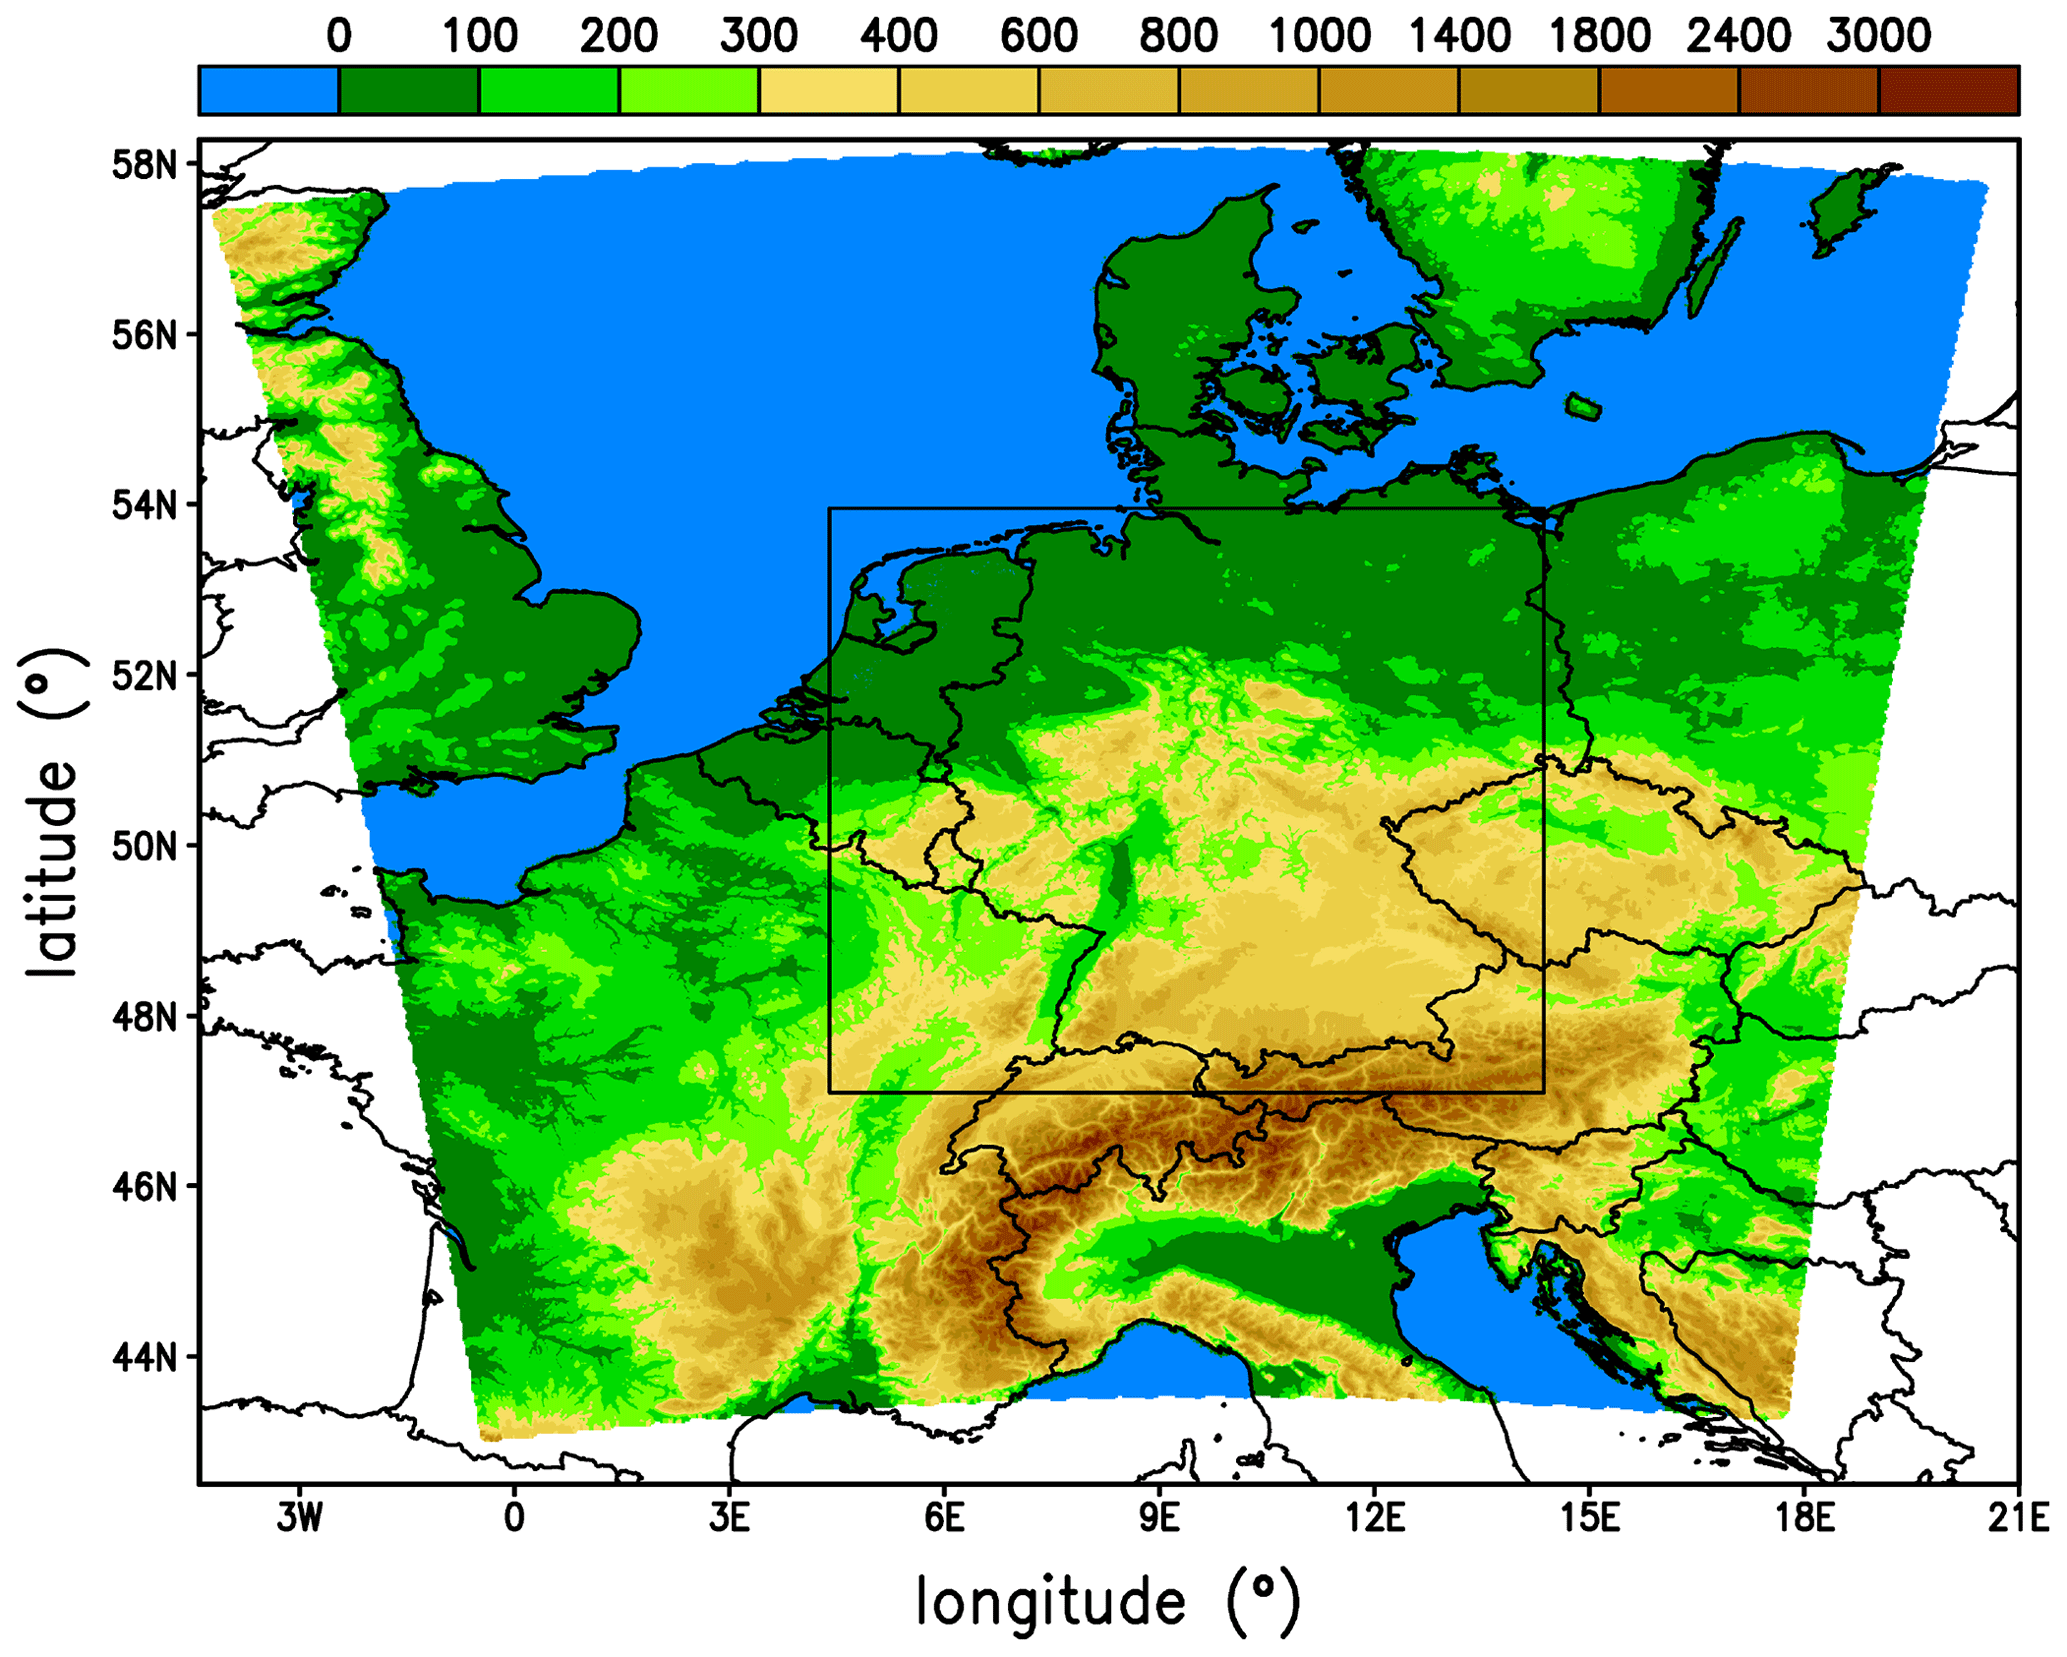
Figure 2ICON simulation domain and model orography in meters above sea level. The black rectangle depicts the evaluation domain covering most of Germany and parts of neighboring countries.
2.1 Model description and simulations overview
The numerical simulations of this study were conducted with version 2.6.2.2 of the ICOsahedral Non-hydrostatic (ICON) model. ICON is based on an icosahedral triangular Arakawa C grid with grid nesting capability, which can be run in a global and limited-area mode (Zängl, 2012). The prognostic variables are the horizontal velocity component normal to the triangle edges vn, the vertical wind component w, density ρ, and virtual potential temperature θv. Time integration is performed with a two-time-level predictor–corrector scheme that is fully explicit in the horizontal and implicit for the terms describing vertical sound wave propagation. For a detailed description of the non-hydrostatic dynamical core, we refer to Zängl et al. (2015). At the German Weather Service (DWD), the ICON model has been operational on the global scale since January 2015 (resolution 13 km), and since July 2015, the two-way nested configuration ICON-EU for Europe with a 7 km resolution has been available. Since February 2021, the convection-permitting version ICON-D2 has replaced the former model COSMO-D2 (COnsortium for Small-scale MOdeling) for conducting operational forecasts over central Europe.
The unstructured triangular grid is based on the successive refinement of a spherical icosahedron. In this study, we use a so-called R19B07 grid, which has 538 164 cells on our simulation domain (Fig. 2). The effective horizontal grid spacing corresponds to 2 km. We use a height-based, terrain-following coordinate system based on the smooth level vertical (SLEVE) coordinate implementation (Leuenberger et al., 2010) with 65 levels. The model domain and horizontal and vertical resolution correspond to the operational ICON-D2 configuration. For the simulation of aerosol effects on mixed-phase clouds, we use the double-moment microphysics scheme of Seifert and Beheng (2006a), which enables the use of four different CCN concentration assumptions. This scheme predicts the mass and number concentration of cloud water, rain water, ice, snow, graupel, and hail. As already documented in Barthlott and Hoose (2018), the activation of CCN from aerosol particles is computed using pre-calculated activation ratios stored in look-up tables by Segal and Khain (2006). For further details about the activation used here, we refer the interested reader to Barthlott et al. (2017) or Barthlott and Hoose (2018). To investigate aerosol–cloud interactions, we performed numerical simulations with maritime (number density NCN=100 cm−3), intermediate (NCN=500 cm−3), continental (NCN=1700 cm−3), and continental polluted conditions (NCN=3200 cm−3). Hande et al. (2016) documented that the continental aerosol assumption represents typical conditions in central Europe. Instead of an explicit supersaturation prediction, the ICON model uses a saturation adjustment scheme to predict droplet condensation, similar to many other double-moment schemes (e.g., Cohard and Pinty, 2000; Milbrandt and Yau, 2005; Morrison et al., 2009; Dipankar et al., 2015). However, this technique has been shown to affect cloud development and rainfall through enhanced latent heating at lower levels (Lebo et al., 2012; Grabowski and Morrison, 2017), which could reduce the potential for a CCN increase to increase buoyancy at mid to upper levels (Barthlott and Hoose, 2018). According to Grabowski and Morrison (2017), the impact on surface rain amounts was minor only. The application of a saturation adjustment technique is considered to be appropriate because almost all clouds (except extremely maritime ones) relax rapidly to the thermodynamic equilibrium between water vapor and water drops (Seifert and Beheng, 2006a). Other recent studies on aerosol–cloud interactions with the ICON model also make use of the saturation adjustment technique (e.g., Seifert et al., 2012; Rieger et al., 2015; Heinze et al., 2017; Costa-Surós et al., 2020; Rybka et al., 2021). Heterogeneous ice nucleation in the immersion and deposition nucleation modes is calculated based on mineral dust concentrations described in Hande et al. (2015), whereas homogeneous ice nucleation is treated following Kärcher and Lohmann (2002) and Kärcher et al. (2006). The number of ice nucleating particles is not varied in this study, as we solely focus on the impact of different CCN concentrations and CDSD shape parameters. Sedimentation is considered using the corresponding number and mass-weighted mean fall velocities, with the terminal velocity depending on the mean drop diameter (Seifert and Beheng, 2006a).
Further physics parametrizations include a multi-layer land surface scheme, Terra (Heise et al., 2006), a turbulence scheme based on a prognostic equation of the turbulent kinetic energy (Raschendorfer, 2001), and a rapid radiation transfer model (RRTM; Mlawer et al., 1997) for radiation. Applied with 2 km grid spacing, the deep convection is resolved but shallow convection still needs to be parameterized using the Tiedtke–Bechtold shallow convection scheme (Bechtold et al., 2008; Tiedtke, 1989) which is able to generate small amounts of convective precipitation. In contrast to the Tiedtke scheme used in COSMO, this scheme has been tuned to avoid excessive moisture transport out of the boundary layer, which reduces a dry bias in the boundary layer. Depending on the day of investigation (see Sect. 2.2), we use either analyses from the Integrated Forecast System (IFS) of the European Centre for Medium-Range Weather Forecasts (ECMWF) or from ICON-EU as initial and boundary data. All simulations were initialized at 00:00 UTC, with an integration time of 24 h.
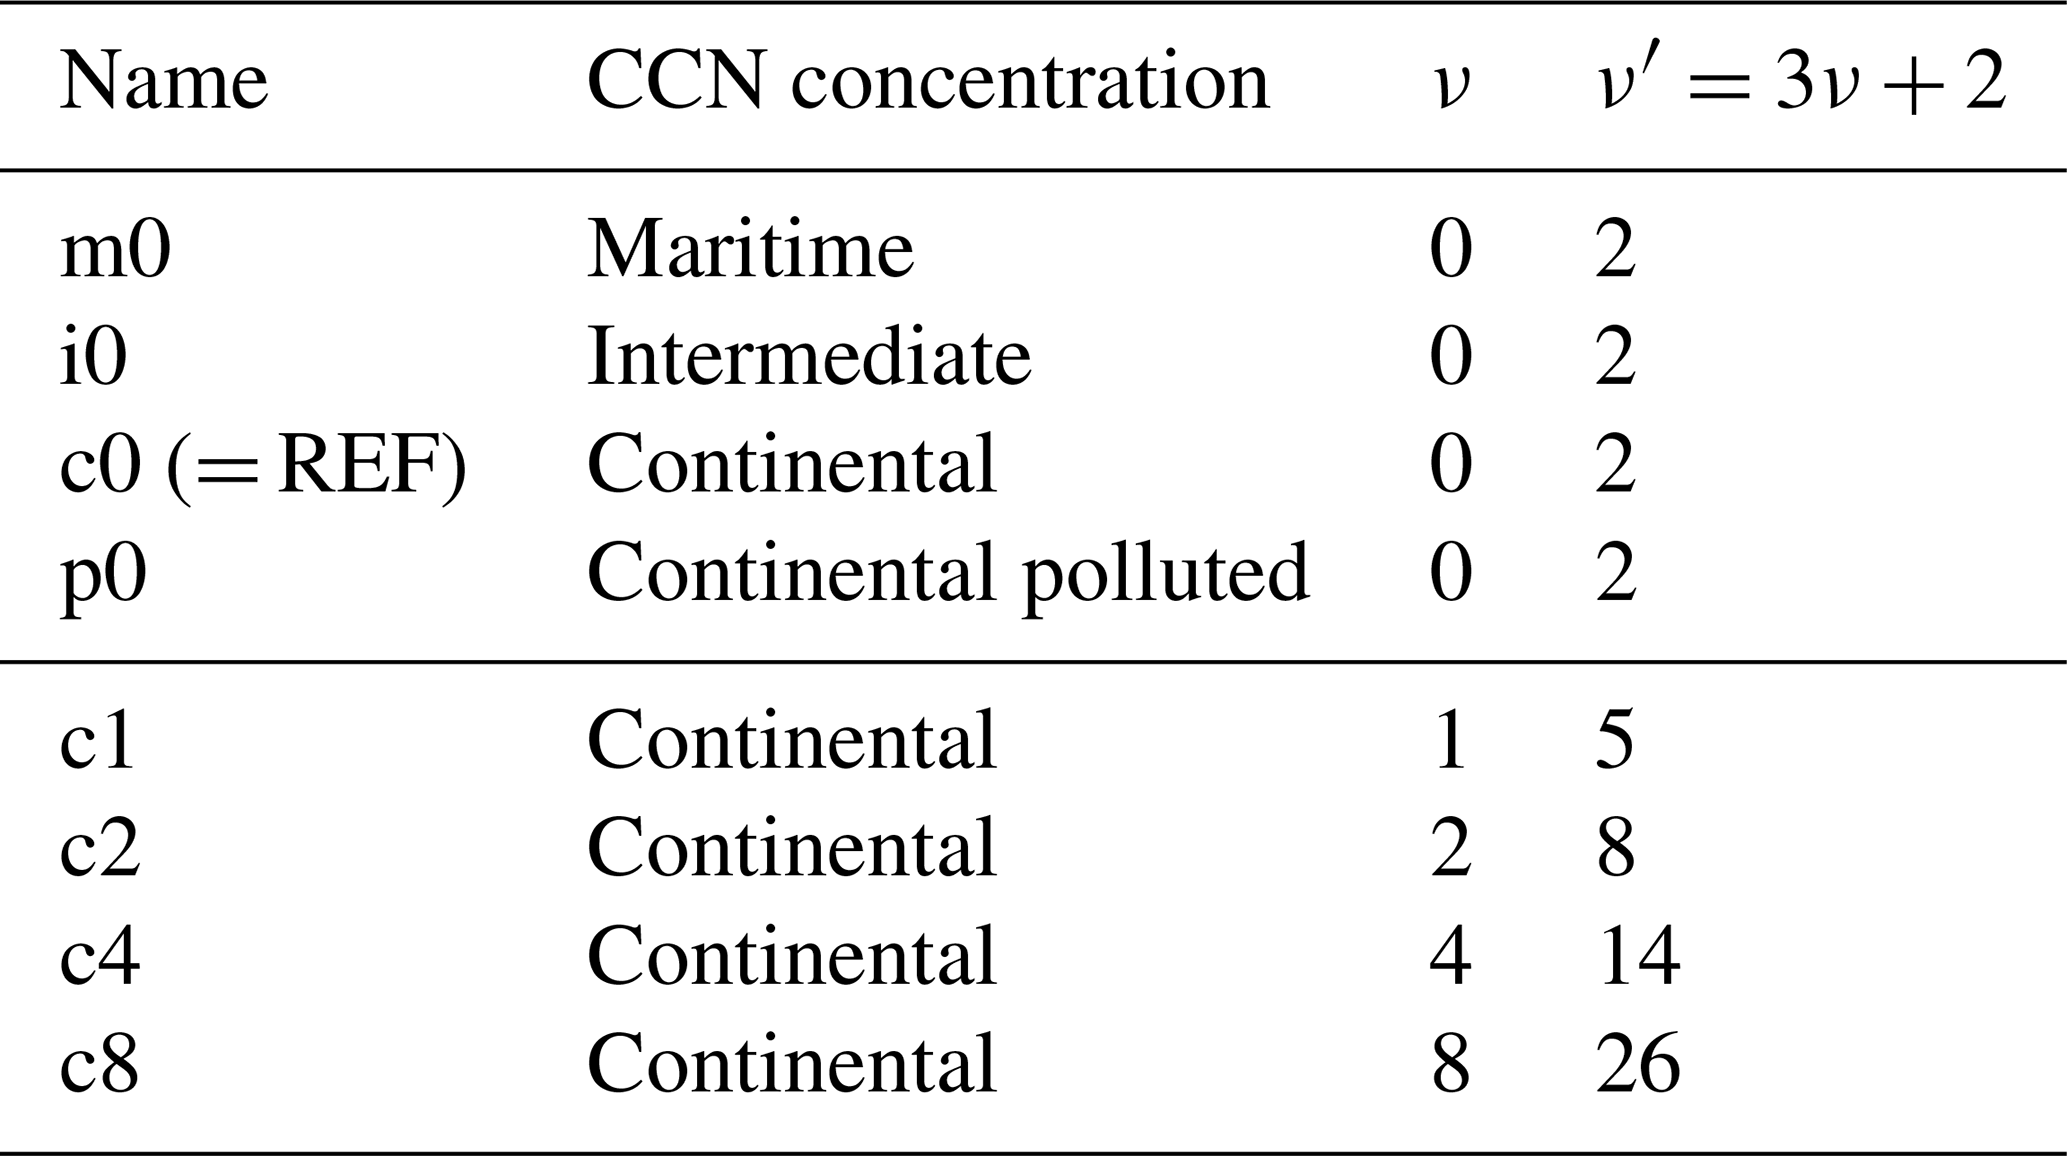
For each of the investigated cases (described in the next section), we conducted eight simulations (Table 1), including a first set with four different CCN concentrations, using a reference shape parameter of 0, and a second set with four different values of the shape parameter ν (Eq. 1), using the reference CCN concentration (i.e., the continental aerosol assumption). We apply the same range of shape parameter values as in the idealized simulations of Wellmann et al. (2020). A shape parameter value of might not be realistic and too large compared to observational values (0–14). The reason for letting ν′ have such a wide range is to show how large the response of simulated clouds and precipitation could be in such extreme conditions. Note that we only change the shape parameter of cloud droplets and not that of other hydrometeor categories. The size distribution of the cloud droplets has a substantial impact on the simulation results, as various microphysical processes depend either directly on the shape parameter (e.g., autoconversion and self collection) or indirectly (e.g., accretion, sedimentation, evaporation, riming, and melting). Since the optical properties of clouds are also influenced, the shape of the CDSD is also important for the radiation and the energy balance at the surface.
Table 1Overview of the numerical simulations with shape parameter values ν based on particle mass x and ν′ based on diameter D.
2.2 Case studies
To cover different typical weather regimes in central Europe, we consider cases with convective precipitation under weak and strong synoptic-scale forcing. We performed numerical simulations for 6 d in total, with 3 d for each synoptic-scale forcing class (Table 2). The two cases of 2016 belong to an exceptional sequence of severe thunderstorms in Germany. The meteorological background of this high-impact weather period is described by Piper et al. (2016). In a recent publication by Keil et al. (2019), different aspects of predictability (i.e., soil moisture heterogeneities, a stochastic boundary-layer perturbation scheme, and varied aerosol concentrations) were analyzed for this period. The cases of 1 July 2009 and 11 September 2013 were also simulated with the COSMO model (500 m grid length) to study the relative impact of soil moisture, CCN concentrations, and terrain forcing by Schneider et al. (2018, 2019). The weakly forced case of 9 June 2018 belongs to a long-lasting episode with severe thunderstorms, as described in more detail by Mohr et al. (2020). Wilhelm et al. (2021) give a detailed description of the synoptic controls of the 3 d storm series in June 2019 to which our last case (11 June) belongs. To evaluate the synoptic-scale forcing quantitatively, we calculated the convective adjustment timescale following the approach of Keil et al. (2014). If the daily mean of this timescale is larger than a threshold of 3 h, then the synoptic-scale forcing is weak, and lower values indicate strong forcing. The resulting values (Table 2) agree well with the results from visual inspection of synoptic weather charts (Fig. 3).
Table 2List of case studies and convective adjustment timescale τ.
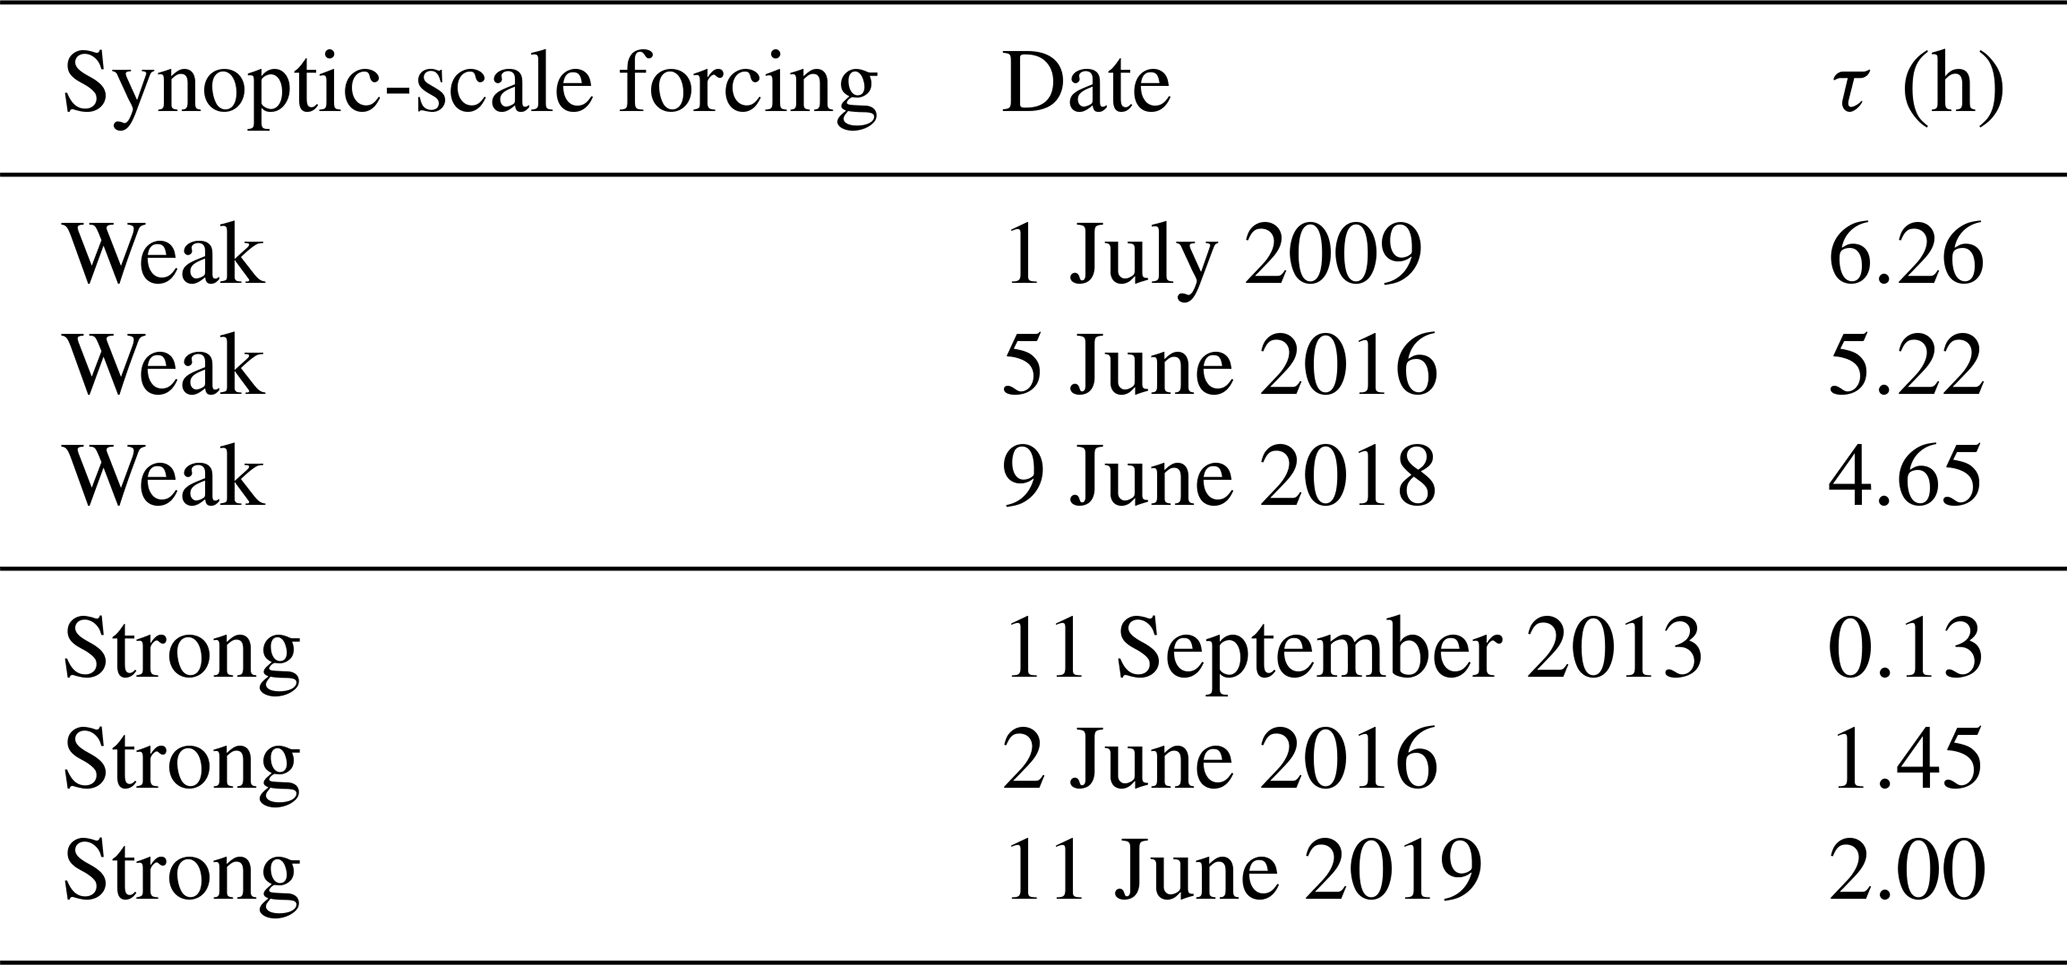
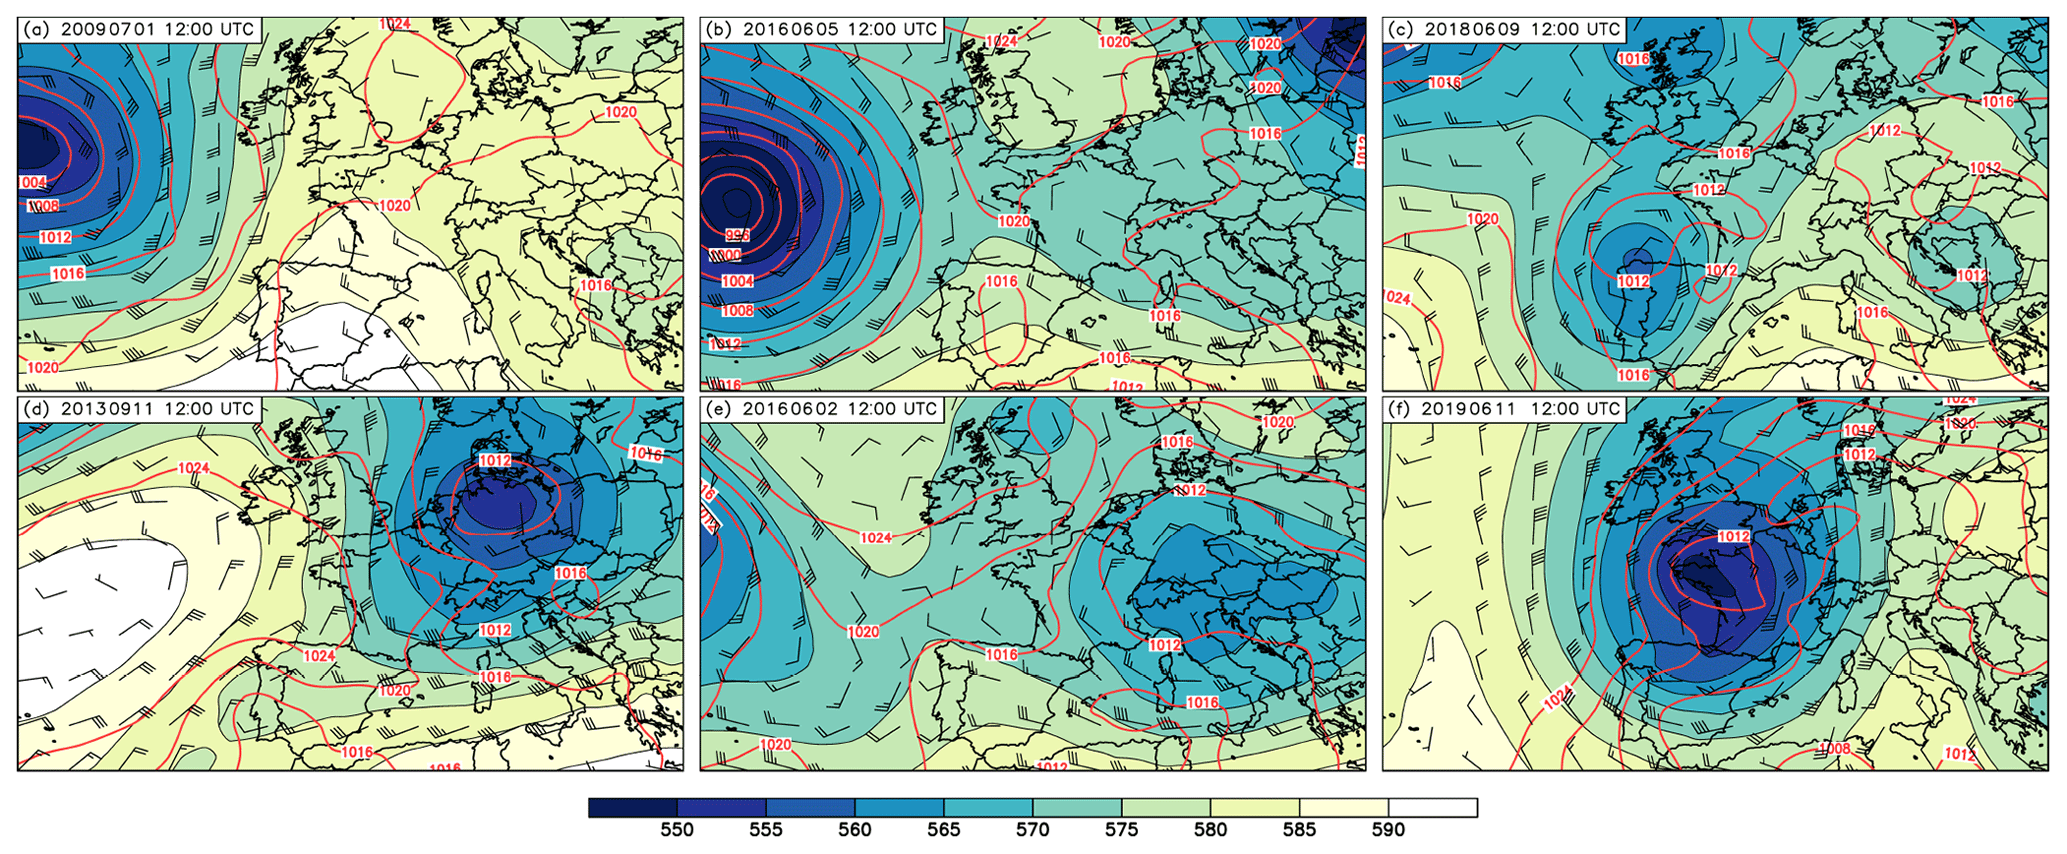
Figure 3Global Forecast System (GFS) analyses at 12:00 UTC for the cases with weak (a–c) and strong (d–f) synoptic-scale forcing showing 500 hPa geopotential height (gpdm; shading), sea level pressure (hPa, red contours), and 500 hPa wind barbs.
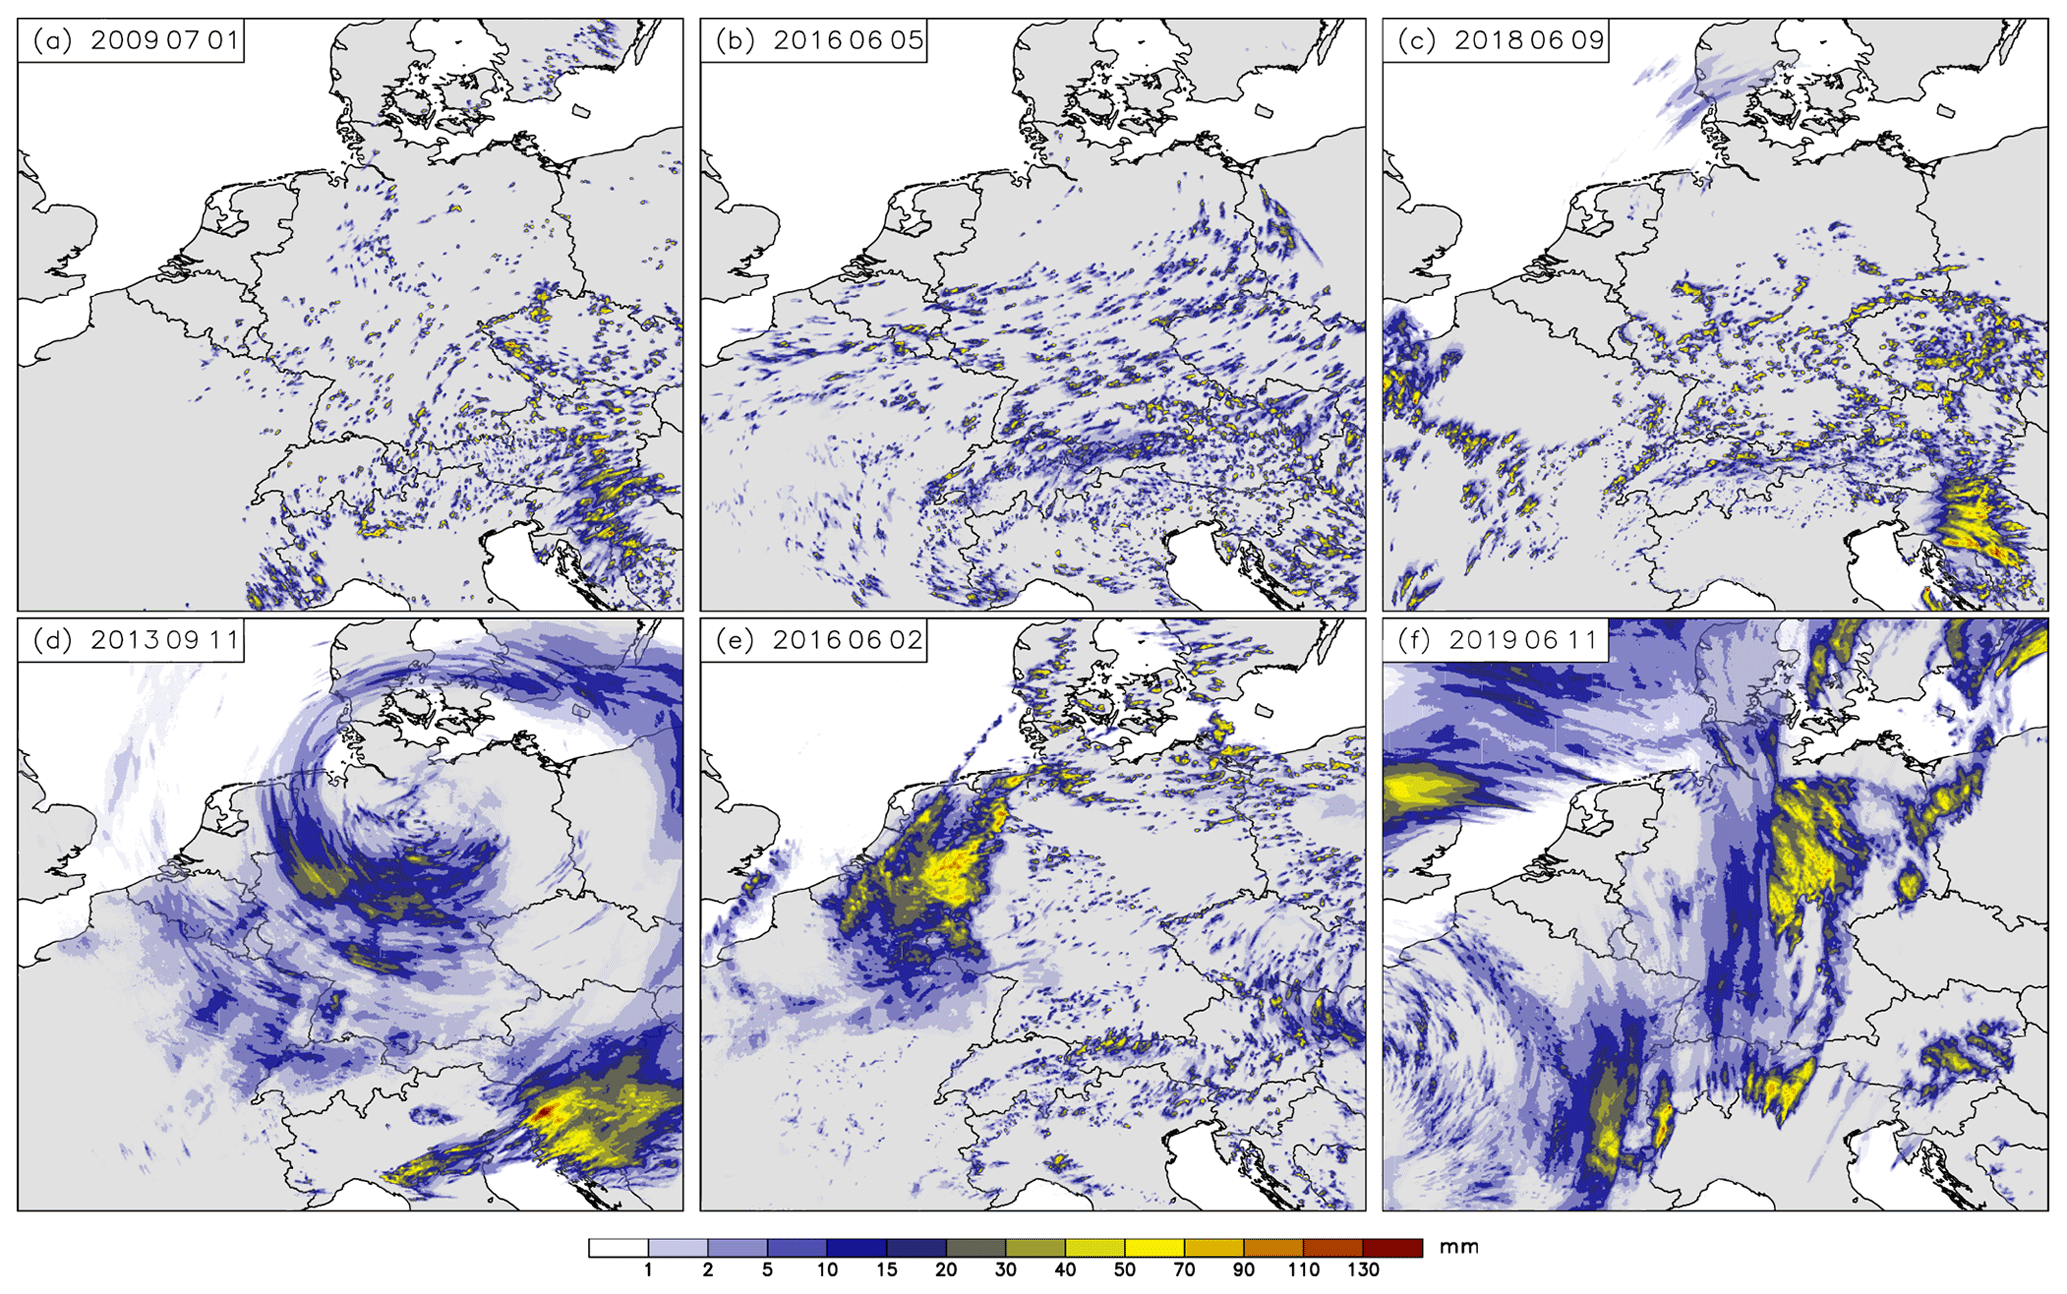
Figure 4The 24 h precipitation amount of the reference runs with continental CCN concentration and broad cloud droplet size distribution (ν=0) for the cases with weak (a–c) and strong (d–f) synoptic-scale forcing.
All cases with weak synoptic forcing show a dominating ridge in central Europe (top panels in Fig. 3). The axis of the ridge lies over France for the cases from 2009 and 2016 and further to the east on 9 June 2018. Over the eastern Atlantic, low pressure systems are present, and over Germany, mid-tropospheric winds are weak with northerly (Fig. 3a), easterly (Fig. 3b), and southwesterly (Fig. 3c) winds. The surface pressure ranges between 1012–1020 hPa, with weak horizontal gradients. The total precipitation amount of the respective reference runs (i.e., with continental CCN concentrations and a cloud droplet shape parameter of 0) shows scattered convection over Germany for these cases (Fig. 4a–c).
The flow of the cases with strong synoptic forcing shows a stronger baroclinicity (bottom panels of Fig. 3). A low-pressure system is situated over Germany on 11 September 2013 and on 2 June 2016. The mid-tropospheric flow is cyclonic, with stronger winds in the first case due to a deeper low and stronger pressure gradients. The case of 11 June 2019 is characterized by a trough over western France. On that day, Germany lies downstream of this trough in a strong southerly flow. The cyclonic circulation on 11 September 2013 is also visible in the precipitation pattern of that day (Fig. 4d). Within this frontal precipitation, convective showers are embedded. For the remaining two cases with strong synoptic forcing (2 June 2016 and 11 June 2019), larger cloud clusters are simulated over Germany as well (Figs. 4e–f). The intercomparison of the simulated precipitation amounts to radar-derived precipitation (not shown) reveals that although the exact location of individual convective cells are not always simulated, there is an overall good agreement between observations and simulations. As the model succeeds reasonably well in reproducing the observed weather characteristics, we conclude that these reference runs serve as a good basis for our sensitivity studies.
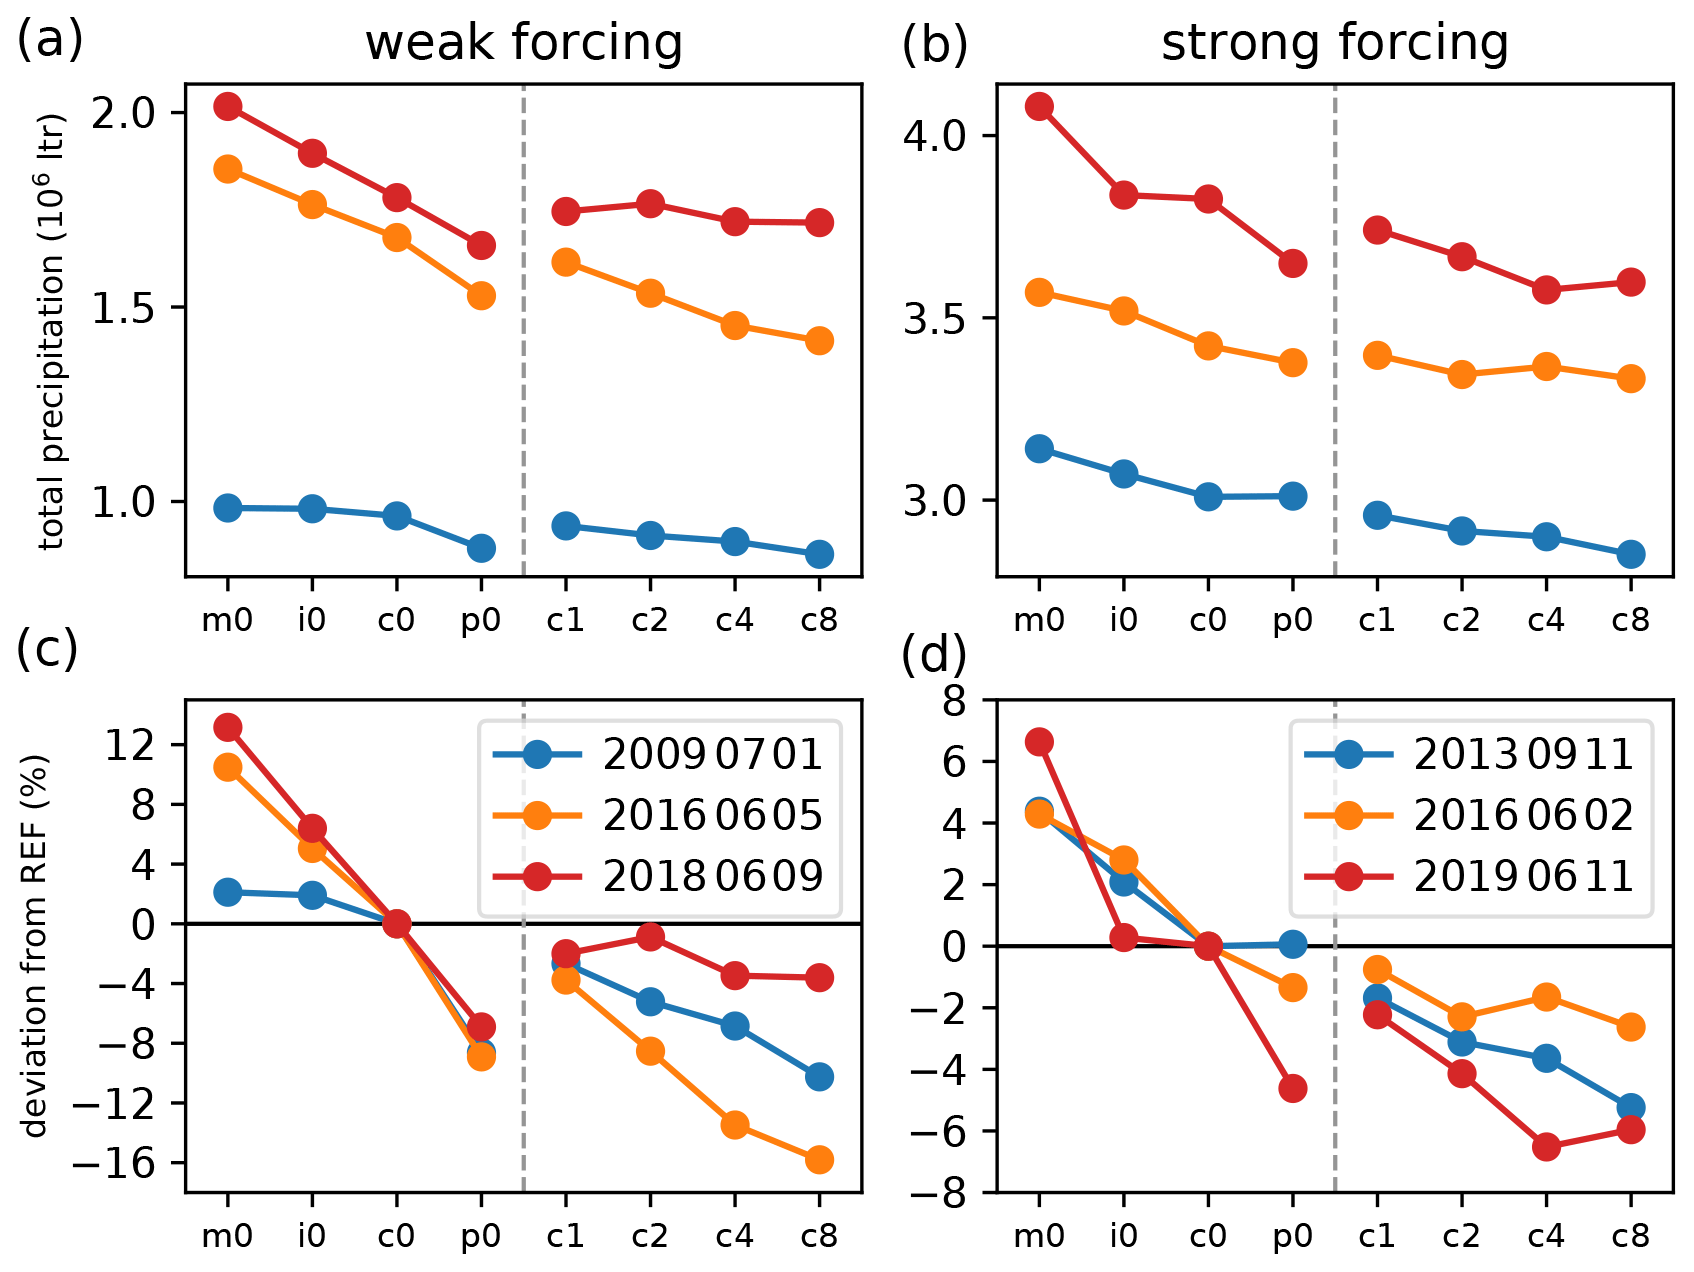
Figure 5Domain-accumulated precipitation (a, b) and precipitation deviation from the respective reference run (c, d) for cases with weak (a, c) and strong (b, d) synoptic-scale forcing. Runs with increasing CCN concentrations are labeled m0–p0, whereas runs with increasing shape parameter and continental aerosol assumptions are labeled c1–c8. The reference run is depicted as c0.
3.1 Precipitation amount and timing
First, we analyze the 24 h accumulated precipitation amount which was computed for the Germany domain (depicted by the black box in Fig. 2). The results show that the cases with strong synoptic forcing all have higher precipitation totals than the ones with weak synoptic-scale forcing (Fig. 5). The precipitation deviations from the respective reference runs (Fig. 5c–d) show larger variations for the weakly forced cases (+13 % to −16 %) than in the strongly forced cases (+7 % to −7 %). This is in agreement with previous findings investigating convective precipitation in central Europe using the COSMO model (Barthlott and Hoose, 2018; Schneider et al., 2019; Keil et al., 2019).
An important finding is the fact that only maritime and intermediate CCN concentrations lead to a precipitation enhancement, and that for all days irrespective of the synoptic forcing, the precipitation amount decreases with increasing CCN concentration. This points towards the influence of a reduced warm-rain process, which will be analyzed later by the analysis of microphysical process rates. The runs with higher shape parameters all show less precipitation than the reference run, and almost all days show a systematic precipitation decrease with increasing shape parameter. It is further of interest to see if changes in the shape parameter (runs c1, c2, c4, and c8) have a larger impact on the precipitation amounts than the CCN concentration (runs m0, i0, c0, and p0). For the cases analyzed in this study, we see a larger absolute deviation (i.e., the range between maximum and minimum precipitation deviation) of 20.1 % for varying CCN concentrations, whereas changes in the shape parameter yield to a maximum difference of 15.8 %. Also, the mean changes of all days is higher for CCN variations (11.9 %) than for shape parameter changes (7.3 %). There is only one case (11 September 2013) where changing the shape parameter leads to larger total deviations (5.2 %) than the different CCN concentrations do (4.3 %). However, this strong forcing day somehow has weaker convective activity with more stratiform precipitation, which could explain this differing behavior.
It is natural to ask if the precipitation response to CCN in ICON is similar to previous COSMO simulations using the same double-moment microphysics scheme. Findings from Barthlott and Hoose (2018) revealed a systematic precipitation decrease with increasing CCN concentration only for cases with strong synoptic forcing, whereas no systematic relationship was found for weakly forced conditions. Barthlott et al. (2017) and Schneider et al. (2019) also found a non-systematic precipitation response. The systemic precipitation decrease found in this study for all days is, therefore, remarkable. Whether this difference is case dependent or caused by a different implementation of the scheme in the ICON model (e.g., saturation adjustment before and after the microphysics) cannot be answered here and is left for future work.
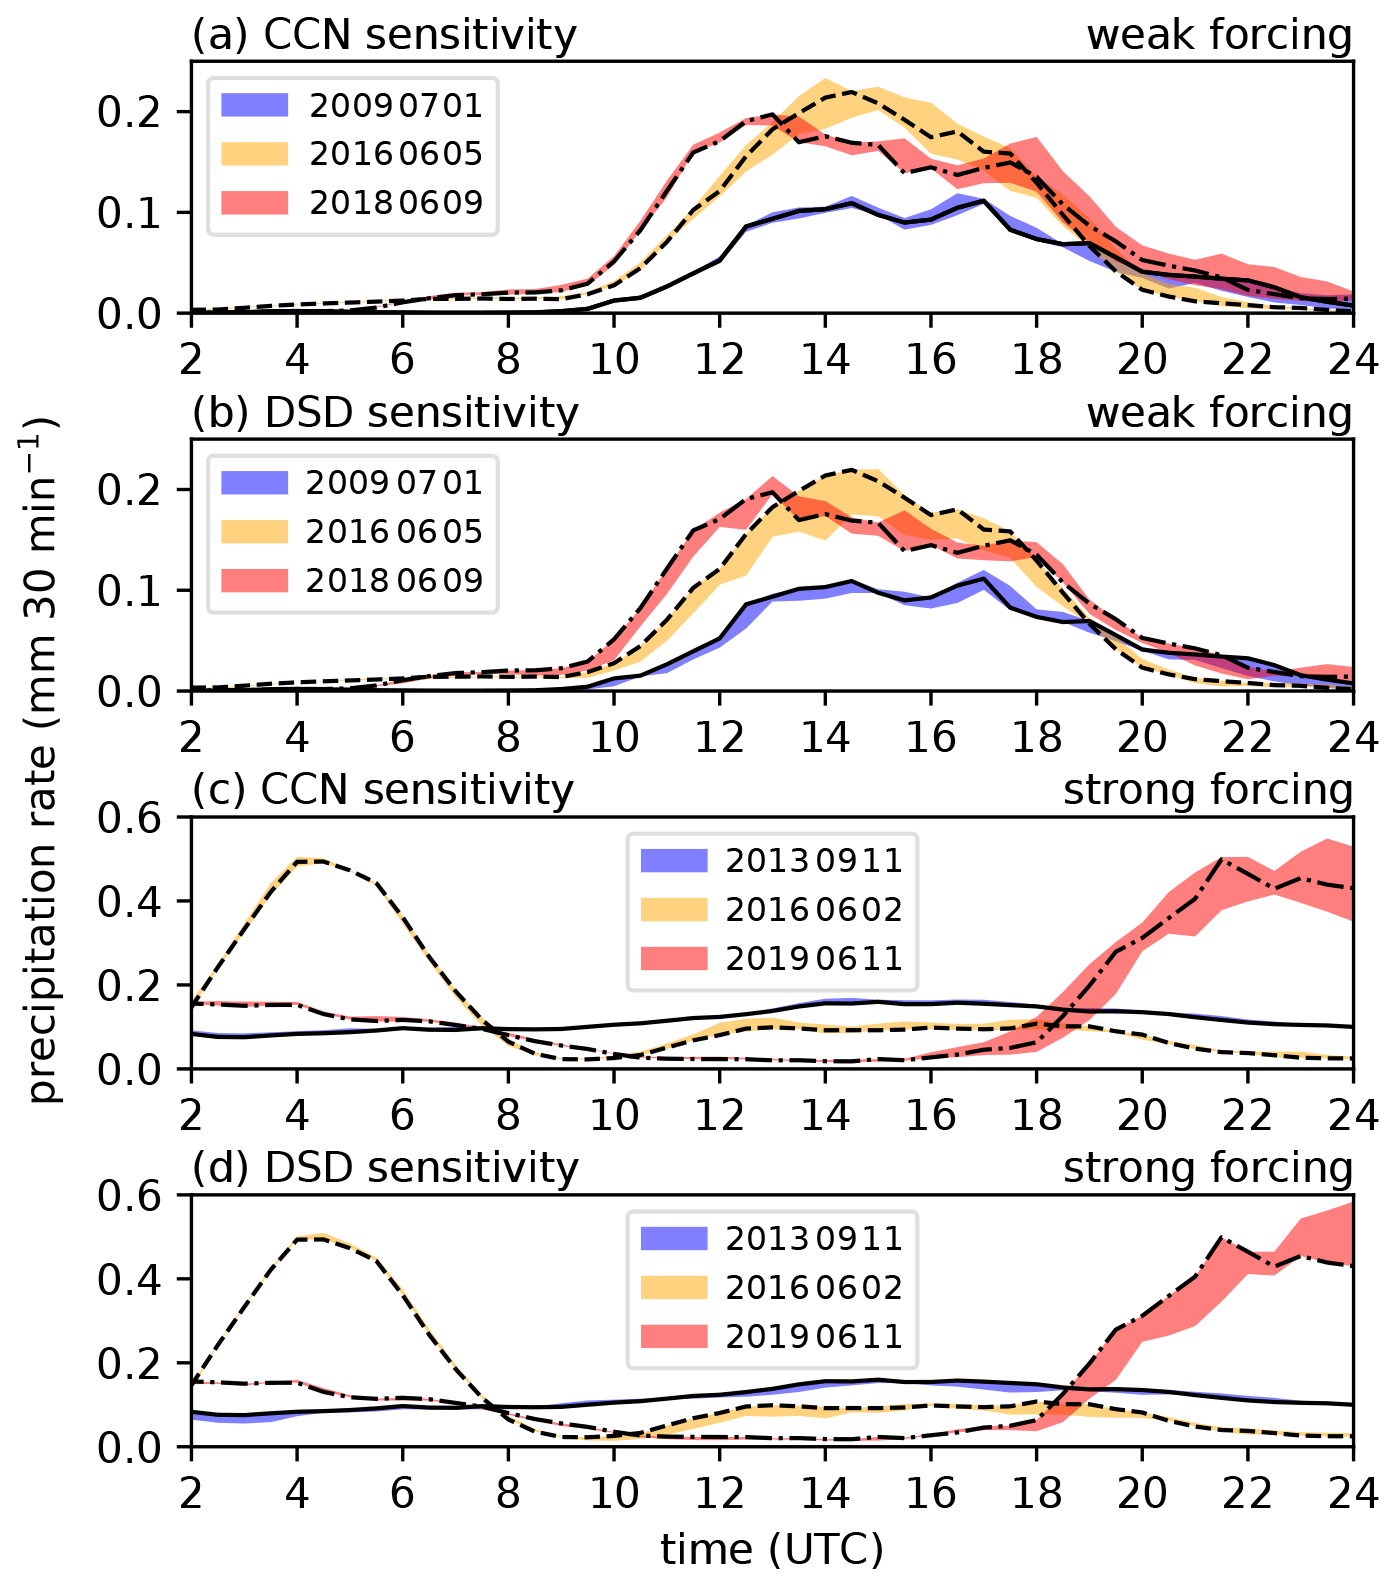
Figure 6Domain-averaged precipitation rates for weak forcing (a, b) and strong forcing (c, d). The color-coded areas indicate the range between the minimum and maximum precipitation rate for all CCN sensitivities in panels (a) and (c) and all shape parameter sensitivities in panels (b) and (d) for each case. The black lines indicate the respective reference run with continental CCN concentration and a shape parameter of 0.
We have also computed domain-averaged half-hourly precipitation rates and found that there is little significant difference among the sensitivity runs with respect to the timing of convective precipitation (Fig. 6). All different model configurations have similar precipitation onset and decay times. Although individual clouds may have started to precipitate earlier or later, at least on average over the evaluation domain of Germany, the timing is similar. There are, however, differences in the magnitude of precipitation intensities. As the different CCN assumptions and shape parameter values do not have an impact on the mean timing of precipitation, the different precipitation totals are solely generated by varying rain intensities in our evaluation domain. As was already obvious from the precipitation amounts presented in Fig. 5, the days with weak forcing show, on average, a larger spread in precipitation intensities. The strong forcing case of 11 June 2019, however, shows the largest spread of all cases analyzed but only after 18:00 UTC. The general trend of decreased precipitation totals with narrower CDSD is also obvious from the respective reference runs, which mostly lie at the upper end of shaded range of rain intensities in Fig. 6b and d. The comparably small spread in precipitation intensities for both the CCN and shape parameter runs during the nighttime precipitation maximum on 2 June 2016 could be explained by the fact that this maximum occurs during the first hours of the simulation. In that time, the spin-up effects and the adjustment to the driving coarser-scale model are still in effect, which could dampen the impacts of the microphysical uncertainties assessed here. A similar, smaller impact of microphysics perturbations at short lead times was found in further sensitivity experiments for 11 June 2019, initializing the model at 18:00 UTC (not shown).
To better quantify differences in the rain intensity over the course of the 24 h simulation period, we computed the fraction of 30 min intervals having a higher and lower rain rate as the reference run with continental CCN concentration and shape parameter of 0 (not shown). Averaged over all six cases analyzed, there is a clear dominance of stronger rain intensities for maritime CCN (run m0; 85 % of time) and intermediate CCN (run i0; 79 % of time). The shape parameter sensitivity runs have larger precipitation rates 26 %–33 % of the time. Thus, lower rain intensities than in the respective reference run are present for the majority of the time, which explains the reduced precipitation totals after 24 h.
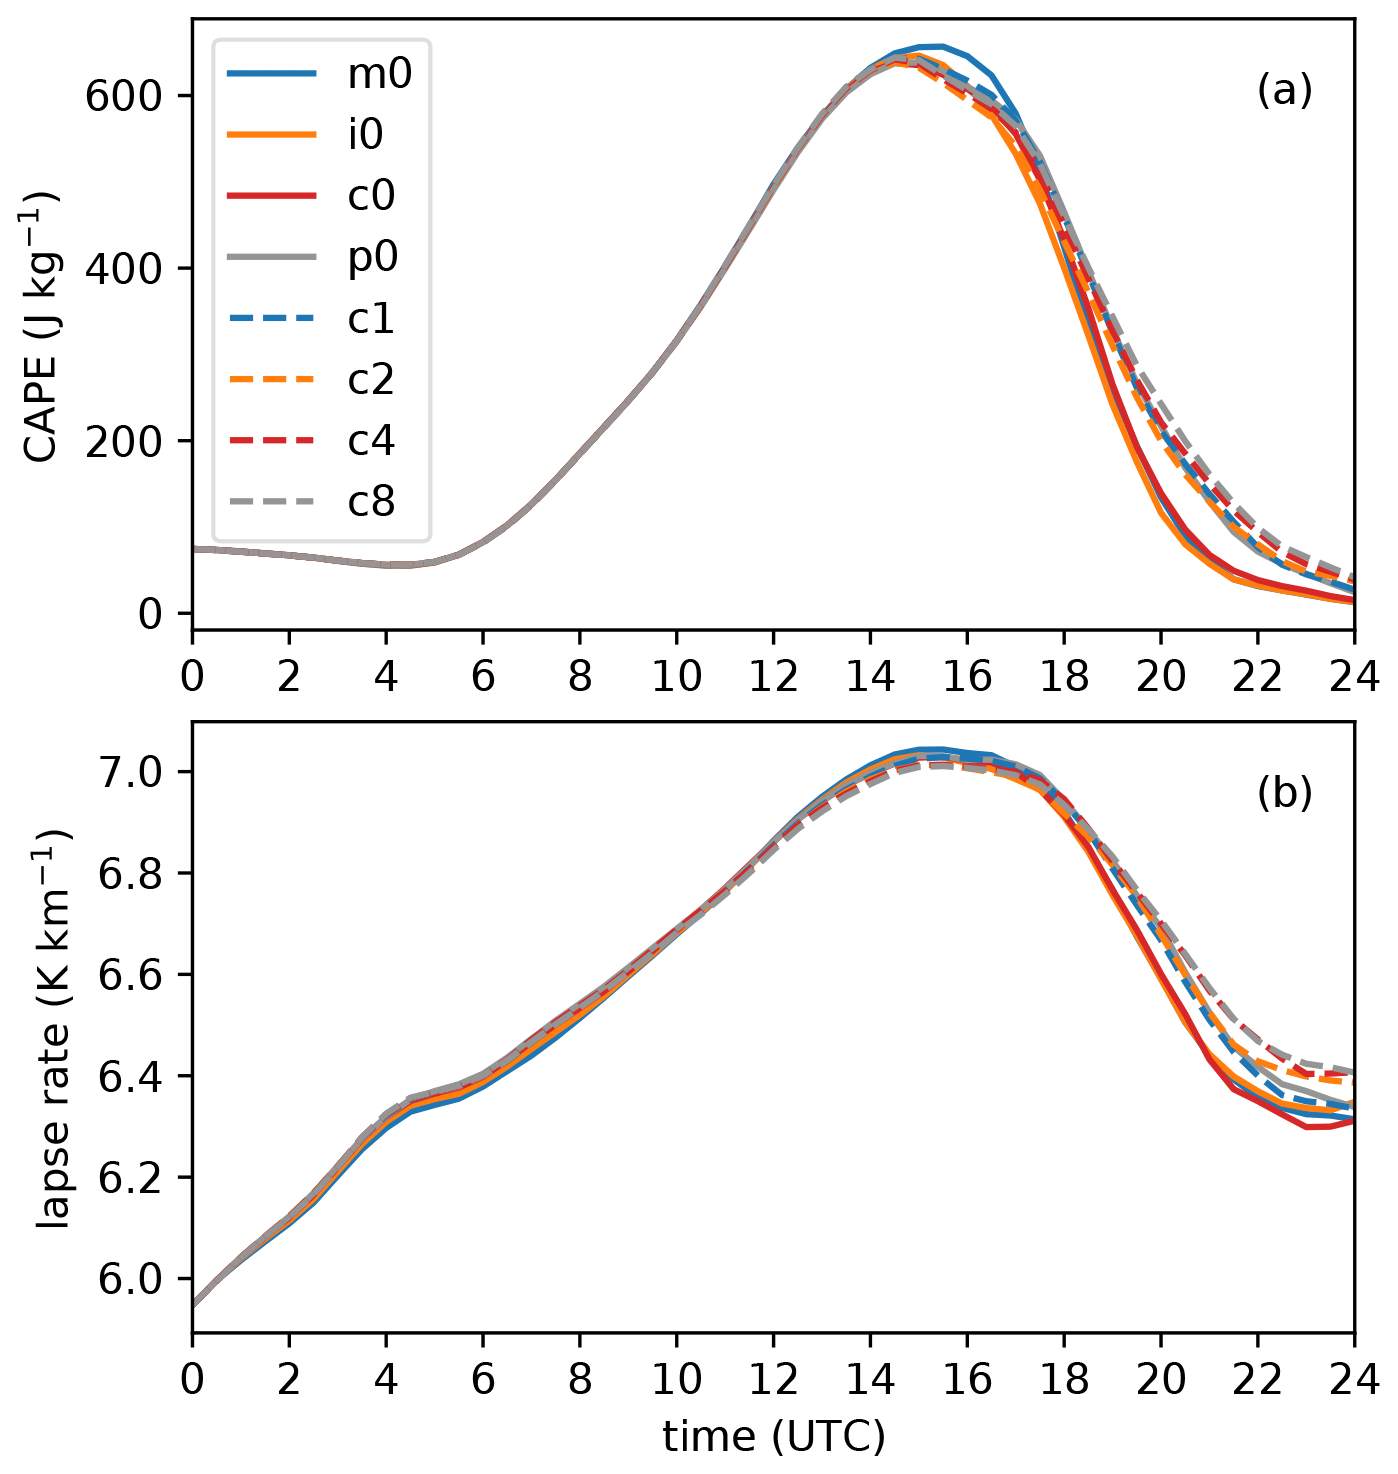
Figure 7Domain-averaged convective available potential energy (CAPE; a) and 700–500 hPa lapse rate (b) on 11 June 2019.
Within this context, the case of 11 June 2019 shows another interesting feature. While precipitation rates of the model runs with increased shape parameters for that day are all lower than the reference run between 18:00–22:00 UTC, they show larger rain intensities after that until midnight (Fig. 6d). This can be explained by the fact that the weaker convection before 22:00 UTC is not consuming as much convective available potential energy (CAPE) as the runs with higher rain intensities. The temporal evolution displayed in Fig. 7 reveals that CAPE in the CCN runs decreases more strongly with time, after 18:00 UTC, than the shape parameter runs. Similarly, the lapse rates between 700–500 hPa are slightly steeper in that period. As the convection decays in the CCN runs, the higher instability and potential energy in the shape parameter runs then leads to a turning point where those runs have higher rain rates, and convection is still in its mature stage. The short available time until the end of the simulation period hinders these runs from receiving similar or even higher total rain amounts than the CCN runs at the end. This interaction between the convective development and the available instability can be an important point in other cases, and the total precipitation amounts can depend on whether (i) such a turning point exists and (ii) if it occurs early enough to have a major impact on precipitation totals. As this interaction has an impact on the life cycle of the convective clouds through decay and intensification, the entire lifetime of the cloud field is also affected, which highlights the complex interactions between thermodynamic and microphysical processes.
3.2 Convection-related parameters and cloud fraction
As environmental conditions such as instability, convective available potential energy (CAPE), or relative humidity were shown to be more important for precipitation totals than accurate aerosol assumptions (Barthlott and Hoose, 2018), it is important to assess their evolution in our model runs. Therefore, we have computed the temporal evolution of several convection-related parameters for all model runs (not shown). It turns out that the environmental conditions in which the first clouds and subsequent precipitation form are very similar, at least for domain averages over Germany. Thus, the sensitivity runs comprising different CCN concentrations and different shapes of the CDSD do not modify the initial environmental conditions. However, the microphysical uncertainties do impact the cloud structure and precipitation rates, which themselves influence the environment in the vicinity of the clouds. For example, CAPE and convective inhibition are very similar until the mature stage of convection, and differences occur only later as a result of different precipitation intensities. Another example is the convergence of the low-level wind, which is an important parameter describing the impact of weaker/stronger cold pools on the initiation or intensification of secondary cells (Barthlott and Hoose, 2018). For this parameter as well, we do not see any distinct differences in the initiation phase and evolving precipitation. Only as a result of different rain intensities is low-level wind convergence modified. Similar findings are valid for 500 hPa relative humidity or wind shear parameters. We, therefore, conclude that the inclusion of microphysical uncertainties by different CCN concentrations and shape parameters only has implications on environmental variables after precipitation onset. As already mentioned earlier, however, the modified environmental conditions can be important for convective processes at later times.
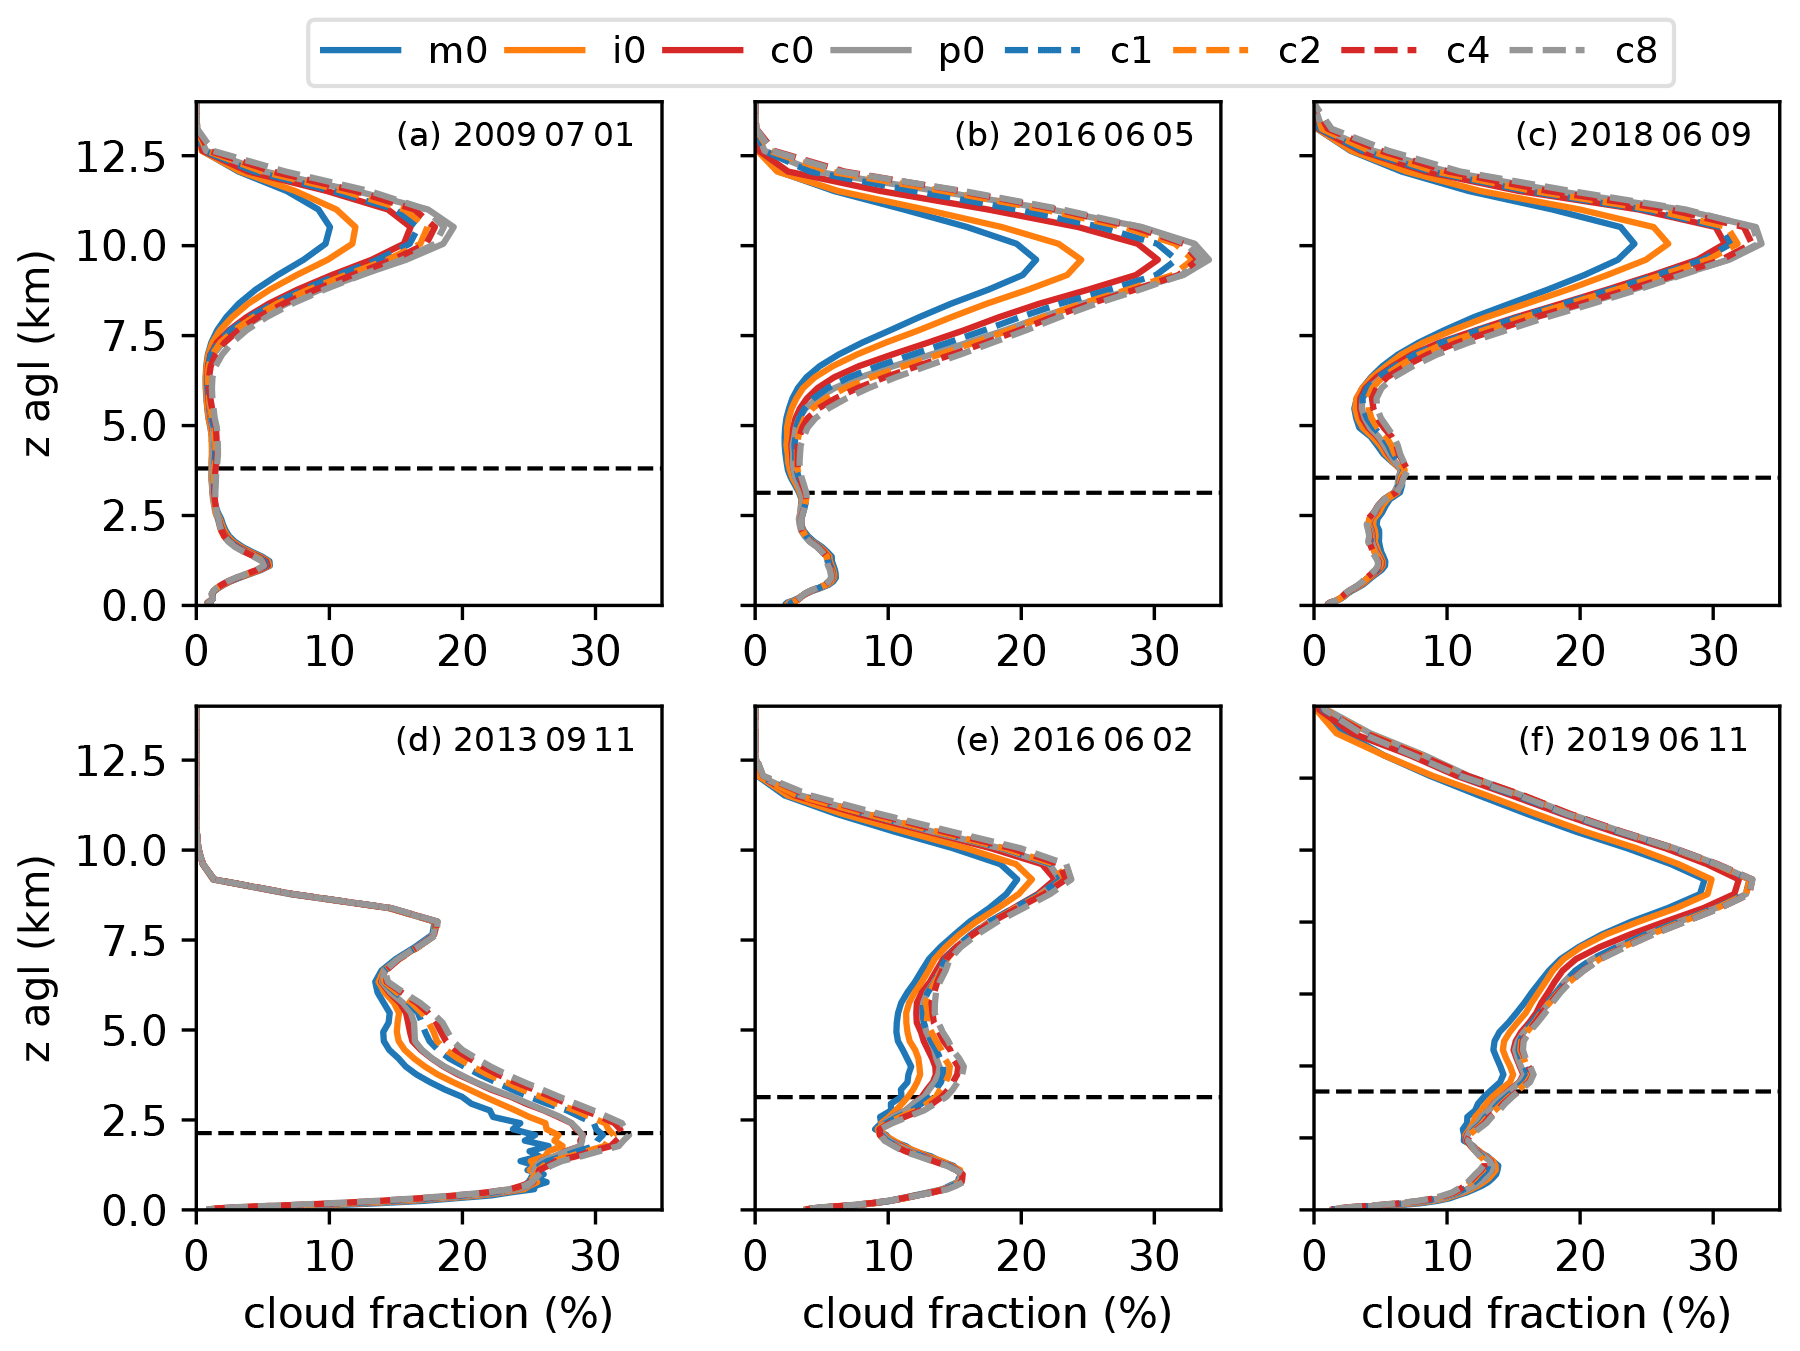
Figure 8Domain-averaged profiles of cloud fraction for weak forcing (a–c) and strong forcing (d–f). The dashed black lines indicate the height of the freezing level.
To assess the relevance of our microphysical perturbations on the vertical cloud structure, we computed mean profiles of the cloud fraction for all cases and sensitivity experiments (Fig. 8). All the weak forcing cases show rather similar profiles below the freezing level. It is only above the freezing level that the cloud fraction is influenced by different CCN concentrations or shape parameters, with the strongest difference occurring at a height of 10 km a.g.l. (above ground level). For all cases, the cloud fraction increases with increasing CCN concentration. The runs with variations in the shape parameter all lie in between the reference run (c0) and the one with continental polluted aerosol assumption (p0). The maximum difference reaches almost a factor of 2 (from 10 % to 19 % on 1 July 2009), which has important implications on the incoming radiation and the energy budget at the ground.
In general, the cases with strong synoptic forcing show a similar behavior, with two exceptions: (i) cloud fraction is altered already below the freezing level and (ii) all shape parameter runs show higher or similar cloud fractions than the p0 run. In addition, the range of simulated differences is smaller than for the cases with weak forcing. This smaller response to the applied microphysical uncertainties could be related to the different cloud and precipitation structure during this weather regime. Here, larger cloud clusters are simulated in comparison to the more scattered and isolated convection in the weak forcing cases (see Fig. 4). These larger cloud clusters seem less susceptible to our modifications, which is also apparent in the weaker sensitivity of precipitation totals for that weather regime. The case of 11 September 2013 (Fig. 8d) shows a sensitivity already from a height level of 1 km, with maximum differences simulated at the freezing level. The height of the freezing level is with 2.1 km a.g.l.; the lowest one of our cases and the clouds do not reach such high levels on the remaining days. The larger fraction of stratiform precipitation with a probably higher relative contribution of warm-rain processes might be the reason for this behavior. This will be analyzed next with the analysis of hydrometeor contents and microphysical process rates.
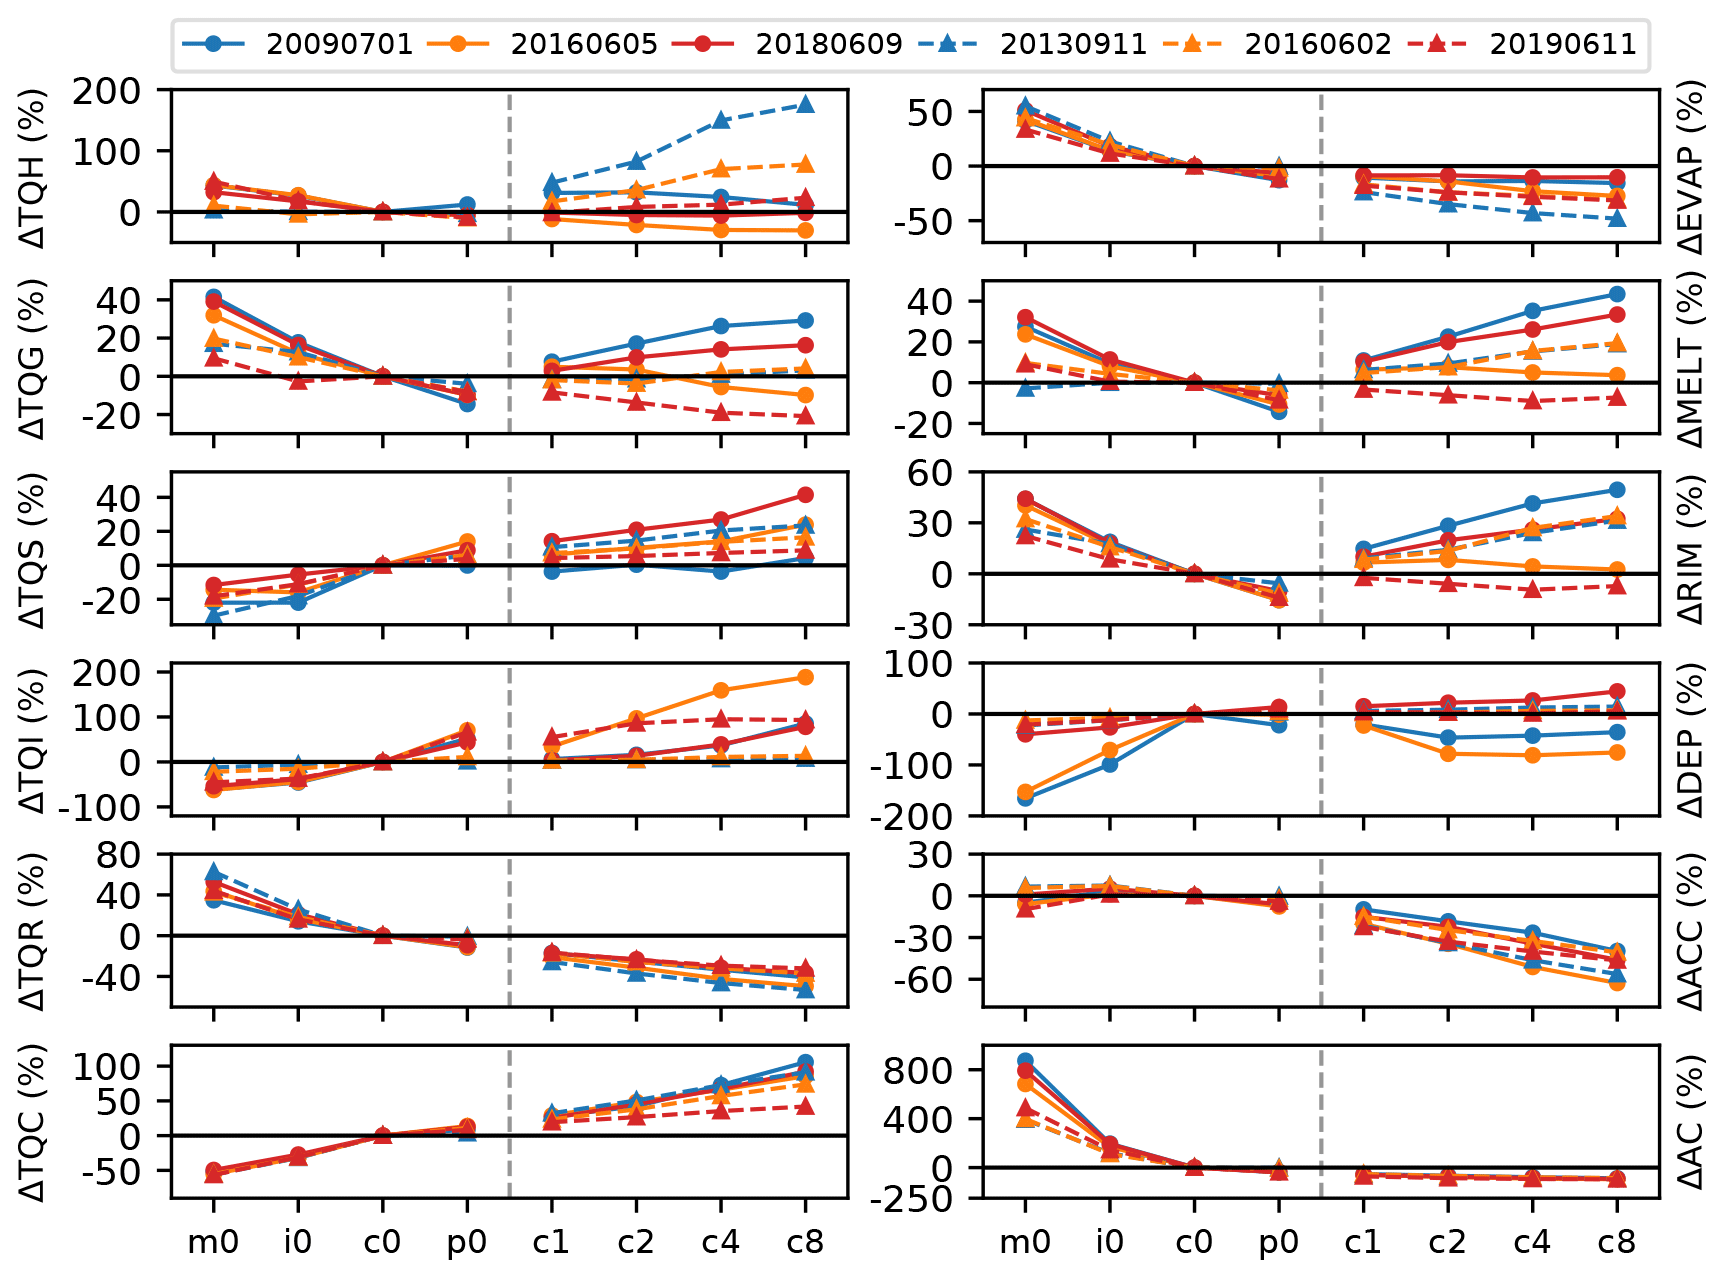
Figure 9Spatiotemporal averages of percentage deviations from the reference run of total cloud water (TQC), rain water (TQR), ice (TQI), snow (TQS), graupel (TQG), and hail (TQH) amounts (left column) and of autoconversion (AC), accretion (ACC), deposition (DEP), riming (RIM), melting (MELT), and evaporation (EVAP; right column). Weak forcing cases have solid lines, and strong forcing cases have dashed ones.
3.3 Total hydrometeor content and microphysical process rates
To further elucidate the impacts of microphysical uncertainties on clouds and precipitation and the processes involved, we now analyze deviations from the reference run of the total cloud water (QC), rain water (QR), ice (QI), snow (QS), graupel (QG), hail (QH), and several microphysical process rates (Fig. 9). In agreement with previous findings with the COSMO model (e.g., Schneider et al., 2019), we find a systematic increase in QC with increasing CCN concentration. This trend is continued with continental CCN concentration and increased shape parameters (run c1–c8). The sensitivity of QC ranges from 56 % reduction in a clean environment to more than 105 % increase with continental CCN concentration and narrow CDSD. The total rain water content, on the other hand, is systematically decreasing with increasing CCN concentrations and larger shape parameters. The percentage deviations are smaller than for QC, ranging from a 63 % increase to 50 % decrease. There is not much of a difference for cases with weak or strong synoptic-scale forcing. As both the CCN increase and larger shape parameters narrow the CDSD, a reduction in the collision–coalescence process is expected. This is also obvious in our model runs. Compared to the reference run, a further increase in CCN or larger shape parameter systematically decreases the autoconversion of cloud water to rain by up to −95 % for a shape parameter of 8. For maritime conditions, however, a huge increase in autoconversion between 392 % and 873 % is simulated. The accretion is also reduced for continental polluted CCN assumptions and narrower CDSD (runs c1–c8) but less intense than autoconversion. As in the study of Barthlott and Hoose (2018), the maximum accretion rates are found in the respective intermediate runs, and for maritime CCN concentrations, positive and negative deviations exist depending on the case.
The ICON model simulates an increase in cloud ice ranging from −50 % to +200 %, probably due to the larger water load at higher levels caused by the reduced warm-rain process. However, two of the strong forcing cases show much smaller changes in cloud ice from −22 % to +13 %. The snow content reveals a similar behavior to the cloud ice, but the response is much smaller. Except for the intermediate CCN concentration of the strong forcing case of 11 June 2019, the graupel contents of all runs decrease with increasing CCN. The response of graupel to narrower CDSD reveals an opposite behavior; some of the days show a graupel increase and others a decrease. The same is valid for the total hail content. However, hail amounts are rather small, and only small changes can lead to large percentage deviations. The run with the lowest hail amount is the one with the strongest hail increase (11 September 2013), which also had embedded convection in a frontal rainband. Vapor deposition mostly shows a systematic increase with increasing CCN concentrations and also larger shape parameters, indicating a stronger Wegener–Bergeron–Findeisen process that consumes more water vapor to form ice. In total, two of the cases (weak forcing cases of 1 July 2009 and 5 June 2016) reveal larger negative deviations and maximum deposition rates in the reference run. The reason for that remains unclear but could be related to the fact that the vertically integrated values also contain negative contributions from sublimation. Especially for these two cases, sublimation at lower levels and deposition at higher levels have similar values, which lead to only small vertical integrals. For the remaining cases, deposition is much higher than sublimation, and the resulting integrals are larger and more significant. The riming of ice particles (ice, snow, graupel, and hail) with supercooled liquid water is decreasing with increasing CCN concentration. As stated by Cui et al. (2011), the size of the graupel particles, the concentration and size distribution of drops, and the collision kernel determine their growth rate by riming. They argue that, in high-aerosol conditions, the concentration of cloud droplets is high, but the smaller graupel particles lead to a smaller graupel–drop collision kernel. This then leads to a reduction in riming, which is also true in our simulations and previous studies with the COSMO model (Barthlott and Hoose, 2018). For two of the cases, the larger shape parameter and narrower CDSD lead only to a slight reduction (11 June 2019) and slight increase (5 June 2016) in riming. The remaining four cases, however, reveal a strong systematic riming increase with larger shape parameters. The maximum increase with very narrow CDSD (run c8) is even higher than the maritime run with broad CDSD. Those cases reveal a higher cloud droplet number concentration than in the reference run. This higher number concentration, together with the strong increase in total cloud water could offset the effect of smaller graupel particle size on the collision kernel. However, we must state that we analyze the total riming, which includes riming on all ice particles and not solely graupel particles.
The response of melting is similar to the one of riming, where melting generally decreases with increasing CCN concentrations and increases with larger shape parameters for most of the analyzed cases. However, melting on 11 June 2019 is smaller for larger shape parameters than the reference run. Also, melting on 11 September 2013 is rather insensitive to the aerosol load. Convection on that day was weaker and did not reach such high levels as in the remaining days (see cloud fraction profiles in Fig. 8). As already documented by Rasmussen and Heymsfield (1987), the melting of graupel and hailstones is significantly affected by the initial hydrometeor density, their initial size, and the temperature and humidity profile. A size distribution with smaller and lighter frozen hydrometeors produces the largest melting rates. As neither the graupel nor the hail size distribution show more smaller particles in maritime conditions or with narrower CDSD (not shown), the largest melting rates are supposed to be a result of the larger graupel and hail content at those runs. This assumption is further supported by the reduced melting on 11 June 2019 in the narrower CDSD because the graupel content is also smaller for these runs.
The falling precipitation particles can significantly modify the environmental conditions, which feeds back to other microphysical processes. Another important parameter for surface precipitation is the evaporation of raindrops. Our results show largest evaporation rates for maritime conditions with a low CCN concentration. Increasing the CCN concentration always leads to smaller evaporation rates. This trend is continued for most cases that also have larger shape parameters, whereas two cases show only a small reduction. The reduced evaporation in more polluted conditions is in agreement with previous studies (e.g., Altaratz et al., 2008; Storer et al., 2010; May et al., 2011). As the raindrop size distribution shifts to populations of raindrops that are fewer in number but larger in size with increasing CCN concentration (Barthlott et al., 2017), evaporation is reduced due to the smaller surface area of large raindrops relative to their volume. The stronger evaporation in maritime conditions results from the higher number of small raindrops. The further reduction in rain water evaporation with larger values of the shape parameter is a consequence of the raindrop size distributions which shift to larger sizes than in the CCN sensitivity runs. As the portion of smaller droplets in the population is declining further, the evaporation is reduced as well. In addition, larger evaporation rates are also produced by the larger rain water content available for evaporation.
Although not shown here, we also analyzed the cloud droplet nucleation by CCN activation and the condensation rate from the saturation adjustment. We find that cloud water formation is dominated to a large extent by the saturation adjustment. As expected, the activation of aerosol particles is strongly reduced in maritime conditions and increases with increasing CCN concentration. The nucleation for larger values of the shape parameter is somewhat lower than the one from the respective reference run, but the sensitivity to the shape parameter is rather low.
3.4 Role of evaporation on surface precipitation amounts
We showed, in the previous section, that changes in the CCN concentration and modifications of the shape parameter induce strong percentage deviations in vertically integrated hydrometeor contents and microphysical process rates. It is, therefore, of interest to determine the reasons why the big changes in cloud water, from −56 % to 105 %, and changes in rain water, from +63 % to −50 %, only have a smaller impact on precipitation amounts, which show deviations of +13 % to −16 % only.
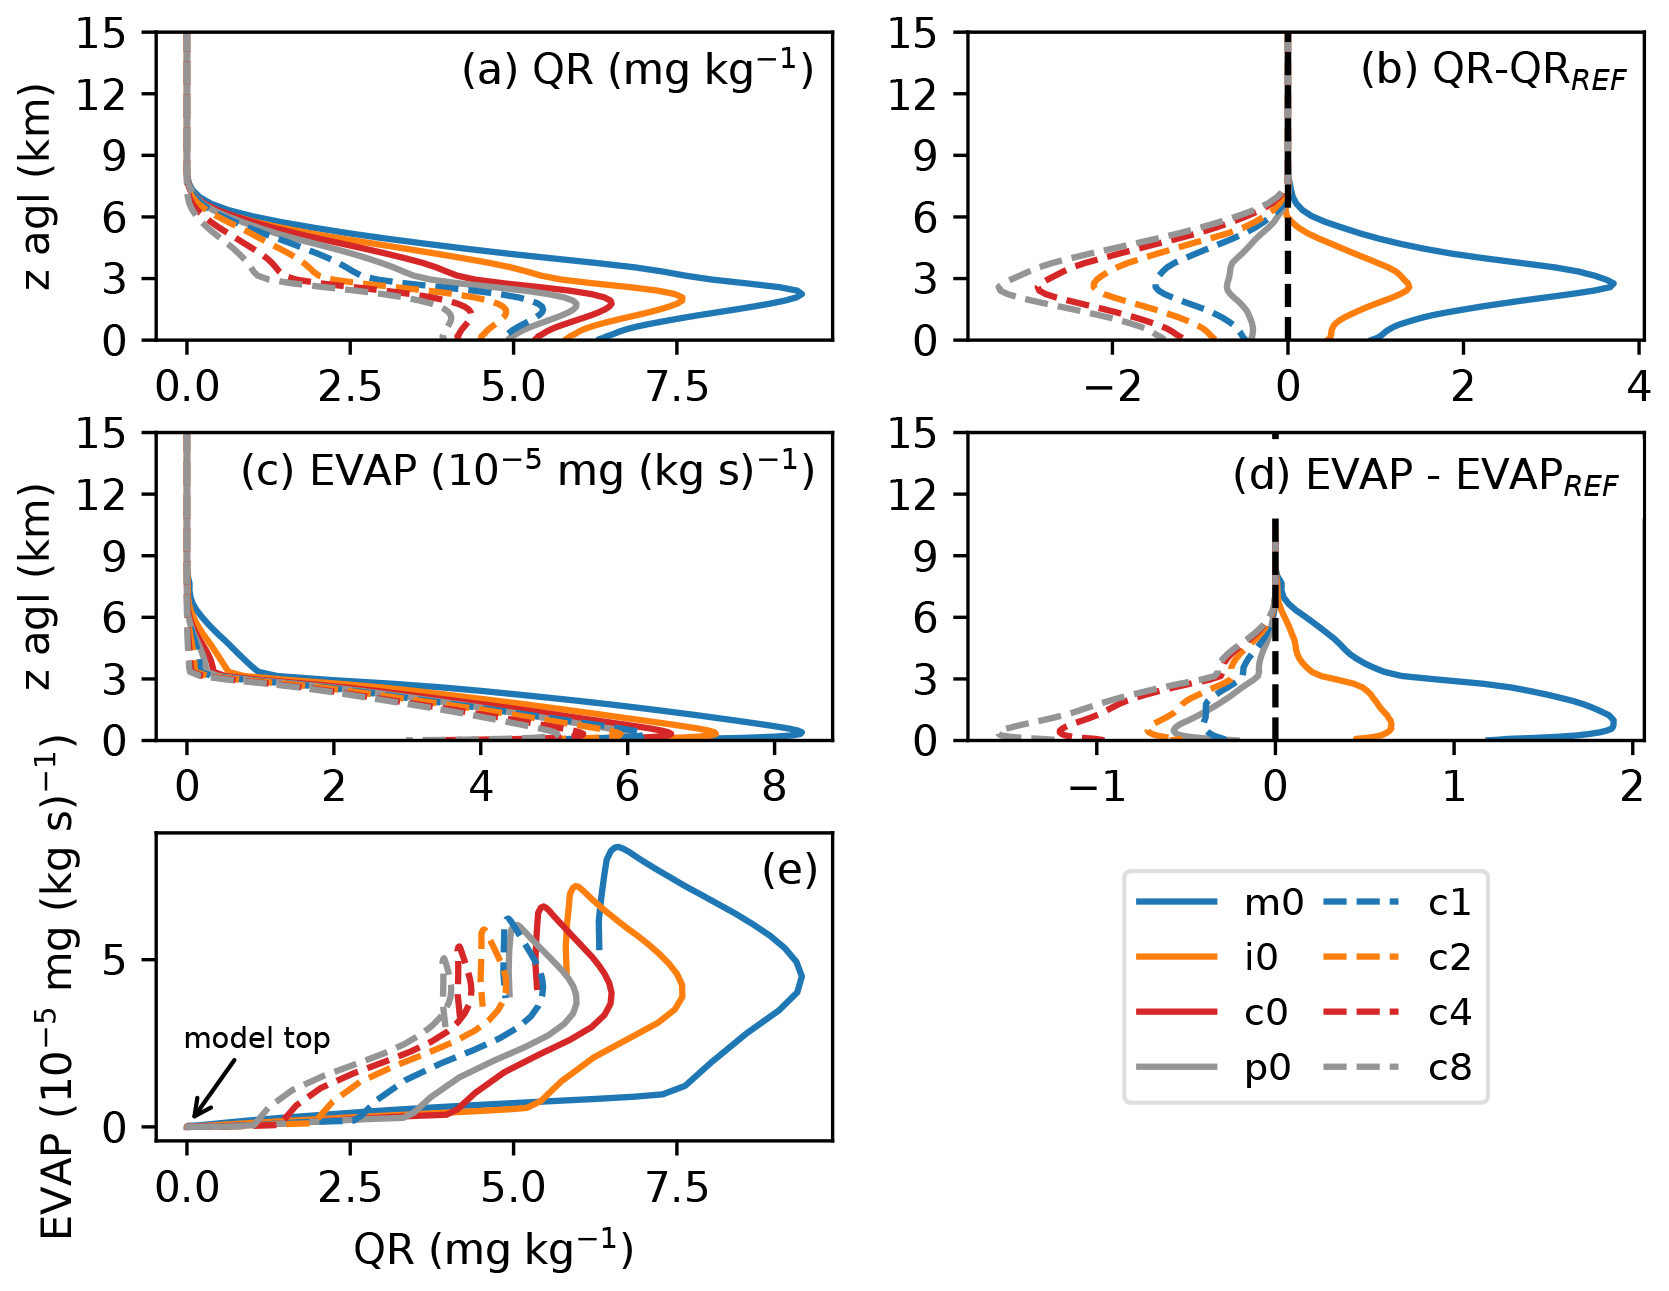
Figure 10Vertical profiles of spatiotemporal averages of rain water content (QR) and evaporation (EVAP) on 1 July 2009. Panel (e) displays the correlation between EVAP and QR throughout the atmosphere with the origin corresponding to the highest model level.
We therefore analyze the vertical profiles of rain water and rain evaporation in Fig. 10. As the other days generally show similar characteristics, we restrict this analysis to one case study (5 June 2016). In agreement with previous findings with the COSMO model (Barthlott and Hoose, 2018), the rain water content is much higher in maritime conditions. With increasing CCN concentration and larger shape parameters, a QR reduction is simulated, and the height of the rain water maximum decreases. The difference plot in Fig. 10b shows this systematic dependance even clearer. Below the level of maximum QR, the profiles converge towards the ground, leading to a smaller precipitation deviation at the ground. The profile of rain water evaporation displayed in Fig. 10c and d reveals a stronger evaporation for maritime conditions. As already mentioned in the previous section, this can be explained by the higher number of small raindrops in that scenario. The evaporation is not strong enough to completely erase the sensitivity of the surface precipitation, but we hypothesize that the relative humidity at low levels is decisive for the strength of the precipitation response. However, we do not observe a linear relationship between evaporation rates and rain water content. In other words, evaporation is not increasing just because there is more rain water. As is obvious from Fig. 10e, there is a strong systematic dependance of the evaporation–rain water relationship on CCN concentrations and shape parameter. The biggest differences resulting from CCN and shape parameter variations occur at maximum rain water contents. Further down, toward the ground, evaporation continues to increase until the lower parts of the boundary layer are reached and the rain water is almost insensitive to evaporation. Furthermore, evaporation also depends on the size of the clouds themselves. The effect of evaporation and entrainment of drier environmental air is larger for populations with smaller sizes than larger cloud systems simulated, e.g., in our strong forcing cases.
3.5 Relative importance of warm-rain and cold-rain processes
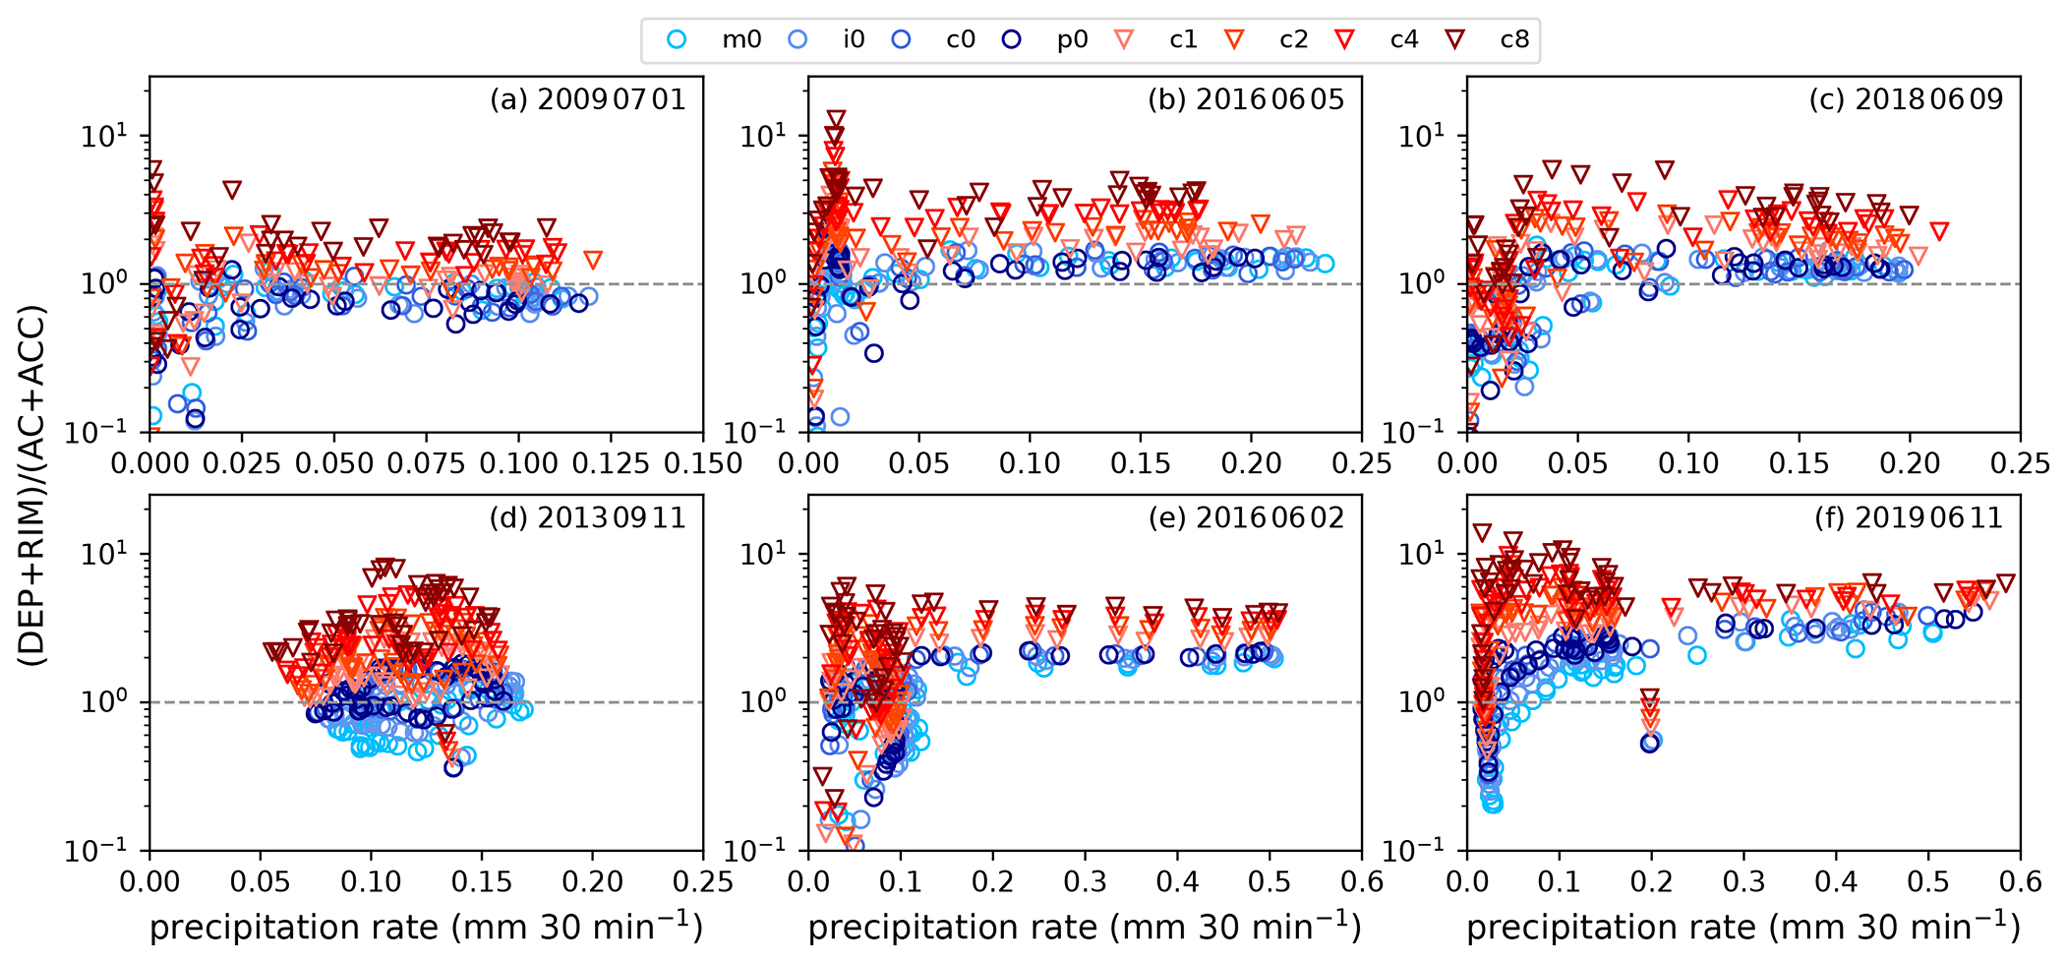
Figure 11Ratio of cold-rain formation (deposition DEP and riming RIM) to warm-rain formation (autoconversion AC and accretion ACC) for weak synoptic forcing (a–c) and strong synoptic forcing (d–f) as a function of mean precipitation rate. Note the different abscissa ranges.
In Sect. 3.3, we analyzed the percentage differences of several microphysical process rates. As neither their absolute values nor their relative contribution to warm and cold-rain processes were addressed, we now inspect the ratio of rain formation via ice (i.e., the cold-rain contribution as the sum of vapor deposition and riming) to rain formation via warm phase processes (sum of autoconversion and accretion). The analysis of this ratio as a function of the mean precipitation rate in Fig. 11 reveals a dominant cold-rain contribution for most of the cases. Only for weaker precipitation rates can the ratio be smaller than 1, indicating a dominant contribution of the warm-rain process. The weak forcing case of 1 July 2009 (Fig. 11a) reveals the smallest rain intensities of all analyzed cases. For that day, most of the CCN sensitivity runs possess a dominant warm-rain process, whereas most of the shape parameter sensitivity runs have a dominant cold-rain process. There is not a clear systematic dependance of the relative contribution on the CCN concentration. Only for two cases (11 September 2013 and 11 June 2019) does the contribution of the cold-rain process increase with increasing CCN concentration. The response of the shape parameter sensitivity runs give a clearer picture. The higher the shape parameter, the larger the cold-rain contribution will be. Interestingly, the ratios of the shape parameter sensitivity runs converge to larger values with increasing precipitation rates than the ones of the CCN sensitivity runs do. This implies that the narrowing of the CDSD not only decreases the absolute values of autoconversion and accretion (see Fig. 9) but also decreases the relative role of the warm-rain process to rain formation in general, independent of the prevailing weather regime.
Beside the relative role of the warm- and cold-rain processes for precipitation amounts, it is also of interest to study the magnitude of the two warm-rain processes, autoconversion and accretion, and their relative contribution to the warm-rain formation. From Fig. 9, we have seen that autoconversion decreased with an increasing CCN concentration and larger values of the shape parameter. For most of the analyzed cases, the accretion showed a similar trend for a narrower CDSD but with smaller magnitude. Maximum accretion rates were simulated for intermediate CCN concentrations.

Figure 12The sum of the warm-rain processes autoconversion AC and accretion ACC (a), the ratio of the AC contribution to warm-rain formation (b), and the ratio of the ACC contribution to warm-rain formation (c).
For the sake of brevity, the temporal evolution of the total warm-rain processes and their contributing parts is given for one case only (2 June 2016; Fig. 12). We find that the strength of the warm-rain process is decreasing with increasing CCN concentration. However, the reference run (c0) and the continental polluted run (p0) are almost identical, and no further warm-rain reduction is present. The runs with larger shape parameters reveal a further systematic reduction in the total warm-rain process. Overall, the contribution of accretion to the warm-rain processes outweighs the one from autoconversion. Only in the initial cloud formation phase, between 08:00 and 10:00 UTC, does the contribution of autoconversion become larger and even dominant for a short period of time in the maritime run (m0). In that time period, the ratio becomes smaller for higher CCN concentrations and larger shape parameters. For the remaining times of the day, when also precipitation intensities are high, there is only a decreasing autoconversion contribution (i.e., increasing accretion contribution) for larger aerosol loads. The contribution of both processes remains more or less identical for shape parameter variations. Other days generally show a similar behavior, with dominating accretion to the warm-rain process.
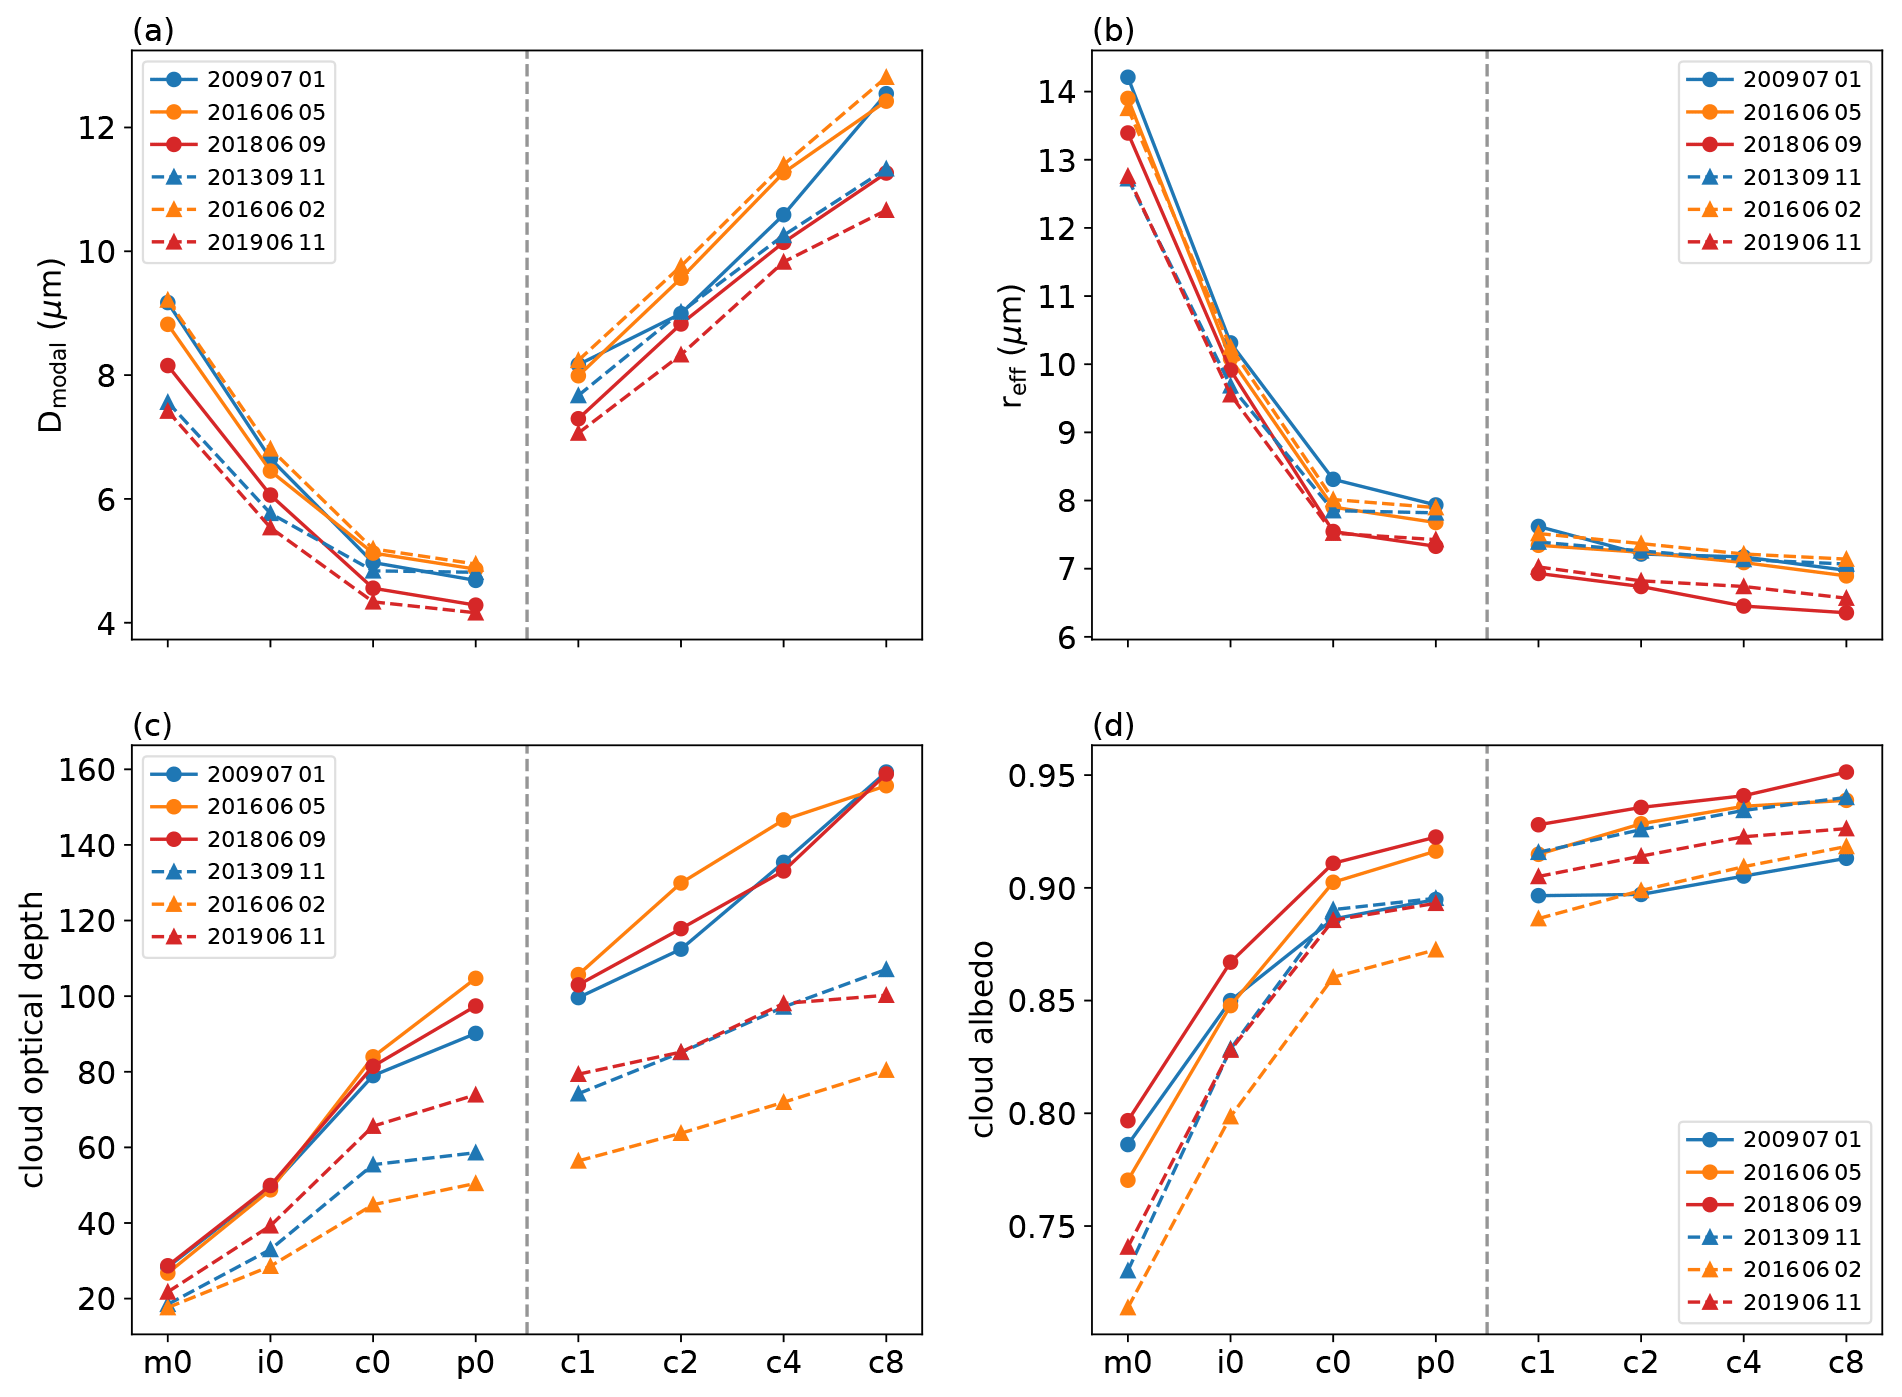
Figure 13Spatiotemporal averages of the modal diameter in the cloud droplet size distribution Dmodal (a), effective radius reff (b), cloud optical depth τc (c), and synthetic cloud albedo (d).
3.6 Impact on particle size and cloud optical depth
Both the CCN concentration and the shape parameter ν have an impact on the cloud droplet size distribution. With our simulation setup, we can investigate how large the effects are and which of our sensitivities has the largest relative impact. First, we calculated CDSDs for all cloudy grid points (liquid water content threshold of 0.01 g m−3) and determined the modal value of each CDSD. The response of this modal cloud droplet diameter at a height of 3 km a.g.l. shows an opposing trend in our sensitivity studies (Fig. 13a). The increase in aerosol load leads to more numerous, but smaller, droplets, and the maximum of the CDSD shifts to smaller values. In addition, the portion of larger cloud droplets decreases (not shown). On the other hand, increasing the shape parameter leads to a systematic increase in the size of the modal cloud droplets. By just increasing the shape parameter from 0 to 1, the modal values in continental CCN amounts are as large as in clean air (run m0).
To better quantify the differences in the entire CDSD, we computed the effective radius as the third moment of the cloud droplet size distribution over the second moment as follows:
where r is the droplet radius and n(r) the cloud droplet size distribution. The size distributions were calculated with the number and mass densities, following the approach of Seifert and Beheng (2006a, see their Appendix A). The mean effective radius was then computed using the height levels of 2, 3, 4, and 5 km a.g.l. In agreement with findings of, e.g., Peng et al. (2002), the effective radius decreases with increasing aerosol load, which is similar to the modal cloud droplet size Dmodal. Whereas Dmodal increases with larger shape parameters, the effective radius continues to decrease moderately. This is the result of the narrower size distribution, which also reduces the portion of larger cloud droplets. Such a behavior was also documented for idealized test cases (Morrison and Grabowski, 2007; Igel and van den Heever, 2017a). The cloud droplet growth in polluted clouds is limited by the competition of the available water vapor by the more numerous cloud droplets inside the cloud, which results in smaller effective radii. The effective radius and the cloud liquid water path (LWP) can then be used to approximate the cloud optical depth τc and the synthetic cloud albedo Ac after Serrano et al. (2014):
where ρL is the liquid water density. As can be seen in Fig. 13c, cloud optical depth is systematically increasing with increasing CCN concentration and larger shape parameters. The fact that the cloud optical depth increases in a similar magnitude for larger shape parameters as for increasing CCN concentrations can only partly be explained by the decrease in the effective radius, which is considerably smaller in runs c1–c8 than in runs m0–p0. The strong increase in the cloud liquid water path for larger shape parameters (see Fig. 9) seems to be the main contributor to the increase in the cloud optical depth for narrower CDSD. An increase in the CCN concentration will generally lead to an increase in the cloud droplet number concentration. Combined with the increase in the cloud liquid water path, an increase in cloud albedo is expected. There is also a significant increase in the cloud albedo with higher aerosol loads, but the further increase with larger shape parameters is lower than for the cloud optical depth. A change in the cloud optical depth or cloud albedo has important implications for the energy and radiation balance at the ground. To quantify that, we determined the range of the net radiation Q at the time of each maximum around noon (not shown). The ICON model simulates differences in the sensitivity runs for the six cases ranging from 5 to 41 W m−2 and a mean value for all days of 22 W m−2. As the total cloud cover only changes by 0.4 % on average, these changes can mostly be attributed to the different cloud optical properties. Together with the ground heat flux, the differences in the net radiation determine the available energy at the ground for the sensible and latent heat fluxes. This demonstrates the importance of both CCN assumptions and the shape of the CDSD for accurately simulating the processes in the boundary layer, which are important for convection initiation. To sum up, changes in the modal cloud droplet size and the cloud optical depth are of similar magnitude in the CCN sensitivity runs and the shape parameter sensitivity runs, whereas the effective radius and synthetic cloud albedo show the strongest response for varying CCN concentrations and a smaller sensitivity to variations in the shape parameter. The strong increase in the cloud optical depth shows that the choice of the shape parameter is indeed highly relevant for determining cloud radiative characteristics. The weaker response of the effective radius and the cloud albedo to shape parameter variations could be influenced by the fact that the reference run already has a comparatively high CCN concentration. We are currently working on the question of how different shape parameters behave at other CCN concentrations.
Furthermore, the terminal velocity of cloud drops and raindrops used in numerical models can significantly affect weather predictions (e.g., Ong et al., 2021). As cloud droplets are smaller than 50 µm in radius and, thus, have no appreciable terminal fall speed relative to the airflow, cloud droplet sedimentation is not included in the ICON model. The terminal velocity of raindrops, however, is important for the rate of removal of liquid water from the atmosphere and depends on the mean droplet diameter, which itself is impacted by the different CCN assumptions and CDSD shape parameters. Moreover, the evaporation rate of rain droplets will also depend on the terminal fall velocity. If melting particles fall slower, then the time for melting increases, which consequently reduces their mass and terminal velocity. Thus, the different cloud droplet size distributions also have a secondary impact on precipitation rates on the ground by influencing the rain droplet size distribution.
3.7 Effects on updrafts
Finally, we will investigate the impact of different aerosol loads and CDSD assumptions on convective cloud updrafts. As an example, we assess the frequency of updraft grid points as a function of height and updraft magnitude for the case of 9 June 2018 (Fig. 14). Here, only grid points with updrafts larger than 2 m s−1 are considered for hourly model outputs throughout the entire day.

Figure 14Frequency of updraft grid points as a function of height and updraft magnitude (top row) and frequency difference in percent, with respect to the reference run (bottom row) on 9 June 2018.
As is obvious from the percentage deviations to the reference run given in the bottom row of Fig. 14, the number of convective updrafts decreases with increasing CCN concentrations for most of the updraft magnitudes, indicating a negative aerosol effect. As was already pointed out for COSMO simulations using the same microphysical scheme, this may be attributed to the fact that updrafts in polluted conditions contain more water and are, therefore, less buoyant (Barthlott and Hoose, 2018). Lebo and Seinfeld (2011) stated that aerosol-induced effects are impacted by the balance between latent heat and the increase in condensed water aloft, with opposing effects on the buoyancy. A negative aerosol effect was also found by Seifert and Beheng (2006b) for ordinary cells. They argue that, in a clean environment, less water freezes, and the freezing also occurs at lower levels, which fosters the dynamics more efficiently. Only for the small range with largest velocity classes below 5 km a.g.l., do the CCN runs simulate less frequent stronger velocities than the reference run.
The increase in the shape parameter is more complex and shows the following two main characteristics: (i) below 6–7 km a.g.l. there is an increase in most of the updraft classes, except the extreme classes, which occurs less often than in the reference run, and (ii) above this level, updrafts less than 20 m s−1 tend to increase with larger shape parameters, whereas the stronger updrafts occur less often. The features found for this case are generally also present for the other days analyzed in this study, but some of them have a weaker expression. These findings demonstrate the large impact of our microphysical uncertainties on the dynamics of convective weather regimes, as some configurations produce significantly more and/or larger convective updrafts. Moreover, more feedbacks, such as the formation of stronger cold pools modifying the life cycle of multicell storms or the secondary initiation of convection at cold pool boundaries, are presumably also involved, all of which could not be investigated here.
The purpose of this study was to investigate the range of uncertainties for convective-scale predictability resulting from varying aerosol concentrations and different shape parameters of the cloud droplet size distribution and how the respective sensitivities compare to each other. To this end, we performed convection-resolving simulations with the ICON model for six real-case events over Germany classified into weak and strong synoptic-scale forcing. For each of the investigated cases, we conducted a set with four different CCN concentrations ranging from low to very high CCN concentrations, using a reference shape parameter (ν=0), and another set with increasing shape parameters (ν=1, 2, 4, and 8), using the reference CCN concentration.
With respect to the reference run, we find a stronger precipitation response for weakly forced cases than for the strongly forced cases. Integrated over the domain of Germany, precipitation totals systematically decrease with higher aerosol loads. The fact that the ICON model simulates a negative aerosol effect for all cases irrespective of the prevailing weather regime is remarkable and in contrast to previous simulations with the COSMO model, which produced an invigoration of convection, at least for some of the weakly forced cases (Barthlott and Hoose, 2018; Schneider et al., 2019; Keil et al., 2019). Whether this difference is case dependent or caused by a different implementation of the double-moment scheme in the ICON model (e.g., saturation adjustment before and after the microphysics) cannot be answered here and is left for future work. The narrowing of the cloud droplet size distribution when using larger shape parameters reduces the precipitation amounts compared to the reference run as well and is even systematic for most cases. An important finding is the fact that an increase in the shape parameter can produce almost as large a variation in precipitation totals as a CCN increase from maritime to polluted conditions. Thus, the shape parameter is an important parameter in the context of aerosol–cloud interactions, as was already pointed out for idealized simulations by Igel and van den Heever (2017c).
The percentage range of precipitation deviations (i.e., difference between maximum increase or decrease) reaches values larger than 20 % for the CCN sensitivities and 16 % for the shape parameter sensitivities for individual days. On average over all days, however, the mean precipitation sensitivity to CCN variations (12 %) is larger than for the shape parameter (7 %). These values demonstrate the importance of these microphysical uncertainties for quantitative precipitation forecasting. Taking into account that these variations are based on averages over a large area, locally stronger differences occur. These are, e.g., relevant for flood forecasting, since the location and intensity of precipitation is important to predict rainfall amounts in individual river catchments.
For the evaluation domain of Germany, the timing of convective precipitation is insensitive to the aerosol load or the assumed shape of the CDSD. Thus, the differences in precipitation totals are solely generated by weaker or stronger rain intensities. On average, 85 % of the 30 min intervals of the model run with maritime CCN and 79 % of the one with intermediate CCN concentration (both with reference shape parameter) have larger mean precipitation rates than the reference run. The model runs with larger shape parameters, on the other hand, show weaker rain intensities for most of the time. Interestingly, one of the cases revealed a turning point from weaker to stronger rain intensities than the reference run. The weaker rain intensities in the developing phase of convective clouds consume less CAPE and, consequently, allow for a higher convective instability later on in the evening, which produces stronger convection at that time. This highlights the importance of the interaction of the convective development with its thermodynamical environment. We, therefore, conclude that this interaction can be an important point for other cases, and the total precipitation amount can depend on whether (i) such a turning point exists and (ii) if it occurs early enough to have a major impact on precipitation totals. Our results show that the simulation of convective precipitation involves complex interactions between thermodynamic and microphysical processes.
The analysis of the vertically integrated hydrometeor contents shows a large systematic increase in total cloud water content with increasing CCN concentrations and narrower CDSDs, together with a reduction in the total rain water content. We could attribute this to a systematic reduction in autoconversion with increasing CCN concentration and shape parameter. Whereas cloud ice and snow generally show an increasing trend with higher aerosol loads and narrower size distribution, graupel and hail show a systematic reduction in the CCN sensitivity experiments due to weaker riming. For higher shape parameters, the graupel and hail response is not systematic and case dependent. It must be stated that hail contents are low for some of the days and that differences between small values are not reliable, and general conclusions cannot be drawn. The big impact of our microphysical uncertainties on the total rain water content ranging from +63 % to −50 % does not impact the precipitation totals at the ground in the same magnitude. The reason is the evaporation of raindrops at lower levels, which is considered to be a key process in determining the magnitude and sign of aerosol–cloud–precipitation interactions (e.g., Tao et al., 2007; Grant and van den Heever, 2015; Barthlott et al., 2017). The larger evaporation is not solely induced by the larger rain water contents but is also related to the particle size distribution with a higher number of smaller raindrops.
Our results also show a dominant cold-rain process for all cases, while the warm-rain process dominates the formation of rain water only for weaker rain intensities. However, there is not a clear systematic dependance of the relative contribution on the CCN concentration. For larger shape parameters, however, the contribution of the cold-rain processes increase as well. Interestingly, the ratios of the shape parameter sensitivity runs converge to larger values with increasing precipitation rates compared to the CCN sensitivity runs. This implies that the narrowing of the CDSD not only decreases the absolute values of autoconversion and accretion but also decreases the relative role of the warm-rain process to rain formation in general, thus being independent of the prevailing weather regime. We have also seen that the contribution of accretion dominates the one from autoconversion; for a short period and only at the initial cloud formation can autoconversion be larger than accretion. For autoconversion, changing the CCN concentration leads to a much larger response than the change in the shape parameter does, whereas the opposite is true for the warm-rain dominating accretion. This is related to the fact that clouds in polluted conditions consist of more droplets that coalesce into raindrops less effectively, but the narrowing of the CDSD further reduces the number of large droplets, which seems to have a larger effect on accretion in general.
Our findings also highlight important impacts on the optical properties of the clouds. Whereas the maximum in the CDSD shifts to smaller values when the aerosol load is higher, it increases with larger shape parameters. By just increasing the shape parameter from 0 to 1, the modal values in continental CCN amounts are as large as in clean air. The effective radius, however, decreases with increasing aerosol load and, to a lesser extent, also with increasing shape parameters as a result of the narrower size distribution, which reduces the portion of larger cloud droplets. We further find a strong systematic increase in the cloud optical depth with increasing CCN concentrations and larger shape parameters. The synthetic cloud albedo shows a positive relationship to the aerosol load as well and, to a lesser extent, also to the shape parameter. The strong increase in the cloud optical depth indicates that the choice of the shape parameter is indeed highly relevant for determining cloud radiative characteristics.
Furthermore, our simulations did not reveal an invigoration of convective clouds, a phenomenon that is also present in COSMO simulations using the same double-moment scheme used in this study. This could be influenced by the saturation adjustment scheme to treat condensational growth (Barthlott and Hoose, 2018). As stated by Lebo et al. (2012), the potential of a CCN increase to increase buoyancy at mid to upper levels could be reduced, as this technique primarily enhances condensation and latent heating at lower levels. Despite many efforts with field experiments and state-of-the-art numerical models, the validity of the invigoration effect is still an open question (Altaratz et al., 2014). In a recent study by Igel and van den Heever (2021), theoretical calculations of a new formulation of the moist adiabatic lapse rate that accounts for freezing, supersaturation, and condensate loading were performed. They find that a CCN-induced increase in storm updraft speed is theoretically possible but substantially smaller (and oftentimes even negative) than previous calculations suggested.
The findings of this study demonstrate that both the CCN assumptions and the shape parameter are important for quantitative precipitation forecasting and should be carefully chosen if double-moment schemes are used for modeling aerosol–cloud interactions. The inclusion of microphysical uncertainties by disturbing the shape parameters in ensemble forecasting is, therefore, very promising. It remains uncertain how aerosol effects are modulated in simulations with different shape parameters. Further work is needed to determine the effects of the shape parameter by combined sensitivity analyses in which CCN concentrations are systematically varied for different values of the shape parameter.
ICON model output is available on request from the authors.
CB and CK developed the project idea and designed the numerical experiments. AZ performed the numerical simulations. CB and AZ conducted the analyses, TM calculated the convective adjustment timescale, and all co-authors contributed to the interpretation of the results. CB wrote the paper, with contributions from all co-authors.
The contact author has declared that neither they nor their co-authors have any competing interests.
Publisher's note: Copernicus Publications remains neutral with regard to jurisdictional claims in published maps and institutional affiliations.
The research leading to these results has been done within the subproject B3 of the Transregional Collaborative Research Centre SFB/TRR 165 “Waves to Weather” (http://www.wavestoweather.de, last access: 15 February 2022), which is funded by the German Research Foundation (DFG). The authors wish to thank the German Weather Service (DWD) for providing the ICON model code. We are also grateful for the provision of the initial and boundary data by DWD and the European Centre for Medium-Range Weather Forecasts (ECMWF). This work was performed on the supercomputer ForHLR funded by the Ministry of Science, Research and the Arts Baden-Württemberg and by the Federal Ministry of Education and Research.
This research has been supported by the Deutsche Forschungsgemeinschaft (project B3 in Transregional Collaborative Research Centre SFB/TRR 165 “Waves to Weather”; grant no. 257899354 – TRR 165).
This paper was edited by Franziska Glassmeier and reviewed by two anonymous referees.
Albrecht, B. A.: Aerosols, cloud microphysics, and fractional cloudiness, Science, 245, 1227–1230, 1989. a
Altaratz, O., Koren, I., Reisin, T., Kostinski, A., Feingold, G., Levin, Z., and Yin, Y.: Aerosols' influence on the interplay between condensation, evaporation and rain in warm cumulus cloud, Atmos. Chem. Phys., 8, 15–24, https://doi.org/10.5194/acp-8-15-2008, 2008. a
Altaratz, O., Koren, I., Remer, L., and Hirsch, E.: Review: Cloud invigoration by aerosols–Coupling between microphysics and dynamics, Atmos. Res., 140–141, 38–60, https://doi.org/10.1016/j.atmosres.2014.01.009, 2014. a, b
Barthlott, C. and Barrett, A. I.: Large impact of tiny model domain shifts for the Pentecost 2014 mesoscale convective system over Germany, Weather Clim. Dynam., 1, 207–224, https://doi.org/10.5194/wcd-1-207-2020, 2020. a
Barthlott, C. and Hoose, C.: Aerosol effects on clouds and precipitation over central Europe in different weather regimes, J. Atmos. Sci., 75, 4247–4264, https://doi.org/10.1175/JAS-D-18-0110.1, 2018. a, b, c, d, e, f, g, h, i, j, k, l, m, n, o
Barthlott, C., Mühr, B., and Hoose, C.: Sensitivity of the 2014 Pentecost storms over Germany to different model grids and microphysics schemes, Q. J. Roy. Meteor. Soc., 143, 1485–1503, https://doi.org/10.1002/qj.3019, 2017. a, b, c, d, e, f
Bechtold, P., Köhler, M., Jung, T., Doblas-Reyes, F., Leutbecher, M., Rodwell, M. J., Vitart, F., and Balsamo, G.: Advances in simulating atmospheric variability with the ECMWF model: From synoptic to decadal time-scales, Q. J. Roy. Meteor. Soc., 134, 1337–1351, https://doi.org/10.1002/qj.289, 2008. a
Clark, P., Roberts, N., Lean, H., Ballard, S. P., and Charlton-Perez, C.: Convection-permitting models: a step-change in rainfall forecasting, Meteorol. Appl., 23, 165–181, https://doi.org/10.1002/met.1538, 2016. a
Cohard, J.-M. and Pinty, J.-P.: A comprehensive two-moment warm microphysical bulk scheme. I: Description and tests., Q. J. Roy. Meteor. Soc., 126, 1815–1842, https://doi.org/10.1256/smsqj.56613, 2000. a
Costa-Surós, M., Sourdeval, O., Acquistapace, C., Baars, H., Carbajal Henken, C., Genz, C., Hesemann, J., Jimenez, C., König, M., Kretzschmar, J., Madenach, N., Meyer, C. I., Schrödner, R., Seifert, P., Senf, F., Brueck, M., Cioni, G., Engels, J. F., Fieg, K., Gorges, K., Heinze, R., Siligam, P. K., Burkhardt, U., Crewell, S., Hoose, C., Seifert, A., Tegen, I., and Quaas, J.: Detection and attribution of aerosol–cloud interactions in large-domain large-eddy simulations with the ICOsahedral Non-hydrostatic model, Atmos. Chem. Phys., 20, 5657–5678, https://doi.org/10.5194/acp-20-5657-2020, 2020. a
Cui, Z., Davies, S., Carslaw, K. S., and Blyth, A. M.: The response of precipitation to aerosol through riming and melting in deep convective clouds, Atmos. Chem. Phys., 11, 3495–3510, https://doi.org/10.5194/acp-11-3495-2011, 2011. a
Dipankar, A., Stevens, B., Heinze, R., Moseley, C., Zängl, G., Giorgetta, M., and Brdar, S.: Large eddy simulation using the general circulation model ICON, J. Adv. Model. Earth Syst., 7, 963–986, https://doi.org/10.1002/2015MS000431, 2015. a
Fan, J., Wand, Y., Rosenfeld, D., and Liu, X.: Review of Aerosol-Cloud Interactions: Mechanisms, Significance, and Challenges, J. Atmos. Sci., 73, 4221–4252, https://doi.org/10.1175/JAS-D-16-0037.1, 2016. a
Gossard, E. E.: Measurement of Cloud Droplet Size Spectra by Doppler Radar, J. Atmos. Ocean. Tech., 11, 712–726, https://doi.org/10.1175/1520-0426(1994)011<0712:MOCDSS>2.0.CO;2, 1994. a
Grabowski, W. W. and Morrison, H.: Modeling Condensation in Deep Convection, J. Atmos. Sci., 74, 2247–2267, https://doi.org/10.1175/JAS-D-16-0255.1, 2017. a, b
Grant, L. D. and van den Heever, S. C.: Cold pool and precipitation responses to aerosol loading: Modulation by dry layers, J. Atmos. Sci., 72, 1398–1408, https://doi.org/10.1175/JAS-D-14-0260.1, 2015. a, b
Hande, L. B., Engler, C., Hoose, C., and Tegen, I.: Seasonal variability of Saharan desert dust and ice nucleating particles over Europe, Atmos. Chem. Phys., 15, 4389–4397, https://doi.org/10.5194/acp-15-4389-2015, 2015. a
Hande, L. B., Engler, C., Hoose, C., and Tegen, I.: Parameterizing cloud condensation nuclei concentrations during HOPE, Atmos. Chem. Phys., 16, 12059–12079, https://doi.org/10.5194/acp-16-12059-2016, 2016. a
Heinze, R., Dipankar, A., Carbajal Henken, C., Moseley, C., Sourdeval, O., Trömel, S., Xie, X., Adamidis, P., Ament, F., Baars, H., Barthlott, C., Behrendt, A., Blahak, U., Bley, S., Brdar, S., Brueck, M., Crewell, S., Deneke, H., Di Girolamo, P., Evaristo, R., Fischer, J., Frank, C., Friederichs, P., Göcke, T., Gorges, K., Hande, L., Hanke, M., Hansen, A., Hege, H.-C., Hoose, C., Jahns, T., Kalthoff, N., Klocke, D., Kneifel, S., Knippertz, P., Kuhn, A., van Laar, T., Macke, A., Maurer, V., Mayer, B., Meyer, C. I., Muppa, S. K., Neggers, R. A. J., Orlandi, E., Pantillon, F., Pospichal, B., Röber, N., Scheck, L., Seifert, A., Seifert, P., Senf, F., Siligam, P., Simmer, C., Steinke, S., Stevens, B., Wapler, K., Weniger, M., Wulfmeyer, V., Zängl, G., Zhang, D., and Quaas, J.: Large-eddy simulations over Germany using ICON: a comprehensive evaluation, Q. J. Roy. Meteor. Soc., 143, 69–100, https://doi.org/10.1002/qj.2947, 2017. a
Heise, E., Ritter, B., and Schrodin, E.: Operational implementation of the multilayer soil model TERRA, Technical Report 9, http://www.cosmo-model.org (last access: 18 September 2018), 19 pp., 2006. a
Igel, A. L. and van den Heever, S. C.: The role of the gamma function shape parameter in determining differences between condensation rates in bin and bulk microphysics schemes, Atmos. Chem. Phys., 17, 4599–4609, https://doi.org/10.5194/acp-17-4599-2017, 2017a. a, b
Igel, A. L. and van den Heever, S. C.: The Importance of the Shape of Cloud Droplet Size Distributions in Shallow Cumulus Clouds. Part I: Bin Microphysics Simulations, J. Atmos. Sci., 74, 249–258, https://doi.org/10.1175/JAS-D-15-0382.1, 2017b. a
Igel, A. L. and van den Heever, S. C.: The Importance of the Shape of Cloud Droplet Size Distributions in Shallow Cumulus Clouds. Part II: Bulk Microphysics Simulations, J. Atmos. Sci., 74, 259–273, https://doi.org/10.1175/JAS-D-15-0383.1, 2017c. a, b, c
Igel, A. L. and van den Heever, S. C.: Invigoration or Enervation of Convective Clouds by Aerosols?, Geophys. Res. Lett., 48, e2021GL093804, https://doi.org/10.1029/2021GL093804, 2021. a
Kärcher, B. and Lohmann, U.: A parameterization of cirrus cloud formation: Homogeneous freezing of supercooled aerosols, J. Geophys. Res., 107, AAC 4-1–AAC 4-10, https://doi.org/10.1029/2001JD000470, 2002. a
Kärcher, B., Hendricks, J., and Lohmann, U.: Physically based parameterization of cirrus cloud formation for use in global atmospheric models, J. Geophys. Res., 111, d01205, https://doi.org/10.1029/2005JD006219, 2006. a
Keil, C., Heinlein, F., and Craig, G. C.: The convective adjustment time-scale as indicator of predictability of convective precipitation, Q. J. Roy. Meteor. Soc., 140, 480–490, https://doi.org/10.1002/qj.2143, 2014. a
Keil, C., Baur, F., Bachmann, K., Rasp, S., Schneider, L., and Barthlott, C.: Relative contribution of soil moisture, boundary-layer and microphysical perturbations on convective predictability in different weather regimes, Q. J. Roy. Meteor. Soc., 145, 3102–3115, https://doi.org/10.1002/qj.3607, 2019. a, b, c, d
Khain, A. P., BenMoshe, N., and Pokrovsky, A.: Factors Determining the Impact of Aerosols on Surface Precipitation from Clouds: An Attempt at Classification, J. Atmos. Sci., 65, 1721–1748, https://doi.org/10.1175/2007JAS2515.1, 2008. a
Khain, A. P., Beheng, K. D., Heymsfield, A., Korolev, A., Krichak, S. O., Levin, Z., Pinsky, M., Phillips, V., Prabhakaran, T., Teller, A., van den Heever, S. C., and Yano, J.-I.: Representation of microphysical processes in cloud-resolving models: Spectral (bin) microphysics versus bulk parameterization, Rev. Geophys., 53, 247–322, https://doi.org/10.1002/2014RG000468, 2015. a
Lebo, Z. J. and Seinfeld, J. H.: Theoretical basis for convective invigoration due to increased aerosol concentration, Atmos. Chem. Phys., 11, 5407–5429, https://doi.org/10.5194/acp-11-5407-2011, 2011. a
Lebo, Z. J., Morrison, H., and Seinfeld, J. H.: Are simulated aerosol-induced effects on deep convective clouds strongly dependent on saturation adjustment?, Atmos. Chem. Phys., 12, 9941–9964, https://doi.org/10.5194/acp-12-9941-2012, 2012. a, b
Leuenberger, D., Koller, M., Fuhrer, O., and Schär, C.: A Generalization of the SLEVE Vertical Coordinate, Mon. Weather Rev., 138, 3683–3689, https://doi.org/10.1175/2010MWR3307.1, 2010. a
Levin, M.: Functions to represent drop size distributions in clouds: The optical density of clouds, Ser. Geofiz., 10, 698–702, 1958. a
Marinescu, P. J., van den Heever, S. C., Heikenfeld, M., Barrett, A. I., Barthlott, C., Hoose, C., Fan, J., Fridlind, A. M., Matsui, T., Miltenberger, A. K., Stier, P., Vie, B., White, B. A., and Zhang, Y.: Impacts of Varying Concentrations of Cloud Condensation Nuclei On Deep Convective Cloud Updrafts – A Multimodel Assessment, J. Atmos. Sci., 78, 1147–1172, https://doi.org/10.1175/JAS-D-20-0200.1, 2021. a
Martins, J. A. and Silva Dias, M. A. F.: The impact of smoke from forest fires on the spectral dispersion of cloud droplet size distributions in the Amazonian region, Environ. Res. Lett., 4, 1–8, https://doi.org/10.1088/1748-9326/4/1/015002, 2009. a
May, P. T., Bringi, V. N., and Thurai, M.: Do We Observe Aerosol Impacts on DSDs in Strongly Forced Tropical Thunderstorms?, J. Atmos. Sci., 68, 1902–1910, https://doi.org/10.1175/2011JAS3617.1, 2011. a
Milbrandt, J. A. and Yau, M. K.: A multimoment bulk microphysics parameterization. Part I: Analysis of the role of the spectral shape parameter, J. Atmos. Sci., 62, 3051–3064, https://doi.org/10.1175/JAS3534.1, 2005. a
Miles, N. L., Verlinde, J., and Clothiaux, E. E.: Cloud Droplet Size Distributions in Low-Level Stratiform Clouds, J. Atmos. Sci., 57, 295–311, https://doi.org/10.1175/1520-0469(2000)057<0295:CDSDIL>2.0.CO;2, 2000. a
Mlawer, E. J., Taubman, S. J., Brown, P. D., Iacono, M. J., and Clough, S. A.: Radiative transfer for inhomogeneous atmospheres: RRTM, a validated correlated-k model for the longwave, J. Geophys. Res., 102, 16663–16682, https://doi.org/10.1029/97JD00237, 1997. a
Mohr, S., Wilhelm, J., Wandel, J., Kunz, M., Portmann, R., Punge, H. J., Schmidberger, M., Quinting, J. F., and Grams, C. M.: The role of large-scale dynamics in an exceptional sequence of severe thunderstorms in Europe May–June 2018, Weather Clim. Dynam., 1, 325–348, https://doi.org/10.5194/wcd-1-325-2020, 2020. a
Morrison, H. and Grabowski, W. W.: Comparison of Bulk and Bin Warm-Rain Microphysics Models Using a Kinematic Framework, J. Atmos. Sci., 64, 2839–2861, https://doi.org/10.1175/JAS3980, 2007. a, b
Morrison, H., Thompson, G., and Tatarskii, V.: Impact of Cloud Microphysics on the Development of Trailing Stratiform Precipitation in a Simulated Squall Line: Comparison of One- and Two-Moment Schemes, Mon. Weather Rev., 137, 991–1007, https://doi.org/10.1175/2008MWR2556.1, 2009. a
Ong, C. R., Miura, H., and Koike, M.: The Terminal Velocity of Axisymmetric Cloud Drops and Raindrops Evaluated by the Immersed Boundary Method, J. Atmos. Sci., 78, 1129–1146, https://doi.org/10.1175/JAS-D-20-0161.1, 2021. a
Peng, Y., Lohmann, U., Leaitch, R., Banic, C., and Couture, M.: The cloud albedo-cloud droplet effective radius relationship for clean and polluted clouds from RACE and FIRE.ACE, J. Geophys. Res., 107, AAC 1-1–AAC 1-6, https://doi.org/10.1029/2000JD000281, 2002. a
Piper, D., Kunz, M., Ehmele, F., Mohr, S., Mühr, B., Kron, A., and Daniell, J.: Exceptional sequence of severe thunderstorms and related flash floods in May and June 2016 in Germany – Part 1: Meteorological background, Nat. Hazards Earth Syst. Sci., 16, 2835–2850, https://doi.org/10.5194/nhess-16-2835-2016, 2016. a
Raschendorfer, M.: The new turbulence parameterization of LM, COSMO Newsletter 1, 89–97, http://www.cosmo-model.org (last access: 13 May 2020), 115 pp., 2001. a
Rasmussen, R. M. and Heymsfield, A. J.: Melting and Shedding of Graupel and Hail. Part II: Sensitivity Study, J. Atmos. Sci., 44, 2764–2782, https://doi.org/10.1175/1520-0469(1987)044<2764:MASOGA>2.0.CO;2, 1987. a
Rieger, D., Bangert, M., Bischoff-Gauss, I., Förstner, J., Lundgren, K., Reinert, D., Schröter, J., Vogel, H., Zängl, G., Ruhnke, R., and Vogel, B.: ICON–ART 1.0 – a new online-coupled model system from the global to regional scale, Geosci. Model Dev., 8, 1659–1676, https://doi.org/10.5194/gmd-8-1659-2015, 2015. a
Rosenfeld, D., Lohmann, U., Raga, G., O'Dowd, C., Kulmala, M., Fuzzi, S., Reissell, A., and Andreae, M.: Flood or Drought: How Do Aerosols Affect Precipitation?, Science, 321, 1309–1313, https://doi.org/10.1126/science.1160606, 2008. a
Rybka, H., Burkhardt, U., Köhler, M., Arka, I., Bugliaro, L., Görsdorf, U., Horváth, Á., Meyer, C. I., Reichardt, J., Seifert, A., and Strandgren, J.: The behavior of high-CAPE (convective available potential energy) summer convection in large-domain large-eddy simulations with ICON, Atmos. Chem. Phys., 21, 4285–4318, https://doi.org/10.5194/acp-21-4285-2021, 2021. a
Schneider, L., Barthlott, C., Barrett, A. I., and Hoose, C.: The precipitation response to variable terrain forcing over low-mountain ranges in different weather regimes, Q. J. Roy. Meteor. Soc., 144, 970–989, https://doi.org/10.1002/qj.3250, 2018. a
Schneider, L., Barthlott, C., Hoose, C., and Barrett, A. I.: Relative impact of aerosol, soil moisture, and orography perturbations on deep convection, Atmos. Chem. Phys., 19, 12343–12359, https://doi.org/10.5194/acp-19-12343-2019, 2019. a, b, c, d, e, f, g
Segal, Y. and Khain, A.: Dependence of droplet concentration on aerosol conditions in different cloud types: application to droplet concentration parameterization of aerosol conditions, J. Geophys. Res., 111, D15240, https://doi.org/10.1029/2005JD006561, 2006. a
Seifert, A. and Beheng, K. D.: A double-moment parameterization for simulating autoconversion, accretion and selfcollection, Atmos. Res., 59–60, 265–281, https://doi.org/10.1016/S0169-8095(01)00126-0, 2001. a
Seifert, A. and Beheng, K. D.: A two-moment cloud microphysics parameterization for mixed-phase clouds. Part I: Model description, Meteorol. Atmos. Phys., 92, 67–82, https://doi.org/10.1007/s00703-005-0112-4, 2006a. a, b, c, d, e
Seifert, A. and Beheng, K. D.: A two-moment cloud microphysics parameterization for mixed-phase clouds. Part II: Maritime vs. continental deep convective storms, Meteorol. Atmos. Phys., 92, 45–66, 2006b. a, b
Seifert, A., Köhler, C., and Beheng, K. D.: Aerosol-cloud-precipitation effects over Germany as simulated by a convective-scale numerical weather prediction model, Atmos. Chem. Phys., 12, 709–725, https://doi.org/10.5194/acp-12-709-2012, 2012. a, b
Serrano, D., Núñez, M., Utrillas, M. P., Marín, M. J., Marcos, C., and Martínez-Lozano, J. A.: Effective cloud optical depth for overcast conditions determined with a UV radiometers, Int. J. Climatol., 34, 3939–3952, https://doi.org/10.1002/joc.3953, 2014. a
Storer, R. L. and van den Heever, S. C.: Microphysical Processes Evident in Aerosol Forcing of Tropical Deep Convective Clouds, J. Atmos. Sci., 70, 430–446, https://doi.org/10.1175/JAS-D-12-076.1, 2013. a
Storer, R. L., van den Heever, S. C., and Stephens, G. L.: Modeling Aerosol Impacts on Convective Storms in Different Environments, J. Atmos. Sci., 67, 3904–3915, https://doi.org/10.1175/2010JAS3363.1, 2010. a
Tao, W.-K., Li, X., Khain, A., Matsui, T., Lang, S., and Simpson, J.: Role of atmospheric aerosol concentration on deep convective precipitation: Cloud-resolving model simulations, J. Geophys. Res., 112, D24S18, https://doi.org/10.1029/2007JD008728, 2007. a
Tao, W.-K., Chen, J.-P., Li, Z., Wang, C., and Zhang, C.: Impact of aerosols on convective clouds and precipitation, Rev. Geophys., 50, RG2001, https://doi.org/10.1029/2011RG000369, 2012. a, b, c
Tiedtke, M.: A comprehensive mass flux scheme for cumulus parameterization in large-scale models, Mon. Weather Rev., 117, 1779–1800, https://doi.org/10.1175/1520-0493(1989)117<1779:ACMFSF>2.0.CO;2, 1989. a
van den Heever, S. C., Stephens, G. L., and Wood, N. B.: Aerosol indirect effects on tropical convection characteristics under conditions of radiative-convective equilibrium, J. Atmos. Sci., 68, 699–718, https://doi.org/10.1175/2010JAS3603.1, 2011. a
Wellmann, C., Barrett, A. I., Johnson, J. S., Kunz, M., Vogel, B., Carslaw, K. S., and Hoose, C.: Comparing the impact of environmental conditions and microphysics on the forecast uncertainty of deep convective clouds and hail, Atmos. Chem. Phys., 20, 2201–2219, https://doi.org/10.5194/acp-20-2201-2020, 2020. a
Wilhelm, J., Mohr, S., Punge, H. J., Mühr, B., Schmidberger, M., Daniell, J. E., Bedka, K. M., and Kunz, M.: Severe thunderstorms with large hail across Germany in June 2019, Weather, 76, 228–237, https://doi.org/10.1002/wea.3886, 2021. a
Zängl, G.: Extending the Numerical Stability Limit of Terrain-Following Coordinate Models over Steep Slopes, Mon. Weather Rev., 140, 3722–3733, https://doi.org/10.1175/MWR-D-12-00049.1, 2012. a
Zängl, G., Reinert, D., Rípodas, P., and Baldauf, M.: The ICON (ICOsahedral Non-hydrostatic) modelling framework of DWD and MPI-M: Description of the non-hydrostatic dynamical core, Q. J. Roy. Meteor. Soc., 141, 563–579, https://doi.org/10.1002/qj.2378, 2015. a