the Creative Commons Attribution 4.0 License.
the Creative Commons Attribution 4.0 License.
 | 19 Dec 2022
Aerosol activation characteristics and prediction at the central European ACTRIS research station of Melpitz, Germany
Laurent Poulain
Chunsong Lu
Frank Stratmann
Yuying Wang
Shengjie Niu
Mira L. Pöhlker
Hartmut Herrmann
Alfred Wiedensohler
Understanding aerosol particle activation is essential for evaluating aerosol indirect effects (AIEs) on climate. Long-term measurements of aerosol particle activation help to understand the AIEs and narrow down the uncertainties of AIEs simulation. However, they are still scarce. In this study, more than 4 years of comprehensive aerosol measurements were utilized at the central European research station of Melpitz, Germany, to gain insight into the aerosol particle activation and provide recommendations on improving the prediction of number concentration of cloud condensation nuclei (CCN, NCCN). (1) The overall CCN activation characteristics at Melpitz are provided. As supersaturation (SS) increases from 0.1 % to 0.7 %, the median NCCN increases from 399 to 2144 cm−3, which represents 10 % to 48 % of the total particle number concentration with a diameter range of 10–800 nm, while the median hygroscopicity factor (κ) and critical diameter (Dc) decrease from 0.27 to 0.19 and from 176 to 54 nm, respectively. (2) Aerosol particle activation is highly variable across seasons, especially at low-SS conditions. At SS=0.1 %, the median NCCN and activation ratio (AR) in winter are 1.6 and 2.3 times higher than the summer values, respectively. (3) Both κ and the mixing state are size-dependent. As the particle diameter (Dp) increases, κ increases at Dp of ∼40 to 100 nm and almost stays constant at Dp of 100 to 200 nm, whereas the degree of the external mixture keeps decreasing at Dp of ∼40 to 200 nm. The relationships of κ vs. Dp and degree of mixing vs. Dp were both fitted well by a power-law function. (4) Size-resolved κ improves the NCCN prediction. We recommend applying the κ–Dp power-law fit for NCCN prediction at Melpitz, which performs better than using the constant κ of 0.3 and the κ derived from particle chemical compositions and much better than using the NCCN (AR) vs. SS relationships. The κ–Dp power-law fit measured at Melpitz could be applied to predict NCCN for other rural regions. For the purpose of improving the prediction of NCCN, long-term monodisperse CCN measurements are still needed to obtain the κ–Dp relationships for different regions and their seasonal variations.
- Article
(5166 KB) - Full-text XML
-
Supplement
(1930 KB) - BibTeX
- EndNote


The specific subset of aerosol particles that serves as nuclei for the condensation of water vapor, forming cloud droplets at a given supersaturation (SS) condition, is known as cloud condensation nuclei (CCN). Aerosol particle activation affects the aerosol and cloud interactions (ACIs), thereby changing the cloud microstructure (Zhao et al., 2012; Jia et al., 2019; Wang et al., 2019), precipitation (Khain, 2009; Wang et al., 2011; Fan et al., 2012, 2018), radiation (Twomey, 1974, 1977; Albrecht, 1989; Zhao and Garrett, 2015), and by these effects the global climate (Ramanathan et al., 2001; Rosenfeld et al., 2019). The latest sixth assessment report from IPCC (2021) pointed out that aerosol indirect effects (AIEs) remain the most considerable uncertainty in assessing the anthropogenic contribution to present and future climate change.
The ambient SS and aerosol activation ability are both important for predicting the number concentration of cloud droplets. The classical Köhler theory (Köhler, 1936), combining the Raoult law with the Kelvin effect, illustrates that the aerosol particle activation depends on particle size, chemical composition, and the given SS. Petters and Kreidenweis (2007) parameterized the Raoult term with a single hygroscopicity factor κ to capture the water activity without needing to know anything about the dissolved compounds. Different perspectives have been presented on the influence of particle size and composition on the CCN activation. In terms of a single aerosol particle, the actual particle size plays a more important role than the chemical composition for activation because of the different range in which κ and particle diameter (Dp) vary and the reciprocal relationship between κ and the third power of the critical Dp () at a given SS. As for a population of aerosol particles, Dusek et al. (2006) concluded that particle number size distribution (PNSD) matters more than the chemical composition distribution, which has been supported by many experiments. Even sometimes, assuming a constant κ still predicted CCN number concentration (NCCN) well (e.g., Sihto et al., 2011; Wang et al., 2018a). Andreae and Rosenfeld (2008) reviewed the previous studies on aerosol particle activation and recommended that for modeling purposes, the global κ values of 0.3±0.1 and 0.7±0.2 can be representative for continental and marine aerosol, respectively, which has been widely used to predict NCCN. The regional variability should be emphasized because the mean κ measured in urban, rural, and forest exhibits significant differences. For instance, Sihto et al. (2011) suggested an average κ of 0.18 to predict the CCN activation well in boreal forest conditions in Hyytiälä, Finland. A fixed κ of 0.31 suffices to calculate the NCCN in a suburban site located in the center of the North China Plain (Wang et al., 2018a). The mean κ is 0.5 in a near-coast background station (CESAR Tower) in the Netherlands (Schmale et al., 2018). The median κ ranges from 0.02 to 0.16 at SS=0.1–1.0 % in an urban background site in Budapest, Hungary (Salma et al., 2021). Therefore, the assumption of a constant κ=0.3 may not be appropriate when trying to predict NCCN for different continental regions.
Additionally, some experiments, especially conducted on more diverse particulate sources, have indicated that chemistry does play an important role in NCCN variability (e.g., Nenes et al., 2002; Petters and Kreidenweis, 2007; Rose et al., 2010). Not only the bulk chemical composition with a constant κ should be considered for NCCN prediction, but the size-resolved chemical composition (Deng et al., 2011; Wu et al., 2016), and the mixing state should be applied (Su et al., 2010; Zhang et al., 2014). Information on the organic aerosol fraction improves NCCN prediction considerably (Poulain et al., 2010; Zhang et al., 2016; Kuang et al., 2020). Freshly formed particles are about 1 nm in diameter (Kulmala et al., 2012), which must grow to tens of nanometers in diameter to serve as the effective CCN at a relatively high SS of ∼1 % (Dusek et al., 2006) and even larger than 200 nm to be efficient at SS less than 0.1 % (Deng et al., 2013). Aerosol chemical composition changes during the growing and aging processes. For instance, photochemical processes promote the formation of secondary inorganic species and increase the particle size, causing a positive correlation between κ and particle size (Massling et al., 2009; Zhang et al., 2017; Wang et al., 2018b). On the other hand, in sulfate-dominated new particle formation (NPF) events with subsequent particle growth by condensation of organic vapors, the κ of small particles may exceed the κ of the larger ones (Wang et al., 2018a). If the κ of organic aerosol increases from 0.05 to 0.15, the global average aerosol radiative forcing would decrease by ∼1 W m−2, which is in the same order of magnitude as the overall climate forcing of anthropogenic aerosol during the industrialization period (Rastak et al., 2017).
To obtain the regional parameters of aerosol particle activation, extensive field campaigns have been conducted worldwide. Besides the significant spatial difference, also the temporal variations of aerosol activation characteristics are essential for NCCN prediction (Andreae and Rosenfeld, 2008). Most of the observations lasted 1–2 months or even less, mainly focusing on the effects of short-term weather processes or pollution events on aerosol particle activation, such as the effects of the summer monsoon (Jayachandran et al., 2020), wet removal (Croft et al., 2009), NPF events (Dusek et al., 2010; Wu et al., 2015), biomass burning (Rose et al., 2010), and aerosol particle aging as well as oxidation processes (Zhang et al., 2016, 2017). The long-term CCN measurements (of at least 1 full year) are still rarely reported, resulting in insufficient knowledge concerning the seasonal and annual cycles of aerosol particle activation, which are also critical for model predictions and evaluations. Burkart et al. (2011) reported the particle activation in the urban background aerosol of Vienna, Austria, based on 11-month aerosol and CCN concentration measurements. Paramonov et al. (2015) reported a synthesis of CCN measurements within the EUCAARI network using the long-term data collected at 14 locations. Pöhlker et al. (2016) presented the climatology of CCN properties of a remote central Amazonian rain forest site using 1-year measurements. Che et al. (2017) provided the aerosol activation properties in the Yangtze River Delta, China, based on ∼1-year measurements. Using the long-term (of most >1 year) aerosol and CCN concentration measurements from 12 sites, Schmale et al. (2018) presented the spatial differences in aerosol particle activation for various regional backgrounds. However, systematic studies focusing on the seasonal cycle of size-resolved particle activation and respective CCN predictions are still scarce in the central European continent. Such a study would be of great help for understanding ACIs and narrowing down the regional uncertainties in climate predictions.
In this investigation, more than 4 years of comprehensive measurements of aerosol physical, chemical, and activation properties collected at the ACTRIS (Aerosol, Clouds and Trace Gases Research Infrastructure, http://www.actris.eu/, last access: 14 June 2022) site of Melpitz, Germany, are utilized. The major objective is to gain insight into the aerosol particle activation and provide recommendations on methods for NCCN predictions. We present therefore the long-term observations and seasonal cycles of various particle activation variables such as NCCN, activation ratio, critical diameter, size-resolved κ, and mixing state. Furthermore, we evaluated the accuracy of NCCN calculated from five different activation schemes and finally provide recommendations on NCCN predictions at Melpitz and for other rural regions.
2.1 Experiment details
Atmospheric aerosol measurements were conducted at the Melpitz observatory (51.54∘ N, 12.93∘ E; 86 m a.s.l.), 50 km to the northeast of Leipzig, Germany. The aerosol particles observed at Melpitz can be regarded as representative for the central European rural background conditions (Birmili et al., 2009). The surroundings of the site are mostly pastures and forests without significant sources of anthropogenic emissions. More detailed descriptions of the Melpitz site can be found, for example, in Poulain et al. (2020).

Figure 1Schematic diagram of the experimental setup. D-MPSS – dual-mobility particle size spectrometer; ACSM – aerosol chemical species monitor; MAAP – multi-angle absorption photometer; DMA – differential mobility analyzer; CPC – condensation particle counter; CCNC – cloud condensation nuclei counter.
This study focuses on the physicochemical properties and the activation ability of aerosol particles using the data collected at Melpitz from August 2012 to October 2016. Figure 1 depicts the experimental setup. All instruments were in the same container laboratory and utilized the same air inlet. Ambient aerosol particles were first pretreated through a PM10 Anderson inlet, and an automatic aerosol diffusion dryer kept the relative humidity in sampling lines less than 40 % following the ACTRIS recommendations. Subsequently, the aerosol flow was divided into the different instruments using an isokinetic splitter. Particle number size distributions (PNSDs) were measured using a dual-mobility particle size spectrometer (D-MPSS, TROPOS-type; Birmili et al., 1999; Wiedensohler et al., 2012) with a diameter range of 5–800 nm. An aerosol chemical speciation monitor (ACSM, Aerodyne Inc; Ng et al., 2011) was used to measure the chemical compositions of the non-refractory submicron aerosol particulate matter (nitrate, sulfate, chloride, ammonium, and organics). A multi-angle absorption photometer (MAAP, model 5012, Thermo Scientific; Petzold and Schönlinner, 2004) was used to measure the particle light absorption coefficients and to estimate the equivalent black carbon (eBC) mass concentration. For simultaneous measurement of particle and CCN number size distributions, dried aerosol particles were passed through the bipolar charger to establish charge equilibrium (Wiedensohler, 1988) and then through a differential mobility analyzer (DMA) for selecting a monodisperse particle fraction. After the DMA, the flow was split to pass through a condensation particle counter (CPC, model 3010, TSI) to measure the total number concentration of the selected monodisperse condensation nuclei (NCN) and through a cloud condensation nuclei counter (CCNC, model 100, Droplet Measurement Technologies; Roberts and Nenes, 2005) to measure the NCCN. Thus, the size-dependent activated fraction (AF, NCCN/NCN) curve, i.e., the AF at a certain diameter (Dp) of dry particles, could be obtained. The losses in both instruments were checked, and it was corrected for in the inversion routine. The coupling between size selection and CCNC was programmed in a way that the size-resolved measurements started only after the temperature and thereby the SS of the CCNC were stabilized. As the diameter scan started after SS stabilization, the measurement itself was the same length at all SS conditions. At fully stabilized CCNC conditions we did one Dp scan at per SS setting. A total of five different SS conditions were set in the CCNC instrument (0.1 %, 0.2 %, 0.3 %, 0.5 %, and 0.7 %). A complete SS cycle lasted ∼2.5 h, and the slight variations in the 2.5 h total SS cycle were only due to the waiting time until the temperature of the CCNC was stabilized.
All the instrumentation was frequently calibrated within the framework of the European Center for Aerosol Calibration and Characterization (ECAC, https://www.actris-ecac.eu/, last access: 14 June 2022). The ACSM was regularly calibrated according to the manufacturer's recommendations with 350 nm monodispersed ammonium nitrate and ammonium sulfate particles (Freney et al., 2019). The D-MPSS was calibrated following the recommendations in Wiedensohler et al. (2018). Throughout the campaign, the CCNC was calibrated once a year following the procedures outlined in Rose et al. (2008) using the E-AIM model (Clegg et al. 1998). The measurement uncertainties of these instruments should be noted. The uncertainty in the MAAP is within 10 % (Müller et al., 2011), and those in the D-MPSS and CCNC are both on the order of 10 % (Wiedensohler et al., 2018; Rose et al., 2008). For the SS setting in CCNC, Gysel and Stratmann (2013) pointed out that an achievable accuracy in SS is 10 % (relative) at SS>0.2 % and less than 0.02 % (absolute) at the lower SS. For the ACSM data, the uncertainty in determining the total non-refractory mass is 9 %, while for the individual chemical components, the uncertainty is 15 % for nitrate, 28 % for sulfate, 36 % for ammonium, and 19 % for organic matter (Crenn et al., 2015).
Due to instrument failures and maintenance operations, missing measurements occurred during the campaign. Effective data coverage is shown in Fig. S1 in the Supplement. Overall, the CCNC, D-MPSS, and ACSM–MAAP captured 45 578 AF curves, 103 052 PNSDs, and 26 876 h aerosol chemical measurements, which covered 63 %, 92 %, and 77 % of the campaign time, respectively. For 42 % of the time, all these instruments measured together.
2.2 Methods
Each AF curve (NCCN/NCN vs. Dp) was first corrected for multiply charged particles. Multiply (mostly doubly) charged particles appear in the AF curve as a plateau or shoulder at small diameters because they have the same electrical mobility diameter as singly charged smaller particles (Rose et al., 2008; Henning et al., 2014). To correct for this, the fraction of multiply charged particles as determined from the D-MPSS measurements was subtracted from each value of NCCN/NCN in AF. The PNSDs from the D-MPSS measurements (5 to 800 nm) are needed as the DMA–CCNC size range does not cover the large particle fraction, which is essential for the correction. Subsequently, we obtained the corrected AF curves.
Each corrected AF curve was fitted with a sigmoid function,
where a is the offset from 0 in the y direction and b is the height of the upper plateau of the sigmoidal function, Dc is the critical diameter, and σs is a measure for the width of the sigmoid function. This AF fit was multiplied with the PNSD to gain the CCN number size distribution and by integrating the total number of CCN, i.e., NCCN.
The critical diameter (Dc) of dry particles, κ, and mixing state at each SS condition can be derived from the AF fit results. Affected by aerosol mixing, the AF rises gradually from 0 to the max (∼1) rather than displaying an intermittent mutation. Dc is defined as the diameter of the dry particles from which 50 % of the particles are activated at the given SS.
The shape of the AF curve, i.e., the relative width of the AF, represents the degree of external mixture, which can be quantified by the ratio of (Jurányi et al., 2013). D75 and D25 are the diameters at which 75 % and 25 % of the particles are activated at the given SS. Internal mixture implies that all particles with any given dry size have equal κ with , whereas a distribution of different κ at a given particle size can be observed for externally mixed aerosol with higher values. Note that the particle composition varying at different sizes is not defined as external mixing in this study. Jurányi et al. (2013) confirmed the reliability of this approach by comparing the κ distributions derived from parallel monodisperse CCN measurements and hygroscopicity tandem differential mobility analyzer (HTDMA) measurements.
According to the derivation of κ-Köhler theory (Petters and Kreidenweis, 2007), the κ can be calculated from Dc at a given SS:
with
where is the droplet surface tension (assumed to be that of pure water, 0.0728 nm−2), Mw is the molecular weight of water, R is the universal gas constant, T is the absolute temperature, ρw is the density of water, and A can be considered a function of T. Thus, the size-resolved κ (pair of κ and Dc) can be obtained at each SS cycle. Our monodisperse CCN measurements provide the size-resolved κ within Dp (Dc) of ∼40–200 nm, which depends largely on the SS setting of 0.1 % to 0.7 %. Note that Eq. (2a) is derived from an approximation of the κ-Köhler equation, and when κ is less than 0.2, it causes a slight bias in calculating κ (Petters and Kreidenweis, 2007). Additionally, the debate about the importance of changes, and the connected bulk/surface partitioning on activation of aerosols is on ongoing (e.g., Ovadnevaite et al., 2017; Vepsäläinen et al., 2022), which is not focused on in this study.
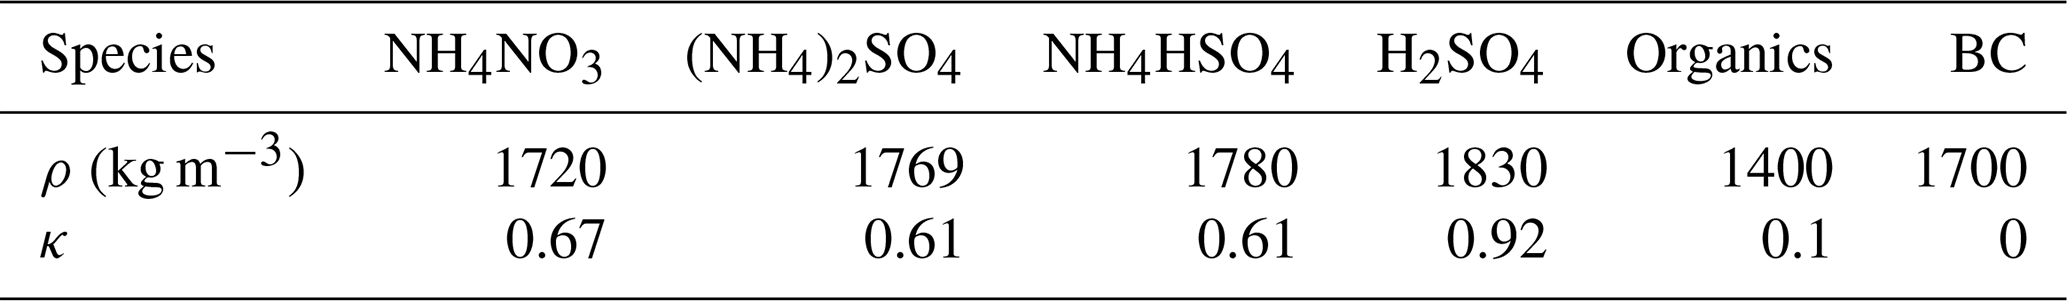
Table 1Densities (ρ) and hygroscopicity factor (κ) for each component.
Besides deriving it from the monodisperse CCN measurements, κ can be derived from the ACSM and MAAP chemical composition measurements (κchem) using the Zdanovskii–Stokes–Robinson (ZSR) mixing rule (Zdanovskii, 1948; Stokes and Robinson, 1966) combined with κ-Köhler theory:
where κi and εi mean the κ and volume fraction for each component, respectively, and i is the number of the component in the mixture. The εi was derived from its measured component i mass concentration and density (ρi). A simple ion-pairing scheme (Gysel et al., 2007) was used in this study with the κi and ρi values listed in Table 1 (Wu et al., 2015). A κ of 0.1 is used for particulate organics (Dusek et al., 2010; Gunthe et al., 2009, 2011). For black carbon, we use a κ of 0 (Rose et al., 2011; Schmale et al., 2018).
The CCN number size distribution is a part of the particle number size distribution (PNSD), which approximately corresponds to the part of PNSD with Dp>Dc when assuming particles to be internally mixed (Fig. S2 in the Supplement). The assumption of the internal mixing could be reasonable because the median values of the parameter b and are 1.0 and 0.18. Thus, Dc plays a critical role on diagnosing NCCN in models, which can be derived from κ parameterization at a given SS. When κ is obtained, Dc(κ,SS) is calculated from Eq. (2a). And, assuming an internal mixture, the predicted NCCN is the integration of the PNSD from Dc, that is,
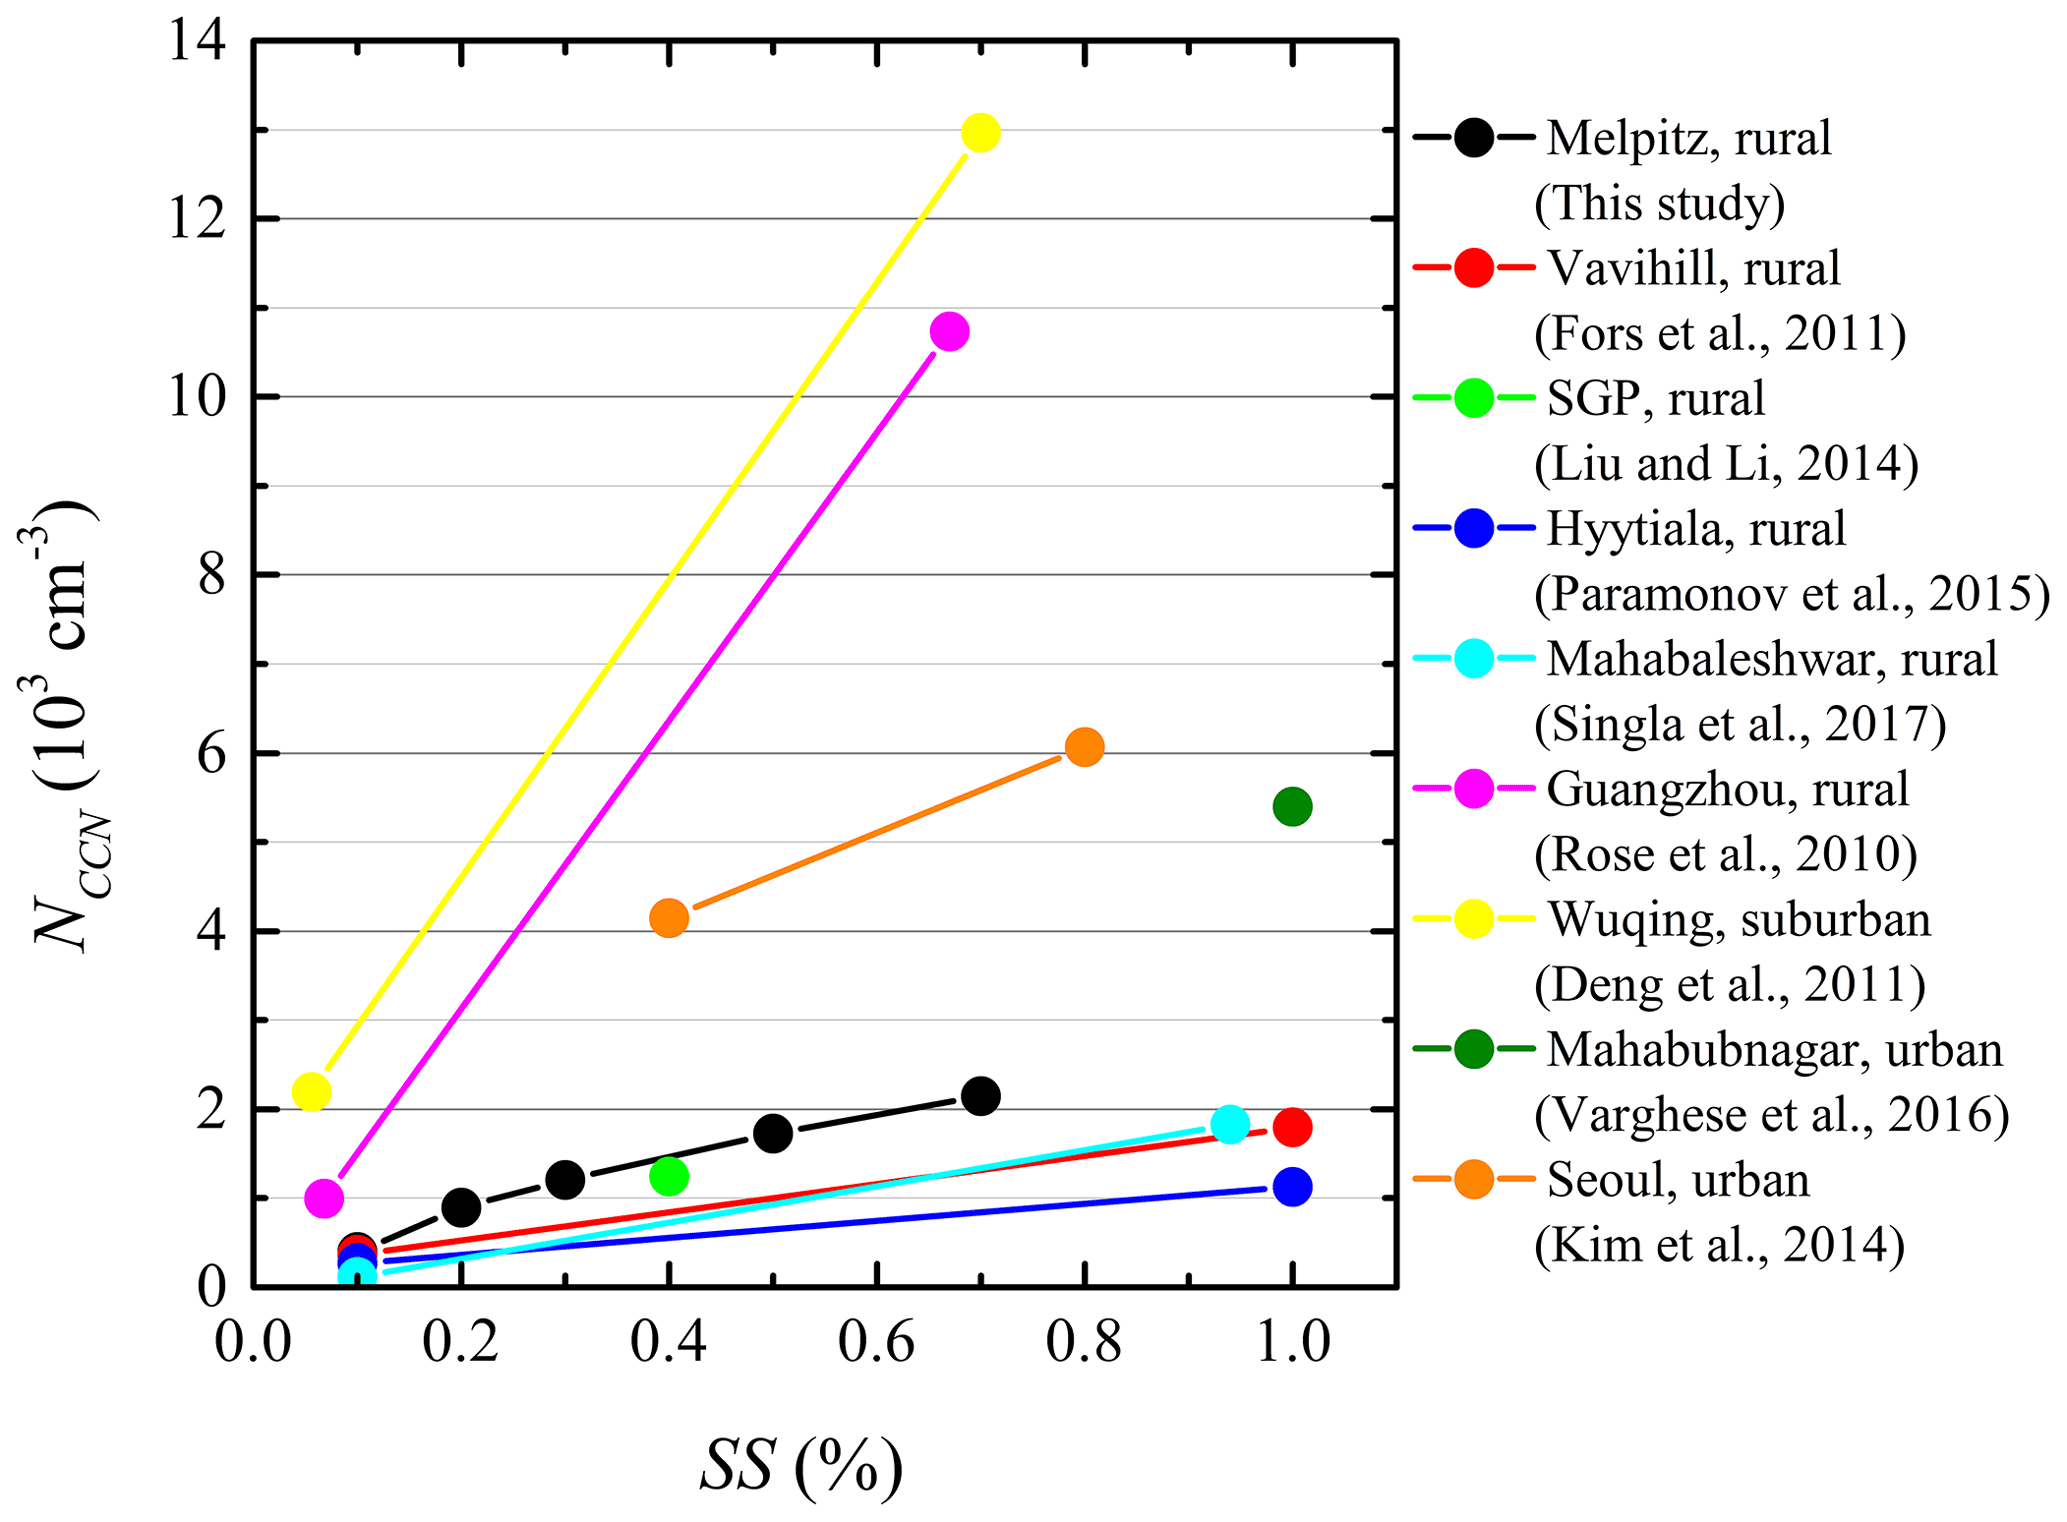
Figure 2Relationship between CCN number concentration (NCCN) and supersaturation (SS) measured at Melpitz and other stations.
3.1 Aerosol activation characteristics
As SS increases, the CCN number size distribution broadens towards smaller particle sizes (Fig. S3 in the Supplement), causing an increase in NCCN and activation ratio (AR, i.e., ratio of NCCN to total aerosol number concentration with a diameter range of 10 to 800 nm, Naero). At Melpitz, the median NCCN and AR increase from 399 to 2144 cm−3 and 0.10 to 0.48 when SS increases from 0.1 % to 0.7 %. As shown in Fig. 2, the NCCN measured at Melpitz is slightly higher than that measured in more remote rural background stations, e.g., in Vavihill, Sweden (Fors et al., 2011); Hyytiälä, Finland (Paramonov et al., 2015); Southern Great Plains, USA (Liu and Li, 2014); and Mahabaleshwar, India (Singla et al., 2017). However, compared to the NCCN measured in polluted regions (e.g., Rose et al., 2010; Deng et al., 2011; Kim et al., 2014; Varghese et al., 2016), the Melpitz NCCN is much lower.
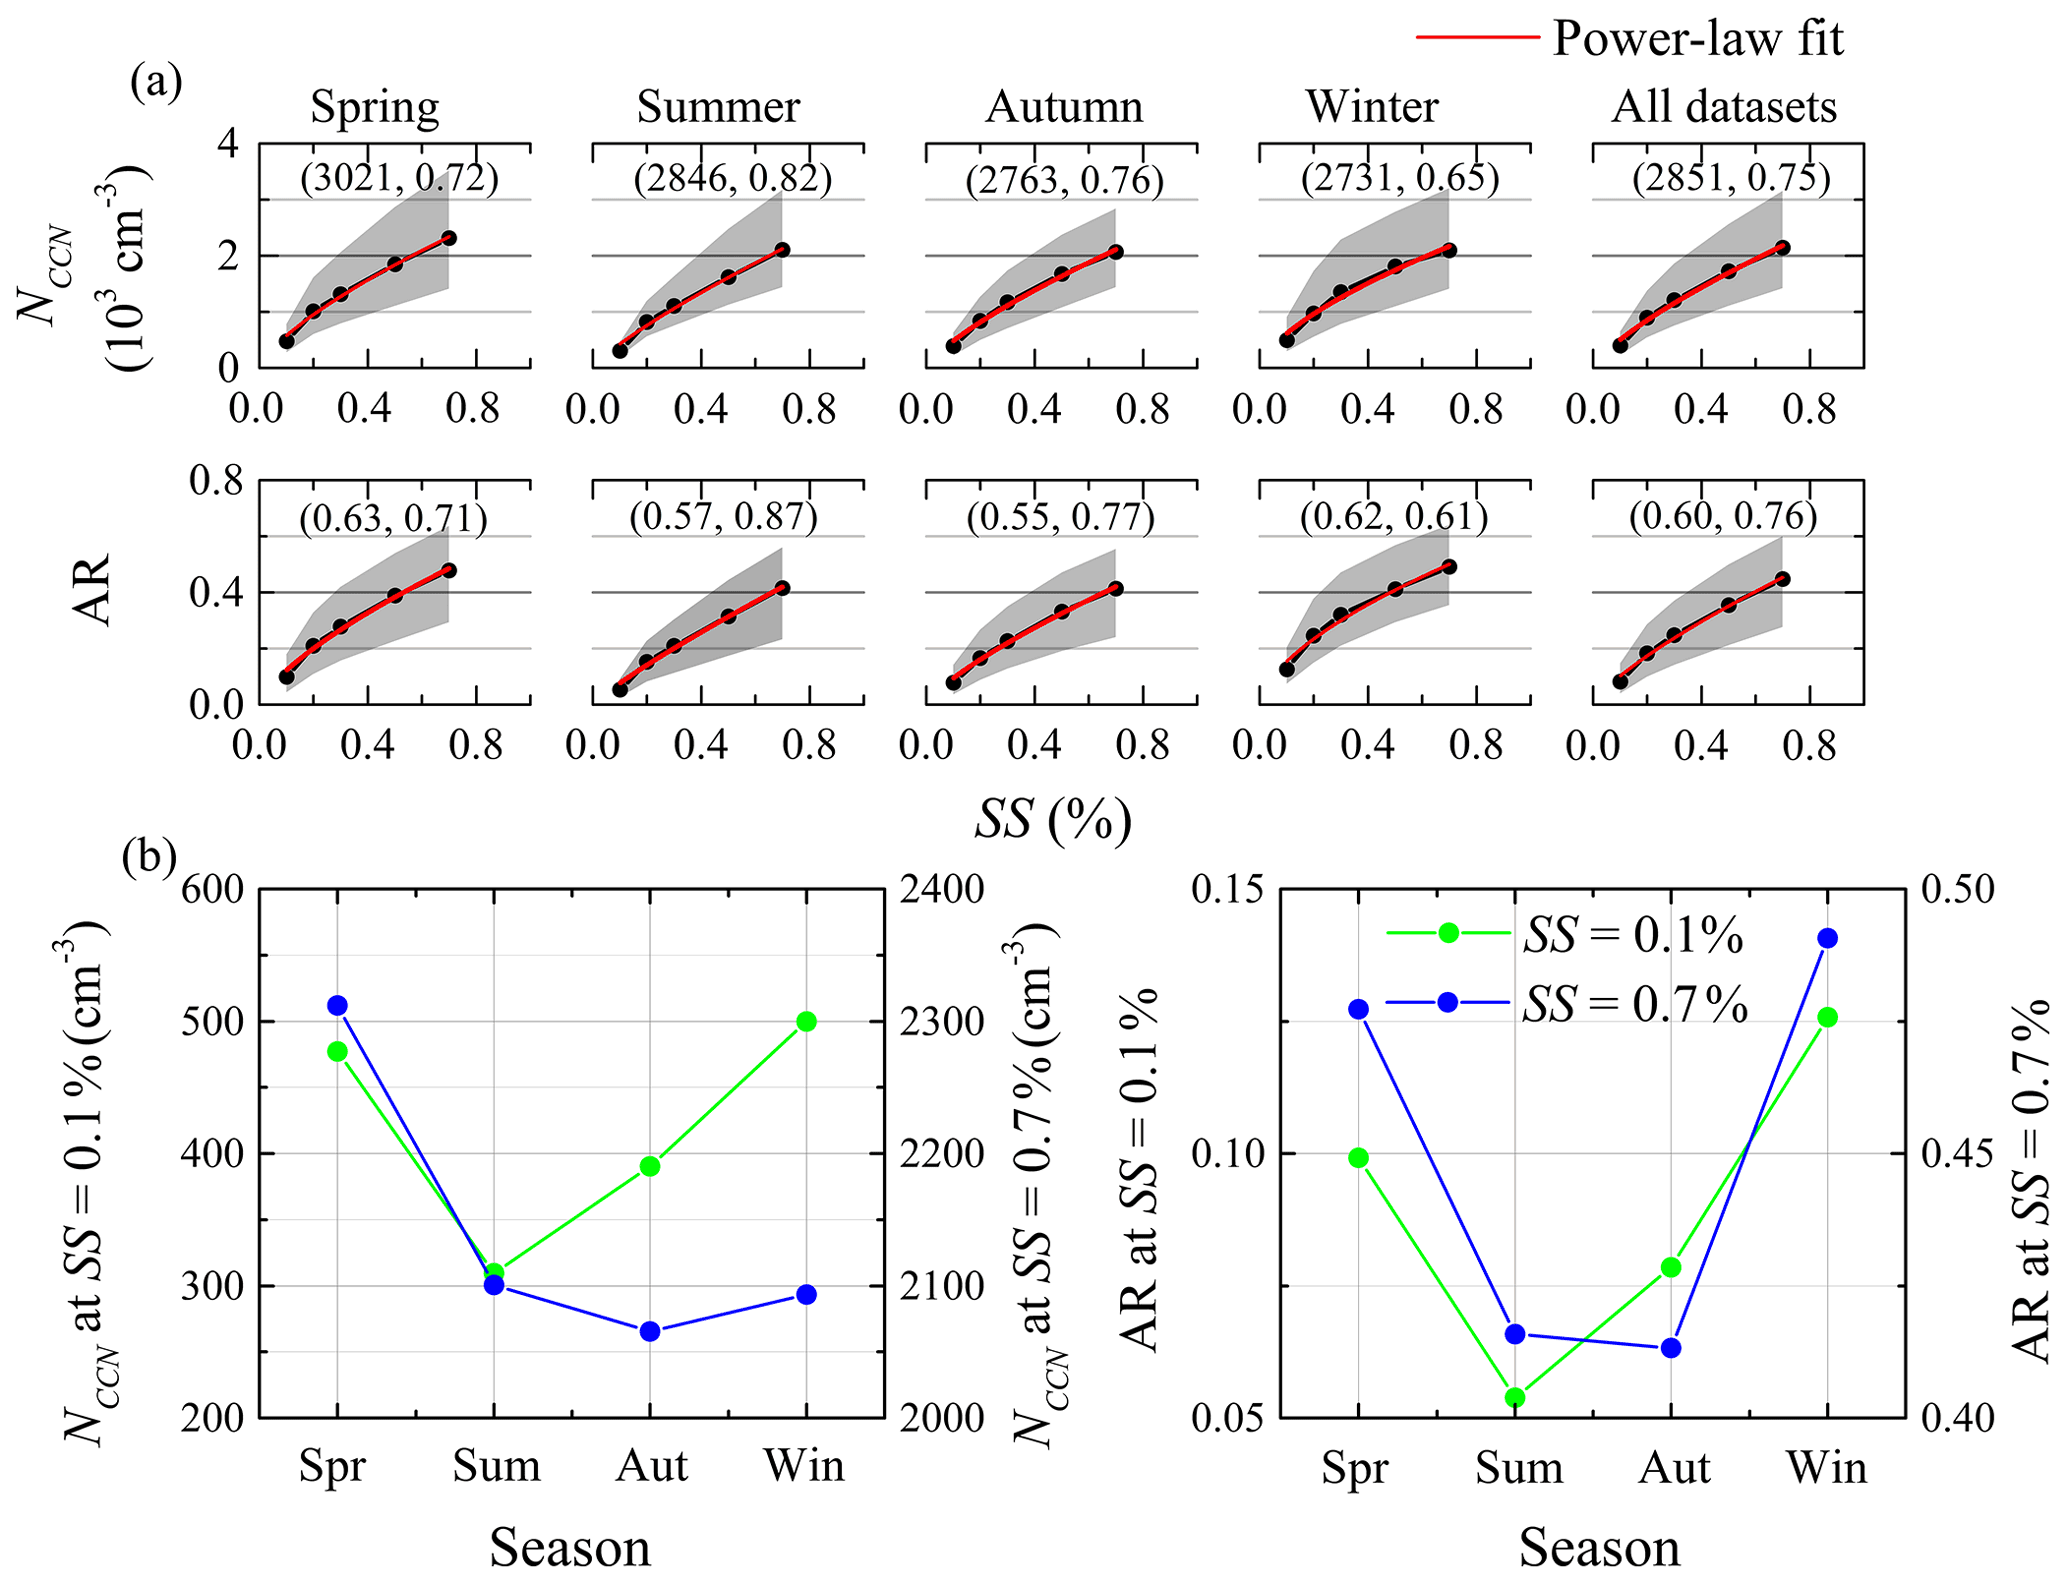
Figure 3(a) Relationships between CCN number concentration (NCCN) and supersaturation (SS), and relationship between activation ratios (AR) and SS for different seasons. (b) Seasonal trends of NCCN and AR at SS=0.1 % and 0.7 %. Dots represent the median values of NCCN and AR. Shaded areas represent the values in the range from the 25th to 75th percentile. Red lines are power-law fittings for NCCN (and AR) vs. SS. Two parameters of the fitting results are shown in brackets.
Figure 3a presents the NCCN vs. SS and AR vs. SS relationships at each season and all datasets at Melpitz. The two relationships are similar, and both can be fitted well with using a power-law function (Twomey, 1959). The fit was also performed with an error function (Pöhlker et al., 2018), and the fitted parameters are in the Supplement (Table S2). Over the whole period, the median values of the slope parameter and the coefficient in the NCCN–SS power-law fit are 2851 cm−3 and 0.75, respectively, which are within the range of values for continental aerosol (slope parameter of 600–3500 cm−3 and coefficient of 0.4–0.9) reported in Seinfeld and Pandis (2016). The slope parameters in the power-law fitting represent the sensitivity of the NCCN and AR to the variation in SS, which is highest in summer and lowest in winter. The seasonal variations of NCCN and AR at SS=0.1 % and 0.7 % are shown in Fig. 3b. In summer, the median NCCN and AR are both lowest at SS=0.1 %, which contributed to the largest sensitivity of NCCN and AR to SS, i.e., the largest slope parameter in the power-law fitting among the four seasons. Additionally, the shape of the PNSD contributed to explain the sensitivity of NCCN and AR to SS. The PNSD in summer was steepest in the 40–200 nm size range among the four seasons (Fig. S4 in the Supplement). Thus, in summer, a small shift in Dc will change the NCCN and AR much more than those in winter where the PNSD looks broader, causing the strong sensitivity of NCCN and AR to SS.
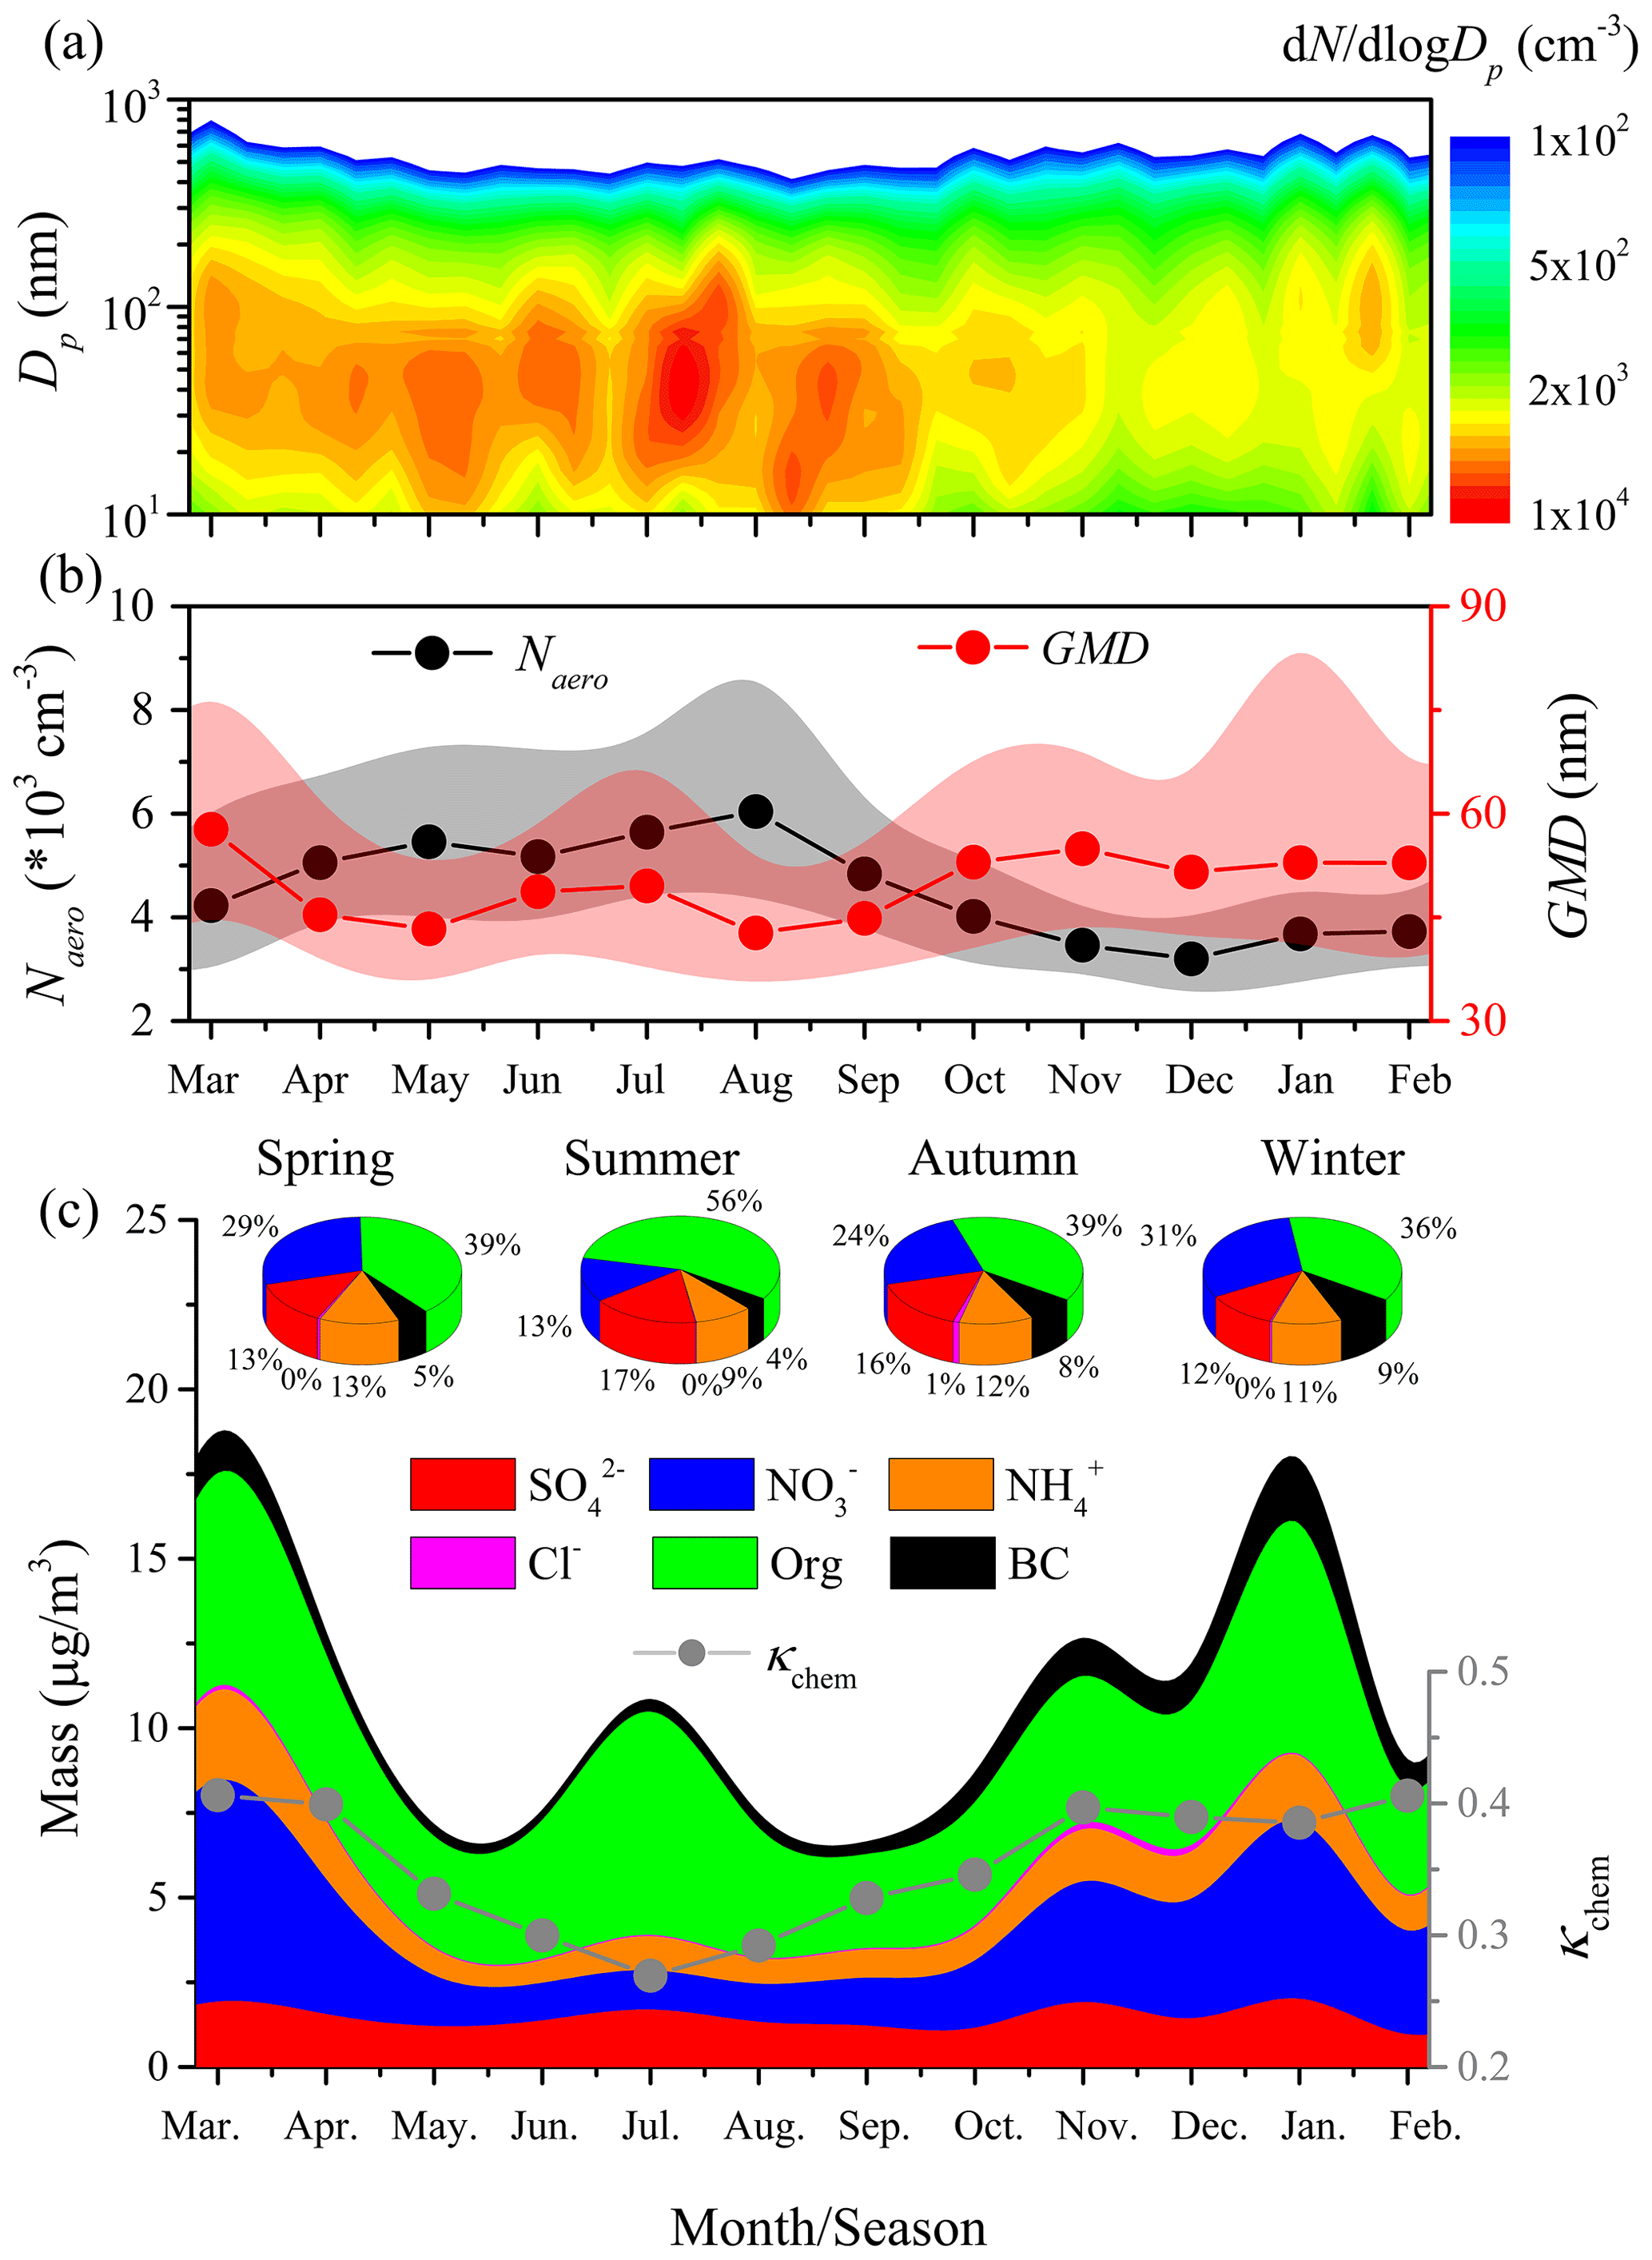
Figure 4Seasonal variations of (a) aerosol particle number size distribution (dNaero/dlogDp vs. Dp, where Dp is particle diameter), (b) total aerosol number concentration with a Dp range of 10 to 800 nm (Naero) and geometric mean diameter of the particles (GMD), and (c) mass concentration and ratio of each component in aerosol particle with Dp less than 1 µm and the hygroscopicity factor calculated from the chemical composition (κchem). Dots represent the median values. Shaded areas represent the values in the range from the 25th to 75th percentile.
To explain the seasonal variations in aerosol activation characteristics, we investigated the PNSD and chemical compositions as shown in Fig. 4. In summer, affected by the frequent NPF events (Ma et al., 2015; Wang et al., 2017), the Aitken-mode particles with Dp<100 nm accounted for the largest portion of the PNSD (Fig. S4 in the Supplement), resulting in the highest Naero and the smallest geometric mean diameter among the four seasons. Additionally, in summer, there was the lowest bulk κchem, with median value of 0.24 corresponding to the highest organic mass fraction (56 % of total mass), which could be related to the strong formation of the secondary organic aerosol (SOA). Therefore, the NCCN and AR both kept relatively low values in summer, especially at low-SS conditions (e.g., at SS=0.1 %). On the contrary, in winter, the relatively low number concentration of Aitken-mode particles caused the lowest Naero and the largest GMD among the four seasons, which could be owing to the rare NPF events. Meanwhile, in winter, low temperatures favored the particulate phase of nitrate (Poulain et al., 2011), causing the highest nitrate mass fraction (31 % of total mass) among the four seasons, which might explain the highest κchem (median value of 0.34). Taking all three together, the lowest Naero, the largest GMD, and the highest κchem contribute to the highest AR value in winter at each SS condition. The relationships between κchem and each particle component and the correlations among seasonal median values of Naero, GMD, and κchem are in the Supplement (Sect. S1, Figs. S5 and S6). Additionally, no significant yearly trends of the CCN activation characteristics are found during the 4-year measurements, and the results are provided in the Supplement (Sect. S2 and Fig. S7).
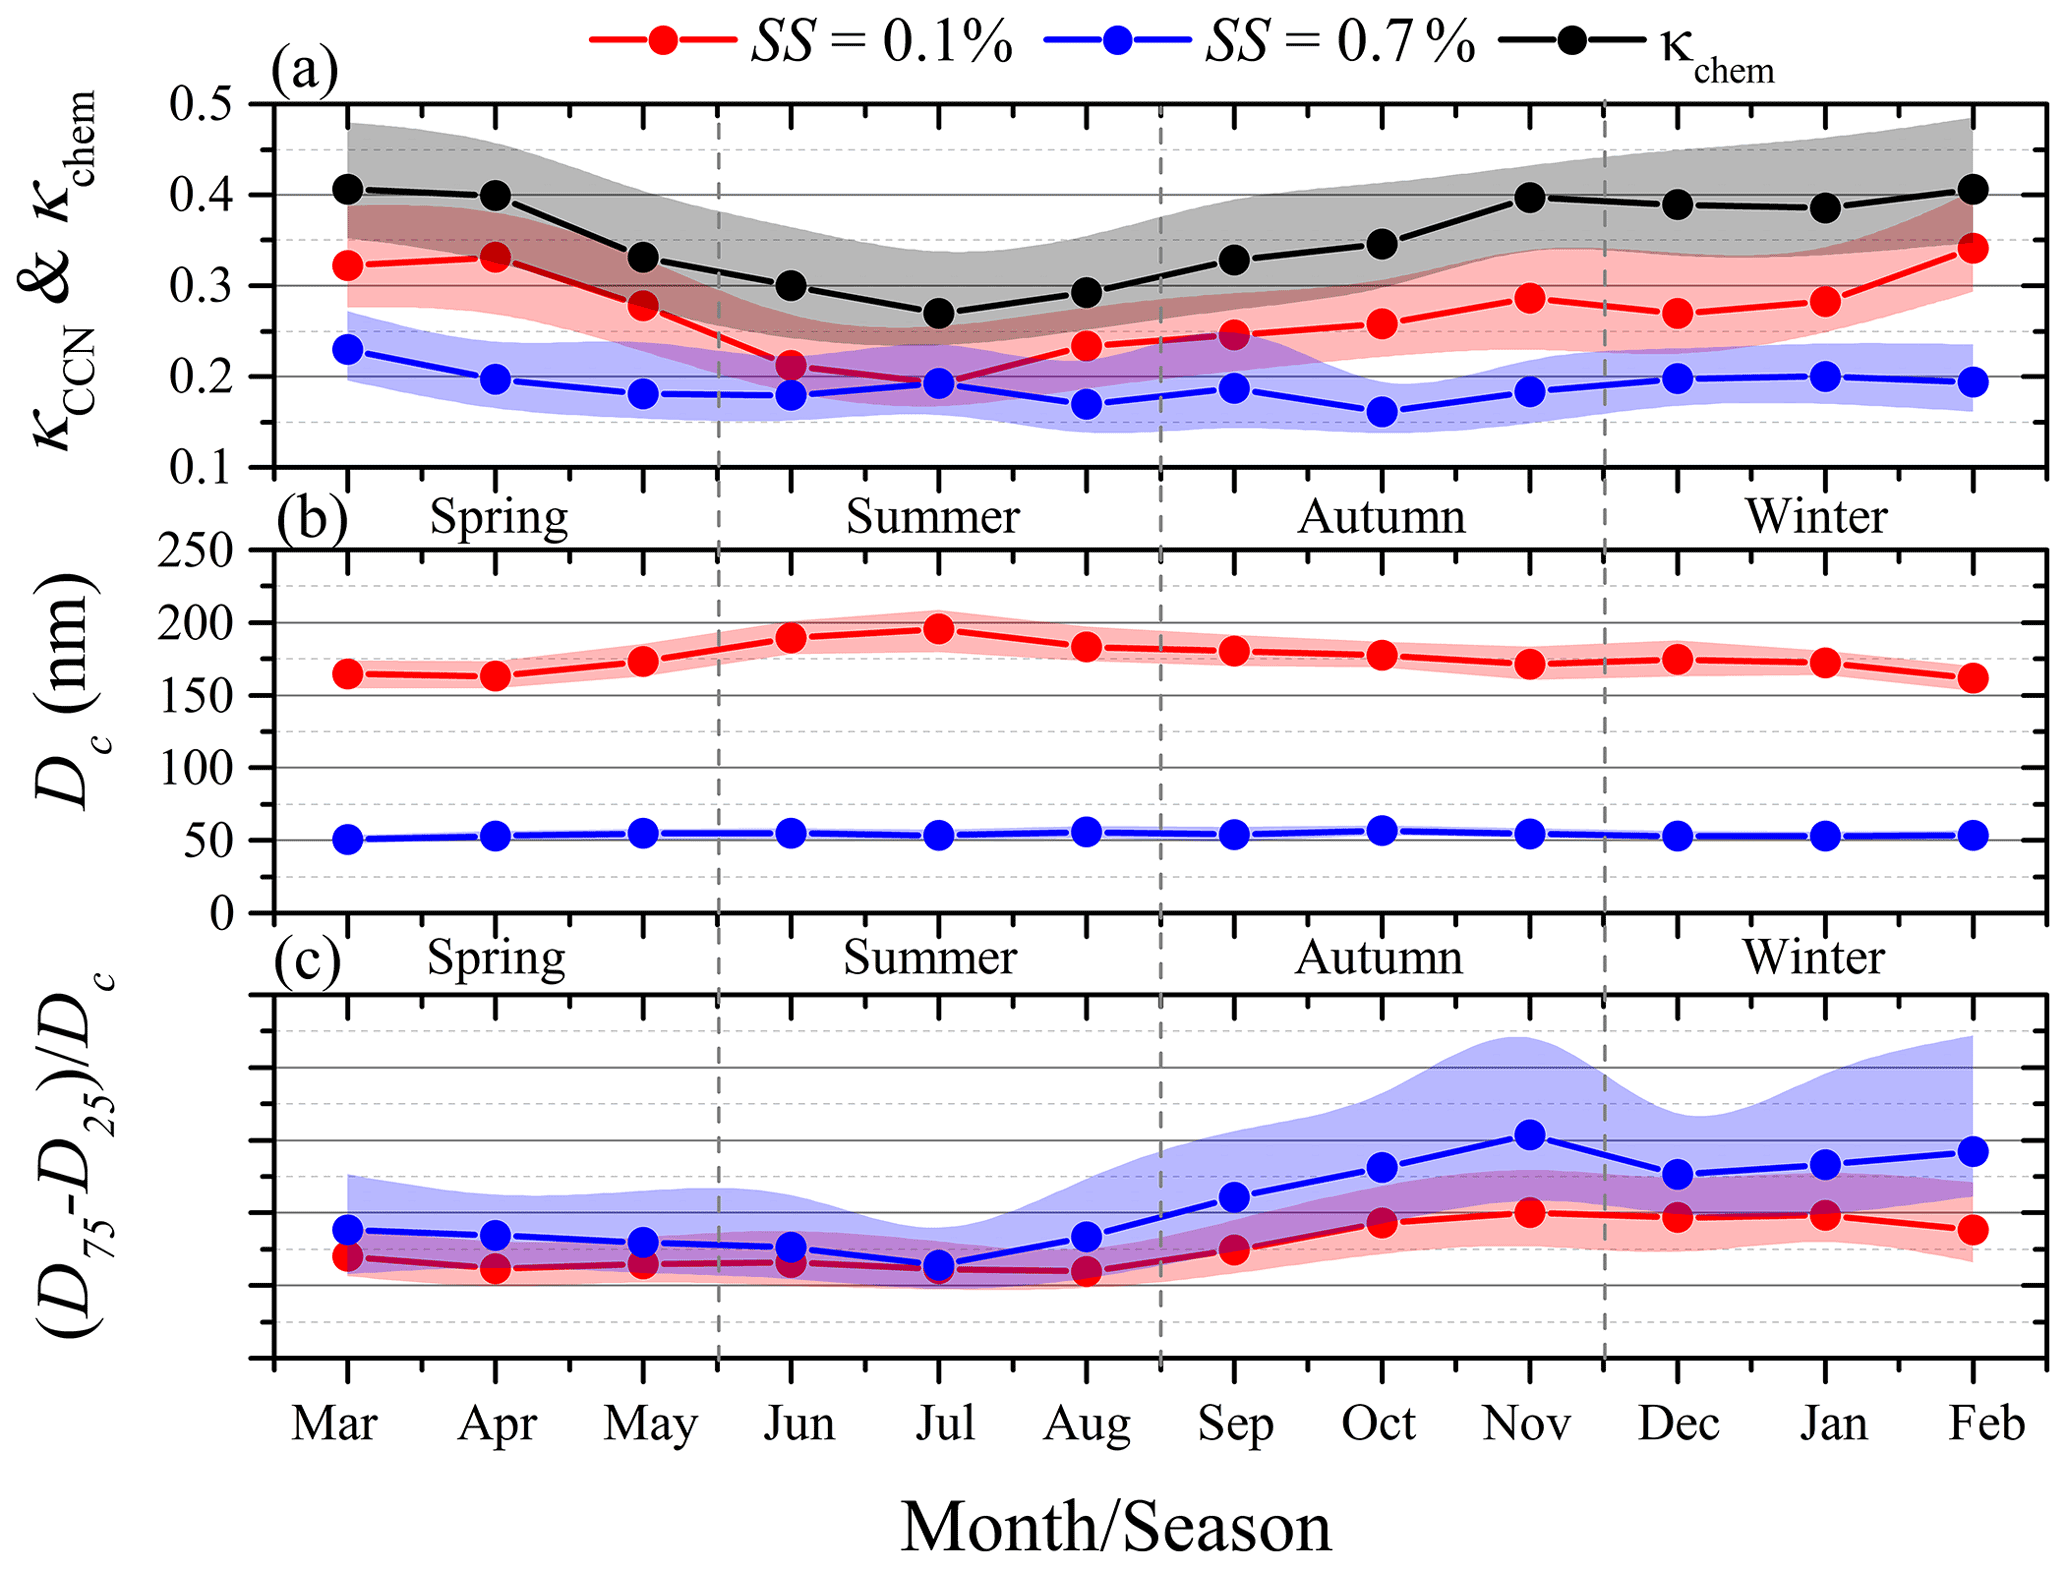
Figure 5Monthly variations of (a) the hygroscopicity factor calculated from monodisperse CCN measurements (κCCN) at a supersaturation (SS) of 0.1 % and 0.7 % and the hygroscopicity factor calculated from particle chemical composition (κchem), (b) the critical diameter of dry particle for activation (Dc) at SS=0.1 % and 0.7 %, and (c) the degree of external mixture at SS=0.1 % and 0.7 %. The definitions of D75 and D25 are the Dp at which 75 % and 25 % of the particles are activated at the given SS, respectively. Dots represent the median values. Shaded areas represent the values in the range from the 25th to 75th percentile.
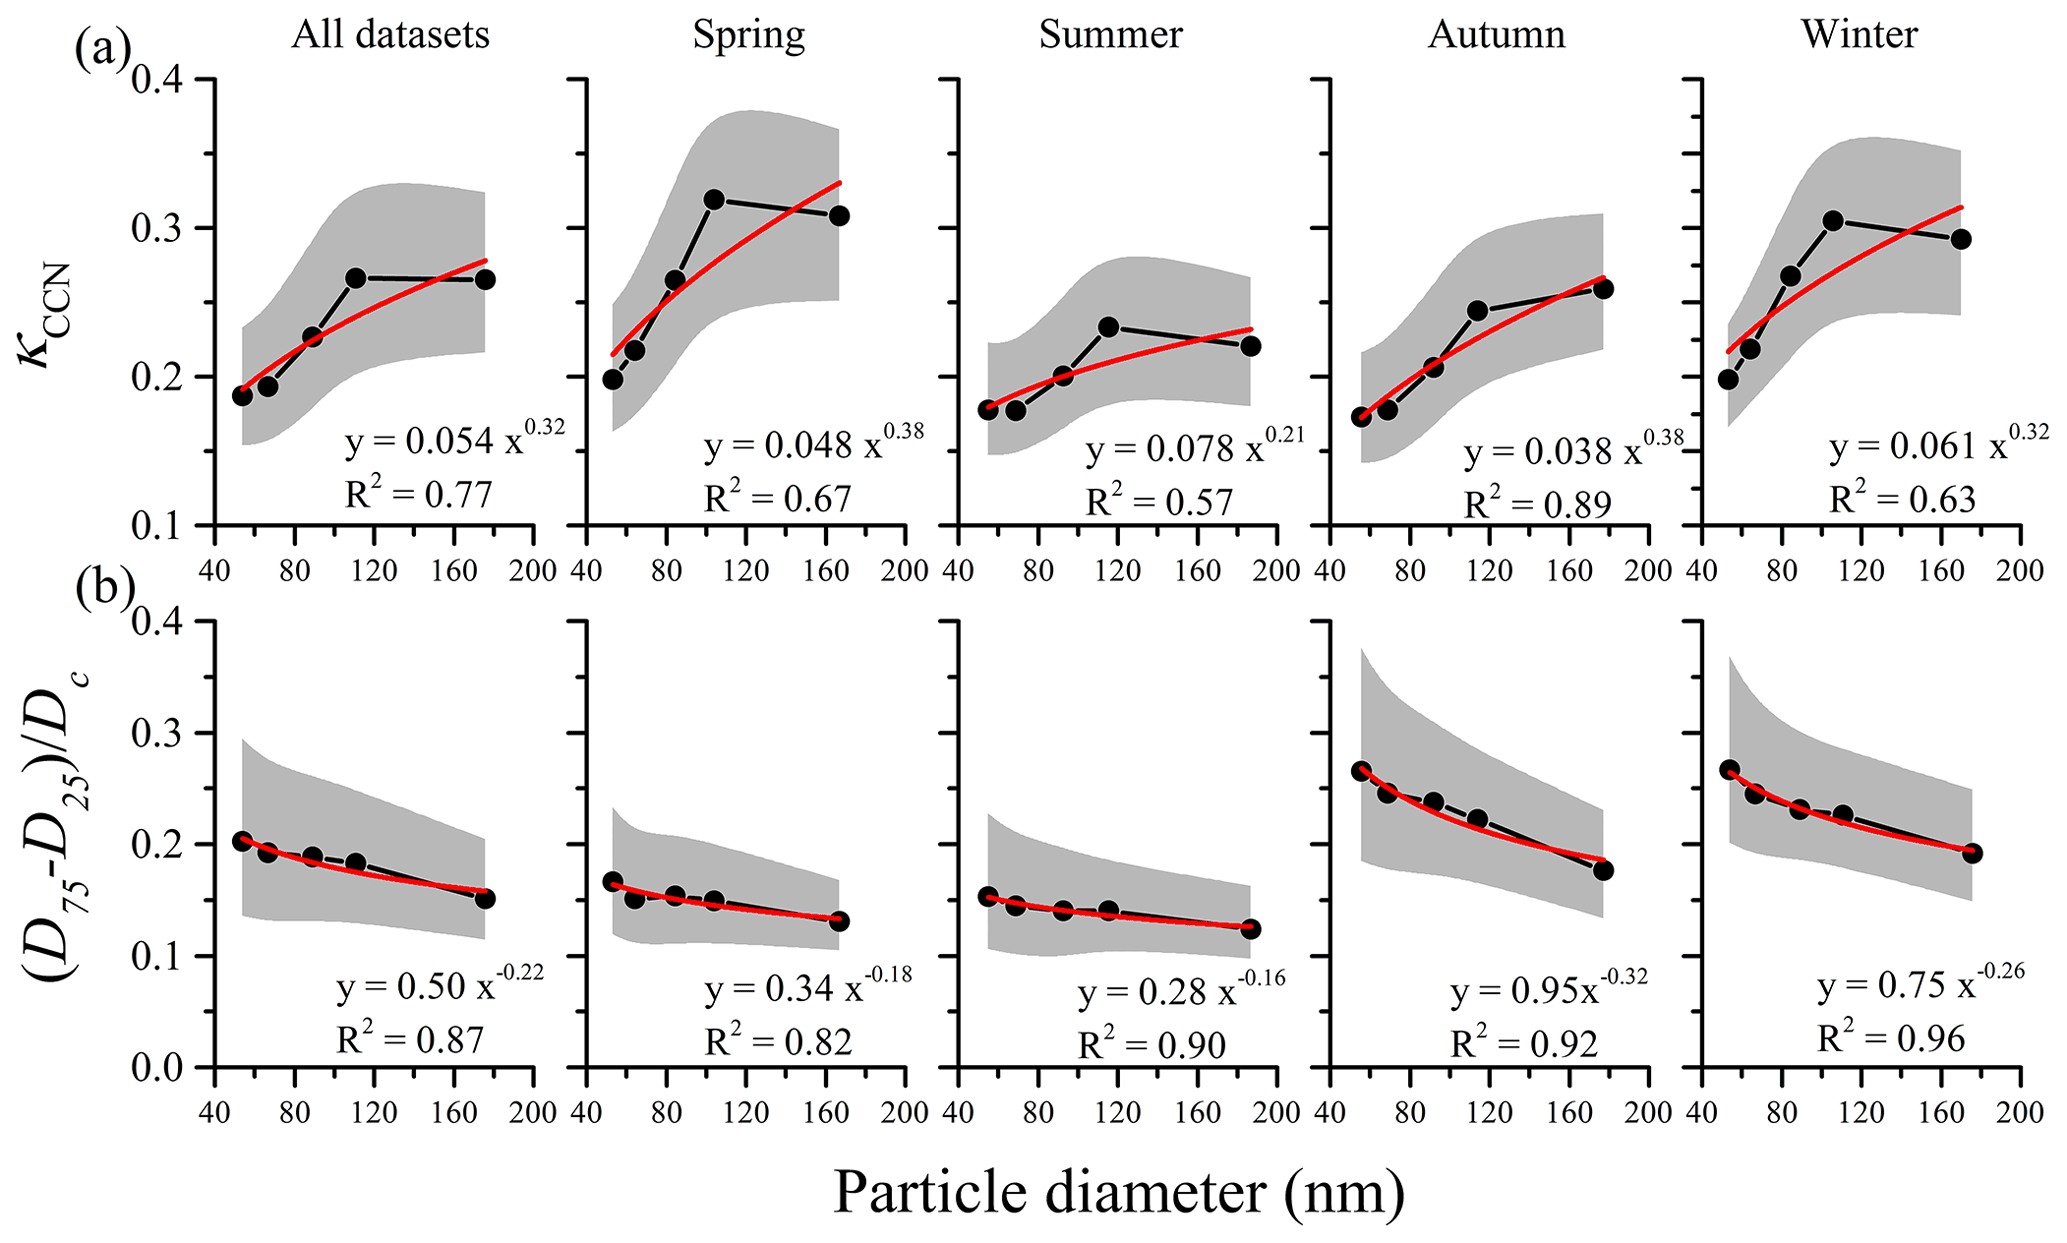
Figure 6(a) Relationship between the hygroscopicity factor calculated from monodisperse CCN measurements (κCCN) and particle diameter (Dp), and (b) degree of external mixture vs. Dp at each season. The definitions of D75 and D25 are the Dp at which 75 % and 25 % of the particles are activated at the given SS, respectively. Red lines are power-law fits. Dots represent the median values. Shaded areas represent the values in the range from the 25th to 75th percentile.
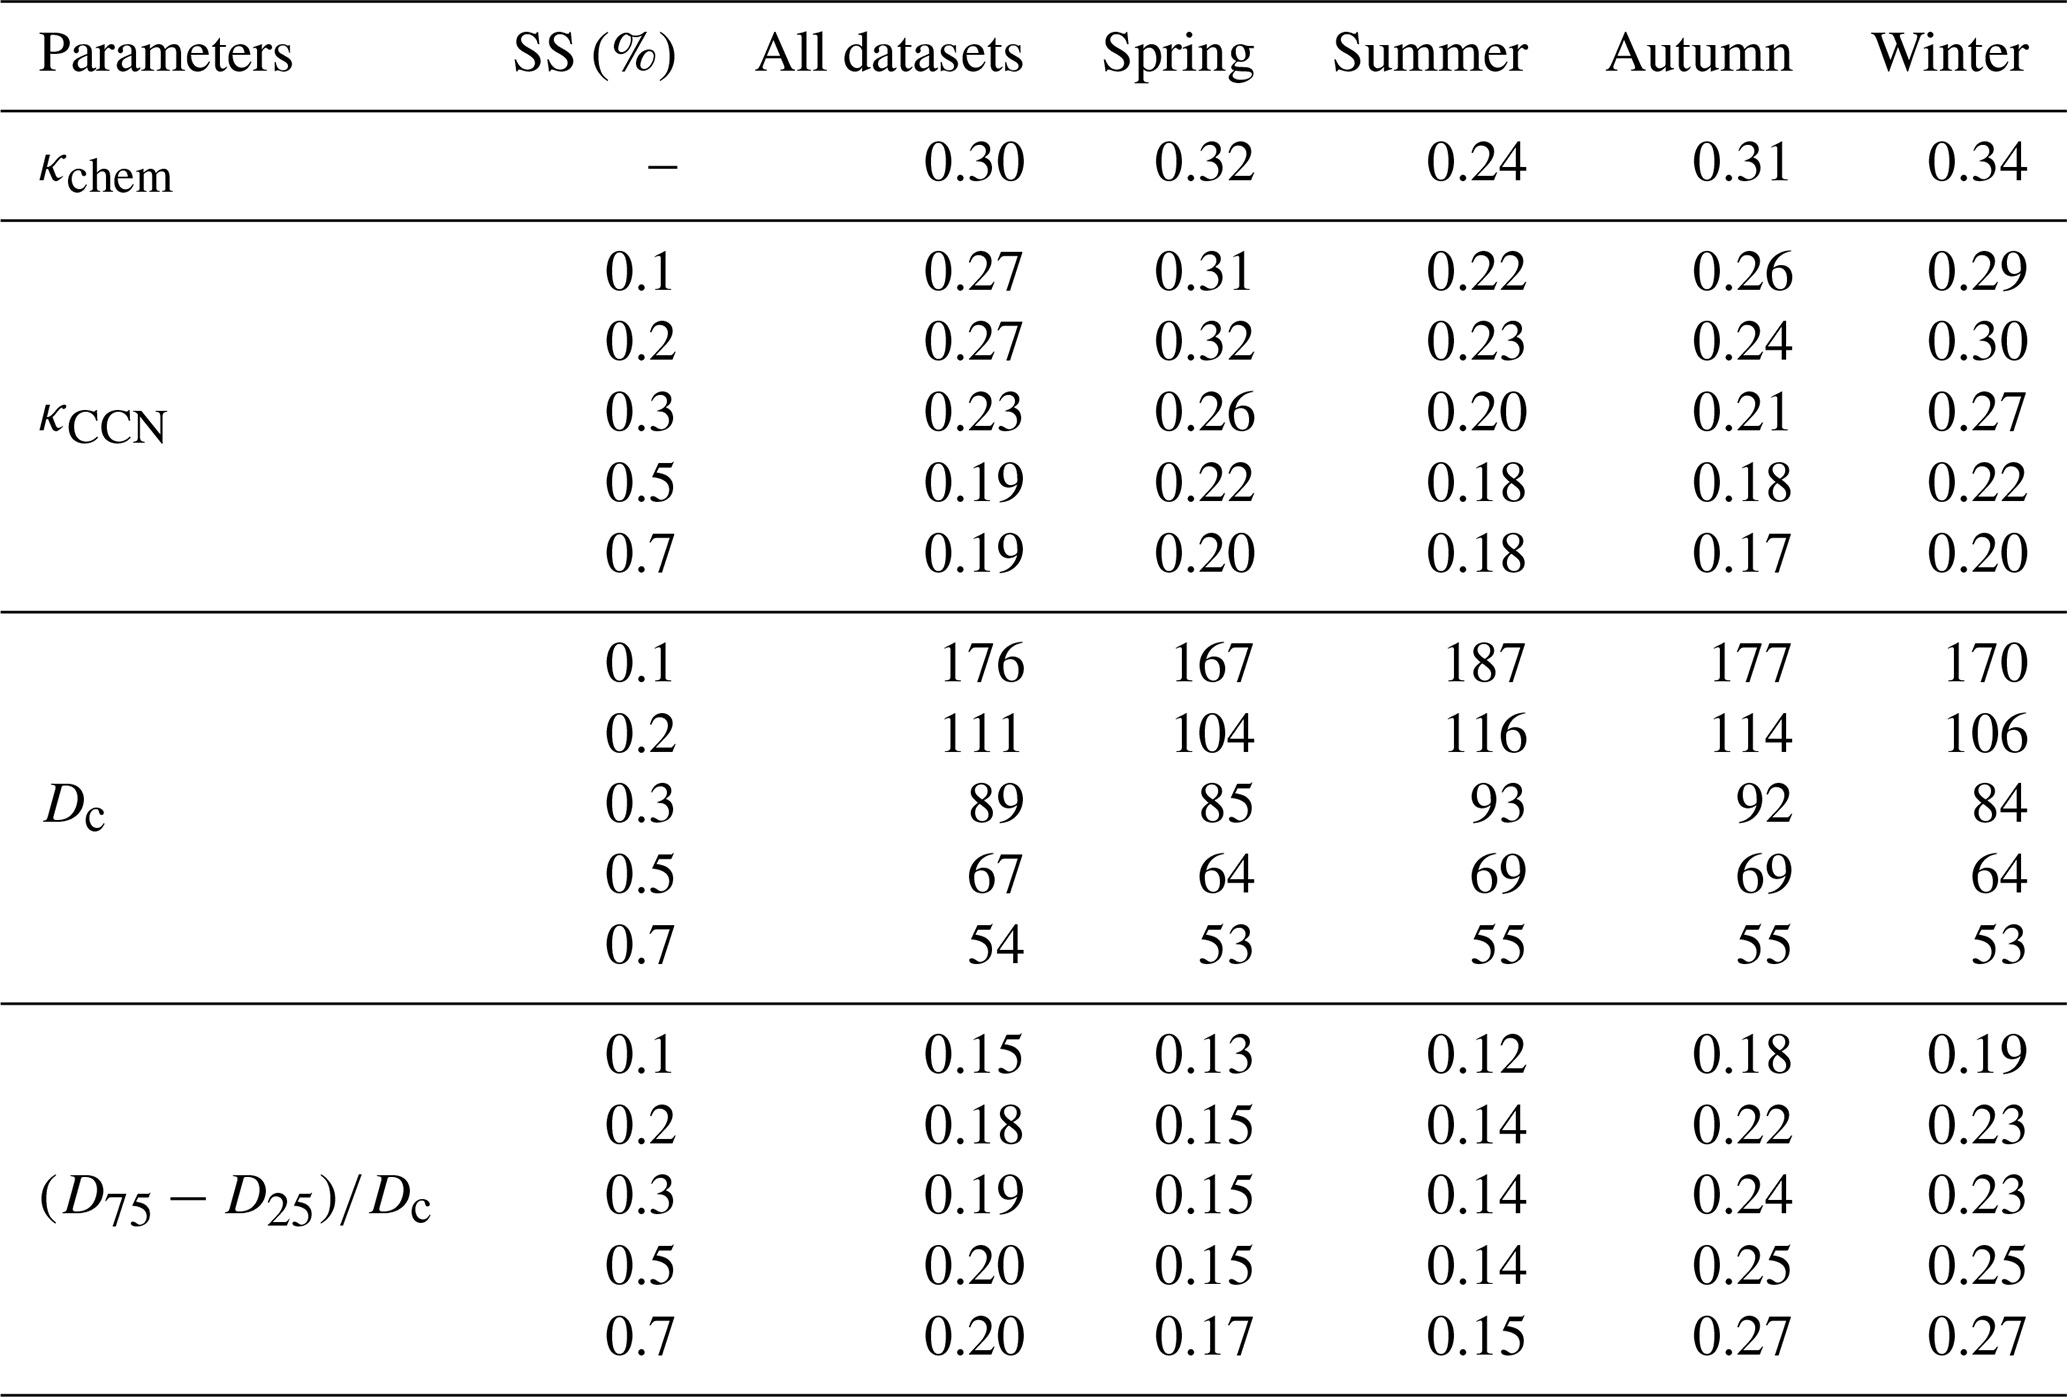
Table 2Seasonal median values of the hygroscopicity factor derived from the chemical composition (κchem), the hygroscopicity factor derived from monodisperse CCN measurements (κCCN), the critical diameter of dry particle for activation (Dc), and the degree of external mixture ((D75 – D25)/Dc) at each supersaturation (SS) condition. The unit of Dc is nanometers (nm).
3.2 Size-resolved particle hygroscopicity factor and mixing state
The hygroscopicity factor and the mixing state directly influence the Dc and the shape of the AF curve, thereby changing the NCCN at a given SS condition. Affected by the variations of particle composition, these two parameters are not constant and both vary with particle size and season.
Figure 5a shows monthly median values of κchem and κ calculated from monodisperse CCN measurements (κCCN) at SS of 0.1 % and 0.7 %. Their seasonal median values are summarized in Table 2. At Melpitz, the median κCCN decreased from 0.27 to 0.19 as SS increased from 0.1 % to 0.7 %, which was less than the median bulk κchem of 0.3. The seasonal variation of κCCN at SS of 0.1 % is similar to that of κchem, whereas the seasonal trend in κCCN is much weaker at SS=0.7 %. Essentially, the relationship between κCCN and SS is determined by the κCCN vs. Dp relationship. The κCCN values at SS of 0.1 % and 0.7 % correspond to the median Dc (i.e., Dp) of 176 and 54 nm, respectively. As the ACSM is sensitive to particle mass rather than number concentration, the bulk composition is dominated by the contribution of the larger particles. In the median volume size distribution of particles, the peak diameter was ∼300 nm (Poulain et al., 2020). Thus, κchem may be representative for the larger particles rather than for the smaller particles. Owing to the positive correlation between κ and Dp (Fig. 6a), the κchem representing the larger particles could be greater than the κCCN for the smaller particles. Figure 5b depicts the monthly variation of Dc at SS of 0.1 % and 0.7 %, which shows the opposite trend to κCCN (SS) because of the negative correlation of (SS) vs. κ (SS) shown in Eq. (2a). Compared to the Dc at lower SS conditions (e.g., 0.1 %), Dc has a more significant seasonal trend at higher SS conditions (e.g., 0.7 %). At SS=0.7 %, the low κCCN caused the largeDc in summer, whereas the high κCCN caused the small Dc in spring and winter.
The monthly trend of the external-mixing degree is shown in Fig. 5c. Jurányi et al. (2013) pointed out that the ranged from 0.08 to 0.12 for ammonium sulfate calibration measurements at SS=0.1–1.0 %, which indicated an internal mixture within measurement accuracy. For our measurements, the median over all datasets ranges from 0.15 to 0.20 at SS=0.1–0.7 %. The median was low in summer and spring and high in winter and autumn. The results tend to indicate that the aerosol particles at Melpitz were more internally mixed in summer and spring, whereas they were less internally mixed in winter and autumn. In summer, the lower contribution from anthropogenic emissions and the faster aging process as well as SOA formation caused by atmospheric chemistry certainly contribute to making particles more internally mixed. Changes in organic aerosol (OA) composition can be found in Crippa et al. (2014), Poulain et al. (2014), and Chen et al. (2022). In cold seasons, the local pollution (100 km around) is dominated by liquid fuel, biomass, and coal combustions mostly for house heating (van Pinxteren et al., 2016). During winter, long-range transport from the eastern wind brings to the station continental air masses which are strongly influenced by anthropogenic emissions (in opposition to western marine air masses). These particles are a mixture of different anthropogenic sources emitted all along the transport as well as including some local and regional sources (most house heating). All of them at different aging states cause the overall particles to be more externally mixed.
As mentioned above, κCCN (and vs. Dp relationships determine the relationship between κCCN (and and SS. Monodisperse CCN measurements provide the size-resolved κ and . At a given SS condition, κCCN represents the κ of particles at Dp=Dc, and the same is true for . As shown in Fig. 6a, κCCN increases with Dp at the Dp range of ∼40 to 100 nm, whereas κCCN almost stays constant at Dp of 100 to 200 nm for all seasons. Additionally, the increase in κCCN with Dp varies with season. The κCCN vs. Dp relationship is fitted by a power-law function at each season. In summer, there is the lowest slope parameter in the κCCN vs. Dp power-law fit, meaning that the κCCN is least sensitive to Dp. Compared to the cold seasons, the anthropogenic emissions linked to house heating strongly reduce in summer, which affects the smaller particles, and the dominant small particles (Dp<100 nm) are associated with NPF and the SOA formation. NPF is a complex process which depends on the availability of condensing material (H2SO4 and organic), as well as pre-existing particles (coagulation and condensation sink parameters). Therefore, same condensing material on the gas phase can either condense on pre-existing particles (usually larger than 100 nm and then detected by ACSM) or lead to NPF formation. A direct consequence of it is a probable smaller effect of the size-dependent chemical composition of the particles. This might explain why κCCN values at SS of 0.1 % and 0.7 % are closer, i.e., the weaker sensitivity of κCCN to Dp in summer. Figure 6b presents the vs. Dp relationship. As particle size increases, decreases at Dp of ∼40 to 200 nm for all seasons, meaning that small particles are less internally mixed. The reason is that during the aerosol aging process, not only particle size increases but κ becomes more uniform. The ( vs. Dp relationship is also fitted well by a power-law function at each season. The lowest absolute value of the slope parameter was observed in summer, indicating that the degree of external mixture was least sensitive to Dp, which could be related to the less mixing between the local emissions and long-range transport particles in summer.
Table 3Introduction of five activation schemes. The meaning of the abbreviations can be found in Appendix A.
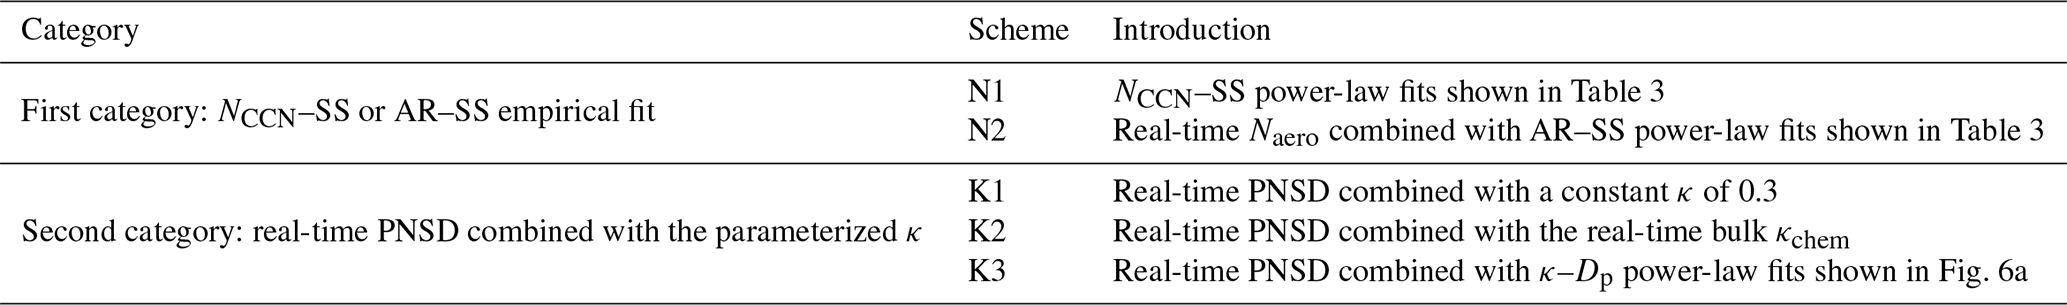
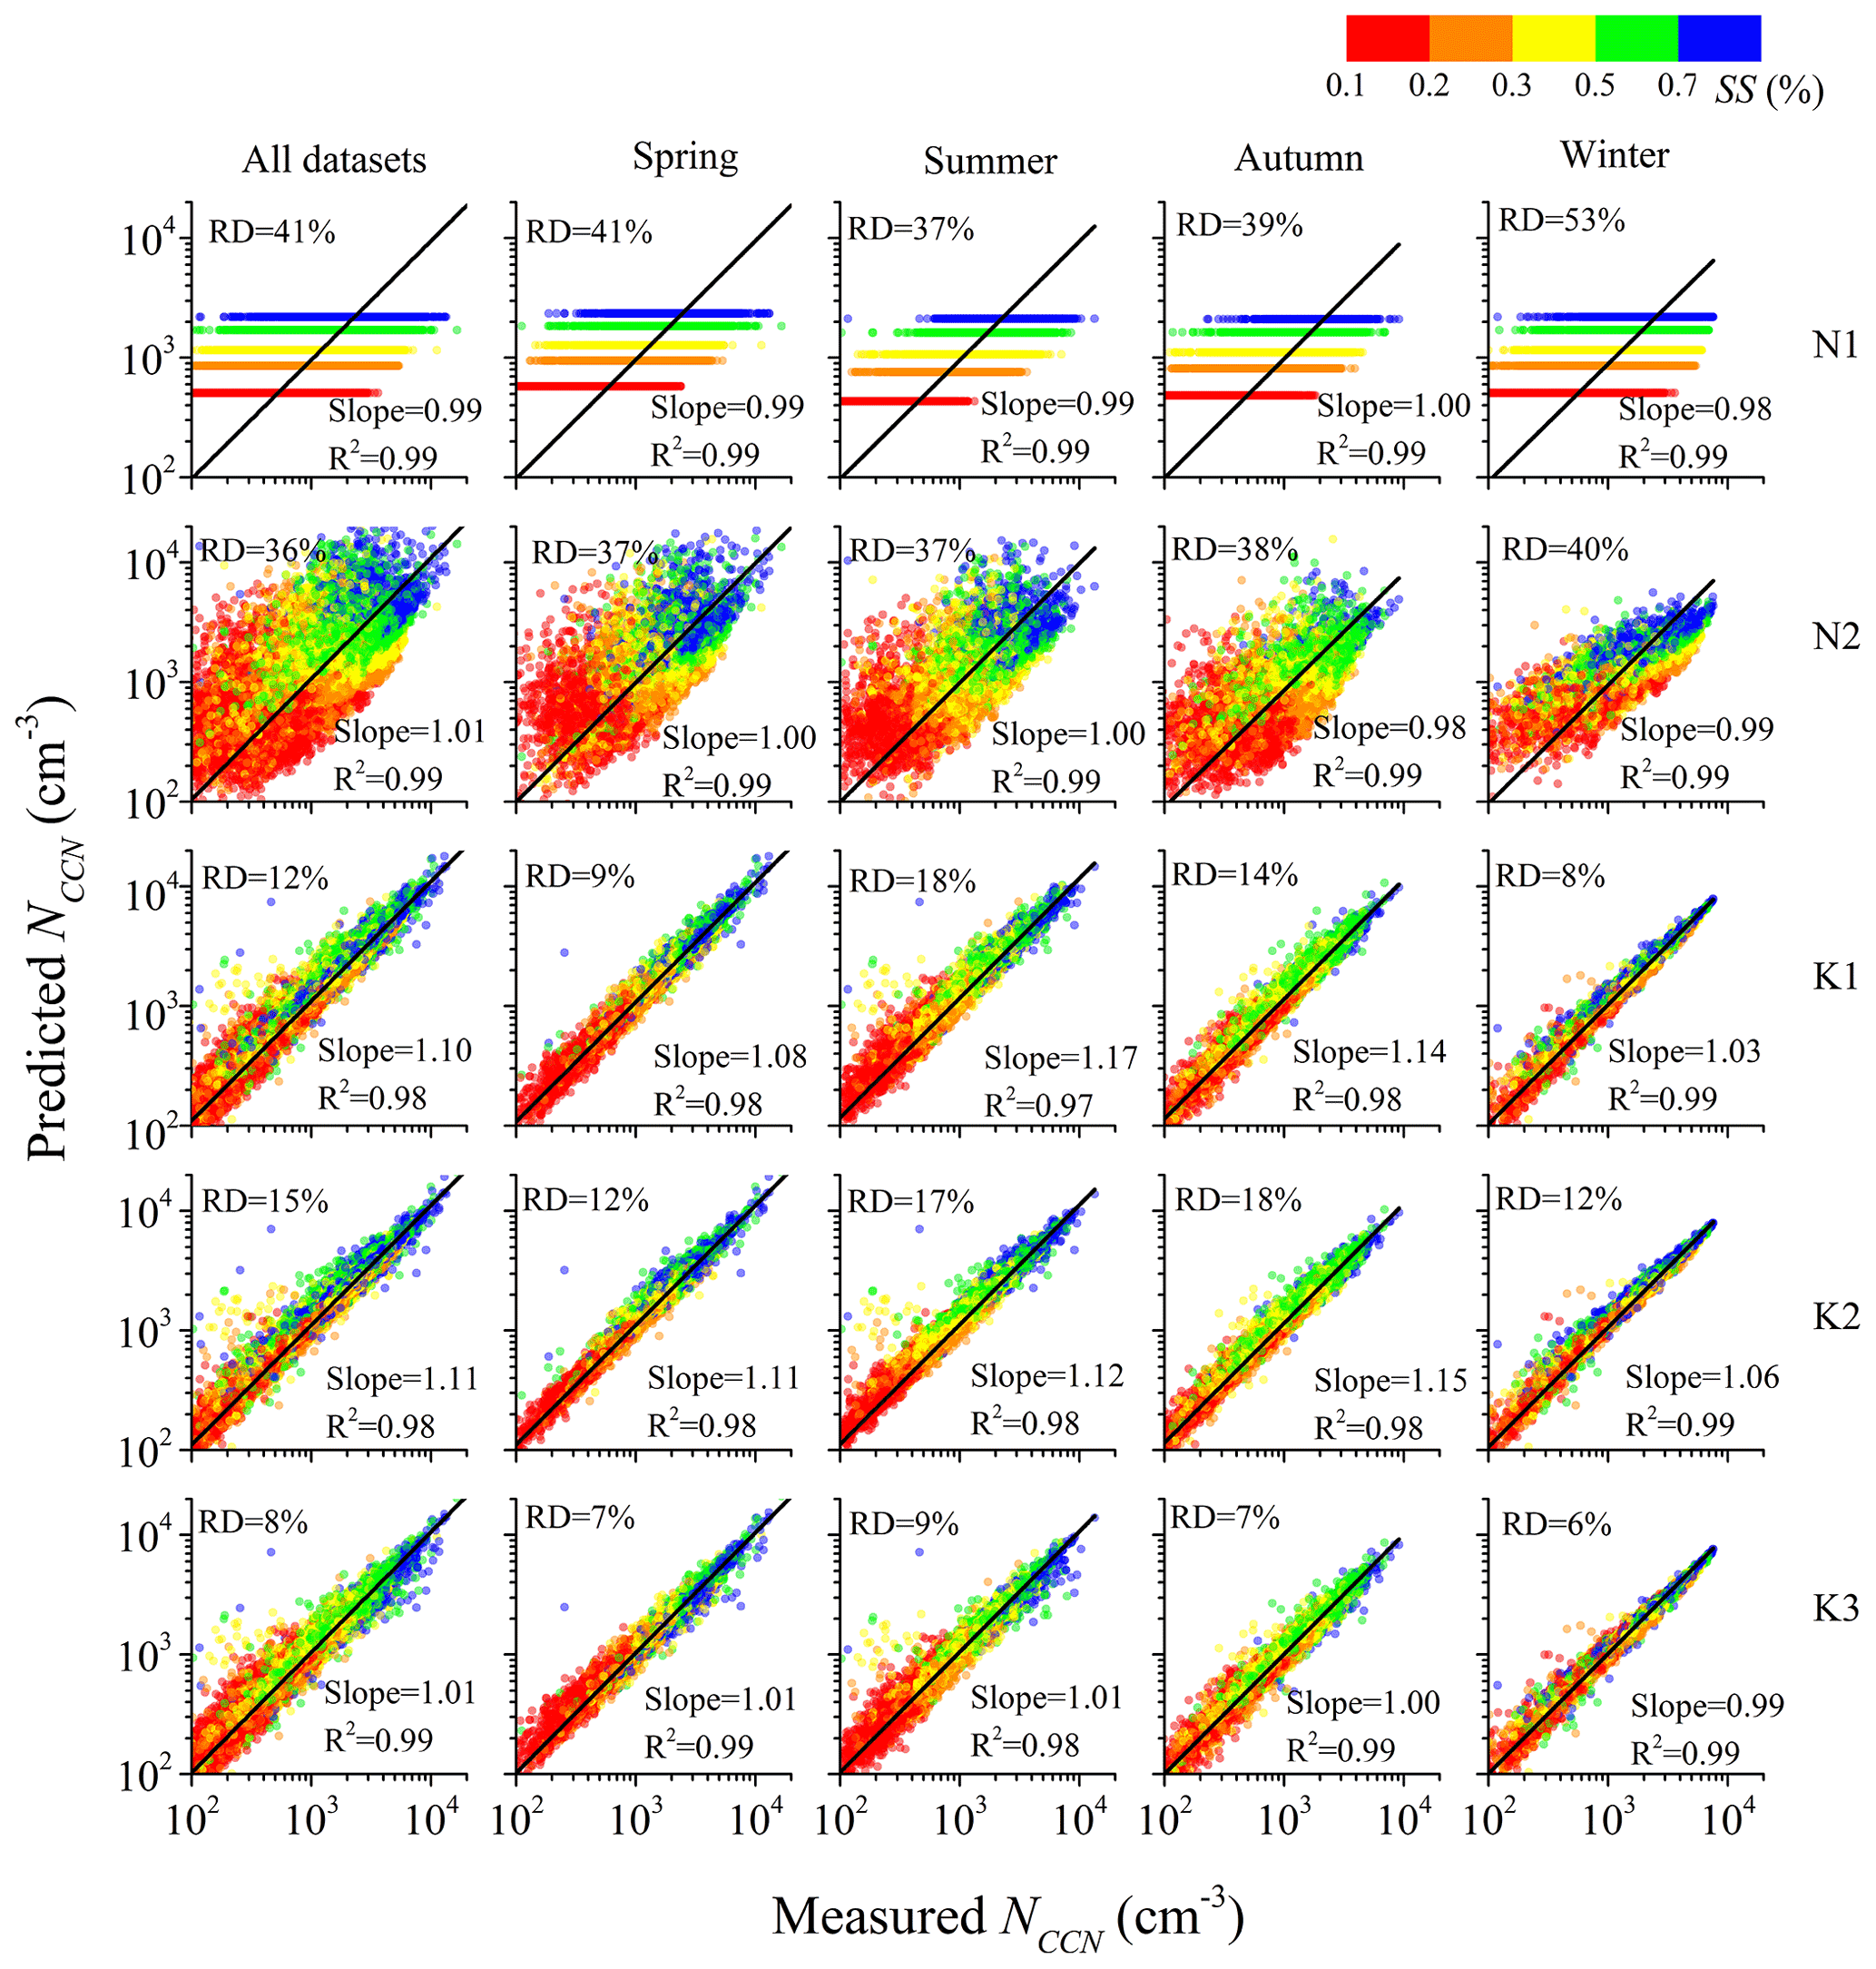
Figure 7Predicted vs. measured CCN number concentration (NCCN) for different seasons. The predicted NCCN is calculated from five different schemes with a detailed introduction shown in Table 3. Color bar represents the different supersaturation (SS) conditions. Black lines are the linear fits. The slope and R2 of the linear regression and the median relative deviation (RD) between the predicted and measured NCCN are shown in each panel. Each row represents the results using the same scheme in different seasons. Each column represents the results using different schemes in the same season.
3.3 NCCN prediction at Melpitz
NCCN plays an important role in modeling the formation and evolution of clouds. In this section, we evaluate the accuracy of NCCN predicted from five schemes. Table 3 introduces the five schemes, which can be summarized into two categories. From polydisperse CCN measurements, the NCCN (AR) and SS relationships can be obtained, and their fitting results can be used to predict NCCN at the given SS conditions, which belongs to the first category, corresponding to the N1 and N2 schemes in Table 3, respectively. Compared to CCN measurements, it is generally more common and simpler to obtain the PNSD measurements. Thus, we usually predict NCCN using the real-time PNSD combined with the parameterized κ (Dc), which belongs to the second category. The second category includes the last three schemes (K1, K2, and K3) in Table 3, but they vary in assuming κ. The K1 scheme used a fixed κ of 0.3 without temporal and size-dependent variations, as recommended for continental aerosol (Andreae and Rosenfeld, 2008), which is also the median value of κchem over all data settings at Melpitz. The K2 scheme used the bulk κchem calculated from aerosol chemical composition, which is also non-size-dependent but changes over time. The K3 scheme used the κ–Dp power-law fit results shown in Fig. 6a, which are size-dependent without temporal variations at each season. Applying the κ–Dp power-law equation into Eq. (2a), Dc can be derived as function of SS,
where the slope and coef represent the slope parameter and the coefficient in the κ–Dp power-law fit. Subsequently, the predicted NCCN can be calculated through Eq. (4). The second category assumed that aerosol particles are internally mixed at a particular Dp, as used in many previous NCCN prediction studies (e.g., Deng et al., 2013; Pöhlker et al., 2016; Wang et al., 2018a).
The prediction results are shown in Fig. 7. The linear equation (y=kx) is used to fit the relationship between the predicted NCCN and the measured one, and its slope represents the mean ratio of the predicted NCCN to the measured NCCN. The relative deviation (RD) equals the ratio of the absolute difference between the predicted NCCN and the measured one to the measured NCCN,
The median RD was used to quantify the deviation between predictions and measurements of each scheme. The slope and median RD shown in Fig. 7 are both calculated from all five SS conditions for each season. As shown in Fig. 7, the N1 and N2 schemes only provide rough estimates of the NCCN, which is reflected in the high median RD. The results for N1 and N2 schemes are similar in that they both predict the overall mean NCCN well (slopes of approximately 1.0) but with large median RDs. Compared to the N1 scheme, the N2 scheme is better because of the lower median RD. Compared to the first category (the N1 and N2 schemes), the second category (the K1, K2, and K3 schemes) predicts NCCN better because of the lower median RD. The results for K1 and K2 are similar in that they both overestimate NCCN by approximately 10 % (slopes of approximately 1.1) with similar median RDs. The reason for the NCCN overestimation is that the constant κ of 0.3 and the real-time bulk κchem are both greater than the κCCN at each season. In winter, the κCCN was highest and the difference between the κCCN and the parameterized κ in K1 and K2 scheme was lowest, causing the best prediction of NCCN among the four seasons. Owing to the largest difference between the κCCN and the parameterized κ, the NCCN prediction was worst in summer for the K1 scheme and in autumn for the K2 scheme. The K3 scheme appears to be the best one for NCCN prediction among the five schemes, which is reflected in the lowest median RDs and the fit slope of ∼1.0 for different seasons. The evaluations of the five schemes for the NCCN prediction at each SS condition and each season are provided in Fig. S8 in the Supplement.
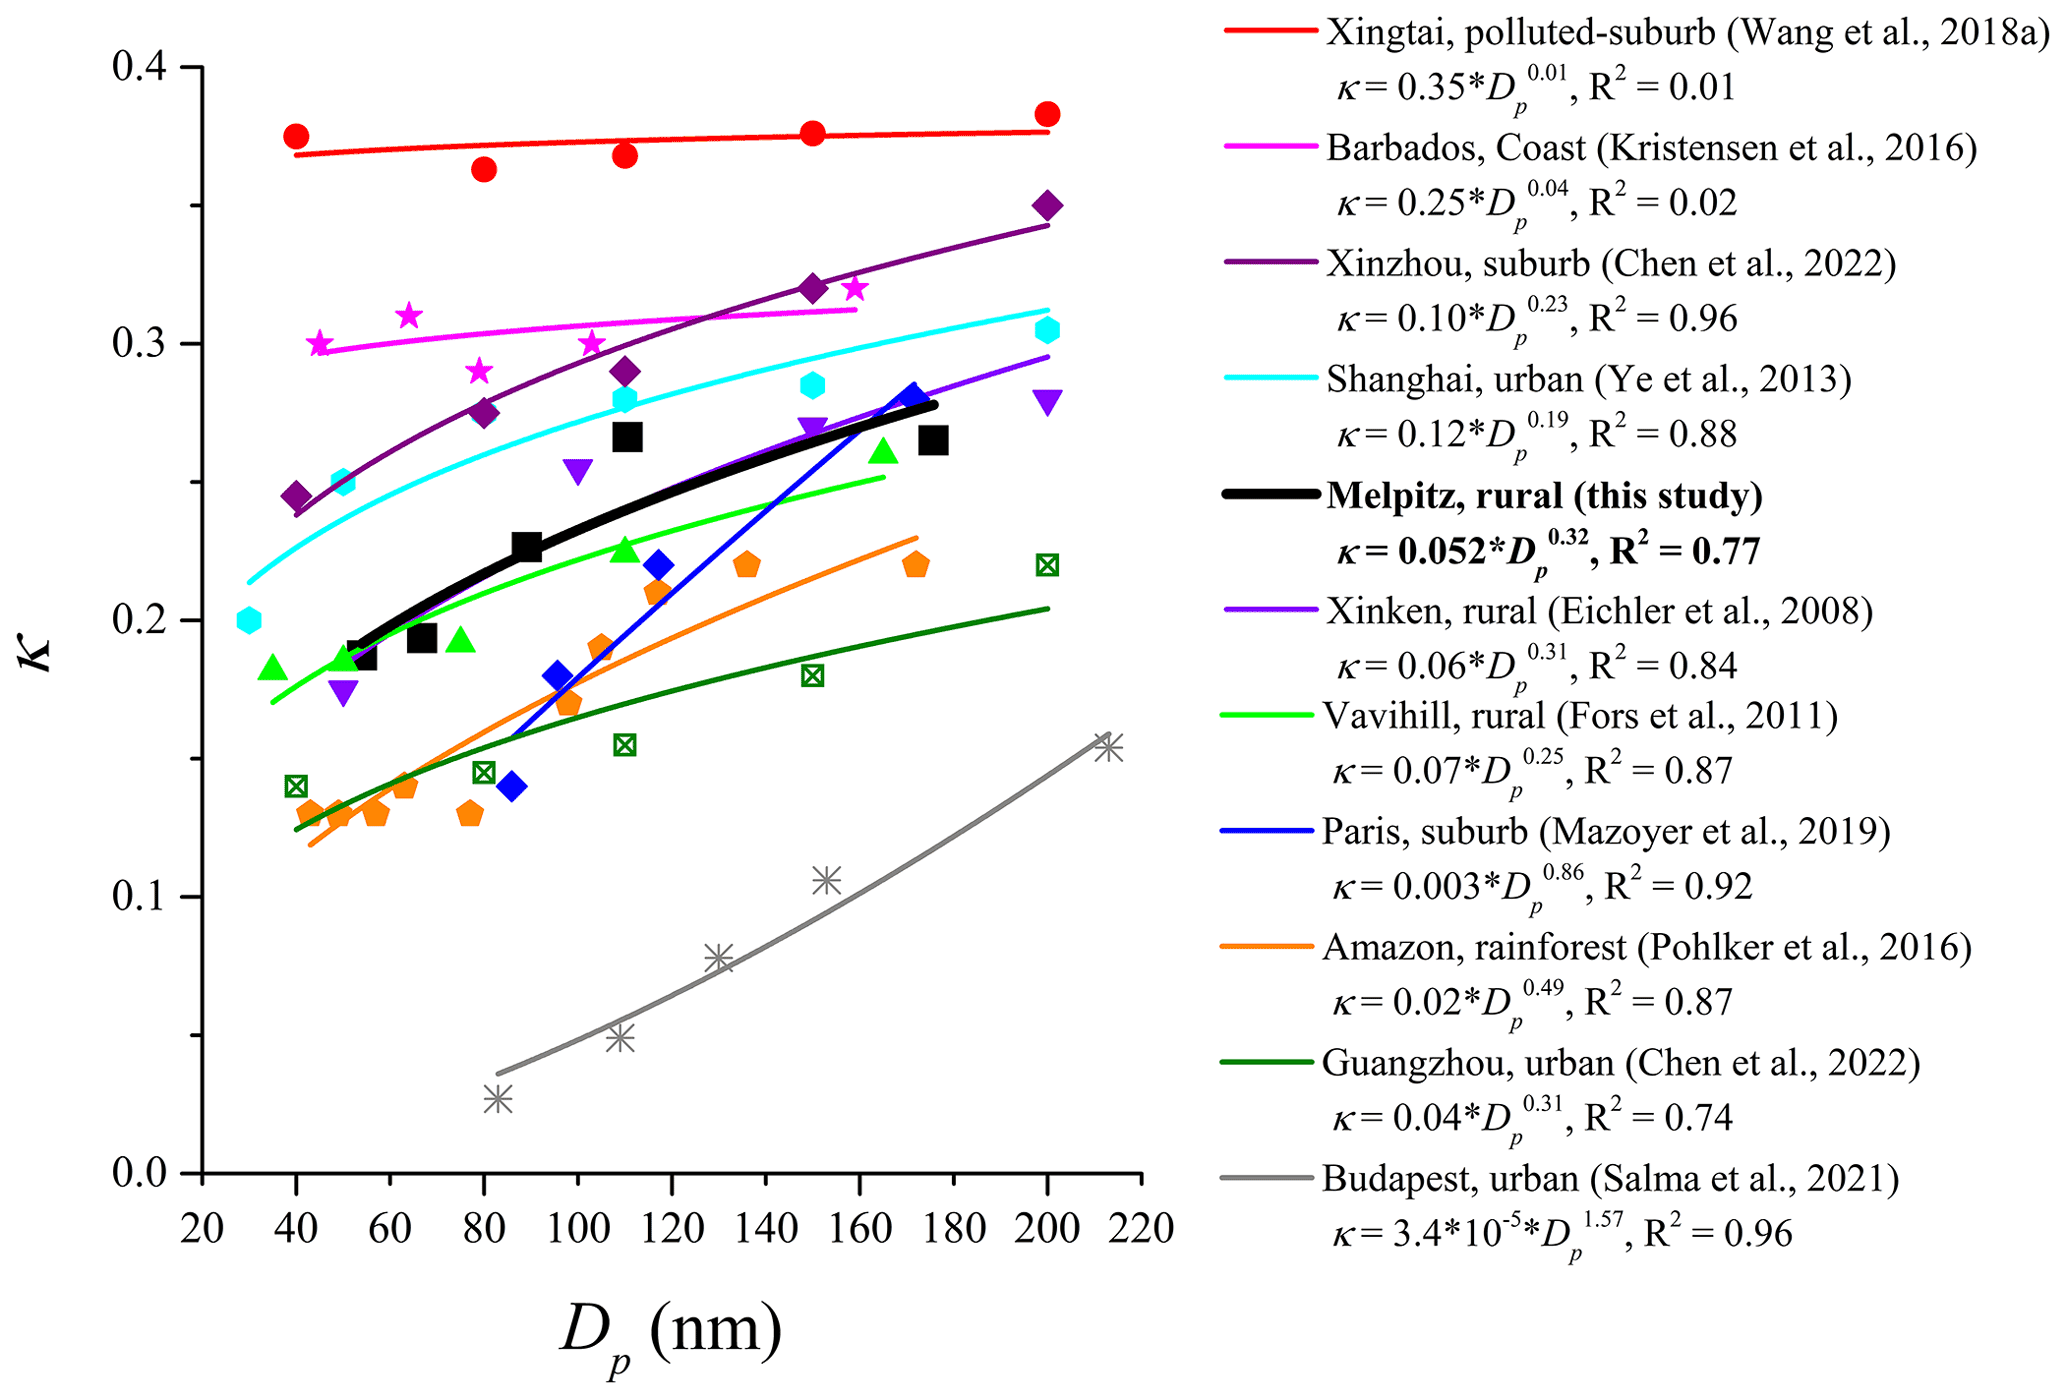
Figure 8Relationships between the particle hygroscopicity factor (κ) and diameter (Dp) observed at different stations. Lines are power-law fits of κ vs. Dp.
The K3 scheme provides an improved prediction of NCCN, which is obvious when compared to N1 and N2 schemes. Compared to K1 and K2 schemes, the K3 scheme reduced the approximately 10 % overestimation of NCCN because the fitting slope decreased ∼0.1 on average. We simply evaluate the effects of the 10 % overestimation in NCCN on predictions of cloud radiative forcing and precipitation. The methods are in Sect. S3 in the Supplement and Wang et al. (2019). Essentially, an overestimation of NCCN leads to an overestimate of the number concentration of cloud droplet (NC) in models. Theoretically, it can reduce a 3.2 % overestimation of cloud optical thickness, corresponding to global average difference of 1.28 Wm−2 when assuming the cloud shortwave cooling effect of 40 Wm−2 (Lee et al., 1997), which amounts to approximately one-third of the direct radiative forcing from a doubling CO2. Additionally, the overestimation in NCCN (and NC) leads to underestimate of the strength of the autoconversion process in cloud (Liu et al., 2006), thereby suppressing precipitation. Therefore, although ACSM measurements can derive κchem and thus predict NCCN, the monodisperse CCN measurements are still important to obtain the κ–Dp relationship and thus improve the predictions of NCCN (and NC) and climate.
Figure 8 compared the κ–Dp relationship measured at different regions. The κ–Dp relationship measured at Melpitz is similar to that measured at other rural regions with similar κ–Dp power-law fitting results, e.g., the Vavihill station in Sweden (Fors et al., 2011) and the Xinken station in China (Eichler et al., 2008). Therefore, the κ–Dp power-law fit measured at Melpitz could be applied to predict NCCN for these rural regions. We conducted a CCN closure test to support this conclusion. Due to lacking the data of PNSD and CCN measurements at Vavihill and Xinken stations, we applied the κ–Dp power-law fitting measured at the two rural stations (green and purple lines in Fig. 8) to predict the NCCN at Melpitz. Good prediction results were obtained with mean deviations of ∼1 % (Fig. S9 in the Supplement). However, it may cause considerable deviations for different aerosol background regions, e.g., the suburb stations in Xingtai, China (Wang et al., 2018a), Xinzhou, China (Chen et al., 2022), and Paris, France (Mazoyer et al., 2019), the coast of Barbados (Kristensen et al., 2016), the Amazon rainforest (Pöhlker et al., 2016), and the urban stations in Budapest, Hungary (Salma et al., 2021), Guangzhou, China (Chen et al., 2022), and Shanghai, China (Ye et al., 2013), because their κ–Dp relationships are different from that measured at Melpitz.
Aerosol particle activation plays an important role in determining NC, thereby affecting cloud microphysics, precipitation processes, radiation, and climate. To reduce the uncertainties and gain more confidence in the simulations on AIEs, long-term measurements of aerosol activation characteristics are essential. However, they are still rarely reported. Based on more than 4 years of comprehensive measurements conducted at the central European ACTRIS site of Melpitz, Germany, this study presents a systematic seasonal analysis of aerosol activation characteristics and NCCN predictions.
Over the whole period at Melpitz, the median NCCN and AR increased from 399 to 2144 cm−3 and 0.10 to 0.48, with SS increasing from 0.1 % to 0.7 %, respectively. Aerosol activation characteristics are highly variable across seasons, especially at relatively low SS conditions. For instance, at SS=0.1 %, the median NCCN and AR in winter are 1.6 and 2.3 times higher than the summer values, respectively. Aerosol particle activation depends on its physical and chemical properties. In summer, the highest Naero, smallest GMD, and lowest κchem all contribute to the lowest AR and NCCN among the four seasons, and the reverse holds true in winter. Additionally, in summer, the steepest PNSD in the 40–200 nm size range and the lowest κchem cause the strongest sensitivity of NCCN and AR to SS even though the spread in κCCN is narrowest.
Both κ and the mixing state are size-dependent, thereby varying with SS. The median κCCN decreases from 0.27 to 0.19 as SS increases from 0.1 % to 0.7 %, which was less than the median bulk κchem. The seasonal trend of κCCN was similar to that of κchem, especially at relatively low SS conditions. The lowest κCCN and κchem were observed in summer, which related to the highest organic mass fraction in particles. Aerosol particles were more internally mixed in summer and spring, whereas they were less internally mixed in winter and autumn. In cold seasons, the increasing anthropogenic emissions linked to house heating mixed with the aged particles from long-range transport, which could decrease the degree of external mixing of particles. As Dp increases, κCCN increases at the Dp range of ∼40 to 100 nm and almost stays constant at the Dp range of 100 to 200 nm, whereas the monotonically decreases. The relationships of vs. Dp and κ vs. Dp are both fitted well by a power-law function for each season.
Five activation schemes are evaluated on the NCCN predictions. Compared to using the classic NCCN–SS or AR–SS power-law fits to predict NCCN, the prediction is better when using the real-time PNSD combined with the parameterized κ, including a constant κ of 0.3, the bulk κchem, and the κ–Dp power-law fit. However, assuming a constant κ of 0.3 recommended for continental aerosol (Andreae and Rosenfeld, 2008) or the bulk κchem calculated from aerosol chemical composition causes significant overestimations of the NCCN with median values of approximately 10 % for all SS conditions, which theoretically causes 3.2 % overestimation of cloud optical thickness, amounting to approximately one-third of the direct radiative forcing from a doubling CO2 (Lee et al., 1997). Moreover, the strength of the autoconversion process in cloud could be underestimated (Liu et al., 2006). Size-resolved κ improves the NCCN prediction. We recommend applying the κ–Dp power-law fit for NCCN prediction, which obtains the best prediction among the five schemes.
The κ–Dp power-law fit presented in this study could apply to other rural regions. However, it may cause considerable deviations for different aerosol background regions. For instance, using the κ–Dp power-law fit measured in urban Budapest (Salma et al., 2021) for predicting Melpitz NCCN could cause underestimation of NCCN with a median value of 39 % for all SS conditions. Additionally, the seasonal difference of the κ–Dp relationship needs to be considered carefully for NCCN prediction. At Melpitz, if the κ–Dp power-law fit measured in summer was used for predicting NCCN in winter, it could cause underestimation of NCCN with a median value of 13 % for all SS conditions. Although the κ–Dp relationships are similarly measured in rural stations, when comparing the different urban stations (e.g., Shanghai vs. Budapest in Fig. 8), these relationships are clearly different, and the reasons for the difference are still unclear. Thus, long-term monodisperse CCN measurements are still needed not only to obtain the κ–Dp relationships for different regions and for different seasons, but also to further investigate the reasons for the difference of the κ–Dp relationships measured at same type of regions. Finally, for the purpose of predicting NCCN, the measurements of monodisperse CCN and particle chemical compositions are more expected, compared to the polydisperse CCN measurements.
| A | comprehensive parameter for , Mw, R, T, and ρw in Eq. (2b) |
| a | lower limit for calculating critical diameters at the set-nominal supersaturations in Eq. (1) |
| ACIs | aerosol and cloud interactions |
| ACSM | aerosol chemical species monitor |
| ACTRIS | Aerosol, Clouds and Trace Gases Research Infrastructure |
| AF | activated fraction, i.e., NCCN/NCN |
| AIEs | aerosol indirect effects |
| AR | activation ratio, i.e., NCCN/Naero |
| b | upper limit for calculating critical diameters at the set-nominal supersaturations in Eq. (1) |
| BC | black carbon |
| CN | condensation nuclei |
| CCN | cloud condensation nuclei |
| CCNC | cloud condensation nuclei counter |
| coef | coefficient in κ–Dp power-law fit |
| CPC | condensation particle counter |
| Dp | diameter of the dry particle |
| Dc | critical diameter of the dry particle |
| DX | D at which X % of the particles are activated |
| degree of external mixture | |
| D-MPSS | dual-mobility particle size spectrometer |
| DMA | differential mobility analyzer |
| eBC | equivalent black carbon |
| fBC | mass fraction of BC in submicron aerosol |
| fnitrate | mass fraction of nitrate in submicron aerosol |
| forg | mass fraction of organics in submicron aerosol |
| fsulfate | mass fraction of sulfate in submicron aerosol |
| GMD | geometric mean diameter of PNSD |
| Mw | molecular weight of water |
| Naero | number concentration of aerosol with a Dp range of 10 to 800 nm |
| NC | number concentration of cloud droplet |
| NCN | number concentration of CN |
| NCCN | number concentration of CCN |
| NPF | new particle formation |
| OA | organic aerosol |
| PM10 | particulate matter with the Dp<10 µm |
| PNSD | particle number size distribution |
| R | universal gas constant |
| R2 | coefficient of determination |
| RD | relative deviation between the predicted NCCN and the measured one |
| SS | supersaturation |
| SOA | secondary organic aerosol |
| T | temperature |
| σs | the shape of the sigmoid function |
| droplet surface tension | |
| κ | hygroscopicity factor of aerosol particle |
| κi | κ of each component |
| κCCN | κ calculated from the monodisperse CCN measurements |
| κchem | κ calculated from the aerosol chemical measurements |
| εi | volume fraction of each component |
| ρw | density of the liquid water |
The data used in this study are available from Silvia Henning (henning@tropos.de) upon request and https://doi.org/10.1594/PANGAEA.938215 (Wang et al., 2021).
The supplement related to this article is available online at: https://doi.org/10.5194/acp-22-15943-2022-supplement.
AW, SH, and LP designed the research. SH and LP collected the data at Melpitz. YW performed the data analysis and prepared the paper. All co-authors contributed to the interpretation of the results as well as paper review and editing.
The contact author has declared that none of the authors has any competing interests.
Publisher’s note: Copernicus Publications remains neutral with regard to jurisdictional claims in published maps and institutional affiliations.
We thank Achim Grüner and René Rabe for the careful maintenance of the measurements on site. We also thank Angela Buchholz and another anonymous reviewer for their helpful comments and suggestions on improving the paper.
This research has been supported by the H2020 Research Infrastructures (ACTRIS grant no. 262254 and ACTRIS-2 grant no. 654109); the European Cooperation in Science and Technology (COLOSSAL grant no. CA16109); the Deutsches Forschungszentrum für Gesundheit und Umwelt, Helmholtz Zentrum München (F&E grant nos. 370343200 and 371143232); the Deutsche Forschungsgemeinschaft (HE grant no. 6770/2); the National Natural Science Foundation of China (grant nos. 42205072, 42075066, 42075063, 42175099, and 42005067); and the China Scholarship Council (grant no. 202008320513).
This paper was edited by James Allan and reviewed by Angela Buchholz and one anonymous referee.
Albrecht, B. A.: Aerosols, cloud microphysics, and fractional cloudiness, Science, 245, 1227–1230, https://doi.org/10.1126/science.245.4923.1227, 1989.
Andreae, M. O. and Rosenfeld, D.: Aerosol-cloud-precipitation interactions, Part 1, The nature and sources of cloud-active particles, Earth-Sci. Rev., 89, 13–41, https://doi.org/10.1016/j.earscirev.2008.03.001, 2008.
Birmili, W., Stratmann, F., and Wiedensohler, A.: Design of a DMA-based size spectrometer for a large particle size range and stable operation, J. Aerosol Sci., 30, 549–553, https://doi.org/10.1016/S0021-8502(98)00047-0, 1999.
Birmili, W., Weinhold, K., Nordmann, S., Wiedensohler, A., Spindler, G., Müller, K., Herrmann, H., Gnauk, T., Pitz, M., Cyrys, J., Flentje, H., Nickel, C., Kuhlbusch, T. A. J., and Löschau, G.: Atmospheric aerosol measurements in the German Ultrafine Aerosol Network (GUAN): Part 1 – soot and particle number size distribution, Gefahrst. Reinh. Luft., 69, 137–145, 2009.
Burkart, J., Steiner, G., Reischl, G., and Hitzenberger, R.: Longterm study of cloud condensation nuclei (CCN) activation of the atmospheric aerosol in Vienna, Atmos. Environ., 45, 5751–5759, https://doi.org/10.1016/j.atmosenv.2011.07.022, 2011.
Che, H., Zhang, X., Zhang, L., Wang, Y., Shen, X., Ma, Q., Sun, J., Zhong, J.: Prediction of size-resolved number concentration of cloud condensation nuclei and long-term measurements of their activation characteristics, Sci. Rep., 7, 5819, https://doi.org/10.1038/s41598-017-05998-3, 2017.
Chen, G., Canonaco, F., Tobler, A., Aas, W., Alastuey, A., Allan, J., Atabakhsh, S., Aurela, M., Baltensperger, U., Bougiatioti, A., Brito, J. F. D., Ceburnis, D., Chazeau, B., Chebaicheb, H., Daellenbach, K. R., Ehn, M., Haddad, I. E., Eleftheriadis, K., Favez, O., Flentje, H., Font, A., Fossum, K., Freney, E., Gini, M., Green, D. C., Heikkinen, L., Herrmann, H., Kalogridis, A., Keernik, H., Lhotka, R., Lin, C., Lunder, C., Maasikmets, M., Manousakas, M. I., Marchand, N., Marin, C., Marmureanu, L., Mihalopoulos, N., Močnik, G., Nęcki, J., O'Dowd, C., Ovadnevaite, J., Peter, T., Petit, J., Pikridas, M., Platt, S. M., Pokorná, P., Poulain, L., Priestman, M., Riffault, V., Rinaldi, M., Różański, K., Schwarz, J., Sciare, J., Simon, L., Skiba, A., Slowik, J. G., Sosedova, Y., Stavroulas, I., Styszko, K., Teinemaa, E., Timonen, H., Tremper, A., Vasilescu, J., Via, M., Vodička, P., Wiedensohler, A., Zografou, O., Minguillón, M. C., Prévôt, A. S. H.: European aerosol phenomenology − 8: Harmonised source apportionment of organic aerosol using 22 Year-long ACSM/AMS datasets, Environ. Int., 166, 107325, https://doi.org/10.1016/j.envint.2022.107325, 2022.
Chen, L., Zhang, F., Zhang, D., Wang, X., Song, W., Liu, J., Ren, J., Jiang, S., Li, X., and Li, Z.: Measurement report: Hygroscopic growth of ambient fine particles measured at five sites in China, Atmos. Chem. Phys., 22, 6773–6786, https://doi.org/10.5194/acp-22-6773-2022, 2022.
Clegg, S., Brimblecombe, P., and Wexler, A.: Thermodynamic model of the system H+ − NH − SO − NO − H2O at tropospheric temperatures, J. Phys. Chem. A, 102, 2137–2154, https://doi.org/10.1021/jp973042r, 1998.
Crenn, V., Sciare, J., Croteau, P. L., Verlhac, S., Fröhlich, R., Belis, C. A., Aas, W., Äijälä, M., Alastuey, A., Artiñano, B., Baisnée, D., Bonnaire, N., Bressi, M., Canagaratna, M., Canonaco, F., Carbone, C., Cavalli, F., Coz, E., Cubison, M. J., Esser-Gietl, J. K., Green, D. C., Gros, V., Heikkinen, L., Herrmann, H., Lunder, C., Minguillón, M. C., Močnik, G., O'Dowd, C. D., Ovadnevaite, J., Petit, J.-E., Petralia, E., Poulain, L., Priestman, M., Riffault, V., Ripoll, A., Sarda-Estève, R., Slowik, J. G., Setyan, A., Wiedensohler, A., Baltensperger, U., Prévôt, A. S. H., Jayne, J. T., and Favez, O.: ACTRIS ACSM intercomparison – Part 1: Reproducibility of concentration and fragment results from 13 individual Quadrupole Aerosol Chemical Speciation Monitors (Q-ACSM) and consistency with co-located instruments, Atmos. Meas. Tech., 8, 5063–5087, https://doi.org/10.5194/amt-8-5063-2015, 2015.
Crippa, M., Canonaco, F., Lanz, V. A., Äijälä, M., Allan, J. D., Carbone, S., Capes, G., Ceburnis, D., Dall'Osto, M., Day, D. A., DeCarlo, P. F., Ehn, M., Eriksson, A., Freney, E., Hildebrandt Ruiz, L., Hillamo, R., Jimenez, J. L., Junninen, H., Kiendler-Scharr, A., Kortelainen, A.-M., Kulmala, M., Laaksonen, A., Mensah, A. A., Mohr, C., Nemitz, E., O'Dowd, C., Ovadnevaite, J., Pandis, S. N., Petäjä, T., Poulain, L., Saarikoski, S., Sellegri, K., Swietlicki, E., Tiitta, P., Worsnop, D. R., Baltensperger, U., and Prévôt, A. S. H.: Organic aerosol components derived from 25 AMS data sets across Europe using a consistent ME-2 based source apportionment approach, Atmos. Chem. Phys., 14, 6159–6176, https://doi.org/10.5194/acp-14-6159-2014, 2014.
Croft, B., Lohmann, U., Martin, R. V., Stier, P., Wurzler, S., Feichter, J., Posselt, R., and Ferrachat, S.: Aerosol size-dependent below-cloud scavenging by rain and snow in the ECHAM5-HAM, Atmos. Chem. Phys., 9, 4653–4675, https://doi.org/10.5194/acp-9-4653-2009, 2009.
Deng, Z. Z., Zhao, C. S., Ma, N., Liu, P. F., Ran, L., Xu, W. Y., Chen, J., Liang, Z., Liang, S., Huang, M. Y., Ma, X. C., Zhang, Q., Quan, J. N., Yan, P., Henning, S., Mildenberger, K., Sommerhage, E., Schäfer, M., Stratmann, F., and Wiedensohler, A.: Size-resolved and bulk activation properties of aerosols in the North China Plain, Atmos. Chem. Phys., 11, 3835–3846, https://doi.org/10.5194/acp-11-3835-2011, 2011.
Deng, Z. Z., Zhao, C. S., Ma, N., Ran, L., Zhou, G. Q., Lu, D. R., and Zhou, X. J.: An examination of parameterizations for the CCN number concentration based on in situ measurements of aerosol activation properties in the North China Plain, Atmos. Chem. Phys., 13, 6227–6237, https://doi.org/10.5194/acp-13-6227-2013, 2013.
Dusek, U., Frank, G., Hildebrandt, L., Curtius, J., Schneider, J., Walter, S., Chand, D., Drewnick, F., Hings, S., Jung, D., Borrmann, S., and Andreae, M. O.: Size matters more than chemistry for cloud-nucleating ability of aerosol particles, Science, 312, 1375–1378, https://doi.org/10.1126/science.1125261, 2006.
Dusek, U., Frank, G., Curtius, J., Drewnick, F., Schneider, J., Kürten, A., Rose, D., Andreae, M. O., Borrmann, S., Pöschl, U.: Enhanced organic mass fraction and decreased hygroscopicity of cloud condensation nuclei (CCN) during new particle formation events, Geophys. Res. Lett. 37, L03804, https://doi.org/10.1029/2009GL040930, 2010.
Eichler, H., Cheng, Y. F., Birmili, W., Nowak, A., Wiedensohler, A., Brüggemann, E., Gnauk, T., Herrmann, H., Althausen, D., Ansmann, A., Engelmann, R., Tesche, M., Wendisch, M., Zhang, Y. H., Hu, M., Liu, S., and Zeng, L. M.: Hygroscopic properties and extinction of aerosol particles at ambient relative humidity in South-Eastern China, Atmos. Environ., 42, 6321–6334, https://doi.org/10.1016/j.atmosenv.2008.05.007, 2008.
Fan, J., Leung, L. R., Li, Z., Morrison, H., Chen, H., Zhou, Y., Qian, Y., and Wang, Y.: Aerosol impacts on clouds and precipitation in eastern China: Results from bin and bulk microphysics, J. Geophys. Res., 117, D00K36, https://doi.org/10.1029/2011JD016537, 2012.
Fan, J., Rosenfeld, D., Zhang, Y., Giangrande, S. E., Li, Z., Machado, L. A. T., Martin, S. T., Yang, Y., Wang, J., Artaxo, P., Barbosa, H. M. J., Braga, R. C., Comstock, J. M., Feng, Z., Gao, W., Gomes, H. B., Mei, F., Pöhlker, C., Pöhlker, M. L., Pöschl, U., and Souza, R. A. F.: Substantial convection and precipitation enhancements by ultrafine aerosol particles, Science, 359, 411–418, https://doi.org/10.1126/science.aan8461, 2018.
Fors, E. O., Swietlicki, E., Svenningsson, B., Kristensson, A., Frank, G. P., and Sporre, M.: Hygroscopic properties of the ambient aerosol in southern Sweden – a two year study, Atmos. Chem. Phys., 11, 8343–8361, https://doi.org/10.5194/acp-11-8343-2011, 2011.
Freney, E., Zhang, Y., Croteau, P., Amodeo, T., Williams, L., Truong, F., Petit, J.-E., Sciare, J., Sarda-Esteve, R., Bonnaire, N., Arumae, T., Aurela, M., Bougiatioti, A., Mihalopoulos, N., Coz, E., Artinano, B., Crenn, V., Elste, T., Heikkinen, L., Poulain, L., Wiedensohler, A., Herrmann, H., Priestman, M., Alastuey, A., Stavroulas, I., Tobler, A., Vasilescu, J., Zanca, N., Canagaratna, M., Carbone, C., Flentje, H., Green, D., Maasikmets, M., Marmureanu, L., Minguillon, M. C., Prevot, A. S. H., Gros, V., Jayne, J., and Favez, O.: The second ACTRIS inter-comparison (2016) for Aerosol Chemical Speciation Monitors (ACSM): Calibration protocols and instrument performance evaluations, Aerosol Sci. Tech., 53, 830–842, https://doi.org/10.1080/02786826.2019.1608901, 2019.
Gunthe, S. S., King, S. M., Rose, D., Chen, Q., Roldin, P., Farmer, D. K., Jimenez, J. L., Artaxo, P., Andreae, M. O., Martin, S. T., and Pöschl, U.: Cloud condensation nuclei in pristine tropical rainforest air of Amazonia: size-resolved measurements and modeling of atmospheric aerosol composition and CCN activity, Atmos. Chem. Phys., 9, 7551–7575, https://doi.org/10.5194/acp-9-7551-2009, 2009.
Gunthe, S. S., Rose, D., Su, H., Garland, R. M., Achtert, P., Nowak, A., Wiedensohler, A., Kuwata, M., Takegawa, N., Kondo, Y., Hu, M., Shao, M., Zhu, T., Andreae, M. O., and Pöschl, U.: Cloud condensation nuclei (CCN) from fresh and aged air pollution in the megacity region of Beijing, Atmos. Chem. Phys., 11, 11023–11039, https://doi.org/10.5194/acp-11-11023-2011, 2011.
Gysel, M., Crosier, J., Topping, D. O., Whitehead, J. D., Bower, K. N., Cubison, M. J., Williams, P. I., Flynn, M. J., McFiggans, G. B., and Coe, H.: Closure study between chemical composition and hygroscopic growth of aerosol particles during TORCH2, Atmos. Chem. Phys., 7, 6131–6144, https://doi.org/10.5194/acp-7-6131-2007, 2007.
Gysel, M. and Stratmann, F.: WP3 – NA3: In-situ chemical, physical and optical properties of aerosols, Deliverable D3.11: Standardized protocol for CCN measurements, Tech. rep., https://actris-ecac.eu/pluginAppObj/pluginAppObj_230_192/WP3_D3.13_M24.pdf (last access: 14 June 2022), 2013.
Henning, S., Dieckmann, K., Ignatius, K., Schäfer, M., Zedler, P., Harris, E., Sinha, B., van Pinxteren, D., Mertes, S., Birmili, W., Merkel, M., Wu, Z., Wiedensohler, A., Wex, H., Herrmann, H., and Stratmann, F.: Influence of cloud processing on CCN activation behaviour in the Thuringian Forest, Germany during HCCT-2010, Atmos. Chem. Phys., 14, 7859–7868, https://doi.org/10.5194/acp-14-7859-2014, 2014.
IPCC.: Climate Change 2021: The Physical Science Basis, Contribution of Working Group I to the Sixth Assessment Report of the Intergovernmental Panel on Climate Change, Cambridge University Press, p. 959, https://doi.org/10.1017/9781009157896, 2021.
Jayachandran, V. N., Varghese, M., Murugavel, P., Todekar, K. S., Bankar, S. P., Malap, N., Dinesh, G., Safai, P. D., Rao, J., Konwar, M., Dixit, S., and Prabha, T. V.: Cloud condensation nuclei characteristics during the Indian summer monsoon over a rain-shadow region, Atmos. Chem. Phys., 20, 7307–7334, https://doi.org/10.5194/acp-20-7307-2020, 2020.
Jia, H., Ma, X., Yu, F., Liu, Y., Yin, Y.: Distinct impacts of increased aerosols on cloud droplet number concentration of stratus/stratocumulus and cumulus, Geophys. Res. Lett., 46, 13517–13525, https://doi.org/10.1029/2019GL085081, 2019.
Jurányi, Z., Tritscher, T., Gysel, M., Laborde, M., Gomes, L., Roberts, G., Baltensperger, U., and Weingartner, E.: Hygroscopic mixing state of urban aerosol derived from size-resolved cloud condensation nuclei measurements during the MEGAPOLI campaign in Paris, Atmos. Chem. Phys., 13, 6431–6446, https://doi.org/10.5194/acp-13-6431-2013, 2013.
Khain, P. A.: Notes on state-of-the-art investigations of aerosol effects on precipitation: A critical review, Environ. Res. Lett., 4, 015004, https://doi.org/10.1088/1748-9326/4/1/015004, 2009.
Kim, J. H., Yum, S. S., Shim, S., Kim, W. J., Park, M., Kim, J.-H., Kim, M.-H., and Yoon, S.-C.: On the submicron aerosol distributions and CCN number concentrations in and around the Korean Peninsula, Atmos. Chem. Phys., 14, 8763–8779, https://doi.org/10.5194/acp-14-8763-2014, 2014.
Köhler, H.: The nucleus in and the growth of hygroscopic droplets, Trans. Farad. Soc., 32, 1152–1161, https://doi.org/10.1039/TF9363201152, 1936.
Kristensen, T. B., Müller, T., Kandler, K., Benker, N., Hartmann, M., Prospero, J. M., Wiedensohler, A., and Stratmann, F.: Properties of cloud condensation nuclei (CCN) in the trade wind marine boundary layer of the western North Atlantic, Atmos. Chem. Phys., 16, 2675–2688, https://doi.org/10.5194/acp-16-2675-2016, 2016.
Kuang, Y., He, Y., Xu, W., Zhao, P., Cheng, Y., Zhao, G., Tao, J., Ma, N., Su, H., Zhang, Y., Sun, J., Cheng, P., Yang, W., Zhang, S., Wu, C., Sun, Y., and Zhao, C.: Distinct diurnal variation in organic aerosol hygroscopicity and its relationship with oxygenated organic aerosol, Atmos. Chem. Phys., 20, 865–880, https://doi.org/10.5194/acp-20-865-2020, 2020.
Kulmala, M., Petäjä, T., Nieminen, T., Sipilä, M., Manninen, H. E., Lehtipalo, K., Dal Maso, M., Aalto, P. P., Junninen, H., Paasonen, P., Riipinen, I., Lehtinen, K. E. J., Laaksonen, A., and Kerminen, V.-M.: Measurement of the nucleation of atmospheric aerosol particles, Nat. Protocols, 7, 1651–1667, https://doi.org/10.1038/nprot.2012.091, 2012.
Lee, W., Iacobellis, S. F., and Somerville, R. C. J.: Cloud Radiation Forcings and Feedbacks: General Circulation Model Tests and Observational Validation, J. Climate, 10, 2479–2496, 1997.
Liu, J. and Li, Z.: Estimation of cloud condensation nuclei concentration from aerosol optical quantities: influential factors and uncertainties, Atmos. Chem. Phys., 14, 471–483, https://doi.org/10.5194/acp-14-471-2014, 2014.
Liu, Y., Daum, P. H., McGraw, R., and Miller, M.: Generalized threshold function accounting for effect of relative dispersion on threshold behavior of autoconversion process, Geophys. Res. Lett., 33, L11804, https://doi.org/10.1029/2005GL025500, 2006.
Ma, N. and Birmili, W.: Estimating the contribution of photochemical particle formation to ultrafine particle number averages in an urban atmosphere, Sci. Total Environ., 512/513, 154–166, https://doi.org/10.1016/j.scitotenv.2015.01.009, 2015
Massling, A., Stock, M., Wehner, B., Wu, Z. J., Hu, M., Brueggemann, E., Gnauk, T., Herrmann, H., and Wiedensohler, A.: Size segregated water uptake of the urban submicrometer aerosol in Beijing, Atmos. Environ., 43, 1578–1589, https://doi.org/10.1016/j.atmosenv.2008.06.003, 2009.
Mazoyer, M., Burnet, F., Denjean, C., Roberts, G. C., Haeffelin, M., Dupont, J.-C., and Elias, T.: Experimental study of the aerosol impact on fog microphysics, Atmos. Chem. Phys., 19, 4323–4344, https://doi.org/10.5194/acp-19-4323-2019, 2019.
Müller, T., Henzing, J. S., de Leeuw, G., Wiedensohler, A., Alastuey, A., Angelov, H., Bizjak, M., Collaud Coen, M., Engström, J. E., Gruening, C., Hillamo, R., Hoffer, A., Imre, K., Ivanow, P., Jennings, G., Sun, J. Y., Kalivitis, N., Karlsson, H., Komppula, M., Laj, P., Li, S.-M., Lunder, C., Marinoni, A., Martins dos Santos, S., Moerman, M., Nowak, A., Ogren, J. A., Petzold, A., Pichon, J. M., Rodriquez, S., Sharma, S., Sheridan, P. J., Teinilä, K., Tuch, T., Viana, M., Virkkula, A., Weingartner, E., Wilhelm, R., and Wang, Y. Q.: Characterization and intercomparison of aerosol absorption photometers: result of two intercomparison workshops, Atmos. Meas. Tech., 4, 245–268, https://doi.org/10.5194/amt-4-245-2011, 2011.
Nenes, A., Charlson, R. J., Facchini, M. C., Kulmalam M., Laaksonen, A., and Seinfeld, J. H.: Can chemical effects on cloud droplet number rival the first indirect effect?, Geophys. Res. Lett., 29, 29-1–29-4, https://doi.org/10.1029/2002GL015295, 2002.
Ng, N. L., Herndon, S. C., Trimborn, A., Canagaratna, M. R., Croteau, P. L., Onasch, T. B., Sueper, D., Worsnop, D. R., Zhang, Q., Sun, Y. L., and Jayne, J. T.: An Aerosol Chemical Speciation Monitor (ACSM) for Routine Monitoring of the Composition and Mass Concentrations of Ambient Aerosol, Aerosol Sci. Tech., 45, 780–794, https://doi.org/10.1080/02786826.2011.560211, 2011.
Ovadnevaite, J., Zuend, A., Laaksonen, A., Sanchez, K. J., Roberts, G., Ceburnis, D., Decesari, S., Rinaldi, M., Hodas, N., Facchini, M. C., Seinfeld, J. H. and O' Dowd, C.: Surface tension prevails over solute effect in organic-influenced cloud droplet activation, Nature, 546, 637–641, https://doi.org/10.1038/nature22806, 2017.
Paramonov, M., Kerminen, V.-M., Gysel, M., Aalto, P. P., Andreae, M. O., Asmi, E., Baltensperger, U., Bougiatioti, A., Brus, D., Frank, G. P., Good, N., Gunthe, S. S., Hao, L., Irwin, M., Jaatinen, A., Jurányi, Z., King, S. M., Kortelainen, A., Kristensson, A., Lihavainen, H., Kulmala, M., Lohmann, U., Martin, S. T., McFiggans, G., Mihalopoulos, N., Nenes, A., O'Dowd, C. D., Ovadnevaite, J., Petäjä, T., Pöschl, U., Roberts, G. C., Rose, D., Svenningsson, B., Swietlicki, E., Weingartner, E., Whitehead, J., Wiedensohler, A., Wittbom, C., and Sierau, B.: A synthesis of cloud condensation nuclei counter (CCNC) measurements within the EUCAARI network, Atmos. Chem. Phys., 15, 12211–12229, https://doi.org/10.5194/acp-15-12211-2015, 2015.
Petters, M. D. and Kreidenweis, S. M.: A single parameter representation of hygroscopic growth and cloud condensation nucleus activity, Atmos. Chem. Phys., 7, 1961–1971, https://doi.org/10.5194/acp-7-1961-2007, 2007.
Petzold, A. and Schönlinner, M.: Multi-angle absorption photometry – a new method for the measurement of aerosol light absorption and atmospheric black carbon, J. Aerosol Sci., 35, 421–441, https://doi.org/10.1016/j.jaerosci.2003.09.005, 2004.
Poulain, L., Wu, Z., Petters, M. D., Wex, H., Hallbauer, E., Wehner, B., Massling, A., Kreidenweis, S. M., and Stratmann, F.: Towards closing the gap between hygroscopic growth and CCN activation for secondary organic aerosols – Part 3: Influence of the chemical composition on the hygroscopic properties and volatile fractions of aerosols, Atmos. Chem. Phys., 10, 3775–3785, https://doi.org/10.5194/acp-10-3775-2010, 2010.
Poulain, L., Spindler, G., Birmili, W., Plass-Dülmer, C., Wiedensohler, A., and Herrmann, H.: Seasonal and diurnal variations of particulate nitrate and organic matter at the IfT research station Melpitz, Atmos. Chem. Phys., 11, 12579–12599, https://doi.org/10.5194/acp-11-12579-2011, 2011.
Poulain, L., Birmili, W., Canonaco, F., Crippa, M., Wu, Z. J., Nordmann, S., Spindler, G., Prévôt, A. S. H., Wiedensohler, A., and Herrmann, H.: Chemical mass balance of 300 °C non-volatile particles at the tropospheric research site Melpitz, Germany, Atmos. Chem. Phys., 14, 10145–10162, https://doi.org/10.5194/acp-14-10145-2014, 2014.
Poulain, L., Spindler, G., Grüner, A., Tuch, T., Stieger, B., van Pinxteren, D., Petit, J.-E., Favez, O., Herrmann, H., and Wiedensohler, A.: Multi-year ACSM measurements at the central European research station Melpitz (Germany) – Part 1: Instrument robustness, quality assurance, and impact of upper size cutoff diameter, Atmos. Meas. Tech., 13, 4973–4994, https://doi.org/10.5194/amt-13-4973-2020, 2020.
Pöhlker, M. L., Pöhlker, C., Ditas, F., Klimach, T., Hrabe de Angelis, I., Araújo, A., Brito, J., Carbone, S., Cheng, Y., Chi, X., Ditz, R., Gunthe, S. S., Kesselmeier, J., Könemann, T., Lavrič, J. V., Martin, S. T., Mikhailov, E., Moran-Zuloaga, D., Rose, D., Saturno, J., Su, H., Thalman, R., Walter, D., Wang, J., Wolff, S., Barbosa, H. M. J., Artaxo, P., Andreae, M. O., and Pöschl, U.: Long-term observations of cloud condensation nuclei in the Amazon rain forest – Part 1: Aerosol size distribution, hygroscopicity, and new model parametrizations for CCN prediction, Atmos. Chem. Phys., 16, 15709–15740, https://doi.org/10.5194/acp-16-15709-2016, 2016.
Pöhlker, M. L., Ditas, F., Saturno, J., Klimach, T., Hrabě de Angelis, I., Araùjo, A. C., Brito, J., Carbone, S., Cheng, Y., Chi, X., Ditz, R., Gunthe, S. S., Holanda, B. A., Kandler, K., Kesselmeier, J., Könemann, T., Krüger, O. O., Lavrič, J. V., Martin, S. T., Mikhailov, E., Moran-Zuloaga, D., Rizzo, L. V., Rose, D., Su, H., Thalman, R., Walter, D., Wang, J., Wolff, S., Barbosa, H. M. J., Artaxo, P., Andreae, M. O., Pöschl, U., and Pöhlker, C.: Long-term observations of cloud condensation nuclei over the Amazon rain forest – Part 2: Variability and characteristics of biomass burning, long-range transport, and pristine rain forest aerosols, Atmos. Chem. Phys., 18, 10289–10331, https://doi.org/10.5194/acp-18-10289-2018, 2018.
Ramanathan, V., Crutzen, P. J., Kiehl, J. T., and Rosenfeld, D.: Aerosols, climate, and the hydrological cycle, Science, 294, 2119–2124, https://doi.org/10.1126/science.1064034, 2001.
Rastak, N., Pajunoja, A., Acosta Navarro, J. C., Ma, J., Song, M., Partridge, D. G., Kirkevåg, A., Leong, Y., Hu, W. W., Taylor, N. F., Lambe, A., Cerully, K., Bougiatioti, A., Liu, P., Krejci, R., Petäjä, T., Percival, C., Davidovits, P., Worsnop, D. R., Ekman, A. M. L., Nenes, A., Martin, S., Jimenez, J. L., Collins, D. R., Topping, D. O., Bertram, A. K., Zuend, A., Virtanen, A., and Riipinen, I.: Microphysical explanation of the RH-dependent water affinity of biogenic organic aerosol and its importance for climate, Geophys. Res. Lett., 44, 5167–5177, https://doi.org/10.1002/2017gl073056, 2017.
Roberts, G. C., and Nenes, A.: A continuous-flow streamwise thermal-gradient CCN chamber for atmospheric measurements, Aerosol Sci. Tech., 39, 206–221, https://doi.org/10.1080/027868290913988, 2005.
Rose, D., Gunthe, S. S., Mikhailov, E., Frank, G. P., Dusek, U., Andreae, M. O., and Pöschl, U.: Calibration and measurement uncertainties of a continuous-flow cloud condensation nuclei counter (DMT-CCNC): CCN activation of ammonium sulfate and sodium chloride aerosol particles in theory and experiment, Atmos. Chem. Phys., 8, 1153–1179, https://doi.org/10.5194/acp-8-1153-2008, 2008.
Rose, D., Nowak, A., Achtert, P., Wiedensohler, A., Hu, M., Shao, M., Zhang, Y., Andreae, M. O., and Pöschl, U.: Cloud condensation nuclei in polluted air and biomass burning smoke near the mega-city Guangzhou, China – Part 1: Size-resolved measurements and implications for the modeling of aerosol particle hygroscopicity and CCN activity, Atmos. Chem. Phys., 10, 3365–3383, https://doi.org/10.5194/acp-10-3365-2010, 2010.
Rose, D., Gunthe, S. S., Su, H., Garland, R. M., Yang, H., Berghof, M., Cheng, Y. F., Wehner, B., Achtert, P., Nowak, A., Wiedensohler, A., Takegawa, N., Kondo, Y., Hu, M., Zhang, Y., Andreae, M. O., and Pöschl, U.: Cloud condensation nuclei in polluted air and biomass burning smoke near the mega-city Guangzhou, China – Part 2: Size-resolved aerosol chemical composition, diurnal cycles, and externally mixed weakly CCN-active soot particles, Atmos. Chem. Phys., 11, 2817–2836, https://doi.org/10.5194/acp-11-2817-2011, 2011.
Rosenfeld, D., Zhu, Y., Wang, M., Zheng, Y., Goren, T., and Yu, S.: Aerosol-driven droplet concentrations dominate coverage and water of oceanic low-level clouds, Science, 363, 6427, https://doi.org/10.1126/science.aav0566, 2019.
Salma, I., Thén, W., Vörösmarty, M., and Gyöngyösi, A. Z.: Cloud activation properties of aerosol particles in a continental Central European urban environment, Atmos. Chem. Phys., 21, 11289–11302, https://doi.org/10.5194/acp-21-11289-2021, 2021.
Schmale, J., Henning, S., Decesari, S., Henzing, B., Keskinen, H., Sellegri, K., Ovadnevaite, J., Pöhlker, M. L., Brito, J., Bougiatioti, A., Kristensson, A., Kalivitis, N., Stavroulas, I., Carbone, S., Jefferson, A., Park, M., Schlag, P., Iwamoto, Y., Aalto, P., Äijälä, M., Bukowiecki, N., Ehn, M., Frank, G., Fröhlich, R., Frumau, A., Herrmann, E., Herrmann, H., Holzinger, R., Kos, G., Kulmala, M., Mihalopoulos, N., Nenes, A., O'Dowd, C., Petäjä, T., Picard, D., Pöhlker, C., Pöschl, U., Poulain, L., Prévôt, A. S. H., Swietlicki, E., Andreae, M. O., Artaxo, P., Wiedensohler, A., Ogren, J., Matsuki, A., Yum, S. S., Stratmann, F., Baltensperger, U., and Gysel, M.: Long-term cloud condensation nuclei number concentration, particle number size distribution and chemical composition measurements at regionally representative observatories, Atmos. Chem. Phys., 18, 2853–2881, https://doi.org/10.5194/acp-18-2853-2018, 2018.
Seinfeld, J. H., and Pandis, S. N.: Atmospheric chemistry and physics: From air pollution to climate change, 3rd Edition, Hoboken: John Wiley and Sons, p. 731, ISBN 9781119221173, 2016.
Sihto, S.-L., Mikkilä, J., Vanhanen, J., Ehn, M., Liao, L., Lehtipalo, K., Aalto, P. P., Duplissy, J., Petäjä, T., Kerminen, V.-M., Boy, M., and Kulmala, M.: Seasonal variation of CCN concentrations and aerosol activation properties in boreal forest, Atmos. Chem. Phys., 11, 13269–13285, https://doi.org/10.5194/acp-11-13269-2011, 2011.
Singla, V., Mukherjee, S., Safai, P. D., Meena, G. S., Dani, K. K., Pandithurai, G.: Role of organic aerosols in CCN activation and closure over a rural background site in Western Ghats, India, Atmos. Environ., 158, 148–159, https://doi.org/10.1016/j.atmosenv.2017.03.037, 2017.
Stokes, R. H. and Robinson, R. A.: Interactions in Aqueous Nonelectrolyte Solutions. I. Solute-Solvent Equilibria, J. Phys. Chem., 70, 2126–2130, https://doi.org/10.1021/j100879a010, 1966.
Su, H., Rose, D., Cheng, Y. F., Gunthe, S. S., Massling, A., Stock, M., Wiedensohler, A., Andreae, M. O., and Pöschl, U.: Hygroscopicity distribution concept for measurement data analysis and modeling of aerosol particle mixing state with regard to hygroscopic growth and CCN activation, Atmos. Chem. Phys., 10, 7489–7503, https://doi.org/10.5194/acp-10-7489-2010, 2010.
Twomey, S.: The nuclei of natural cloud formation part II: The supersaturation in natural clouds and the variation of cloud droplet concentration, Geofisica Pura e Applicata, 43, 243–249, https://doi.org/10.1007/BF01993560, 1959.
Twomey, S.: Pollution and the planetary albedo, Atmos. Environ., 8, 1251–1256, https://doi.org/10.1016/0004-6981(74)90004-3, 1974.
Twomey, S.: The influence of pollution on the shortwave albedo of clouds, J. Atmos. Sci., 34, 1149–1152, https://doi.org/10.1175/1520-0469(1977)034<1149:TIOPOT>2.0.CO;2, 1977.
van Pinxteren, D., Fomba, K. W., Spindler, G., Müller, K., Poulain, L., Iinuma, Y., Loschau, G., Hausmann, A., and Herrmann, H.: Regional air quality in Leipzig, Germany: detailed source apportionment of size-resolved aerosol particles and compar ison with the year 2000, Faraday Discuss., 189, 291–315, https://doi.org/10.1039/c5fd00228a, 2016.
Varghese, M., Prabha, T. V., Malap, N., Resmi, E. A., Murugavel, P., Safai, P. D., Axisa, D., Pandithurai, G., and Dani, K.: Airborne and ground based CCN spectral characteristics: Inferences from CAIPEEX–2011, Atmos. Environ., 125, 324–336, https://doi.org/10.1016/j.atmosenv.2015.06.041, 2016.
Vepsäläinen, S., Calderón, S. M., Malila, J., and Prisle, N. L.: Comparison of six approaches to predicting droplet activation of surface active aerosol – Part 1: moderately surface active organics, Atmos. Chem. Phys., 22, 2669–2687, https://doi.org/10.5194/acp-22-2669-2022, 2022.
Wang, Y., Wan, Q., Meng, W., Liao, F., Tan, H., and Zhang, R.: Long-term impacts of aerosols on precipitation and lightning over the Pearl River Delta megacity area in China, Atmos. Chem. Phys., 11, 12421–12436, https://doi.org/10.5194/acp-11-12421-2011, 2011.
Wang, Y., Li, Z., Zhang, Y., Du, W., Zhang, F., Tan, H., Xu, H., Fan, T., Jin, X., Fan, X., Dong, Z., Wang, Q., and Sun, Y.: Characterization of aerosol hygroscopicity, mixing state, and CCN activity at a suburban site in the central North China Plain, Atmos. Chem. Phys., 18, 11739–11752, https://doi.org/10.5194/acp-18-11739-2018, 2018a.
Wang, Y., Wu, Z., Ma, N., Wu, Y., Zeng, L., Zhao, C., and Wiedensohler, A.: Statistical analysis and parameterization of the hygroscopic growth of the sub-micrometer urban background aerosol in Beijing, Atmos. Environ., 175, 184–191, https://doi.org/10.1016/j.atmosenv.2017.12.003, 2018b.
Wang, Y., Niu, S., Lv, J., Lu, C., Xu, X., Wang, Y., Ding, J., Zhang, H., Wang, T., and Kang, B.: A new method for distinguishing unactivated particles in cloud condensation nuclei measurements: Implications for aerosol indirect effect evaluation, Geophys. Res. Lett., 46, 14 185–14 194, https://doi.org/10.1029/2019GL085379, 2019.
Wang, Y., Henning, S., Poulain, L., Stratmann, F., Herrmann, H., and Wiedensohler, A.: Long-term CCN measurements at the central European ACTRIS research station Melpitz, Germany, PANGAEA [data set], https://doi.org/10.1594/PANGAEA.938215 2021.
Wang, Z., Birmili, W., Hamed, A., Wehner, B., Spindler, G., Pei, X., Wu, Z., Cheng, Y., Su, H., and Wiedensohler, A.: Contributions of volatile and nonvolatile compounds (at 300 ∘C) to condensational growth of atmospheric nanoparticles: An assessment based on 8.5 years of observations at the Central Europe background site Melpitz, J. Geophys. Res. Atmos., 122, 485–497, https://doi.org/10.1002/2016JD025581, 2017.
Wiedensohler, A.: An approximation of the bipolar charge distribution for particles in the sub-micron size range, J. Aerosol Sci., 19, 387–389, https://doi.org/10.1016/0021-8502(88)90278-9, 1988.
Wiedensohler, A., Birmili, W., Nowak, A., Sonntag, A., Weinhold, K., Merkel, M., Wehner, B., Tuch, T., Pfeifer, S., Fiebig, M., Fjäraa, A. M., Asmi, E., Sellegri, K., Depuy, R., Venzac, H., Villani, P., Laj, P., Aalto, P., Ogren, J. A., Swietlicki, E., Williams, P., Roldin, P., Quincey, P., Hüglin, C., Fierz-Schmidhauser, R., Gysel, M., Weingartner, E., Riccobono, F., Santos, S., Grüning, C., Faloon, K., Beddows, D., Harrison, R., Monahan, C., Jennings, S. G., O'Dowd, C. D., Marinoni, A., Horn, H.-G., Keck, L., Jiang, J., Scheckman, J., McMurry, P. H., Deng, Z., Zhao, C. S., Moerman, M., Henzing, B., de Leeuw, G., Löschau, G., and Bastian, S.: Mobility particle size spectrometers: harmonization of technical standards and data structure to facilitate high quality long-term observations of atmospheric particle number size distributions, Atmos. Meas. Tech., 5, 657–685, https://doi.org/10.5194/amt-5-657-2012, 2012.
Wiedensohler, A., Wiesner, A., Weinhold, K., Birmili, W., Hermann, M., Merkel, M., Muller, T., Pfeifer, S., Schmidt, A., Tuch, T., Velarde, F., Quincey, P., Seeger, S., and Nowak, A.: Mobility particle size spectrometers: Calibration procedures and measurement uncertainties, Aerosol Sci. Tech., 52, 146–164, https://doi.org/10.1080/02786826.2017.1387229, 2018.
Wu, Z. J., Poulain, L., Birmili, W., Größ, J., Niedermeier, N., Wang, Z. B., Herrmann, H., and Wiedensohler, A.: Some insights into the condensing vapors driving new particle growth to CCN sizes on the basis of hygroscopicity measurements, Atmos. Chem. Phys., 15, 13071–13083, https://doi.org/10.5194/acp-15-13071-2015, 2015.
Wu, Z. J., Zheng, J., Shang, D. J., Du, Z. F., Wu, Y. S., Zeng, L. M., Wiedensohler, A., and Hu, M.: Particle hygroscopicity and its link to chemical composition in the urban atmosphere of Beijing, China, during summertime, Atmos. Chem. Phys., 16, 1123–1138, https://doi.org/10.5194/acp-16-1123-2016, 2016.
Ye, X., Tang, C., Yin, Z., Chen, J., Ma, Z., Kong, L., Yang, X., Gao, W., and Geng, F.: Hygroscopic growth of urban aerosol particles during the 2009 Mirage-Shanghai Campaign, Atmos. Environ., 64, 263–269, https://doi.org/10.1016/j.atmosenv.2012.09.064, 2013.
Zdanovskii, B.: Novyi Metod Rascheta Rastvorimostei Elektrolitovv Mnogokomponentnykh Sistema, Zh. Fiz. Khim+, 22, 1478–1485, 1486–1495, 1948.
Zhang, F., Li, Y., Li, Z., Sun, L., Li, R., Zhao, C., Wang, P., Sun, Y., Liu, X., Li, J., Li, P., Ren, G., and Fan, T.: Aerosol hygroscopicity and cloud condensation nuclei activity during the AC3Exp campaign: implications for cloud condensation nuclei parameterization, Atmos. Chem. Phys., 14, 13423–13437, https://doi.org/10.5194/acp-14-13423-2014, 2014.
Zhang, F., Li, Z., Li, Y., Sun, Y., Wang, Z., Li, P., Sun, L., Wang, P., Cribb, M., Zhao, C., Fan, T., Yang, X., and Wang, Q.: Impacts of organic aerosols and its oxidation level on CCN activity from measurement at a suburban site in China, Atmos. Chem. Phys., 16, 5413–5425, https://doi.org/10.5194/acp-16-5413-2016, 2016.
Zhang, F., Wang, Y., Peng, J., Ren, J., Collins, D., Zhang, R., Sun, Y., Yang, X., and Li, Z.: Uncertainty in predicting CCN activity of aged and primary aerosols, J. Geophys. Res. Atmos., 122, 11 723–11 736, https://doi.org/10.1002/2017JD027058, 2017.
Zhao, C., and Garrett, T. J.: Effects of Arctic haze on surface cloud radiative forcing, Geophys. Res. Lett., 42, 557–564, https://doi.org/10.1002/2014GL062015, 2015.
Zhao, C., Klein, S. A., Xie, S., Liu, X., Boyle, J. S., and Zhang, Y.: Aerosol first indirect effects on non-precipitating low-level liquid cloud properties as simulated by CAM5 at ARM sites, Geophys. Res. Lett., 39, L08806, https://doi.org/10.1029/2012GL051213, 2012.