the Creative Commons Attribution 4.0 License.
the Creative Commons Attribution 4.0 License.
 | 19 Dec 2022
An assessment of land energy balance over East Asia from multiple lines of evidence and the roles of the Tibet Plateau, aerosols, and clouds
Qiuyan Wang
Su Yang
Qi Chen
Xixun Zhou
Bing Xie
Yuying Wang
Guangyu Shi
Martin Wild
With high emissions of aerosols and the known world's “Third Pole” of the Tibet Plateau (TP) in East Asia, knowledge on the energy budget over this region has been widely concerned. This study first attempts to estimate the present-day land energy balance over East Asia by combining surface and satellite observations as well as the atmospheric reanalysis and Coupled Model Intercomparison Project Phase 6 (CMIP6) simulations. Compared to the global land budget, a substantially larger fraction of atmospheric shortwave radiation of 5.2 % is reflected, highly associated with the higher aerosol loadings and more clouds over East Asian land. While a slightly smaller fraction of atmospheric shortwave absorption of 0.6 % is unexpectedly estimated, possibly related to the lower water vapor content effects due to the thinner air over the TP to overcompensate for the aerosol and cloud effects over East Asian land. The weaker greenhouse effect and fewer low clouds due to the TP are very likely the causes of the smaller fraction of East Asian land surface downward longwave radiation. Hence, high aerosol loadings, clouds, and the TP over East Asia play vital roles in the shortwave budgets, while the TP is responsible for the longwave budgets during this regional energy budget assessment. The further obtained cloud radiative effects suggest that the presence of clouds results in a larger cooling effect on the climate system over East Asian land than that over the globe. This study provides a perspective to understand fully the roles of potential factors in influencing the different energy budget assessments over regions.
- Article
(5602 KB) - Full-text XML
-
Supplement
(902 KB) - BibTeX
- EndNote


Current patterns of Earth's weather and climate are largely determined by the spatiotemporal distributions of energy exchanges between the surface, atmosphere, and space. Theoretically, the outgoing longwave radiation (OLR) is balanced by the incoming and reflected solar radiation at the top of the atmosphere (TOA) to produce an equilibrium climate. The incoming solar radiation can be scattered by clouds and aerosols or absorbed by the intermediary atmosphere, thereby contributing to the diverse energy transformation at the surface (Trenberth et al., 2009; Wild et al., 2013a). The Earth's surface energy balance is of particular significance because it is the key driver of atmospheric and oceanic circulations, hydrological cycles, and various surface processes (Wild et al., 2008; Mercado et al., 2009; Wild et al., 2013a; L'Ecuyer et al., 2015). Anthropogenic influences on climate change are driven by the uneven distribution of the TOA net radiation caused by forcings perturbed by variations of the atmospheric composition of greenhouse gases and aerosols as well as aerosol–cloud interactions (Trenberth et al., 2009; Stephens et al., 2012; Wild et al., 2013a; Trenberth et al., 2014; L'Ecuyer et al., 2015; Wild et al., 2019; Z. Wang et al., 2021).
Many efforts have been made to quantify the magnitudes of different radiative components or energy budgets in the climate system over a range of time–space scales, such as on global scales (Lin et al., 2008; Trenberth et al., 2009; Stephens et al., 2012; Wild et al., 2013b, 2015; L'Ecuyer et al., 2015; Wild et al., 2019; Wild, 2020), over land and ocean domains or the energy transport between them (Fasullo and Trenberth, 2008a, b; Trenberth et al., 2009; Wild et al., 2015; L'Ecuyer et al., 2015), over the Arctic (Previdi et al., 2015; Christensen et al., 2016), and over individual continents and ocean basins (L'Ecuyer et al., 2015; Kim and Lee, 2018; Thomas et al., 2020). The energy balance at the TOA can be accurately monitored by satellites from the most advanced Clouds and the Earth's Radiant Energy System (CERES) Energy Balanced and Filled (EBAF) data product (Loeb et al., 2018), while considerably larger uncertainties appear at the surface fluxes owing to weaker observational constraints (Raschke et al., 2016; Kato et al., 2018; Huang et al., 2019). These assessments mostly build upon complementary approaches from a combination of space and surface observations, climate models, and reanalyses. To date, the discrepancies of independent global mean surface radiative fluxes have been estimated to be within a few W m−2 (Wild, 2017a, b), enabling the accurate quantification of global surface budgets. Besides, the surface radiative components simulated by various climate models vary substantially in a range of around 10–20 W m−2 on global scales but exhibit greater inter-model discrepancies on regional scales (Li et al., 2013; Wild et al., 2013a; Boeke and Taylor, 2016; Wild et al., 2015; Wild, 2017a, b, 2020). Existing challenges in the surface energy estimates include considerable uncertainties from surface albedo and skin temperature as well as the partitioning of surface net radiation into sensible and latent heat (SH; LH) (Wild, 2017a, b).
Due to the large population and the largest emission source of aerosols and their precursors, East Asia, especially China, has long been a hotpot in climate change research. Aerosols can interact with radiation directly by scattering and absorbing solar/thermal radiation (Ghan et al., 2012) and indirectly by modifying cloud microphysical properties and lifetimes (Li et al., 2011), thereby influencing Earth's radiation balance. As the world's largest and highest plateau, the Tibet Plateau (TP) covers nearly one-fifth of the East Asian land area, significantly affecting the atmospheric circulation, energy budget, and water cycles of the climate system through its orographic and thermal effects (Liu et al., 2007; Xu et al., 2008a, b; Wu et al., 2015). Deeper insights into the energy budget differences over East Asian and global land against the background of high aerosol emissions and the TP role in East Asia are meaningful and essential attempts. Moreover, clouds play a key role in modulating global and regional energy budgets and hydrological cycles by increasing the reflected solar radiation and also the downward thermal radiation, leading to a cooling and warming of the climate system (Stephens, 2005; Wild et al., 2013a; Li and Mao, 2015; H. Wang et al., 2021). Therefore, our emphasis in this study is on the regional characterization of the East Asian energy balance under both all-sky and clear-sky conditions based on a combination of surface observations, satellite-derived products, reanalysis, and Coupled Model Intercomparison Project Phase 6 (CMIP6) models. The cloud influence on the radiative energy budgets at the TOA, within the atmosphere, and at the surface is further quantified over this region. Section 2 introduces the different data sources used in this study, including surface and satellite observations, climate models, and reanalyses. Sections 3 and 4 provide detailed analyses of the all-sky and clear-sky estimates of the energy balance components. The inferred cloud radiative effects (CREs) at the TOA, within the atmosphere, and at the surface are presented in Sect. 5. A summary and conclusions are given in Sect. 6. The present day in this study represents the years of 2010–2014, which correspond to the last 5 years of the historical simulations in CMIP6 climate models. East Asian land as considered in this study consists of five countries, i.e., China, Japan, South and North Korea, as well as Mongolia.
2.1 Surface observations
Considering the efforts to diminish the inhomogeneities in the measurement of ground-based surface (downward) solar radiation (SSR) (Tang et al., 2011; Wang, 2014; Wang et al., 2015; Wang and Wild, 2016; He et al., 2018; Yang et al., 2018, 2019) and the large number of observational stations over China, the homogenized monthly all-sky and clear-sky SSR datasets from the China Meteorological Administration (CMA) National Meteorological Information Center (NMIC) are used in this study (http://data.cma.cn/enl, last access: 10 February 2022) (Yang et al., 2018, 2019). In this dataset, the clear-sky condition at observational sites is defined based on the measured cloud fraction per day of no more than 15 % (Yang et al., 2018). Taking clear-sky data (with relatively complex missing months compared to the all-sky dataset) as an example, sites with more than 1 year of > 2 missing months were deleted to ensure ≥ 4 years of available data during the period 2010–2014, and then the spline interpolation was performed on the missing months of the selected sites. As a consequence, 99 and 76 sites are available for the all-sky and clear-sky studies, respectively. Besides, to further explore the anthropogenic influence on SSR, 84 (62) urban and 15 (14) rural stations for all-sky (clear-sky) conditions are defined according to the administrative divisions of China (Wang et al., 2017).
For the remaining East Asian sites, we use the monthly Global Energy Balance Archive (GEBA) dataset (http://www.geba.ethz.ch, last access: 25 February 2022) (Wild et al., 2017), which contains a worldwide widespread distribution of monthly data from many sources, e.g., from the World Radiation Data Center (WRDC) or the Baseline Surface Radiation Network (BSRN). Among these data sources, the BSRN dataset has a much higher precision and temporal resolution (up to 1 min) compared to the GEBA, but its site number is very limited over East Asia (only a few sites located in Japan and one site in Xianghe, China, but with no data available during this study period). Moreover, the relative random error of the monthly SSR from the GEBA data evaluated by Gilgen et al. (1998) is 5 %.
In order to retain as many sites as possible during the study period, we widen the selection criterion of the GEBA data, i.e., sites with data ≥ 4 years and missing months ≤ 3. Eventually, 8, 2, 4, and 14 sites are selected from the GEBA in China, Mongolia, South and North Korea, and Japan, respectively. In particular, among the 14 sites in Japan, five pairs of the duplicate sites are obtained from the WRDC and BSRN sources, respectively, and the remaining 4 sites are only from the WRDC (9 sites available). For China, only 1 site from Hong Kong out of 8 GEBA sites is not repetitive from the abovementioned CMA sites (1 site available). Therefore, 16 out of 28 GEBA sites are available under all-sky conditions (including 15 sites over regions outside China and 1 site over Hong Kong, China) by taking the average of these duplicate sites in Japan instead, while the clear-sky reference sites are obtained from the interpolated CERES EBAF clear-sky estimates at the GEBA sites (also 16 sites) due to the limited numbers of observational sites over these regions. Additionally, we regard four island sites in Japan as rural stations (not shown in the figures), while the sites in Mongolia as well as South and North Korea are all urban sites.
As shown in Fig. S1 in the Supplement, there are 99 (rural/total: 15/99) and 16 (rural/total: 4/16) sites from the CMA and GEBA available under all-sky conditions, respectively, whereas 76 (rural/total: 14/99) and 16 (from the CERES-interpolated data at the 16 GEBA sites) sites are considered for clear-sky conditions, respectively. More detailed station information is given in Table S1.
2.2 Satellite observation
Owing to the excellent temporal and spatial coverage of satellite instruments, CERES data products are widely used to track variations of Earth's energy budgets. The newly released CERES EBAF Edition 4.1 with a monthly 1∘ × 1∘ latitude–longitude resolution is used in this study (https://ceres.larc.nasa.gov/data/, last access: 20 March 2022). In this dataset, the TOA radiation components are adjusted within their uncertainty ranges based on the independent observational ocean estimates of the global heating rate (Loeb et al., 2018). Unlike the directly measured TOA energy budget, the EBAF surface energy fluxes are calculated by the cloud and aerosol properties from satellite-derived products as well as the atmospheric profiles from reanalysis, with a lower accuracy than their TOA counterparts (Kato et al., 2018). The uncertainty ranges in 1∘ × 1∘ regional monthly all-sky and clear-sky longwave (LW) and shortwave (SW) radiation fluxes at the TOA are also documented by Loeb et al. (2018).
2.3 Climate models and reanalysis
Data from 40 CMIP6 climate models are used for the analyses in this study, with their model abbreviations, modeling groups, and resolutions in Table S2. A detailed description of the modeling groups participating in CMIP6 is provided at https://pcmdi.llnl.gov/CMIP6/ (last access: 14 April 2022). The CMIP6 model-calculated radiation fluxes under investigation for this study include energy budgets under both all-sky and clear-sky conditions from “historical all forcings” experiments covering the period 2010–2014. In these historical simulations, both natural (e.g., solar variability and volcanic aerosols) and anthropogenic (e.g., greenhouse gases, aerosols, and land use) forcings are considered to reproduce the climate change and evolution since preindustrial times as accurately as possible (Eyring et al., 2016). Only the first ensemble member of each model is selected for the analysis, and the model numbers vary slightly among different available energy components.
In the long history of the European Centre for Medium-Range Weather Forecasts (ECMWF), ERA5 is the fifth-generation product. It is a comprehensive reanalysis from 1959 to near real time, which assimilates as many observations as possible in the upper air and near surface (https://www.ecmwf.int/en/forecasts/datasets/reanalysis-datasets/era5, last access: 22 May 2022). Monthly means of the radiative components from ERA5 are used in this study with a resolution of 0.25∘ × 0.25∘ (regridded to 1∘ × 1∘). Compared to previous reanalyses (such as ERA-Interim), a major strength of ERA5 is the much higher temporal and spatial resolutions as well as a higher vertical resolution with 137 levels (Hersbach et al., 2020). Several independent studies have evaluated the performance of ERA5 since its release. For example, excellent closure of the Arctic energy budget based on ERA5 atmospheric data has been assessed by Mayer et al. (2019). The representation of the surface irradiance of ERA5 has been compared with other reanalyses and with ground and satellite observations (Trolliet et al., 2018; Urraca et al., 2018). Specifically, Trolliet et al. (2018) found that the surface solar irradiance over the tropical Atlantic Ocean from ERA5 exhibits fewer biases than the second version of the Modern-Era Retrospective Analysis for Research and Applications (MERRA-2). Urraca et al. (2018) reported that ERA5 can be a valid alternative for satellite-derived products in terms of surface irradiance in most inland stations compared to ERA-Interim or MERRA-2. Furthermore, based on BSRN station data, Tang et al. (2021) pointed out that the accuracy of ERA5 over land in terms of surface downward longwave radiation is higher than the CERES-derived product on average at both hourly and monthly timescales.
3.1 Shortwave components
Under all-sky conditions, the present-day annual land mean anomalies of TOA incident solar radiation as well as the SW net radiation at the TOA, within the atmosphere, and at the surface regarding their respective multi-model means as simulated by various CMIP6 models over East Asia are shown in Fig. 1a. A summary of the CMIP6 model statistics (such as the available model number, the model spread, and the standard deviation – SD) along with the corresponding multi-model mean as well as ERA5- and CERES-derived estimates of different energy balance components is listed in Table 1. As shown in Fig. 1a, with the exception of the BCC-CSM2-MR and BCC-CESM1 models, all models give an estimate around 334 W m−2 for TOA incoming solar radiation with a very small SD of 0.2, closely matching the multi-model mean as well as the CERES and ERA5 estimates (Table 1). The multi-model means of solar absorption at the TOA, within the atmosphere, and at the surface are 217, 73, and 144 W m−2, respectively, all within 2 W m−2 of the biases against the CERES-derived estimates, while they are 3–4 W m−2 larger for those from ERA5 at the TOA and within the atmosphere, yielding 1 W m−2 of bias against the CERES-based estimate at the surface (Table 1). However, the individual models vary significantly in their simulated annual East Asian land mean solar absorption, both at the TOA and the surface (Fig. 1a), with SDs of around 6 W m−2 and inter-model spreads of more than 20 W m−2 (Table 1). Considering the smaller absolute amount of atmospheric and surface solar absorption compared to the TOA counterpart (73 and 144 vs. 217 W m−2; Table 1), the relative (percentage) differences relative to their respective multi-model means indicate that the uncertainties within the atmosphere and at the surface are larger than that at the TOA (i.e., TOA: ; atmosphere: ; surface: ).
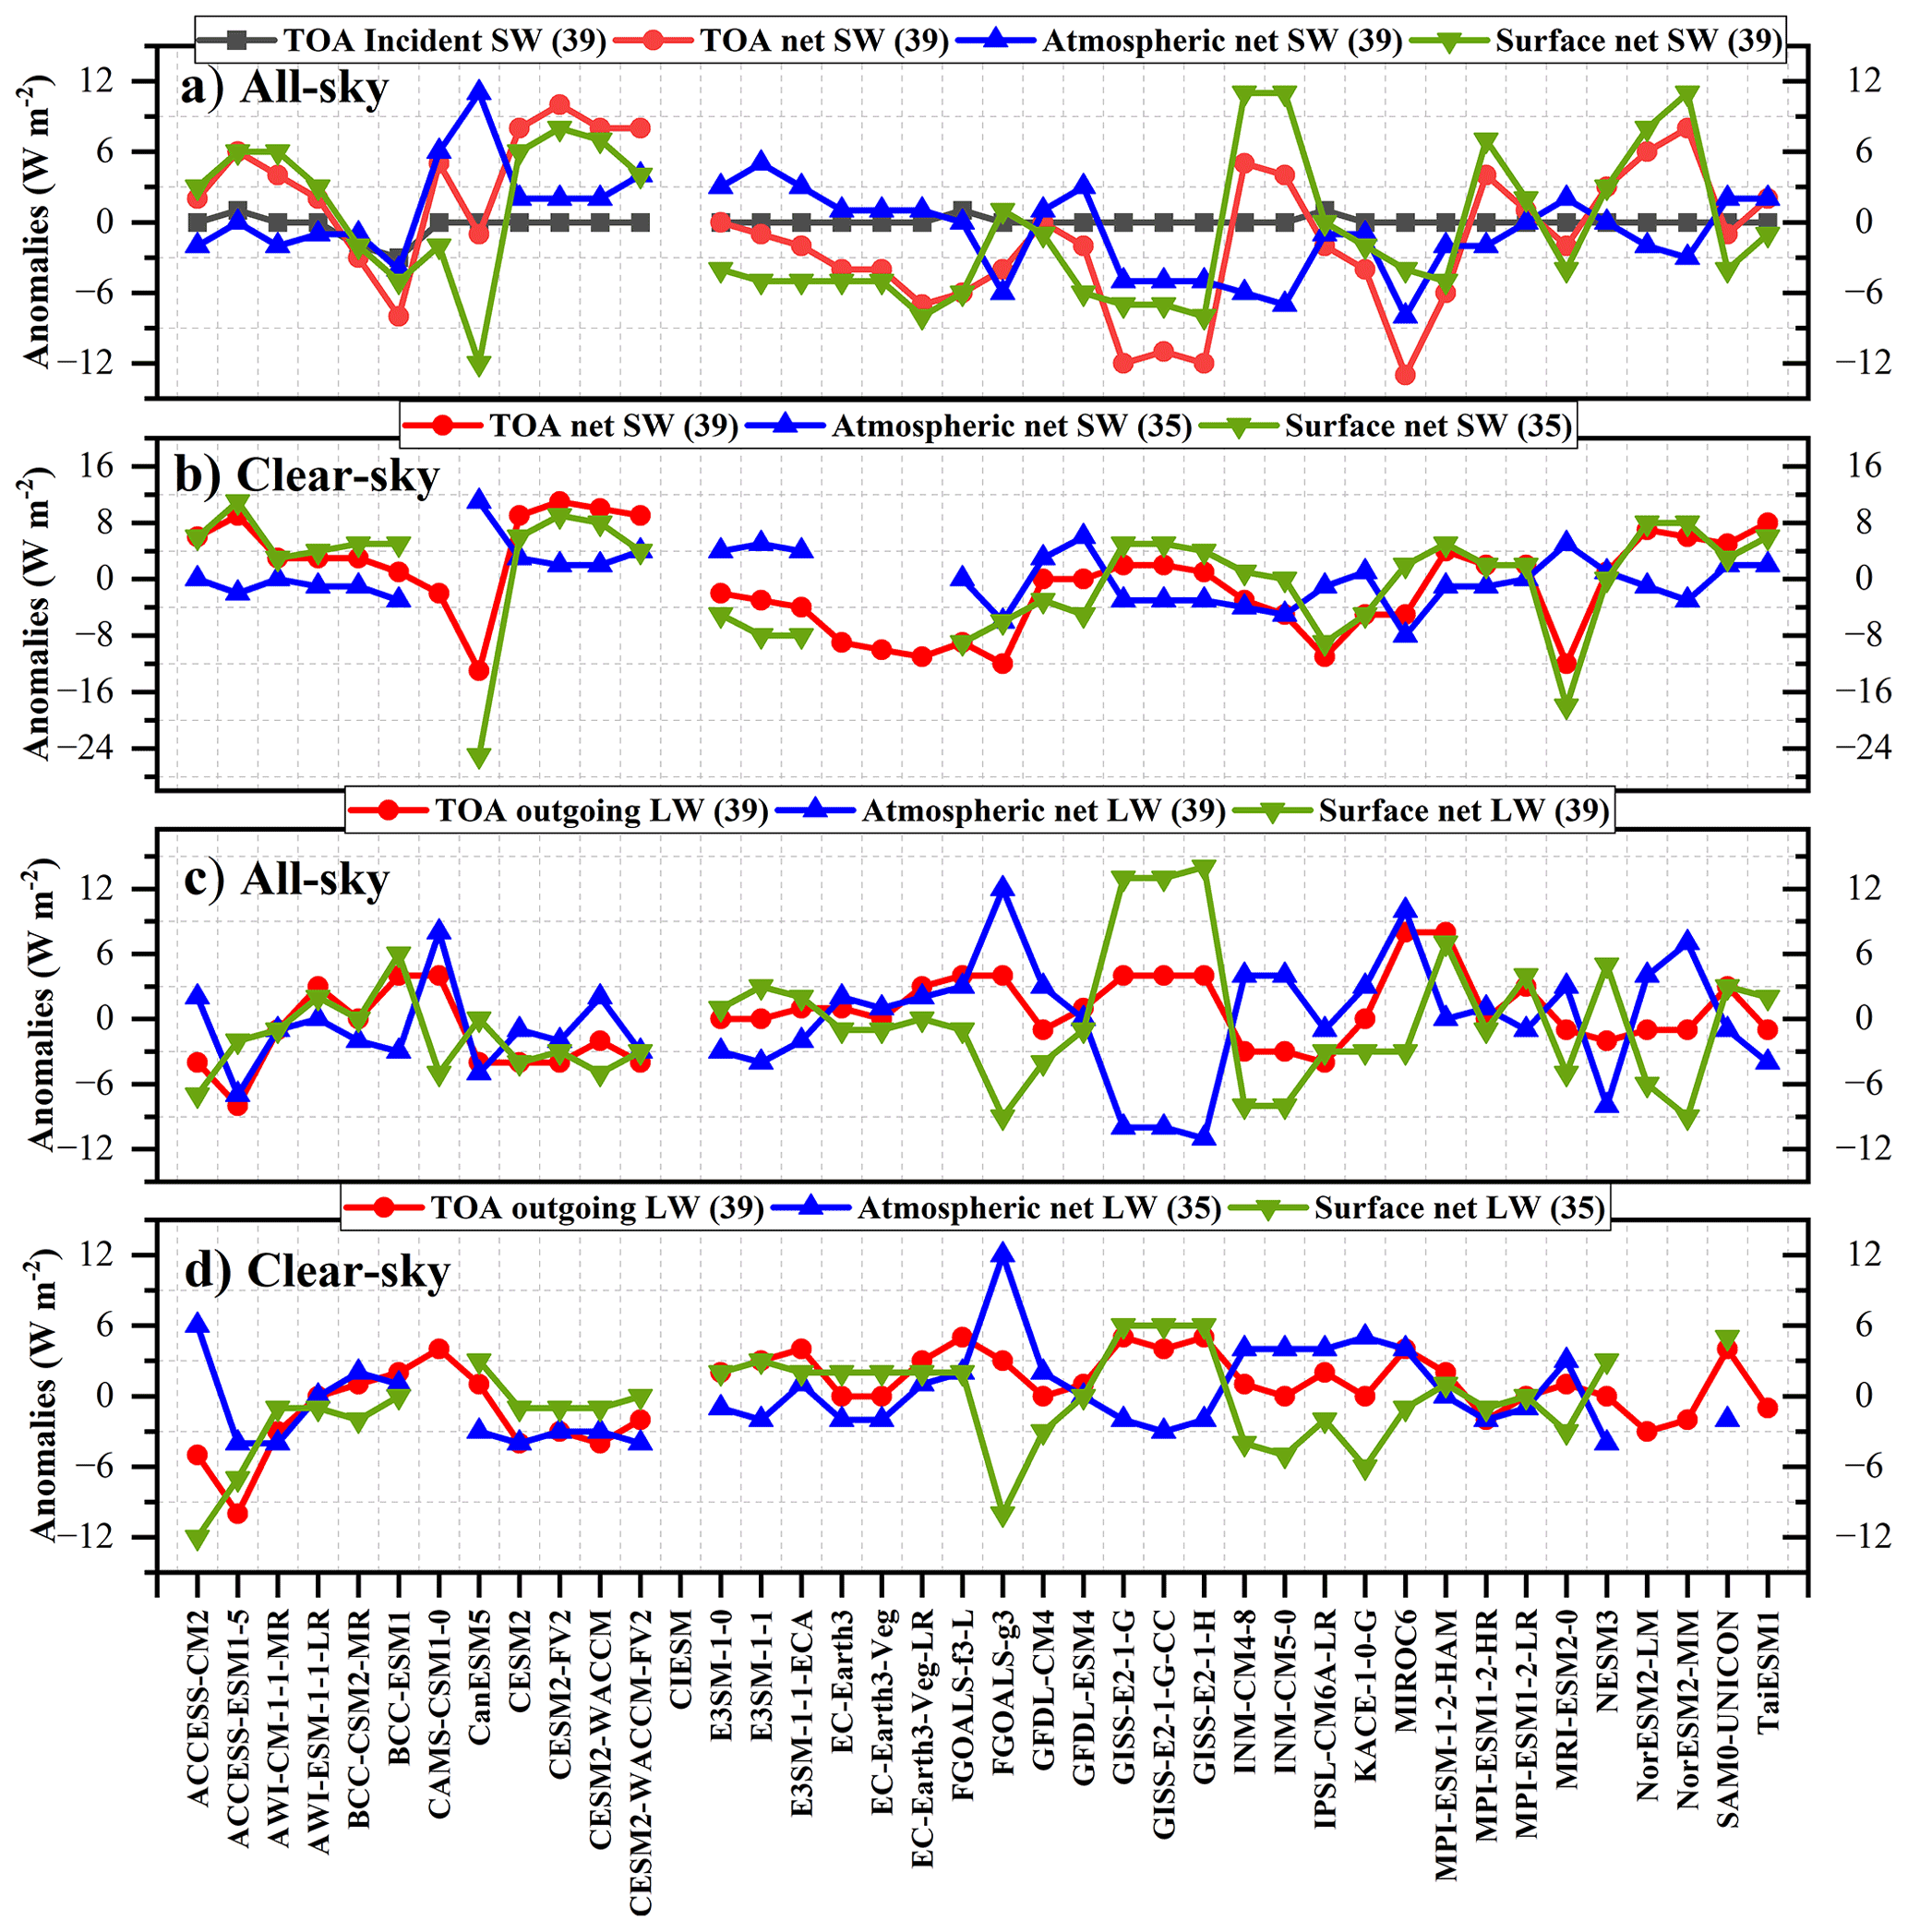
Figure 1Annual land mean anomalies of (a, b) shortwave (SW) and (c, d) longwave (LW) budgets (unit: W m−2) with regard to their respective multi-model means for the present-day climate under (a, c) all-sky and (b, d) clear-sky conditions over East Asia as simulated by various CMIP6 models. The black, red, blue, and green lines represent the TOA incoming solar radiation as well as the net SW/LW radiation at the TOA, within the atmosphere, and at the surface, respectively.
Table 1Annual land mean estimates (unit: W m−2) of the magnitudes of various energy balance components and cloud radiative effects (CREs) over East Asia under all-sky and clear-sky conditions at the TOA, within the atmosphere, and at the surface, respectively. The CMIP6 model statistics (e.g., available model number, spread, standard deviation – SD) as well as the corresponding multi-model mean, ERA5-derived, and CERES-derived estimates are also given in the table.

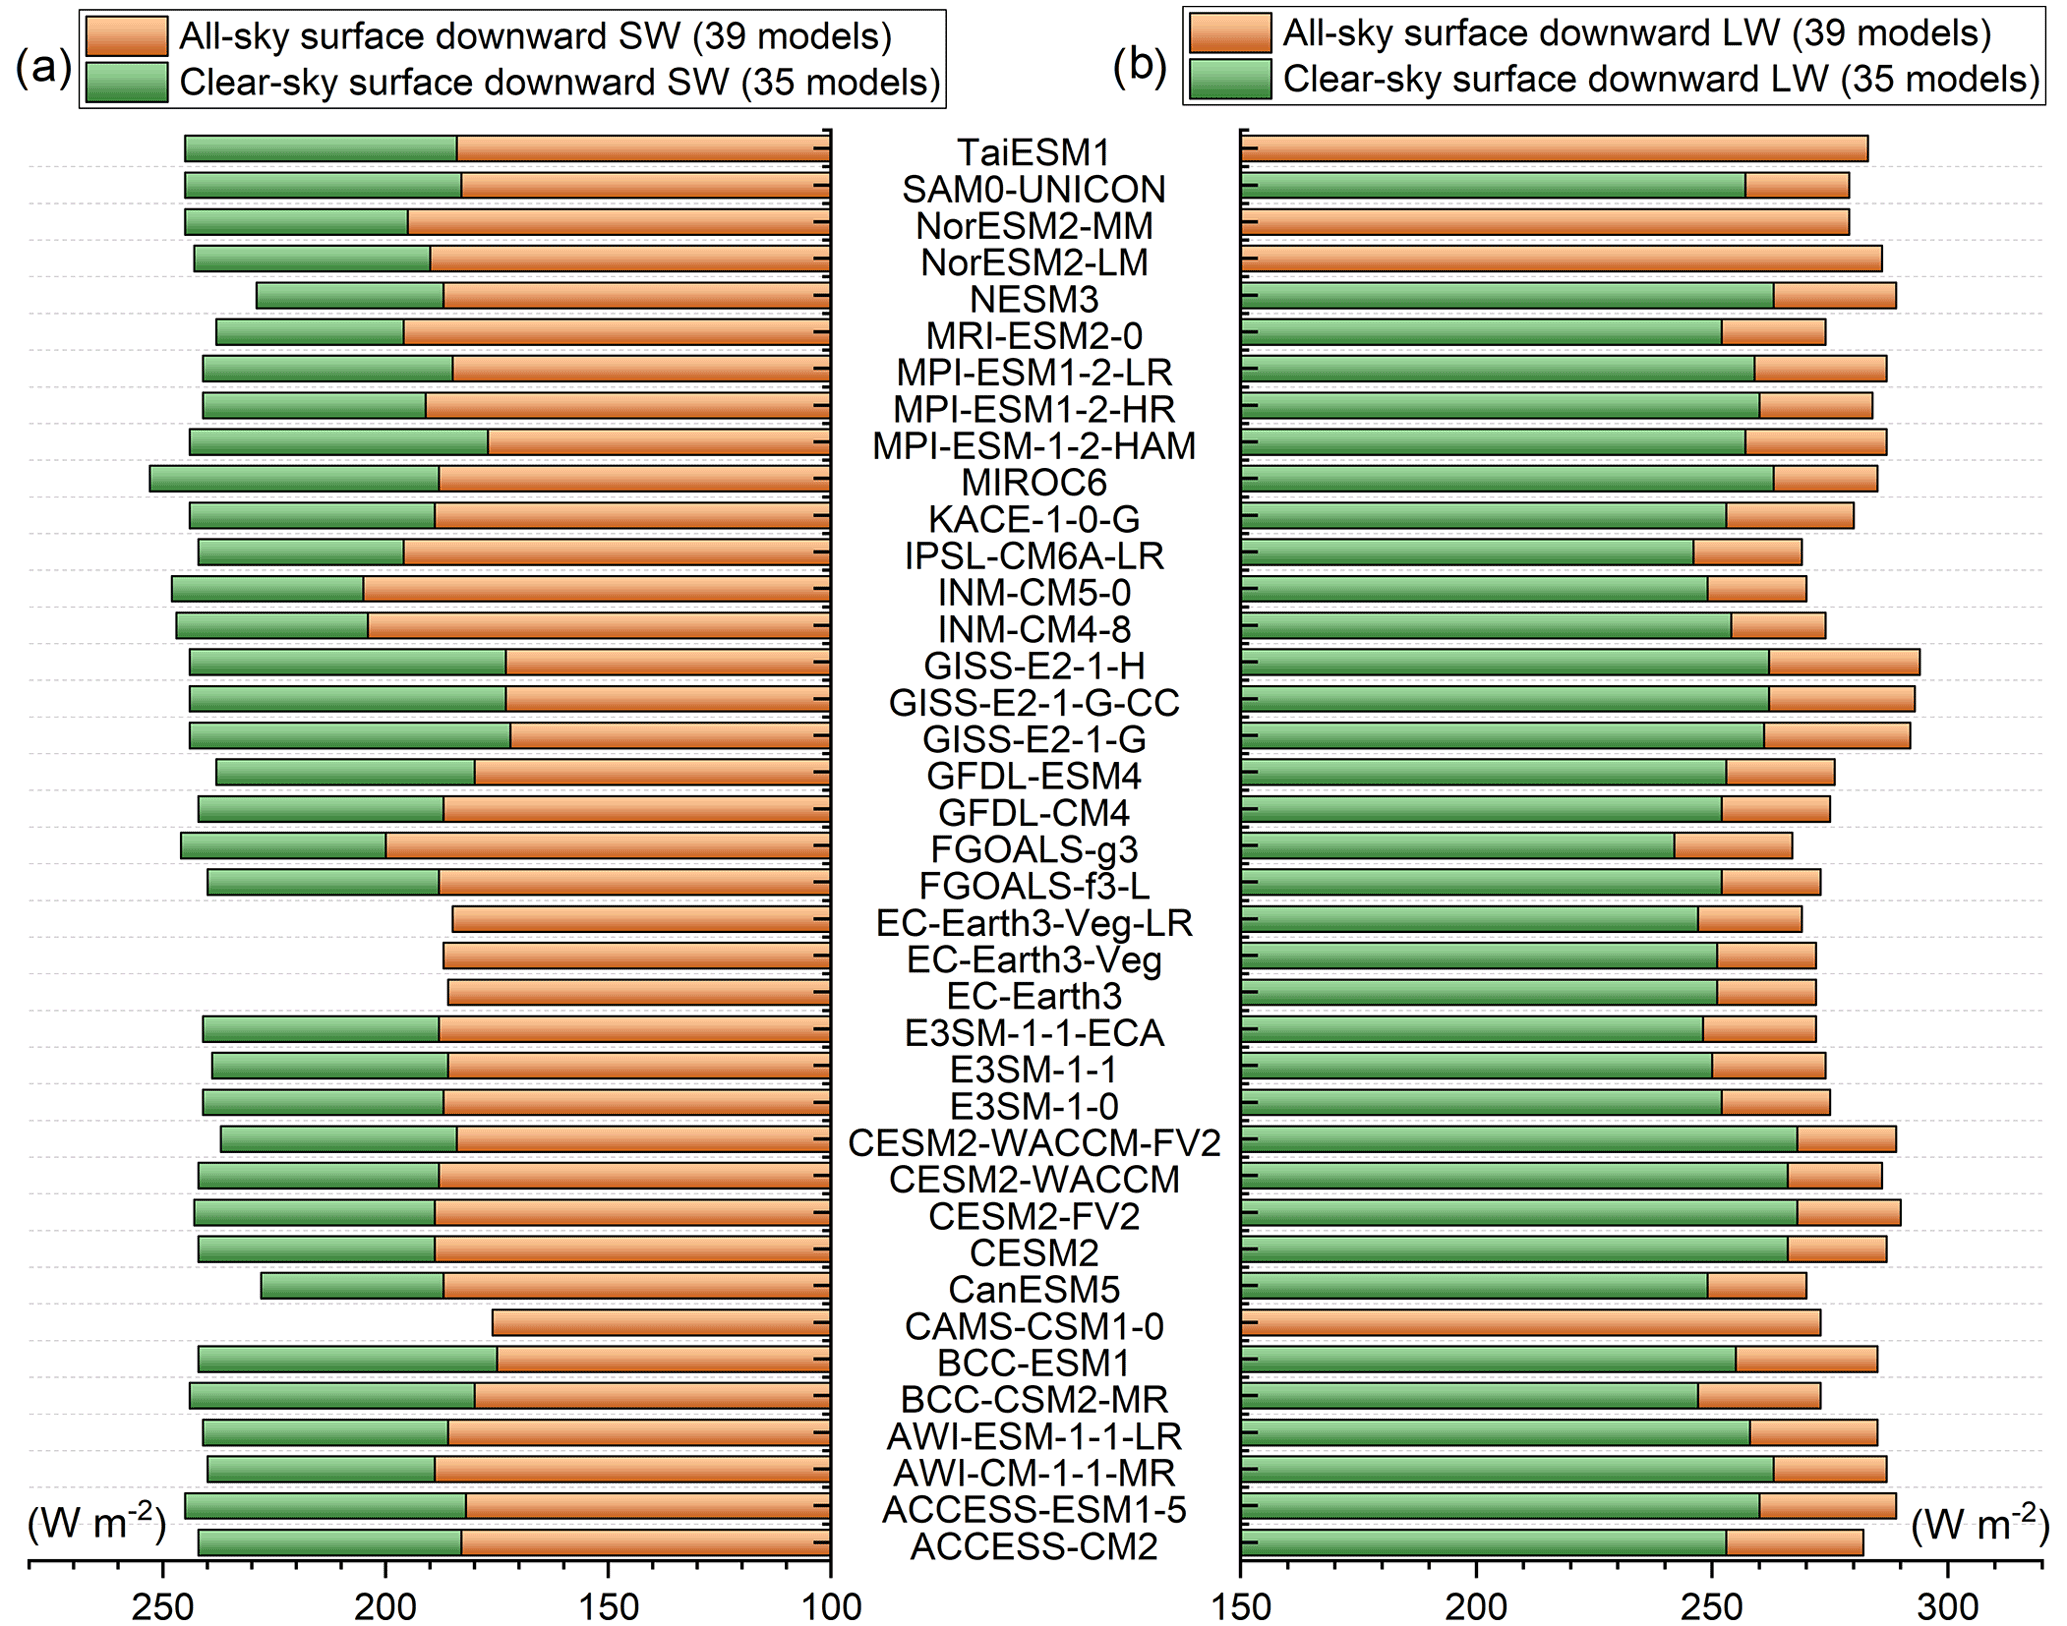
Figure 2Annual land mean surface downward (a) SW and (b) LW radiation (unit: W m−2) under both all-sky (orange bars) and clear-sky (green bars) conditions over East Asia as calculated by various CMIP6 models.
The simulated SSR, however, shows the largest spread of more than 30 W m−2 (ranging from 172 to 205 W m−2) among all the substantially differing all-sky surface radiation components, with a large SD of 7.6 W m−2 (Fig. 2a; Table 1). The multi-model mean SSR is estimated to be 186 W m−2, suggesting positive and negative deviations of 8 and 5 W m−2 from the CERES- and ERA5-derived estimates, respectively (Table 1). Interestingly, although the discrepancy between them is very large (8 or 5 W m−2), both the resulting surface solar absorption differences are very small (within 3 W m−2), indicating that a higher SSR goes together with a higher surface albedo (Table 1), which agrees well with that on a global mean level (Wild et al., 2015).
3.2 Best estimates for the surface downward SW radiation
As a major component of Earth's energy balance, the solar radiation reaching the Earth's surface governs a wide range of surface physical and chemical processes. The spatial distributions of the site-based annual mean SSR from the CMA and GEBA (Sect. 2.1) over East Asia under all-sky conditions are presented in Fig. 3a together with the classified rural and urban sites. In short, the high values are mainly located at the high-elevation stations over western China and a few island sites in Japan (e.g., Minamitorishima, Japan; not shown in the figure), especially over the TP, with the largest value reaching 263 W m−2 (Geer, Tibet), which is associated with the high atmospheric transparency over these regions. However, the low annual mean values are primarily over southwestern China, with the smallest value of 103 W m−2 (Shapingba, Chongqing), which is possibly caused by the higher aerosol loadings (Liao et al., 2015; de Leeuw et al., 2018) and more clouds (Li et al., 2017; You et al., 2019; Lei et al., 2020; Zhang et al., 2020) over these regions. This distribution pattern is highly consistent with that over China documented by Q. Wang et al. (2021).
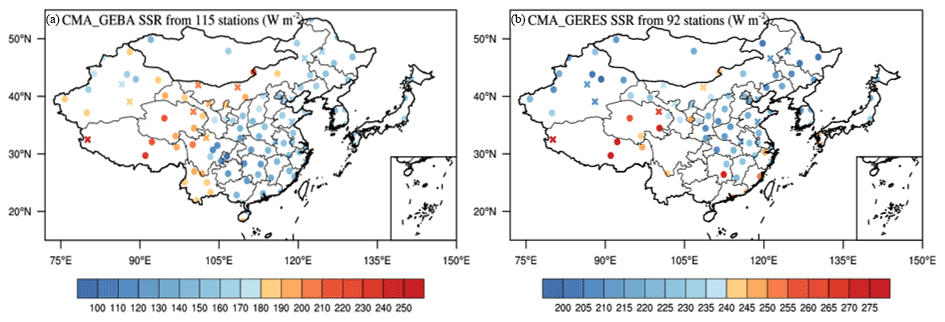
Figure 3Spatial distributions of annual mean surface downward solar radiation (SSR) (unit: W m−2) under (a) all-sky and (b) clear-sky conditions over East Asia. The all-sky sites are available from 99 CMA and 16 GEBA stations, while there are 76 CMA and 16 CERES-interpolated sites for clear-sky conditions. The cross and circle symbols indicate rural (19 vs. 18 for all-sky and clear-sky conditions) and urban stations (96 vs. 74), respectively.
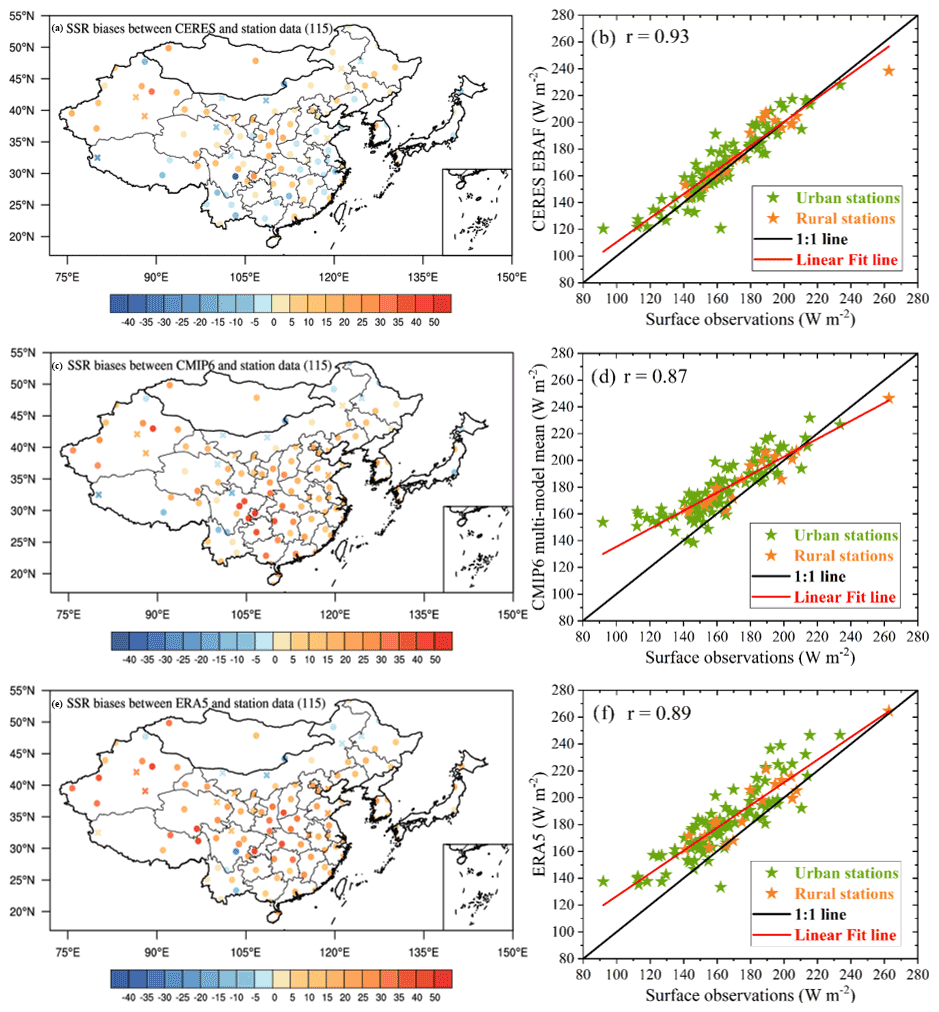
Figure 4Spatial distributions of annual mean SSR biases (unit: W m−2) derived from (a) CERES-EBAF, (c) the CMIP6 multi-model mean, and (e) ERA5 reanalysis at a combination of the CMA and GEBA sites under all-sky conditions over East Asia. The corresponding comparisons of their respective annual means at the surface sites with their observed counterparts are displayed in panels (b), (d), and (f), respectively. The cross and circle symbols in panels (a), (c), and (e) as well as the orange and green stars in panels (b), (d), and (f) indicate rural and urban stations, respectively.
Table 2Annual station mean SSR biases (unit: W m−2) derived from CERES-EBAF, the CMIP6 multi-model mean, and ERA5 compared to the surface observational sites under all-sky and clear-sky conditions during 2010–2014 over East Asian land together with the separate station averages of biases at urban and rural sites. The values in parentheses represent the percentages of SSR biases relative to their respective station mean averages, with the largest percentages around 10 % and 4 % for all-sky and clear-sky conditions.
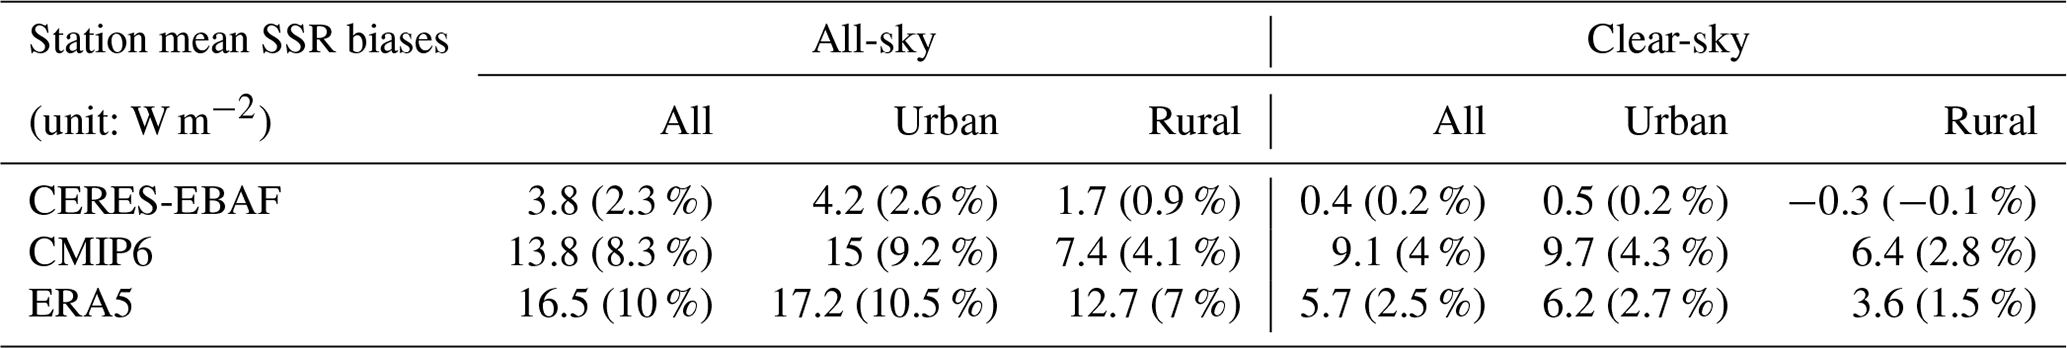
Table 3Annual land mean area-weighted average SSR (unit: W m−2) from a combination of the CMA and GEBA (CERES-interpolated) site observations under all-sky (clear-sky) conditions during the period 2010–2014 over East Asia together with the corresponding estimates from the CERES-EBAF, CMIP6 multi-model means, and ERA5, respectively.
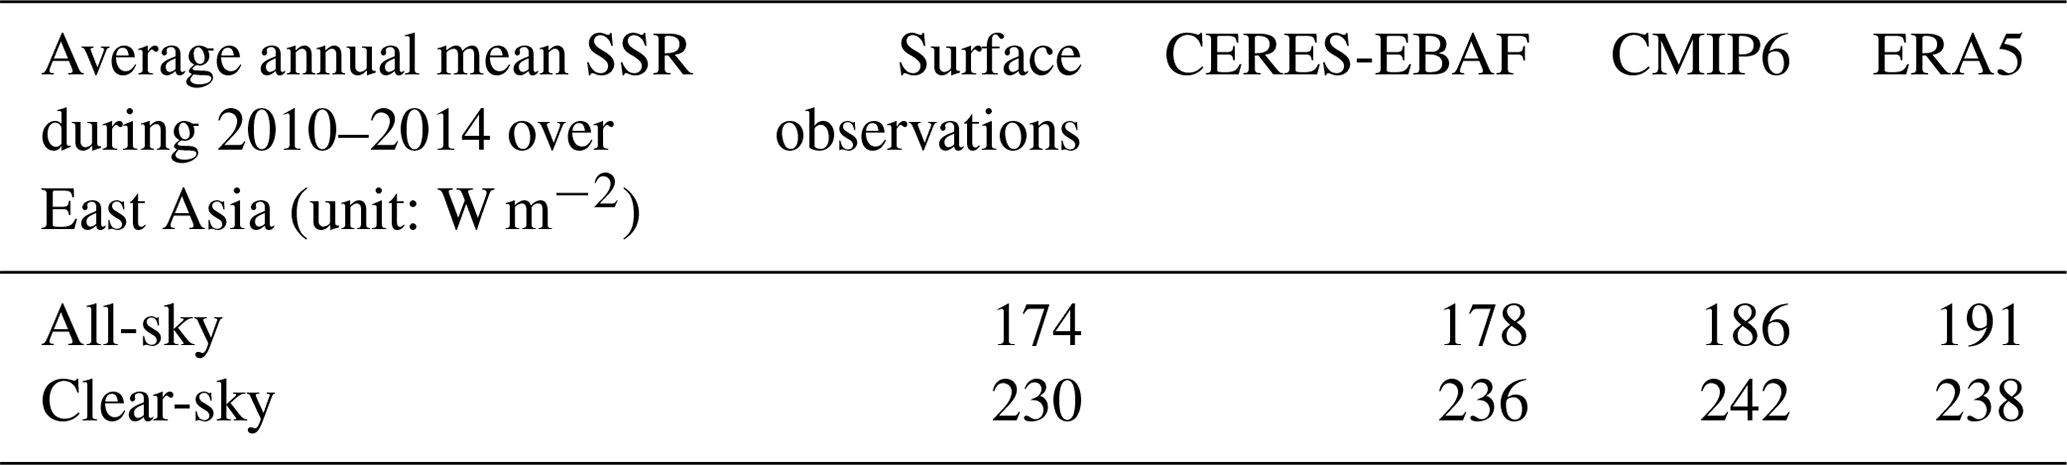
Figure 4 shows the distributions of annual mean SSR biases derived from CERES, the CMIP6 multi-model mean, and ERA5 against the surface observations, as well as the comparisons of their respective annual land means at the surface sites with their observed counterparts. The corresponding quantifications of the magnitudes of station mean biases are also given in Table 2. According to the comparisons, they all correlate well with the ground-based observations, with their respective high correlation coefficients of 0.93, 0.87, and 0.89, indicative of the highest accuracy in the CERES-derived estimate (Fig. 4b, d, and f). To quantify their SSR mean biases against the corresponding observed counterparts, the CERES-based bias at all the sites is the smallest, with a station mean bias of 3.8 W m−2, followed by the CMIP6 multi-model mean and the ERA5 reanalysis (with respective station mean biases of 13.8 and 16.5 W m−2) (Table 2). Additionally, among all the aforementioned SSR estimates, the East Asian urban sites are in general more significantly overestimated than the rural sites on average compared to the surface observations (Fig. 4b, d, and f; Table 2). This further supports the argument that rural stations might be more representative for larger-scale comparisons (e.g., the general circulation model grid scales) than the urban stations (which are vulnerable to local pollution) (Wang et al., 2018). The overestimations are mainly located in the high-latitude regions over East Asia for CERES-derived estimates (among them the underestimations mostly from rural sites), while the underestimates are primarily located in lower-latitude and eastern coastal regions (Fig. 4a and b). The CMIP6 multi-model mean and ERA5-derived SSR generally greatly overestimate the surface-based observations at both urban and rural sites, except for the regions over northern and northeastern Inner Mongolia, northwestern Heilongjiang (located in northeastern China), and some individual sites over southwestern China (Fig. 4c–f). The annual land mean area-weighted average SSR over East Asia derived from CERES is estimated to be 178 W m−2, which is closest to the surface observational estimate of 174 W m−2 compared to the much higher overestimations of both the CMIP6 multi-model mean and ERA5 (186 and 191 W m−2) against the surface observations (Table 3), which shows a high consistency with their bias distributions and the collocated quantifications (Fig. 4; Table 2).
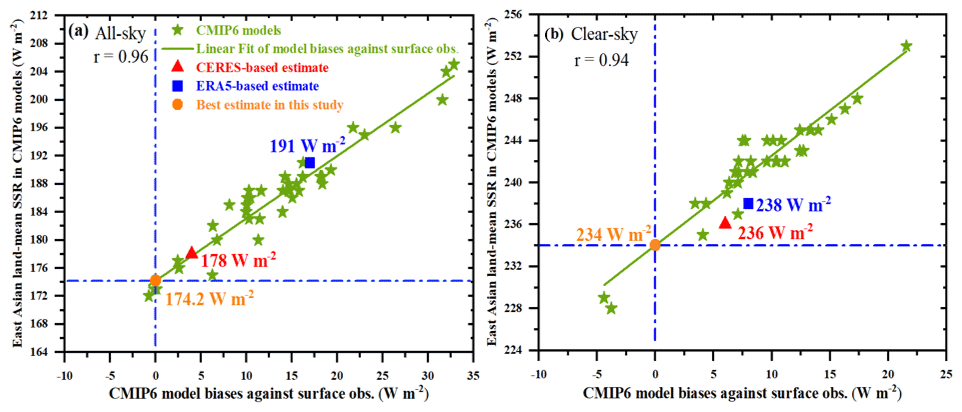
Figure 5Annual land mean SSR (unit: W m−2) of various CMIP6 models as well as their respective model biases relative to an average over surface sites (99 CMA and 16 GEBA for all-sky, 76 CMA and 16 CERES-interpolated sites for clear-sky) under (a) all-sky and (b) clear-sky conditions during 2010–2014 over East Asia. Green stars represent various CMIP6 models. The best estimate here (orange circle) can be inferred from the intersection between the linear regression line (green solid lines) and the zero-bias line (blue dotted lines). Furthermore, the corresponding estimates from CERES-EBAF and ERA5 are also given by the red triangle and blue square, respectively.
However, the ground-based observations are spatially limited with sparse stations in some remote regions and are thus inadequate for many applications, as they may be not representative for real situations. To better constrain the large spread in the model-based SSR outlined above, we combine the ground-based observations to obtain the best estimate referring to the approach introduced in Wild et al. (2013a). Figure 5a gives various CMIP6 model biases of all-sky SSR at all the surface sites and their respective East Asian land means. The higher overestimations relative to surface observations generally correspond to higher model-based East Asian land means, with a much higher correlation coefficient of 0.96 than that of 0.88 on the global scale (Wild et al., 2015). Thus, the best estimate of the annual East Asian land mean SSR is deduced to be 174.2 ± 1.3 W m−2 (2σ uncertainty) in light of the linear regression analysis. The corresponding estimates from CERES and ERA5 are also labeled in the figure, at 178 and 191 W m−2, respectively, implying a slight and substantial overestimation for CERES and ERA5 estimates. There is an overall tendency that most models overestimate the surface downward SW fluxes (36 out of 39 sites) compared to the ground-based observations, with a multi-model mean overestimation relative to site observations of 13.8 W m−2, which is also a longstanding issue in climate modeling (Wild et al., 1995, 2015).
3.3 Longwave components
Similarly to the all-sky SW counterparts, obvious discrepancies can still be noted in the annual land mean LW radiation over East Asia among models, especially for those within the atmosphere and at the surface (Fig. 1c). Correspondingly, the simulated TOA OLR varies in a range of 12 W m−2, which is almost 10 W m−2 lower than that within the atmosphere (22 W m−2) and at the surface (23 W m−2) (Table 1). The estimated annual East Asian land-mean TOA OLR from the CMIP6 multi-model mean is −224 W m−2, within 2 W m−2 of the deviations from the CERES- and ERA5-inferred estimates. The model spread of the simulated annual land-mean net LW radiation becomes larger from the TOA to the surface, with SDs of 3.5, 5.1, and 5.7 W m−2, respectively, which shows the same tendency as the relative (percentages) differences with respect to their multi-model means (5.4 %, 14.5 %, and 32.4 %).
These large discrepancies in surface net LW radiation between models are particularly evident in the surface downward LW radiation (Fig. 2b; Table 1), with a range of up to 27 W m−2 (from 267 to 294 W m−2) and a SD of 7.9 W m−2, which is also the largest deviation among all the components under all-sky conditions. Compared to the CERES estimates, the slightly lower surface upward LW radiation (−352 vs. −354 W m−2) and much lower surface downward LW radiation (280 vs. 285 W m−2) from the multi-model means are the major reason for the small deviation (within 2 W m−2) of the surface net LW radiation between them (Table 1). It is interesting to note that the annual East Asian land mean surface upward LW radiation estimated from ERA5 is the lowest among all these estimates, at −347 W m−2, suggesting the lowest surface skin temperature of the ERA5 product according to the Stefan–Boltzmann law, followed by the estimates from the multi-model mean and CERES (Table 1). Besides, the annual land mean surface downward LW radiation estimated by ERA5 is 273 W m−2, approximately 7 and 12 W m−2 lower than the estimates by the CMIP6 multi-model mean and CERES, respectively (Table 1). Therefore, both the lower surface upward and downward LW radiation fluxes result in the small deviation in the estimated surface net LW radiation from ERA5 compared to those from the multi-model mean and CERES (Table 1). Since the reanalysis products take as many observed atmospheric parameters with global coverage as possible into consideration during the radiative transfer calculations, they are widely used to obtain more accurate surface LW radiation (Simmons et al., 2004; Wild et al., 2015). We also examined the corresponding surface LW fluxes from another reanalysis, namely MERRA-2, and found much lower annual land means than those from ERA5, in particular for the surface downward LW radiation (not shown), which arrives at similar conclusions to those documented by Urraca et al. (2018). Thus, considering the limited observational surface LW radiation data over East Asia, ERA5 might be the best reference for the estimates of the annual land mean surface upward and downward LW radiation, at −347 and 273 W m−2, respectively (Table 1).
3.4 Discussion of land energy balance over East Asia under all-sky conditions
3.4.1 Radiative components
Figure 6a displays the schematic diagram of the all-sky land mean energy balance over East Asia, including the abovementioned SW and LW radiation budgets and other radiative components discussed in the following. The estimated annual East Asian land mean incoming, reflected, and net SW radiation as well as the OLR at the TOA are therefore 334, −118, 216, and −226 W m−2 (Table 1), respectively, based on the CERES EBAF dataset. The corresponding uncertainties are obtained from the uncertainty of 2.5 (1σ uncertainty) W m−2 for both SW and LW fluxes given by Loeb et al. (2018). The annual East Asian land-mean TOA OLR in CERES-EBAF is estimated to be 10 W m−2 larger than the TOA-absorbed SW radiation, implying an energy loss of 10 W m−2 at the TOA under all-sky conditions, which should be compensated by the LH and SH transported from regions outside East Asia (Fig. 6a).
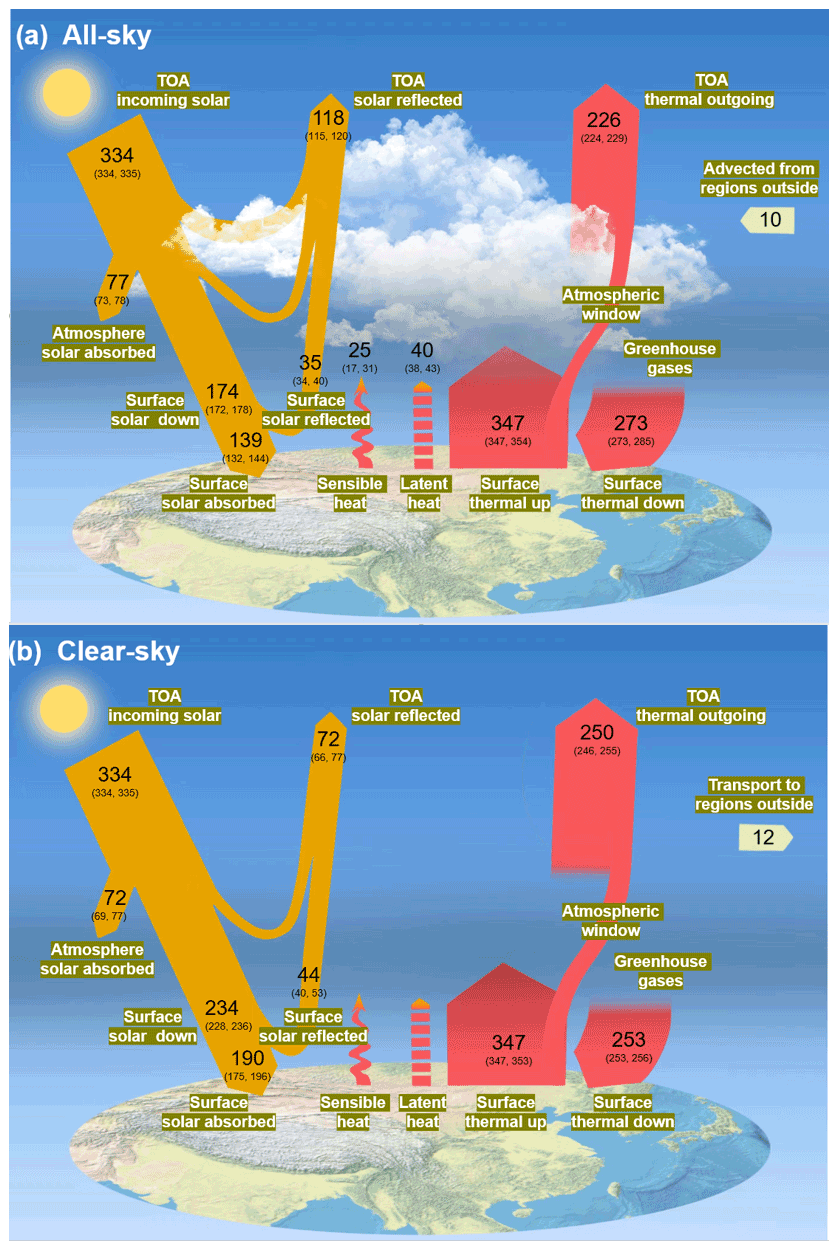
Figure 6Diagrams of the annual land mean energy balance (unit: W m−2) over East Asia under (a) all-sky and (b) clear-sky conditions for the present-day climate. The uncertainty ranges are also given in parentheses.
For the SSR, the annual East Asian land mean best estimate based on the CMIP6 multi-model simulations and surface observations is 174.2 W m−2 (Figs. 5a and 6a). Considering the abnormally high overestimation by ERA5 compared to surface observation, the high value of the uncertainty range is given by the estimate from CERES EBAF (178 W m−2), while its low value is from the lowest model estimate (172 W m−2; Fig. 2a) (Fig. 6a). The all-sky surface albedo information is derived from the ratio between the CERES-derived surface upward and downward solar radiation, with a radiation-weighted average of around 0.2 (36.4/178.3) over East Asian land. However, the corresponding surface albedos estimated by the CMIP6 multi-model mean and ERA5 are substantially higher than that from CERES, with respective averages of around 0.23 (42.7/186.4) and 0.26 (49.6/191). Considering the large spatial coverage of remote sensing measurement to map albedo globally, the CERES-derived annual East Asian land mean surface albedo is adopted as the best estimate in this study. Therefore, considering the rounded best SSR estimate of 174 W m−2, the calculated surface-reflected and surface-absorbed SW radiation fluxes are around −35 and 139 W m−2, respectively. As shown in Table 1, the uncertainty range of the surface-absorbed SW radiation is 132–144 W m−2 according to the lowest value of CMIP6 models and the highest estimate among the aforementioned estimates, which gives rise to an uncertainty range of the surface-reflected solar radiation of 34–40 W m−2. Together with the annual East Asian land mean SW absorption at the TOA and surface of 216 and 139 W m−2, the best estimate for the atmospheric SW absorption is therefore 77 W m−2, which is within 4 W m−2 of the differences between those estimated from the CMIP6 multi-model mean and CERES, and closes to the ERA5-derived estimate of 78 W m−2 (Table 1). The uncertainty range of the atmospheric SW absorption is also determined by the estimates from different data sources as shown in Fig. 6a.
The downward LW radiation emitted by the atmosphere is mainly sensitive to the near-surface temperature, water vapor, and cloud properties, while the surface emission is in proportion to the skin temperature according to the Stefan–Boltzmann law. As analyzed in Sect. 3.3, the best estimates of the East Asian annual land mean surface upward and downward LW radiation amount to −347 and 273 W m−2, respectively, with uncertainty ranges also coming from the above-discussed different data sources (Fig. 6a). The surface net LW radiation is then estimated to be −74 W m−2 based on the surface upward and downward LW radiation outlined above. Combined with the TOA outgoing thermal radiation of −226 W m−2, the estimated atmospheric net LW radiation is −152 W m−2, which is close to the collocated estimates from the multi-model mean (−152 W m−2) and ERA5 (−150 W m−2) but deviates substantially from the CERES-derived estimate of −157 W m−2 (Table 1). Considering the surface-absorbed SW radiation of 139 W m−2, the best estimate for surface net radiation is 65 W m−2, suggesting that around 65 W m−2 of energy is available for the non-radiative SH and LH. Besides, the ERA5 estimate of 67 W m−2 is very close to the best estimate of 65 W m−2, while much higher estimates of 72 and 73 W m−2 are obtained from the multi-model mean and CERES (Table 1), respectively.
3.4.2 Non-radiative components
The surface net radiation is mainly balanced by the non-radiative components of SH and LH in addition to a very small proportion of ground heat flux and melt (less than 1 %) (Ohmura, 2004). However, due to the lack of constraints from in situ and space observations, this partitioning of the surface net radiation into SH and LH is still subject to considerable uncertainties. As shown in Fig. S2, the simulated annual East Asian land-mean LH and SH vary greatly between different models, with a range of 26 and 21 W m−2, respectively, as well as the relative discrepancies relative to their respective multi-model means of 60 % and 68 % , respectively, showing larger discrepancies between models with larger uncertainties in SH (Table 1). The best SH estimate can therefore be obtained from the residual of the LH. To obtain a more accurate surface LH from available datasets of the multi-model mean and ERA5, we take an average of them as the best estimate, namely −40 W m−2, the uncertainty ranges of which are also given according to these estimates (Fig. 6a). Note that all the values in this study are calculated on the basis of one decimal point, which may result in 1 W m−2 of bias during the rounding process. Combined with the surface net radiation and LH of 65 and −40 W m−2, respectively, the surface SH is estimated to be −25 W m−2, the uncertainty range of which is also given by the existing estimates from various CMIP6 models and ERA5 (Fig. 6a). Besides, although the annual land mean SH estimated from MERRA-2 is much higher than the estimates from the multi-model mean and ERA5 (not shown), the estimated LH is around −39 W m−2 (not shown), very close to the best estimate of −40 W m−2, which increases our confidence in the estimation of this quantity.
3.4.3 Comparisons with global land mean estimates
Notable discrepancies exist in the global land mean energy budgets reported by Wild et al. (2015) and the regional ones over East Asia in this study (Fig. S3; Table 4). For the SW budgets, the estimated annual land-mean TOA incident solar radiation over East Asia is 9 W m−2 higher than that over global land (334 vs. 325 W m−2), implying a slightly lower land mean solar zenith angle over East Asia. Comparisons also show a slightly higher relative percentage of TOA-reflected solar radiation of 0.8 % despite the much lower surface-reflected SW radiation of 4.3 % over East Asian land compared to global land with respect to their respective TOA incident solar radiation (thereafter called “relative percentage” for short). This suggests a much more relative atmospheric SW reflection of 5.2 % over East Asian land, which agrees fairly well with more aerosols (Wei et al., 2019) and more clouds (King et al., 2013; Fan et al., 2018; also see Fig. S4) over this region compared to global land. However, the annual land mean solar radiation reaching the East Asian surface is around 10 W m−2 lower than that over global land (174 vs. 184 W m−2), approximately accounting for 52.1 % and 56.6 % of their respective incident solar radiation at the TOA, respectively, indicating a lower fraction of solar energy arriving at the East Asian surface compared to global land. Together with the lower annual land mean surface albedo over East Asian land compared to global land (20 % vs. 26 %), this leads to the similar relative percentages of surface absorptions (41.6 % vs. 41.9 %). Although the magnitudes of the atmospheric SW absorptions over East Asian and global land are nearly the same (both around 77 W m−2), the corresponding relative percentage over East Asian land is a little bit lower than that over global land (around 0.6 %). This is somewhat unexpected due to the existence of more clouds and aerosol loadings over East Asian land, which is possibly offset by the lower water vapor contents caused by the higher altitudes and thinner air over the TP.
Table 4Comparisons of the annual mean SW/LW energy balance components (unit: W m−2) over East Asian land (this study) and global land (Wild et al., 2015) as well as the corresponding relative percentages with regard to their respective TOA incident solar radiation/surface LW emissions and the relative percentage differences between them.
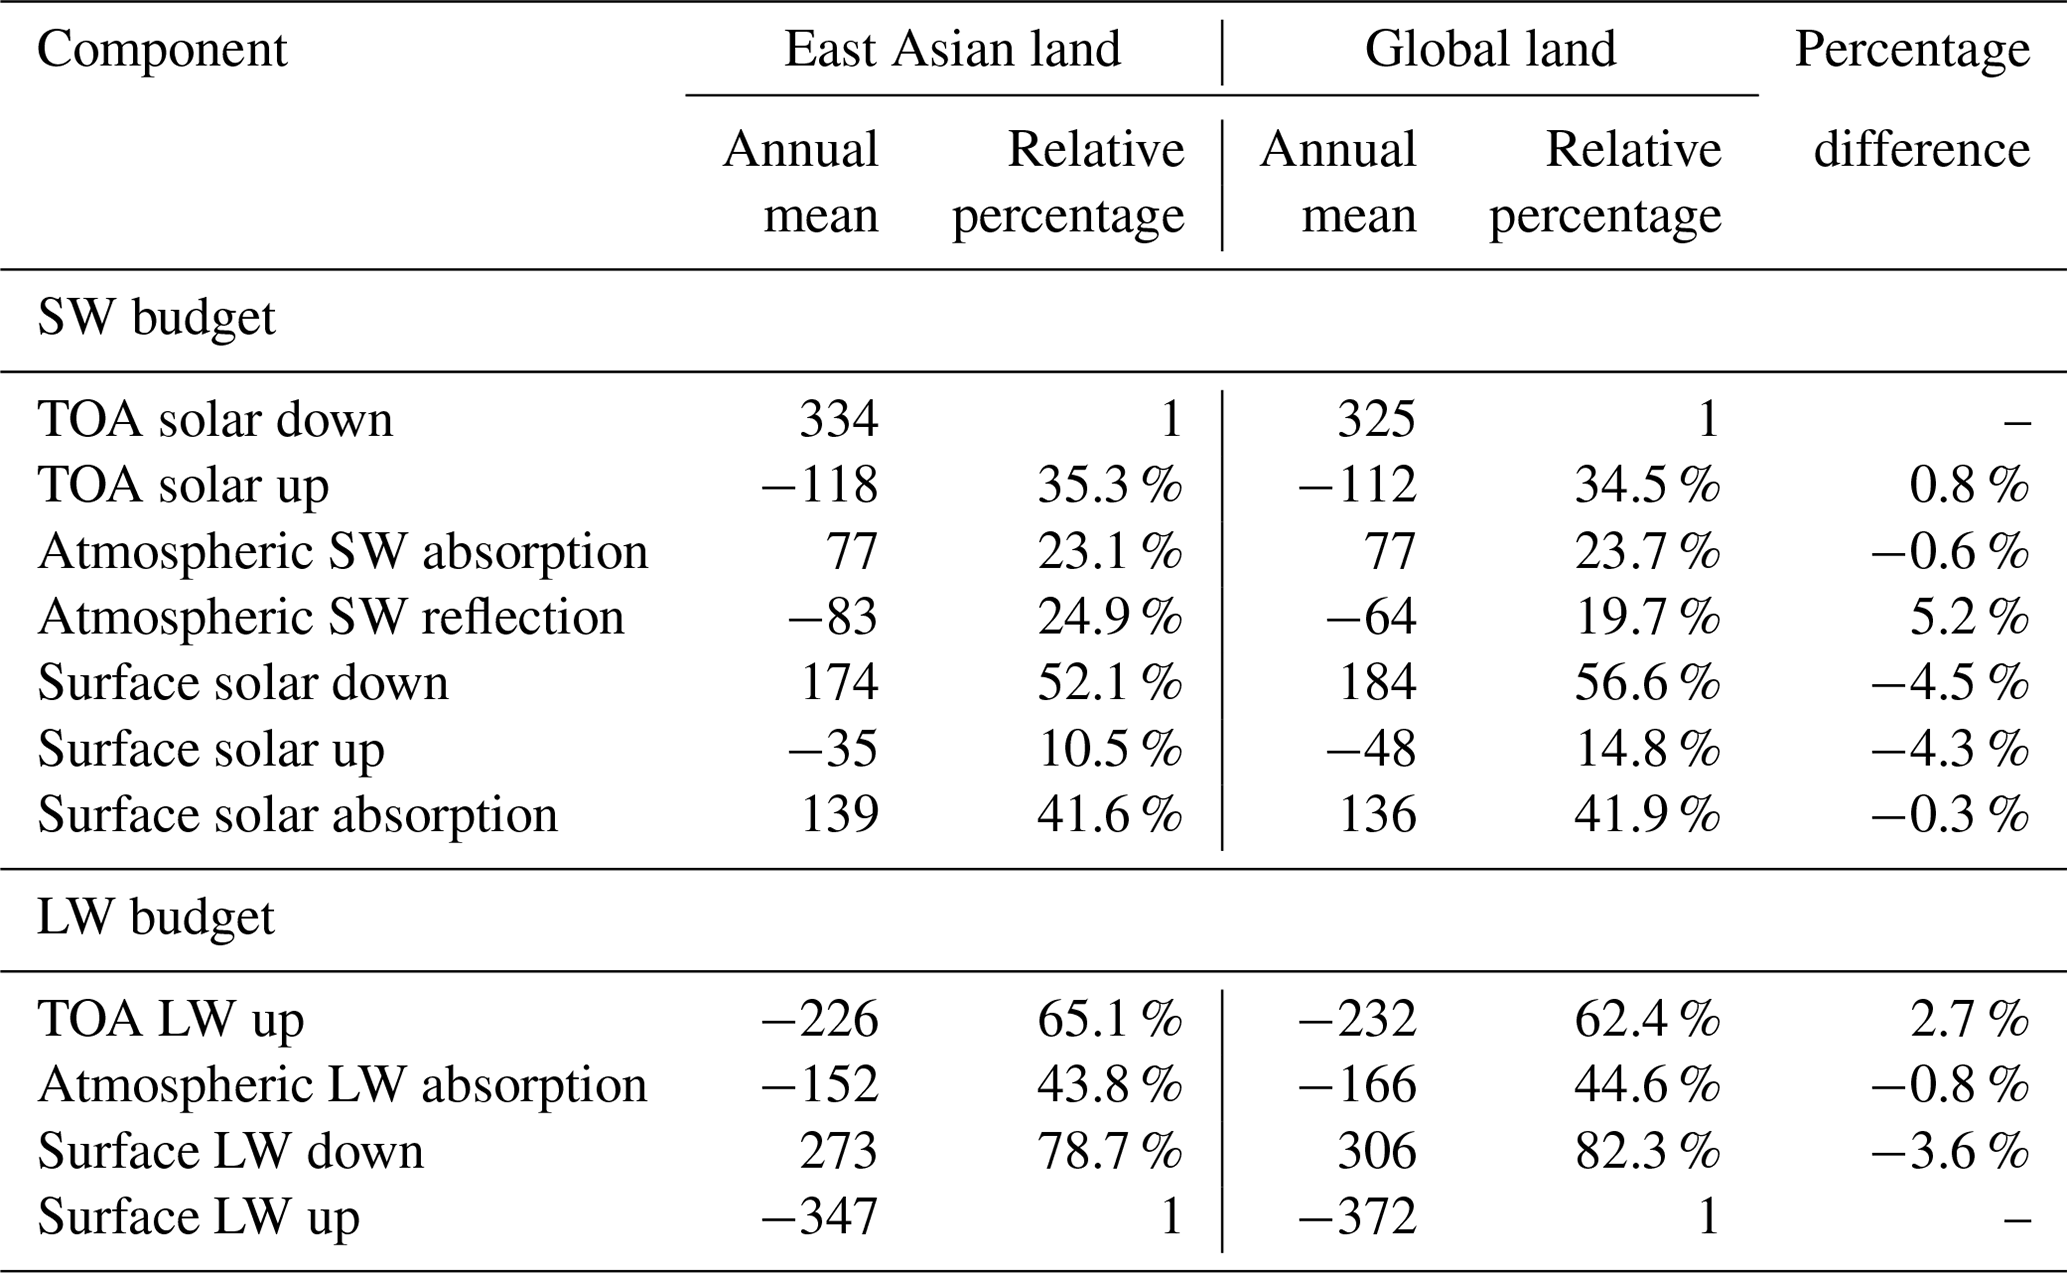
For the LW budgets, the regional surface LW emission over East Asia is estimated to be much lower than the global land mean estimates in Wild et al. (2015) (Fig. S3), which mainly results from the lower temperature over the TP induced by high altitudes. The relative percentage of land mean surface downward LW radiation with respect to the surface emission over East Asia is about 78.7 %, which is lower than the global estimate of 82.3 %, corresponding well to a reduction in the greenhouse effect and fewer low clouds due to the TP (Fig. S4) considering its coverage over East Asian land. Ultimately, a higher percentage of LW radiation is emitted into space over East Asian land compared to global land (65.1 % vs. 62.4 %). Our estimates also indicate approximately similar amounts of LH (40 vs. 38 W m−2) and much lower SH (25 vs. 32 W m−2) over East Asia compared to the global land mean estimates (Fig. S3), which is possibly related to the lower East Asian land surface temperature.
In general, as can be concluded from Table 4, although much less surface SW radiation (4.3 %) is reflected over East Asian land compared to global land, a slightly higher SW reflection of 0.8 % is estimated at the TOA, indicating a much larger atmospheric SW reflection of 5.2 % due to the stronger scattering from aerosols and clouds over East Asian land than global land. However, the SW absorption within the atmosphere over East Asian land is 0.6 % lower than that over global land despite the higher absorption from clouds and aerosols, which is possibly offset by the lower water vapor contents caused by the thinner air over the TP. The lower surface temperature, weaker greenhouse effect, and fewer low clouds due to the high altitudes and the thinner air over the TP in East Asian land are the major reasons for the relatively lower surface LW emission, fewer and more fractions of surface downward LW radiation of 3.6 % and the OLR of 2.7 % over East Asian land compared to global land, respectively.
The clear-sky land energy balance budgets over East Asia are similarly evaluated as all-sky conditions. Detailed analyses are given in the Supplement if the reader is interested. The annual land mean SW clear-sky absorptions at the TOA and the surface over East Asia show larger variations among different models than those under all-sky conditions (Fig. 1a and b; Table 1), which is consistent with those reported by Wild et al. (2019) but is amazingly in contrast to the recognition that the representation of clouds is the largest uncertainty in climate models (Dolinar et al., 2015). In particular, the surface SW clear-sky absorptions simulated by various models still exhibit a larger uncertainty than the TOA counterparts despite the lower absolute values (Fig. 1b; Table 1). In contrast to the all-sky counterparts, the simulated clear-sky SSR among different models shows a notably smaller inter-model spread and SD than the surface SW absorptions (Table 1), with a much smaller model discrepancy compared to the all-sky conditions (Fig. 2a; Table 1).
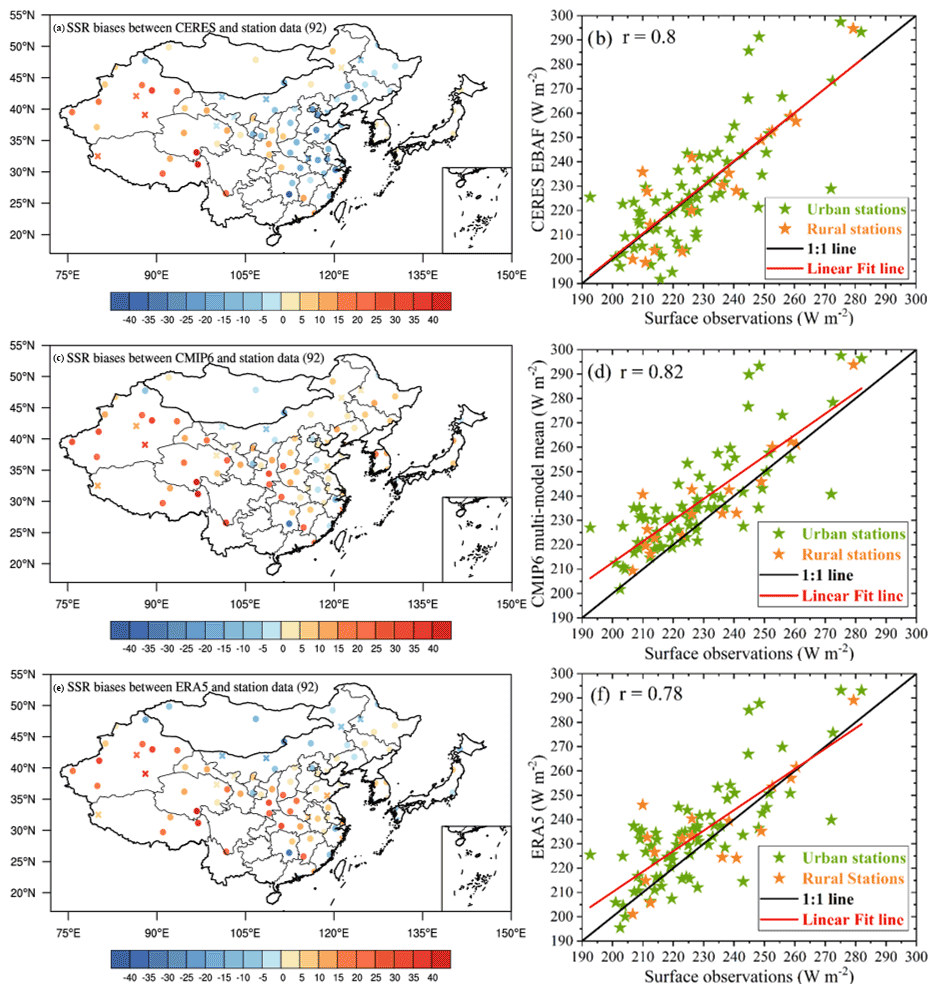
Figure 7Spatial distributions of annual mean SSR biases derived from (a) CERES-EBAF, (b) the CMIP6 multi-model mean, and (c) ERA5 reanalysis against surface observations from a combination of the CMA and CERES-interpolated sites under clear-sky conditions over East Asia. The corresponding comparisons of their respective annual land means at the surface sites with their observed counterparts are displayed in panels (b), (d), and (f), respectively. The cross and circle symbols in panels (a), (c), and (e) as well as the orange and green stars in panels (b), (d), and (f) indicate rural and urban stations, respectively.
To further constrain the outlined inter-model discrepancy of the simulated clear-sky SSR, surface observations from the CMA and CERES-interpolated estimates at the GEBA sites are utilized in this study. The high values of the station-based clear-sky SSR are mainly located in the TP but with an abnormally high value located in southern China (Fig. 3b). All the East Asian land mean clear-sky SSR estimates from CERES, the CMIP6 multi-model mean, and ERA5 agree reasonably well with the surface observations but with smaller correlation coefficients ranging from 0.78 to 0.82 compared to the all-sky conditions (Fig. 7b, d, and f). The CERES-derived clear-sky SSR is mainly overestimated in central and western China but with slight underestimations mainly located in northeastern, eastern, and southern China (Fig. 7a). Similar bias patterns can also be found in the clear-sky SSR from the CMIP6 multi-model mean and ERA5 compared to the surface observations, except for some individual sites over northeastern Inner Mongolia, eastern China, western Mongolia, and Japan (Fig. 7c and e) but with relatively smaller overestimations than the all-sky counterparts (Fig. 4c and e; Table 2). Specifically, the smallest station mean bias in the CERES-derived SSR compared to the multi-model mean and ERA5 (Table 2) can be attributed to its evenly distributed surface sites of overestimations and underestimations (Fig. 7b, d, f). Again, among all the aforementioned clear-sky SSR biases, more overestimations exist in urban stations than rural stations (Figs. 4b, d, f and 7b, d, f; Table 2). Consequently, all East Asian land mean area-weighted averages of clear-sky SSR from CERES, the CMIP6 multi-model mean, and ERA5 show higher overestimations of around 6, 12, and 8 W m−2, respectively, compared to the surface observed counterpart of 230 W m−2 (Table 3). Based on the similar method introduced in Wild et al. (2015), the best estimate for the East Asian land mean clear-sky SSR is determined to be 234 ± 1.1 W m−2 (2σ uncertainty), with a slightly smaller correlation coefficient of 0.94 and smaller deviations from the CERES and ERA5 estimates compared to the all-sky counterparts (Fig. 5b; Table 3). Besides, the overestimations still exist in the observed land mean clear-sky SSR for most climate models over East Asia, with a smaller multi-model mean overestimation of 9.1 W m−2 than the all-sky counterparts.
This clear-sky energy budget only represents the removal of cloud but maintains the same atmospheric conditions as the all-sky conditions, which is not balanced because it is not the equilibrium state the Earth would achieve when no clouds could form. Ultimately, the clear-sky East Asian land mean energy budget is not closed and has no quantifications of SH and LH as displayed in Fig. 6b. In addition to the analyses above, the clear-sky TOA energy budgets are derived from the CERES-derived product, with uncertainty ranges referring to Loeb et al. (2018), while the surface LW budgets are again from ERA5 reanalysis. Also, an additional clear-sky radiation-weighted surface albedo of 0.19 from CERES is obtained to estimate the surface-reflected and absorbed SW radiation. Apart from the TOA budget, all the remaining uncertainty ranges are given by different data sources from various CMIP6 models as well as the multi-model mean, CERES-derived, and ERA5-derived estimates.
We double-check the energy balance components evaluated in this study by referring to the uncertainty ranges from the CERES-derived product given by Kato et al. (2018) (Table 5), which indicates that all estimated energy components fall within these uncertainty ranges, except for the all-sky surface downward LW radiation, with about 3 W m−2 lower than the corresponding lowest CERES range. This is in line with its much higher CERES-derived estimate compared to that of ERA5 (285 vs. 273 W m−2) (Table 1).
Table 5Uncertainties (unit: W m−2) in 1∘ × 1∘ regional monthly surface SW, LW, and net (SW + LW) fluxes under all-sky and clear-sky conditions for the CERES-EBAF Edition 4.1 product (referring to Kato et al., 2018) as well as its corresponding estimates of various surface fluxes.

Overall, around 21.6 % and 56.9 % of the TOA incoming solar radiation are absorbed by the atmosphere and surface, respectively, for clear-sky conditions, while these absorptions are 23.1 % and 41.6 % for all-sky conditions. This implies that the existence of clouds results in more atmospheric SW absorption of around 1.5 % and much less surface solar absorption of around 15.3 % with respect to the TOA incoming solar radiation.
According to the annual land mean best estimates of radiative components over East Asia under all-sky and clear-sky conditions obtained in the previous sections, the present-day CREs can be inferred quantitatively over this region. The calculated SW, LW, and net CREs at the TOA, within the atmosphere, and at the surface are therefore presented in Fig. 8. Moreover, the corresponding calculation formulas are also given as follows.
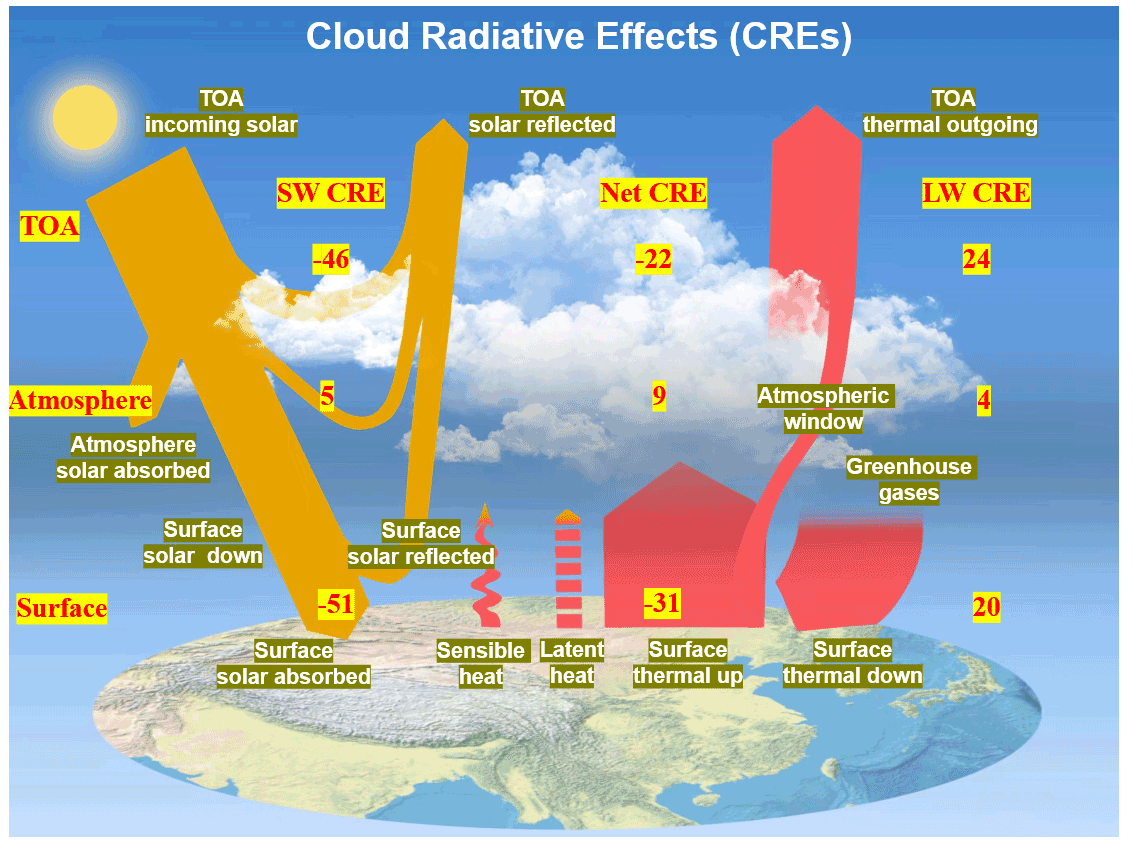
Figure 8Diagram of the annual land mean SW, LW, and net (SW + LW) cloud radiative effects (CREs) (unit: W m−2) at the TOA, within the atmosphere, and at the surface over East Asia, calculated by the differences between all-sky and clear-sky radiation budgets as given in Fig. 7.
The best estimates for the annual East Asian land mean reflected solar radiation at the TOA under all-sky and clear-sky conditions are −118 and −72 W m−2, respectively, differing by −46 W m−2, indicating that the clouds give rise to an extra 46 W m−2 solar reflection at the TOA, thus cooling the Earth–atmosphere system. Similarly, the TOA LW CRE, obtained as the difference between the TOA thermal radiation under all-sky and clear-sky conditions, is 24 W m−2, suggesting a warming effect of clouds on the system. Thus, the estimated TOA net CRE is −22 W m−2, pointing out that the overall effects of clouds result in an energy loss and net cooling to the system, not only in the global mean, but also over East Asian land.
At the Earth's surface, the shading effects of clouds are estimated to reduce the surface solar radiation by 60 W m−2, from 234 to 174 W m−2, while the surface solar absorption differs by 51 W m−2, from 190 to 139 W m−2; that is, the surface net SW CRE is −51 W m−2. In cloudy skies, the estimated surface downward LW radiation increases from 253 to 273 W m−2, with an increase of 20 W m−2, illustrating that the surface net LW CRE is 20 W m−2 and therefore leads to a surface warming. Thus, the surface net CRE, i.e., the sum of the surface net SW and LW CRE, is then −31 W m−2, indicating that clouds contribute more to the SW energy budgets. Eventually, the clouds lead to enhancements of the SW and LW absorptions within the atmosphere of around 5 and 4 W m−2, respectively, thus resulting in an atmospheric net CRE of 9 W m−2 over East Asian land.
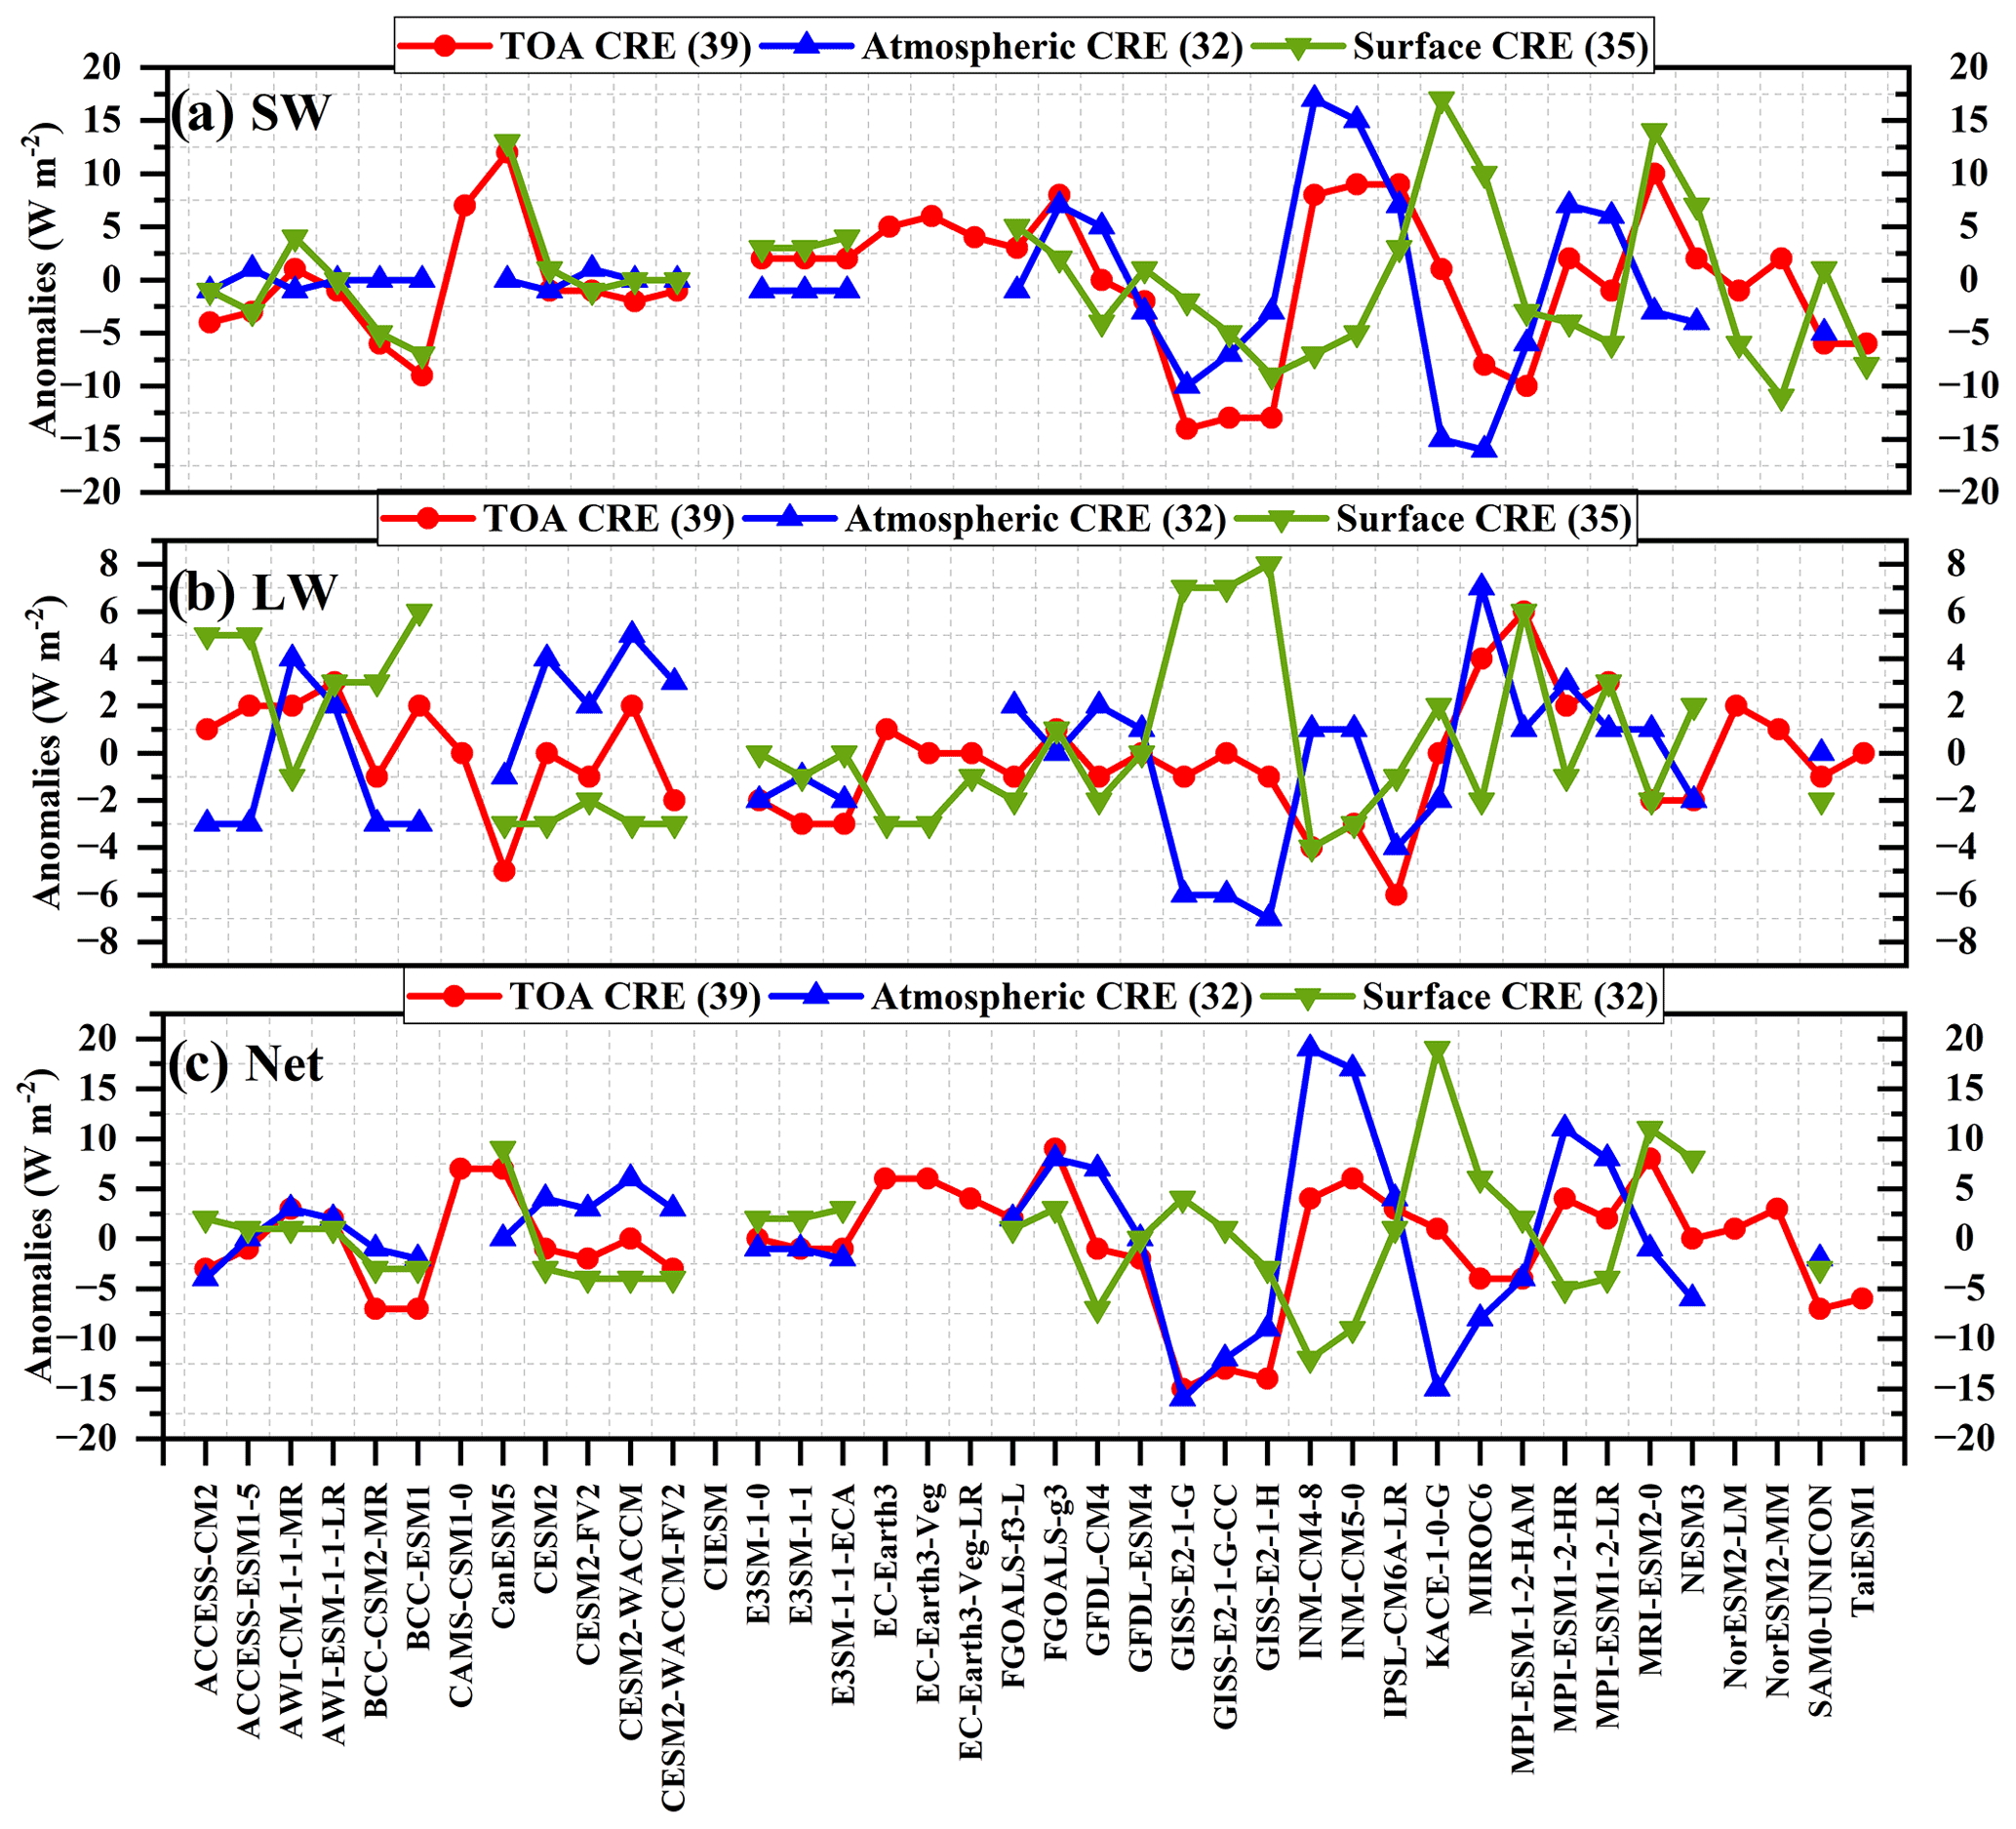
Figure 9Annual land mean anomalies of (a) SW, (b) LW, and (c) net (SW+LW) CREs (unit: W m−2) at the TOA (red line), within the atmosphere (blue line), and at the surface (green line) with regard to their respective multi-model means over East Asia, respectively, as represented by various CMIP6 models. The numbers in the parentheses indicate the available CMIP6 climate models for the corresponding radiation components.
The above CRE best estimates are compared with the corresponding estimates from different data sources (Fig. 9; Table 1). Generally, compared to the LW CREs (Fig. 9b), the simulated SW CREs show larger spreads and SDs amongst the models (Fig. 9a; Table 1). For the SW CREs at the TOA, within the atmosphere, and at the surface, the CERES-derived estimates match perfectly with the best estimates mentioned above, within 2 W m−2 of the biases, followed by the estimates from the multi-model means and ERA5 (Table 1). For the LW CREs, the calculated TOA LW CREs from the CMIP6 multi-model mean and CERES differ by no more than 1 W m−2 compared to the best estimate, while large differences are noted at the surface LW CREs, thereby leading to their opposite signs in the atmospheric LW CREs (Fig. 9b; Table 1). Specifically, since the ERA5-based TOA LW CRE deviates by no more than 3 W m−2 with the best estimate of 24 W m−2 with nearly the same surface LW CRE, the estimated atmospheric LW CRE is therefore the closest to the best estimate (Table 1). This is owing to the fact that we make use of the ERA5 data as the reference to estimate the surface LW radiation. Thus, the major reason for the large discrepancies in the atmospheric and surface LW CREs estimated from different data sources with respect to the best estimates in this study is the determination of the surface downward and upward LW radiation, which is also the reason for the large deviations in their net CREs (Fig. 9c).
A better comparison with the global annual mean best estimates of CREs by Wild et al. (2019) is given in Fig. S5. At the TOA, slightly lower and much lower East Asian land-mean SW and LW CREs of 1 and 4 W m−2 result in 3 W m−2 more energy loss at the TOA compared to the globe. At the surface, much lower annual East Asian land-mean SW and LW CREs of 3 and 8 W m−2 are estimated compared to the values over the globe, leading to a net CRE deviation of 5 W m−2 indicative of 5 W m−2 more energy loss at the surface. However, lower and higher annual East Asian land-mean SW and LW CREs of 2 and 4 W m−2 within the atmosphere contribute to the nearly close net CRE with a deviation of no more than 2 W m−2 compared to the global mean estimates. On the whole, lower annual East Asian land-mean best estimates in the absolute values of surface SW and LW CREs as well as the TOA LW CRE compared to their global mean counterparts give rise to the CRE differences between them.
This study aims to explore how the energy budgets are interrupted by the complex orographic and thermal effects of the TP as well as the high anthropogenic aerosol emissions over East Asian land compared to global land, based on complementary data sources from space and surface observations as well as the CMIP6 climate models and ERA5 reanalysis. A further quantitative investigation of CREs at the TOA, within the atmosphere, and at the surface is also conducted.
Comparisons between all-sky and clear-sky energy budgets indicate that the overall effects of clouds greatly reduce the surface solar absorption by about 15.3 % and enhance that within the atmosphere by 1.5 %. Compared to the global land energy budget estimates from Wild et al. (2015), for the SW budgets, a notably more atmospheric SW reflection of 5.2 % but with a slightly less atmospheric SW absorption of 0.6 % with respect to their respective TOA incident solar radiation is estimated over East Asian land, possibly indicating that the lower water vapor content effects due to the TP overcompensate for the aerosol and cloud effects over East Asian land. For the LW budgets, a substantially lower surface LW emission of around 25 W m−2 and a smaller relative surface downward LW radiation of around 3.6 % with respect to their respective surface emissions can be noticed over East Asian land compared to global land, which possibly result from the lower regional surface skin temperature as well as the weaker greenhouse effect and fewer low clouds mainly induced by the high altitude and thinner air over the TP, thus leading to a higher percentage of regional OLR of 2.7 %.
The CREs over East Asian land are inferred through the energy budget differences between all-sky and clear-sky conditions. The clouds reduce the solar absorption at the TOA by 46 W m−2 and enhance the TOA thermal radiation by 24 W m−2, respectively, leading to a TOA net CRE of −22 W m−2, a more cooling effect on the regional climate system than that over the globe (−19 W m−2). At the surface, the net CRE is estimated to be −31 W m−2 according to less solar absorption of 51 W m−2 and more downward thermal radiation of 20 W m−2, indicative of larger cloud impacts on SW radiation. Within the atmosphere, the estimated net CRE is 9 W m−2 due to the increases in solar absorption and net thermal radiation of 5 and 4 W m−2, respectively. Compared to the global mean best estimates of CREs as introduced by Wild et al. (2019), relatively lower East Asian land mean best estimates of surface SW and LW CREs as well as the TOA LW CRE contribute to the CRE differences between them.
On the whole, all the estimated land mean energy balance components over East Asia in this study fall within the uncertainty ranges of the CERES-derived assessments, except for the all-sky surface downward LW radiation. More accurate and reliable datasets should be utilized to reduce the substantial uncertainties in the regional energy balance estimates, particularly in the surface budgets, and more widespread temporal and spatial representations of energy budget research are recommended for more comprehensive comparisons in future. For example, newly published surface radiation products with high resolutions based on satellite datasets (e.g., Letu et al., 2022; Xu et al., 2022) are expected to make sense in improving the accuracy of the regional/global surface radiation budget studies.
The surface observations of the CMA and GEBA used in this study are available at http://data.cma.cn/enl (application required, last access: 10 February 2022; CMA, 2022) and https://geba.ethz.ch/data-retrieval.html (login required, last access: 25 February 2022; GEBA, 2022), respectively. The satellite-derived product CERES EBAF Edition 4.1 is obtained at https://ceres.larc.nasa.gov/data/ (last access: 20 March 2022; CERES, 2022). The CMIP6 climate models are from https://pcmdi.llnl.gov/CMIP6/ (last access: 14 April 2022; CMIP6, 2022). The ERA5 reanalysis is acquired from https://www.ecmwf.int/en/forecasts/datasets/reanalysis-datasets/era5 (last access: 22 May 2022; ECMWF, 2022).
The supplement related to this article is available online at: https://doi.org/10.5194/acp-22-15867-2022-supplement.
HZ, MW, and QW proposed the main ideas of this study. QW designed and wrote the manuscript. SY provided the homogenized ground-based surface solar radiation data. QC, XZ, and GS contributed to the interpretation of the results. BX and YW assisted with the figures. All the co-authors participated in discussions and provided constructive suggestions.
The contact author has declared that none of the authors has any competing interests.
Publisher's note: Copernicus Publications remains neutral with regard to jurisdictional claims in published maps and institutional affiliations.
The Global Energy Balance Archive (GEBA) is co-funded by the Federal Office of Meteorology and Climatology, MeteoSwiss, within the framework of GCOS Switzerland.
This research has been supported by the National Key R&D Program of China (grant no. 2017YFA0603502), the National Natural Science Foundation of China (grant no. 42275039), and the S&T Development Fund of CAMS (grant nos. 2021KJ004 and 2022KJ019).
This paper was edited by Yafang Cheng and reviewed by two anonymous referees.
Boeke, R. C. and Taylor, P. C.: Evaluation of the Arctic surface radiation budget in CMIP5 models, J. Geophys. Res.-Atmos., 121, 8525–8548, https://doi.org/10.1002/2016JD025099, 2016.
CERES: Data Products, National Aeronautics and Space Administration (NASA) [data set], https://ceres.larc.nasa.gov/data/, last access: 20 March 2022.
Christensen, M. W., Behrangi, A., L'Ecuyer, T. S., Wood, N. B., Lebsock, M. D., and Stephens, G. L.: Arctic observation and reanalysis integrated system: A new data product for validation and climate study, B. Am. Meteorol. Soc., 97, 907–916, https://doi.org/10.1175/BAMS-D-14-00273.1, 2016.
CMA: Surface observational radiation data, China Meteorological Administration National Meteorological Information Center [data set], http://data.cma.cn/enl, last access: 10 February 2022.
CMIP6: Climate models, The World Climate Research Programme [data set], https://pcmdi.llnl.gov/CMIP6/, last access: 14 April 2022.
de Leeuw, G., Sogacheva, L., Rodriguez, E., Kourtidis, K., Georgoulias, A. K., Alexandri, G., Amiridis, V., Proestakis, E., Marinou, E., Xue, Y., and van der A, R.: Two decades of satellite observations of AOD over mainland China using ATSR-2, AATSR and MODIS/Terra: data set evaluation and large-scale patterns, Atmos. Chem. Phys., 18, 1573–1592, https://doi.org/10.5194/acp-18-1573-2018, 2018.
Dolinar, E. K., Dong, X., Xi, B., Jiang, J. H., and Su, H.: Evaluation of CMIP5 simulated clouds and TOA radiation budgets using NASA satellite observations, Clim. Dynam., 44, 2229–2247, https://doi.org/10.1007/s00382-014-2158-9, 2015.
ECMWF: ERA5 Reanalysis, European Centre for Medium-Range Weather Forecasts [data set], https://www.ecmwf.int/en/forecasts/datasets/reanalysis-datasets/era5, last access: 22 May 2022.
Eyring, V., Bony, S., Meehl, G. A., Senior, C. A., Stevens, B., Stouffer, R. J., and Taylor, K. E.: Overview of the Coupled Model Intercomparison Project Phase 6 (CMIP6) experimental design and organization, Geosci. Model Dev., 9, 1937–1958, https://doi.org/10.5194/gmd-9-1937-2016, 2016.
Fan, T., Zhao, C., Dong, X., Liu, X., Yang, X., Zhang, F., Shi, C., Wang, Y., and Wu, F.: Quantify contribution of aerosol errors to cloud fraction biases in CMIP5 Atmospheric Model Intercomparison Project simulations, Int. J. Climatol., 38, 3140–3156, https://doi.org/10.1002/joc.5490, 2018.
Fasullo, J. T. and Trenberth, K. E.: The annual cycle of the energy budget. Part I: Global mean and land-ocean exchanges, J. Climate, 21, 2297–2312, https://doi.org/10.1175/2007JCLI1935.1, 2008a.
Fasullo, J. T. and Trenberth, K. E.: The annual cycle of the energy budget. Part II: Meridional structures and poleward transports, J. Climate, 21, 2313–2325, https://doi.org/10.1175/2007JCLI1936.1, 2008b.
GEBA: Surface measured energy fluxes, ETH Zurich (Switzerland) [data set], https://geba.ethz.ch/data-retrieval.html, last access: 25 February 2022.
Ghan, S. J., Liu, X., Easter, R. C., Zaveri, R., Rasch, P. J., Yoon, J.-H, and Eaton, B.: Toward a minimal representation of aerosols in climate models: Comparative decomposition of aerosol direct, semidirect, and indirect radiative forcing, J. Climate, 25, 6461–6476, https://doi.org/10.1175/JCLI-D-11-00650.1, 2012.
Gilgen, H., Wild, M., and Ohmura, A.: Means and trends of shortwave irradiance at the surface estimated from global energy balance archive data, J. Climate, 11, 2042–2061, https://doi.org/10.1175/1520-0442(1998)011<2042:MATOSI>2.0.CO;2, 1998.
He, Y., Wang, K., Zhou, C., and Wild, M.: A revisit of global dimming and brightening based on the sunshine duration, Geophys. Res. Lett., 45, 4281–4289, https://doi.org/10.1029/2018GL077424, 2018.
Hersbach, H., Bell, B., Berrisford, P., Hirahara, S., Horányi, A., Muñoz-Sabater, J., Nicolas, J., Peubey, C., Radu, R., Schepers, D., Simmons, A., Soci, C., Abdalla, S., Abellan, X., Balsamo, G., Bechtold, P., Biavati, G., Bidlot, J., Bonavita, M., De Chiara, G., Dahlgren, P., Dee, D., Diamantakis, M., Dragani, R., Flemming, J., Forbes, R., Fuentes, M., Geer, A., Haimberger, L., Healy, S., Hogan, R. J., Hólm, E., Janisková, M., Keeley, S., Laloyaux, P., Lopez, P., Lupu, C., Radnoti, G., de Rosnay, P., Rozum, I., Vamborg, F., Villaume, S., and Thépaut, J.: The ERA5 global reanalysis, Q. J. Roy. Meteor. Soc., 146, 1999–2049, https://doi.org/10.1002/qj.3803, 2020.
Huang, G., Li, Z., Li, X., Liang, S., Yang, K., Wang, D., and Zhang, Y.: Estimating surface solar irradiance from satellites: Past, present, and future perspectives, Remote Sens. Environ., 233, 111371, https://doi.org/10.1016/j.rse.2019.111371, 2019.
Kato, S., Rose, F. G., Rutan, D. A., Thorsen, T. J., Loeb, N. G., Doelling, D. R., Huang, X., Smith, W. L., Su, W., and Ham, S.: Surface Irradiances of Edition 4.0 Clouds and the Earth's Radiant Energy System (CERES) Energy Balanced and Filled (EBAF) data product, J. Climate, 31, 4501–4527, https://doi.org/10.1175/JCLI-D-17-0523.1, 2018.
Kim, B. and Lee, K.: Radiation component calculation and energy budget snalysis for the Korean Peninsula region, Remote Sens., 10, 1147, https://doi.org/10.3390/rs10071147, 2018.
King, M. D., Platnick, S., Menzel, W. P., Ackerman, S. A., and Hubanks, P. A.: Spatial and temporal distribution of clouds observed by MODIS onboard the Terra and Aqua satellites, IEEE T. Geosci. Remote Sens., 51, 3826–3852, https://doi.org/10.1109/TGRS.2012.2227333, 2013.
L'Ecuyer, T. S., Beaudoing, H. K., Rodell, M., Olson, W., Lin, B., Kato, S., Clayson, C. A., Wood, E., Sheffield, J., Adler, R., Huffman, G., Bosilovich, M., Gu, G., Robertson, F., Houser, P. R., Chambers, D., Famiglietti, J. S., Fetzer, E., Liu, W. T., Gao, X., Schlosser, C. A., Clark, E., Lettenmaier, D. P., and Hilburn, K.: The observed state of the energy budget in the early twenty-First century, J. Climate, 28, 8319–8346, https://doi.org/10.1175/JCLI-D-14-00556.1, 2015.
Lei, Y., Letu, H., Shang, H., and Shi, J.: Cloud cover over the Tibetan Plateau and eastern China: a comparison of ERA5 and ERA-Interim with satellite observations, Clim. Dynam., 54, 2941–2957, https://doi.org/10.1007/s00382-020-05149-x, 2020.
Letu, H., Nakajima, T. Y., Wang, T., Shang, H., Ma, R., Yang, K., Baran, A. J., Riedi, J., Ishimoto, H., and Yoshida, M.: A new benchmark for surface radiation products over the East Asia-Pacific region retrieved from the Himawari-8/AHI next-generation geostationary satellite, B. Am. Meteorol. Soc., 103, E873–E888, https://doi.org/10.1175/BAMS-D-20-0148.1, 2022.
Li, J. and Mao, J.: A preliminary evaluation of global and East Asian cloud radiative effects in reanalyses, Atmos. Ocean. Sci. Lett., 8, 100–106, https://doi.org/10.3878/AOSL20140093, 2015.
Li, J., Mao, J., and Wang, F.: Comparative study of five current reanalyses in characterizing total cloud fraction and top-of-the-atmosphere cloud radiative effects over the Asian monsoon region, Int. J. Climatol., 37, 5047–5067, https://doi.org/10.1002/joc.5143, 2017.
Li, J.-L. F., Waliser, D. E., Stephens, G., Lee, S., L'Ecuyer, T., Kato, S., Loeb, N., and Ma, H.: Characterizing and understanding radiation budget biases in CMIP3/CMIP5 GCMs, contemporary GCM, and reanalysis, J. Geophys. Res.-Atmos., 118, 8166–8184, https://doi.org/10.1002/jgrd.50378, 2013.
Li, Z., Niu, F., Fan, J., Liu, Y., Rosenfeld, D., and Ding, Y.: Long-term impacts of aerosols on the vertical development of clouds and precipitation, Nat. Geosci., 4, 888–894, https://doi.org/10.1038/ngeo1313, 2011.
Liao, H., Chang, W., and Yang, Y.: Climatic effects of air pollutants over china: A review, Adv. Atmos. Sci., 32, 115–139, https://doi.org/10.1007/s00376-014-0013-x, 2015.
Lin, B., Stackhouse Jr., P. W., Minnis, P., Wielicki, B. A., Hu, Y., Sun, W., Fan, T., and Hinkelman, L. M.: Assessment of global annual atmospheric energy balance from satellite observations, J. Geophys. Res.-Atmos., 113, D16114, https://doi.org/10.1029/2008JD009869, 2008.
Liu, Y., Bao, Q., Duan, A., Qian, Z. A., and Wu, G.: Recent progress in the impact of the Tibetan Plateau on climate in China, Adv. Atmos. Sci., 24, 1060–1076, https://doi.org/10.1007/s00376-007-1060-3, 2007.
Loeb, N. G., Doelling, D. R., Wang, H., Su, W., Nguyen, C., Corbett, J. G., Liang, L., Mitrescu, C., Rose, F. G., and Kato, S.: Clouds and the Earth's Radiant Energy System (CERES) Energy Balanced and Filled (EBAF) Top-of-Atmosphere (TOA) Edition-4.0 data product, J. Climate, 31, 895–918, https://doi.org/10.1175/JCLI-D-17-0208.1, 2018.
Mayer, M., Tietsche, S., Haimberger, L., Tsubouchi, T., Mayer, J., and Zuo, H.: An improved estimate of the coupled Arctic energy budget, J. Climate, 32, 7915–7934, https://doi.org/10.1175/JCLI-D-19-0233.1, 2019.
Mercado, L. M., Bellouin, N., Sitch, S., Boucher, O., Huntingford, C., Wild, M., and Cox, P. M.: Impact of changes in diffuse radiation on the global land carbon sink, Nature, 458, 1014–1017, https://doi.org/10.1038/nature07949, 2009.
Ohmura, A.: Cryosphere During the Twentieth Century, The state of the planet: frontiers and challenges in geophysics, Geophys. Monogr. Ser., 150, 239–257, https://doi.org/10.1029/150gm19, 2004.
Previdi, M., Smith, K. L., and Polvani, L. M.: How well do the CMIP5 models simulate the Antarctic atmospheric energy budget?, J. Climate, 28, 7933–7942, https://doi.org/10.1175/JCLI-D-15-0027.1, 2015.
Raschke, E., Kinne, S., Rossow, W. B., Stackhouse, P. W., and Wild, M.: Comparison of radiative energy flows in observational datasets and climate modeling, J. Appl. Meteorol. Clim., 55, 93–117, https://doi.org/10.1175/JAMC-D-14-0281.1, 2016.
Simmons, A. J., Jones, P. D., Da Costa Bechtold, V., Beljaars, A. C. M., Kållberg, P. W., Saarinen, S., Uppala, S. M., Viterbo, P., and Wedi, N.: Comparison of trends and low-frequency variability in CRU, ERA-40, and NCEP/NCAR analyses of surface air temperature, J. Geophys. Res.-Atmos., 109, D24115, https://doi.org/10.1029/2004JD005306, 2004.
Stephens, G. L.: Cloud feedbacks in the climate system: A critical review, J. Climate, 18, 237–273, https://doi.org/10.1175/JCLI-3243.1, 2005.
Stephens, G. L., Li, J., Wild, M., Clayson, C. A., Loeb, N., Kato, S., L'Ecuyer, T., Stackhouse, P. W., Lebsock, M., and Andrews, T.: An update on Earth's energy balance in light of the latest global observations, Nat. Geosci., 5, 691–696, https://doi.org/10.1038/ngeo1580, 2012.
Tang, W.-J., Yang, K., Qin, J., Cheng, C. C. K., and He, J.: Solar radiation trend across China in recent decades: a revisit with quality-controlled data, Atmos. Chem. Phys., 11, 393–406, https://doi.org/10.5194/acp-11-393-2011, 2011.
Tang, W. J., Qin, J., Yang, K., Zhu, F., and Zhou, X.: Does ERA5 outperform satellite products in estimating atmospheric downward longwave radiation at the surface?, Atmos. Res., 252, 105453, https://doi.org/10.1016/j.atmosres.2021.105453, 2021.
Thomas, C. M., Dong, B., and Haines, K.: Inverse modeling of global and regional energy and water cycle fluxes using earth observation data, J. Climate, 33, 1707–1723, https://doi.org/10.1175/JCLI-D-19-0343.1, 2020.
Trenberth, K. E., Fasullo, J. T., and Kiehl, J.: Earth's global energy budget, B. Am. Meteorol. Soc., 90, 311–324, https://doi.org/10.1175/2008BAMS2634.1, 2009.
Trenberth, K. E., Fasullo, J. T., and Balmaseda, M. A.: Earth's energy imbalance, J. Climate, 27, 3129–3144, https://doi.org/10.1175/JCLI-D-13-00294.1, 2014.
Trolliet, M., Walawender, J. P., Bourlès, B., Boilley, A., Trentmann, J., Blanc, P., Lefèvre, M., and Wald, L.: Downwelling surface solar irradiance in the tropical Atlantic Ocean: a comparison of re-analyses and satellite-derived data sets to PIRATA measurements, Ocean Sci., 14, 1021–1056, https://doi.org/10.5194/os-14-1021-2018, 2018.
Urraca, R., Huld, T., Gracia-Amillo, A., Martinez-de-Pison, F. J., Kaspar, F., and Sanz-Garcia, A.: Evaluation of global horizontal irradiance estimates from ERA5 and COSMO-REA6 reanalyses using ground and satellite-based data, Sol. Energy, 164, 339–354, https://doi.org/10.1016/j.solener.2018.02.059, 2018.
Wang, H., Zhang, H., Xie, B., Jing, X., He, J., and Liu, Y.: Evaluating the Impacts of Cloud Microphysical and Overlap Parameters on Simulated Clouds in Global Climate Models, Adv. Atmos. Sci., 39, 2172–2187, https://doi.org/10.1007/s00376-021-0369-7, 2021.
Wang, K.: Measurement biases explain discrepancies between the observed and simulated decadal variability of surface incident solar radiation, Sci. Rep., 4, 6144, https://doi.org/10.1038/srep06144, 2014.
Wang, K., Ma, Q., Li, Z., and Wang, J.: Decadal variability of surface incident solar radiation over China: Observations, satellite retrievals, and reanalyses, J. Geophys. Res.-Atmos., 120, 6500–6514, https://doi.org/10.1002/2015JD023420, 2015.
Wang, Q., Zhang, H., Yang, S., Chen, Q., Zhou, X., Shi, G., Cheng, Y., and Wild, M.: Potential driving factors on surface solar radiation trends over China in recent years, Remote Sens., 13, 704, https://doi.org/10.3390/rs13040704, 2021.
Wang, Y. and Wild, M.: A new look at solar dimming and brightening in China, Geophys. Res. Lett., 43, 11777–11785, https://doi.org/10.1002/2016GL071009, 2016.
Wang, Y., Trentmann, J., Yuan, W., and Wild, M.: Validation of CM SAF CLARA-A2 and SARAH-E surface solar radiation datasets over China, Remote Sens., 10, 1977, https://doi.org/10.3390/rs10121977, 2018.
Wang, Y., Wild, M., Sanchez-Lorenzo, A., and Manara, V.: Urbanization effect on trends in sunshine duration in China, Ann. Geophys., 35, 839–851, https://doi.org/10.5194/angeo-35-839-2017, 2017.
Wang, Z., Lin, L., Xu, Y., Che, H., Zhang, X., Zhang, H., Dong, W., Wang, C., Gui, K., and Xie, B.: Incorrect Asian aerosols affecting the attribution and projection of regional climate change in CMIP6 models, npj Clim. Atmos. Sci., 4, 1–8, https://doi.org/10.1038/s41612-020-00159-2, 2021.
Wei, J., Peng, Y., Guo, J., and Sun, L.: Performance of MODIS Collection 6.1 Level 3 aerosol products in spatial-temporal variations over land, Atmos. Environ., 206, 30–44, https://doi.org/10.1016/j.atmosenv.2019.03.001, 2019.
Wild, M.: Progress and challenges in the estimation of the global energy balance, AIP Conf. Proc., 1810, 20004, https://doi.org/10.1063/1.4975500, 2017a.
Wild, M.: Towards global estimates of the surface energy budget, Curr. Clim. Change Rep., 3, 87–97, https://doi.org/10.1007/s40641-017-0058-x, 2017b.
Wild, M.: The global energy balance as represented in CMIP6 climate models, Clim. Dynam., 55, 553–577, https://doi.org/10.1007/s00382-020-05282-7, 2020.
Wild, M., Ohmura, A., Gilgen, H., and Roeckner, E.: Validation of general circulation model radiative fluxes using surface observations, J. Climate, 8, 1309–1324, https://doi.org/10.1175/1520-0442(1995)008<1309:VOGCMR>2.0.CO;2, 1995.
Wild, M., Grieser, J., and Schär, C.: Combined surface solar brightening and increasing greenhouse effect support recent intensification of the global land-based hydrological cycle, Geophys. Res. Lett., 35, L17706, https://doi.org/10.1029/2008GL034842, 2008.
Wild, M., Folini, D., Schär, C., Loeb, N., Dutton, E. G., and König-Langlo, G.: The global energy balance from a surface perspective, Clim. Dynam., 40, 3107–3134, https://doi.org/10.1007/s00382-012-1569-8, 2013a.
Wild, M., Folini, D., Schär, C., Loeb, N., Dutton, E. G., and König-Langlo, G.: A new diagram of the global energy balance, AIP Conf. Proc., 1531, 628–631, https://doi.org/10.1063/1.4804848, 2013b.
Wild, M., Folini, D., Hakuba, M. Z., Schär, C., Seneviratne, S. I., Kato, S., Rutan, D., Ammann, C., Wood, E. F., and König-Langlo, G.: The energy balance over land and oceans: an assessment based on direct observations and CMIP5 climate models, Clim. Dynam., 44, 3393–3429, https://doi.org/10.1007/s00382-014-2430-z, 2015.
Wild, M., Hakuba, M. Z., Folini, D., Schär, C., and Long, C.: New estimates of the Earth radiation budget under cloud-free conditions and cloud radiative effects, AIP Conf. Proc., 1810, 90012, https://doi.org/10.1063/1.4975552, 2017.
Wild, M., Hakuba, M. Z., Folini, D., Dörig-Ott, P., Schär, C., Kato, S., and Long, C. N.: The cloud-free global energy balance and inferred cloud radiative effects: an assessment based on direct observations and climate models, Clim. Dynam., 52, 4787–4812, https://doi.org/10.1007/s00382-018-4413-y, 2019.
Wu, G., Duan, A., Liu, Y., Mao, J., Ren, R., Bao, Q., He, B., Liu, B., and Hu, W.: Tibetan Plateau climate dynamics: recent research progress and outlook, Natl. Sci. Rev., 2, 100–116, https://doi.org/10.1093/nsr/nwu045, 2015.
Xu, J., Liang, S., and Jiang, B.: A global long-term (1981–2019) daily land surface radiation budget product from AVHRR satellite data using a residual convolutional neural network, Earth Syst. Sci. Data, 14, 2315–2341, https://doi.org/10.5194/essd-14-2315-2022, 2022.
Xu, X., Lu, C., Shi, X., and Gao, S.: World water tower: An atmospheric perspective, Geophys. Res. Lett., 35, L20815, https://doi.org/10.1029/2008GL035867, 2008a.
Xu, X., Zhang, R., Koike, T., Lu, C., Shi, X., Zhang, S., Bian, L., Cheng, X., Li, P., and Ding, G.: A new integrated observational system over the Tibetan Plateau, B. Am. Meteorol. Soc., 89, 1492–1496, 2008b.
Yang, S., Wang, X. L., and Wild, M.: Homogenization and trend analysis of the 1958–2016 in situ surface solar radiation records in China, J. Climate, 31, 4529–4541, https://doi.org/10.1175/JCLI-D-17-0891.1, 2018.
Yang, S., Wang, X. L., and Wild, M.: Causes of dimming and brightening in China inferred from homogenized daily clear-sky and all-sky in situ surface solar radiation records (1958–2016), J. Climate, 32, 5901–5913, https://doi.org/10.1175/JCLI-D-18-0666.1, 2019.
You, Q., Liu, J., and Pepin, N.: Changes of summer cloud water content in China from ERA-Interim reanalysis, Global Planet. Change, 175, 201–210, https://doi.org/10.1016/j.gloplacha.2019.02.014, 2019.
Zhang, H., Zhao, M., Chen, Q., Wang, Q., Zhao, S., Zhou, X., and Peng, J.: Water and ice cloud optical thickness changes and radiative effects in East Asia, J. Quant. Spectrosc. Radiat. Transf., 254, 107213, https://doi.org/10.1016/j.jqsrt.2020.107213, 2020.
- Abstract
- Introduction
- Data sources
- Assessment of land energy balance budgets under all-sky conditions
- Assessment of land energy balance budgets under clear-sky conditions
- The cloud radiative effects (CREs)
- Summary and conclusions
- Data availability
- Author contributions
- Competing interests
- Disclaimer
- Acknowledgements
- Financial support
- Review statement
- References
- Supplement