the Creative Commons Attribution 4.0 License.
the Creative Commons Attribution 4.0 License.
 | 30 Nov 2022
Aerosol–cloud interaction in the atmospheric chemistry model GRAPES_Meso5.1/CUACE and its impacts on mesoscale numerical weather prediction under haze pollution conditions in Jing–Jin–Ji in China
Wenjie Zhang
Xiaoye Zhang
Liping Huang
Zhaodong Liu
Xiao Zhang
Huizheng Che
The representation of aerosol–cloud interaction (ACI) and its impacts in the current climate or weather model remains a challenge, especially for severely polluted regions with high aerosol concentration, which is even more important and worthy of study. Here, ACI is first implemented in the atmospheric chemistry model GRAPES_Meso5.1/CUACE by allowing for real-time aerosol activation in the Thompson cloud microphysics scheme. Two experiments are conducted focusing on a haze pollution case with coexisting high aerosol and stratus cloud over the Jing–Jin–Ji region in China to investigate the impact of ACI on the mesoscale numerical weather prediction (NWP). Study results show that ACI increases cloud droplet number concentration, water mixing ratio, liquid water path (CLWP), and optical thickness (COT), as a result improving the underestimated CLWP and COT (reducing the mean bias by 21 % and 37 %, respectively) over a certain subarea by the model without ACI. A cooling in temperature in the daytime below 950 hPa occurs due to ACI, which can reduce the mean bias of 2 m temperature in the daytime by up to 14 % (∼ 0.6 ∘C) in the subarea with the greatest change in CLWP and COT. The 24 h cumulative precipitation in this subarea corresponding to moderate-rainfall events increases, which can reduce the mean bias by 18 %, depending on the enhanced melting of the snow by more cloud droplets. In other areas or periods with a slight change in CLWP and COT, the impact of ACI on NWP is not significant, suggesting the inhomogeneity of ACI. This study demonstrates the critical role of ACI in the current NWP model over the severely polluted region and the complexity of the ACI effect.
- Article
(7500 KB) - Full-text XML
-
Supplement
(3451 KB) - BibTeX
- EndNote


Cloud covers approximately 70 % of the Earth's surface (Ding et al., 2005; Mao et al., 2019) and plays key roles in the Earth's radiation budget, hydrologic cycle, and chemical reactions of gaseous and particulate materials (Ramanathan et al., 2005; Rosenfeld et al., 2014). Accurate simulation of cloud in numerical weather prediction (NWP) models is one of the most important elements of weather forecasting (Seifert et al., 2012; Makar et al., 2015; Wang et al., 2014; Xu et al., 2022).
Aerosol is a key factor for cloud formation – no aerosol, no cloud (Andreae and Rosenfeld, 2008; Pruppacher and Klett, 1980; McFiggans et al., 2006). The influence of aerosol on cloud is mainly reflected in two aspects: under the conditions of holding liquid water content constant, more cloud condensation nuclei (CCN) produce smaller but more cloud droplets, causing the albedo of the cloud to be larger (Twomey, 1977); the smaller cloud droplets reduce the collision rate, changing the liquid water content and thickness of the cloud and prolonging of the cloud lifetime (Albrecht, 1989). Aerosol–cloud interaction (ACI) has been the largest uncertainty factor in climate prediction and weather forecasting (Quaas, 2015; Myhre et al., 2013; Makar et al., 2015). One of the key potential challenges is to define the ability of aerosol to act as cloud droplets (Chang et al., 2021; Rosenfeld et al., 2019; Che et al., 2017; Sun and Ariya, 2006).
In the current NWP model, the cloud microphysics scheme determines the evolution of hydrometeors (Listowski and Lachlan-Cope, 2017). However, the number concentration of cloud droplets in most cloud microphysics schemes is usually set to be constant (i.e., space–time-invariant) (Thompson et al., 2008, 2004; Hong and Lim, 2006; Morrison et al., 2009), which ignores the impact of aerosol on the cloud. Even in schemes that can predict the number concentration of cloud droplets, such as the WDM6 scheme (the initial CCN are a constant) (Lim and Hong, 2010) and Thompson scheme (a preset aerosol emission) (Thompson and Eidhammer, 2014), the impact of aerosol is still not fully considered. According to previous studies, there are huge differences in anthropogenic aerosol emission globally (e.g., higher aerosol loading over northern India and eastern China) (Che et al., 2015), and the response of cloud physical properties to aerosol is obvious (Miltenberger et al., 2018; Lawand et al., 2022; McCoy et al., 2018; G. Zheng et al., 2018). The lack of anthropogenic aerosol emission, bringing large simulation errors, cannot meet the requirements of weather forecasting by NWP models, especially in precipitation and temperature predictions (Su and Fung, 2018; Zhang et al., 2015; Huang and Ding, 2021). For example, in the Global Forecast System (GFS) model without aerosol feedback, the simulation of 2 m temperature showed larger errors when heavy aerosol pollution or thick cloud cover occurs (Huang and Ding, 2021).
Recognizing the importance of aerosol changes to the cloud, weather, and chemistry, etc., many studies have incorporated ACI effects into NWP models to evaluate the impact of ACI (Zhao et al., 2017; Zhou et al., 2016; Miltenberger et al., 2018; Wong et al., 2012; Makar et al., 2015). The study results show that ACI significantly increases the number concentration of cloud droplets and liquid water content during the selected study period and further leads to a decrease in surface downward short-wave radiation (SDSR), boundary layer height, and surface temperature (Makar et al., 2015; Zhang et al., 2015, 2010). As a result, the simulated errors in precipitation and temperature are reduced (Zhou et al., 2016). In addition, a recent study using the two-way coupled Weather Research and Forecasting Community Multi-scale Air Quality (WRF-CMAQ) model to conduct long-term (2008–2012) simulations in the contiguous United States indicates that the main simulated meteorological factors (e.g., temperature, precipitation, and wind speed) and air pollutants (e.g., ozone, sulfate, and nitrate) show improved performance compared to the original model (Wang et al., 2021). These studies further prove the critical role of ACI in NWP models, yet the ability to consider the ACI effect in weather forecasting is still poor. Meanwhile, due to predominantly extremely inhomogeneous ACI in time and space, especially under haze pollution conditions, the significance of the ACI effect may not be fully realized in long-term or large-scale studies; thus putting its focus on the weather-scale NWP in severely aerosol-polluted Jing–Jin–Ji in China is essential and meaningful.
In this paper, real-time ACI is first coupled into the atmospheric chemistry model GRAPES_ Meso5.1/CUACE for the study of the impact of ACI on cloud, temperature, and precipitation predictions under haze pollution conditions in Jing–Jin–Ji in China. A representative case, the haze pollution episode from 4 to 8 January 2017, with coexisting severe aerosol pollution and stratus cloud, is selected to be the research object. Through this short-term case study, the operating mechanism of ACI in the current model and the spatiotemporal inhomogeneous ACI effect under haze pollution conditions can be clearly understood.
2.1 Data used
Hourly PM2.5 observation data (µg m−3) are provided by more than 1300 air pollution stations (Fig. 1) from the Chinese Ministry of Ecology and Environment. Hourly surface meteorological observation data come from the automatic weather stations (Fig. 1) of the China Meteorological Administration (CMA), including temperature (∘C) and precipitation (mm). Daily aerosol optical depth (AOD), cloud top pressure (CTP; hPa), cloud optical thickness (COT), cloud liquid water path (CLWP; g m−2), and cloud fraction (CF, %) data are from the Suomi National Polar-orbiting Partnership (SNPP) Visible Infrared Imaging Radiometer Suite (VIIRS) NASA Level-3 (L3) aerosol and cloud property continuity product with a spatial resolution of 1∘ (https://ladsweb.modaps.eosdis.nasa.gov/search/order/1/CLDPROP_D3_VIIRS_SNPP--5111/, last access: 11 December 2021). The number concentration of cloud droplets (cm−3) can be derived based on CLWP, COT, and CF from previous studies (Bennartz, 2007; Pawlowska and Brenguier, 2000). SDSR data (W m−2) are derived from the Clouds and the Earth's Radiant Energy System (CERES) project L3 product, which provides satellite-based observations of the Earth's radiation budget (ERB) and cloud with a spatial resolution of 1∘ (https://asdc.larc.nasa.gov/data/CERES/SYN1deg-1Hour/Terra-NPP_Edition1A/2017/01/, last access: 16 February 2022). The vertical profiles of aerosol and cloud data are provided by the Cloud-Aerosol Lidar and Infrared Pathfinder Satellite Observation (CALIPSO) Level 2 (L2) vertical feature mask (VFM) data product (https://asdc.larc.nasa.gov/data/CALIPSO/LID_L2_VFM-Standard-V4-20/2017/01/, last access: 13 February 2022). All data ranges are from 4 to 8 January 2017. National Centers for Environmental Prediction (NCEP) Final analysis (FNL) data with 0.25∘ horizontal resolution and 6 h interval (https://rda.ucar.edu/datasets/ds083.3/, last access: 6 August 2021) are used as meteorological boundary conditions and initial fields in the model. The anthropogenic emission data entered into the model are the Multi-resolution Emission Inventory for China (MEIC) of Tsinghua University in December 2016, which covers more than 700 anthropogenic emission sources on China's mainland (Li et al., 2014; B. Zheng et al., 2018; Li et al., 2017).
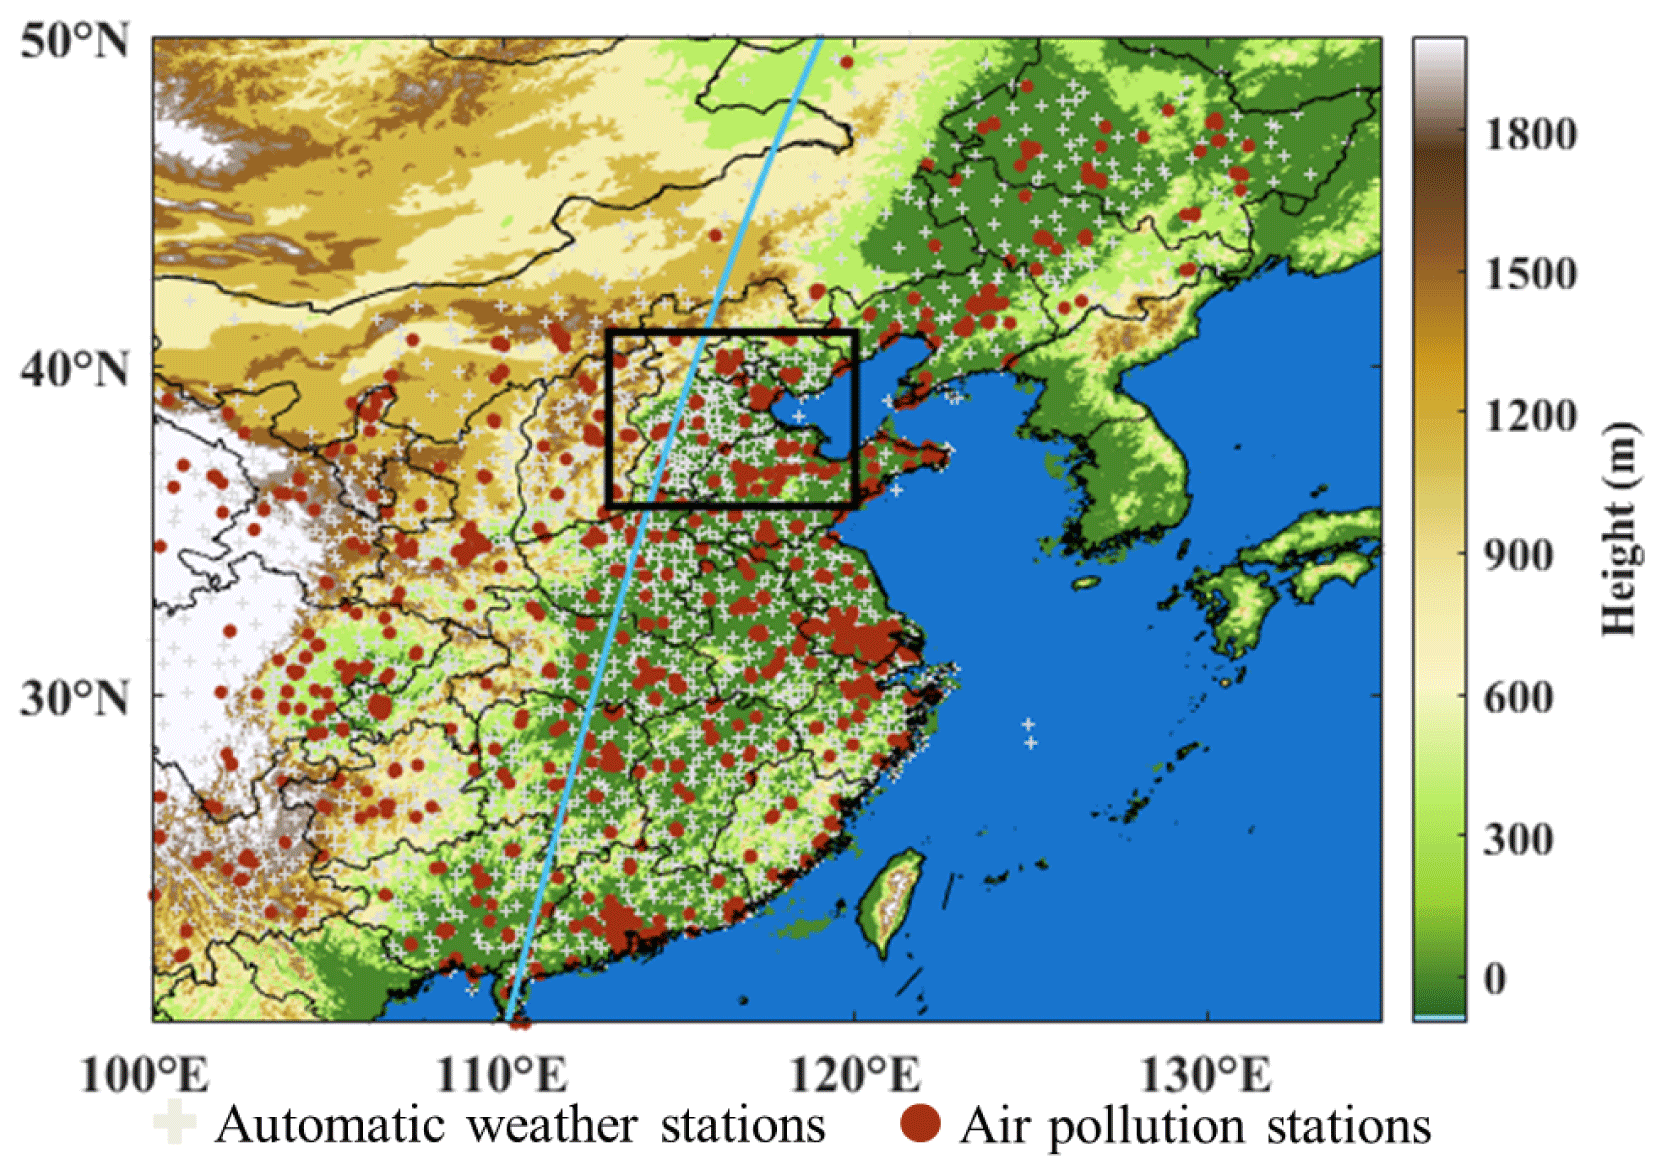
Figure 1The map and topographic height of the simulated domain. The turquoise line represents a part of the CALIPSO satellite orbit tracks at 18:12 on 7 January 2017, the black rectangle represents the location of Jing–Jin–Ji, the gray cross signs are the automatic weather stations, and the dark-red dots are the air pollution stations.
2.2 Model introduction
The updated operational atmospheric chemistry model GRAPES_Meso5.1/CUACE developed by CMA mainly includes four modules: preprocessing and quality control, standard initialization, assimilating forecasting, and post-processing (Chen and Shen, 2006; Chen et al., 2008; Zhang and Shen, 2008; Wang et al., 2010). The dynamic frame includes an Arakawa C staggered grid, a semi-implicit and semi-Lagrangian scheme for temporal and advection discretion, and a height-based terrain-following coordinate. The selected physical-chemistry options include RRTM long-wave radiation (Mlawer et al., 1997), Thompson cloud microphysics (Thompson et al., 2008), Goddard short-wave radiation (Chou et al., 1998), Noah land-surface (Chen and Dudhia, 2001), MRF planetary boundary layer (Hong and Pan, 1996), KFeta cumulus cloud (Kain and Fritsch, 1993), SFCLAY surface-layer (Pleim, 2007), RADM II gas-phase chemistry (Stockwell et al., 1990), and CUACE aerosol (Gong and Zhang, 2008; Zhou et al., 2012) schemes. In the RADM II gas-phase chemistry scheme, 63 gas species through 21 photochemical reactions and 136 gas-phase reactions participate in the calculations. In the CUACE aerosol scheme (Wang et al., 2010; Gong and Zhang, 2008), seven types of aerosol (sea salt (SS), sand–dust, black carbon, organic carbon (OC), sulfate (SF), nitrate (NT), and ammonium salt (AM)) are calculated by hygroscopic growth, dry and wet depositions, and condensation, etc. These aerosols (except for AM) are divided into 12 bins with diameter ranges of 0.01–40.96 µm.
The simulated domain of the model covers eastern China (100–135∘ E, 20–50∘ N) (Fig. 1) with a horizontal resolution of 0.1∘ × 0.1∘ and the 49 vertical layers from the ground (about 52 m) to ∼ 31 km. The whole simulation period is from 30 December 2016 to 10 January 2017 with 72 h as a looping experiment. The results of the first 72 h (30 December 2016 to 1 January 2017) are regarded as the spin-up time to keep the model stable and to avoid the effects of the chemical initial fields. The study period is from 4 to 8 January 2017 (from cloud formation to dissipation in Jing–Jin–Ji) in this paper.
2.3 Implementation of ACI in the model
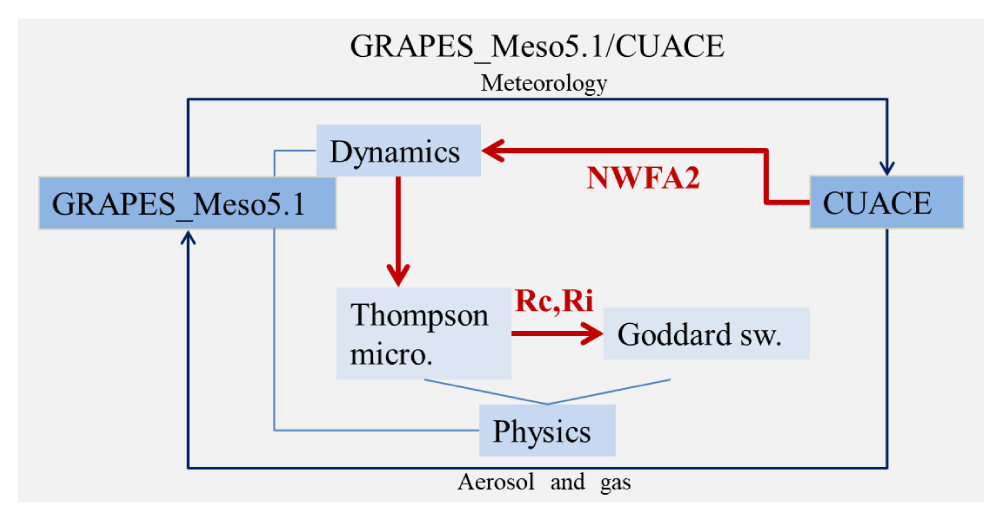
To account for the indirect effect of aerosol, we first update the Thompson cloud microphysics scheme from the original version in the model to the “aerosol-aware” version based on previous studies (Thompson and Eidhammer, 2014; Thompson et al., 2008). The calculation of supersaturation degree is detailed in Sect. S1.1 in the Supplement. The new Thompson cloud microphysics scheme includes the activation of water-friendly aerosol to cloud droplets (Sect. S1.2) and ice nucleation (Sect. S1.3). The source of water-friendly aerosol derives from the preset aerosol emission based on the climatological mean state. Second, the assumed aerosol concentration is replaced by real-time simulated aerosol concentration by CUACE. Water-friendly aerosol number concentration (kg−1) required by the activation in the cloud microphysics scheme is calculated by aerosol mass concentration at each grid point according to Eqs. (1), (2), and (3):
Here, m is the aerosol mass (kg), num is the tracer number from 1 to 49, r is the mean radius (µm), ρ is the aerosol density (g cm−3), tracer is the aerosol mass concentration (kg kg−1), N is the aerosol number concentration (kg−1), and NWFA2 is the total water-friendly aerosol number concentration (kg−1). I, j, and k represent the grid point. The tracer is the prognostic variable. The terms num, r, and ρ are specified in Table S1. The controversial black carbon and sand–dust in the activation are ignored in this study. The calculated NWFA2 is input into the cloud microphysics scheme instead of the original assumed aerosol number concentration (Fig. 2). The wet scavenging of aerosol and the evaporation of cloud droplets are described in Sect. S1.4 in the Supplement. Finally, the cloud physical parameters (cloud water and cloud ice effective radius (Rc and Ri)) from the Thompson scheme are input into the Goddard short-wave radiation scheme for radiation calculation, and ACI is then completed in the current GRAPES_Meso5.1/CUACE model (Fig. 2).
2.4 Case description
This case is a haze pollution episode (from 4 to 8 January 2017) over Jing–Jin–Ji accompanied by the appearance of stratus cloud, which demonstrates the rationality and pertinence of this simulated study. During this episode, the peak mass concentration of PM2.5 exceeds 200 µg m−3 (i.e., heavy aerosol pollution occurs in Jing–Jin–Ji) (Fig. S1a). Figure S2b shows the vertical distribution of aerosol and cloud layers in Jing–Jin–Ji at 18:12 on 7 January 2017. The aerosol layer is partly overlapped with the cloud layer, suggesting the potentiality of aerosol as CCN and ACI in this region. Different types of cloud can be identified by CTP and COT from satellite data, including stratus, cumulus, and cirrus, according to the International Satellite Cloud Climatology Project (ISCCP) (Rossow and Schiffer, 1991; Hahn et al., 2001). Figure S2a shows the daily mean CTP and COT in Jing–Jin–Ji from 4 to 8 January 2017. It can be confirmed that the types of cloud over Jing–Jin–Ji are basically stratus cloud (except for 4 January 2017) with lower cloud base height.
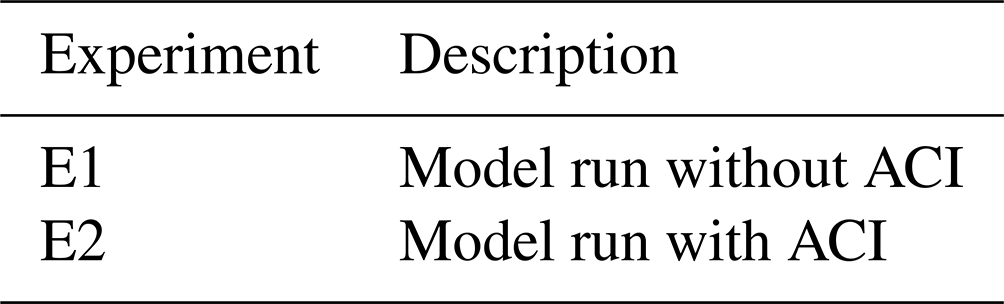
2.5 Experimental design
To investigate ACI and its feedback on the simulated cloud, temperature, and precipitation in the current model, we conduct two experiments (E1 and E2) as shown in Table 1. The E1 experiment is the control experiment with the constant 100 cm−3 number concentration of cloud droplets, which is the default setting in the Thompson cloud microphysics scheme. The E2 experiment includes ACI combined with real-time aerosol activation. The difference of simulations between the E2 and E1 experiment can be attributed to the impact of ACI on current NWP predictions.
3.1 Model evaluation
Figure 3a and b show the spatial distributions of observed and simulated (E1 experiment) mean PM2.5 mass concentration during the whole study period, both of which indicate that there is a high-value center of PM2.5 mass concentration in the southwest of Jing–Jin–Ji. However, the simulations in the southeast of Jing–Jin–Ji are lower than the observations. The model also captures the observed temporal variation of PM2.5 mass concentration, including the rising and falling period, and the correlation coefficient (R) is 0.75 (Fig. S1a). To further evaluate the aerosol information at the boundary layer height, Fig. S1b and c show the spatial distributions of the time-average AOD from the E1 experiment and VIIRS. The simulated AOD is consistent with VIIRS, both exhibiting a high-value center of AOD similar to PM2.5 mass concentration. All these results indicate that the model can accurately reproduce the aerosol pollution level reasonably in Jing–Jin–Ji.
In addition to ensuring reasonable aerosol simulations, it is necessary to have a brief understanding of simulated performance in meteorological factors from the current model without ACI (the E1 experiment). As shown in Fig. 3c–j, the model basically reproduces the location of the large-scale stratus cloud and accurately simulates the distributions and magnitudes of mean 2 m temperature in the daytime (i.e., from 08:00 to 16:00 local time) and 24 h cumulative precipitation in China. However, compared with VIIRS, the simulated mean COT and CLWP in Jing–Jin–Ji for 5 d (JJJ-5d) show obvious negative bias (i.e., bias = Xsim − Xobs, where Xsim and Xobs represent the simulations and observations) (−18.4 and −104.2 g m−2). In addition, the mean bias of the 2 m temperature in the daytime and 24 h cumulative precipitation for JJJ-5d are 3.2 ∘C and −0.11 mm against observations. It can be seen that 2 m temperature in the daytime is overestimated, and 24 h cumulative precipitation is underestimated by the E1 experiment without ACI, especially in the southern part of Jing–Jin–Ji with more cloud cover.
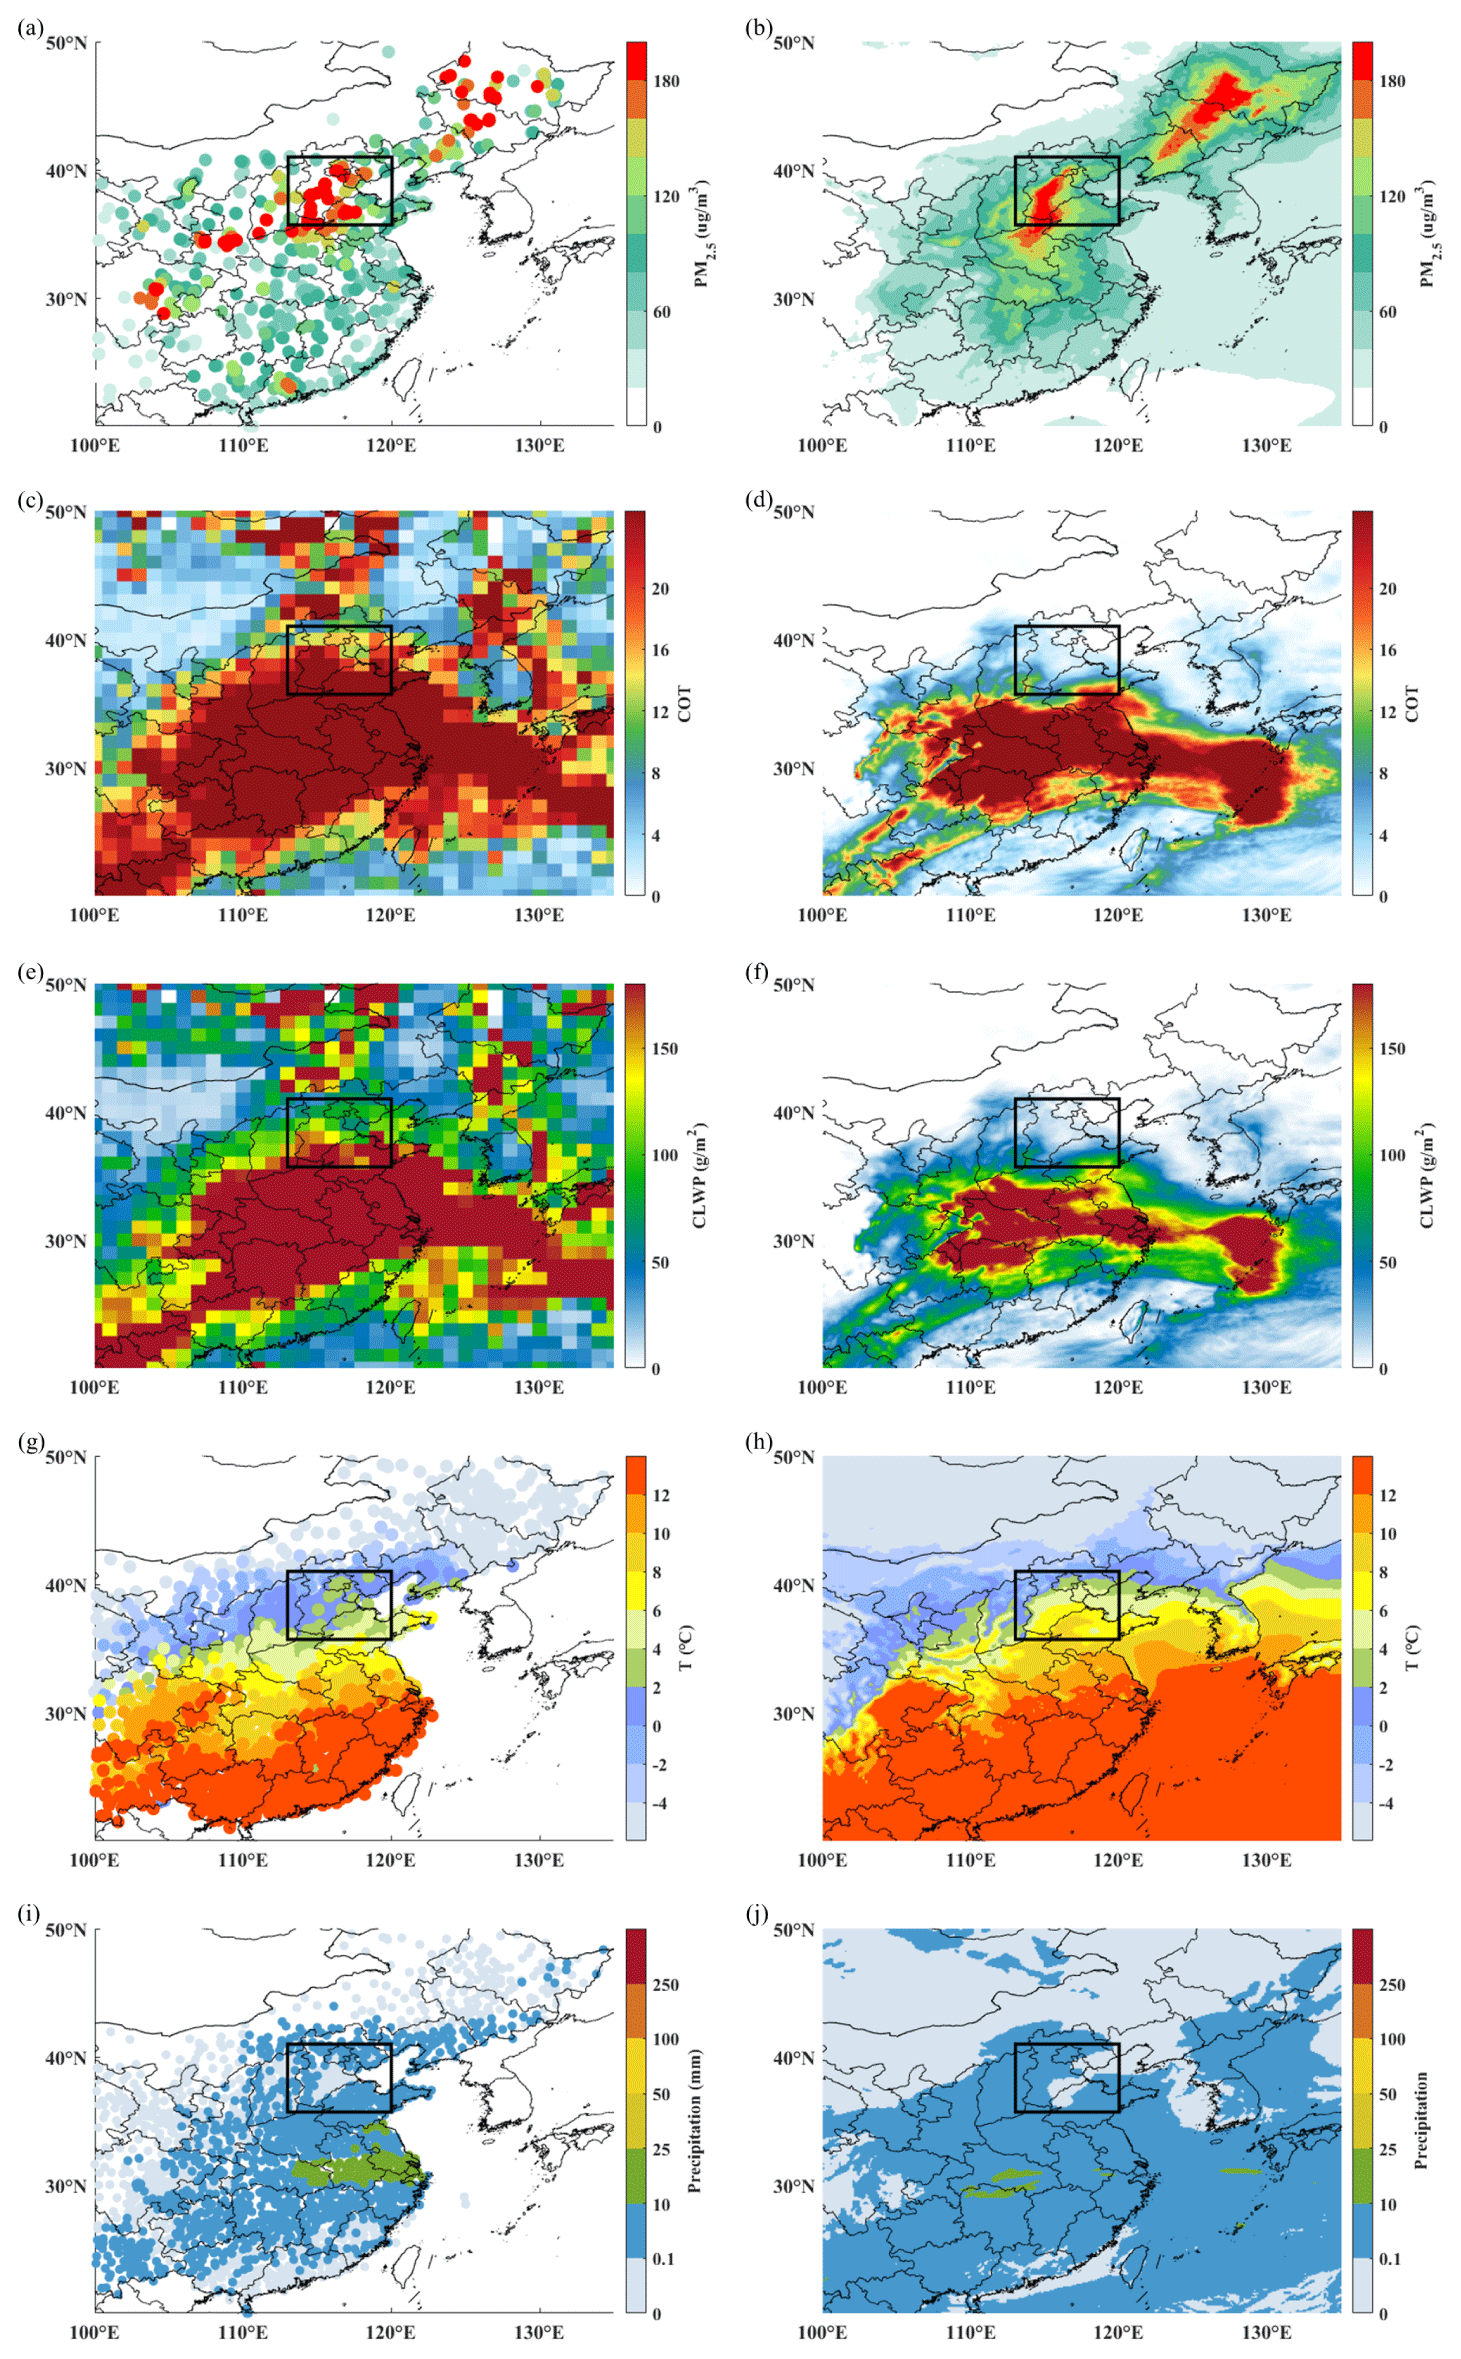
Figure 3Comparisons of observations (left column) and simulations by the E1 experiment (right column) of mean (a, b) PM2.5 mass concentration, (c, d) COT, (e, f) CLWP, (g, h) 2 m temperature in the daytime, and (i, j) 24 h cumulative precipitation from 4 to 8 January 2017. The black rectangle represents the location of Jing–Jin–Ji.
3.2 The impact of ACI on cloud
When ACI is activated in the model (i.e., the E2 experiment), there are more generated cloud droplets and more reasonable distributions of cloud droplets (Fig. S3) compared with the constant number concentration of cloud droplets (100 cm−3) in the E1 experiment. Furthermore, the Rc decreases (Fig. omitted) due to competitive growth. Such changes have impacts on hydrometeors in the cloud (Lohmann and Feichter, 2005). Figure 4 shows the temporal variation of the regional mean hydrometeor mixing ratios in Jing–Jin–Ji from the E1 and E2 experiments. On the whole, the cloud top height is above the 0 ∘C isotherm, and the magnitude of snow mixing ratio (Qs) is relatively larger, indicating that this cloud system is mixed-phase cloud with more significant cold cloud processes. Taking a day (7 January 2017) as an example (Figs. 4 and S4), compared with the E1 experiment, we find that the cloud water mixing ratio (Qc) increases significantly (the maximum increase in the vertical direction is more than g kg−1) in the E2 experiment. This is mainly due to the smaller Rc and lower auto-conversion of cloud water to form rain. Typically, during the warm cloud process, inhibited auto-conversion of cloud water may reduce the rainwater mixing ratio (Qr). However, Qr increases in the E2 experiment, which is mainly related to the increased rainwater from an enhanced rate of snow melting. This phenomenon also reflects the characteristics of the cold cloud processes. To further confirm the changes in snow, we find a significant increase of Qs in the mid-troposphere, which promotes the melting of the snow to form rain. The increase of Qs in the E2 experiment is mainly because ACI increases the supercooled cloud water in the mid-troposphere and may promote the riming growth process. The Qs, in addition, decreases in the lower troposphere, which may be related to the melting of snow to form rain. The changes in ice mixing ratio (Qi) and graupel mixing ratio (Qg) are relatively small. It should be noted that, in the E2 experiment, additional cloud fields do not generate in the original area without cloud (the E1 experiment), even though ACI is activated. For example, on 5 January 2017 (Fig. 4), the original model does not reproduce the fact that VIIRS indicated the presence of cloud in Jing–Jin–Ji, and the ACI effect also does not improve this phenomenon, indicating the limitations of ACI. More detailed studies are needed in the future.
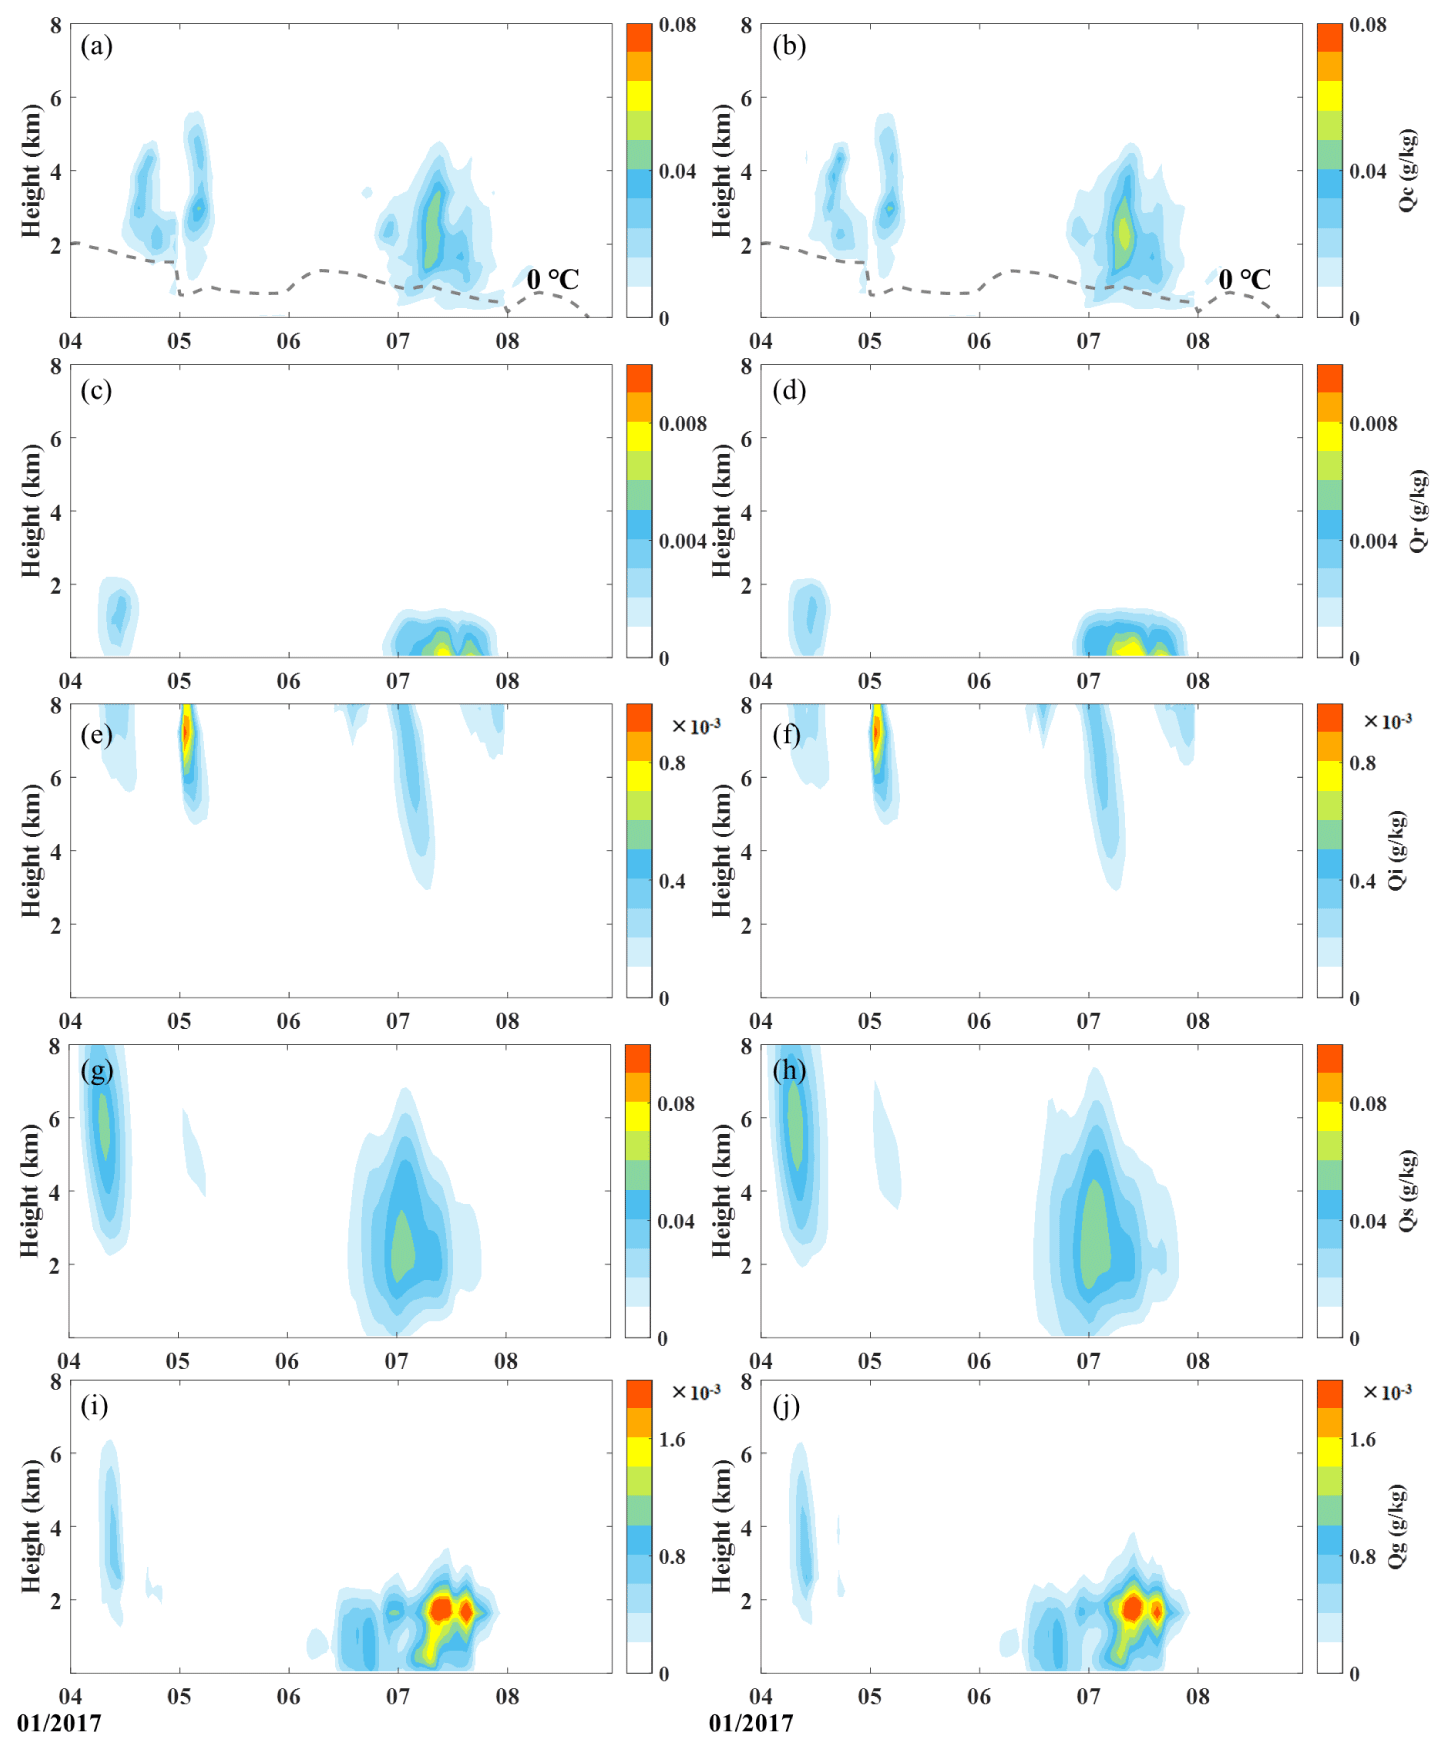
Figure 4The vertical distribution of regional mean hydrometeor mixing ratios (Qc, Qr, Qi, Qs, and Qg) in Jing–Jin–Ji from the (left column) E1 and (right column) E2 experiment.
The cloud macroscopic characteristics can be affected accordingly. The ACI increases simulated CLWP and COT, both of which are more consistent with satellite observations with a slightly reduced mean bias for JJJ-5d by 2 % and 2 %, respectively (Fig. 10a and b). In particular, on 7 January 2017, the daily mean CLWP and COT increase significantly in most areas of Jing–Jin–Ji due to ACI (Figs. 5 and 6). The maximum values of increase are 137.7 g m−2 and 25.1, respectively. This increase reduces the regional mean bias of the E1 experiment by 7 % (from −163.4 to −151.8 g m−2) for CLWP and 7 % (from −22.3 to −20.7) for COT against VIIRS. In addition, it can be seen that the impact of ACI on CLWP and COT is significantly different in various regions of Jing–Jin–Ji. We explain this phenomenon in Sect. 3.4.

Figure 5The spatial distribution of mean CLWP on 7 January 2017. (a) VIIRS. (b) The E1 experiment. (c) The E2 experiment. (d) The difference between the E2 and E1 experiment in Jing–Jin–Ji.
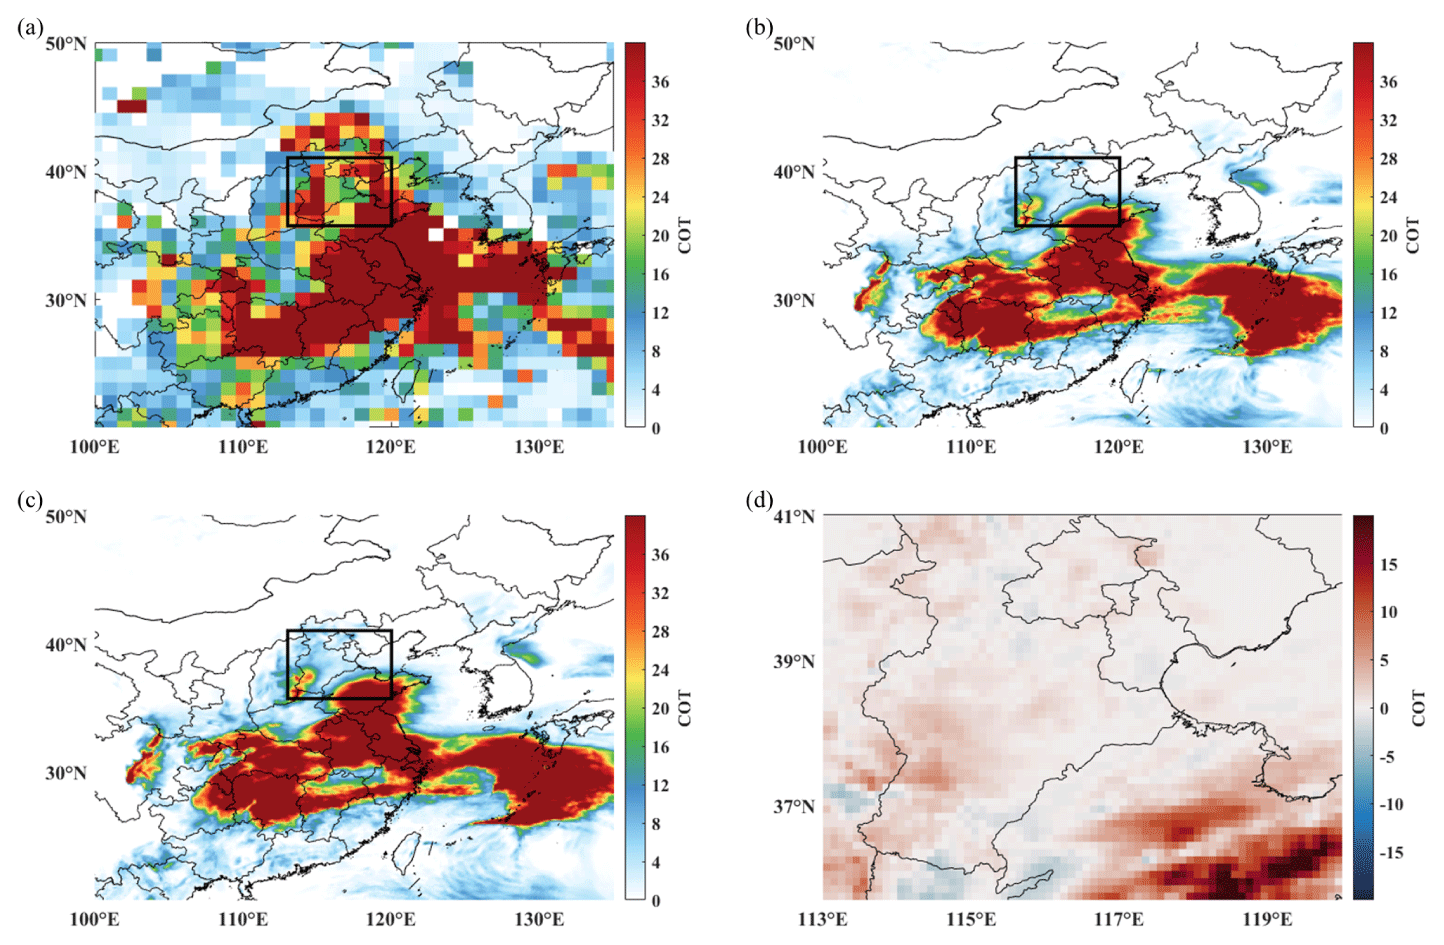
Figure 6As in Fig. 5 but for mean COT on 7 January 2017.
3.3 The impact of ACI on NWP
Changes in simulated cloud inevitably affect NWP such as radiation, temperature, and precipitation (Liu et al., 2019; Borys et al., 2000). The above section shows that the ACI effect significantly influences the cloud's micro- and macrophysical properties. Furthermore, the spatial distribution of daily mean SDSR on 7 January 2017 is shown in Fig. S5. Compared with the E1 experiment, the decreased SDSR from the E2 experiment has better performance against the data from CERES, with the regional mean bias of 44.6 vs. 42.9 W m−2 in Jing–Jin–Ji. Evaluations in Sect. 3.1 have pointed out that the simulated 2 m temperature in the daytime from the E1 experiment has a significantly positive bias in Jing–Jin–Ji, further supported by simulations on 5 and 7 January 2017 (Fig. 7b and e). The simulated mean 2 m temperature in the daytime by the E2 experiment with ACI has significantly decreased in cloudy fields of Jing–Jin–Ji, with a maximum decrease value of 1 ∘C on 7 January 2017 (Fig. 7f). However, other days during the study period are not significantly affected. For example, on 5 January 2017, the highest absolute difference of 2 m temperature in the daytime between the E2 and E1 experiment is less than 0.2 ∘C (Fig. 7c). In summary, the regional mean bias of 2 m temperature in the daytime has slightly improved (2 %) for JJJ-5d (3.2 ∘C for the E1 experiment vs. 3.1 ∘C for the E2 experiment) (Fig. 10c), while this improvement on 7 January 2017 increases to 4 % with a bias of 2.7 vs. 2.6 ∘C. Figure 8 shows the difference in temperature in the daytime in the vertical direction between the E2 and E1 experiment on 7 January 2017. The decrease in temperature at 1000 and 950 hPa (Fig. 8a and b) is more significant than at 900 and 850 hPa (Fig. 8c and d). The maximum value of decrease at 1000 hPa is more than 0.8 ∘C. As for the temperature above 700 hPa, the changes in temperature are not significant, with the maximum absolute difference being less than 0.2 ∘C (Fig. 8e and f). This phenomenon suggests that real-time ice nucleation is expected in the following study. Similar to the ACI effect on cloud characteristics, the impact on temperature is inhomogeneous in Jing–Jin–Ji, especially in the lower atmosphere. It is worth noting that the changes in CLWP, COT, and temperature in the daytime are all more significant in the same areas or periods, which is emerging evidence for explaining the inhomogeneous ACI effect.
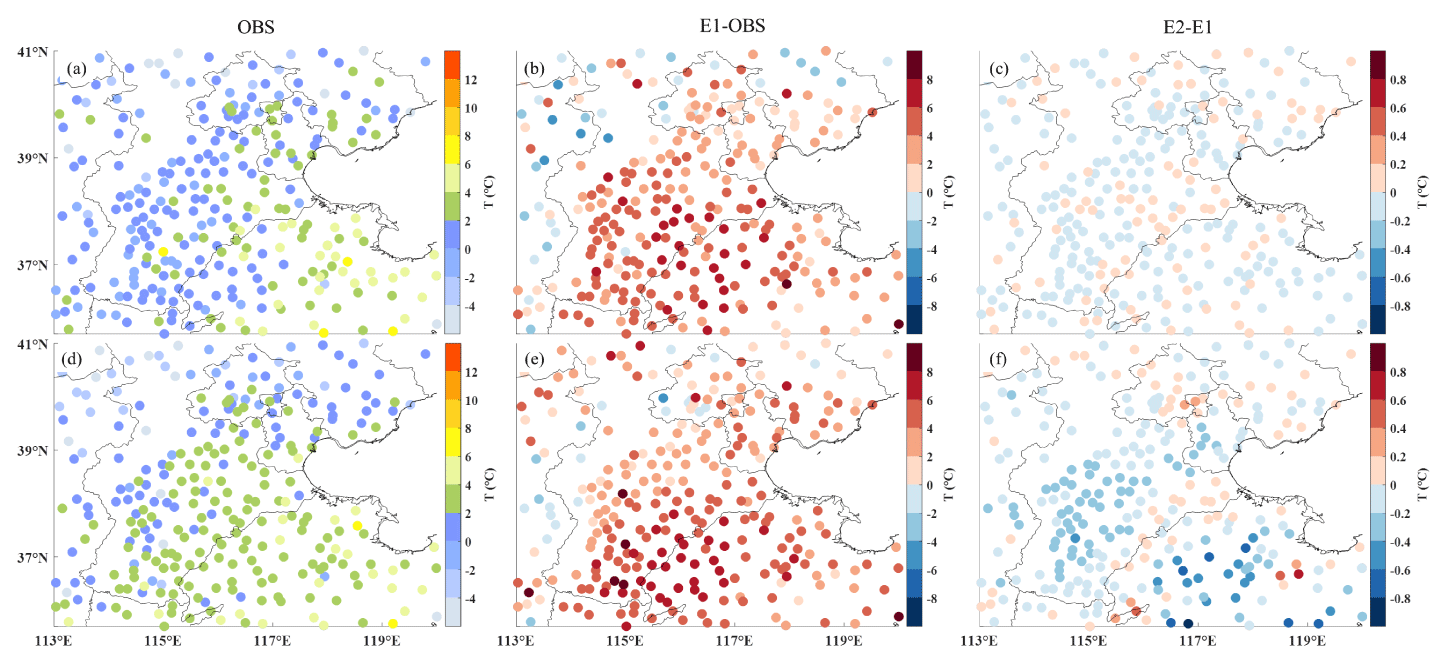
Figure 7The spatial distribution of mean 2 m temperature in the daytime. (a, d) The mean observations. (b, e) The bias of the E1 experiment. (c, f) The difference between the E2 and E1 experiment. The top and bottom row are data on 5 and 7 January 2017, respectively.

Figure 8The difference of mean temperature in the daytime on 7 January 2017 between the E2 and E1 experiment in the vertical direction. (a) 1000 hPa. (b) 950 hPa. (c) 900 hPa. (d) 850 hPa. (e) 700 hPa. (f) 500 hPa.
The simulated precipitation is another meteorological factor that requires special attention. Unlike temperature, the impact of ACI on precipitation is more complex. In this paper, a rainfall event is selected from an automatic weather station within 24 h cumulative precipitation > 0 mm. We define a moderate-rainfall (light-rainfall) event as 10 mm < 24 h cumulative precipitation < 25 mm (0.1 mm < 24 h cumulative precipitation < 10 mm). If all rainfall events from contiguous stations in a certain region are moderate rainfall, this region is defined as the moderate-rainfall area. Similar procedures are applied to the light-rainfall area. The only moderate-rainfall area is shown in Fig. 9a. Apart from this, other areas in Jing–Jin–Ji are light-rainfall areas during the study period. In the moderate-rainfall area associated with significant changes in CLWP and COT, ACI increases 24 h cumulative precipitation, with the maximum value exceeding 4.2 mm (Fig. 9d), which improves the underestimated mean precipitation by 26 % (Fig. 9c). Additionally, ACI decreases 24 h cumulative precipitation in light-rainfall areas. For example, in a light-rainfall area (the black oval in Fig. 9), this decrease due to ACI is observed with the maximum value exceeding −1 mm (Fig. 9d). In terms of the study period average, ACI reduces the mean bias of 24 h cumulative precipitation by 7 % in these light-rainfall areas. The combined effect of ACI on moderate rainfall and light rainfall improves the simulated mean 24 h cumulative precipitation for JJJ-5d, with a mean bias of −0.11 vs. −0.07 mm (Fig. 10d). The regionality of the ACI effect on precipitation is reflected. In Sect. 3.4, we continue to quantify the improvement in the selected areas and explore the possible reasons for discrepancies. More detailed evaluations about precipitation will be carried out in future works.
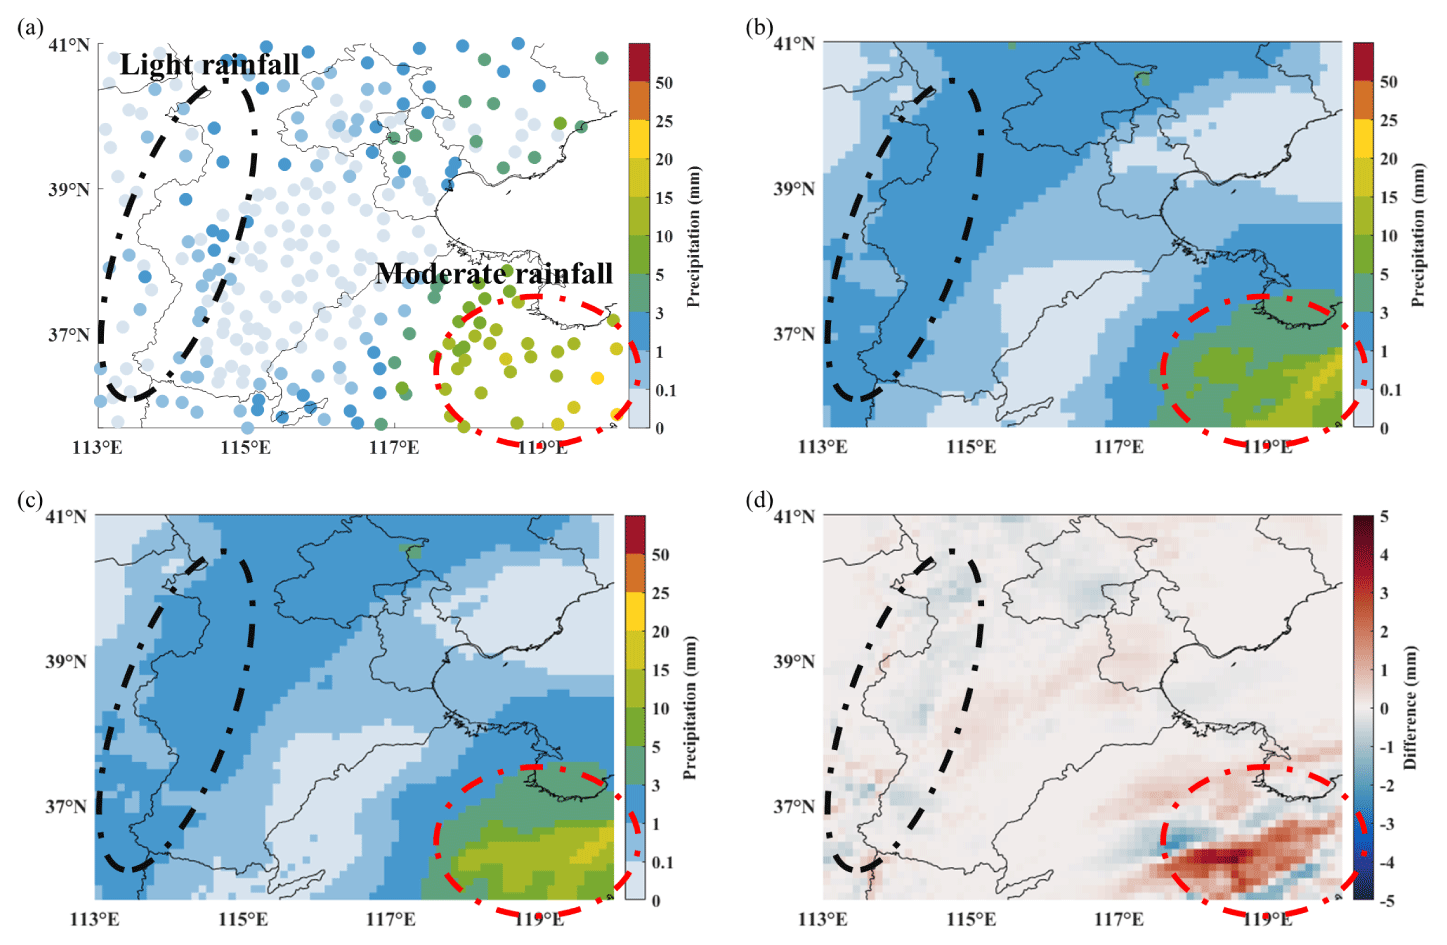
Figure 9The spatial distribution of 24 h cumulative precipitation on 7 January 2017. (a) The observations. (b) The E1 experiment. (c) The E2 experiment. (d) The difference between the E2 and E1 experiment. The red and black ovals represent the moderate- and light-rainfall areas, respectively.
3.4 The possible attributions of significant variations of ACI effect in time and space
Based on previous studies (Pawlowska and Brenguier, 2000; Lohmann and Feichter, 2005; Zhou et al., 2020; Lu et al., 2012), the factors affecting ACI include aerosol concentration, local meteorological conditions, cloud types, and the overlap degree of cloud and aerosol layers. To avoid averaging out the distinct patterns of the ACI effect that could possibly exist for different regions within the whole Jing–Jin–Ji, domaim A (i.e., DA; 113–115∘ E, 36.4–38.5∘ N) and domain B (i.e., DB; 116.2–120∘ E, 35.7–37.5∘ N) are selected according to the aerosol concentration and the magnitude of CLWP on 7 January 2017 (Fig. S6a and b).
Clear from the above sections and Fig. 10 is that the impact of ACI on simulations varies significantly in time and space, even in this localized area (Jing–Jin–Ji), for a few reasons. First, the possible attributions of this phenomenon are mainly derived by comparing the results in the DA and DB, where the observed cloud fields are reproduced. In the DA, ACI increases CLWP and COT, with the mean bias decreased by 27 % (from −33.8 to −24.5 g m−2) and 12 % (from −13.8 to −12.1), while in the DB, the changed CLWP and COT help to reduce the mean bias by 21 % (from −203.2 to −160.1 g m−2) and 37 % (from −18.7 to −11.7) (Fig. 10a and b). The changes in absolute values due to ACI are more significant in the DB. Then we find that the regional mean PM2.5 mass concentration in the DA (164.3 g m−3) is much greater than that in the DB (74.5 g m−3) (Fig. S6a), while the positive supersaturation (900 hPa) and ascent speed (900 hPa), two typical meteorological factors, control more areas in the DB (Fig. S6c and d). This suggests that the ACI effect is probably dominated more by supersaturation degree and ascent speed, rather than aerosol concentration, in these subareas of Jing–Jin–Ji. As pointed out by Hudson and Noble (2014), ACI depends more on ascent speed than aerosol concentration when CCN are larger than 400 cm−3 in stratus cloud. In addition, the mean bias of 2 m temperature in the daytime decreases by 10 % (from 1.9 to 1.7 ∘C) in the DA and 14 % (from 4.1 to 3.5 ∘C) in the DB (Fig. 10c), indicating that a more significant ACI effect in 2 m temperature in the daytime occurs in the subarea, with a greater increase in CLWP and COT. This can also be further proved by comparing the improved 2 m temperature in the daytime in four cases (JJJ-5d, JJJ, DA, and DB) with different changes in CLWP and COT (Fig. 10c). As for the simulated precipitation, in the DB with moderate-rainfall events, ACI increases 24 h cumulative precipitation with the mean bias reduced by 18 % (from −2.36 to −1.94 mm) (Fig. 10d), while in the DA with light-rainfall events, ACI decreases 24 h cumulative precipitation with the mean bias reduced by 3 % (from 1.14 to 1.11 mm). According to Fig. S7 and Sect. S2 in the Supplement, we have enough evidence to believe that the increased/decreased precipitation in the DB/DA is mainly caused by the enhanced/inhibited melting of the snow to form rain in cold cloud processes. Second, if the original model cannot reproduce the observed cloud fields in some areas or periods, ACI has almost no effect on simulations, which can likely be attributed to the cloud microphysical scheme and the initial fields, etc (Thompson and Eidhammer, 2014; Fan et al., 2016; White et al., 2017). Finally, the systematic errors in the model itself may limit the improvement from the ACI effect. More detailed studies are needed.
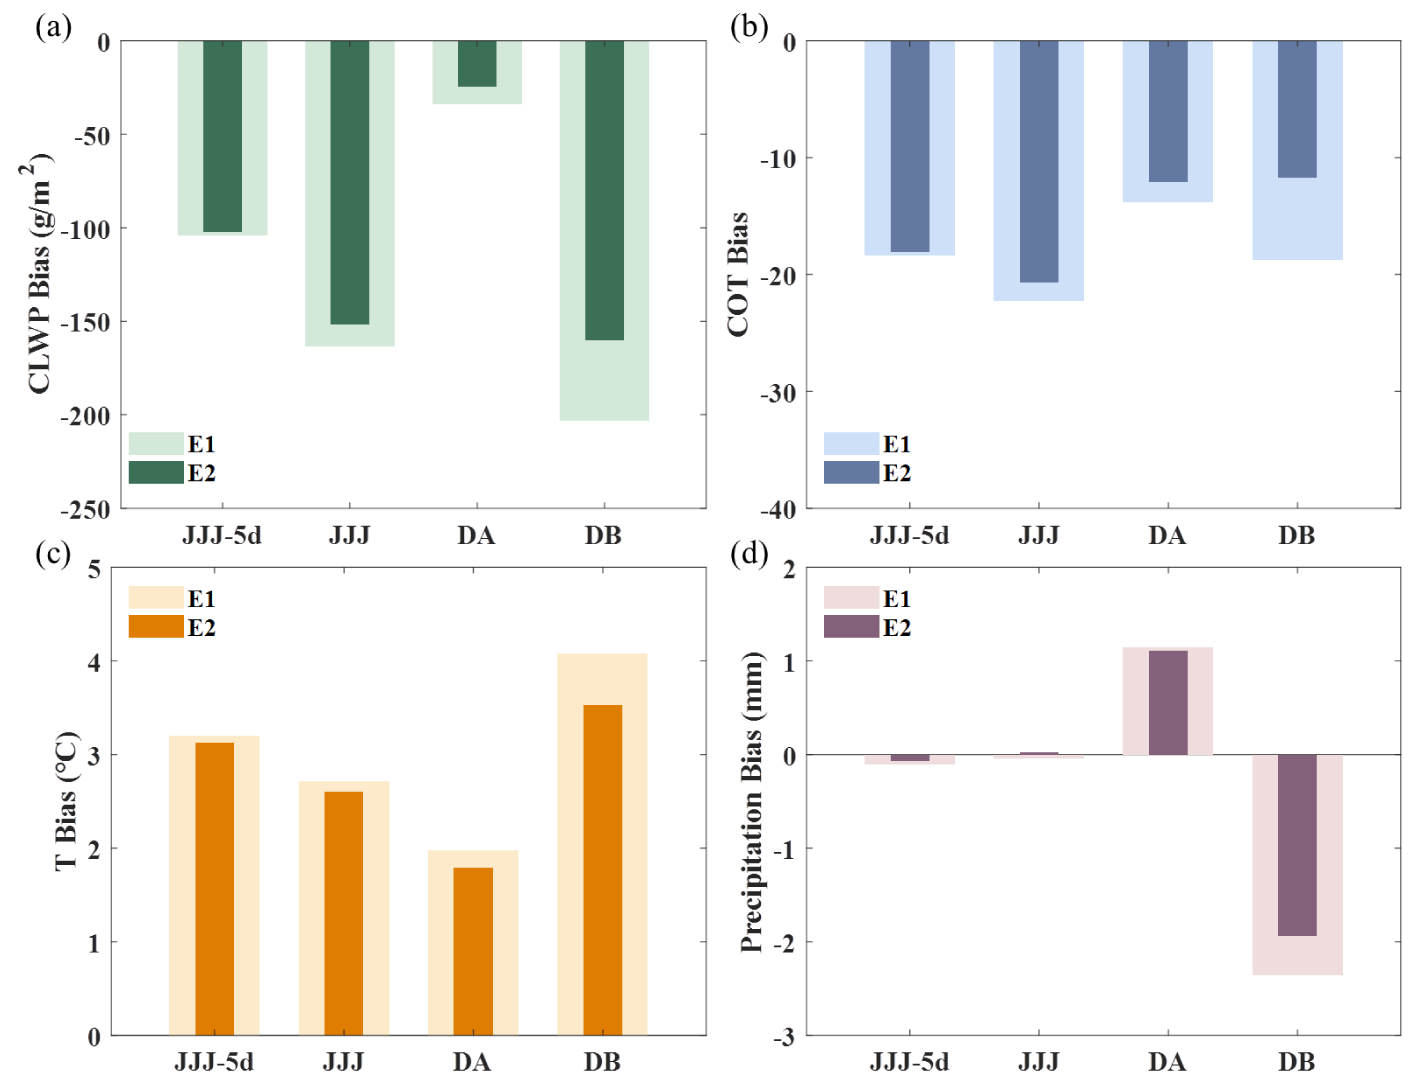
Figure 10Comparisons of the mean bias of simulations from the E1 and E2 experiment for JJJ-5d and a day (7 January 2017) in Jing–Jin–Ji (JJJ), DA, and DB. (a) CLWP. (b) COT. (c) 2 m temperature in the daytime. (d) 24 h cumulative precipitation.
In this work, ACI is first completed in the GRAPES_ Meso5.1/CUACE model by linking the real-time calculated aerosol in CUACE to cloud droplet nucleation in the Thompson cloud microphysics scheme and transferring diagnostic variables (Rc and Ri) to Goddard short-wave radiation scheme. Using this developed model, two experiments, including a control experiment without ACI and a comparative experiment with activated ACI, are conducted to investigate the impact of ACI on simulations (e.g., cloud, temperature, and precipitation) in a typical haze pollution episode (from 4 to 8 January 2017) with heavy aerosol concentration and stratus cloud over Jing–Jin–Ji in China.
The results show that ACI increases the number concentration of cloud droplets, Qc, CLWP, and COT and decreases Rc. The increased CLWP and COT are more consistent with satellite observations, especially in a certain subarea, with the mean biases decreased by up to 21 % (from −203.2 to −160.1 g m−2) and 37 % (from −18.7 to −11.7). The cloud extinction enhanced by ACI accompanied by the decreased SDSR further cools temperature in the daytime below 950 hPa, as a result reducing the regional mean biases of 2 m temperature in the daytime by up to 14 % (from 4.1 to 3.5 ∘C) in the subarea, with the greatest change in CLWP and COT. The 24 h cumulative precipitation in this subarea, corresponding to moderate-rainfall events, increases due to ACI with reduced mean biases by 18 % (from −2.36 to −1.94 mm), which is caused by the enhanced melting of the snow to form rain in cold cloud processes. However, in other areas or periods with a slight change in CLWP and COT, the improvement of ACI on NWP is not significant, suggesting the inhomogeneous spatiotemporal ACI effect.
In general, the GRAPES_ Meso5.1/CUACE model coupled with ACI has a better performance on simulated cloud, temperature, and precipitation under haze pollution conditions in Jing–Jin–Ji. However, the inhomogeneous ACI effect in time and space still needs more detailed work in the future. In addition, there are still some shortcomings worth improving, such as aerosol activation in the convective cloud (Ekman et al., 2011) and real-time ice-friendly aerosol input (Demott et al., 2010; Thompson and Eidhammer, 2014).
VIIRS daily Level-3 cloud data are available at https://doi.org/10.5067/VIIRS/CLDPROP_D3_VIIRS_SNPP.011 (Platnick et al., 2019). The CALIPSO Level 2 vertical feature mask data are available at https://doi.org/10.5067/CALIOP/CALIPSO/LID_L2_VFM-STANDARD-V4-20 (NASA/LARC/SD/ASDC, 2018). The NCEP Final analysis data are available at https://doi.org/10.5065/D65Q4T4Z (National Centers for Environmental Prediction/National Weather Service/NOAA/U.S. Department of Commerce, 2015).
The supplement related to this article is available online at: https://doi.org/10.5194/acp-22-15207-2022-supplement.
HW and XiaoyZ designed the study. WZ and LH implemented the related model code. WZ performed the model simulations and prepared the manuscript. YP, ZL, and XiaoZ collected the observed data. HW, XiaoyZ, and HC provided supervision and advice on the representation of the manuscript.
The contact author has declared that none of the authors has any competing interests.
Publisher’s note: Copernicus Publications remains neutral with regard to jurisdictional claims in published maps and institutional affiliations.
This study is supported by the NSFC Major Project (42090030), the National Key Research and Development Program of China (2019YFC0214601), and the NSFC for Distinguished Young Scholars (41825011).
This research has been supported by the Major Project (grant no. 42090030) from the National Natural Science Foundation of China, the National Key Research and Development Program of China (grant no. 2019YFC0214601), and the Distinguished Young Scholars (grant no. 41825011) from the National Natural Science Foundation of China.
This paper was edited by Dantong Liu and reviewed by two anonymous referees.
Albrecht, B.: Aerosols, Cloud Microphysics, and Fractional Cloudiness, Science, 245, 1227–1230, https://doi.org/10.1126/science.245.4923.1227, 1989.
Andreae, M. O. and Rosenfeld, D.: Aerosol–cloud–precipitation interactions. Part 1. The nature and sources of cloud-active aerosols, Earth-Sci. Rev., 89, 13–41, https://doi.org/10.1016/j.earscirev.2008.03.001, 2008.
Bennartz, R.: Global assessment of marine boundary layer cloud droplet number concentration from satellite, J. Geophys. Res.-Atmos., 112, D02201, https://doi.org/10.1029/2006JD007547, 2007.
Borys, R. D., Lowenthal, D. H., and Mitchell, D. L.: The relationships among cloud microphysics, chemistry, and precipitation rate in cold mountain clouds, Atmos. Environ., 34, 2593–2602, https://doi.org/10.1016/S1352-2310(99)00492-6, 2000.
Chang, D. Y., Lelieveld, J., Steil, B., Yoon, J., Yum, S. S., and Kim, A. H.: Variability of aerosol-cloud interactions induced by different cloud droplet nucleation schemes, Atmos. Res., 250, 105367, https://doi.org/10.1016/j.atmosres.2020.105367, 2021.
Che, H., Zhang, X.-Y., Xia, X., Goloub, P., Holben, B., Zhao, H., Wang, Y., Zhang, X.-C., Wang, H., Blarel, L., Damiri, B., Zhang, R., Deng, X., Ma, Y., Wang, T., Geng, F., Qi, B., Zhu, J., Yu, J., Chen, Q., and Shi, G.: Ground-based aerosol climatology of China: aerosol optical depths from the China Aerosol Remote Sensing Network (CARSNET) 2002–2013, Atmos. Chem. Phys., 15, 7619–7652, https://doi.org/10.5194/acp-15-7619-2015, 2015.
Che, H. C., Zhang, X. Y., Zhang, L., Wang, Y. Q., Zhang, Y. M., Shen, X. J., Ma, Q. L., Sun, J. Y., and Zhong, J. T.: Prediction of size-resolved number concentration of cloud condensation nuclei and long-term measurements of their activation characteristics, Sci. Rep.-UK, 7, 5819, https://doi.org/10.1038/s41598-017-05998-3, 2017.
Chen, D. and Shen, X.: Recent Progress on GRAPES Research and Application, J. Appl. Meteorol. Sci., 17, 773–777, 2006.
Chen, D. H., Xue, J., Yang, X., Zhang, H., Shen, X., Hu, J., Wang, Y., Ji, L., and Chen, J.: New generation of multi-scale NWP system (GRAPES): general scientific design, Chinese Sci. Bull., 53, 3433–3445, 2008.
Chen, F. and Dudhia, J.: Coupling an advanced land surface–hydrology model with the Penn State–NCAR MM5 modeling system. Part I: Model implementation and sensitivity, Mon. Weather Rev., 129, 569–585, 2001.
Chou, M.-D., Suarez, M., Ho, C.-H., Yan, M., and Lee, K.-T.: Parameterizations for Cloud Overlapping and Shortwave Single-Scattering Properties for Use in General Circulation and Cloud Ensemble Models, J. Climate, 11, 202–214, https://doi.org/10.1175/1520-0442(1998)011<0202:PFCOAS>2.0.CO;2, 1998.
DeMott, P. J., Prenni, A. J., Liu, X., Kreidenweis, S. M., Petters, M. D., Twohy, C. H., Richardson, M. S., Eidhammer, T., and Rogers, D. C.: Predicting global atmospheric ice nuclei distributions and their impacts on climate, P. Natl. Acad. Sci. USA, 107, 11217–11222, https://doi.org/10.1073/pnas.0910818107, 2010.
Ding, S., Zhao, C., Shi G., and Wu, C.: Analysis of global total cloud amount variation over the past 20 years, Journal of Applied Meteorological Science, 16, 670–677, 2005.
Ekman, A. M. L., Engström, A., and Söderberg, A.: Impact of Two-Way Aerosol–Cloud Interaction and Changes in Aerosol Size Distribution on Simulated Aerosol-Induced Deep Convective Cloud Sensitivity, J. Atmos. Sci., 68, 685–698, https://doi.org/10.1175/2010JAS3651.1, 2011.
Fan, J., Wang, Y., Rosenfeld, D., and Liu, X.: Review of Aerosol–Cloud Interactions: Mechanisms, Significance, and Challenges, J. Atmos. Sci., 73, 4221–4252, https://doi.org/10.1175/JAS-D-16-0037.1, 2016.
Gong, S. L. and Zhang, X. Y.: CUACE/Dust – an integrated system of observation and modeling systems for operational dust forecasting in Asia, Atmos. Chem. Phys., 8, 2333–2340, https://doi.org/10.5194/acp-8-2333-2008, 2008.
Hahn, C. J., Rossow, W. B., and Warren, S. G.: ISCCP cloud properties associated with standard cloud types identified in individual surface observations, J. Climate, 14, 11–28, 2001.
Hong, S.-Y. and Pan, H.-L.: Nonlocal Boundary Layer Vertical Diffusion in a Medium-Range Forecast Model, Mon. Weather Rev., 124, 2322–2339, https://doi.org/10.1175/1520-0493(1996)124<2322:NBLVDI>2.0.CO;2, 1996.
Hong, S. Y. and Lim, J. O.: The WRF single-moment 6-class microphysics scheme (WSM6), J. Korean Meteor. Soc., 42, 129–151, 2006.
Huang, X. and Ding, A.: Aerosol as a critical factor causing forecast biases of air temperature in global numerical weather prediction models, Sci. Bull., 66, 1917–1924, https://doi.org/10.1016/j.scib.2021.05.009, 2021.
Hudson, J. G. and Noble, S.: CCN and Vertical Velocity Influences on Droplet Concentrations and Supersaturations in Clean and Polluted Stratus Clouds, J. Atmos. Sci., 71, 312–331, https://doi.org/10.1175/JAS-D-13-086.1, 2014.
Kain, J. S. and Fritsch, J. M.: Convective Parameterization for Mesoscale Models: The Kain-Fritsch Scheme, in: The Representation of Cumulus Convection in Numerical Models, edited by: Emanuel, K. A. and Raymond, D. J., American Meteorological Society, Boston, MA, 165–170, https://doi.org/10.1007/978-1-935704-13-3_16, 1993.
Lawand, D., Bhakare, S., Fadnavis, S., Bhawar, R., Rahul, P., Pallath, P., and Lolli, S.: Variability of Aerosols and Clouds Over North Indian and Myanmar During the COVID-19 Lockdown Period, Front. Environ. Sci., 10, 838778, https://doi.org/10.3389/fenvs.2022.838778, 2022.
Li, M., Zhang, Q., Streets, D. G., He, K. B., Cheng, Y. F., Emmons, L. K., Huo, H., Kang, S. C., Lu, Z., Shao, M., Su, H., Yu, X., and Zhang, Y.: Mapping Asian anthropogenic emissions of non-methane volatile organic compounds to multiple chemical mechanisms, Atmos. Chem. Phys., 14, 5617–5638, https://doi.org/10.5194/acp-14-5617-2014, 2014.
Li, M., Liu, H., Geng, G., Hong, C., Liu, F., Song, Y., Tong, D., Zheng, B., Cui, H., Hanyang, M., Zhang, Q., and He, K.: Anthropogenic emission inventories in China: A review, Nat. Sci. Rev., 4, 834–866, https://doi.org/10.1093/nsr/nwx150, 2017.
Lim, K.-S. S. and Hong, S.-Y.: Development of an Effective Double-Moment Cloud Microphysics Scheme with Prognostic Cloud Condensation Nuclei (CCN) for Weather and Climate Models, Mon. Weather Rev., 138, 1587–1612, https://doi.org/10.1175/2009MWR2968.1, 2010.
Listowski, C. and Lachlan-Cope, T.: The microphysics of clouds over the Antarctic Peninsula – Part 2: modelling aspects within Polar WRF, Atmos. Chem. Phys., 17, 10195–10221, https://doi.org/10.5194/acp-17-10195-2017, 2017.
Liu, S., Xing, J., Zhao, B., Wang, J., Wang, S., Zhang, X., and Ding, A.: Understanding of Aerosol–Climate Interactions in China: Aerosol Impacts on Solar Radiation, Temperature, Cloud, and Precipitation and Its Changes Under Future Climate and Emission Scenarios, Current Pollution Reports, 5, 36–51, https://doi.org/10.1007/s40726-019-00107-6, 2019.
Lohmann, U. and Feichter, J.: Global indirect aerosol effects: a review, Atmos. Chem. Phys., 5, 715–737, https://doi.org/10.5194/acp-5-715-2005, 2005.
Lu, C., Liu, Y., Niu, S., and Vogelmann, A. M.: Observed impacts of vertical velocity on cloud microphysics and implications for aerosol indirect effects, Geophys. Res. Lett., 39, L21808, https://doi.org/10.1029/2012GL053599, 2012.
Makar, P. A., Gong, W., Milbrandt, J., Hogrefe, C., Zhang, Y., Curci, G., Žabkar, R., Im, U., Balzarini, A., Baró, R., Bianconi, R., Cheung, P., Forkel, R., Gravel, S., Hirtl, M., Honzak, L., Hou, A., Jiménez-Guerrero, P., Langer, M., Moran, M. D., Pabla, B., Pérez, J. L., Pirovano, G., San José, R., Tuccella, P., Werhahn, J., Zhang, J., and Galmarini, S.: Feedbacks between air pollution and weather, Part 1: Effects on weather, Atmos. Environ., 115, 442–469, https://doi.org/10.1016/j.atmosenv.2014.12.003, 2015.
Mao, K., Yuan, Z., Zuo, Z., Xu, T., Shen, X., and Gao, C.: Changes in Global Cloud Cover Based on Remote Sensing Data from 2003 to 2012, Chinese Geogr. Sci., 29, 306–315, https://doi.org/10.1007/s11769-019-1030-6, 2019.
McCoy, D. T., Field, P. R., Schmidt, A., Grosvenor, D. P., Bender, F. A.-M., Shipway, B. J., Hill, A. A., Wilkinson, J. M., and Elsaesser, G. S.: Aerosol midlatitude cyclone indirect effects in observations and high-resolution simulations, Atmos. Chem. Phys., 18, 5821–5846, https://doi.org/10.5194/acp-18-5821-2018, 2018.
McFiggans, G., Artaxo, P., Baltensperger, U., Coe, H., Facchini, M. C., Feingold, G., Fuzzi, S., Gysel, M., Laaksonen, A., Lohmann, U., Mentel, T. F., Murphy, D. M., O'Dowd, C. D., Snider, J. R., and Weingartner, E.: The effect of physical and chemical aerosol properties on warm cloud droplet activation, Atmos. Chem. Phys., 6, 2593–2649, https://doi.org/10.5194/acp-6-2593-2006, 2006.
Miltenberger, A. K., Field, P. R., Hill, A. A., Rosenberg, P., Shipway, B. J., Wilkinson, J. M., Scovell, R., and Blyth, A. M.: Aerosol–cloud interactions in mixed-phase convective clouds – Part 1: Aerosol perturbations, Atmos. Chem. Phys., 18, 3119–3145, https://doi.org/10.5194/acp-18-3119-2018, 2018.
Mlawer, E. J., Taubman, S. J., Brown, P. D., Iacono, M. J., and Clough, S. A.: Radiative transfer for inhomogeneous atmospheres: RRTM, a validated correlated-k model for the longwave, J. Geophys. Res.-Atmos., 102, 16663–16682, https://doi.org/10.1029/97JD00237, 1997.
Morrison, H., Thompson, G., and Tatarskii, V.: Impact of Cloud Microphysics on the Development of Trailing Stratiform Precipitation in a Simulated Squall Line: Comparison of One- and Two-Moment Schemes, Mon. Weather Rev., 137, 991–1007, https://doi.org/10.1175/2008MWR2556.1, 2009.
Myhre, G., Samset, B. H., Schulz, M., Balkanski, Y., Bauer, S., Berntsen, T. K., Bian, H., Bellouin, N., Chin, M., Diehl, T., Easter, R. C., Feichter, J., Ghan, S. J., Hauglustaine, D., Iversen, T., Kinne, S., Kirkevåg, A., Lamarque, J.-F., Lin, G., Liu, X., Lund, M. T., Luo, G., Ma, X., van Noije, T., Penner, J. E., Rasch, P. J., Ruiz, A., Seland, Ø., Skeie, R. B., Stier, P., Takemura, T., Tsigaridis, K., Wang, P., Wang, Z., Xu, L., Yu, H., Yu, F., Yoon, J.-H., Zhang, K., Zhang, H., and Zhou, C.: Radiative forcing of the direct aerosol effect from AeroCom Phase II simulations, Atmos. Chem. Phys., 13, 1853–1877, https://doi.org/10.5194/acp-13-1853-2013, 2013.
National Centers for Environmental Prediction/National Weather Service/NOAA/U.S. Department of Commerce: NCEP GDAS/FNL 0.25 Degree Global Tropospheric Analyses and Forecast Grids, Research Data Archive at the National Center for Atmospheric Research, Computational and Information Systems Laboratory [data set], https://doi.org/10.5065/D65Q4T4Z, 2015.
NASA/LARC/SD/ASDC: CALIPSO Lidar Level 2 Vertical Feature Mask (VFM), V4-20, NASA Langley Atmospheric Science Data Center [data set], https://doi.org/10.5067/CALIOP/CALIPSO/LID_L2_VFM-STANDARD-V4-20, 2018.
Platnick, S., Meyer, K. G., Hubanks, P., Holz, R., Ackerman, S. A., and Heidinger, A. K.: VIIRS Atmosphere L3 Cloud Properties Product, Version-1.1, NASA Level-1 and Atmosphere Archive & Distribution System (LAADS) Distributed Active Archive Center (DAAC), Goddard Space Flight Center, USA [data set], https://doi.org/10.5067/VIIRS/CLDPROP_D3_VIIRS_SNPP.011, 2019.
Pawlowska, H. and Brenguier, J.-L.: Microphysical properties of stratocumulus clouds during ACE-2, Tellus B, 52, 868–887, https://doi.org/10.1034/j.1600-0889.2000.00076.x, 2000.
Pleim, J.: A Combined Local and Nonlocal Closure Model for the Atmospheric Boundary Layer. Part II: Application and Evaluation in a Mesoscale Meteorological Model, J. Appl. Meteorol. Clim., 46, 1396–1409, https://doi.org/10.1175/JAM2534.1, 2007.
Pruppacher, H. R. and Klett, J. D.: Microphysics of Clouds and Precipitation, Nature, 284, 88–88, https://doi.org/10.1038/284088b0, 1980.
Quaas, J.: Approaches to Observe Anthropogenic Aerosol-Cloud Interactions, Current Climate Change Reports, 1, 297–304, https://doi.org/10.1007/s40641-015-0028-0, 2015.
Ramanathan, V., Chung, C., Kim, D., Bettge, T., Buja, L., Kiehl, J. T., Washington, W. M., Fu, Q., Sikka, D. R., and Wild, M.: Atmospheric brown clouds: Impacts on South Asian climate and hydrological cycle, P. Natl. Acad. Sci. USA, 102, 5326–5333, https://doi.org/10.1073/pnas.0500656102, 2005.
Rosenfeld, D., Andreae, M. O., Asmi, A., Chin, M., de Leeuw, G., Donovan, D. P., Kahn, R., Kinne, S., Kivekäs, N., Kulmala, M., Lau, W., Schmidt, K. S., Suni, T., Wagner, T., Wild, M., and Quaas, J.: Global observations of aerosol-cloud-precipitation-climate interactions, Rev. Geophys., 52, 750–808, https://doi.org/10.1002/2013RG000441, 2014.
Rosenfeld, D., Zhu, Y., Wang, M., Zheng, Y., Goren, T., and Yu, S.: Aerosol-driven droplet concentrations dominate coverage and water of oceanic low-level clouds, Science, 363, eaav0566, https://doi.org/10.1126/science.aav0566, 2019.
Rossow, W. B. and Schiffer, R. A.: ISCCP Cloud Data Products, B. Am. Meteorol. Soc., 72, 2–20, https://doi.org/10.1175/1520-0477(1991)072<0002:ICDP>2.0.CO;2, 1991.
Seifert, A., Köhler, C., and Beheng, K. D.: Aerosol-cloud-precipitation effects over Germany as simulated by a convective-scale numerical weather prediction model, Atmos. Chem. Phys., 12, 709–725, https://doi.org/10.5194/acp-12-709-2012, 2012.
Stockwell, W. R., Middleton, P., Chang, J. S., and Tang, X.: The second generation regional acid deposition model chemical mechanism for regional air quality modeling, J. Geophys. Res.-Atmos., 95, 16343–16367, https://doi.org/10.1029/JD095iD10p16343, 1990.
Su, L. and Fung, J. C. H.: Investigating the role of dust in ice nucleation within clouds and further effects on the regional weather system over East Asia – Part 1: model development and validation, Atmos. Chem. Phys., 18, 8707–8725, https://doi.org/10.5194/acp-18-8707-2018, 2018.
Sun, J. and Ariya, P. A.: Atmospheric organic and bio-aerosols as cloud condensation nuclei (CCN): A review, Atmos. Environ., 40, 795–820, https://doi.org/10.1016/j.atmosenv.2005.05.052, 2006.
Thompson, G. and Eidhammer, T.: A Study of Aerosol Impacts on Clouds and Precipitation Development in a Large Winter Cyclone, J. Atmos. Sci., 71, 3636–3658, https://doi.org/10.1175/JAS-D-13-0305.1, 2014.
Thompson, G., Rasmussen, R. M., and Manning, K.: Explicit forecasts of winter precipitation using an improved bulk microphysics scheme. Part I: Description and sensitivity analysis, Mon. Weather Rev., 132, 519–542, 2004.
Thompson, G., Field, P. R., Rasmussen, R. M., and Hall, W. D.: Explicit forecasts of winter precipitation using an improved bulk microphysics scheme. Part II: Implementation of a new snow parameterization, Mon. Weather Rev., 136, 5095–5115, 2008.
Twomey, S.: The Influence of Pollution on the Shortwave Albedo of Clouds, J. Atmos. Sci., 34, 1149–1154, https://doi.org/10.1175/1520-0469(1977)034<1149:TIOPOT>2.0.CO;2, 1977.
Wang, H., Gong, S., Zhang, H., Chen, Y., Shen, X., Chen, D., Xue, J., Shen, Y., Wu, X., and Jin, Z.: A new-generation sand and dust storm forecasting system GRAPES_CUACE/Dust: Model development, verification and numerical simulation, Chinese Sci. Bull., 55, 635–649, https://doi.org/10.1007/s11434-009-0481-z, 2010.
Wang, K., Zhang, Y., Yu, S., Wong, D. C., Pleim, J., Mathur, R., Kelly, J. T., and Bell, M.: A comparative study of two-way and offline coupled WRF v3.4 and CMAQ v5.0.2 over the contiguous US: performance evaluation and impacts of chemistry–meteorology feedbacks on air quality, Geosci. Model Dev., 14, 7189–7221, https://doi.org/10.5194/gmd-14-7189-2021, 2021.
Wang, Z., Zhang, H., and Lu, P.: Improvement of cloud microphysics in the aerosol-climate model BCC_AGCM2.0.1_CUACE/Aero, evaluation against observations, and updated aerosol indirect effect, J. Geophys. Res.-Atmos., 119, 8400–8417, https://doi.org/10.1002/2014JD021886, 2014.
White, B., Gryspeerdt, E., Stier, P., Morrison, H., Thompson, G., and Kipling, Z.: Uncertainty from the choice of microphysics scheme in convection-permitting models significantly exceeds aerosol effects, Atmos. Chem. Phys., 17, 12145–12175, https://doi.org/10.5194/acp-17-12145-2017, 2017.
Wong, D. C., Pleim, J., Mathur, R., Binkowski, F., Otte, T., Gilliam, R., Pouliot, G., Xiu, A., Young, J. O., and Kang, D.: WRF-CMAQ two-way coupled system with aerosol feedback: software development and preliminary results, Geosci. Model Dev., 5, 299–312, https://doi.org/10.5194/gmd-5-299-2012, 2012.
Xu, X., Lu, C., Liu, Y., Luo, S., Zhou, X., Endo, S., Zhu, L., and Wang, Y.: Influences of an entrainment–mixing parameterization on numerical simulations of cumulus and stratocumulus clouds, Atmos. Chem. Phys., 22, 5459–5475, https://doi.org/10.5194/acp-22-5459-2022, 2022.
Zhang, B., Wang, Y., and Hao, J.: Simulating aerosol–radiation–cloud feedbacks on meteorology and air quality over eastern China under severe haze conditionsin winter, Atmos. Chem. Phys., 15, 2387–2404, https://doi.org/10.5194/acp-15-2387-2015, 2015.
Zhang, R. H. and Shen, X.: On the development of the GRAPES – A new generation of the national operational NWP system in China, Chinese Sci. Bull., 53, 3429–3432, 2008.
Zhang, Y., Wen, X. Y., and Jang, C. J.: Simulating chemistry–aerosol–cloud–radiation–climate feedbacks over the continental U.S. using the online-coupled Weather Research Forecasting Model with chemistry (WRF/Chem), Atmos. Environ., 44, 3568–3582, https://doi.org/10.1016/j.atmosenv.2010.05.056, 2010.
Zhao, B., Liou, K.-N., Gu, Y., Li, Q., Jiang, J. H., Su, H., He, C., Tseng, H.-L. R., Wang, S., Liu, R., Qi, L., Lee, W.-L., and Hao, J.: Enhanced PM2.5 pollution in China due to aerosol-cloud interactions, Sci. Rep.-UK, 7, 4453, https://doi.org/10.1038/s41598-017-04096-8, 2017.
Zheng, B., Tong, D., Li, M., Liu, F., Hong, C., Geng, G., Li, H., Li, X., Peng, L., Qi, J., Yan, L., Zhang, Y., Zhao, H., Zheng, Y., He, K., and Zhang, Q.: Trends in China's anthropogenic emissions since 2010 as the consequence of clean air actions, Atmos. Chem. Phys., 18, 14095–14111, https://doi.org/10.5194/acp-18-14095-2018, 2018.
Zheng, G., Wang, Y., Aiken, A. C., Gallo, F., Jensen, M. P., Kollias, P., Kuang, C., Luke, E., Springston, S., Uin, J., Wood, R., and Wang, J.: Marine boundary layer aerosol in the eastern North Atlantic: seasonal variations and key controlling processes, Atmos. Chem. Phys., 18, 17615–17635, https://doi.org/10.5194/acp-18-17615-2018, 2018.
Zhou, C.-H., Gong, S., Zhang, X.-Y., Liu, H.-L., Xue, M., Cao, G.-L., An, X.-Q., Che, H.-Z., Zhang, Y.-M., and Niu, T.: Towards the improvements of simulating the chemical and optical properties of Chinese aerosols using an online coupled model – CUACE/Aero, Tellus B, 64, 18965, https://doi.org/10.3402/tellusb.v64i0.18965, 2012.
Zhou, C., Zhang, X., Gong, S., Wang, Y., and Xue, M.: Improving aerosol interaction with clouds and precipitation in a regional chemical weather modeling system, Atmos. Chem. Phys., 16, 145–160, https://doi.org/10.5194/acp-16-145-2016, 2016.
Zhou, S., Yang, J., Wang, W.-C., Zhao, C., Gong, D., and Shi, P.: An observational study of the effects of aerosols on diurnal variation of heavy rainfall and associated clouds over Beijing–Tianjin–Hebei, Atmos. Chem. Phys., 20, 5211–5229, https://doi.org/10.5194/acp-20-5211-2020, 2020.