the Creative Commons Attribution 4.0 License.
the Creative Commons Attribution 4.0 License.
 | 01 Feb 2022
Mapping gaseous dimethylamine, trimethylamine, ammonia, and their particulate counterparts in marine atmospheres of China’s marginal seas – Part 2: Spatiotemporal heterogeneity, causes, and hypothesis
Yating Gao
Dihui Chen
Yanjie Shen
Huiwang Gao
Xiaohong Yao
Spatiotemporal heterogeneities in the concentrations of alkaline gases and their particulate counterparts in the marine atmosphere over China's marginal seas were investigated in terms of causes and chemical conversion during two winter cruise campaigns, using semi-continuous measurements made by an onboard URG-9000D Ambient Ion Monitor-Ion Chromatograph (AIM-IC, Thermo Fisher). During the cruise campaign over the East China Sea from 27 December 2019 to 6 January 2020, the concentrations of gas-phase atmospheric trimethylamine (TMAgas) varied by approximately 1 order of magnitude, with an average (± standard deviation) of 0.10±0.04 µg m−3 corresponding to a mixing ratio of 26±17 pptv. Corresponding mean values were 0.037±0.011 µg m−3 (14±5 pptv in mixing ratio) over the Yellow Sea during the period from 7 to 16 January 2020 and 0.031±0.009 µg m−3 (12±4 pptv in mixing ratio) over the Yellow Sea and Bohai Sea from 9 to 22 December 2019. By contrast, the simultaneously observed concentrations of TMA in PM2.5, detected as TMAH+, over the East China Sea were 0.098±0.069 µg m−3 and substantially smaller than the 0.28±0.18 µg m−3 observed over the Yellow Sea and Bohai Sea from 9 to 22 December 2019. A significant correlation between TMAgas and particulate TMAH+ was observed over the East China Sea, but no correlation was found over the Yellow Sea and Bohai Sea. Proportional or disproportional variations in concentrations of TMAgas with particulate TMAH+ over the sea zones were probably attributed to the difference in the enrichment of TMAH+ in the sea surface microlayer. In addition, spatiotemporal heterogeneities in concentrations of atmospheric ammonia (NH3gas), atmospheric dimethylamine (DMAgas), and DMA in PM2.5, detected as DMAH+, were investigated. Case analyses were performed to illustrate the formation and chemical conversion of particulate aminium ions in marine aerosols. Finally, we hypothesized the release of basic gases and particulate counterparts from the ocean to the atmosphere, together with the secondary formation of DMAH+ and chemical conversion of TMAH+, in the marine atmosphere.
- Article
(3054 KB) - Full-text XML
-
Supplement
(6246 KB) - BibTeX
- EndNote


In the marine atmosphere, gaseous ammonia (NH3gas) and amines, including trimethylamine (TMAgas) and dimethylamine (DMAgas), are unique alkaline gases that play an important role in neutralizing acids (Gibb et al., 1999; Johnson et al., 2007, 2008; Ge et al., 2011; Carpenter et al., 2012; Yu and Luo, 2014; Paulot et al., 2015; Wentworth et al., 2016; Chen et al., 2016; Köllner et al., 2017; van Pinxteren et al., 2019; Perraud et al., 2020). The release of NH3gas from the ocean into the atmosphere is determined mainly by NH concentrations in bulk seawater, surface seawater temperature, and pH of surface seawater (Johnson et al., 2007, 2008; Carpenter et al., 2012). Biochemical origins of TMA and DMA in marine atmospheres have been well documented with these amines to be released from the degradation of glycine betaine (GBT) and trimethylamine N-oxide (TMAO), which help marine organisms resist the salinity fluctuations (Lidbury et al., 2014, 2015). As organic alkali, TMA and DMA can be dissolved in water as well as liquid organics. In addition to the aforementioned factors, the release of TMAgas and DMAgas from the ocean to the atmosphere may also be affected by the sea surface microlayer (SML) because of the enrichment of TMA and DMA therein (van Pinxteren et al., 2019). In addition, TMA and DMA in bulk seawater theoretically undergo protonation as TMAH+ and DMAH+. However, whether the amines enriched in the SML undergo protonation remains unclear. The differences between inorganic and organic alkali cause different spatiotemporal variations in sea-derived emissions and concentrations of NH3gas from TMAgas and DMAgas, generating a large spatiotemporal heterogeneity in the molar ratios of TMAgas (DMAgas) to NH3gas in various marine atmospheres (Gibb et al., 1999). In exploring spatiotemporal heterogeneity and its causes, high-time-resolution observational data are required.
Two additional factors can also complicate the spatiotemporal heterogeneity of the ratios in marine atmospheres. First, decay of phytoplankton blooms on the surface and subsurface seawater may lead to the accumulation of NH therein (Johnson et al., 2007, 2008; Liu et al., 2013). However, NH is an important nutrient that can be rapidly reused by phytoplankton in seawater (Velthuis et al., 2017; Zhang et al., 2019a, b). Reuse of aminium ions by phytoplankton is theoretically possible but, according to our review of the literature, has not been investigated. Two scenarios can be hypothesized: (a) the reuse of aminium ions by phytoplankton as quickly as that of NH and (b) slow reuse of aminium ions by phytoplankton. Second, TMA and DMA may further biochemically decompose into small molecules (Hu et al., 2015, 2018; Lidbury et al., 2014, 2015; Xie et al., 2018). These two factors would alter the ratios of TMAgas (DMAgas) to NH3gas in oceanic emissions in opposite directions.
Unlike the release of alkaline gases, the release of primary particulate aminium aerosols from the ocean should be behaviorally similar to that of sea spray organic aerosols and be strongly affected by the SML (Quinn et al., 2015; Hu et al., 2018; Dall'Osto et al., 2019). In addition to primary emissions, secondary reactions have been reported as important sources of particulate aminium aerosols in the marine atmosphere (Facchini et al., 2008; Müller et al., 2009; Xie et al., 2018; Hu et al., 2015, 2018; Köllner et al., 2017; Dall'Osto et al., 2019; Zhou et al., 2019). However, it is challenging to robustly identify primary aminium aerosols from secondary aminium aerosols in the marine atmosphere. Moreover, what remains poorly understood is whether the detected particulate aminium ions by ion chromatography, or particulate amines by mass spectrum, exist in the organic phase, aqueous phase, or mixed phase in the marine atmosphere (Ault et al., 2013; Prather et al., 2013; Pankow, 2015; Xie et al., 2018).
In a companion paper (Chen et al., 2021), we focused on identifying sea-derived alkaline gases and particulate counterparts in PM2.5 during a winter cruise campaign over the Yellow Sea and Bohai Sea, determined by an onboard URG-9000D Ambient Ion Monitor-Ion Chromatograph (AIM-IC, Thermo Fisher). In this study, we focused on investigating the spatiotemporal heterogeneity of concentrations of NH3gas, TMAgas, and DMAgas, together with their particulate counterparts in marine atmospheres, by comparing observations during two winter cruise campaigns over the Yellow Sea, Bohai Sea, and East China Sea. Moreover, previously reported episodic concentrations of particulate TMAH+ and DMAH+ observed in the marine atmosphere over the Yellow Sea were also included to deepen the understanding of size distributions of aminium ions, the ratio of aminium ions to NH, and related primary or secondary origins of particulate aminium ions. Building on the analysis results, a hypothesis is presented to illustrate the release of gaseous alkali and their counterparts from the ocean to the atmosphere and related chemical conversions in the marine atmosphere.
From 27 December 2019 to 17 January 2020, a round cruise survey, focusing on air–sea exchanges of greenhouse gases and short-lived reactive gases, was conducted in China over the East China Sea and Yellow Sea using the R/V Dongfanghong-3. The cruise routes during the campaign and immediately before are shown in Fig. S1a, b. The cruise campaigns from 9 to 22 December 2019 and from 27 December 2019 to 17 January 2020 are here referred to as Campaigns A and B, respectively. Details on the measurements during Campaign B were the same as those reported in the companion paper: the onboard AIM-IC was housed in air-conditioned containers and semi-continuously measured the hourly average concentrations of gaseous species of interest and particulate counterparts in PM2.5. The limits of detection of NH, DMAH+, and TMAH+ in the atmosphere were 0.0004, 0.004, and 0.002 µg m−3, respectively. In Campaign B, no K+ contamination occurred in the channel used to determine gaseous species, and the concentrations of DMAgas and TMAgas could be determined (Fig. 1a). However, strong K+ contamination unexpectedly occurred in the channel used to determine particulate species from 7 January 2020, leading to no data for DMAH+ and TMAH+ in PM2.5 after that date (Fig. 1b). However, concentrations of NH and other ions, excluding K+, were not affected because their residence time in the ion chromatograph was far from that of K+. Note that monomethylamine cannot be detected by AIM-IC by using the analytical column CS17A (2×250 mm) in this study. Concentrations of triethylamine were generally undetectable; therefore, the data were not analyzed here. No biogenic origin in marine environments has been reported for diethylamine, although it may be detected as TMAH+ by AIM-IC. In 2021, we tried a new analytical column CS20 (2×250 mm) to analyze amines, including diethylamine, and the unpublished data confirmed its concentration to be negligible relative to TMAH+ in the marine atmosphere of the marginal seas of China.
The AIM-IC expectedly encountered terminations several times during Campaign B. This is quite normal for most online analyzers after operating for 2 weeks on a swaying research vessel, especially when the cruise frequently encounters strong winds. Considering that strong winds substantially increase air–sea exchange fluxes, all the instruments were operated to continuously capture the signals. After restarting the AIM-IC, it always reported a few abnormally high values in the first 3–5 h because of residuals in the system. Abnormal values were excluded from the analysis. Moreover, 24 h air mass backward trajectories at 100, 500, and 1000 m above sea level were calculated using the National Oceanic and Atmospheric Administration Air Resources Laboratory's Hybrid Single-Particle Lagrangian Integrated Trajectory model (HYSPLIT; https://ready.arl.noaa.gov/HYSPLIT.php, last access: 23 December 2021).
In addition, observations made over the Yellow Sea from 2 to 21 May 2012 were included to facilitate analyses. These data were reported in our previous study (Hu et al., 2015), in which the total concentrations of TMAH+ in three size-segregated atmospheric particle samples were also found to reach a high level of ∼1 µg m−3. Notably, high concentrations of particulate TMAH+ were not observed in marine atmospheres during additional multiple cruise campaigns from the marginal seas of China to the northwestern Pacific Ocean (Xie et al., 2018; Hu et al., 2018; Zhu et al., 2019). In the study reported by Hu et al. (2015), a low-volume Anderson cascade impactor (AN-200; Sibata Co., Inc., Japan) was employed to collect atmospheric particles with 50 % aerodynamic cut-off diameters of 11, 7.0, 4.7, 3.3, 2.1, 1.1, 0.65, and 0.43 µm. Details of the sampling and chemical analyses can be found in Hu et al. (2015). The cruise campaign was referred to as Campaign C in this study, and the sea zones collected from the three aerosol samples are shown in Fig. S1c.
3.1 Spatiotemporal variations in concentrations of alkaline gases over the East China Sea and Yellow Sea
Table 1Information on the three campaigns and concentrations of TMAgas and DMAgas and their particulate partners in PM2.5 (average ± standard deviation).
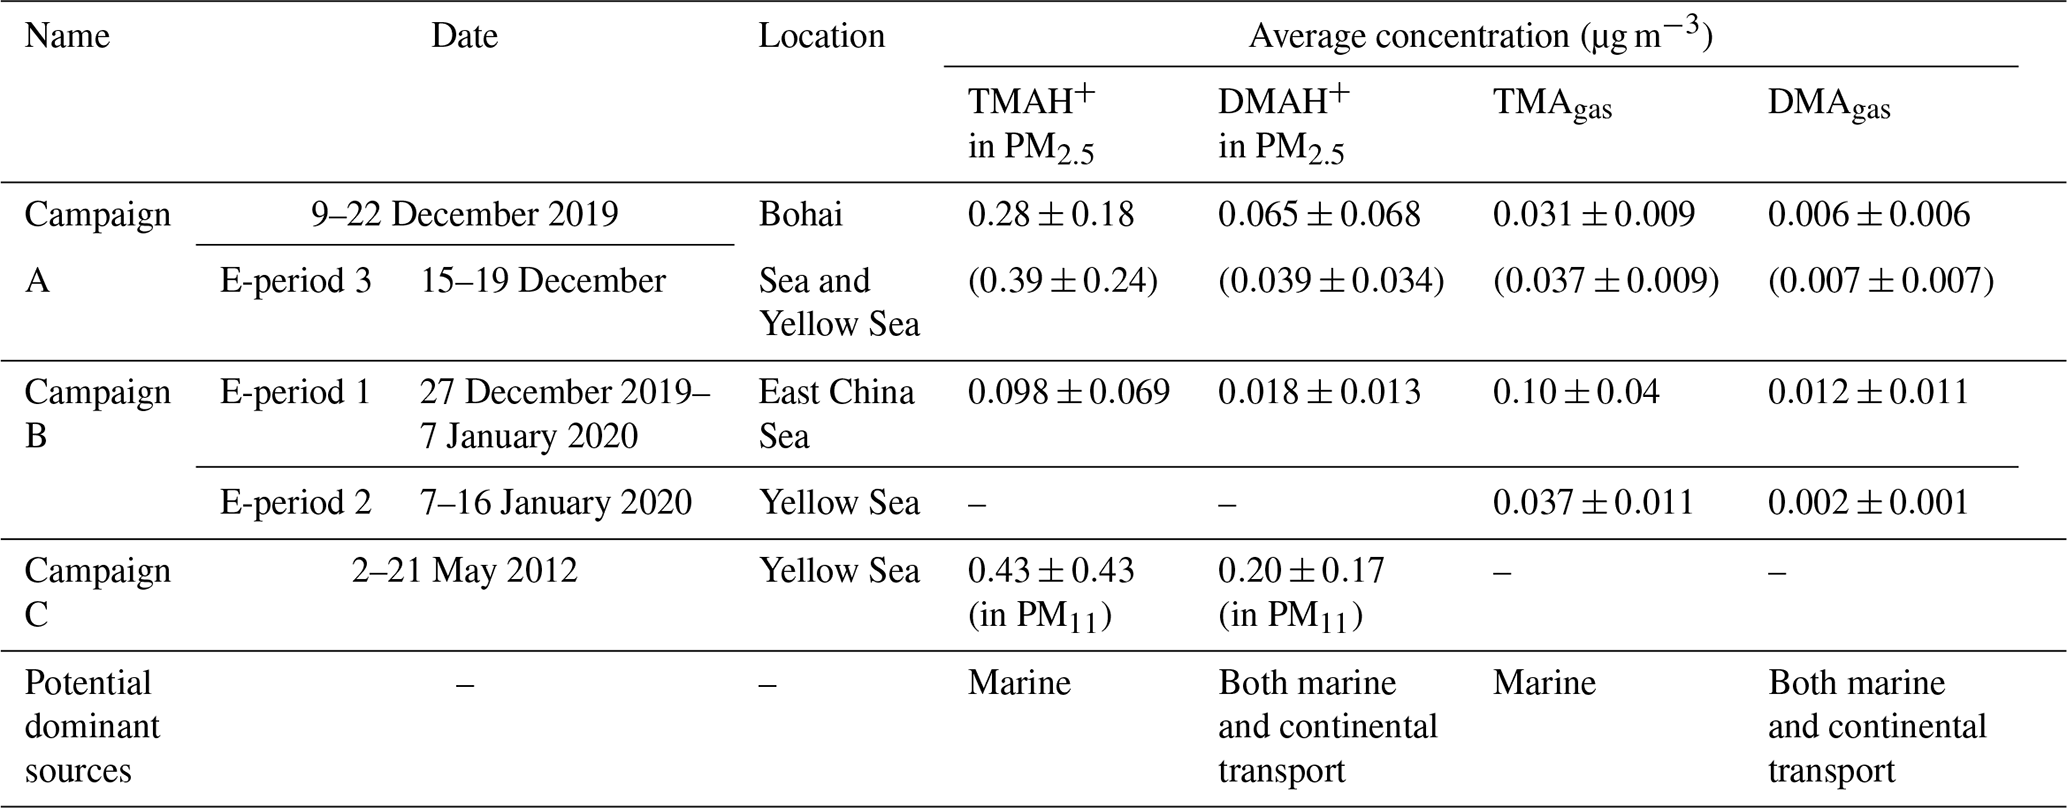
Figure 1a, b show spatiotemporal variations in concentrations of TMAgas, DMAgas, and NH3gas and their counterparts in PM2.5 during Campaign B (note that the corresponding mass concentrations of PM2.5 were not available in this study), and Table 1 summarizes the observational results during the three campaigns. The corresponding wind speeds and directions are shown in Fig. 1c. Some concentrations of TMAgas, particulate TMAH+, and wind fields are mapped in Fig. 1d–f. Concentrations of TMAgas ranged from 0.022 µg m−3 (8 pptv in mixing ratio) to 0.22 µg m−3 (91 pptv in mixing ratio) over the East China Sea from 27 December 2019 to 6 January 2020. Corresponding average values were 0.10±0.04 µg m−3 (26±17 pptv in mixing ratio).

Figure 1Time series and maps of basic gases and particulate counterparts in concentration and meteorological parameters during the cruise campaign from 27 December 2019 to 17 January 2020: time series of TMAgas, DMAgas, and NH3gas (a); time series of TMAH+, DMAH+, and NH in PM2.5 (b); time series of wind speed and wind directions (c); map of TMAgas (d); map of TMAH+ (e); map of wind fields (f); not all data were shown in (d–f) to avoid clustering.
TMAgas values largely decreased to 0.037±0.011 µg m−3 (14±5 pptv in mixing ratio) over the Yellow Sea from 7 to 16 January 2020. The latter concentrations were comparable to those of 0.031±0.009 µg m−3 (12±4 pptv in mixing ratio) observed over the Yellow Sea and Bohai Sea during Campaign A (Chen et al., 2021). Based on the evidence provided as follows, long-range continental transport should be a negligible contributor to the observed TMAgas in the marine atmosphere. Alternatively, the observed TMAgas during the period of Campaign B was probably determined by oceanic emissions of TMAgas from the cruise sea zone. This is supported by the following.
First, no increase in TMAgas was detected with several periodically large increases in particulate NH under offshore winds over the Yellow Sea from 7 to 16 January 2020 (Fig. 1a–c). By contrast, higher concentrations of NH were associated with lower values of TMAgas over the East China Sea and vice versa (Fig. 1a, b; the start period of Campaign B). Higher concentrations of NH reflected an increased contribution from continental input because of insufficient SO2 and NOx to form ammonium aerosols. The calculated 24 h air mass backward trajectories at 100, 500, and 1000 m implied that the air masses were derived from the continental atmosphere (Fig. S4a). Moreover, two broad peaks of TMAgas were observed over the East China Sea, approximately 200 km from the continent, under onshore winds (Fig. 1d, f). The calculated trajectories implied that the air masses were derived from the marine atmosphere (Fig. S4b, c, d). Combining the concentrations of TMAgas in the continental atmosphere upwind of the Yellow Sea with these results allowed us to infer that continental transport represents a negligible contribution to the observed TMAgas during Campaign B.
Second, the concentrations of TMAgas in the continental atmosphere upwind of the Yellow Sea during the summer and fall of 2019 remained at a low level of ∼0.002 µg m−3 (Chen et al., 2021) and were over 1 order of magnitude smaller than the values over the Yellow Sea from 7 to 16 January 2020. An even larger difference was observed when the observed concentrations of TMAgas over the East China Sea were compared with continental values. Unfortunately, no recent measurements of TMAgas in the coastal atmosphere upwind of the East China Sea were available for comparison.
Third, a moderately good exponential correlation (TMA; R2=0.76, P<0.01) was observed between the concentrations of TMAgas and ambient air temperature (Fig. 2a). Although the surface seawater temperature was not measured, it could reasonably be approximated from the ambient air temperature (Deng et al., 2014). The exponential correlation suggested that the observed concentrations of TMAgas were probably determined by the temperature-driven oceanic emission of TMAgas in the corresponding sea zones. Across the same ambient temperature ranges, the observed concentrations of TMAgas over the East China Sea (full dots in Fig. 2a) were larger than those over the Yellow Sea (empty dots in Fig. 2a). The regression equation derived was TMA (R2=0.56, P<0.01) when data measured over the Yellow Sea during Campaign B were used alone. We compared the two derived regression equations and could infer that the temperature-driven oceanic emissions of TMAgas over the East China Sea were larger than those over the Yellow Sea. In addition to temperature, the pH of surface seawater and the concentration of TMAH+ in surface seawater may also affect TMAgas emissions (van Pinxteren et al., 2019). Considering approximately constant pH values of 8.0–8.2 in surface seawater across the two sea zones (Lui et al., 2015; Shao et al., 2020), the concentrations of TMAH+ in the surface seawater of the East China Sea were expected to be larger than those over the Yellow Sea during Campaign B. Unfortunately, no direct measurements were made to confirm this.
To enlarge the dataset measured over the Yellow Sea, we included the measurements from 15:00 LT (local time; UTC + 08:00) on 16 December to 01:00 LT on 19 December during Campaign A. During this period in Campaign A, concentrations of TMAgas were higher than those observed during other periods in Campaign A at the same ambient air temperature (Chen et al., 2021). We combined the data during this period with data measured over the Yellow Sea during Campaign B to derive the regression equation, TMA (Fig. S2), which is the same as that derived from the data measured over the Yellow Sea during Campaign B alone. However, R2 slightly decreased to 0.54, with P<0.01. This result further supports the lower temperature-driven oceanic emissions of TMAgas from the Yellow Sea.
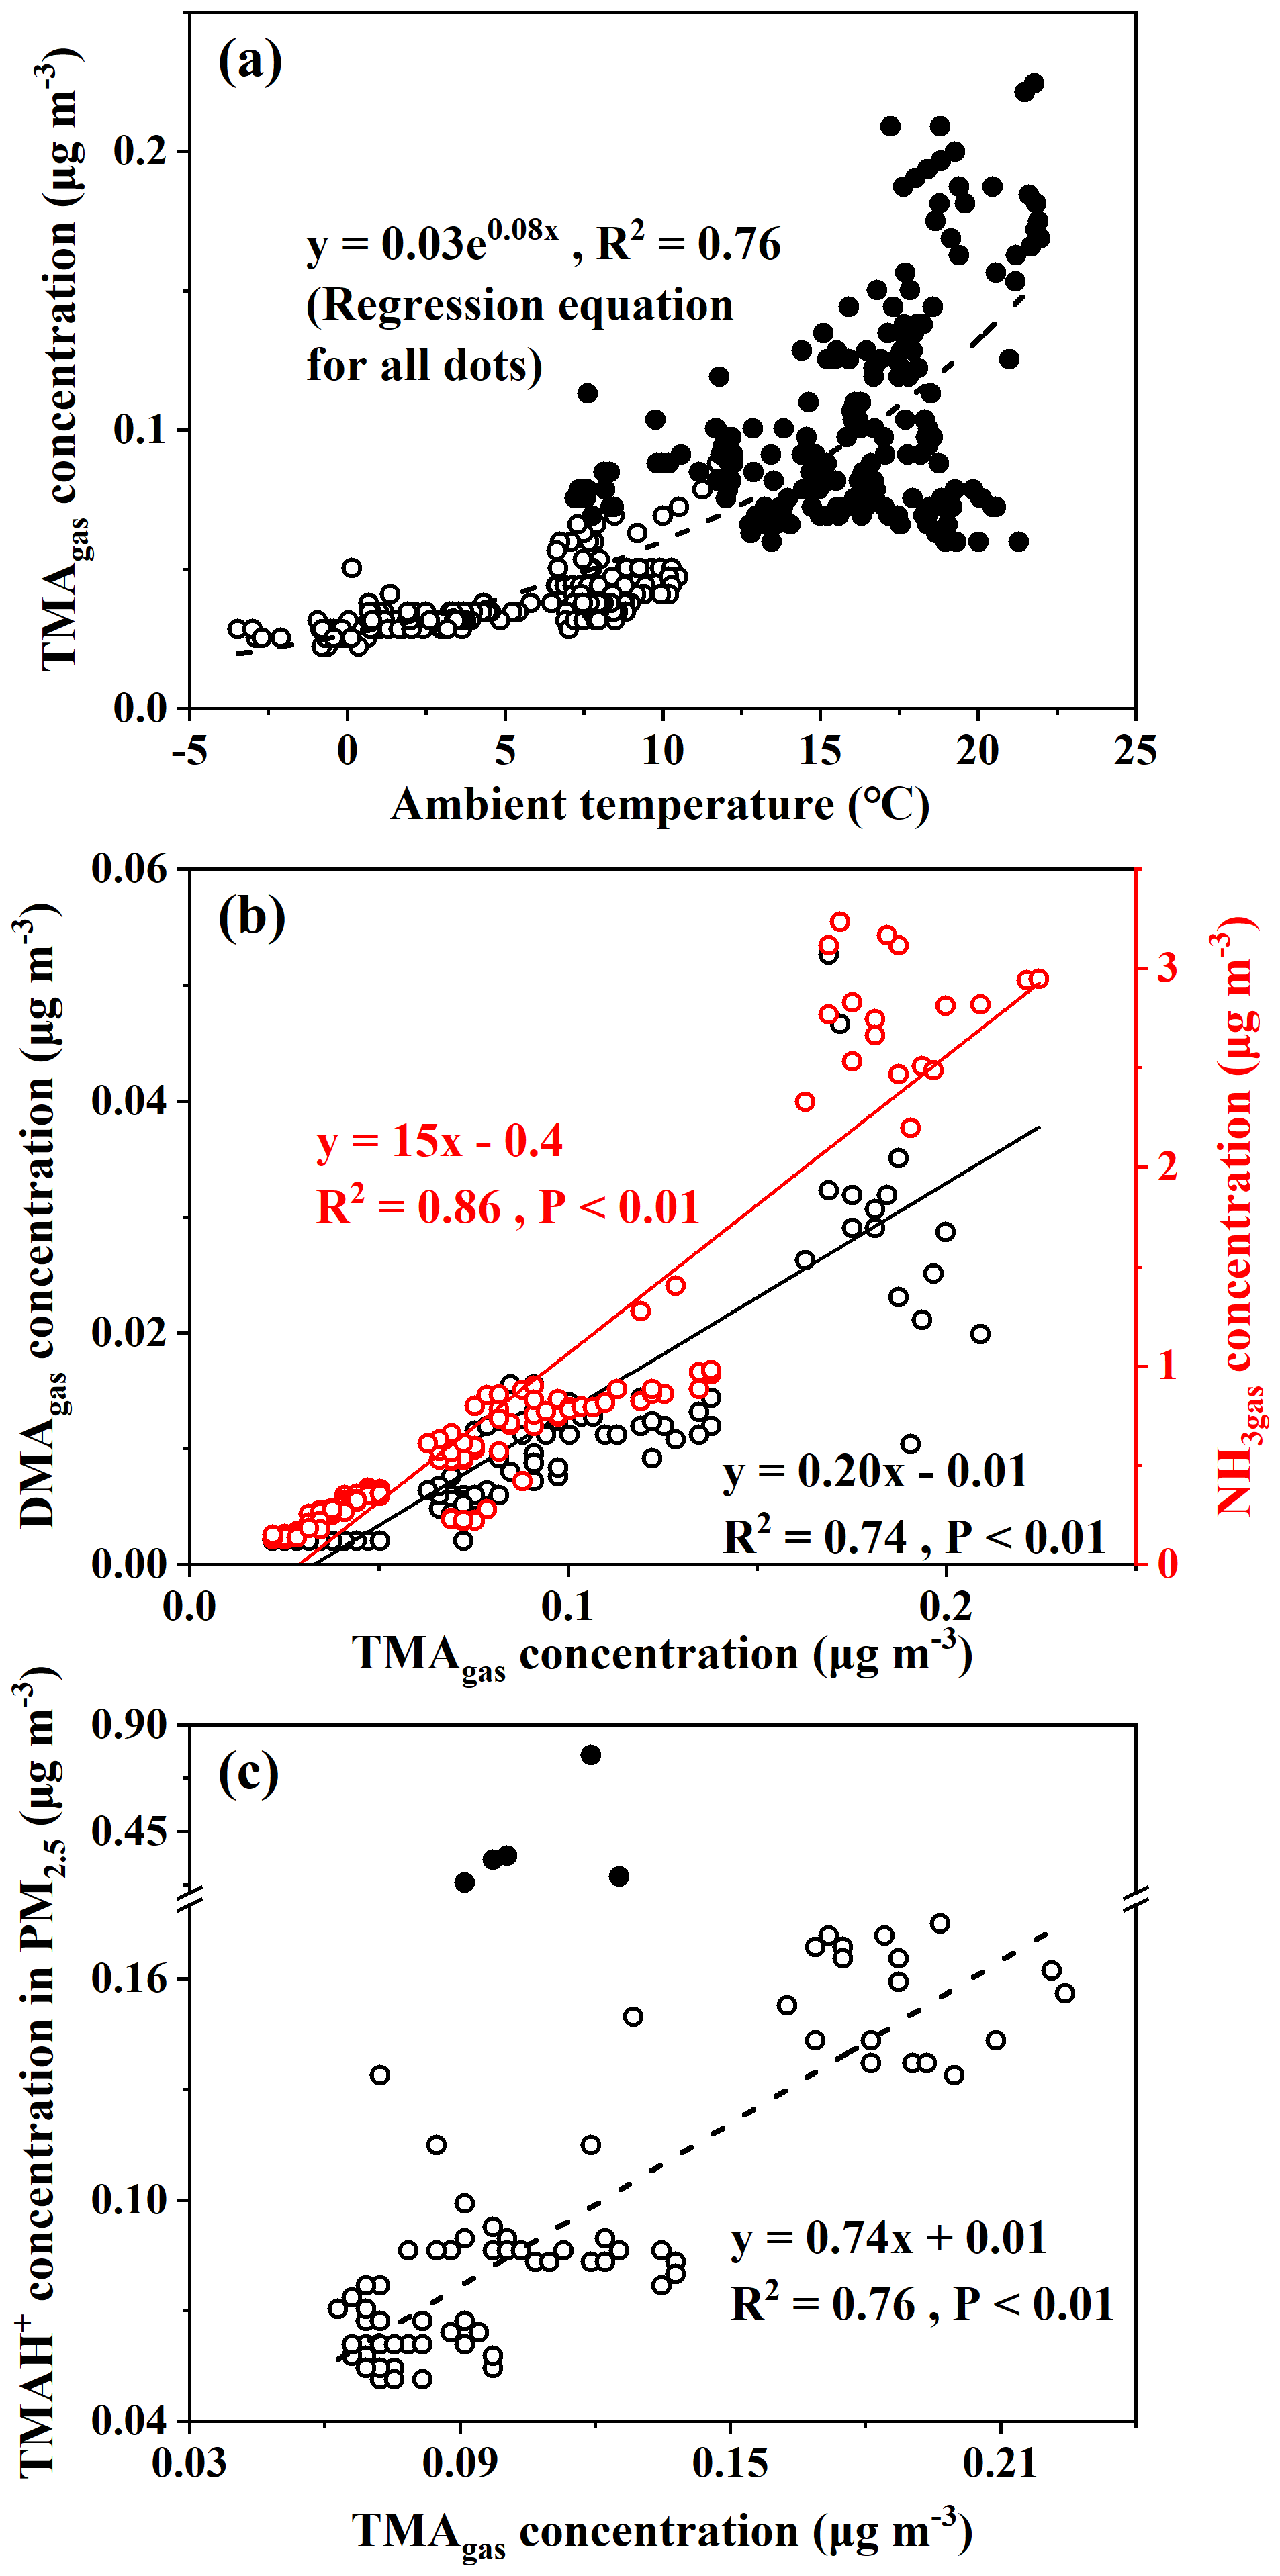
Figure 2Correlations of TMAgas with ambient air temperature, DMAgas, NH3gas, and TMAH+ in PM2.5 with TMAgas (TMAgas vs. ambient air temperature, a; DMAgas and NH3gas vs. TMAgas, b; TMAH+ vs. TMAgas, b; full dots in b represent five episodic concentrations of TMAH+ and were excluded for correlation analysis).
Spatiotemporal variations in concentrations of DMAgas and NH3gas were similar to those of TMAgas during Campaign B. For example, concentrations of DMAgas and NH3gas varied, 0.012±0.011 and 1.1±0.76 µg m−3, respectively, over the East China Sea. However, they largely decreased to 0.002±0.001 and 0.24±0.08 µg m−3, respectively, over the Yellow Sea. In addition, concentrations of DMAgas and NH3gas had moderately good and good correlations with those of TMAgas (Fig. 2b), respectively, that is, DMA, R2=0.74, P<0.01, NH, R2=0.86, and P<0.01. The correlations suggested that the observed DMAgas and NH3gas were also generally derived from marine emissions simultaneously with TMAgas. Thus, we concluded that the seas were the net sources of DMAgas and NH3gas during the study. Note that the residence time of NH3gas is substantially shorter than that of NH aerosols (Yao and Zhang, 2013), and less long-range transport of NH3gas is expected than NH aerosols. In addition, the observed ratios of TMAgas to NH3gas ranged from 0.01 to 0.10, with an average value of 0.04±0.01, which were 2 orders of magnitude larger than those that have been reported in marine atmospheres and adopted for modeling (Van Neste et al., 1987; Gibb et al., 1999; Yu and Luo, 2014). To the best of our knowledge, no recent measurements of TMAgas and NH3gas in a marine atmosphere have been recently reported in the literature. Zheng et al. (2015) measured the concentrations of TMAgas and NH3gas in the continental atmosphere in Nanjing, China. The ratio of TMAgas to NH3gas was approximately . However, the observed ratios of DMAgas to NH3gas were reasonably comparable to previously reported values (Yu and Luo, 2014).
3.2 Spatiotemporal variations in concentrations of particulate TMAH+, DMAH+, and NH over the East China Sea
Concentrations of TMAH+ in PM2.5 varied by approximately 0.098±0.069 µg m−3 over the East China Sea, but no data could be obtained over the Yellow Sea during the cruise because of K+ contamination. Almost all values were smaller than 0.2 µg m−3, except five episodic values of 0.26 µg m−3 at 10:00 LT on 29 December 2019, 0.23 and 0.35 µg m−3 at 22:00–23:59 LT on 3 January, and 0.33 and 0.77 µg m−3 at 05:00–06:59 LT on 4 January 2020 (Fig. 1b). Concentrations of TMAH+ exhibited a moderately good correlation with those of TMAgas simultaneously observed over the East China Sea when the five episodes with concentrations of TMAH+ in PM2.5 exceeding 0.2 µg m−3 were excluded from the correlation (Fig. 2c), suggesting that the TMAH+ in PM2.5 may also be derived from marine sources. In addition, a broad peak of TMAH+ concentrations (PeakTMAH−1 shadowing in Fig. 1b) was observed from 27 to 30 December 2019, when a negative correlation existed between the concentrations of TMAH+ and NH, with R2=0.35 and P<0.01. The negative correlation also supported the conclusion that increased concentrations of TMAH+ in PM2.5 were driven by enhanced marine emissions rather than continental transport.
The large increases in concentrations of particulate NH, for example, when its concentrations exceed 5 µg m−3 under offshore winds, clearly indicated the continental transport of air pollutants (Figs. 1bc, S1a). However, when its concentration was below 1 µg m−3, a significant correlation between particulate NH and TMAH+ was apparent, with P<0.01 (empty dots in Fig. 3a). When five points with concentrations of particulate TMAH+ exceeding 0.2 µg m−3 were included in the correlation analysis (full dots in Fig. 3a), R2 increased to 0.62. Thus, primary sea-derived particulate NH could not be excluded from the marine atmosphere over the East China Sea. On the basis of the regression equation shown in Fig. 3a, the estimated primary sea-derived particulate NH should be smaller than 0.48 µg m−3 under concentrations of particulate TMAH+ below 0.2 µg m−3. Altieri et al. (2014) used isotopic data and identified a marine ammonium source in rainwater in Bermuda, but they did not specify whether marine ammonium was derived from primary particulate emissions.
Concentrations of DMAH+ in PM2.5 varied around 0.018±0.013 µg m−3 over the East China Sea. The average value was only one-fifth that of TMAH+ in PM2.5, but it was almost double that of the DMAgas simultaneously observed. The average value of DMAH+ in PM2.5 was also approximately one-third the value observed over the Yellow Sea and Bohai Sea on 9–22 December (0.065±0.068 µg m−3) (Chen at al., 2021). Positive correlations between DMAH+ and NH were demonstrated, with P<0.01, but the R2 value was 0.17 (all dots in Fig. 3b). However, when NH concentrations exceeded 5 µg m−3, there was a good correlation between DMAH+ and NH ([DMAH+] , R2=0.80, P<0.01) (full dots in Fig. 3b). When NH concentrations were in the range of 2–4 µg m−3 (half-full dots in Fig. 3b), a moderately good correlation of DMAH+ existed with NH, R2=0.71, P<0.01), when one outlier was omitted. The good and moderately good correlations, together with the negative intercepts in the regression equations, suggested a dominant contribution from continental transport to the observed DMAH+ when NH concentrations exceeded 2 µg m−3, except for the outlier. However, it is still unclear what caused the outlier.
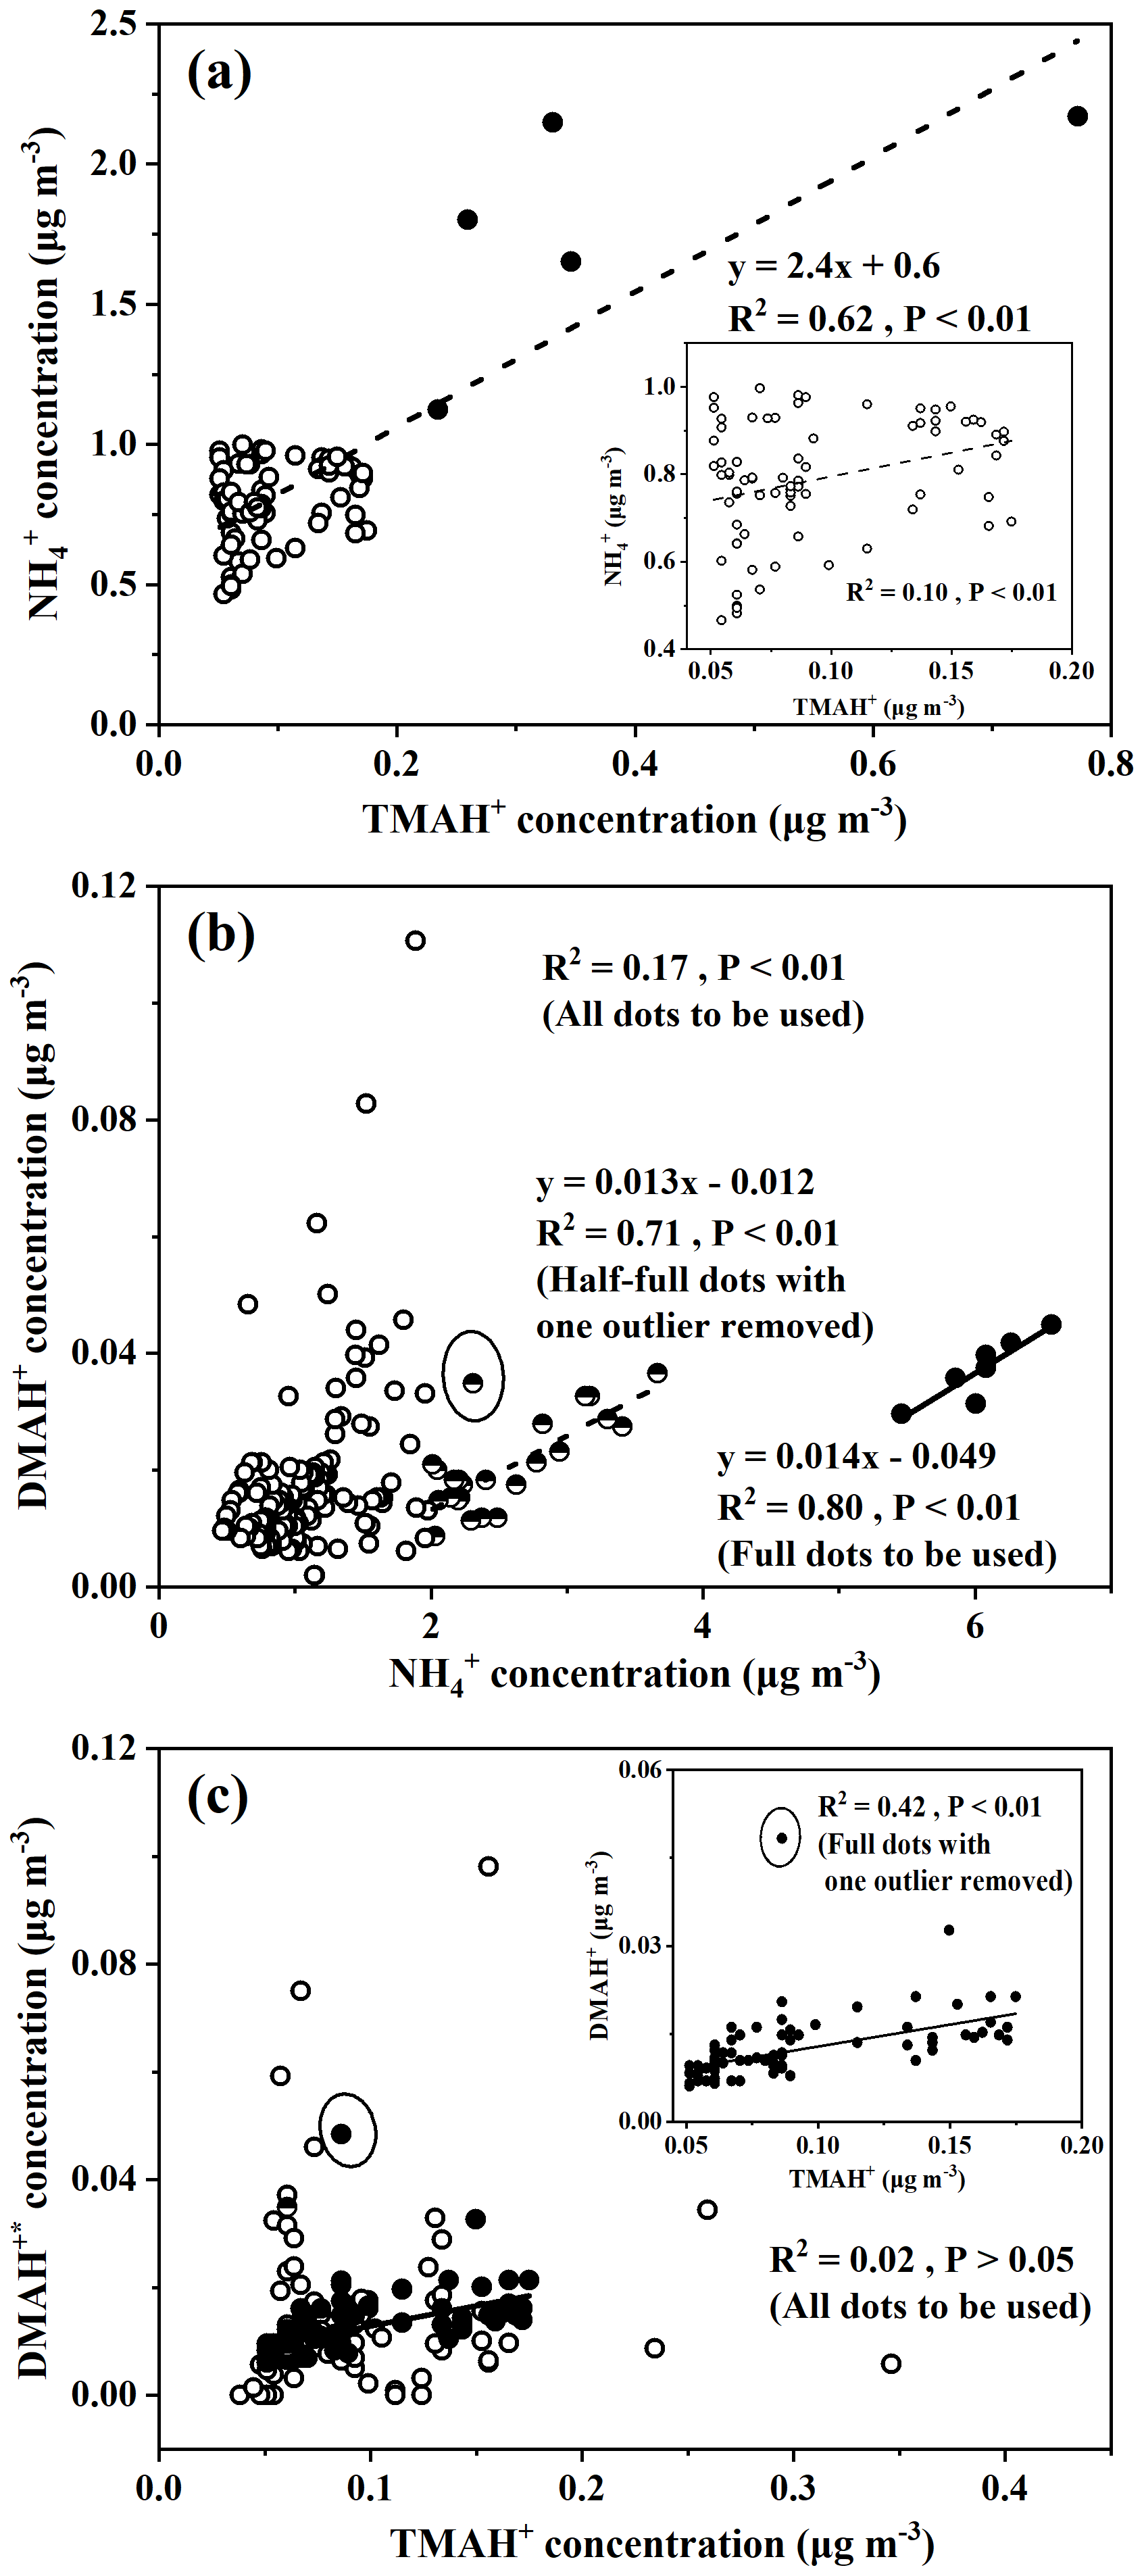
Figure 3Correlations between concentrations of ions in PM2.5: (a) NH vs. TMAH+ and the samples when [NH] <1 µg m−3 in the inner frame; (b) DMAH vs. NH; (c) DMAH vs. TMAH+ and the samples when [NH] <1 µg m−3 in the inner frame. DMAH was defined in the text; full, half-full, and empty dots in (a), (b), and (c) are defined in the text.
When the regression equation of [DMAH+] , with the concentrations of NH ranging from 1 to 2 µg m−3 as input, was used to estimate the concentrations of DMAH+ from continental transport, the estimated concentrations accounted for 33±27 % of the observed values. The sea-derived DMAH+ in PM2.5 was probably the major contributor to the observed values in most cases. In the outlier with a concentration of particulate NH of 2.3 µg m−3 (half-full dots in Fig. 3b), the contribution from continental transport was estimated to be 52 %.
When the concentrations of NH were smaller than 1 µg m−3, the values of continental DMAH+ concentration predicted by the equation [DMAH+] were close to or smaller than zero. Thus, the observed DMAH+ in PM2.5, when NH concentrations were below 1 µg m−3, should be overwhelmed by marine sources. Under these conditions, a significant correlation with a low R2 was obtained between DMAH+ and TMAH+ when one outlier was removed (full dots in Fig. 3c, R2=0.42, P<0.01). Primary emissions of particulate DMAH+ from the East China Sea likely contributed to the observed values to some extent. In four of the five episodic concentrations of particulate TMAH+ ranging from 0.23 to 0.77 µg m−3, the corresponding concentrations of particulate DMAH+ varied from 0.011 to 0.018 µg m−3 and [DMAH+] (R2=0.77). The moderately good correlation supported the presence of primary particulate DMAH+. Note that the outlier is yet to be explained.
3.3 In-depth analysis during three episodes
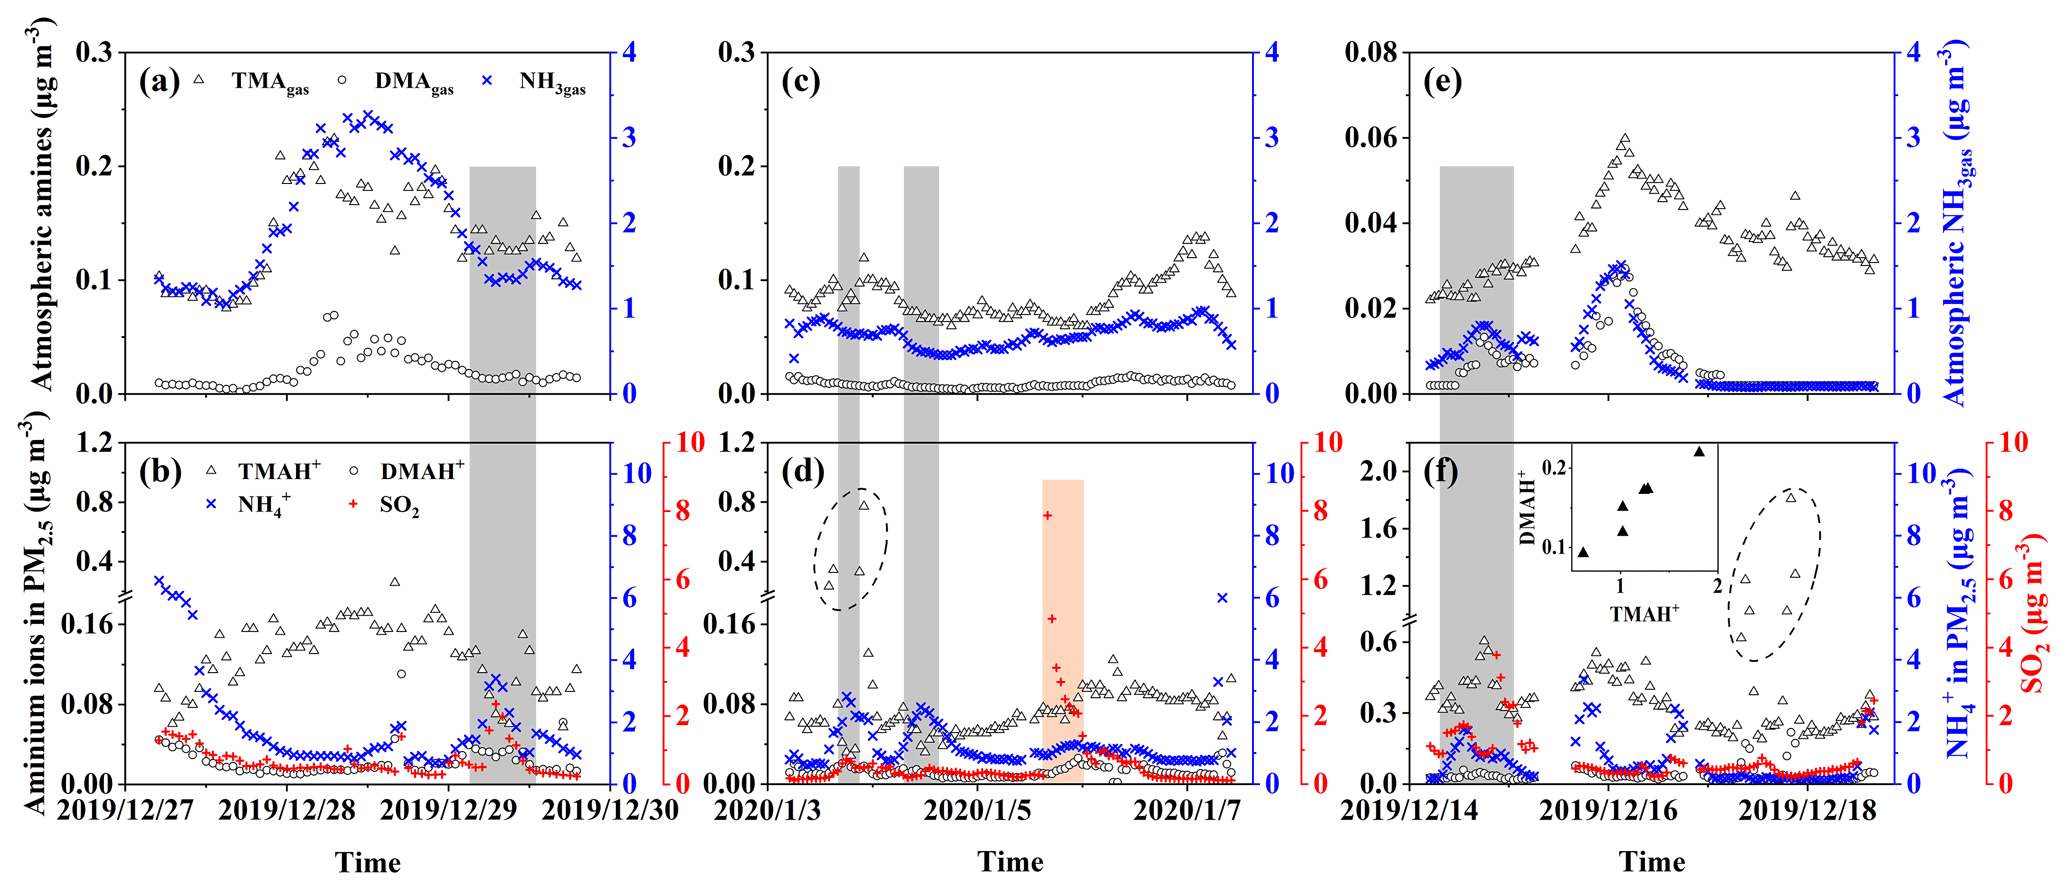
Figure 4Time series of concentrations of gases and particulate ions during three episodes. Basic gases in E-period 1 (a); particulate ions and SO2 in E-period 1 (b); (c) and (d) are the same as (a) and (b) except in E-period 2; (e) and (f) are the same as (a) and (b) except in E-period 3; gray and pink shadowing represents episodes with increasing NH or SO2, respectively; the figure superimposed in (f) shows the correlation between TMAH+ and DMAH+ in six cycling points in (f).
Three episodes were further selected for deeper analyses of the sea-derived alkaline gases and primary particulate counterparts, during which continental transport was likely to have largely decreased. E-period 1 started at 23:00 LT on 27 December and ended at 13:00 LT on 30 December 2019, when increases in concentrations of sea-derived gases and sea-derived primary TMAH+ in PM2.5 were observed over the East China Sea during Campaign B. E-period 2 also occurred in the East China Sea during Campaign B and started at 13:00 LT on 3 January and ended at 18:00 LT on 7 January 2020, when (1) an episodic increase in the sea-derived primary TMAH+ in PM2.5 occurred in the absence of a corresponding increase in TMAgas and (2) an increase in the concentration of sea-derived TMAgas was observed without a corresponding increase in sea-derived primary TMAH+ present in PM2.5. E-period 3 started at 00:00 LT on 15 December and ended at 11:00 LT on 19 December 2019 during Campaign A, when either an increase in the concentration of TMAgas or particulate TMAH+ was observed without a corresponding increase in their counterparts. The feature is similar to that of E-period 2.
Concentrations of TMAH+ in PM2.5 during E-periods 1 and 2 were smaller than those during E-period 3, and the reverse was generally true for concentrations of TMAgas. A similar result can also be obtained from the observations over the East China Sea during Campaign B, in comparison with those measured during Campaign A. For example, the average concentration of TMAH+ in PM2.5 during Campaign A was 0.28 µg m−3 (Chen et al., 2021), approximately 3 times the corresponding average of 0.098 µg m−3 during Campaign B.
Concentrations of TMAgas and TMAH+ in PM2.5 were generally comparable during E-periods 1 and 2. However, concentrations of TMAgas were approximately 1 order of magnitude smaller than those of TMAH+ in PM2.5 during E-period 3. A large difference between TMAgas and particulate TMAH+ was observed over the Yellow Sea and Bohai Sea throughout Campaign A. Several factors, for example, surface seawater temperature, sea surface wind speed, and the concentration of TMAH+ in surface seawater and/or the SML, may cause the disproportion, which is discussed as follows.
As we have analyzed, higher surface seawater temperatures, together with possibly higher concentrations of TMAH+ in surface seawater, probably increased concentrations of TMAgas over the East China Sea relative to those over the Yellow Sea and Bohai Sea. However, these two factors could not explain why concentrations of TMAH+ in PM2.5 over the East China Sea were lower than concentrations over the Yellow Sea and Bohai Sea. The release of sea spray aerosols is generally an exponential function of wind speed (Andreas, 1998; Leeuw et al., 2011; Feng et al., 2017). Thus, sea surface wind speeds were examined. Hourly average wind speeds were 7.3±2.6 m s−1 over the East China Sea during Campaign B, which were not significantly different from those of 7.9±8.1 m s−1 during Campaign A (P>0.05). Moreover, five hourly averages of TMAH+ in PM2.5 exceeded 1 µg m−3 over the Yellow Sea and Bohai Sea when wind speeds reached 12±0.5 m s−1. During the nine hourly average wind speeds exceeding 12 m s−1 during the East China Sea cruise, the corresponding concentrations of TMAH+ in PM2.5 were only 0.08±0.01 µg m−3. Five concentrations of TMAH+ in PM2.5 exceeded 0.2 µg m−3 in Campaign B, and wind speeds ranged from 5.6 to 8.1 m s−1 at those moments. Therefore, wind speeds alone could not explain why the observed concentrations of TMAH+ in PM2.5 over the East China Sea were lower than those over the Yellow Sea and Bohai Sea.
Because the SML affects all mass transfers between the atmosphere and ocean (Cunliffe et al., 2013; Quinn et al., 2015), the release of sea spray aerosols containing TMAH+ should be affected by the abundance of TMAH+ in the SML, in addition to sea surface wind speeds and concentrations of TMAH+ in bulk surface seawater. Combining the aforementioned observations, we argue that TMAH+ may be more highly enriched in the SML than in bulk surface seawater over the Yellow Sea and Bohai Sea during Campaign A under low surface seawater temperatures. Direct measurements of TMAH+ enriched in the SML, as reported by van Pinxteren et al. (2019), are necessary to confirm this hypothesis.
During E-period 1, concentrations of TMAgas and DMAgas exhibited similar spatiotemporal patterns. Concentrations of NH3gas exhibited a spatiotemporal pattern similar to that of gaseous amines during the initial period of increasing concentrations and the late period of decreasing concentrations but not during the transition between early and late periods. Ratios of aminium to ammonium in bulk surface seawater and/or the SML of the corresponding sea zone may vary to some extent and complicate the observational results. Concentrations of particulate TMAH+ exhibited a spatiotemporal pattern similar to that of gaseous amines, while a reverse spatiotemporal pattern was found for concentrations of particulate DMAH+. Primary sea spray aerosols may contain substantially low concentrations of particulate DMAH+, as mentioned above. In addition, a significant decrease in the concentration of particulate TMAH+ was apparent with increasing concentrations of particulate NH and DMAH+ as well as those of SO2 (gray shadowing in Fig. 4a). The unique decrease in particulate TMAH+ also occurred in E-period 2 and E-period 3 (gray and pink shadowing in Fig. 4d, f), regardless of the simultaneous increase or decrease in concentrations of TMAgas. Secondary chemical reactions probably converted particulate TMAH+ to compounds undetectable by AIM-IC.
Unlike during E-period 1, the disproportional release of TMAgas with particulate TMAH+ from the seas probably occurred in E-periods 2 and 3. Moreover, a large increase in the concentration of particulate DMAH+ was observed simultaneously with a large increase in particulate TMAH+ in the six episodes observed over the Yellow Sea (figure superimposed in Fig. 4f). However, only a small increase in particulate DMAH+ was detected for the four episodes observed over the East China Sea (cycled empty triangles in Fig. 4d). This disproportion may also be ascribed to the spatiotemporal heterogeneity of the enrichments of TMAH+ and DMAH+ in the SML.
3.4 Molar ratios of gaseous amines over NH3gas and their particulate counterparts
Dissociation constants (Kb) of TMA and DMA in water were 31 and 4 times that of NH3 • H2O (Ge et al., 2011), respectively. Thus, DMAgas and TMAgas may enable the competitive neutralization of acids by NH3gas in the atmosphere (Almeida et al., 2013; Chen et al., 2016; Yao et al., 2018; Xie et al., 2018). When the values of Kb were used to calculate effective Henry's law constants for DMA (effKDMA), TMA (effKTMA), and NH3 (effKNH3), assuming the activity coefficients to be unity, the ratios of effKDMA effKNH3 and effKTMA effKNH3 were 16 and 0.6, respectively, at an ambient temperature of 298 K under acidic conditions (Ge et al., 2011). We considered the large differences between effKDMA effKNH3 and effKTMA effKNH3 and then separately examined the molar ratios of TMAgas to NH3gas and the ratios of DMAgas to NH3gas. Detailed equations are provided in the Supplement.
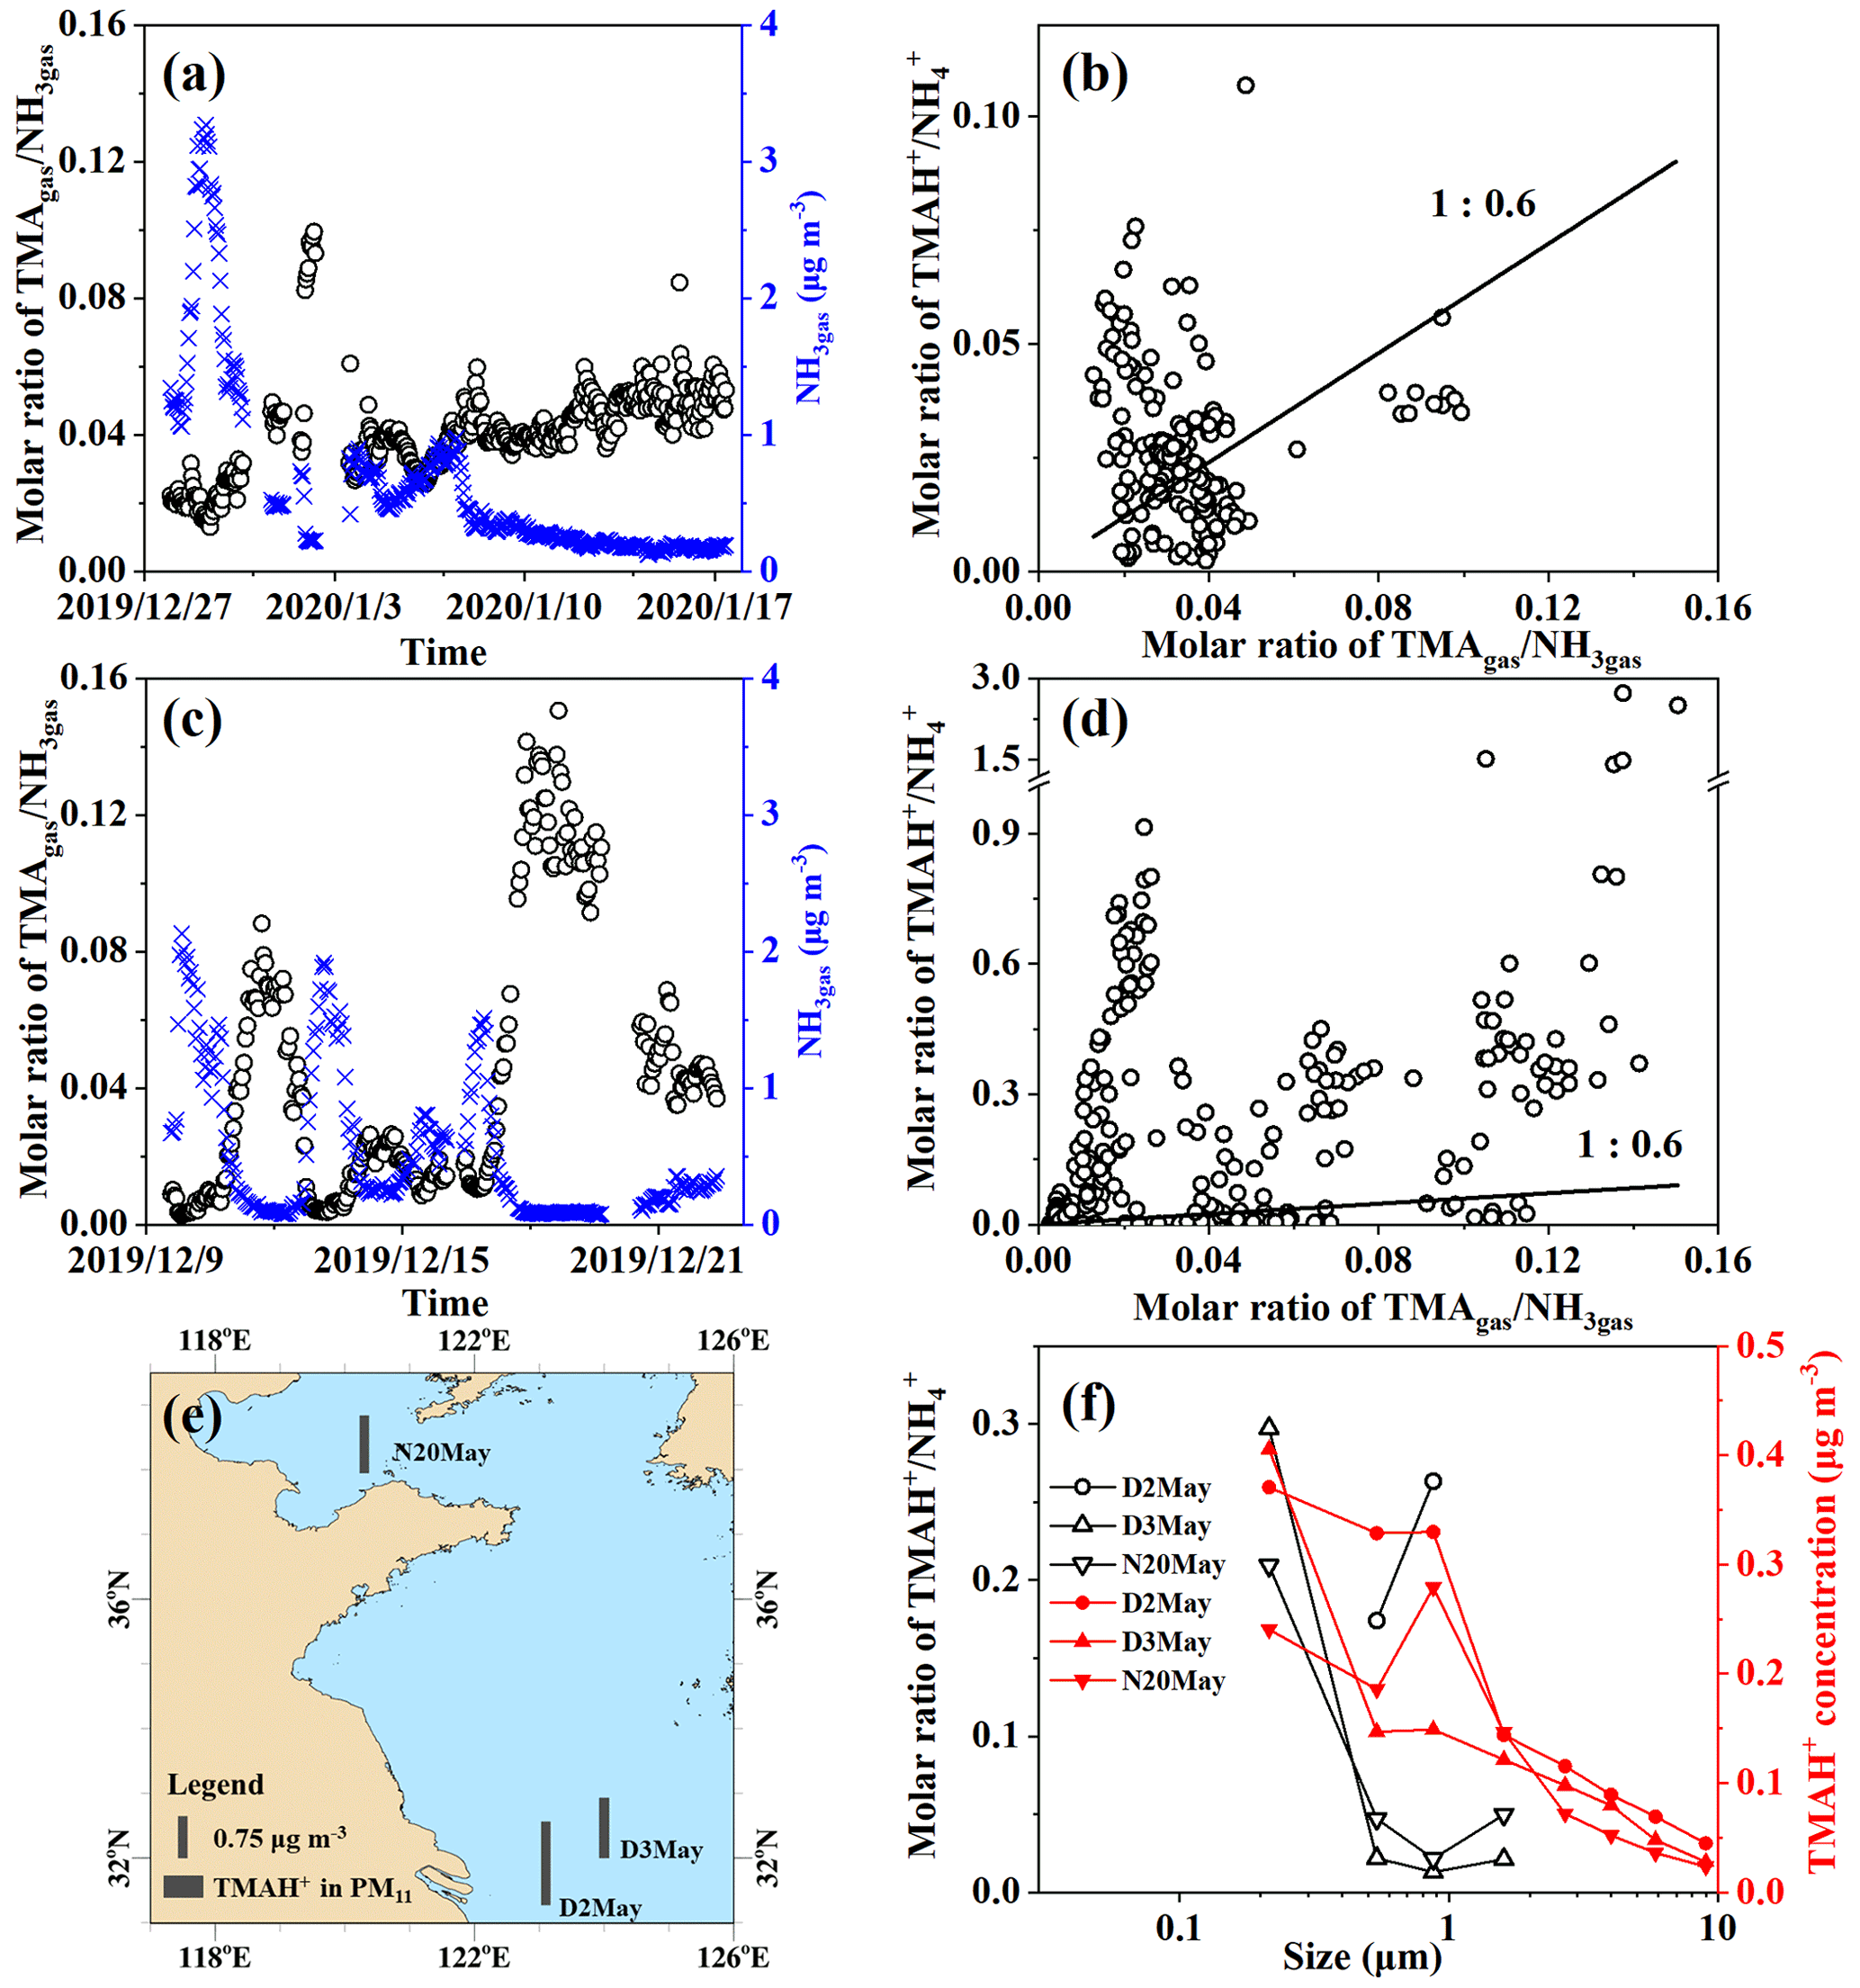
Figure 5Time series of molar ratios of TMAgas NH3gas (a) and (c) in Campaigns B and A; correlation between TMAgas NH3gas and TMAH+ NH (b) and (d) in Campaigns B and A; map of particulate TMAH+ (e) and size distributions of TMAH+ NH and mass concentrations of TMAH+ (f) in Campaign C.
The ratios were first examined during Campaign B, when higher concentrations of TMAgas and DMAgas were observed than those observed during Campaign A. A large spatiotemporal variation in the molar ratio of TMAgas to NH3gas, ranging between 0.013 and 0.10 over the East China Sea, was observed from 27 December 2019 to 7 January 2020 (Fig. 5a). Low ratios of TMAgas to NH3gas with a mean of 0.022±0.004 occurred concurrently with higher concentrations of TMAgas and NH3gas, for example, from 23:00 LT on 27 December 2019 to 13:00 LT on 30 December 2019 (PeakTMA−1 in Fig. 1a). Increased ratios of TMAgas to NH3gas of 0.08–0.10 occurred concurrently with the lowest concentrations of NH3gas, ranging between 0.22 and 0.28 µg m−3 from 22:00 LT on 1 January to 07:00 LT on 2 January 2020. This phenomenon may be related to the reuse of NH by phytoplankton (Liu et al., 2013). In Campaign B over the Yellow Sea from 7 to 17 January 2020, the ratios exhibited a narrow range of 0.034 to 0.064; one outlier of 0.085 was excluded (Fig. 5a).
During Campaign A over the Yellow Sea and Bohai Sea on 9–22 December, the molar ratios of TMAgas to NH3gas ranged from 0.003 to 0.15 (Fig. 5c). The ratios increased during the period from 17:00 LT on 17 December to 16:00 LT on 19 December, with a mean of 0.12±0.014, because of a large decrease in the concentrations of NH3gas (Figs. 5c and 4e). However, smaller ratios in the range of 0.011–0.016 were observed between 20:00 LT on 16 December and 00:00 LT on 17 December in the presence of the strong sea-derived emissions of alkaline gases (Figs. 5c and 4e). These results were consistent with those observed in Campaign B, indicating that the ratios of TMAgas to NH3gas during periods of episodic emission were likely decreased by 0.5 to 1 order of magnitude relative to those during periods of low emission.
The mean molar ratio of TMAH+ to NH in PM2.5 was 0.032±0.019 during Campaign B over the East China Sea, comparable to those of TMAgas to NH3gas (Fig. 5c). When molar ratios of TMAH+ to NH in PM2.5 were plotted against the ratios of TMAgas to NH3gas, data were scattered along the 1:0.6 line. However, no significant correlation was observed between them. The observed particulate TMAH+ may co-exist externally with aerosols containing NH.
During Campaign A, the molar ratios of TMAH+ to NH largely varied with the 25th, 50th, 75th, and 90th percentile values of 0.009, 0.089, 0.35, and 0.56, respectively. As extremes, the 98th–100th percentile values ranged between 1.4 and 2.7 when concentrations of TMAH+ in PM2.5 exceeded 1 µg m−3. When the molar ratios of TMAH+ to NH in PM2.5 were plotted against the ratios of TMAgas to NH3gas (Fig. 5d), no significant correlation was apparent, and most of these data were distributed far above the 1:0.6 line. Laboratory experiments are required to measure the thermodynamic gas–aerosol equilibria in the organic phase to explain these results (Pankow, 2015; Xie et al., 2018). Although the particulate TMA was detected as TMAH+ by AIM-IC, it may not necessarily occur protonated in sea spray organic aerosols.
Measurements of ion concentrations in PM2.5 do not demonstrate the size distributions of the ratios of TMAH+ to NH. Thus, three episodes, with concentrations of total particulate TMAH+ exceeding 1 µg m−3 in atmospheric particles with diameters smaller than 11 µm (PM11) collected over the Yellow Sea in 2012 (Hu et al., 2015), were included in the analysis. The sample collection sea zones are mapped in Fig. 5e. Size distributions of particulate TMAH+ in the mass concentration and molar ratios of TMAH+ to NH are shown in Fig. 5f.
Concentrations of TMAH+ generally increased from the bin size of 7.0–11 µm to that of <0.43 µm (Fig. 1f), which were totally different from those of NH, which peaked at 0.65–1.1 µm (figure was superimposed in Fig. S1c). The unique size distributions of particulate TMAH+ also implied that the observed TMAH+ was overwhelmingly derived from primary sea spray organic aerosols, based on laboratory experimental results and field measurements (Ault et al., 2013; Prather et al., 2013; Hu et al., 2015, 2018; Quinn et al., 2015). Notably, the mass concentration size distribution patterns of particulate TMAH+ were reported to be similar to those of NH when secondary-formed particulate TMAH+ dominated the primary particulate TMAH+ (Hu et al., 2018; Xie et al., 2018).
Ratios of TMAH+ to NH in bins of different sizes were also calculated. Assuming gas–aerosol equilibria were achieved and particulate TMAH+ to NH co-existed internally, ratios in different-sized particles should theoretically approach a constant. However, ratios in particle size bins were distributed across two ranges, namely, 0.2–0.3 and 0.01–0.05, corresponding to concentrations of NH exceeding 0.9 µg m−3 or below 0.6 µg m−3, respectively, rejecting the null hypothesis. Notably, ratios were not calculated in size bins when the concentrations of NH were smaller than 0.1 µg m−3. At such low concentrations, analytical errors may be large and can be transferred to the calculated ratios.
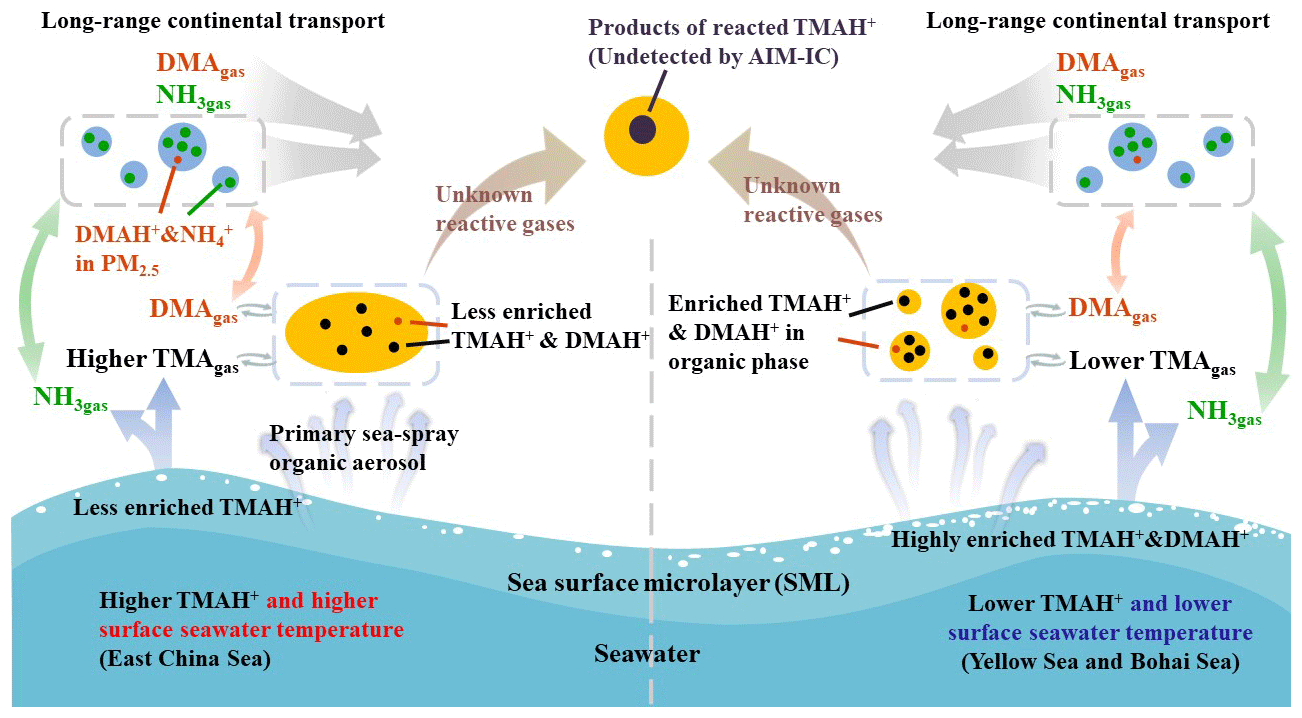
Figure 6A schematic illustrating the release of basic gases and their counterparts from the two different seas and potential atmospheric reactions.
Time series of ratios of DMAgas to NH3gas, particulate DMAH+ to particulate NH, and their correlations during Campaigns A and B are shown in Fig. S3a, b, c, d. Concentrations of DMAH+ in the three episodic samples collected in 2012 are mapped in Fig. S3e. Size distributions of particulate DMAH+ in the mass concentration and molar ratios of DMAH+ to NH are shown in Fig. S3f. During Campaigns B and A, mean molar ratios of DMAgas to NH3gas were 0.004±0.001 and 0.006±0.004, respectively. When molar ratios of DMAH+ to NH in PM2.5 were plotted against ratios of DMAgas over NH3gas (Fig. 5d), the data were far below the 1:16 line during Campaign B. A possible explanation is that sea-derived DMAgas was not achieved with NH-containing aerosols from continental transport. During Campaign A, most of the data were also far below the 1:16 line. However, a few points were close to or above the 1:16 line. The data were associated with the strong sea-derived primary particulate DMAH+, which may co-exist externally with NH-containing aerosols. In addition, the size distributions of particulate DMAH+ in the mass concentration and molar ratios of DMAH+ to NH in the three samples collected in 2012 were generally similar to those of TMAH+. The analysis of particulate TMAH+ was applied to that of particulate DMAH+.
Semi-continuous measurements of the concentrations of basic gases and their counterparts over the East China Sea, Yellow Sea, and Bohai Sea showed large spatiotemporal variations. The average concentration of TMAgas was 0.10±0.04 µg m−3 over the East China Sea during Campaign B and decreased by approximately 70 % over the Yellow Sea and Bohai Sea during Campaigns A and B, with the corresponding TMAgas concentrations 0.031±0.009 and 0.037±0.011 µg m−3. By contrast, the average concentration of TMAH+ in PM2.5 over the East China Sea was 0.098±0.068 µg m−3, and the average increased by approximately 200 % to 0.28±0.18 µg m−3 over the Yellow Sea and Bohai Sea in Campaign A. Comprehensive analysis indicated that both TMAgas and particulate TMAH+ were released from the seas. The disproportional release of TMAgas and particulate TMAH+ from the East China Sea, compared with that of the Yellow Sea and Bohai Sea, however, indicated a differential enrichment of TMAH+ in the SML.
During Campaign B, the average concentration of DMAgas over the East China Sea was 0.012±0.011 µg m−3 and significantly decreased to 0.002±0.001 µg m−3 over the Yellow Sea and Bohai Sea. The moderately good correlation between DMAgas and TMAgas suggests that the observed DMAgas was likely derived from marine emissions with TMAgas. The average concentration of particulate DMAH+ was 0.019±0.014 µg m−3 over the East China Sea during Campaign B. When the concentration of NH exceeded 2 µg m−3, the corresponding particulate DMAH+ was predominantly from long-range continental transport. However, the sea-derived DMAH+ was probably the main contributor in most cases when the concentration of NH was below 2 µg m−3. When the concentration of NH was below 1 µg m−3, the primary emission of DMAH+ probably contributed to the observed DMAH+ to some extent.
We hypothesized that a lower surface seawater temperature would reduce the rate of biochemical degradation of polysaccharides, peptides, and protein gels (Carpenter et al., 2012; Prather et al., 2013; Quinn et al., 2015; Freedman, 2017) to small molecules in the Yellow Sea and Bohai Sea (Fig. 6). These compounds may highly accumulate in the SML. Under higher surface seawater temperatures in the East China Sea, larger molecules may be largely decomposed into small molecules, TMA and DMA. TMA and DMA were dissolved in bulk seawater with less TMA and DMA enriched in the SML.
Based on the exponential correlation between basic gases and ambient temperature, we inferred that surface seawater temperature was probably one of the key factors controlling the release of TMAgas, DMAgas, and NH3gas from the seas to the atmosphere. Disproportional release of alkaline gases and corresponding particulate counterparts implied that enrichment of TMAH+ and DMAH+ in the SML may be overwhelmingly determined by the release of particulate TMAH+ and DMAH+, although the extent of enrichment may be largely affected by surface seawater temperature.
Combining no correlation between the molar ratios of TMAH+ to NH in PM2.5 with the ratios of TMAgas to NH3gas and the data with substantially larger ratios of TMAH+ to NH compared with those of TMAgas to NH3gas, we can infer that the observed TMAH+ in the marine atmospheres was probably overwhelmed by primary sea spray organic aerosols and existed mainly in either the organic phase or mixed phase. Secondary reactions in the marine atmosphere further led to the conversion of TMAH+ into chemicals undetectable by AIM-IC rather than the formation of new detectable particulate TMAH+.
Sea-derived DMAgas and NH3gas were expected to exhibit an equilibrium with aerosols containing NH and DMAH+ from continental transport, but the equilibria were seemingly not achieved over the three seas. Thermodynamic models, including gas phase, aqueous phase, organic phase, and mixed phase, are necessary to explain these results (Chan and Chan, 2013; Qiu and Zhang, 2013; Pankow, 2015; Chu and Chan, 2017; van Pinxteren et al., 2019).
Reuse of NH by phytoplankton may also largely affect ratios of DMAgas to NH3gas and TMAgas to NH3gas in their emissions, which requires further investigation. The extent of degradation of TMA to DMA in different sea zones may vary significantly, leading to different ratios of DMAH+ to TMAH+ in their primary marine emissions. These factors probably complicated the ratios of DMAgas to TMAgas and DMAgas (TMAgas) to NH3gas in their marine emissions and should be considered when estimating their emissions.
In addition, primary particulate TMAH+ and DMAH+ were distributed mainly in submicron atmospheric particles. Their concentrations generally increased with decreasing particle size. By contrast, the size distribution of secondary particulate DMAH+ should be similar to that of particulate NH (Xie et al., 2018; Hu et al., 2018). Considering the largely increased ratios of TMAH+ to NH in <0.43 µm particles, particles containing TMAH+ may yield contributions comparable with anthropogenic particles to cloud condensation nuclei in less polluted marine atmospheres over the China marginal seas.
The data of this paper are available upon request (contact: Xiaohong Yao, xhyao@ouc.edu.cn).
The supplement related to this article is available online at: https://doi.org/10.5194/acp-22-1515-2022-supplement.
XY designed the research. YG and DC carried out the measurement and analyzed the data. All the authors wrote the manuscript and contributed to the scientific discussions.
The contact author has declared that neither they nor their co-authors have any competing interests.
Publisher’s note: Copernicus Publications remains neutral with regard to jurisdictional claims in published maps and institutional affiliations.
This research is supported by the Natural Science Foundation of China (grant no. 41776086), the National Key Research and Development Program of China (grant no. 2016YFC0200504), and the Fundamental Research Funds for the Central Universities (202072002).
This research is supported by the Natural Science Foundation of China (grant no. 41776086), the National Key Research and Development Program of China (grant no. 2016YFC0200504), and the Fundamental Research Funds for the Central Universities (202072002).
This paper was edited by Maria Kanakidou and reviewed by three anonymous referees.
Almeida, J., Schobesberger, S., Kürten, A., Ortega, I. K., Kupiainen-Määttä, O., Praplan, A. P., Adamov, A., Amorim, A., Bianchi, F., Breitenlechner, M., David, A., Dommen, J., Donahue, N. M., Downard, A., Dunne, E., Duplissy, J., Ehrhart, S., Flagan, R. C., Franchin, A., Guida, R., Hakala, J., Hansel, A., Heinritzi, M., Henschel, H., Jokinen, T., Junninen, H., Kajos, M., Kangasluoma, J., Keskinen, H., Kupc, A., Kurtén, T., Kvashin, A. N., Laaksonen, A., Lehtipalo, K., Leiminger, M., Leppä, J., Loukonen, V., Makhmutov, V., Mathot, S., McGrath, M. J., Nieminen, T., Olenius, T., Onnela, A., Petäjä, T., Riccobono, F., Riipinen, I., Rissanen, M., Rondo, L., Ruuskanen, T., Santos, F. D., Sarnela, N., Schallhart, S., Schnitzhofer, R., Seinfeld, J. H., Simon, M., Sipilä, M., Stozhkov, Y., Stratmann, F., Tomé, A., Tröstl, J., Tsagkogeorgas, G., Vaattovaara, P., Viisanen, Y., Virtanen, A., Vrtala, A., Wagner, P. E., Weingartner, E., Wex, H., Williamson, C., Wimmer, D., Ye, P., Yli-Juuti, T., Carslaw, K. S., Kulmala, M., Curtius, J., Baltensperger, U., Worsnop, D. R., Vehkamäki, H., and Kirkby, J.: Molecular understanding of sulphuric acid–amine particle nucleation in the atmosphere, Nature, 502, 359–363, https://doi.org/10.1038/nature12663, 2013.
Altieri, K. E., Hastings, M. G., Peters, A. J., Oleynik, S., and Sigman, D. M.: Isotopic evidence for a marine ammonium source in rainwater at Bermuda, Global Biogeochem. Cy., 28, 1066–1080, https://doi.org/10.1002/2014GB004809, 2014.
Andreas, E. L.: A new sea spray generation function for wind speeds up to 32 m s−1, J. Phys. Oceanogr., 28, 2175–2184, https://doi.org/10.1175/1520-0485(1998)028<2175:ANSSGF>2.0.CO;2, 1998.
Ault, A. P., Moffet, R. C., Baltrusaitis, J., Collins, D. B., Ruppel, M. J., Cuadra-Rodriguez, L. A., Zhao, D., Guasco, T. L., Ebben, C. J., Geiger, F. M., Bertram, T. H., Prather, K. A., and Grassian, V. H.: Size-dependent changes in sea spray aerosol composition and properties with different seawater conditions, Environ. Sci. Technol., 47, 5603–5612, https://doi.org/10.1021/es400416g, 2013.
Carpenter, L. J., Archer, S. D., and Beale, R.: Ocean-atmosphere trace gas exchange, Chem. Soc. Rev., 41, 6473–6506, https://doi.org/10.1039/C2CS35121H, 2012.
Chan, L. P. and Chan, C. K.: Role of the Aerosol Phase State in Ammonia/Amines Exchange Reactions, Environ. Sci. Technol., 47, 5755–5762, https://doi.org/10.1021/es4004685, 2013.
Chen, H., Varner, M. E., Gerber, R. B., and Finlayson-Pitts, B. J.: Reactions of methanesulfonic acid with amines and ammonia as a source of new particles in air, J. Phys. Chem. B, 120, 1526–1536, https://doi.org/10.1021/acs.jpcb.5b07433, 2016.
Chen, D., Shen, Y., Wang, J., Gao, Y., Gao, H., and Yao, X.: Mapping gaseous dimethylamine, trimethylamine, ammonia, and their particulate counterparts in marine atmospheres of China's marginal seas – Part 1: Differentiating marine emission from continental transport, Atmos. Chem. Phys., 21, 16413–16425, https://doi.org/10.5194/acp-21-16413-2021, 2021.
Chu, Y. and Chan, C. K.: Reactive uptake of dimethylamine by ammonium sulfate and ammonium sulfate–sucrose mixed particles, J. Phys. Chem. A, 121, 206–215, https://doi.org/10.1021/acs.jpca.6b10692, 2017.
Cunliffe, M., Engel, A., Frka, S., Gašparović, B., Guitart, C., Murrell, J. C., Salter, M., Stolle, C., Upstill-Goddard, R., and Wurl, O.: Sea surface microlayers: A unified physicochemical and biological perspective of the air–ocean interface, Prog. Oceanogr., 109, 104–116, https://doi.org/10.1016/j.pocean.2012.08.004, 2013.
Dall'Osto, M., Airs, R. L., Beale, R., Cree, C., Fitzsimons, M. F., Beddows, D., Harrison, R. M., Ceburnis, D., O'Dowd, C., Rinaldi, M., Paglione, M., Nenes, A., Decesari, S., and Simó, R.: Simultaneous detection of alkylamines in the surface ocean and atmosphere of the antarctic sympagic environment, ACS Earth and Space Chemistry, 3, 854–862, https://doi.org/10.1021/acsearthspacechem.9b00028, 2019.
Deng, Y., Gao, T., Gao, H., Yao, X., and Xie, L.: Regional precipitation variability in East Asia related to climate and environmental factors during 1979–2012, Sci. Rep., 4, 5693, https://doi.org/10.1038/srep05693, 2014.
Facchini, M. C., Decesari, S., Rinaldi, M., Carbone, C., Finessi, E., Mircea, M., Fuzzi, S., Moretti, F., Tagliavini, E., Ceburnis, D., and O'Dowd, C. D.: Important source of marine secondary organic aerosol from biogenic amines, Environ. Sci. Technol., 42, 9116–9121, https://doi.org/10.1021/es8018385, 2008.
Feng, L., Shen, H., Zhu, Y., Gao, H., and Yao, X.: Insight into generation and evolution of sea-salt aerosols from field measurements in diversified marine and coastal atmospheres, Sci. Rep., 7, 41260, https://doi.org/10.1038/srep41260, 2017.
Freedman, M. A.: Phase separation in organic aerosol, Chem. Soc. Rev., 46, 7694–7705, https://doi.org/10.1039/C6CS00783J, 2017.
Ge, X., Wexler, A. S., and Clegg, S. L.: Atmospheric amines – Part II. Thermodynamic properties and gas/particle partitioning, Atmos. Environ., 45, 561–577, https://doi.org/10.1016/j.atmosenv.2010.10.013, 2011.
Gibb, S. W., Mantoura, R. F. C., and Liss, P. S.: Ocean-atmosphere exchange and atmospheric speciation of ammonia and methylamines in the region of the NW Arabian Sea, Global Biogeochem. Cy., 13, 161–178, https://doi.org/10.1029/98GB00743, 1999.
Hu, Q., Yu, P., Zhu, Y., Li, K., Gao, H., and Yao, X.: Concentration, size distribution, and formation of trimethylaminium and dimethylaminium ions in atmospheric particles over marginal seas of China, J. Atmos. Sci., 72, 3487–3498, https://doi.org/10.1175/JAS-D-14-0393.1, 2015.
Hu, Q., Qu, K., Gao, H., Cui, Z., Gao, Y., and Yao, X.: Large increases in primary trimethylaminium and secondary dimethylaminium in atmospheric particles associated with cyclonic eddies in the northwest Pacific Ocean, J. Geophys. Res.-Atmos., 123, 12133–12146, https://doi.org/10.1029/2018JD028836, 2018.
Johnson, M., Sanders, R., Avgoustidi, V., Lucas, M., Brown, L., Hansell, D., Moore, M., Gibb, S., Liss, P., and Jickells, T.: Ammonium accumulation during a silicate-limited diatom bloom indicates the potential for ammonia emission events, Mar. Chem., 106, 63–75, https://doi.org/10.1016/j.marchem.2006.09.006, 2007.
Johnson, M. T., Liss, P. S., Bell, T. G., Lesworth, T. J., Baker, A. R., Hind, A. J., Jickells, T. D., Biswas, K. F., Woodward, E. M. S., and Gibb, S. W.: Field observations of the ocean-atmosphere exchange of ammonia: Fundamental importance of temperature as revealed by a comparison of high and low latitudes, Global Biogeochem. Cy., 22, GB1019, https://doi.org/10.1029/2007GB003039, 2008.
Köllner, F., Schneider, J., Willis, M. D., Klimach, T., Helleis, F., Bozem, H., Kunkel, D., Hoor, P., Burkart, J., Leaitch, W. R., Aliabadi, A. A., Abbatt, J. P. D., Herber, A. B., and Borrmann, S.: Particulate trimethylamine in the summertime Canadian high Arctic lower troposphere, Atmos. Chem. Phys., 17, 13747–13766, https://doi.org/10.5194/acp-17-13747-2017, 2017.
Leeuw, G. de, Andreas, E. L., Anguelova, M. D., Fairall, C. W., Lewis, E. R., O'Dowd, C., Schulz, M., and Schwartz, S. E.: Production flux of sea spray aerosol, Rev. Geophys., 49, RG2001, https://doi.org/10.1029/2010RG000349, 2011.
Lidbury, I., Murrell, J. C., and Chen, Y.: Trimethylamine N-oxide metabolism by abundant marine heterotrophic bacteria, P. Natl. Acad. Sci. USA, 111, 2710–2715, https://doi.org/10.1073/pnas.1317834111, 2014.
Lidbury, I. D., Murrell, J. C., and Chen, Y.: Trimethylamine and trimethylamine N-oxide are supplementary energy sources for a marine heterotrophic bacterium: implications for marine carbon and nitrogen cycling, ISME J., 9, 760–769, https://doi.org/10.1038/ismej.2014.149, 2015.
Liu, Y., Zhang, T. R., Shi, J. H., Gao, H. W., and Yao, X. H.: Responses of chlorophyll a to added nutrients, Asian dust, and rainwater in an oligotrophic zone of the Yellow Sea: Implications for promotion and inhibition effects in an incubation experiment, J. Geophys. Res.-Biogeo., 118, 1763–1772, https://doi.org/10.1002/2013JG002329, 2013.
Lui, H.-K., Chen, C.-T. A., Lee, J., Wang, S.-L., Gong, G.-C., Bai, Y., and He, X.: Acidifying intermediate water accelerates the acidification of seawater on shelves: An example of the East China Sea, Cont. Shelf Res., 111, 223–233, https://doi.org/10.1016/j.csr.2015.08.014, 2015.
Müller, C., Iinuma, Y., Karstensen, J., van Pinxteren, D., Lehmann, S., Gnauk, T., and Herrmann, H.: Seasonal variation of aliphatic amines in marine sub-micrometer particles at the Cape Verde islands, Atmos. Chem. Phys., 9, 9587–9597, https://doi.org/10.5194/acp-9-9587-2009, 2009.
Pankow, J. F.: Phase considerations in the gas/particle partitioning of organic amines in the atmosphere, Atmos. Environ., 122, 448–453, https://doi.org/10.1016/j.atmosenv.2015.09.056, 2015.
Paulot, F., Jacob, D. J., Johnson, M. T., Bell, T. G., Baker, A. R., Keene, W. C., Lima, I. D., Doney, S. C., and Stock, C. A.: Global oceanic emission of ammonia: Constraints from seawater and atmospheric observations, Global Biogeochem. Cy., 29, 1165–1178, https://doi.org/10.1002/2015GB005106, 2015.
Perraud, V., Li, X., Jiang, J., Finlayson-Pitts, B. J., and Smith, J. N.: Size-resolved chemical composition of sub-20 nm particles from methanesulfonic acid reactions with methylamine and ammonia, ACS Earth and Space Chemistry, 4, 1182–1194, https://doi.org/10.1021/acsearthspacechem.0c00120, 2020.
Prather, K. A., Bertram, T. H., Grassian, V. H., Deane, G. B., Stokes, M. D., Demott, P. J., Aluwihare, L. I., Palenik, B. P., Azam, F., Seinfeld, J. H., Moffet, R. C., Molina, M. J., Cappa, C. D., Geiger, F. M., Roberts, G. C., Russell, L. M., Ault, A. P., Baltrusaitis, J., Collins, D. B., Corrigan, C. E., Cuadra-Rodriguez, L. A., Ebben, C. J., Forestieri, S. D., Guasco, T. L., Hersey, S. P., Kim, M. J., Lambert, W. F., Modini, R. L., Mui, W., Pedler, B. E., Ruppel, M. J., Ryder, O. S., Schoepp, N. G., Sullivan, R. C., and Zhao, D.: Bringing the ocean into the laboratory to probe the chemical complexity of sea spray aerosol, P. Natl. Acad. Sci. USA, 110, 7550–7555, https://doi.org/10.1073/pnas.1300262110, 2013.
Qiu, C. and Zhang, R.: Multiphase chemistry of atmospheric amines, Phys. Chem. Chem. Phys., 15, 5738–5752, https://doi.org/10.1039/C3CP43446J, 2013.
Quinn, P. K., Collins, D. B., Grassian, V. H., Prather, K. A., and Bates, T. S.: Chemistry and related properties of freshly emitted sea spray aerosol, Chem. Rev., 115, 4383–4399, https://doi.org/10.1021/cr500713g, 2015.
Shao, Z., Shuai, L., Cheng, H., Wu, Z., You, F., Zhang, H., and Yao, J.: Influence of iron and carbon on the occurrence of Ulva prolifera (Ulvophyceae) in the Yellow Sea, Regional Studies in Marine Science, 36, 101224, https://doi.org/10.1016/j.rsma.2020.101224, 2020.
van Neste, A., Duce, R. A., and Lee, C.: Methylamines in the marine atmosphere, Geophys. Res. Lett., 14, 711–714, https://doi.org/10.1029/GL014i007p00711, 1987.
van Pinxteren, M., Fomba, K. W., van Pinxteren, D., Triesch, N., Hoffmann, E. H., Cree, C. H. L., Fitzsimons, M. F., von Tümpling, W., and Herrmann, H.: Aliphatic amines at the Cape Verde Atmospheric Observatory: Abundance, origins and sea-air fluxes, Atmos. Environ., 203, 183–195, https://doi.org/10.1016/j.atmosenv.2019.02.011, 2019.
Velthuis, M., van Deelen, E., van Donk, E., Zhang, P., and Bakker, E. S.: Impact of Temperature and Nutrients on Carbon: Nutrient Tissue Stoichiometry of Submerged Aquatic Plants: An Experiment and Meta-Analysis, Front. Plant Sci., 8, 655, https://doi.org/10.3389/fpls.2017.00655, 2017.
Wentworth, G. R., Murphy, J. G., Croft, B., Martin, R. V., Pierce, J. R., Côté, J.-S., Courchesne, I., Tremblay, J.-É., Gagnon, J., Thomas, J. L., Sharma, S., Toom-Sauntry, D., Chivulescu, A., Levasseur, M., and Abbatt, J. P. D.: Ammonia in the summertime Arctic marine boundary layer: sources, sinks, and implications, Atmos. Chem. Phys., 16, 1937–1953, https://doi.org/10.5194/acp-16-1937-2016, 2016.
Xie, H., Feng, L., Hu, Q., Zhu, Y., Gao, H., Gao, Y., and Yao, X.: Concentration and size distribution of water-extracted dimethylaminium and trimethylaminium in atmospheric particles during nine campaigns – Implications for sources, phase states and formation pathways, Sci. Total Environ., 631–632, 130–141, https://doi.org/10.1016/j.scitotenv.2018.02.303, 2018.
Yao, X. H. and Zhang, L.: Analysis of passive-sampler monitored atmospheric ammonia at 74 sites across southern Ontario, Canada, Biogeosciences, 10, 7913–7925, https://doi.org/10.5194/bg-10-7913-2013, 2013.
Yao, L., Garmash, O., Bianchi, F., Zheng, J., Yan, C., Kontkanen, J., Junninen, H., Mazon, S. B., Ehn, M., Paasonen, P., Sipilä, M., Wang, M., Wang, X., Xiao, S., Chen, H., Lu, Y., Zhang, B., Wang, D., Fu, Q., Geng, F., Li, L., Wang, H., Qiao, L., Yang, X., Chen, J., Kerminen, V.-M., Petäjä, T., Worsnop, D. R., Kulmala, M., and Wang, L.: Atmospheric new particle formation from sulfuric acid and amines in a Chinese megacity, Science, 361, 278–281, https://doi.org/10.1126/science.aao4839, 2018.
Yu, F. and Luo, G.: Modeling of gaseous methylamines in the global atmosphere: impacts of oxidation and aerosol uptake, Atmos. Chem. Phys., 14, 12455–12464, https://doi.org/10.5194/acp-14-12455-2014, 2014.
Zhang, C., Ito, A., Shi, Z., Aita, M. N., Yao, X., Chu, Q., Shi, J., Gong, X., and Gao, H.: Fertilization of the northwest Pacific Ocean by East Asia air pollutants, Global Biogeochem. Cy., 33, 690–702, https://doi.org/10.1029/2018GB006146, 2019a.
Zhang, C., Yao, X., Chen, Y., Chu, Q., Yu, Y., Shi, J., and Gao, H.: Variations in the phytoplankton community due to dust additions in eutrophication, LNLC and HNLC oceanic zones, Sci. Total Environ., 669, 282–293, https://doi.org/10.1016/j.scitotenv.2019.02.068, 2019b.
Zheng, J., Ma, Y., Chen, M., Zhang, Q., Wang, L., Khalizov, A. F., Yao, L., Wang, Z., Wang, X., and Chen, L.: Measurement of atmospheric amines and ammonia using the high resolution time-of-flight chemical ionization mass spectrometry, Atmos. Environ., 102, 249–259, https://doi.org/10.1016/j.atmosenv.2014.12.002, 2015.
Zhou, S., Li, H., Yang, T., Chen, Y., Deng, C., Gao, Y., Chen, C., and Xu, J.: Characteristics and sources of aerosol aminiums over the eastern coast of China: insights from the integrated observations in a coastal city, adjacent island and surrounding marginal seas, Atmos. Chem. Phys., 19, 10447–10467, https://doi.org/10.5194/acp-19-10447-2019, 2019.
Zhu, Y., Li, K., Shen, Y., Gao, Y., Liu, X., Yu, Y., Gao, H., and Yao, X.: New particle formation in the marine atmosphere during seven cruise campaigns, Atmos. Chem. Phys., 19, 89–113, https://doi.org/10.5194/acp-19-89-2019, 2019.