the Creative Commons Attribution 4.0 License.
the Creative Commons Attribution 4.0 License.
 | 18 Nov 2022
Long-term declines in atmospheric nitrogen and sulfur deposition reduce critical loads exceedances at multiple Canadian rural sites, 2000–2018
Irene Cheng
Zhuanshi He
Hazel Cathcart
Daniel Houle
Amanda Cole
Jian Feng
Jason O'Brien
Anne Marie Macdonald
Julian Aherne
Jeffrey Brook
Daily air concentrations of inorganic nitrogen (N) species, including gaseous HNO3 and particulate-bound and , and sulfur (S) species, including SO2 and , and precipitation concentrations of , , and , have been routinely monitored by the Canadian Air and Precipitation Monitoring Network (CAPMoN) since 1983. Data at 15 rural sites from 2000–2018 were used to estimate dry and wet N and S deposition fluxes, which were then used to explore their spatiotemporal trends and assess ecosystem damage through a retrospective analysis of critical loads (CLs) exceedances. Total (dry + wet) N deposition ranged from 1.7–9.5 among the 15 sites, though dry deposition of NH3 and some oxidized N species were not included due to lack of monitoring data. Based on additional N measurements in 2010 at one of the sites, annual total N deposition may be underestimated by up to 32 %. Total N deposition was dominated by wet and wet deposition, which together comprised 71 %–95 %. Contributions to dry N deposition were 40 %–74 % by HNO3, 11 %–40 % by , and 5 %–25 % by . Total S deposition ranged from 1.3–8.5 and was dominated by wet deposition of and dry deposition of SO2. Relative percentages of wet and dry S deposition were 45 %–89 % and 11 %–55 %, respectively. Acidic ion fluxes were greatest in southeastern Canada and were comparable among the west coast, prairie, remote, and eastern Canadian sites. Oxidized N (dry HNO3, dry , wet ) deposition was greater than that of reduced N (dry , wet ) in the early 2000s. In 2014–2018, reduced N deposition surpassed that of oxidized N in southeastern Canada. Total N and S deposition decreased significantly at a rate of −0.03 to −0.25 (−1.1 % yr−1 to −3.3 % yr−1) and −0.08 to −0.66 (−3.5 % yr−1 to −6.6 % yr−1), respectively, among the sites. The weak declining trend in total N deposition at the west coast site was consistent with the slower decline in NOx emissions in western Canada. Reductions in total N deposition were driven by its oxidized form as trends in reduced N were non-significant. As a result, reduced N contributions to total N deposition increased on average from 42 % in 2000–2004 to 53 % in 2014–2018. Anthropogenic NOx and SO2 emissions reductions in both eastern Canada and eastern US were highly effective in reducing total oxidized N and total S deposition, respectively, in eastern Canada. Acidic deposition exceeded terrestrial CL at 5 of the 14 sites and aquatic CL at 2 of the 5 sites in the early 2000s. However, exceedances have been trending downwards and acidic deposition fluxes were mostly near or below CL after 2012 for the subset of sites assessed, which support recovery from historical acidification. Further assessments of CL exceedances are required in other Canadian regions susceptible to acidification and affected by elevated or increasing N and S emissions.
- Article
(4589 KB) - Full-text XML
-
Supplement
(4315 KB) - BibTeX
- EndNote


Nitrogen (N) and sulfur (S) are the major chemical constituents of acidic deposition. Long-term atmospheric inputs of N and S contribute to acidification of terrestrial and aquatic ecosystems as well as eutrophication in the case of N. It is well established that acidic deposition results in the degradation of soil and water quality leading to detrimental effects on vegetation, forests, and aquatic and terrestrial wildlife (Driscoll et al., 2001; ECCC, 2004; Bergström and Jansson, 2006; Pardo et al., 2011; Wright et al., 2018). Further, recovery from acidification effects can take decades even as acidifying deposition decreases (Shao et al., 2020). In addition to acidification effects, increased N deposition accelerates algal growth in aquatic ecosystems and can negatively affect vegetation by decreasing plant species diversity, altering their physiology, increasing their vulnerability to parasites and pathogens, and reducing its ability to adapt to extreme weather (Bobbink et al., 2011; de Vries et al., 2015).
Atmospheric deposition of N and S occurs via both wet and dry deposition. Wet deposition of ammonium (), nitrate (), and sulfate () are routinely monitored around the world. A review of global acidic deposition measurements up to 2005–2007 identified eastern North America as one of the regions having the highest wet deposition fluxes of N and S (Vet et al., 2014). Since policies were introduced to reduce anthropogenic NOx and SO2 emissions (dominant precursors of N and S deposition), wet deposition of and have declined significantly in Canada and the US (Du et al., 2014; Sickles and Shadwick, 2015; Li et al., 2016; Cheng and Zhang, 2017; Zhang et al., 2018; Feng et al., 2021; Burns et al., 2021; Likens et al., 2021). The rates of decline in eastern North America were 1.6 % yr−1–2.0 % yr−1 and 2.5 % yr−1–2.9 % yr−1 for and wet deposition, respectively, between 1989 and 2016 (Feng et al., 2021). Wet deposition was relatively unchanged in Canada (Cheng and Zhang, 2017; Feng et al., 2021) and in most regions of the US (Lehmann et al., 2007; Du et al., 2014; Li et al., 2016; Feng et al., 2021) between the 1990s and 2015. A slight increasing trend was found in the US Midwest, which appears to coincide with increasing ammonia (NH3) emissions contributing to particulate ammonium (; Du et al., 2014; Li et al., 2016).
Unlike wet deposition, long-term data on dry deposition of N and S are sparse because of the challenges in accurately measuring dry deposition fluxes. Dry deposition fluxes are typically estimated using the inferential method, which is based on the observed or modeled surface concentrations and modeled dry deposition velocities of N and S compounds (Fowler et al., 2005; Holland et al., 2005; Zhang et al., 2003, 2009; Flechard et al., 2011; Schwede et al., 2011; Staelens et al., 2012). Particulate sulfate () and SO2 are the main constituents of dry S deposition. Dry deposition of N comprises oxidized (e.g., , HNO3, NO2, HONO, N2O5, peroxy nitrates) and reduced (e.g., , NH3) species and organic N (Walker et al., 2020). Most estimates of dry N deposition include , HNO3, and given that their ambient air concentrations are routinely monitored or modeled. It is more difficult to include NH3 in dry deposition estimates because of few ambient measurements and large model uncertainties associated with NH3 bidirectional exchange and its high deposition velocity.
Dry deposition makes up a significant proportion of the total deposition. Approximately 28 %–75 % of total N deposition in the continental US (Li et al., 2016; Zhang et al., 2018; Walker et al., 2019a; 2020; Benish et al., 2022), 10 %–50 % of total N deposition, 24 %–46 % of total S deposition in Canada (ECCC, 2004; Zhang et al., 2009), and 50 %–52 % of total N deposition in China (Pan et al., 2012; Xu et al., 2015) have been attributed to dry deposition. Large variations in the contributions of dry deposition to total N deposition across the US convey significant spatial variability that likely arises from a combination of effects associated with spatial heterogeneity in emission source distribution, land use, and precipitation amount. Reduced N is playing an increasingly important role in dry deposition owing to agricultural and wildfire emissions of NH3 (Pan et al., 2012; Xu et al., 2015; Butler et al., 2016; Li et al., 2016; Kharol et al., 2018; Zhang et al., 2018; McHale et al., 2021). Emissions reductions in NOx have also been shown to contribute to increases in free NH3 (Yu et al., 2018; Yao and Zhang, 2019). Nevertheless, oxidized N deposition continues to exceed reduced N or exhibit increasing trends in some regions (Zhang et al., 2009; Liu et al., 2013; Kharol et al., 2018). There are a few studies tracking the long-term trends in both dry and wet deposition of N and S (Fowler et al., 2005; Sickles and Shadwick, 2015; Li et al., 2016; Zhang et al., 2018; Nopmongcol et al., 2019; Yu et al., 2019; Tan et al., 2020; Wen et al., 2020; Benish et al., 2022), which provides a more complete assessment of the acidic deposition budget. Previous studies demonstrate that dry deposition cannot be neglected when assessing the effects of anthropogenic emissions reductions on acidic deposition. Total (dry + wet) deposition of N and S are also necessary for evaluating exceedances of critical loads (threshold values for acidic deposition that can be tolerated by ecosystems; Nilsson and Grennfelt, 1988) and potential negative effects on ecosystems (e.g., Ellis et al., 2013; Simkin et al., 2016; Zhao et al., 2017; Makar et al., 2018).
The Canadian Air and Precipitation Monitoring Network (CAPMoN) measures inorganic N and S among other pollutants in air and precipitation at rural and remote locations across Canada (ECCC, 2017). Previous analyses of CAPMoN data largely focused on long-term trends in N and S in ambient air or in wet deposition (ECCC, 2004; Zbieranowski and Aherne, 2011; Vet et al., 2014; Cheng and Zhang, 2017; Feng et al., 2021). Dry deposition of N species were also estimated at CAPMoN sites through a series of short-term field campaigns in the early 2000s (Zhang et al., 2009). Hence, this study expands on the scope of previous assessments by focusing on dry and total N and S deposition during the past 2 decades. The objectives were to (1) estimate the long-term dry deposition fluxes of inorganic N and S at 15 CAPMoN sites using the inferential approach; (2) analyze the spatiotemporal trends in dry and total (dry + wet) deposition as they relate to changes in anthropogenic emissions; (3) examine the relative contributions from dry and wet deposition and from various N and S species; and (4) discuss the implications of the deposition results on Canadian ecosystems based on an analysis of critical loads exceedances.
2.1 Measurements of air concentration of pollutants and wet concentration of inorganic ions
Atmospheric deposition of N and S at 15 CAPMoN sites were analyzed in this study. The sites were selected because of their long-term (8 to 19 years) data availability, which are suitable for temporal trend analyses. All sites are considered regionally representative, following the criteria in Olsen et al. (1990), meaning that local pollution sources do not have an outsized influence. The 15 sites consist of one site on the west coast – Saturna (SAT); one site in the prairies – Bratt's Lake (BRA); two sites in the southeastern region – Longwoods (LON) and Egbert (EGB); four sites in the greater southeastern region – Algoma (ALG), Sprucedale (SPR), Chalk River (CHA), and Frelighsburg (FRE) – which are located at higher latitudes compared to LON and EGB; four remote inland sites – Experimental Lakes Area (ELA), Bonner Lake (BON), Chapais (CPS), and Lac Edouard (LED); and three sites in the Atlantic region – Kejimkujik National Park (KEJ), Mingan (MIN), and Bay d'Espoir (BAB). MIN is located in eastern Quebec, but is classified as part of the Atlantic region in this paper. A map of the sites is shown in Fig. 1 and site descriptions are provided in Table S1 in the Supplement.

Figure 1Map of CAPMoN sites analyzed in this study and their regional designations.
Methods for sampling and analysis of air and precipitation have been described in previous studies (Sirois and Fricke, 1992; Sirois et al., 2000). CAPMoN collects 24 h integrated air samples using an open-face three-stage filter. The non-size selective air filters are sent to the CAPMoN laboratory in Toronto, Canada, for chemical analysis including particulate sulfate (), nitrate () and ammonium (), gaseous HNO3 and SO2 (analyzed as dissolved and ), calcium (Ca2+), magnesium (Mg2+), sodium (Na+), potassium (K+), and chloride (Cl−) ions. Non-sea salt was approximated at coastal sites (i.e., SAT, KEJ, MIN, and BAB) using the WMO method for estimating non-sea salt sulfate in precipitation (GAW, 2004). Precipitation is sampled over a 24 h collection period using a wet-only collector that opens when it senses rain or snow. Samples are sent to the CAPMoN laboratory for measurement of pH and major inorganic ions including total , , and , as well as Ca2+, Mg2+, Na+, K+, and Cl− in precipitation. Rain and snow gauge measurements are used to calculate wet deposition fluxes. The CAPMoN sites and monitoring equipment are maintained regularly by field technicians and site operators. The data are quality controlled using the Research Data Management and Quality Assurance System (RDMQ) software (McMillan et al., 2000), and finalized by ECCC's National Atmospheric Chemistry (NAtChem) team. The CAPMoN air filter pack and precipitation chemistry datasets can be downloaded from the Government of Canada's Open Data Portal (ECCC, 2021b, c). Annual wet deposition fluxes of N and S species were calculated from their precipitation-weighted mean concentrations multiplied by the annual precipitation amount. Annual fluxes were reported only if data completeness thresholds were met. The criteria were that (a) at least 90 % of the days in the year, and at least 60 % of the days in each quarter, had a valid precipitation depth measurement, and (b) a valid concentration measurement was available for at least 70 % of the annual precipitation and 60 % in each quarter.
Additional N species including NO, NO2, total oxidized N (NOy), and NH3 have been measured at selected CAPMoN sites. Measurements at the EGB site in 2010 were analyzed in this study to estimate total N dry deposition after including the missing N species and to examine the relative contributions of various N species to N dry deposition, following the approach described in Zhang et al. (2009). NO, NO2, and NOy were measured at 1 min intervals using Thermo Electron model 42C trace level gas analyzers. The analyzers measured NO based on the chemiluminescent reaction with ozone. NO2 was converted to NO using a Droplet Measurements photolytic blue light converter (BLC), while NOy (NO, NO2, HNO3, HO2, , N2O5, PAN, organic nitrates, and others) were converted to NO using a molybdenum converter heated to 325 ∘C. An intercomparison of the NO measurement channels from different instruments indicated a high degree of correlation (slope = 0.996, r2 = 0.9992) and minimal offset (intercept = 0.008). Mixing ratios of unknown NOy were estimated by subtracting the measured NOy species (NO, NO2, HNO3, ) from total NOy. Continuous measurements of NH3 were made using a modified Thermo 42C trace level chemiluminescence-based analyzer. The measurement technique is based on the difference in responses of various N species converted to NO at elevated temperatures over stainless steel and molybdenum converters. The instrument was found to efficiently convert NH3 to NO at 750 ∘C over the stainless steel converter and inefficiently (< 1 %) over the molybdenum converter. In efforts to minimize any possible effects of ammonium nitrate volatilization, the sample inlet filter was changed daily. Automated instrument calibrations were performed every 25 h, and the instruments were audited approximately every 3 months against a National Institute of Standards and Technology (NIST) standard.
2.2 Dry deposition model
Dry deposition fluxes were estimated using the inferential method (observed surface concentration multiplied by the modeled dry deposition velocity, Vd). Models for deriving Vd of gaseous compounds and PM2.5 and PM2.5−10 have been described in previous studies (Zhang et al., 2003; Zhang and He, 2014). Surface meteorological fields used in the Vd calculations were obtained from 19 years (2000–2018) of model reanalysis data (10 km resolution) from the Precipitation and Ground Surface Reanalysis (REQA) project (Gasset et al., 2021). Land use data and leaf area index (LAI) within a 3 km circle of each site (Table S1) were extracted from MODIS satellite data to compute land use area-weighted Vd's. The same models, meteorological data and land use data were recently used to produce a Vd database across North America, and more information regarding the model setup and data input can be found in Zhang et al. (2023).
In Eqs. (1)–(4), Vd of , , and were determined using Vd of PM2.5 and PM2.5−10, and observed fine fractions of particulate inorganic ions (i.e., PM2.5/total PM) following Zhang et al. (2008). Although there is no size cutoff for CAPMoN particulate ion measurements, , , and mass are assumed to be mostly in PM10. Vd of unknown NOy was estimated using Eq. (5) (Zhang et al., 2009).
Spatial and temporal patterns in Vd of N and S species are detailed in Sect. S1, and Figs. S1 and S2 in the Supplement. Modeled Vd of N and S species in Table S2 in the Supplement were comparable to those in a previous study at CAPMoN sites (Zhang et al., 2009) and a review of N fluxes (Walker et al., 2020). Differences in the parameterizations between dry deposition models result in uncertainties of a factor of 2 to 3 in modeled Vd of N and S species, and in their dry fluxes (Flechard et al., 2011; Schwede et al., 2011). Thus, it is important to use a consistent model framework for long-term data, as was applied in this study.
2.3 Data analysis methods
Long-term trends in atmospheric deposition of N and S and precursor emissions were estimated using Theil–Sen's slopes, and the statistical significance of the slope was determined using the Mann–Kendall test (Carslaw and Ropkins, 2012). This is a non-parametric trends analysis method typically applied to environmental data (Du et al., 2014; Cheng and Zhang, 2017). Prior to estimating the long-term trends in deposition, seasonally-average yearly fluxes for the four seasons were decomposed by LOESS (locally estimated scatterplot smoothing) because of the strong seasonality in the deposition fluxes. Deposition fluxes were also summarized for a 6-month period during cold (November to April) and warm seasons (May to October). N and S deposition at the Canadian sites were compared with province- or state-level NOx, NH3 and SO2 emissions in Canada (ECCC, 2021a) and the US (USEPA, 2021), respectively. Emissions were categorized by geographical region namely western Canada, eastern Canada, western US, and eastern US. Emissions in eastern Canada and eastern US have a greater likelihood of affecting the sites in the southeastern and Atlantic regions, whereas emissions in western Canada and western US are more likely to influence the west coast and prairie sites based on back trajectory analyses of CAPMoN sites (ECCC, 2004; Zhang et al., 2008). Emissions in the provinces of British Columbia, Alberta, and Saskatchewan are considered part of western Canada and those in Ontario and Quebec are part of eastern Canada. Western US emissions include those from the following states: CA, CO, ID, MT, NV, OR, UT, WA, and WY. Eastern US emissions include those from the following states: IL, IN, KY, MD, MI, MN, MO, NC, NJ, NY, OH, PA, TN, VA, WI, and WV.
2.4 Critical loads estimation for lakes and soil
To provide a view of potential changes in exceedances of critical loads (CLs) of acidity, aquatic CL were estimated for 31 lakes surrounding five CAPMoN sites (ALG 5 lakes, ELA 5 lakes, LED 6 lakes, BAB 7 lakes, KEJ 8 lakes) using the Steady-State Water Chemistry (SSWC) model. The approach is described in detail elsewhere (Jeffries et al., 2010; Aherne and Jeffries, 2015). Briefly, in the SSWC model, lake CL is quantified by the pre-acidification base cation flux exiting the lakes minus the acid neutralizing capacity (ANClimit), the threshold above which harmful effects on fish population are not observed (Jeffries et al., 2010; Aherne and Jeffries, 2015). The contribution of dissolved organic carbon (DOC) to acidic charges has been taken into account in calculating the ANClimit using Eq. (6) (Jeffries et al., 2010). The pre-acidification base cation fluxes were estimated using present-day fluxes, which were derived from current base cation concentrations and spatially interpolated runoff values. The “F-factor” was used to adjust the present-day base cation fluxes to account for long-term changes in acidic deposition (Brakke et al., 1990). Exceedance was estimated using the lake CL Steady-State method following the Canadian Acid Deposition Science Assessment (ECCC, 2004) and Jeffries et al. (2010) and the total S and N deposition fluxes at the CAPMoN sites (Eq. 7). Unlike S deposition, only a fraction of the N deposition is acidifying given its biological retention in the terrestrial portion of lake catchments. Equation (7) includes total N deposition, which assumes surrounding soils are N-saturated and all N deposition contributes to acidity (ECCC, 2004; Jeffries et al., 2010). This assumption is a worst-case scenario and may result in higher CL exceedance. However, the higher exceedance may be offset by an underestimate of total N deposition due to missing NH3 dry deposition.
The simple mass balance (SMB) model for estimating terrestrial CL (Sverdrup, 1990; Sverdrup and De Vries, 1994; Posch et al., 2015) was used to approximate soil CL at 14 of the 15 CAPMoN stations. The SMB model is a steady-state model that relies on several simplifying assumptions, primarily that the soil is a homogenous compartment and depth is limited to the root zone. Critical loads are defined as a function based on the maximum S-based CL (CLmaxS), maximum N-based CL (CLmaxN), and long-term N removal in the soil (CLminN). An approximate 10 km × 10 km area based on the GEM-MACH v2 model grid (Moran et al., 2018) was chosen to represent the terrestrial ecosystem surrounding the stations for cohesion with contemporary deposition maps. The BRA site was omitted from the soil CL estimations as the area is entirely agricultural (i.e., soils are not natural and receive anthropogenic N inputs through fertilizer application). Three more sites (EGB, LON, and FRE) were predominately agricultural but had some (≥ 8 %) natural or semi-natural soils, which are the focus of the SMB model. Required input data, such as the soil weathering rate, nutrient uptake, and critical ANC leaching, were estimated according to CLRTAP (2004) and mapped at 250 m resolution (details in Sect. S2 in the Supplement). Soil CL within each grid were summarized using the 5th percentile (Posch et al., 1993) and exceedance was estimated along the CL function using total S and N deposition from the representative CAPMoN station (Sect. S2).
3.1 N and S concentrations and emissions trends
Over the 2000–2018 period, the highest concentrations of atmospheric S and N were observed at LON and EGB, which are the two southeastern sites closest to industrialized and populated areas in the US and Canada (Fig. S3 in the Supplement). The next highest concentrations were observed at sites in the greater southeastern region of Canada (FRE, CHA, SPR, and ALG). Concentrations of N and S at the west coast (SAT) and prairie sites (BRA) were similar to those of the greater southeastern region, except for the lower and concentrations at the west coast and prairie sites. The lowest concentrations were observed at remote sites (ELA, BON, CPS, LED) and in the Atlantic region (KEJ, MIN, BAB).
Annual trends in S and N concentrations during the 2000–2018 period varied across regions. The largest declines in the annual mean concentrations were observed at the two southeastern sites (Fig. S4 in the Supplement). Despite having recorded the highest SO2 concentrations among CAPMoN stations every year since 1983, concentrations at LON and EGB were comparable to those in the greater southeastern region and at the west coast site in 2017–2018, and were only slightly higher than those of remote sites. The second largest decrease in annual mean concentrations of S and N were observed in the greater southeastern region. At the west coast site, the decrease in annual SO2 and HNO3 concentrations was similar to those in the greater southeastern region, while slight decreases were observed in annual , , and . Weak declining trends in S and N were also observed at remote and Atlantic sites. No trend in the annual concentrations was found at the prairie site.
Trends in the annual mean concentrations at CAPMoN sites were strongly influenced by emissions of SO2 and NOx as noted in previous studies (ECCC, 2004; Cheng and Zhang, 2017; Feng et al., 2020). SOx emissions declined significantly between 2000 and 2018 in Ontario and Quebec (73 % reduction, and in the eastern US (90 % reduction; Fig. S5a in the Supplement). Declines in both domestic emissions and transboundary pollution were the main factors driving the decrease in atmospheric S concentrations in southeastern Canada. Decreases in SOx emissions in Ontario and Quebec were attributed to the ore and minerals and electric power generation sectors, while the decrease in SO2 emissions in the eastern US was predominantly from electric utilities (Fig. S5a). Decreasing trends in NOx emissions drove the decrease in atmospheric N at LON and EGB and the decrease in HNO3 concentrations in the greater southeastern region. NOx emissions in Ontario and Quebec decreased by ∼ 55 % from 2000–2015 as a result of emissions reductions from the transportation sector and began to level off from 2015–2018. In the eastern US, the percentage decrease from 2000 to 2018 was 66 % for total NOx emissions and 71 % for transportation and electric utility NOx emissions. NH3 emissions in Ontario and Quebec declined from 2002–2008 and were constant from 2008–2018. In the eastern US, there was a period of steady NH3 emissions from 2002–2011 (Fig. S5a), which was followed by a sharp drop from 2011–2014 and then an increase from 2014–2018 but emission levels were still below 2011 levels. Trends in NH3 emissions were primarily driven by agriculture activities (ECCC, 2021a; USEPA, 2021).
Weaker trends in atmospheric S and N at the west coast and prairie locations reflected the emission trends and levels in western Canada and the western US. The Canadian west coast is also affected by episodes of elevated sulfate and crustal dust associated with long-range transport from Asia (McKendry et al., 2008). The increasing contributions from intercontinental transport could result in weaker trends in airborne S and N at the west coast site. Compared with Ontario and Quebec, SOx and NOx emissions reductions in the western provinces of Canada were relatively modest during the 2000–2018 period (Fig. S5b). This was also the case when western and eastern US emissions were compared. Emission levels of SO2 and NOx in the western US were significantly lower than those of the eastern US. The lack of trend in atmospheric S and N at the prairie site was consistent with the leveling off in emissions of SOx and NOx in Saskatchewan where the prairie site is located. It is important to note that NH3 emissions have been rising since 2010 in western Canada (notably in Saskatchewan) and in the western US (Fig. S5b), which contrasts with the declining trend in eastern regions. The rise in NH3 emissions may have contributed to the secondary formation of and , which resulted in a weakened decreasing trend in and caused by declining SOx and NOx emissions. SO2 and NOx emissions in North Dakota, US, which borders Saskatchewan to the south, have seen a dramatic increase between the early 2000s and 2014–2018 due to the Bakken oil and gas development (USEPA, 2021). Further, emissions from the Canadian Athabasca oil sands region have contributed to exceedances of terrestrial and aquatic critical loads, which suggest potential ecosystem damage (Makar et al., 2018). In response to these anthropogenic activities, additional CAPMoN and provincial monitoring sites have started operating in this region in recent years. Ongoing monitoring is required to assess the air quality and ecological impacts of these industrial activities on ambient N and S in the northern Great Plains region (US) and prairie (Canada).
Table 1Regional breakdown of annual mean dry deposition fluxes of N and S (kg N or ) across Canada for the 2000–2018 period. Site ID and flux range in parentheses. Regional values are based on deposition fluxes from representative CAPMoN sites.
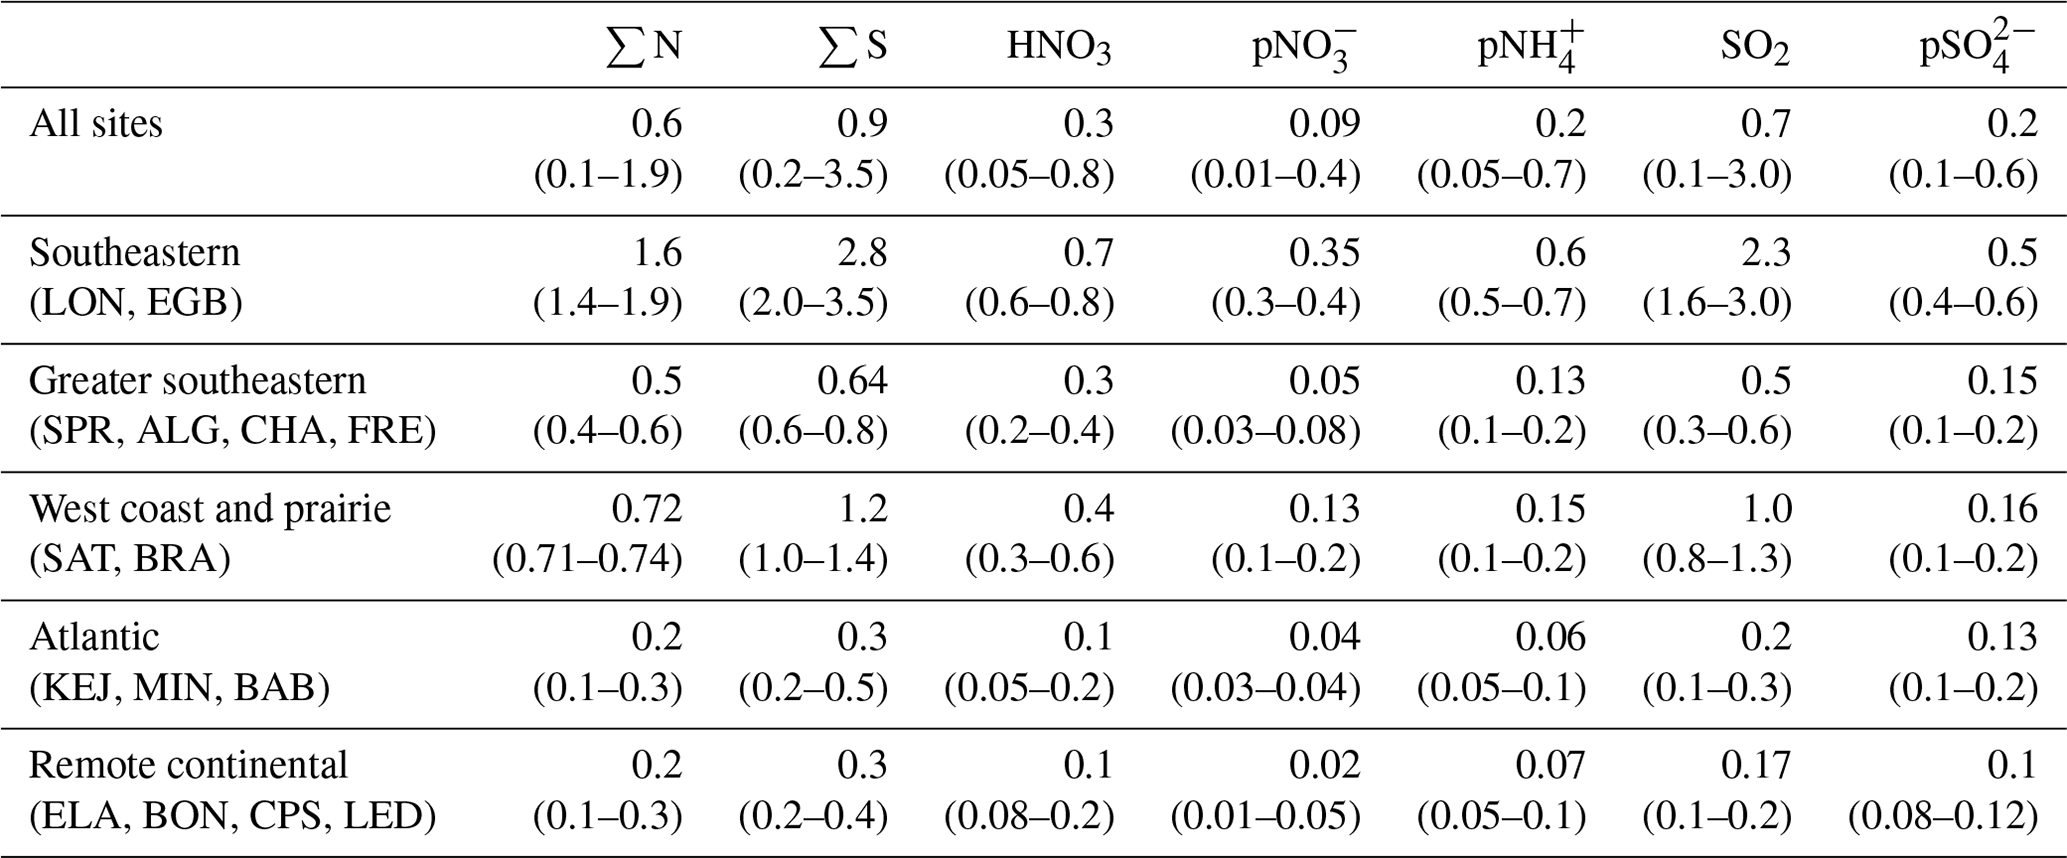
Table 2Percentage reduction in dry, wet, and total (dry + wet) N and S deposition from 2000–2004 to 2014–2018 period. NA: not available due to incomplete data coverage. % reduction = (mean annual flux2000−2004 − mean annual flux2014−2018) mean annual flux2000−2004.
3.2 Dry deposition fluxes
3.2.1 Geographical distribution
Dry deposition fluxes for each of the 15 sites were calculated for the period from 2000–2018. Table 1 presents a regional breakdown of annual dry deposition of S and N, averaged over the period, for the sites in each geographical area. For all 15 sites, the mean dry deposition was 0.6 and 0.9 (non-sea salt), where N ranged from 0.1 (MIN) to 1.9 (LON) , and S ranged from 0.2 (MIN) to 3.5 (LON) (Tables 1 and S3 in the Supplement). The values at MIN were particularly low in part because measurements began in 2009, after significant emission declines across the region. On a regional scale, the highest N and S dry depositions were observed at two sites in southeastern Canada (LON and EGB), which are strongly affected by large urban sources and transboundary pollution. The lowest N and S dry deposition fluxes were observed at several remote sites (ELA, BON, CPS, LED) and in the Atlantic region (KEJ, MIN, BAB).

Figure 2Dry N and S deposition fluxes (kg N or ) and the percentage of N or S species in dry deposition for the 5 year period in 2000–2004 and in 2014–2018 at CAPMoN sites. For each site, the first bar represents the 2000–2004 values and the second bar represents the 2014–2018 values. Gaseous species: HNO3 and SO2; particulate (p) species: pNO3, pNH4, and pSO4. Sites are listed in order longitudinally from west (left) to east (right).
Dry deposition fluxes for the regionally-grouped sites were compared over an early and recent 5 year period (i.e., 2000–2004 and 2014–2018). The spatial patterns in dry deposition of N and S remained consistent with the highest fluxes at the two southeastern sites (Fig. 2). The major difference between the two periods was the large decrease in dry deposition fluxes at all sites. Dry deposition of N decreased by ∼ 50 %, while dry deposition of S decreased by ∼ 71 % from 2000–2004 to 2014–2018 (Table 2). This is similar in magnitude to SO2 and NOx emissions reductions as discussed in Sect. 3.1. The percentage decrease in N dry deposition over the two periods was likely below 50 % if changes in NH3 and NO2 dry deposition were included (see detailed discussion below). Dry deposition of S on a mass basis was higher than that of N during 2000–2004; however, the fluxes of N and S were almost equivalent in the recent period (Fig. 2).
The relative role of gas versus aerosol phase dry deposition of routinely measured species was examined. Over the entire period (2000–2018), HNO3 contributions to dry deposition of N were greater than those of and at all sites (Table 1). This is because the dry deposition velocity of gaseous HNO3 is greater than that of particle N species (Table S2). The highest mean HNO3 dry deposition was observed in southeastern Canada (0.6–0.8 ), but in the greater southeastern region (less affected by urban regional transport) dry deposition was lower than at the west coast and prairie sites. Fluxes of HNO3 in the Atlantic region and remote sites (0.05–0.2 ) were among the lowest in Canada. Overall, there were minor contributions of and to N dry deposition across Canada with the exception of two sites in southeastern Canada (Table 1). Relative contributions of N species to dry N deposition were compared for the early and recent periods, and the percentages remained constant between the two periods. HNO3 contributed the greatest to N dry deposition (40 %–74 %), followed by (11 %–40 %) and (5 %–25 %) depending on the site (Fig. 2). The relative composition of N dry deposition varied from site to site yet remained relatively stable at each site during the two 5 year periods. The relative amounts of oxidized N dry deposition, which comprised HNO3 and , were nearly equivalent in the two periods. This is because of decreases in the dry deposition of both HNO3 and between the two periods (Fig. 2). As discussed below, relative contributions of HNO3, , and to N dry deposition would be smaller if NH3 and other N species were included in the dry deposition budget. Similarly, the proportion of oxidized N dry deposition was likely smaller with NH3 dry deposition considered.
Table 3Breakdown of atmospheric deposition of non-routinely (NR) and routinely (R) monitored N species at the EGB site in 2010, on an annual basis and during cold (January–April, November–December) and warm (May–October) seasons.
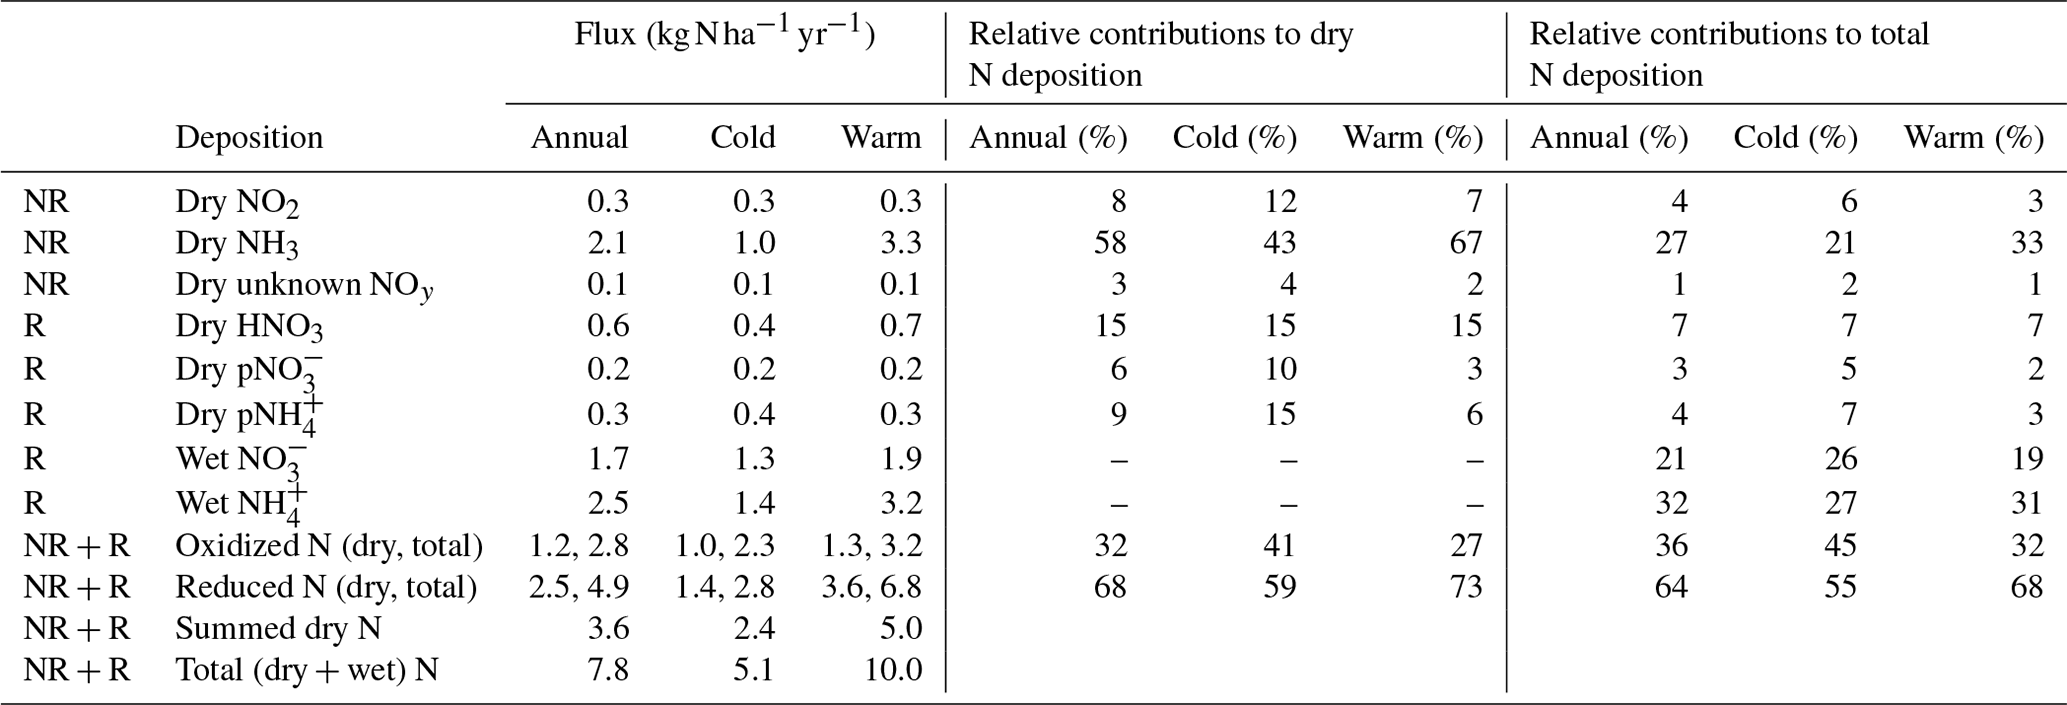
Gaseous NH3, NO2, PAN, PPN, and other NOy can also contribute to N dry deposition. It was estimated that 50 %–65 % of the N dry deposition during 2002–2005 at eight CAPMoN sites was attributed to N compounds that are not routinely monitored by CAPMoN, while 35 %–50 % was attributed to HNO3, , and (Zhang et al., 2009). Based on additional N measurements at EGB in 2010, the relative dry deposition of routinely versus non-routinely monitored N species was 30 % and 70 %, respectively, on an annual basis. The findings at EGB can be extrapolated to the LON site, which is another agricultural site in the same region (Table S1). BRA and FRE are also in agricultural regions and may have comparable contributions from NH3. The percentage of non-routinely monitored N species in dry deposition for non-agricultural sites is expected to be somewhat smaller because of the lower ambient NH3 with the exception of wildfire-impacted regions. At the BRA site, oil and gas emissions in the region may contribute to higher NO2 dry deposition, thereby the fraction of non-routinely monitored N species to the dry deposition could be even higher than at EGB. N dry deposition at EGB including those of routine species, NO2, NH3, and unknown NOy (e.g., PAN, PPN, other N species) was 3.6 kg N ha−1 in 2010 (Table 3). This was about three times the dry deposition of routine N species (1.1 kg N ha−1 in 2010). Table 3 shows that the dominant species in N annual dry deposition were NH3 (58 %) and HNO3 (15 %) followed by , NO2, , and unknown NOy, respectively. The N dry flux at EGB in 2010 was slightly lower than the 3.9 kg N ha−1 estimated in 2002 (Zhang et al., 2009). Oxidized N was the dominant form of N dry deposition in 2002 (Zhang et al., 2009). In 2010, oxidized and reduced forms comprised 32 % and 68 %, respectively, of the N dry deposition. This change was driven by a decrease in ambient oxidized N (9.5 ppbv in 2002 to 3.4 ppbv in 2010) and an increase in ambient reduced N notably from NH3 (1.2 ppbv in 2002 to 3.1 ppbv in 2010).
It should be noted that NH3 undergoes frequent bidirectional air–surface exchange processes in agricultural and unmanaged areas, and its dry deposition estimates at EGB presented here should be treated as upper-end values. Nevertheless, given NH3 was by far the largest contributor to N dry deposition for this 1 year period at EGB, including NH3 in routine monitoring and supplemental measurements (e.g., relating to air–surface exchange processes) should be a priority, in order to accurately assess the long-term levels and effects of N deposition and constrain bidirectional flux models (Zhang et al., 2010; Walker et al., 2019a).
At the 15 CAPMoN sites, dry deposition of S was dominated by SO2 at most sites except at BON, MIN, and BAB, which had equal contributions from SO2 and because of the relatively low SO2 concentrations at these three sites. Dry deposition of SO2 was 1.6 and 3.0 at the two sites in southeastern Canada, which represented the highest fluxes among the sites. Dry deposition of SO2 in the greater southeastern region was only ∼ 20 % of that observed at the two sites in southeastern Canada (Table 1). Dry fluxes of SO2 at the west coast and prairie sites ranged from 0.8 to 1.3 . The Atlantic region and remote sites recorded the lowest dry deposition of SO2 (0.1–0.3 ). Dry deposition fluxes of non-sea salt were generally small at the majority of the sites except for the two sites in southeastern Canada (Table 1). This is because Vd of the particulate species are typically smaller than the gaseous compounds (Table S2). Concentrations of may be higher or lower than those of SO2 depending on the site (Fig. S3). The relative contribution of SO2 to S dry deposition generally decreased between the early and recent 5 year period (Fig. 2). In 2000–2004, SO2 contributed 65 %–93 % of the S dry deposition depending on the site, while in the later period this ranged from 36 %–89 %. The relative dry deposition of increased over the years to 11 %–55 % and exceeded that of SO2 at five sites in the 2014–2018 period (Fig. 2). Feng et al. (2020) showed that the relative fraction of to total S in ambient air rose by 50.6 % as SO2 declined in the eastern US and eastern Canada for the 1989–2016 period.
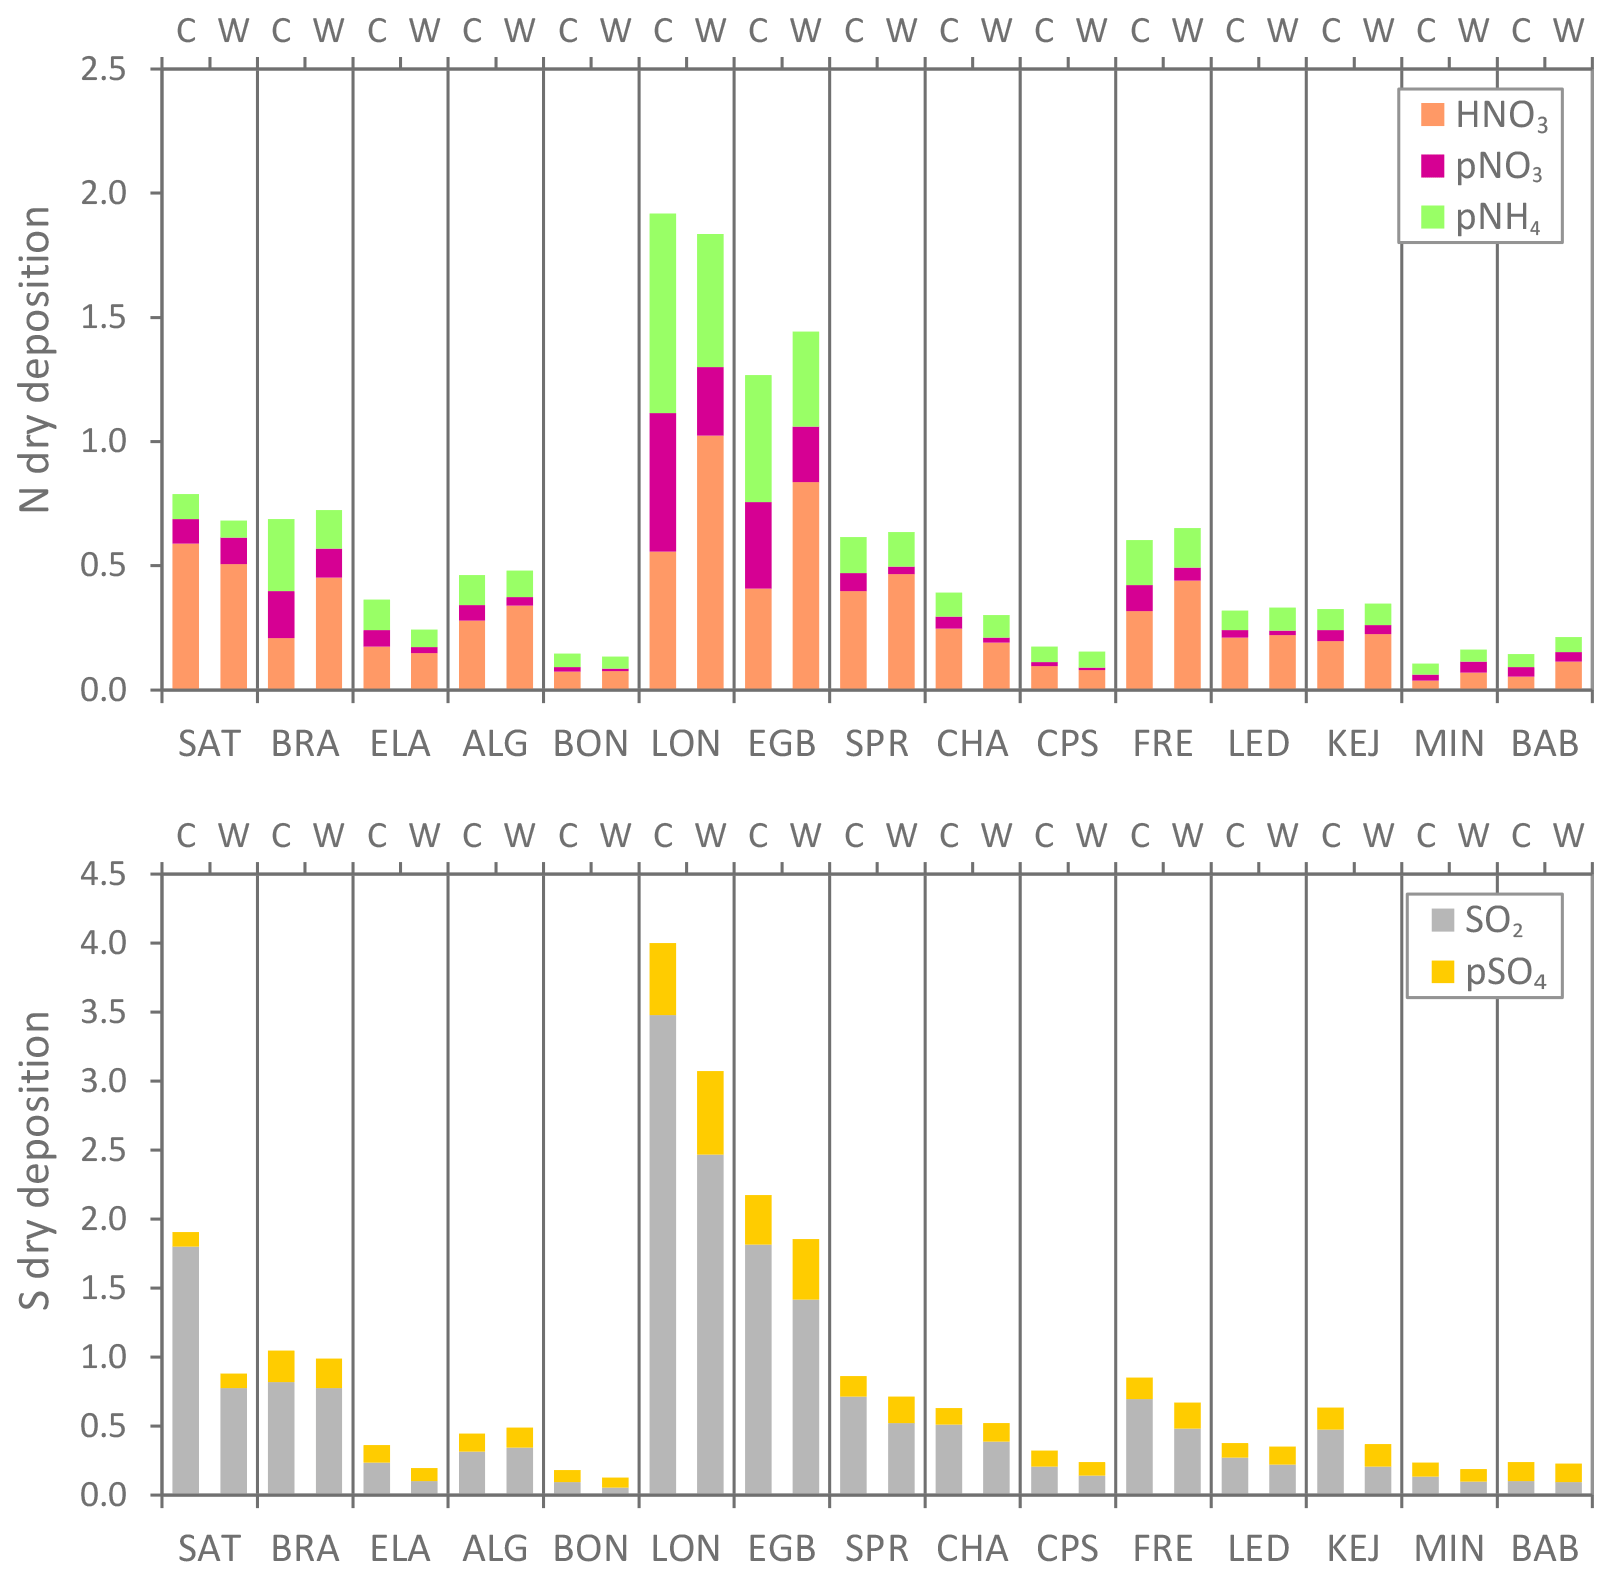
Figure 3Mean dry deposition fluxes of N and S species (kg N or ) during the cold (November–April) and warm (May–October) seasons during 2000–2018 at CAPMoN sites. C: cold season; W: warm season. Gaseous species: HNO3 and SO2; particulate (p) species: pNO3, pNH4, and pSO4. Sites are listed in order longitudinally from west (left) to east (right).
3.2.2 Seasonal patterns
Seasonal mean dry deposition of N and S are shown in Fig. 3. In the warm season (May to October), the deposition of HNO3 was higher at most locations. For example, mean dry deposition of HNO3 during the warm season was twice that of the cold season for the two sites in southeastern Canada and the prairie site (Fig. 3). This warm season increase is attributed to enhanced atmospheric oxidation especially at the more polluted sites, which are likely to observe higher oxidant mixing ratios. In the cold season (November to April), dry deposition of HNO3 decreased while that of and increased slightly (Fig. 3). This is due to the temperature-dependent gas–particle partitioning process, which is conducive to the formation of ammonium nitrate in the cold season. The seasonal patterns in dry fluxes were consistent with those of the ambient air concentrations. Concentrations of HNO3 were typically higher in the warm season, while were higher in the cold season (Feng et al., 2020).
Dry deposition of NH3 at EGB in 2010 was higher in the warm season than the cold season. Seasonal fluxes in that year were comparable for NO2 and unknown NOy. Further, relative contributions for the cold and warm season were 43 % and 67 % for NH3, 12 % and 7 % for NO2, and 4 % and 2 % for unknown NOy (Table 3). The higher NH3 dry deposition in the warm season is due to the higher NH3 mixing ratios resulting from elevated agricultural activity and their associated emissions and increased volatilization with warmer temperatures.
Unlike N, dry deposition of S was higher in the cold season, mainly driven by higher air concentrations of SO2 (Fig. 3). On average, dry deposition of SO2 in the cold season was ∼ 0.25 higher than that of the warm season, despite the somewhat lower cold season mean Vd of SO2 at most of the sites; however, this difference was as high ∼ 1 at SAT and LON. A likely explanation is that the atmospheric oxidation rate of SO2 in the cold season is much lower, which resulted in the higher ambient SO2 and its longer lifetime in the winter. This is consistent with model simulation results, which estimated that the lifetime of SO2 during winter and summer were 48 and 13 h, respectively (Lee et al., 2011). At the range of latitudes of the CAPMoN stations (∼ 45–55∘ N), the average gas-phase SO2 oxidation rate in the summer was approximately 11 times that of winter, with insignificant SO2 conversion in the winter (Altshuller, 1979). Although the magnitude of the fluxes differed between seasons, the geographical distribution of the fluxes were generally consistent. In both seasons, S dry deposition was highest at the two sites in southeastern Canada followed by the west coast and prairie site. The Atlantic region and remote sites received the lowest dry deposition of S in the cold and warm seasons. For , there were minor differences in the dry deposition fluxes between seasons (Fig. 3).
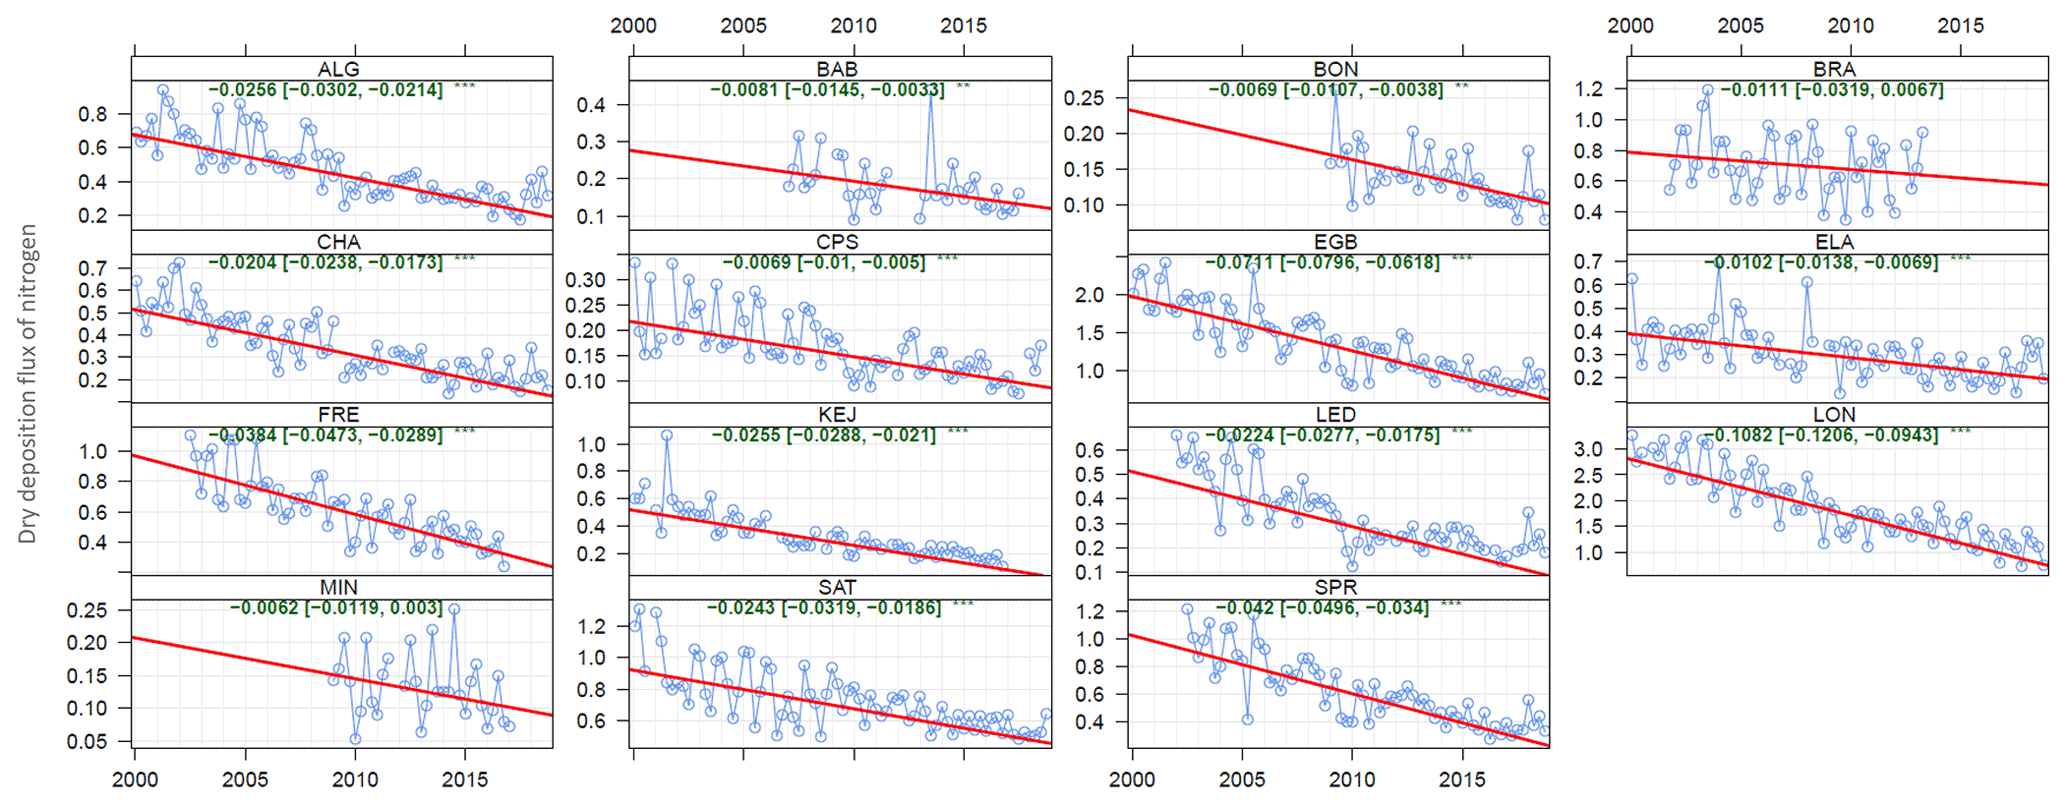
Figure 4Annual trends in dry deposition fluxes of nitrogen at CAPMoN sites (). Theil–Sen slope and 95 % confidence interval (green text); trend line de-seasonalized using LOESS (red line); observed seasonal mean dry deposition fluxes (blue time series). Note: excludes NH3 and other NOy dry deposition. Statistically significant trends shown with (p < 0.001) or (p < 0.01).
3.2.3 Long-term annual trends
Long-term trends in annual dry deposition of total N and S at 15 CAPMoN sites estimated using Theil–Sen slopes are shown in Figs. 4 and 5, respectively. The rate of decrease in annual dry N deposition ranged from −0.007 (BON) to −0.11 (LON) during the 2000–2018 period. This is equivalent to percentage decreases of −2.6 % to −5.0 % per year (Table S4 in the Supplement). The largest rate of decline in N dry deposition was at the two sites in southeastern Canada, LON and EGB (Fig. 4). Greater interannual variability in N dry fluxes at these two sites was due to the larger variability in their ambient concentrations. Ambient N concentrations at these two locations have been the highest among CAPMoN sites since measurements began in 1983 (Cheng and Zhang, 2017) because of the strong influence of local urban and transboundary pollution. In the last 2 decades, ambient N concentrations have decreased significantly as a result of air pollution control measures aimed at reducing NOx emissions in Canada and the US (Sect. 3.1). This improvement in air quality was largely responsible for the decrease in dry deposition of N and S. The reductions in dry deposition fluxes were not attributed to changes in annual Vd of N and S species based on Theil–Sen's analysis (Sect. S1.3, Fig. S2 in the Supplement). Moderate rates of decline in dry deposition of N were observed in the greater southeastern region (SPR, FRE, CHA, ALG), west coast (SAT), and in the Atlantic region (LED, KEJ). Weak declining trends were estimated at remote sites (ELA, BON, CPS, BAB), where the ambient N concentrations have always been the lowest in Canada. Thus, the interannual variability at remote sites were also much smaller compared with southeastern Canadian sites. Although the absolute rates of decrease were small, the percentage reductions in dry N deposition across Canada were substantial (Table 2). No trends were found at BRA and MIN.
At LON, EGB, and FRE, the decreasing trends in dry N deposition from 2000–2018 were driven by the decrease in HNO3 and dry deposition. The rates of decline in dry N deposition () from HNO3 and , respectively, were −0.040 and −0.043 at LON, −0.027 and −0.027 at EGB, and −0.025 and −0.011 at FRE (Fig. S6 in the Supplement). In other parts of Canada, the decrease in dry N deposition was largely due to those of HNO3, while and showed a very weak trend. As reported by Feng et al. (2020), there was also a lack of trend in the annual mean concentrations of in eastern Canada and the eastern US except for the Midwest.
The annual rate of decrease in dry deposition of S was greater than that of N at all sites, which was consistent with the trends in their ambient air concentrations. The rates of decrease varied from −0.016 (BON) to −0.35 (LON) (percentage decreases of −4.2 % yr−1 to −7.1 % yr−1; Fig. S6 and Table S4). Similar to dry N deposition, the steepest declines in dry S deposition were found at LON and EGB (Fig. 5). Rates of decrease in dry S deposition were also substantial at the west coast site (SAT) and the greater southeastern region (SPR, FRE). Moderate decreasing trends in dry S deposition were found at other southeastern Canadian sites (ALG, CHA) and in the Atlantic region (LED, KEJ). Remote sites including ELA, BON, CPS, and BAB exhibited weak temporal trends in dry S deposition. No trends in dry S deposition were found at BRA and MIN.
Table 4Rate of change in annual dry deposition fluxes of N and S species (kg N or ) at CAPMoN sites, based on Theil–Sen slopes (statistically significant at p < 0.05). Pre-2010: 2000–2009 period; post-2010: 2010–2018 period; NA: not available due to incomplete data; ns: trend is not statistically significant. Note: ∑ nitrogen excludes dry deposition of NH3 and some oxidized nitrogen species.

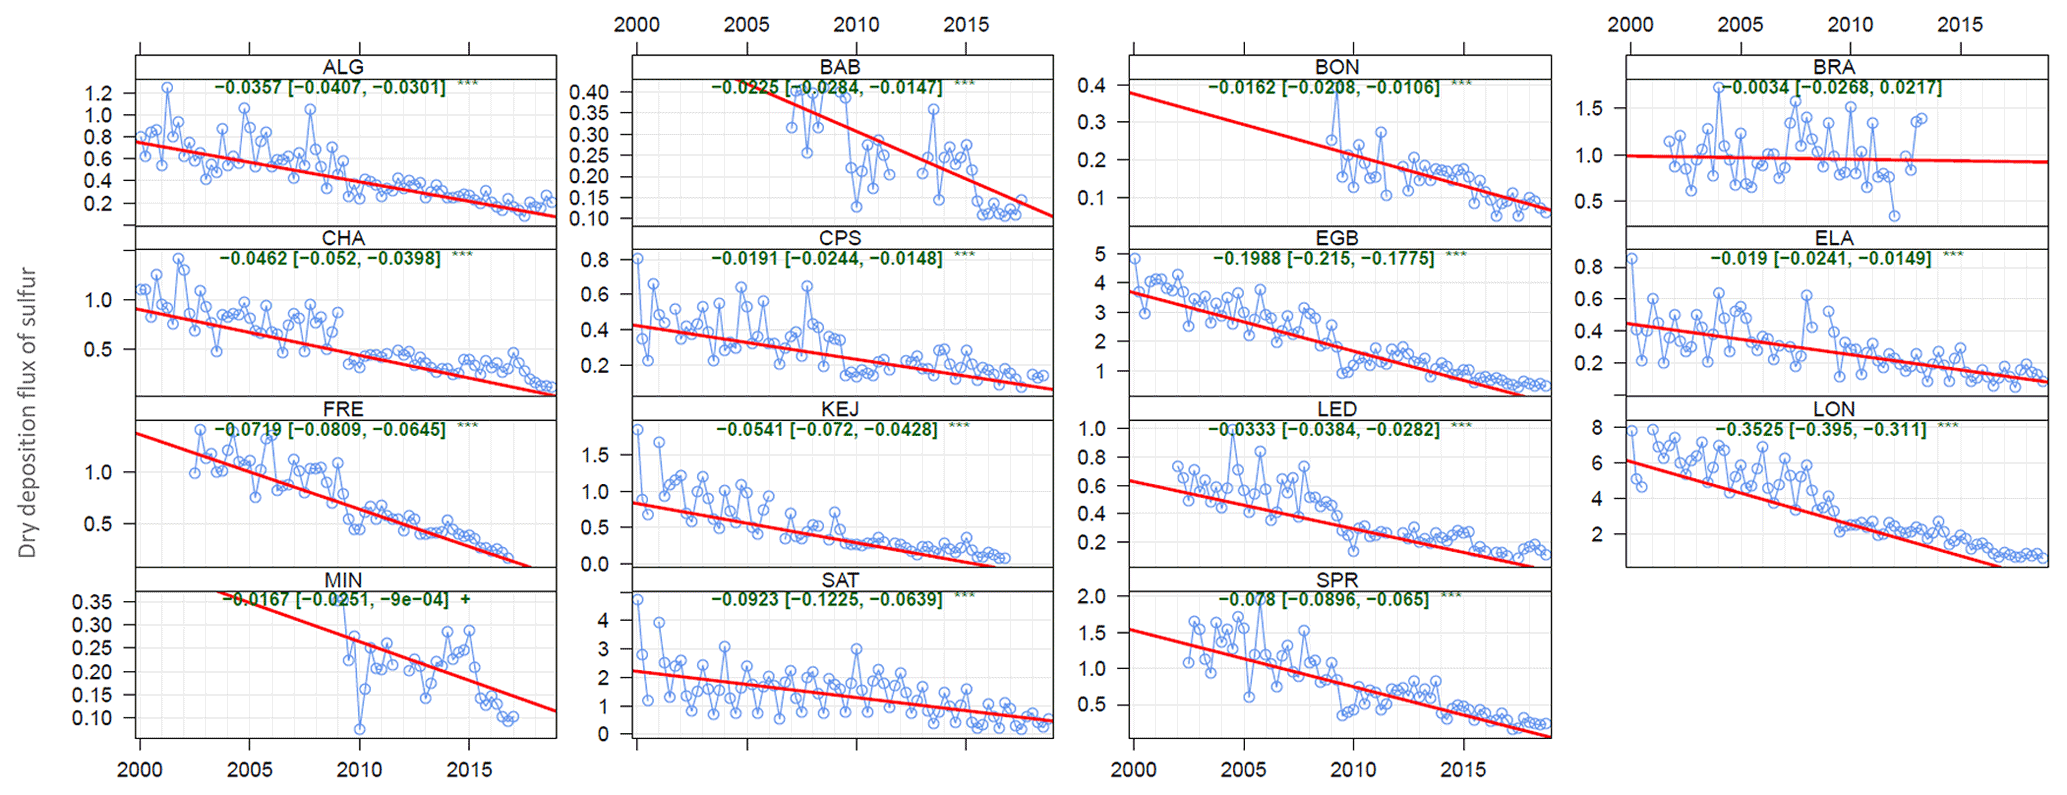
Figure 5Annual trends in dry deposition fluxes of sulfur at CAPMoN sites (). Theil–Sen slope and 95 % confidence interval (green text); trend line de-seasonalized using LOESS (red line); observed seasonal mean dry deposition fluxes (blue time series). Statistically significant trends shown with (p < 0.001) or + (p < 0.1).
Although the overall trends are shown in Figs. 4 and 5, there were differences in the rates of decline in N and S annual dry deposition for the periods before and after 2010. Annual dry N deposition decreased more rapidly during 2000–2009 compared to 2010–2018 (Table 4). Based on 11 sites with sufficient pre- and post-2010 data, the rate of change in annual dry N deposition ranged from −0.009 to −0.16 pre-2010 and −0.009 to −0.08 post-2010. The magnitude of the trend at LON after 2010 was half of that before 2010. Furthermore at 3 of the 11 sites (ELA, CPS, LED), the trends in annual dry N deposition were not statistically significant for the period after 2010. The current trend in annual dry N deposition appears to be weakening across Canada, which is similar to the NOx emissions trends in Canada (Sect. 3.1). There was also a shift in the N compounds driving the declines in annual dry N deposition before and after 2010. At LON and EGB, the dry N deposition trends were equally dominated by those of HNO3 and during 2000–2009. After 2010, the trends in HNO3 dry deposition plateaued and those of drove the weaker dry N deposition trends in this period (Table 4). This result was likely attributed to the flattening in NOx emissions. Meanwhile, as SO2 ambient concentrations continued to decline after 2010, the secondary formation of was also reduced. Potential increases in NH3 dry deposition could result in weaker dry N deposition trends; however, this needs to be tracked through expanded ambient NH3 monitoring across Canada.
For annual dry S deposition, the rate of decrease was much slower during 2010–2018 compared to the previous decade (Table 4). For example, the magnitude of the trends at LON and EGB were 50 %–60 % of that in the previous decade. This was due to the weaker trend in ambient SO2 concentrations after 2010, which can be traced back to a similar weak trend in SOx emissions in Ontario and Quebec. Interestingly, the rate of decline in annual dry S deposition accelerated after 2010 at SAT and ELA (Table 4). The decline at SAT is likely associated with reductions in ambient SO2 in the port of Vancouver and Victoria (Canadian west coast), which was driven by the implementation of new regulations requiring the use of low-sulfur fuel in marine transportation in Canadian waters (Anastasopolos et al., 2021). Prior to 2010, the trends were not statistically significant at either site.
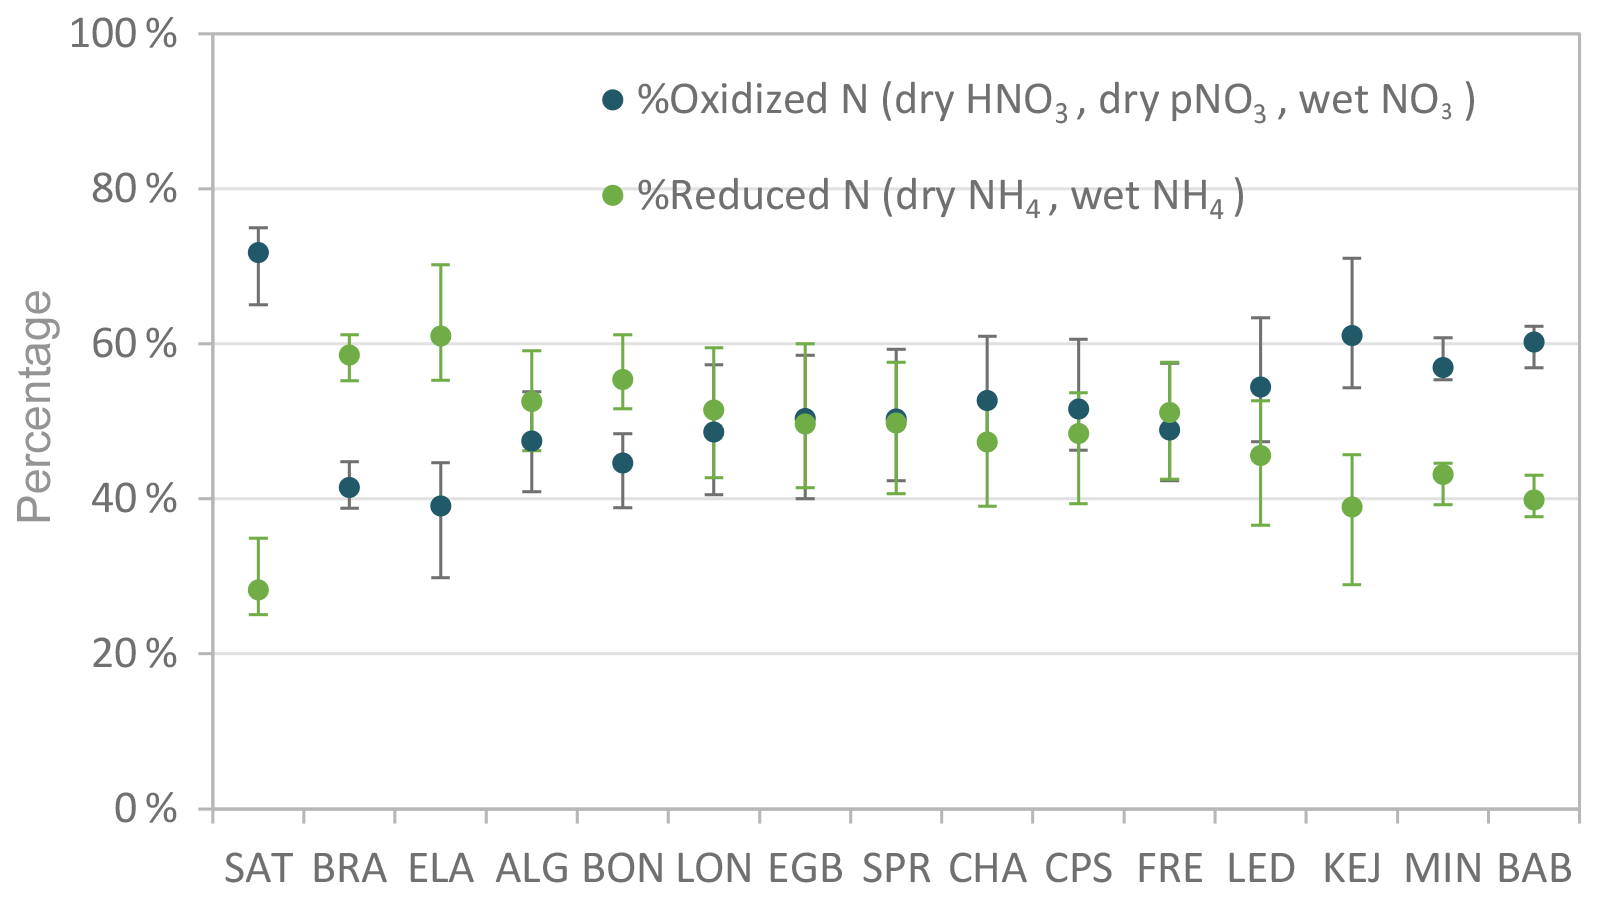
Figure 6Percentage of oxidized and reduced N species in annual total deposition of N at CAPMoN sites during 2000–2018. Mean (circle); range or annual variability (error bars). Sites are listed in order longitudinally from west (left) to east (right).
Table 5Regional breakdown of mean total (dry + wet) N and S deposition fluxes (kg N or ) across Canada. Regional values are based on deposition fluxes from representative CAPMoN sites.
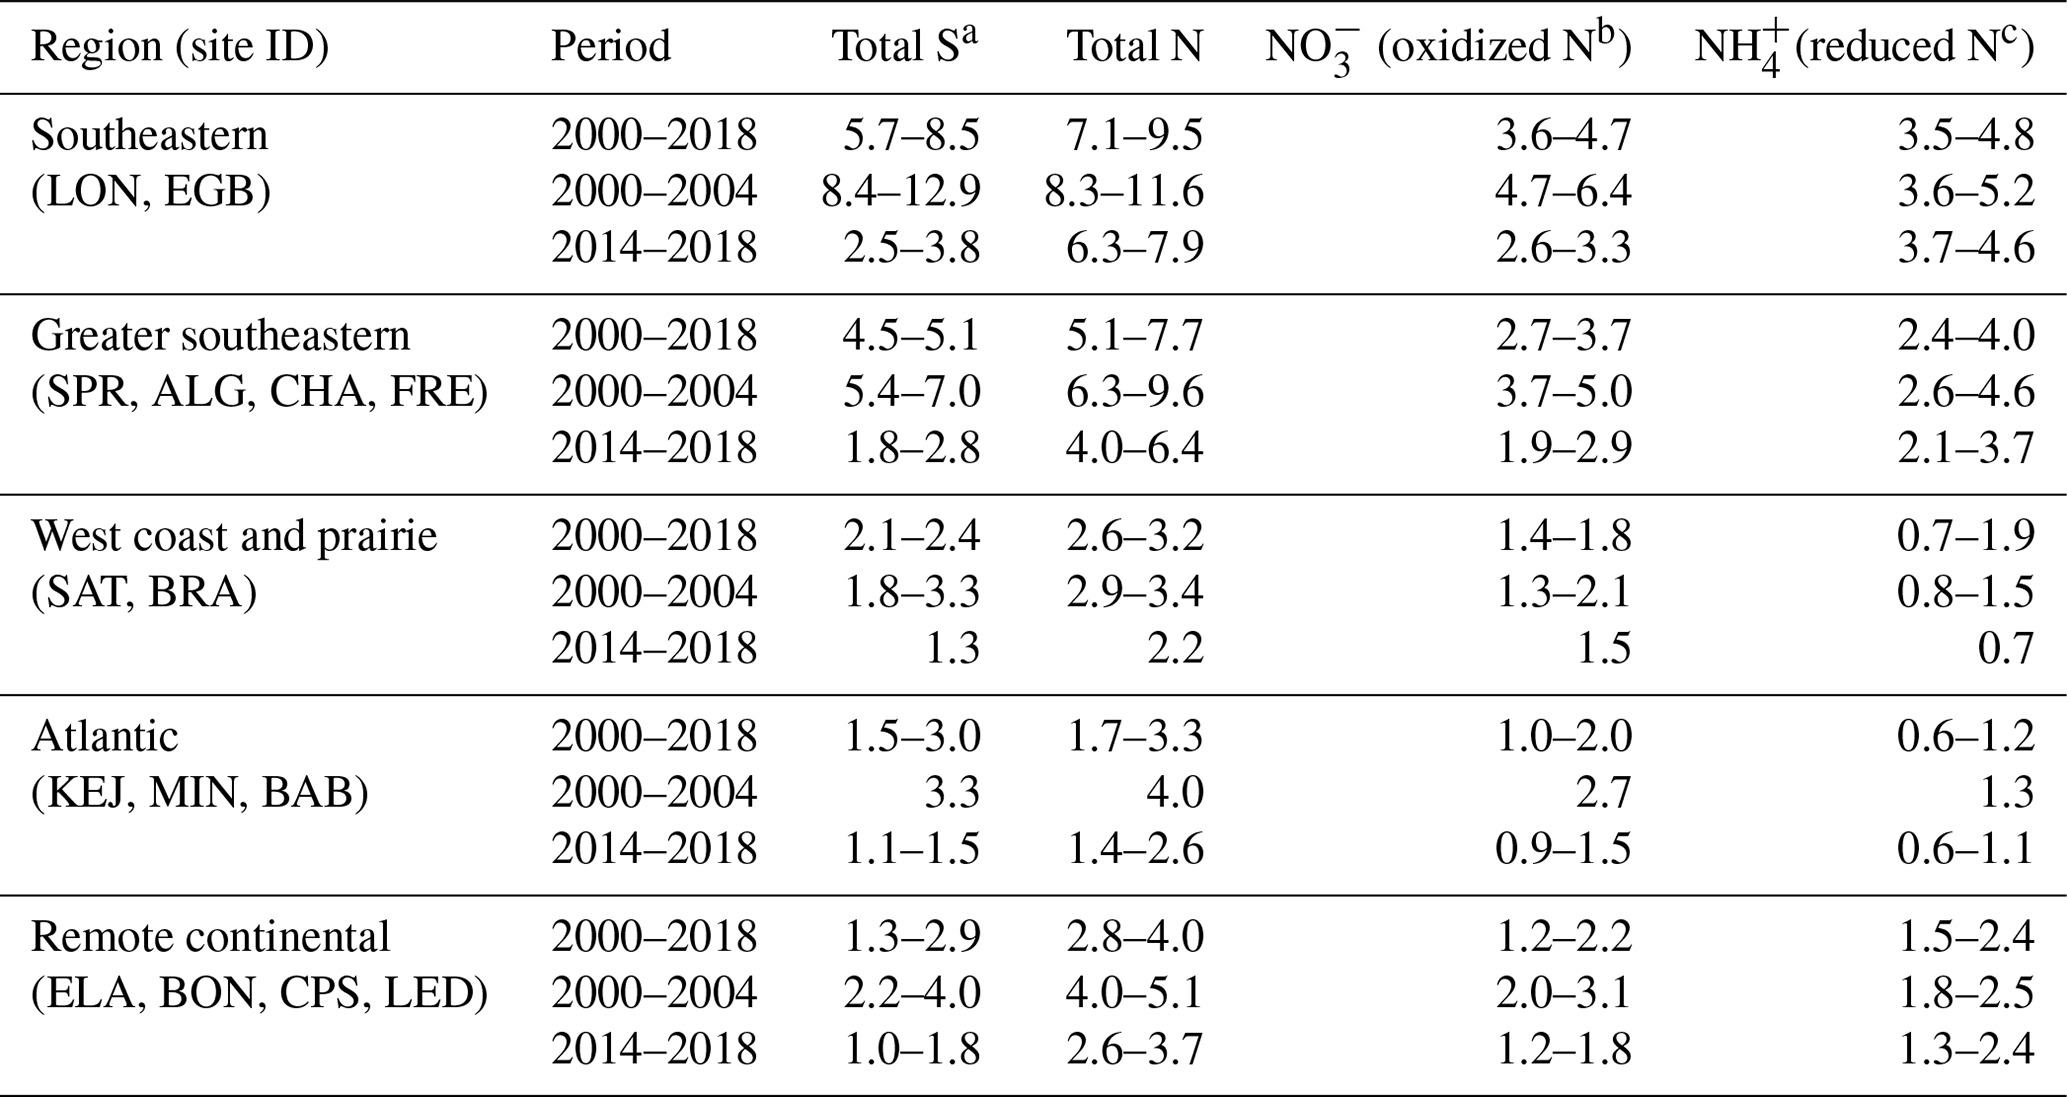
a total S includes dry SO2, dry , and wet ; b oxidized N includes dry HNO3, dry , and wet ; c reduced N includes dry (no NH3) and wet
3.3 Total deposition fluxes
3.3.1 Geographical distribution
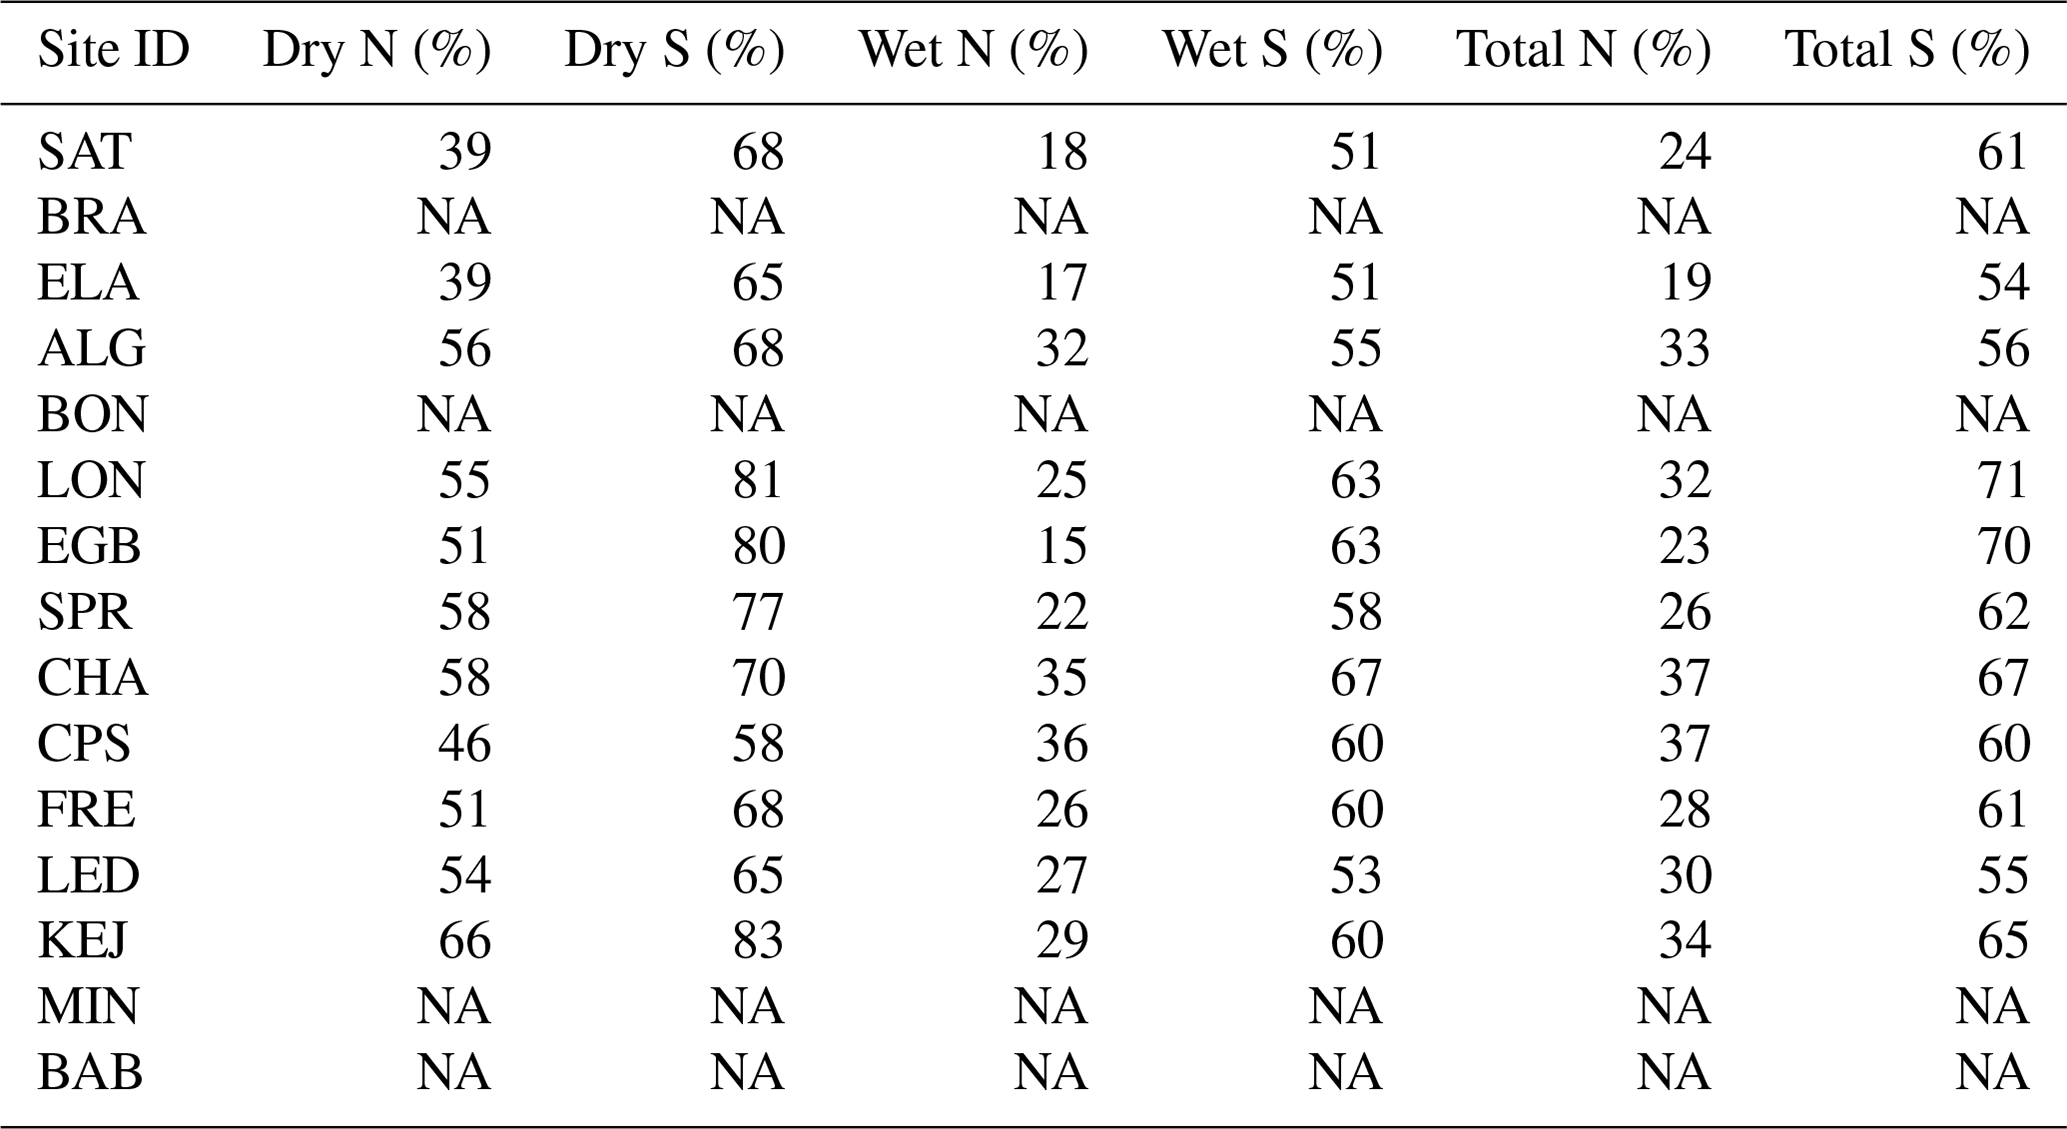
Total deposition fluxes were obtained by summing the dry deposition flux estimates and wet deposition measurements. Total deposition fluxes of N and S during 2000–2018 ranged from 1.7 to 9.5 and from 1.3 to 8.5 across Canada. Total S deposition flux in Canada was lower than that in the continental US over a similar timeframe (2002–2017), namely 1–11 (Benish et al., 2022). Total N and non-sea salt S deposition were highest in the southeastern region and were comparable among west coast, prairie, remote continental, and Atlantic region sites (Table 5). As illustrated in Fig. 6, the percentage of oxidized and reduced N were similar in the southeastern region; however, oxidized N does not include NO2 dry deposition and reduced N does not include NH3 dry deposition. Oxidized N was greater than reduced N deposition at the west coast site and in the Atlantic region, while reduced N exceeded oxidized N at the prairie and remote continental sites (Fig. 6).
The inclusion of NO2, NH3, PAN, and unknown NOy dry deposition increased the total N deposition during the 2002–2005 period from 4.2–9.5 (routinely monitored N) to 4.6–11.6 , depending on the site (Zhang et al., 2009). The increase in total N deposition due to the inclusion of NO2, NH3, PAN, and unknown NOy dry deposition was greater at CAPMoN sites near agricultural areas (∼ 1.7 increase) compared with other sites (∼ 0.4 increase) (Zhang et al., 2009). At the EGB site, which is surrounded by agricultural areas, NH3 dry deposition was a significant contributor to total N deposition. Dry deposition of the non-routinely monitored species increased the total N deposition at EGB from 5.2 kg N ha−1 (routinely monitored N) to 7.75 kg N ha−1 in 2010 (Table 3). Note that the N dry deposition of the non-routinely monitored species at EGB in 2010 was only ∼ 0.3 higher than that in 2002. This was because the increase in NH3 dry deposition from 2002 to 2010 was largely offset by the decrease in NO2 dry deposition. The importance of agricultural NH3 to local and downwind total N deposition is evident (Warner et al., 2017; Walker et al., 2019a; Hu et al., 2021; Pan et al., 2021); however, quantifying its role remains elusive in natural lands in Canada because of limited measurements. Satellite generated surface-level air concentration data of some important nitrogen species (e.g., NH3 and NO2), once available for multiple years, could be potentially useful in filling the data gaps described in this study (Kharol et al., 2018). Passive NH3 measurements, which are part of the National Atmospheric Deposition Program's Ammonia Monitoring Network, are also ongoing at selected CAPMoN sites. Estimates of NO2, NH3 and other N species from chemical transport models and model–measurement fusion products are suitable for quantifying total N deposition over broader scales beyond CAPMoN stations.
In the early 2000s, total N deposition fluxes were comparable by mass to those of total S (Table 5). During the latter period in 2014–2018, total N deposition exceeded that of total S in most regions. This is due to the large declines in ambient S from the early 2000s to the recent period. Significant declines in total N and S deposition were observed between the two periods with percentage decreases of 19 %–37 % and 54 %–71 %, respectively (Table 2). Oxidized N (i.e., dry HNO3 + dry + wet ) deposition was greater than that of reduced N (i.e., dry + wet ) during 2000–2004 in all regions (Table 5). During 2014–2018, reduced N deposition surpassed oxidized N deposition in the southeastern region; however, oxidized N deposition continued to be greater than reduced N deposition at the west coast site and in the Atlantic region.

Figure 7Percentage of wet and dry annual deposition of (a) nitrogen and (b) sulfur at CAPMoN sites during 2000–2018. %ddep TN includes dry deposition of oxidized N (HNO3 and ) and reduced N (). Mean percentage (circles); range or annual variability in the percentage (error bars); mean annual precipitation amount (diamonds). Sites are listed in order longitudinally from west (left) to east (right).
3.3.2 Relative contributions of dry and wet deposition
Total N deposition was dominated by wet deposition of and , while total S deposition was dominated by wet deposition of and dry deposition of SO2. Annual wet deposition of total N and S averaged over all years were greater than those of dry deposition. Wet N deposition ranged from 71 % to 95 % depending on the location (Fig. 7), while wet S deposition varied from 45 % to 89 %. At the west coast, prairie, and southeastern sites, the relative contribution from dry deposition was slightly higher compared with other sites (Fig. 7). This is due to the lower precipitation amounts in the west coast and prairie sites and the higher atmospheric N and S concentrations at the two southeastern sites. At EGB, the relative wet and dry N deposition of routine species were 79 % and 21 %, respectively, in 2010. With the inclusion of dry deposition of NO2, NH3, and unknown NOy, the relative N dry deposition increased to 47 %. The relative total N deposition in 2010 was dominated by wet deposition, NH3 dry deposition, and wet deposition (Table 3), whereas in 2002, and wet deposition and NOy dry deposition comprised the bulk of total N deposition (Zhang et al., 2009). A comparison between 2002 and 2010 shows a clear shift from the predominance of oxidized N to reduced N in total deposition at EGB if NH3 dry deposition is accounted for.
Ratios of wet to dry deposition fluxes varied between sites. On average, wet deposition exceeded dry deposition by a factor of 10 for total N and a factor of 5 for total S. There were also large differences between wet and dry deposition of oxidized and reduced N. Mean wet/dry flux ratios for oxidized and reduced N were ∼ 7 (range: 1.7 to 14.7, depending on location) and ∼ 18 (range: 6.2 to 32.9), respectively. The large disparity between wet and dry deposition of reduced N was likely because of the lack of data on dry NH3 deposition and the minor contribution to dry deposition from . For example, the wet/dry flux ratio for reduced N at EGB in 2010 was 7.2 without considering NH3 dry deposition, whereas the ratio was only 1.0 after including NH3 dry deposition. Thus, the actual ratio should be between 1.0 and 7.2 if bi-directional exchange is considered for NH3.
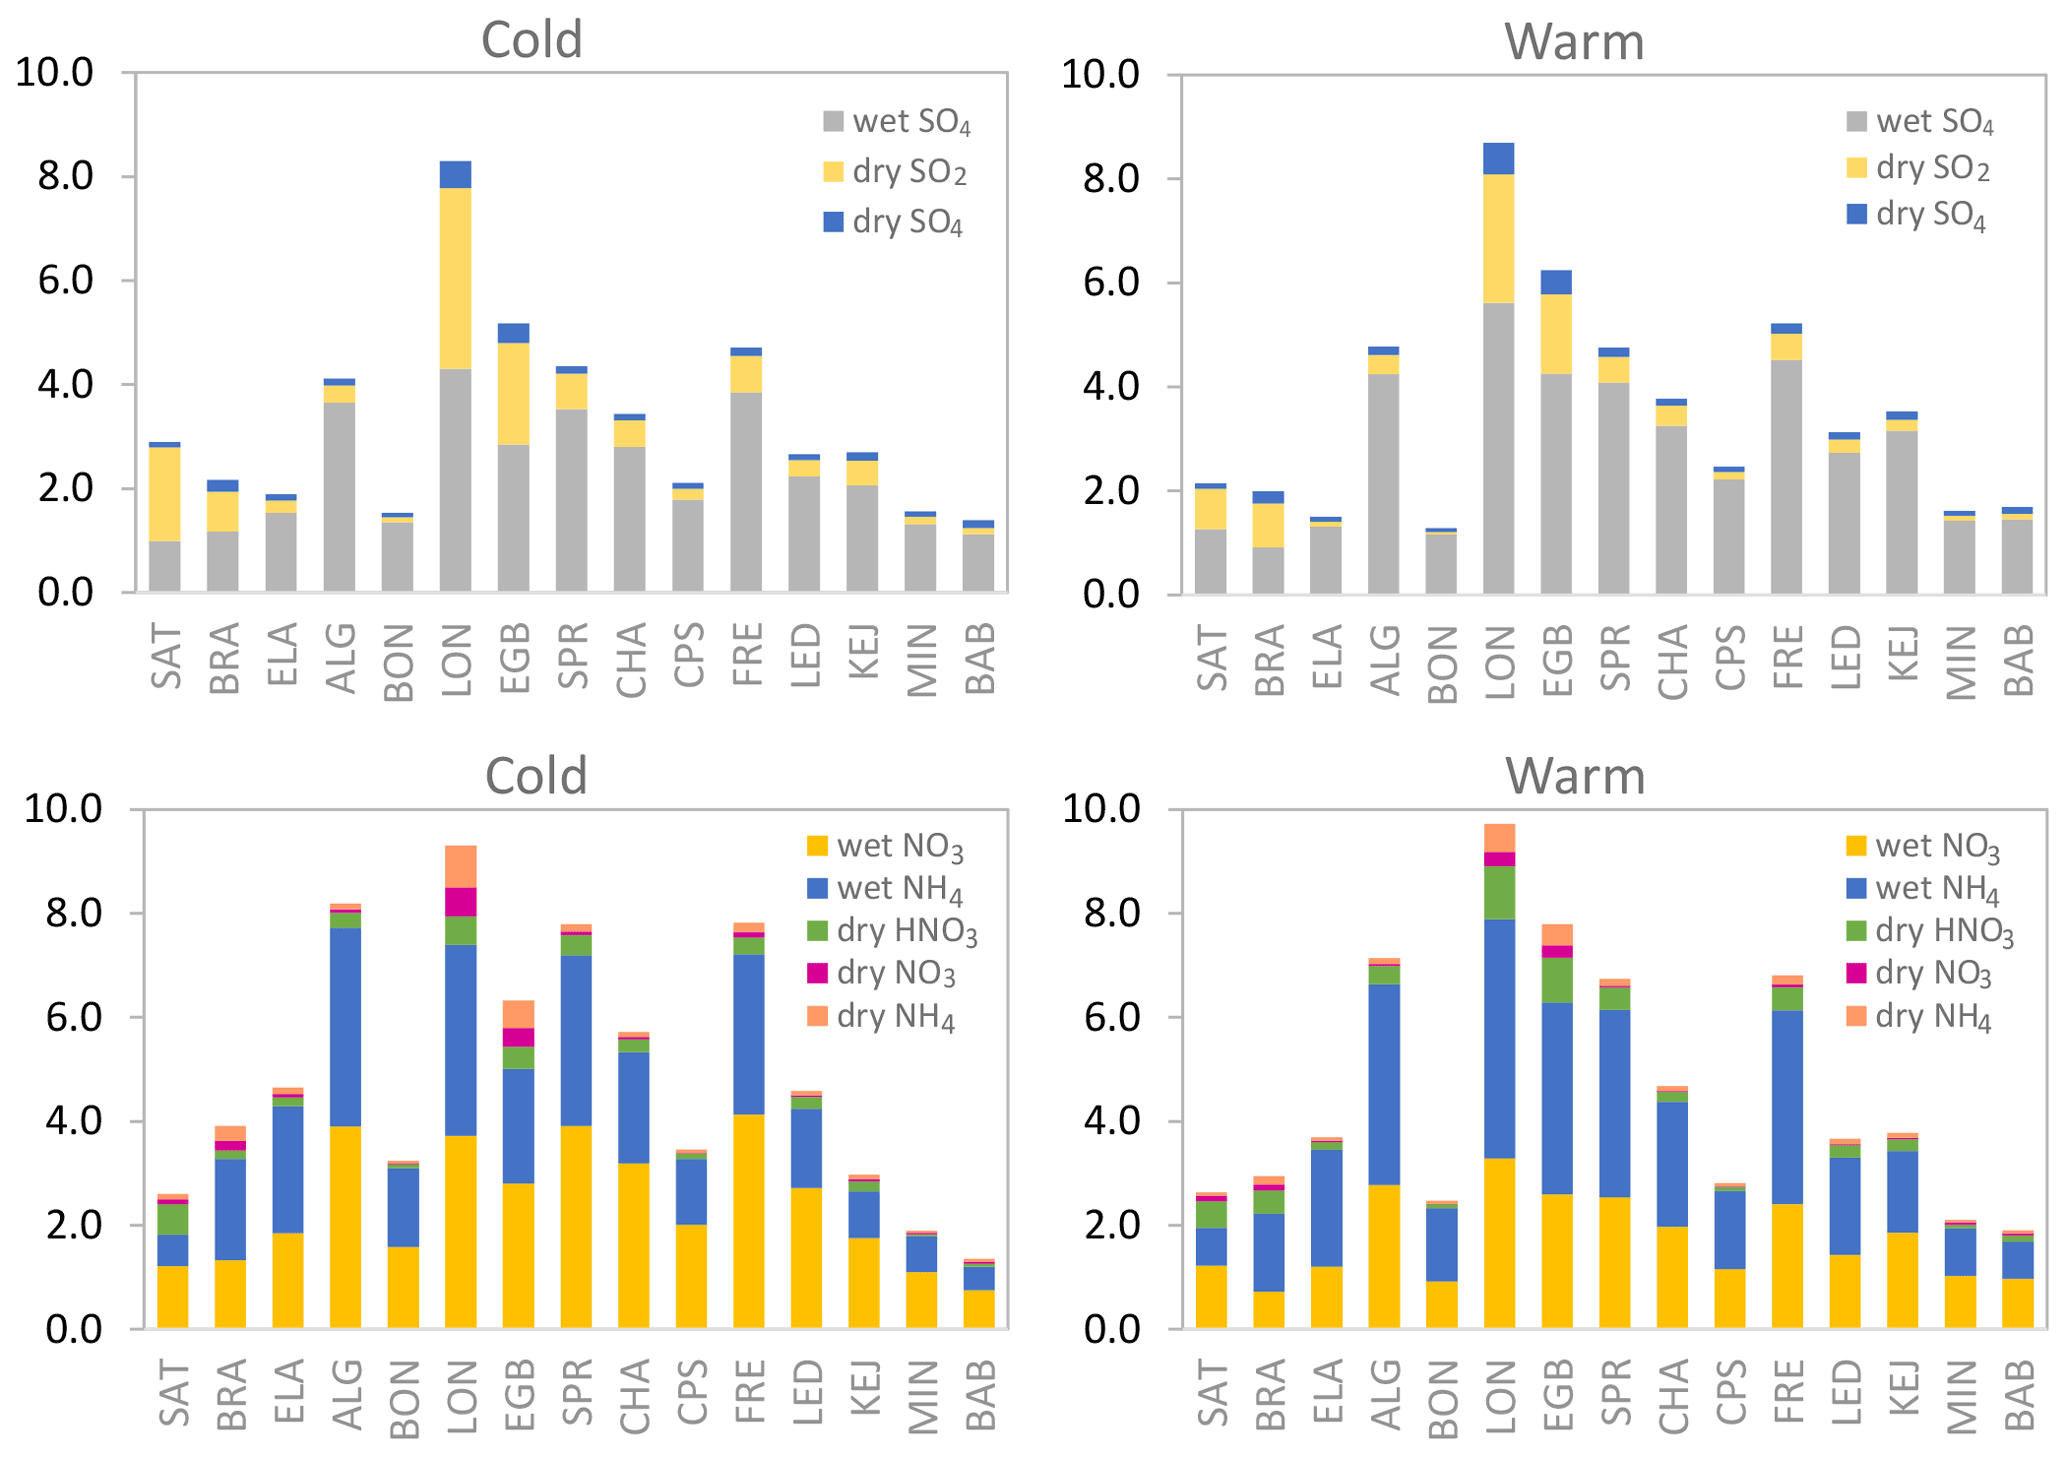
Figure 8Mean total (dry + wet) deposition fluxes of N and S species in kg N or during the cold (November–April) and warm (May–October) seasons at CAPMoN sites during 2000–2018. Sites are listed in order longitudinally from west (left) to east (right).
3.3.3 Seasonal patterns
Mean cold and warm season fluxes of total N were 1.4 to 9.3 and 1.9 to 9.7 . Larger differences in the fluxes between seasons were observed for N deposition. Notably, mean total N deposition in the cold season was greater than in the warm season by ∼ 1 at BRA, ELA, ALG, SPR, CHA, FRE, and LED (Fig. S7 in the Supplement). At EGB, the warm season flux exceeded the cold season flux by 1.5 . Total N deposition was dominated by wet in the cold season and by wet in the warm season (Fig. 8). Wet deposition was greater in the cold season than in the warm season and vice versa for wet deposition. The proportion from dry N deposition (i.e., HNO3 + + ) was similar between the cold and warm season at most sites.
Mean total deposition of S ranged from 1.4 to 8.3 during the cold season and 1.3 to 8.7 during the warm season. Seasonal differences in total S flux were large at only a few sites. For example, the cold season flux at SAT was 0.75 greater than the warm season flux, whereas the warm season flux at EGB was 1.1 greater than the cold season flux at EGB (Fig. S8 in the Supplement). Wet deposition dominated the total deposition of S at most sites in either season, except for the west coast and prairie sites and two southeastern sites. At these sites, dry S and wet deposition were nearly equivalent during the cold season (Fig. 8). At most of the sites, wet deposition was greater while dry S deposition was smaller in the warm season than in the cold season.
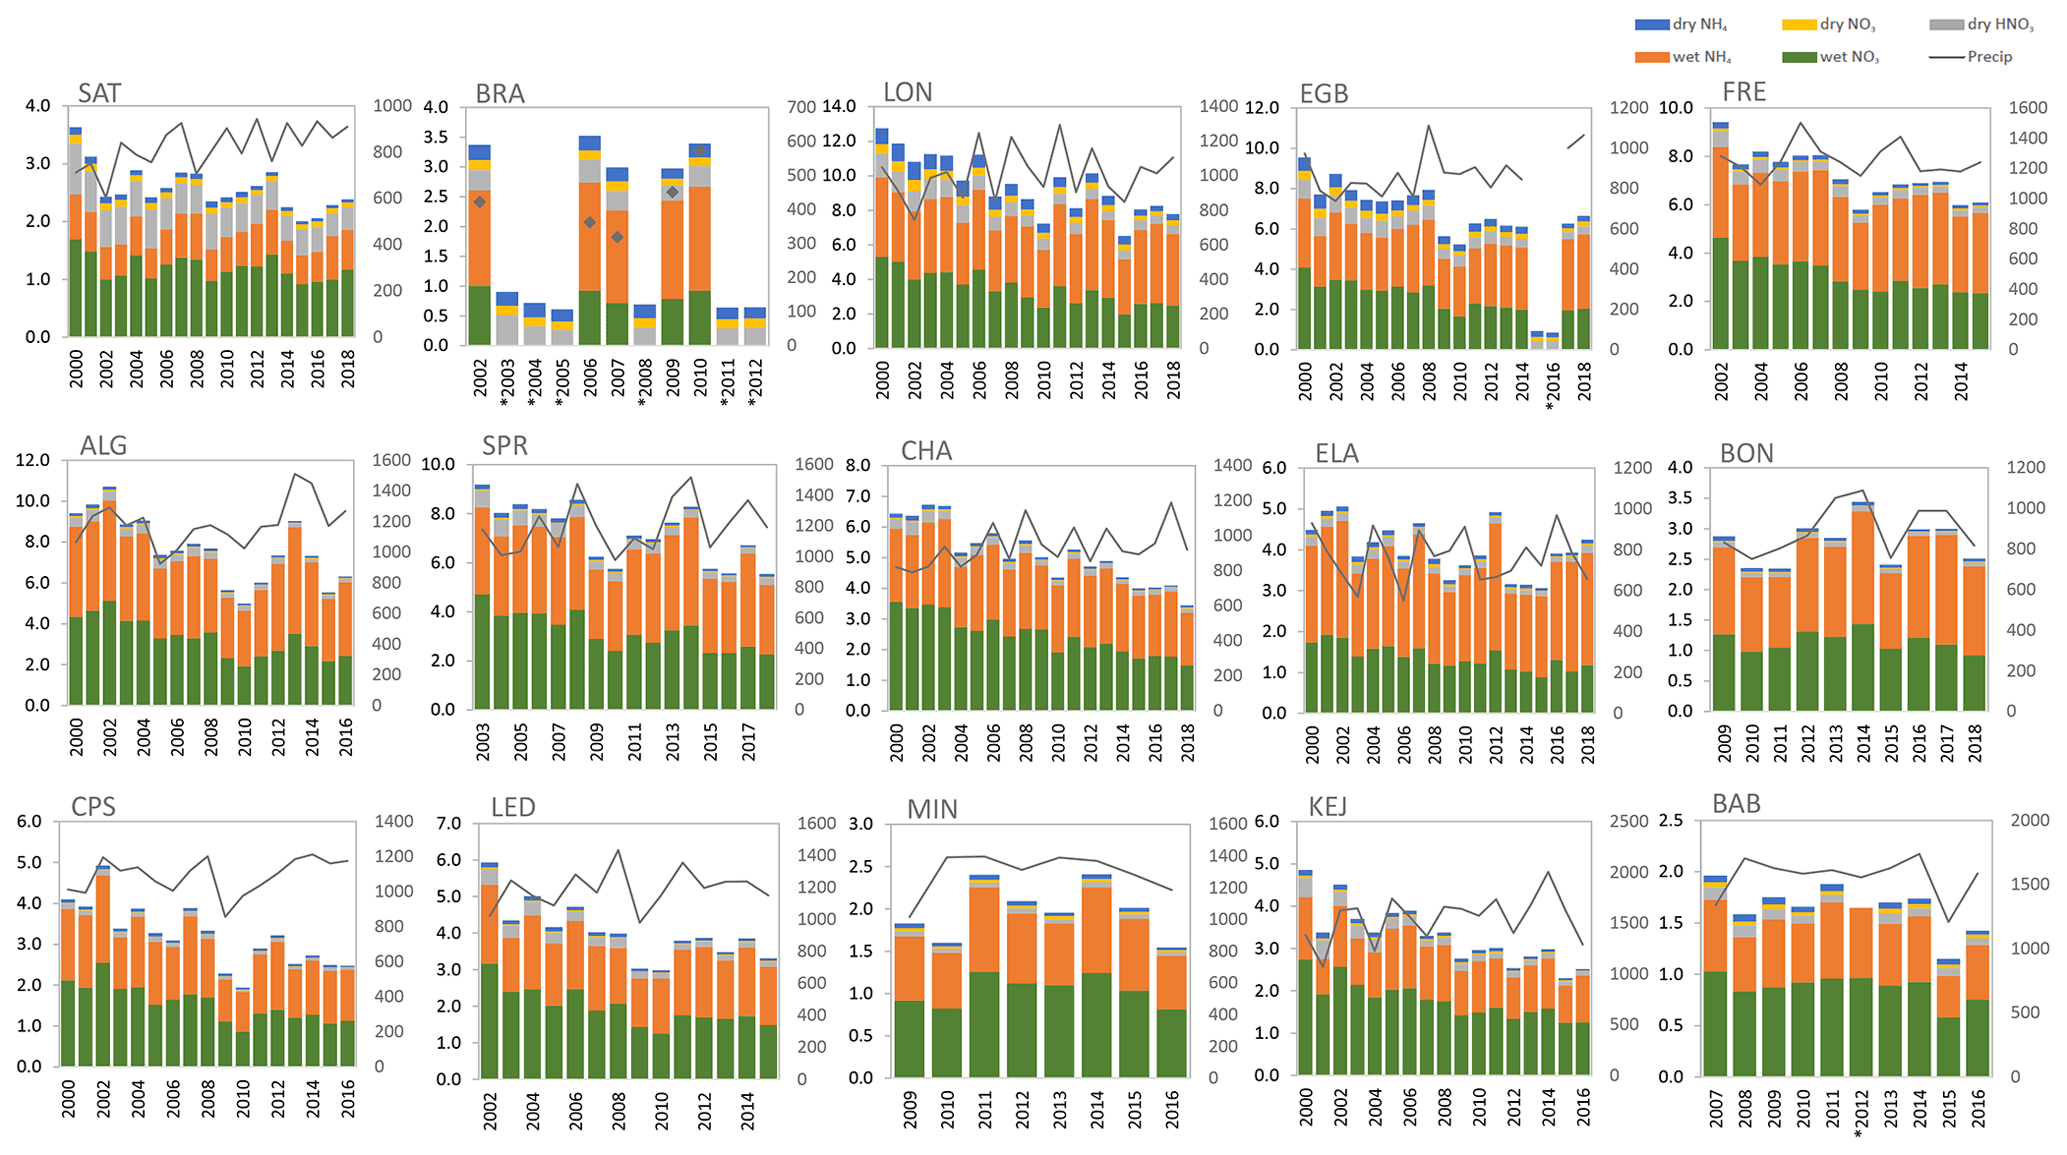
Figure 9Long-term annual trends in total (dry + wet) deposition of nitrogen at CAPMoN sites, 2000–2018. Total deposition (, primary y axis); precipitation (mm yr−1, secondary y axis); ∗ indicates dry or wet deposition data were not available because data completeness criteria was not met.

Figure 10Long-term annual trends in total (dry + wet) deposition of sulfur at CAPMoN sites, 2000–2018. Total deposition (, primary y axis); precipitation (mm yr−1, secondary y axis); ∗ indicates dry or wet deposition data were not available because data completeness criteria was not met.
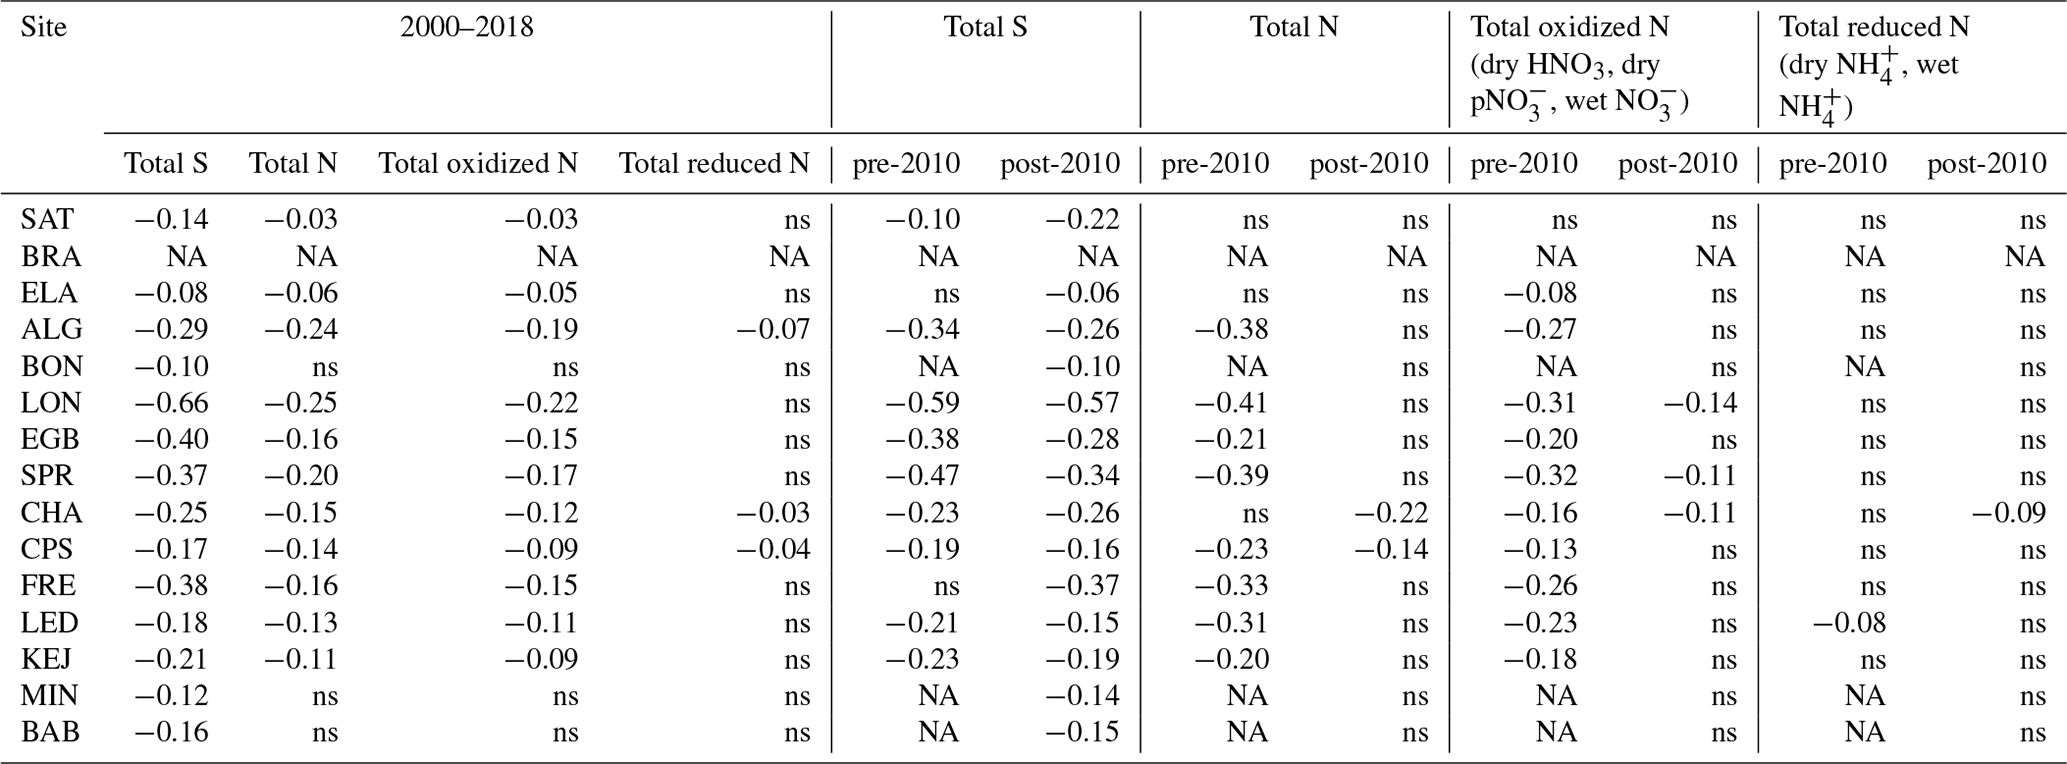
Table 6Rate of change in annual total (dry + wet) deposition fluxes of N and S (kg N or ) at CAPMoN sites based on Theil–Sen slopes (statistically significant at p < 0.05). Pre-2010: 2000–2009 period; post-2010: 2010–2018 period; NA: not available due to incomplete data; ns: trend is not statistically significant. Note: total N and reduced N exclude dry deposition of NH3 and some oxidized nitrogen species.
3.3.4 Long-term annual trends
Long-term trends in annual total (dry + wet) deposition of N, non-sea salt S, and individual components are shown in Figs. 9 and 10, respectively. Based on Mann–Kendall analyses, statistically significant decreasing trends in total N deposition were found at 11 sites with slopes ranging from −0.03 (SAT) to −0.25 (LON) during the 2000–2018 period (Table 6). This is equivalent to decreasing trends of −1.1 % yr−1 to −3.3 % yr−1 for total N deposition (Table S4). Over the continental US, total N deposition also decreased at a similar rate of −0.06 to −0.3 during the same period owing to NOx emissions reductions (Benish et al., 2022). Annual trends were not significant at BON, MIN, and BAB (p > 0.05) during the 2000–2018 period. Decreasing trends in total deposition of S were found at 14 sites with magnitudes ranging from −0.08 (ELA) to −0.66 (LON) (−3.5 % yr−1 to −6.6 % yr−1). Annual trends in total N and S deposition were not available at BRA due to data gaps. Total deposition fluxes of N and S declined more rapidly in southeastern Canada than in the Atlantic region and remote sites, which reflect the substantial NOx and SO2 emissions reductions in eastern Canada and the eastern US (Fig. S5a). Total N and S deposition at the west coast site decreased at a slower rate compared with southeastern Canada. This result is consistent with the slower decline in emissions reductions in western Canada (Fig. S5b). Oxidized N compounds drove the decreasing trends in total deposition of N at the majority of the sites (Table 6). Trends in reduced N ( deposition) were not statistically significant at most sites except for the slight decreasing trends at ALG, CHA, and CPS.
The lack of trends in total deposition can be explained as follows. First, total deposition was dominated by the wet deposition of , which exhibited a lack of trend in the eastern US and eastern Canada (Feng et al., 2021). Second, although ambient concentrations of decreased as a result of declines in ambient SO2 and NOx concentrations, dry deposition of contributed a small portion of the total N deposition because was predominately in PM2.5 which has a smaller Vd compared with coarse or ultrafine particulates (d < 0.1 µm) (Zhang and He, 2014). However, with less formed, ambient NH3 increased over the US and Canada (Butler et al., 2016; Yao and Zhang, 2016; Feng et al., 2021). It is very likely that the increased dry deposition of NH3 could compensate for the decreased dry deposition of considering the much higher (by 5 to 10 times) Vd of NH3 than ; however, additional long-term measurements of ambient NH3 would be required in order to verify this (e.g., via ongoing remote sensing and passive measurements).
Similar to the trends in dry deposition, differences in the annual total deposition trends were observed between the 2000–2009 period and 2010–2018 period. While the decreasing trends in total deposition of N were statistically significant at eight sites in the period before 2010, there were only two sites with significant declining trends after 2010 (Table 6). Relatively flat trends in ambient TNO3 ( + HNO3) were also reported for the northeast, the mid-Atlantic, and the southeast of the US after 2010 (Feng et al., 2020). Prior to 2010, long-term trends in total deposition of N were mainly driven by a decline in oxidized N species. Trends in reduced N () deposition were not statistically significant in either period. Decreasing trends in total deposition of S were statistically significant in the periods before and after 2010. The magnitude of the trends were smaller during 2010–2018 compared with 2000–2009 at ALG, EGB, SPR, and LED, whereas the trends during 2010–2018 were equal to or larger than those during 2000–2009 at SAT, LON, CHA, and FRE (Table 6). During the last decade, total deposition of S has continued to decrease owing to reductions in SO2 emissions. In contrast, total deposition of N and NOx emissions have leveled off in the last decade in Canada, similar to the continental US (Benish et al., 2022).
A comparison of dry and wet deposition trends indicates that wet deposition of oxidized N and decreased more rapidly than dry deposition from 2000 to 2018, although differences between wet and dry deposition trends varied across locations. Trends in the wet deposition of oxidized N () were much greater than those of dry deposition (HNO3 + ). Depending on the site, the annual rate of decrease in wet deposition of oxidized N was greater than dry deposition of oxidized N by a factor of 2.5 (LON and EGB) to 17 (CPS). The annual rate of decrease in wet deposition of exceeded that of dry deposition (SO2 + ) by a factor of 1.1 (EGB) to 7.9 (CPS) (Table S5 in the Supplement). In contrast, decreasing trends in dry deposition of S were greater than those of wet deposition at SAT and LON. The inter-site variability between wet versus dry deposition trends is likely due to the distance from emission sources. The SO2 and NOx concentrations and by extension dry deposition are quite low at remote sites. Thus, decreasing emissions from distant sources have minor impact on the ambient concentrations and dry deposition. Trends in the emissions at remote sites are mostly reflected in wet deposition given the high precipitation amounts at these sites (Figs. 9 and 10). While there were slight decreasing trends in dry deposition of at all CAPMoN sites, trends in annual wet deposition of reduced N () were not significant at most of the Canadian sites (Table S5). The rate of decline in wet deposition fluxes were greater than those of dry fluxes for N and S based on the absolute fluxes. However, the percentage decrease in dry deposition was greater than those in wet deposition (Table 2) owing to the smaller magnitude of dry fluxes compared to wet fluxes. The percentage decreases in dry deposition of S and oxidized N between 1990 and 2010 were also greater than that of wet deposition in the US (Sickles and Shadwick, 2015; Zhang et al., 2018). Changes in the meteorological conditions, especially the precipitation amount, may have played a role in the different trends and their relative dry and wet contributions to total deposition, but this is outside the scope of this paper and could be the subject of future analysis.
The proportion of total deposition of N and S from wet deposition increased modestly during the 2000–2018 period (Table S5). The increasing trends were statistically significant at 11 sites with the percentage of wet N in total deposition varying from 0.1 % yr−1 (ELA) to 0.5 % yr−1–0.6 % yr−1 (SAT, LON, EGB). The trend in the percentage of wet N deposition may change if NH3 dry deposition was included. An increasing trend in the percentage of dry N deposition is expected at sites with high ambient NH3. For the percentage of wet S in total deposition, the trends were statistically significant at 10 sites and the magnitudes ranged from 0.2 % yr−1 (ELA) to 1.3 % yr−1 (LON). Long-term trends in the percentages of oxidized and reduced N in total deposition were also analyzed. Due to significant decreases in oxidized N deposition and lack of trend in reduced N deposition during 2000–2018, the proportion of reduced N in total deposition has generally risen over the same period. Increasing trends in the percentage of reduced N in total deposition were estimated at 11 sites with magnitudes ranging from 0.3 % yr−1 to 1.3 % yr−1. The largest rates of increase (> 1 % reduced N yr−1) were found at EGB, FRE, LON, SPR, and LED (Table S5). The rise in the percentage of reduced N is a conservative estimate since NH3 dry deposition was not included.
3.4 N and S deposition response to long-term changes in emissions
The efficacy of emissions reductions was evaluated by examining the ratio of the percentage change in deposition of N and S to the percentage change in precursor emissions based on the Theil–Sen's slopes (i.e., response). Analysis of emissions changes were based on emissions from the large geographical regions that are known to influence the CAPMoN sites according to previous back trajectory analyses (ECCC, 2004; Zhang et al., 2008). This approach increased the likelihood of detecting relationships between ambient measurements and emissions by reducing the local meteorological effects on the ambient measurements (Brook et al., 1994). Based on previous studies, the closer the ratio is to 1 (or the percentage is to 100 %), the greater the efficacy of precursor emissions reductions on decreasing N or S deposition. A percentage between 80 % and 120 % suggests good efficacy, whereas a percentage below 80 % suggests precursor emissions reductions were ineffective at decreasing N or S deposition (Tan et al., 2020). Wet deposition has declined drastically in the US northeast owing to large reductions in NOx emissions (Du et al., 2014; Li et al., 2016), and the response in total oxidized N deposition to changes in NOx emissions between 2000 and 2017 was nearly 1 to 1 based on model simulations (Nopmongcol et al., 2019; Tan et al., 2020). A similar analysis spanning the early 1990s to mid-2000s indicated that the response in total oxidized N deposition to NOx emissions decrease in the eastern US was closer to 65 %–78 % (Sickles and Shadwick, 2015). In the southeastern UK, the response in wet concentrations to regional NOx emissions reductions across Europe was 0.8 to 1 based on a 20 % change in wet and 25 % change in NOx emissions (Fowler et al., 2005). In this study, we estimated that the response in total oxidized N deposition to NOx emissions reductions in eastern Canada and eastern US was 86 %–88 % in southeastern Canada and 84 %–87 % at one Atlantic site (KEJ) for the 2000–2018 period (Table S6 in the Supplement). The response in total oxidized N deposition at a west coast site (SAT) to NOx emissions decrease in western Canada was 113 %. The response in total oxidized deposition at the Canadian west coast site to NOx emissions reductions in the western US was only 42 %. Thus, both domestic and transboundary emissions reductions were pivotal in decreasing total oxidized N deposition in eastern Canada, whereas domestic emissions reductions were more effective in decreasing the deposition at the west coast site. The spatial differences in the responses could be due to differences in relative frequencies air masses from Canada and the US and NOx emissions levels and trends. Emissions reductions were also more effective in decreasing dry N deposition than wet oxidized N deposition. The responses in dry and wet oxidized N deposition in southeastern Canada to NOx emissions decrease were 103 %–106 % and 85 %–87 %, respectively (Table S6).
Unlike oxidized N, the quantitative linkage between total reduced N deposition and NH3 emissions is uncertain because of missing data on long-term NH3 dry deposition in this study (Table S7 in the Supplement). The lack of trend in wet deposition at Canadian rural sites was consistent with NH3 emissions in eastern Canada (a slight decreasing trend) and the eastern US (no trend) (Fig. S5a). Note that the NH3 emissions in Fig. S5a are mostly from anthropogenic sources. Climate-driven effects, such as the increased volatilization of NH3 due to increasing temperatures (Sutton et al., 2013), are not considered in the emissions. If NH3 dry deposition was considered, reduced N deposition would likely increase at agricultural sites. This is because of the observed increase in ambient NH3 at EGB from 2002 to 2010, which results in an increase in NH3 dry deposition. Thus, the reduced N deposition response is likely more than 100 % for agricultural sites. Increasing wet deposition trends at US sites were ascribed to rising NH3 emissions (Du et al., 2014; Li et al., 2016). However, Tan et al. (2020) suggest that total reduced N deposition in the continental US changed only by 60 %–80 % per unit change in US NH3 emissions. In contrast, the response in wet concentration to NH3 emissions in southeastern UK was 130 % (Fowler et al., 2005).
The total non-sea salt S deposition response to decreases in eastern Canadian and eastern US SO2 emissions was 90 %–96 % in southeastern Canada and 108 %–115 % in the Atlantic region (Table S8 in the Supplement). The response in total S deposition at the west coast site to western Canadian SO2 emissions reductions was 150 %, whereas the response was 73 % with respect to western US SO2 emissions reductions. The response to SO2 emissions reductions were greater for dry S deposition than wet S deposition in all Canadian regions, which was also observed in the UK (Fowler et al., 2005) and in the eastern US (Sickles and Shadwick, 2015). Thus, changes in emissions likely result in a more immediate change in dry deposition of S and oxidized N, since dry deposition is more localized. Changes in wet deposition are less regionally coupled with emissions because contaminants are removed from higher in the troposphere and higher up for some intense thunderstorms, thereby including contaminants from long-range transport. Process-based drivers can also have an effect on the N or S deposition response, such as variability in precipitation amounts, air mass patterns, aerosol chemistry as the relative amounts of ambient SO2, NOx, and NH3 change, and bidirectional flux of NH3.
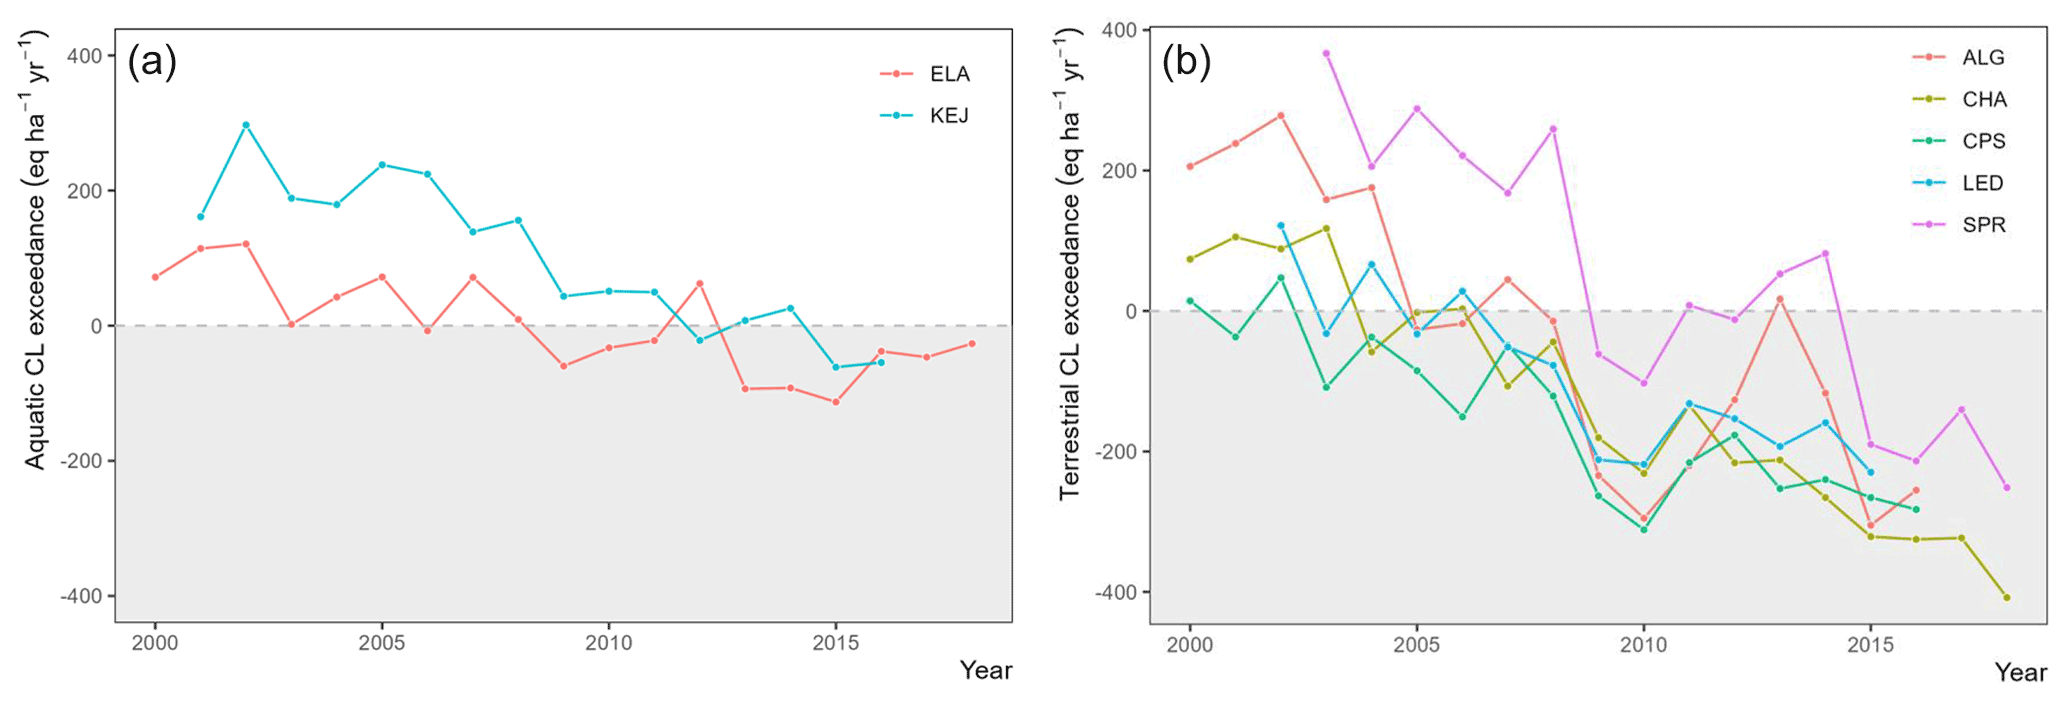
Figure 11Critical load (CL) exceedances from total sulfur and nitrogen deposition near selected CAPMoN stations at Algoma (ALG), Chalk River (CHA), Chapais (CPS), Experimental Lakes Area (ELA), Lac Edouard (LED), Kejimkujik National Park (KEJ), and Sprucedale (SPR) for lakes (a) and soils (b). Stations with deposition fluxes below CL in every year from 2000–2018 are not shown. The gray area represents non-exceedance.
3.5 Long-term trends in critical loads exceedances
Aquatic critical loads (CL) of acidity for the lakes around the five stations studied (ALG, ELA, LED, BAB, and KEJ) ranged from 308 (KEJ) to 1460 (LED), which encompasses a large range of surface water acid-base conditions (Table S9 in the Supplement). As expected, aquatic CL exceedances at each station showed decreasing trends with time in agreement with the decrease in total N and S deposition. Among the lakes in the five regions, the lakes of three regions (ALG, BAB, and LED) showed no exceedance in any year over the 2000–2018 period because of high CL for these lakes (Table S9). The selected lakes around ELA generally showed exceedance in the first half of the period but after 2008 there was no exceedance except in 2012 (Fig. 11). For the Kejimkujik (KEJ) region, the selected lakes showed high exceedances at the beginning of the period (2001–2008), whereas exceedances were close to or below zero after 2012. The results are in good agreement with recent trends showing improved pH and alkalinity in this region although many lakes are still below critical pH and alkalinity thresholds for aquatic life (Houle et al., 2022). Indeed, the Kejimkujik region has been severely influenced by acidification of soils and surface waters, and the latter are still among the most sensitive (i.e., have low base cation concentrations) and exhibit the greatest proportion of acidic surface water across Canada (Jeffries et al., 2003; Houle et al., 2022). It must be noted that the lake CL estimates are based on a small number of lakes and that there may be biases in their selection (based on their proximity to the studied stations). As such, the data presented here provide a recent estimation of aquatic CL exceedances for selected lakes of five regions covering a wide array of acid-base status, but this does not provide an exhaustive picture of the whole lake population at a much larger scale. Based on estimates from a previous study (Zhang et al., 2009), dry deposition of NO2, NH3, PAN, and unknown NOy (non-routinely monitored species) at ALG, KEJ, and LED did not result in additional years of exceedance (Table S11 in the Supplement). Total acidic deposition exceeded CL at KEJ by an additional 8 % in 2002, while it remained significantly below the CL at ALG and LED in 2003 because of the high base cation levels in the lakes.
Five of the 14 stations (ALG, CHA, CPS, LED, SPR) received total N+S deposition in exceedance of their terrestrial CL of acidity at some point in time across the study period (Fig. 11). The SPR site represented the highest initial terrestrial CL exceedance (beginning in 2003) and steepest decline into non-exceedance of the five exceeded sites; ALG followed a similar trend. The CPS site was only briefly in exceedance during a period of high deposition in 2000 and 2002. Wet deposition was the main driver of the majority of the acidic deposition, and wet alone resulted in terrestrial CL exceedance at these five stations. Note that there is no unique combination of S and N deposition to achieve or maintain non-exceedance; in some cases, changes to S or N deposition individually could result in a change of exceedance status, while in others, it may be easier to achieve change through varying reductions in both S and N. At four stations that did not experience exceedance over the time period, sensitivity to S deposition alone (that is, very low CLmaxS) was estimated at BAB (208 ) and CLmaxS values below 500 were estimated for MIN, CPS, and LED (Table S10 in the Supplement). Poor weathering rates characterized the CL at these four sites, which have shallow soils (i.e., 30 cm or less) underlain by acidic parent material. The three southern stations (LON, EGB, FRE) had the highest CLmaxS (that is, they are tolerant to higher levels of S deposition, up to 2936 at LON; Table S10); these stations are situated in areas with deeper soils (up to 50 cm) and alkaline parent material. The BON site showed high estimated tolerance to N deposition (CLmaxN) at 2589 , which is likely driven by poorly drained soils (and therefore a high denitrification fraction); other sites ranged between 398 and 1719 (Table S10), with BAB being very sensitive to acidifying N (that is, CLmaxN-CLminN is the smallest among the sites). Terrestrial ecosystems in exceedance of their CL are at risk for decreased soil base saturation, mobilization of root-toxic aluminum ions, and reduced plant growth. While soils may be slower to recover from acidification, the trend into non-exceedance by the terrestrial sites is encouraging and consistent with indications that forest soils in North America are gradually recovering (Lawrence et al., 2015; Hazlett et al., 2020).
Figure 11 shows fluctuations in the exceedances with deposition just below or at the terrestrial CL at a few sites (e.g., CHA in 2004–2006 and LED in 2003/2005). The inclusion of NO2, NH3, PAN, and unknown NOy dry deposition reported in our previous study (Zhang et al., 2009) resulted in CL exceedance at CHA in 2004 and near exceedance at LED in 2003 (Table S11). This suggests that the dry deposition of other N compounds cannot be neglected at sites where the difference between the CL and total deposition from routinely monitored N is small. Further, uncertainties in the air and precipitation monitoring data also contribute to uncertainties in dry and wet deposition fluxes, which may affect the assessment of CL exceedance especially at locations close to critical thresholds (Walker et al., 2019b). Even with the increased total N deposition at EGB due to the additional N flux, terrestrial CL was not in exceedance in 2002 or 2010 because of the high CLmaxS and CLmaxN at EGB (Table S10). It is important to note that only CLs of acidity were evaluated in this study. N deposition contributes to eutrophication in N-limited aquatic and terrestrial ecosystems (Smith et al., 1999), as well as changes to plant communities (Field et al., 2014) including losses of species diversity (Bobbink and Hicks, 2014; Payne et al., 2017). The form of N deposited also has ecosystem health implications. Increased ammonium in the soil results in lower base cation uptake, which can reduce tree growth (Gloser and Gloser, 2001; Bobbink et al., 2011; de Vries et al., 2015). Critical loads of N for eutrophication and biodiversity loss have not been widely established for Canadian ecosystems, but an area of future work is to assess eutrophication effects due to N deposition surrounding the monitoring stations (e.g., Forsius et al., 2021).
Exceedances of terrestrial and aquatic CL presented here are not a direct comparison with regards to area, data sources, or methodology, and are presented separately to illustrate how CL exceedance responds to acidic deposition trends. Aquatic and terrestrial CL are subject to a number of uncertainties, including those in the input data (e.g., runoff, satellite land cover identification, soil data) and in the methodology (e.g., selection of a critical chemical criterion) (Hall et al., 2001). The terrestrial CL used a map-based approach that introduces additional uncertainty from the application of regional maps to local sites. CL estimates, however, have been shown to have less uncertainty than the individual model inputs because of compensating errors (Suutari et al., 2001; Skeffington et al., 2007).
Data at 15 rural and remote CAPMoN sites were used to estimate dry and wet N and S deposition fluxes from 2000 to 2018. Acidic deposition at 14 sites decreased significantly during this period. While the declining trend in acidic deposition was modest at the west coast site, the decrease in acidic deposition was much greater in southeastern Canada. Total N deposition in southeastern Canada decreased from 6.3–11.6 during 2000–2004 to 4.0–7.9 during 2014–2018, excluding dry deposition of NH3 and some oxidized N compounds. Total S depositions for the respective periods were 5.4–12.9 and 1.8–3.8 in southeastern Canada. Our analysis showed that decreases in total S deposition were driven by reductions in wet deposition and dry SO2 deposition, while decreases in total N deposition were largely attributed to reductions in wet and dry oxidized N deposition. Changes in total ammonium deposition were not significant. The long-term decrease in acidic deposition can be explained by reductions in anthropogenic SO2 and NOx emissions in Canada and the US.
To assess the effects of acidic deposition on Canadian ecosystems, critical loads of acidity were estimated for soils and lakes surrounding the monitoring sites. Although ecosystem damage likely occurred in acid-sensitive regions throughout the early 2000s, no significant exceedances of aquatic and terrestrial critical loads were observed after 2012 according to the SSWC and SMB steady-state CL models. It is important to emphasize that the legacy effects of acidification on ecosystems have not been resolved. While the models indicate that under post-2012 deposition, the ecosystems are not exceeded, they do not indicate when ecosystems will fully recover from pre-2012 acidification. The critical loads analysis presented in this paper is a case study of selected lakes covering a wide range of acid-base status. Some lakes in eastern Canada continue to be very acidic likely due to the long-term legacy of acidic deposition that decreased the size of the exchangeable base cation reservoir in the soils. Moreover, the deposition sites were not selected based on their representation of acid-sensitive soils or lakes.
Continued monitoring and tracking of long-term trends in total S and N deposition across Canada is essential, particularly in western Canada and the prairie provinces where SO2 and NOx emissions reductions are modest and NH3 emissions are rising. N and S monitoring sites have been added in western Canada since 2015 to track long-term emissions and acidic deposition trends in that region. The impacts of wildfires, changes in the atmospheric chemistry, extreme precipitation events, and other climate-related environmental stressors also require further study. As oxidized N in air and in deposition continue to decrease, reduced N will comprise a larger proportion of the total N deposition at a greater number of sites. Thus, a greater focus is needed to track ammonia emissions and reduced N deposition trends. It should be noted that organic N is not included in the total N deposition budget, which should be considered in future monitoring and analysis studies. This can be done by measuring dissolved organic N in precipitation and total NOy in air, with the former for estimating organic N wet deposition and the latter for approximating organic N dry deposition (Walker et al., 2020). In terms of deposition model improvements, one important area is constraining the air–surface exchange estimates for reactive N by incorporating measurements from process-level studies and integrating spatial- and time-specific meteorological data to improve NH3 emission estimates (Sutton et al., 2013; Walker et al., 2020). Emerging research in Europe and the US point to the growing importance in acquiring a complete N deposition budget, not only for mapping critical loads of acidity but also mapping thresholds for eutrophication. Future work will also include mapping continuous acidic deposition fluxes through model–measurement fusion to supplement monitoring networks and using the resulting high spatial resolution fluxes to conduct a detailed study of the impacts of acidification on Canadian ecosystems.
The data used in this publication can be accessed via the links provided in the references or Supplement. Annual deposition fluxes of nitrogen and sulfur species and critical loads exceedances at CAPMoN sites during 2000–2018 are available from Environment and Climate Change Canada (https://open.canada.ca/data/en/dataset/89a1e52c-d24e-4840-904f-fd6f2cb92648, Cheng et al., 2022).
The supplement related to this article is available online at: https://doi.org/10.5194/acp-22-14631-2022-supplement.
IC analyzed the data, generated most of the figures and tables, and prepared the paper with contributions from co-authors. LZ designed and oversaw the project with input from AC, AMM, and JB. LZ and ZH generated dry deposition flux data. HC, DH, and JA generated the critical loads data and wrote the corresponding sections. JF provided discussions on the air concentration and wet deposition flux for eastern Canada and the eastern US. JO was responsible for both measurement and data curation of 2010 continuous ambient nitrogen at the Egbert site. All co-authors have commented and/or edited the paper.
At least one of the (co-)authors is a member of the editorial board of Atmospheric Chemistry and Physics. The peer-review process was guided by an independent editor, and the authors also have no other competing interests to declare.
Publisher's note: Copernicus Publications remains neutral with regard to jurisdictional claims in published maps and institutional affiliations.
The authors acknowledge the Canadian National Atmospheric Chemistry (NAtChem) Particulate Matter and Precipitation Chemistry Databases and its data contributing agencies/organizations for the provision of data (2000–2018); ECCC's Air Pollutant Emissions Inventory and USEPA Air Emissions Inventory data used in this publication. The authors thank the CAPMoN field and lab teams including the dedicated site operators; Kulbir Banwait, Bill Sukloff, Amy Hou, Gary Yip, and Greg Skelton for QA/QC and data support; Suzanne Couture for providing the Quebec and Maritimes lakes long-term average chemistry data; and Michael Paterson from the International Institute for Sustainable Development–Experimental Lakes Area (ELA) for providing the long-term chemistry data average of the five reference lakes in ELA and discharge data from lake 239.
This study is funded by Environment and Climate Change Canada's (ECCC) Air Pollution program.
This paper was edited by Joshua Fu and reviewed by Gregory Wetherbee and three anonymous referees.
Aherne, J. and Jeffries, D.: Critical Load Assessments and Dynamic Model Applications for Lakes in North America, in: Critical Loads and Dynamic Risk Assessments, series Environmental Pollution, vol. 25, edited by: de Vries, W., Hettelingh, J. P., and Posch, M., Springer, Dordrecht, https://doi.org/10.1007/978-94-017-9508-1_19, 2015.
Altshuller, A.: Model predictions of the rates of homogeneous oxidation of sulfur dioxide to sulfate in the troposphere, Atmos. Environ., 13, 1653–1661, 1979.
Anastasopolos, A. T., Sofowote, U. M., Hopke, P. K., Rouleau, M., Shin, T., Dheri, A., Peng, H., Kulka, R., Gibson, M. D., Farah, P. M., and Sundar, N.: Air quality in Canadian port cities after regulation of low-sulphur marine fuel in the North American Emissions Control Area, Sci. Total. Environ., 791, 147949, https://doi.org/10.1016/j.scitotenv.2021.147949, 2021.
Benish, S. E., Bash, J. O., Foley, K. M., Appel, K. W., Hogrefe, C., Gilliam, R., and Pouliot, G.: Long-term regional trends of nitrogen and sulfur deposition in the United States from 2002 to 2017, Atmos. Chem. Phys., 22, 12749–12767, https://doi.org/10.5194/acp-22-12749-2022, 2022.
Bergström, A. K. and Jansson, M.: Atmospheric nitrogen deposition has caused nitrogen enrichment and eutrophication of lakes in the Northern Hemisphere, Glob. Change Biol., 12, 635–643, 2006.
Bobbink, R. and Hicks, W. K.: Factors Affecting Nitrogen Deposition Impacts on Biodiversity: An Overview, in: Nitrogen Deposition, Critical Loads and Biodiversity, edited by: Sutton, M. A., Mason, K. E., Sheppard, L. J., Sverdrup, H., Haeuber, R., and Hicks, W. K., Springer, Dordrecht, https://doi.org/10.1007/978-94-007-7939-6_14, 127–138, 2014.
Bobbink, R., Braun, S., Nordin, A., Power, S., Schutz, K., Strengbom, J., Weijters, M., and Tomassen, H: Review and revision of empirical critical loads and dose-response relationships, in: Proceedings of an expert workshop, Noordwijkerhout, 23–25 June 2010, edited by: Bobbink, R. and Hettelingh, J.-P., 21–28, 2011.
Brakke, D. F., Henriksen, A., and Norton, S. A.: A variable F-factor to explain changes in base cation concentration as a function of strong acid deposition, Verh. Int. Verein. Limnol., 24, 146–149, 1990.
Brook, J. R., Samson, P. J., and Sillman, S.: A meteorology-based approach to detecting the relationship between changes in SO2 emission rates and precipitation concentrations of sulfate, J. Appl. Meteorol. Clim., 33, 1050–1066, 1994.
Burns, D. A., Bhatt, G., Linker, L. C., Bash, J. O., Capel, P. D., and Shenk, G. W.: Atmospheric nitrogen deposition in the Chesapeake Bay watershed: A history of change, Atmos. Environ., 251, 118277, https://doi.org/10.1016/j.atmosenv.2021.118277, 2021.
Butler, T., Vermeylen, F., Lehmann, C. M., Likens, G. E., and Puchalski, M.: Increasing ammonia concentration trends in large regions of the USA derived from the NADP/AMoN network, Atmos. Environ., 146, 132–140, 2016.
Carslaw, D. C. and Ropkins, K.: Openair – an R package for air quality data analysis, Environ. Modell. Softw., 27–28, 52–61, 2012.
Cheng, I. and Zhang, L.: Long-term air concentrations, wet deposition, and scavenging ratios of inorganic ions, HNO3, and SO2 and assessment of aerosol and precipitation acidity at Canadian rural locations, Atmos. Chem. Phys., 17, 4711–4730, https://doi.org/10.5194/acp-17-4711-2017, 2017.
Cheng, I., Zhang, L., Cole, A., Cathcart, H., and Houle, D.: 2000–2018 annual total deposition fluxes of nitrogen and sulfur at CAPMoN sites, Environment and Climate Change Canada, Government of Canada Open Data Portal [data set], https://open.canada.ca/data/en/dataset/89a1e52c-d24e-4840-904f-fd6f2cb92648, last access: 7 November 2022.
CLRTAP: Manual on Methodologies and Criteria for Modelling and Mapping Critical Loads and Levels and Air Pollution Effects, Risks and Trends, CLRTAP, http://www.icpmapping.org (last access: 15 September 2021), 2004.
de Vries, W., Hettlingh, J.-P., and Posch, M. (Eds.): Critical Loads and Dynamic Risk Assessments: Nitrogen, Acidity and Metals in Terrestrial and Aquatic Ecosystems, series Environmental Pollution, vol. 25, Springer Dordrecht, https://doi.org/10.1007/978-94-017-9508-1, 2015.
Driscoll, C. T., Lawrence, G. B., Bulger, A. J., Butler, T. J., Cronan, C. S., Eagar, C., Lambert, K. F., Likens, G. E., Stoddard, J. L., and Weathers, K. C.: Acidic Deposition in the Northeastern United States: Sources and Inputs, Ecosystem Effects, and Management Strategies, BioScience., 51, 180–198, 2001.
Du, E., de Vries, W., Galloway, J. N., Hu, X., and Fang, J.: Changes in wet nitrogen deposition in the United States between 1985 and 2012, Environ. Res. Lett., 9, 9, https://doi.org/10.1088/1748-9326/9/9/095004, 2014.
Ellis, R. A., Jacob, D. J., Sulprizio, M. P., Zhang, L., Holmes, C. D., Schichtel, B. A., Blett, T., Porter, E., Pardo, L. H., and Lynch, J. A.: Present and future nitrogen deposition to national parks in the United States: critical load exceedances, Atmos. Chem. Phys., 13, 9083–9095, https://doi.org/10.5194/acp-13-9083-2013, 2013.
Environment and Climate Change Canada (ECCC): 2004 Canadian Acid Deposition Science Assessment, Meteorological Services of Canada [data set], http://www.publications.gc.ca/pub?id=9.688243&sl=0 (last access: 7 November 2022), 2004.
Environment and Climate Change Canada (ECCC): Canadian Air and Precipitation Monitoring Network (CAPMoN), Government of Canada Open Data Portal [data set], https://open.canada.ca/data/en/dataset/4baa2ee4-a8aa-457a-af26-aa13e96ee2f4 (last access: 7 November 2022), 2017.
Environment and Climate Change Canada (ECCC): Canada's Air Pollutant Emissions Inventory, Government of Canada Open Data Portal [data set], https://open.canada.ca/data/en/dataset/fa1c88a8-bf78-4fcb-9c1e-2a5534b92131 (last access: 7 November 2022), 2021a.
Environment and Climate Change Canada (ECCC): Major ions, Government of Canada Open Data Portal [data set], https://open.canada.ca/data/en/dataset/9974e51f-2616-42bf-8b40-ed12de91a304 (last access: 7 November 2022), 2021b.
Environment and Climate Change Canada (ECCC): Major ions and acidifying gases, Government of Canada Open Data Portal [data set], https://open.canada.ca/data/en/dataset/10ec2a54-9b6d-4dd7-9b05-5c30b9fa4920 (last access: 7 November 2022), 2021c.
Feng, J., Chan, E., and Vet, R.: Air quality in the eastern United States and Eastern Canada for 1990–2015: 25 years of change in response to emission reductions of SO2 and NOx in the region, Atmos. Chem. Phys., 20, 3107–3134, https://doi.org/10.5194/acp-20-3107-2020, 2020.
Feng, J., Vet, R., Cole, A., Zhang, L., Cheng, I., O'Brien, J., and Macdonald, A. M.: Inorganic chemical components in precipitation in the eastern US and Eastern Canada during 1989–2016: Temporal and regional trends of wet concentration and wet deposition from the NADP and CAPMoN measurements, Atmos. Environ., 254, 118367, https://doi.org/10.1016/j.atmosenv.2021.118367, 2021.
Field, C. D., Dise, N. B., Payne, R. J., Britton, A. J., Emmett, B. A., Helliwell, R. C., Hughes, S., Jones, L., Lees, S., Leake, J. R., Leith, I. D., Phoenix, G. K., Power, S. A., Sheppard, L. J., Southon, G. E., Stevens, C. J., and Caporn, S. J. M.: The Role of Nitrogen Deposition in Widespread Plant Community Change Across Semi-natural Habitats, Ecosystems, 17, 864–877, https://doi.org/10.1007/s10021-014-9765-5, 2014.
Flechard, C. R., Nemitz, E., Smith, R. I., Fowler, D., Vermeulen, A. T., Bleeker, A., Erisman, J. W., Simpson, D., Zhang, L., Tang, Y. S., and Sutton, M. A.: Dry deposition of reactive nitrogen to European ecosystems: a comparison of inferential models across the NitroEurope network, Atmos. Chem. Phys., 11, 2703–2728, 2011.
Forsius, M., Posch, M., Holmberg, M., Vuorenmaa, J., Kleemola, S., Augustaitis, A., Beudert, B., Bochenek, W., Clarke, N., deWit, H. A., Dirnböck, T., Frey, J., Grandin, U., Hakola, H., Kobler, J., Krám, P., Lindroos, A.-J., Löfgren, S., Pecka, T., Rönnback, P., Skotak, K., Szpikowski, J., Ukonmaanaho, L., Valinia, S., and Váňa, M.: Assessing critical load exceedances and ecosystem impacts of anthropogenic nitrogen and sulphur deposition at unmanaged forested catchments in Europe, Sci. Total. Environ., 753, 141791, https://doi.org/10.1016/j.scitotenv.2020.141791, 2021.
Fowler, D., Smith, R. I., Muller, J. B. A., Hayman, G., and Vincent, K. J.: Changes in the atmospheric deposition of acidifying compounds in the UK between 1986 and 2001, Environ. Pollut., 137, 15–25, 2005.
Gasset, N., Fortin, V., Dimitrijevic, M., Carrera, M., Bilodeau, B., Muncaster, R., Gaborit, É., Roy, G., Pentcheva, N., Bulat, M., Wang, X., Pavlovic, R., Lespinas, F., Khedhaouiria, D., and Mai, J.: A 10 km North American precipitation and land-surface reanalysis based on the GEM atmospheric model, Hydrol. Earth Syst. Sci., 25, 4917–4945, https://doi.org/10.5194/hess-25-4917-2021, 2021.
GAW (Precipitation Chemistry Science Advisory Group): Global Atmosphere Watch: Manual for the GAW Precipitation Chemistry Programme, Guidelines Data Quality Objectives and Standard Operating Procedures, No. 160, World Meteorological Organization (WMO), Geneva, Switzerland, 2004.
Gloser, V. and Gloser, J.: Nitrogen and base cation uptake in seedlings of Acer pseudoplatanus and Calamagrostis villosa exposed to an acidified environment, in: Recent Advances of Plant Root Structure and Function, edited by: Gašparíková, O., Čiamporová, M., Mistrík, I., and Baluška, F., Springer, Dordrecht, https://doi.org/10.1007/978-94-017-2858-4_12, 103–109, 2001.
Hall, J., Reynolds, B., Aherne, J., and Hornung, M.: The importance of selecting appropriate criteria for calculating acidity critical loads for terrestrial ecosystems using the simple mass balance equation, Water Air Soil Poll., 1, 29–41, 2001.
Hazlett, P. W., Emilson, C. E., Lawrence, G. B., Fernandez, I. J., Ouimet, R., and Bailey, S. W.: Reversal of forest soil acidification in the northeastern United States and eastern Canada: Site and soil factors contributing to recovery, Soil Syst., 4, 54, https://doi.org/10.3390/soilsystems4030054, 2020.
Holland, E. A., Braswell, B. H., Sulzman, J., and Lamarque, J. F.: Nitrogen deposition onto the United States and Western Europe: synthesis of observations and models, Ecol. Appl., 15, 38–57, 2005.
Houle, D., Augustin, F., and Couture, S.: Rapid improvement of lake acid-base status in Atlantic Canada following steep decline in precipitation acidity, Can. J. Fish. Aquat. Sci., https://doi.org/10.1139/cjfas-2021-0349, online first, 2022.
Hu, C., Griffis, T. J., Frie, A., Baker, J. M., Wood, J. D., Millet, D. B., Yu, Z., Yu, X., and Czarnetzki, A. C.: A multiyear constraint on ammonia emissions and deposition within the US corn belt, Geophys. Res. Lett., 48, e2020GL090865, https://doi.org/10.1029/2020GL090865, 2021.
Jeffries, D. S., Clair, T. A., Couture, S., Dillon, P. J., Dupont, J., Keller, W., McNicol, D. K., Turner, M. A., Vet, R., and Weeber, R.: Assessing the Recovery of Lakes in Southeastern Canada from the Effects of Acidic Deposition, Ambio, 32, 176–182, 2003.
Jeffries, D. S., Semkin, R. G., Gibson, J. J., and Wong, I.: Recently surveyed lakes in northern Manitoba and Saskatchewan, Canada: characteristics and critical loads of acidity, J. Limnol., 69, 45–55, 2010.
Kharol, S. K., Shephard, M. W., McLinden, C. A., Zhang, L., Sioris, C. E., O'Brien, J. M., Vet, R., Cady-Pereira, K. E., Hare, E., Siemons, J., and Krotkov, N. A.: Dry deposition of reactive nitrogen from satellite observations of ammonia and nitrogen dioxide over North America, Geophys. Res. Lett., 45, 1157–1166, 2018.
Lawrence, G. B., Hazlett, P. W., Fernandez, I. J., Ouimet, R., Bailey, S. W., Shortle, W. C., Smith, K. T., and Antidormi, M. R.: Declining Acidic Deposition Begins Reversal of Forest-Soil Acidification in the Northeastern U. S. and Eastern Canada, Environ. Sci. Technol., 49, 13103–13111, 2015.
Lee, C., Martin, R. V., van Donkelaar, A., Lee, H., Dickerson, R. R., Hains, J. C., Krotkov, N., Richter, A., Vinnikov, K., and Schwab, J. J.: SO2 emissions and lifetimes: Estimates from inverse modeling using in situ and global, space-based (SCIAMACHY and OMI) observations, J. Geophys. Res.-Atmos., 116, D06304, https://doi.org/10.1029/2010JD014758, 2011.
Lehmann, C. M., Bowersox, V. C., Larson, R. S., and Larson, S. M.: Monitoring long-term trends in sulfate and ammonium in US precipitation: Results from the National Atmospheric Deposition Program/National Trends Network, Water Air Soil Poll., 7, 59–66, https://doi.org/10.1007/s11267-006-9100-z, 2007.
Li, Y., Schichtel, B. A., Walker, J. T., Schwede, D. B., Chen, X., Lehmann, C. M., Puchalski, M. A., Gay, D. A., and Collett, J. L.: Increasing importance of deposition of reduced nitrogen in the United States, P. Natl. Acad. Sci. USA, 113, 5874–5879, 2016.
Likens, G. E., Butler, T. J., Claybrooke, R., Vermeylen, F., and Larson, R..: Long-term monitoring of precipitation chemistry in the US: Insights into changes and condition, Atmos. Environ., 245, 118031, https://doi.org/10.1016/j.atmosenv.2020.118031, 2021.
Liu, X., Zhang, Y., Han, W., Tang, A., Shen, J., Cui, Z., Vitousek, P., Erisman, J. W., Goulding, K., Christie, P., Fangmeier, A., and Zhang, F.: Enhanced nitrogen deposition over China, Nature, 494, 459–462, 2013.
Makar, P. A., Akingunola, A., Aherne, J., Cole, A. S., Aklilu, Y.-A., Zhang, J., Wong, I., Hayden, K., Li, S.-M., Kirk, J., Scott, K., Moran, M. D., Robichaud, A., Cathcart, H., Baratzedah, P., Pabla, B., Cheung, P., Zheng, Q., and Jeffries, D. S.: Estimates of exceedances of critical loads for acidifying deposition in Alberta and Saskatchewan, Atmos. Chem. Phys., 18, 9897–9927, https://doi.org/10.5194/acp-18-9897-2018, 2018.
McHale, M. R., Ludtke, A. S., Wetherbee, G. A., Burns, D. A., Nilles, M. A., and Finkelstein, J. S.: Trends in precipitation chemistry across the US 1985–2017: Quantifying the benefits from 30 years of Clean Air Act amendment regulation, Atmos. Environ., 247, 118219, https://doi.org/10.1016/j.atmosenv.2021.118219, 2021.
McKendry, I. G., Macdonald, A. M., Leaitch, W. R., van Donkelaar, A., Zhang, Q., Duck, T., and Martin, R. V.: Trans-Pacific dust events observed at Whistler, British Columbia during INTEX-B, Atmos. Chem. Phys., 8, 6297–6307, https://doi.org/10.5194/acp-8-6297-2008, 2008.
McMillan, A. C., MacIver, D., and Sukloff, W. B.: Atmospheric environmental information – an overview with Canadian examples, Environ. Modell. Softw., 15, 245–248, 2000.
Moran, M. D., Lupu, A., Zhang, J., Savic-Jovcic, V., and Gravel, S.: A Comprehensive Performance Evaluation of the Next Generation of the Canadian Operational Regional Air Quality Deterministic Prediction System, in: Air Pollution Modeling and its Application XXV, edited by: Mensink, C. and Kallos, G., Springer, Cham, https://doi.org/10.1007/978-3-319-57645-9_12, 75–81, 2018.
Nilsson, J. and Grennfelt, P.: Critical loads for sulphur and nitrogen, Report from a workshop held at Skokloster, Sweden, Miljørapport, Nordic Council of Ministers, Copenhagen, Denmark, 31 pp., 1988.
Nopmongcol, U., Beardsley, R., Kumar, N., Knipping, E., and Yarwood, G.: Changes in United States deposition of nitrogen and sulfur compounds over five decades from 1970 to 2020, Atmos. Environ., 209, 144–151, 2019.
Olsen, A. R., Voldner, E. C., Bigelow, D. S., Chan, W. H., Clark, T. L., Lusis, M. A., Misra, P. K., and Vet, R. J.: Unified wet deposition data summaries for North America: data summary procedures and results for 1980–1986, Atmos. Environ., 24, 661–672, 1990.
Pan, D., Benedict, K. B., Golston, L. M., Wang, R., Collett, J. L., Tao, L., Sun, K., Guo, X., Ham, J., Prenni, A. J., Schichtel, B. A., Mikoviny, T., Muller, M., Wisthaler, A., and Zondlo, M. A.: Ammonia Dry Deposition in an Alpine Ecosystem Traced to Agricultural Emission Hotpots, Environ. Sci. Technol., 55, 7776–7785, 2021.
Pan, Y. P., Wang, Y. S., Tang, G. Q., and Wu, D.: Wet and dry deposition of atmospheric nitrogen at ten sites in Northern China, Atmos. Chem. Phys., 12, 6515–6535, https://doi.org/10.5194/acp-12-6515-2012, 2012.
Pardo, L. H., Fenn, M. E., Goodale, C. L., Geiser, L. H., Driscoll, C. T., Allen, E. B., Baron, J. S., Bobbink, R., Bowman, W. D., Clark, C. M., Emmett, B., Gilliam, F. S., Greaver, T. L., Hall, S. J., Lilleskov, E. A., Liu, L., Lynch, J. A., Nadelhoffer, K. J., Perakis, S. S., Robin-Abbott, M. J., Stoddard, J. L., Weathers, K. C., and Dennis, R. L.: Effects of nitrogen deposition and empirical nitrogen critical loads for ecoregions of the United States, Ecol. Appl., 21, 3049–3082, 2011.
Payne, R. J., Dise, N. B., Field, C. D., Dore, A. J., Caporn, S. J., and Stevens, C. J.: Nitrogen deposition and plant biodiversity: Past, present, and future, Front. Ecol. Environ., 15, 431–436. https://doi.org/10.1002/fee.1528, 2017.
Posch, M., Kämäri, J., Johansson, M., and Forsius, M.: Displaying inter-and intra-regional variability of large-scale survey results, Environmetrics, 4, 341–352, 1993.
Posch, M., de Vries, W., and Sverdrup, H. U.: Mass Balance Models to Derive Critical Loads of Nitrogen and Acidity for Terrestrial and Aquatic Ecosystems, in: Critical Loads and Dynamic Risk Assessments: Nitrogen, Acidity and Metals in Terrestrial and Aquatic Ecosystems, edited by: de Vries, W., Hettelingh, J.-P., and Posch, M., Springer, Dordrecht, https://doi.org/10.1007/978-94-017-9508-1_6, 171–205, 2015.
Schwede, D., Zhang, L., Vet, R., and Lear, G.: An intercomparison of the deposition models used in the CASTNET and CAPMoN networks, Atmos. Environ., 45, 1337–1346, 2011.
Shao, S., Driscoll, C. T., Sullivan, T. J., Burns, D. A., Baldigo, B., Lawrence, G. B., and McDonnell, T. C.: The response of stream ecosystems in the Adirondack region of New York to historical and future changes in atmospheric deposition of sulfur and nitrogen, Sci. Total. Environ., 716, 137113, https://doi.org/10.1016/j.scitotenv.2020.137113, 2020.
Sickles II, J. E. and Shadwick, D. S.: Air quality and atmospheric deposition in the eastern US: 20 years of change, Atmos. Chem. Phys., 15, 173–197, https://doi.org/10.5194/acp-15-173-2015, 2015.
Simkin, S. M., Allen, E. B., Bowman, W. D., Clark, C. M., Belnap, J., Brooks, M. L., Cade, B. S., Collins, S. L., Geiser, L. H., Gilliam, F. S., and Jovan, S. E.: Conditional vulnerability of plant diversity to atmospheric nitrogen deposition across the United States, P. Natl. Acad. Sci. USA, 113, 4086–4091, 2016.
Sirois, A. and Fricke, W.: Regionally representative daily air concentrations of acid-related substances in Canada; 1983–1987, Atmos. Environ., 26, 593–607, 1992.
Sirois, A., Vet, R., and Lamb, D.: A comparison of the precipitation chemistry measurements obtained by the CAPMoN and NADP/NTN networks, Environ. Monit. Assess., 62, 273–303, 2000.
Skeffington, R. A., Hall, J. R., Heywood, E., Wadsworth, R. A., Whitehead, P., Reynolds, B., Abbott, J., and Vincent, K.: Uncertainty in critical load assessment models, Science Report: SC030172/SR, Technical Report, Environment Agency, Bristol, 2007.
Smith, V. H., Tilman, G. D., and Nekola, J. C.: Eutrophication: Impacts of excess nutrient inputs on freshwater, marine, and terrestrial ecosystems, Environ. Pollut., 100, 179–196, https://doi.org/10.1016/S0269-7491(99)00091-3, 1999.
Staelens, J., Wuyts, K., Adriaenssens, S., Van Avermaet, P., Buysse, H., Van den Bril, B., Roekens, E., Ottoy, J. P., Verheyen, K., Thas, O., and Deschepper, E.: Trends in atmospheric nitrogen and sulphur deposition in northern Belgium, Atmos. Environ., 49, 186–196, 2012.
Sutton, M. A., Reis, S., Riddick, S. N., Dragosits, U., Nemitz, E., Theobald, M. R., Tang, Y. S., Braban, C. F., Vieno, M., Dore, A. J., Mitchell, R. F., Wanless, S., Daunt, F., Fowler, D., Blackall, T. D., Milford, C., Flechard, C. R., Loubet, B., Massad, R., Cellier, P., Personne, E., Coheur, P. F., Clarisse, L., Van Damme, M., Ngadi, Y., Clerbaux, C., Skjøth, C. A., Geels, C., Hertel, O., Wichink Kruit, R. J., Pinder, R. W., Bash, J. O., Walker, J. T., Simpson, D., Horváth, L., Misselbrook, T. H., Bleeker, A., Dentener, F., and de Vries, W.: Towards a climate-dependent paradigm of ammonia emission and deposition, Philos. T. R. Soc. B., 368, 20130166, https://doi.org/10.1098/rstb.2013.0166, 2013.
Suutari, R., Amann, M., Cofala, J., Klimont, Z., Posch, M., and Schöpp, W.: From economic activities to ecosystem protection in Europe: An uncertainty analysis of two scenarios of the RAINS integrated assessment model, CIAM/CCE Rep. 1/2001, International Institute for Applied Systems Analysis (IIASA), Laxenburg, Austria, 2001.
Sverdrup, H.: The kinetics of base cation release due to chemical weathering, Lund University Press, Lund, Sweden, ISBN 91-7966-109-2, 1990.
Sverdrup, H. and De Vries, W.: Calculating critical loads for acidity with the simple mass balance method, Water Air Soil Poll., 72, 143–162, https://doi.org/10.1007/BF01257121, 1994.
Tan, J., Fu, J. S., and Seinfeld, J. H.: Ammonia emission abatement does not fully control reduced forms of nitrogen deposition, P. Natl. Acad. Sci. USA, 117, 9771–9775, 2020.
USEPA: Air pollutant emissions trends data, USEPA [data set], https://www.epa.gov/air-emissions-inventories/air-pollutant-emissions-trends-data (last access: 8 November 2022), 2021.
Vet, R., Artz, R. S., Carou, S., Shaw, M., Ro, C. U., Aas, W., Baker, A., Bowersox, V. C., Dentener, F., Galy-Lacaux, C.,Hou, A., Pienaar, J. J., Gillett, R., Forti, M. C., Gromov, S., Hara, H., Khodzher, T., Mahowald, N. M., Nickovic, S., Rao, P. S. P., and Reid, N. W.: A global assessment of precipitation chemistry and deposition of sulfur, nitrogen, sea salt, base cations, organic acids, acidity and pH, and phosphorus, Atmos. Environ., 93, 3–100, 2014.
Walker, J. T., Beachley, G., Amos, H. M., Baron, J. S., Bash, J., Baumgardner, R., Bell, M. D., Benedict, K. B., Chen, X., Clow, D. W., Cole, A., Coughlin, J. G., Cruz, K., Daly, R. W., Decina, S. M., Elliott, E. M., Fenn, M. E., Ganzeveld, L., Gebhart, K., Isil, S. S., Kerschner, B. M., Larson, R. S., Lavery, T., Lear, G. G., Macy, T., Mast, M. A., Mishoe, K., Morris, K. H., Padgett, P. E., Pouyat, R. V., Puchalski, M., Pye, H., Rea, A. W., Rhodes, M. F., Rogers, C. M., Saylor, R., Scheffe, R., Schichtel, B. A., Schwede, D. B., Sexstone, G. A., Sive, B. C., Sosa, R., Templer, P. H., Thompson, T., Tong, D., Wetherbee, G. A., Whitlow, T. H., Wu, Z., Yu, Z., and Zhang, L.: Toward the improvement of total nitrogen deposition budgets in the United States, Sci. Total Environ., 691, 1328–1352, 2019a.
Walker, J. T., Bell, M. D., Schwede, D., Cole, A., Beachley, G., Lear, G., and Wu, Z.: Aspects of uncertainty in total reactive nitrogen deposition estimates for North American critical load applications, Sci. Total Environ., 690, 1005–1018, 2019b.
Walker, J. T., Beachley, G., Zhang, L., Benedict, K. B., Sive, B. C., and Schwede, D. B.: A review of measurements of air-surface exchange of reactive nitrogen in natural ecosystems across North America, Sci. Total Environ., 698, 133975, https://doi.org/10.1016/j.scitotenv.2019.133975, 2020.
Warner, J. X., Dickerson, R. R., Wei, Z., Strow, L. L., Wang, Y., and Liang, Q.: Increased atmospheric ammonia over the world's major agricultural areas detected from space, Geophys. Res. Lett., 44, 2875–2884, 2017.
Wen, Z., Xu, W., Li, Q., Han, M., Tang, A., Zhang, Y., Luo, X., Shen, J., Wang, W., Li, K., Pan, Y., Zhang, L., Li, W., Collett, J. R., Zhong, B., Wang, X., Goulding, K., Zhang, F., and Liu, X.: Changes of nitrogen deposition in China from 1980 to 2018, Environ. Int., 144, 106022, https://doi.org/10.1016/j.envint.2020.106022, 2020.
Wright L. P., Zhang L., Cheng I., Aherne J., and Wentworth G. R.: Impacts and effects indicators of atmospheric deposition of major pollutants to various ecosystems – A review, Aerosol Air Qual. Res., 18, 1953–1992, 2018.
Xu, W., Luo, X. S., Pan, Y. P., Zhang, L., Tang, A. H., Shen, J. L., Zhang, Y., Li, K. H., Wu, Q. H., Yang, D. W., Zhang, Y. Y., Xue, J., Li, W. Q., Li, Q. Q., Tang, L., Lu, S. H., Liang, T., Tong, Y. A., Liu, P., Zhang, Q., Xiong, Z. Q., Shi, X. J., Wu, L. H., Shi, W. Q., Tian, K., Zhong, X. H., Shi, K., Tang, Q. Y., Zhang, L. J., Huang, J. L., He, C. E., Kuang, F. H., Zhu, B., Liu, H., Jin, X., Xin, Y. J., Shi, X. K., Du, E. Z., Dore, A. J., Tang, S., Collett Jr., J. L., Goulding, K., Sun, Y. X., Ren, J., Zhang, F. S., and Liu, X. J.: Quantifying atmospheric nitrogen deposition through a nationwide monitoring network across China, Atmos. Chem. Phys., 15, 12345–12360, https://doi.org/10.5194/acp-15-12345-2015, 2015.
Yao, X. and Zhang, L.: Trends in atmospheric ammonia at urban, rural, and remote sites across North America, Atmos. Chem. Phys., 16, 11465–11475, https://doi.org/10.5194/acp-16-11465-2016, 2016.
Yao, X. and Zhang, L.: Causes of large increases in atmospheric ammonia in the last decade across North America, ACS Omega, 4, 22133–22142, https://doi.org/10.1021/acsomega.9b03284, 2019.
Yu, F., Nair, A. A., and Luo, G.: Long-term trend of gaseous ammonia over the United States: Modeling and comparison with observations, J. Geophys. Res.-Atmos., 123, 8315–8325, https://doi.org/10.1029/2018JD028412, 2018.
Yu, G., Jia, Y., He, N., Zhu, J., Chen, Z., Wang, Q., Piao, S., Liu, X., He, H., Guo, X., Wen, Z., Li, P., Ding, G., and Goulding, K.: Stabilization of atmospheric nitrogen deposition in China over the past decade, Nat. Geosci., 12, 424–429, 2019.
Zbieranowski, A. L. and Aherne, J.: Long-term trends in atmospheric reactive nitrogen across Canada: 1988–2007, Atmos. Environ., 45, 5853–5862, 2011.
Zhang, L. and He, Z.: Technical Note: An empirical algorithm estimating dry deposition velocity of fine, coarse and giant particles, Atmos. Chem. Phys., 14, 3729–3737, https://doi.org/10.5194/acp-14-3729-2014, 2014.
Zhang, L., Brook, J. R., and Vet, R.: A revised parameterization for gaseous dry deposition in air-quality models, Atmos. Chem. Phys., 3, 2067–2082, https://doi.org/10.5194/acp-3-2067-2003, 2003.
Zhang, L., Vet, R., Wiebe, A., Mihele, C., Sukloff, B., Chan, E., Moran, M. D., and Iqbal, S.: Characterization of the size-segregated water-soluble inorganic ions at eight Canadian rural sites, Atmos. Chem. Phys., 8, 7133–7151, https://doi.org/10.5194/acp-8-7133-2008, 2008.
Zhang, L., Vet, R., O'Brien, J. M., Mihele, C., Liang, Z., and Wiebe, A.: Dry deposition of individual nitrogen species at eight Canadian rural sites, J. Geophys. Res.-Atmos., 114, D02301, https://doi.org/10.1029/2008JD010640, 2009.
Zhang, L., Wright, L. P., and Asman, W. A. H.: Bi-directional air-surface exchange of atmospheric ammonia – A review of measurements and a development of a big-leaf model for applications in regional-scale air-quality models, J. Geophys. Res.-Atmos., 115, D20310, https://doi.org/10.1029/2009JD013589, 2010.
Zhang, L., He, Z., Wu, Z., Macdonald, A. M., Brook, J. R., and Kharol, S.: A database of modeled gridded dry deposition velocities for 45 gaseous species and three particle size ranges across North America, J. Environ. Sci., 127, 264–272, https://doi.org/10.1016/j.jes.2022.05.030, 2023.
Zhang, Y., Mathur, R., Bash, J. O., Hogrefe, C., Xing, J., and Roselle, S. J.: Long-term trends in total inorganic nitrogen and sulfur deposition in the US from 1990 to 2010, Atmos. Chem. Phys., 18, 9091–9106, https://doi.org/10.5194/acp-18-9091-2018, 2018.
Zhao, Y., Zhang, L., Chen, Y., Liu, X., Xu, W., Pan, Y., and Duan, L.: Atmospheric nitrogen deposition to China: A model analysis on nitrogen budget and critical load exceedance, Atmos. Environ., 153, 32–40, 2017.