the Creative Commons Attribution 4.0 License.
the Creative Commons Attribution 4.0 License.
 | 17 Nov 2022
Atmospheric breakdown chemistry of the new “green” solvent 2,2,5,5-tetramethyloxolane via gas-phase reactions with OH and Cl radicals
Caterina Mapelli
Juliette V. Schleicher
Alex Hawtin
Conor D. Rankine
Fiona C. Whiting
Fergal Byrne
C. Rob McElroy
Claudiu Roman
Cecilia Arsene
Romeo I. Olariu
Iustinian G. Bejan
The atmospheric chemistry of 2,2,5,5-tetramethyloxolane (TMO), a promising “green” solvent replacement for toluene, was investigated in laboratory-based experiments and computational calculations. Results from both absolute and relative rate studies demonstrated that the reaction OH + TMO (Reaction R1) proceeds with a rate coefficient k1(296 K) = (3.1±0.4) cm3 molecule−1 s−1, a factor of 3 smaller than predicted by recent structure–activity relationships. Quantum chemical calculations (CBS-QB3 and G4) demonstrated that the reaction pathway via the lowest-energy transition state was characterised by a hydrogen-bonded pre-reaction complex, leading to thermodynamically less favoured products. Steric hindrance from the four methyl substituents in TMO prevents formation of such H-bonded complexes on the pathways to thermodynamically favoured products, a likely explanation for the anomalous slow rate of Reaction (R1). Further evidence for a complex mechanism was provided by k1(294–502 K), characterised by a local minimum at around T=340 K. An estimated atmospheric lifetime of τ1≈3 d was calculated for TMO, approximately 50 % longer than toluene, indicating that any air pollution impacts from TMO emission would be less localised. An estimated photochemical ozone creation potential (POCPE) of 18 was calculated for TMO in north-western Europe conditions, less than half the equivalent value for toluene. Relative rate experiments were used to determine a rate coefficient of k2(296 K) = (1.2±0.1) cm3 molecule−1 s−1 for Cl + TMO (Reaction R2); together with Reaction (R1), which is slow, this may indicate an additional contribution to TMO removal in regions impacted by high levels of atmospheric chlorine. All results from this work indicate that TMO is a less problematic volatile organic compound (VOC) than toluene.
- Article
(3663 KB) - Full-text XML
- Companion paper
-
Supplement
(1238 KB) - BibTeX
- EndNote


Aromatic solvents, unsustainably sourced from the petroleum industry, are harmful to health, often potentially carcinogenic, and environmentally hazardous (Jimenez-Gonzalez et al., 2011). Considerable research effort therefore has been directed towards developing less harmful and hazardous new “green” solvents. Sustainably sourced from readily available, potentially renewable feedstock, 2,2,5,5-tetramethyloxolane (Fig. 1) also known as 2,2,5,5-tetramethyltetrahydrofuran, henceforth TMO, is a promising green solvent with unusual properties. Byrne et al. (2017) reported that the four methyl substituents alpha to the ethereal oxygen lead to a low basicity and (by excluding alpha hydrogens) an inherent resistance to peroxide formation. TMO exhibits solvent behaviour similar to common hydrocarbons and has been proposed as a replacement compound for toluene (formally methylbenzene, C6H5CH3) (Byrne et al., 2017). C6H5CH3 is used at industrial sites and even in consumer products for a wide range of applications. Widespread in building work and coating products, as well as detergents and fragrances, C6H5CH3 can be released in indoor and outdoor areas, and its manufacturing reaches 106–107 t yr−1 in the European Economic Area (Echa, 2022). Both C6H5CH3 and TMO are examples of volatile organic compounds (VOCs), i.e. organic liquids with significant vapour pressures at ambient temperature. The atmospheric oxidation of VOC is governed by complex mechanisms and proceeds via a host of partially oxidised intermediates (Atkinson, 1986; Atkinson and Arey, 2003; Jenkin et al., 1997; Saunders et al., 2003). The crucial, often rate-determining, step is the first attack on the VOC from oxidants such as ozone (O3) and gas-phase free radicals or directly via photolysis. For C6H5CH3, the principal breakdown route is via a bimolecular reaction, Reaction (R3), with the hydroxyl radical (OH).
IUPAC has evaluated the kinetic literature for Reaction (R3) and recommends a rate coefficient of k3(298 K) cm3 molecule−1 s−1 with an associated uncertainty Δlogk3(298 K) =0.10 or approximately 25 % (Mellouki et al., 2021). The removal rate of C6H5CH3 from the troposphere via Reaction (R3) is therefore reasonably well established, with a photochemical lifetime of around 2 d. The subsequent oxidative breakdown of aromatics such as C6H5CH3 in air is known to yield rapidly large quantities of harmful ozone (O3), formaldehyde (HCHO), and particulates (Hansen et al., 1975; Saunders et al., 2003; Bloss et al., 2005). Waste and/or inefficient use of aromatic VOC is therefore an established source of harmful gaseous emissions to the atmosphere. Overall mortality from poor air quality has been estimated as a cause of over 400 000 annual deaths in Europe alone (EEA Report 9/2020 (EEA, 2020; Lelieveld et al., 2019). By contrast with established pollutants, little to nothing is known of the atmospheric chemistry of TMO. In the absence of a near-UV chromophore (Christianson et al., 2021) and any C=C double bonds, the principal route for breakdown of TMO in the troposphere is likely via Reaction (R1) with OH (Fig. 1). In air heavily impacted by atmospheric chlorine (Ariya et al., 1999; Atkinson and Aschmann, 1985; Thornton et al., 2010), TMO loss may be augmented by reaction with Cl atoms (Reaction R2).
To date there appears to be no gas-phase kinetic data on Reactions (R1)–(R2) from which to calculate the reactivity and properties such as the atmospheric lifetime of TMO. In the absence of such data, even a cursory assessment of the environmental impact of replacing C6H5CH3 with TMO is not feasible. Accordingly, the objectives of this work were to use lab-based experiments to determine accurate values of k1 and k2 and to interpret these results to make informed predictions as to the subsequent breakdown chemistry of TMO (Fig. 1).
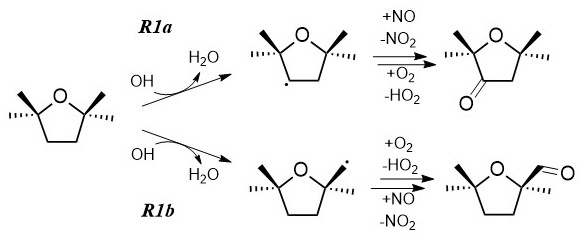
Figure 1The chemical structure of TMO and the two possible breakdown routes following Reaction (R1) with OH. The differing reactivities of the ketone (Reaction R1a) and aldehyde (Reaction R1b) products with respect to reaction with OH and to photolysis will control subsequent breakdown chemistry and ultimately the impact of TMO on air quality metrics such as O3 production. Note that reaction of TMO with Cl (R2) would proceed via two equivalent pathways.
Laboratory-based experiments were carried out using two well-established kinetic techniques: pulsed laser photolysis (PLP) generation of OH coupled to direct detection by laser-induced fluorescence (LIF) for absolute determinations of k1(294–502 K) as detailed in Sect. 2.1 and a smog chamber equipped with long-path Fourier transform infrared spectroscopy (FTIR) for detection of TMO and suitable reference VOC for relative rate determinations of k1(296 K) and k2(296 K) as detailed in Sect. 2.2. Details of the quantum chemical calculations (QCCs) used to investigate TMO and OH–TMO complexes are provided in Sect. 2.3.
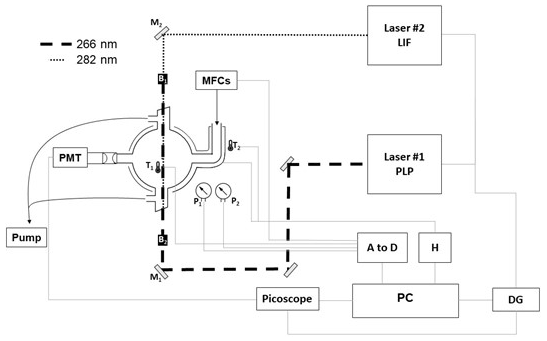
Figure 2Schematic of the PLP–LIF apparatus. Key: Laser#1 – 266 nm YAG for PLP OH generation; Laser#2 – 532 nm YAG-pumped dye, frequency doubled for output at 282 nm for OH LIF detection; M1 – 266 nm dichroic mirrors; M2 – 282 nm dichroic mirror; B1 and B2 – beam stoppers; T1 and T2 – thermocouples; P1 and P2 – 1000 and 10 Torr pressure gauges; DG – delay generator; H – thermal control box; A to D – analogue to digital converter to allow for PC control of gas flows and logging of cell temperature and pressure.
2.1 Direct PLP–LIF determinations of k1(T)
Absolute laser-based kinetic experiments were carried out at the University of York. Photochemistry took place in an approximately spherical Pyrex reactor vessel of volume ≈400 cm3 equipped with laser side arms and gas inlets (ca. 30 cm upstream of the photolysis region; see Fig. 2). All were wrapped with heating tape and insulated with glass-fibre tape; a K-type thermocouple situated between the walls of the reactor and the insulation tape was coupled to feedback electronics to allow for temperature control. Temperature in the reactor itself was monitored with a second K-type thermocouple that could be readily translated in and out of the photolysis region. Pressure was monitored by two calibrated capacitance manometers (MKS, 10 and 1000 Torr). Gas flow rates were regulated via four calibrated mass flow controllers (MFCs); gases were pre-mixed upstream of the reaction cell. Absolute determinations of k1(T) rely critically on knowledge of TMO concentration, here calculated to an estimated precision of ±15 % from manometric measurements.
The fourth harmonic output (E=20 mJ per pulse) from a Nd:YAG laser (Quantel, Q-Smart) operating at 10 Hz was directed into the reactor via a quartz Brewster window and used to generate OH via 266 nm PLP (Reaction R4 or R5) of one of two suitable radical precursors.
Kinetic experiments conducted in the absence of TMO and manometric estimates indicated that concentrations of either H2O2 or (CH3)3COOH were low (<1014 molecule cm−3) in all experiments. Under these conditions, an estimated [OH] molecule cm−3 was generated (Reaction R4 or R5). As such, pseudo-first-order conditions of [TMO] ≫ [OH] were applied throughout, save in experiments conducted with [TMO] = 0.
The 282 nm output from a frequency-doubled dye laser (radiant dyes using Rhodamine-6G; pumped at 532 nm by a YAG, Continuum) was directed through a second quartz Brewster window, co-linear but counter-propagating to the PLP laser (see Fig. 2). This tuneable laser light was used to pump the Q11 transition of at 281.997 nm for direct, off-resonant LIF detection of OH. Perpendicular to the laser beams, a pair of biconvex lenses was used to collect the 308 nm fluorescence from OH, direct it through a 309 nm interference filter, and onto a photomultiplier (PMT; Hamamatsu). The PMT output was passed through a fast pre-amplifier to an oscilloscope (Picoscope 6000) for collection, digitisation, and analysis.
Concerning chemicals, N2>99.9999 % was obtained directly from N2(l) boil-off; O2 (99.995 %, BOC) was used as supplied; H2O2 (JT Baker, 60 % in H2O) was prepped to an estimated (vapour pressure) mixing ratio of >90 % by continuous flow of N2 through the liquid to remove the more volatile H2O component then supplied via a bubbler maintained at T=273 K, situated downstream from a MFC and thus operating at close to reactor pressure; (CH3)3COOH (70 %, Sigma-Aldrich, Luperoxr TBH70X) was supplied from a Pyrex storage bulb (mixing ratio ≈2 % in N2); and TMO (>97 %, synthesised within the Green Chemistry Centre of Excellence, University of York) and CH3OH (99.9 %, Sigma-Aldrich) were both subject to repeated freeze–pump–thaw cycles at T=77 K prior to dilution with N2 (mixing ratios ≈1 % for TMO, ≈3 % for CH3OH) in 12 dm3 Pyrex bulbs for storage and supply.
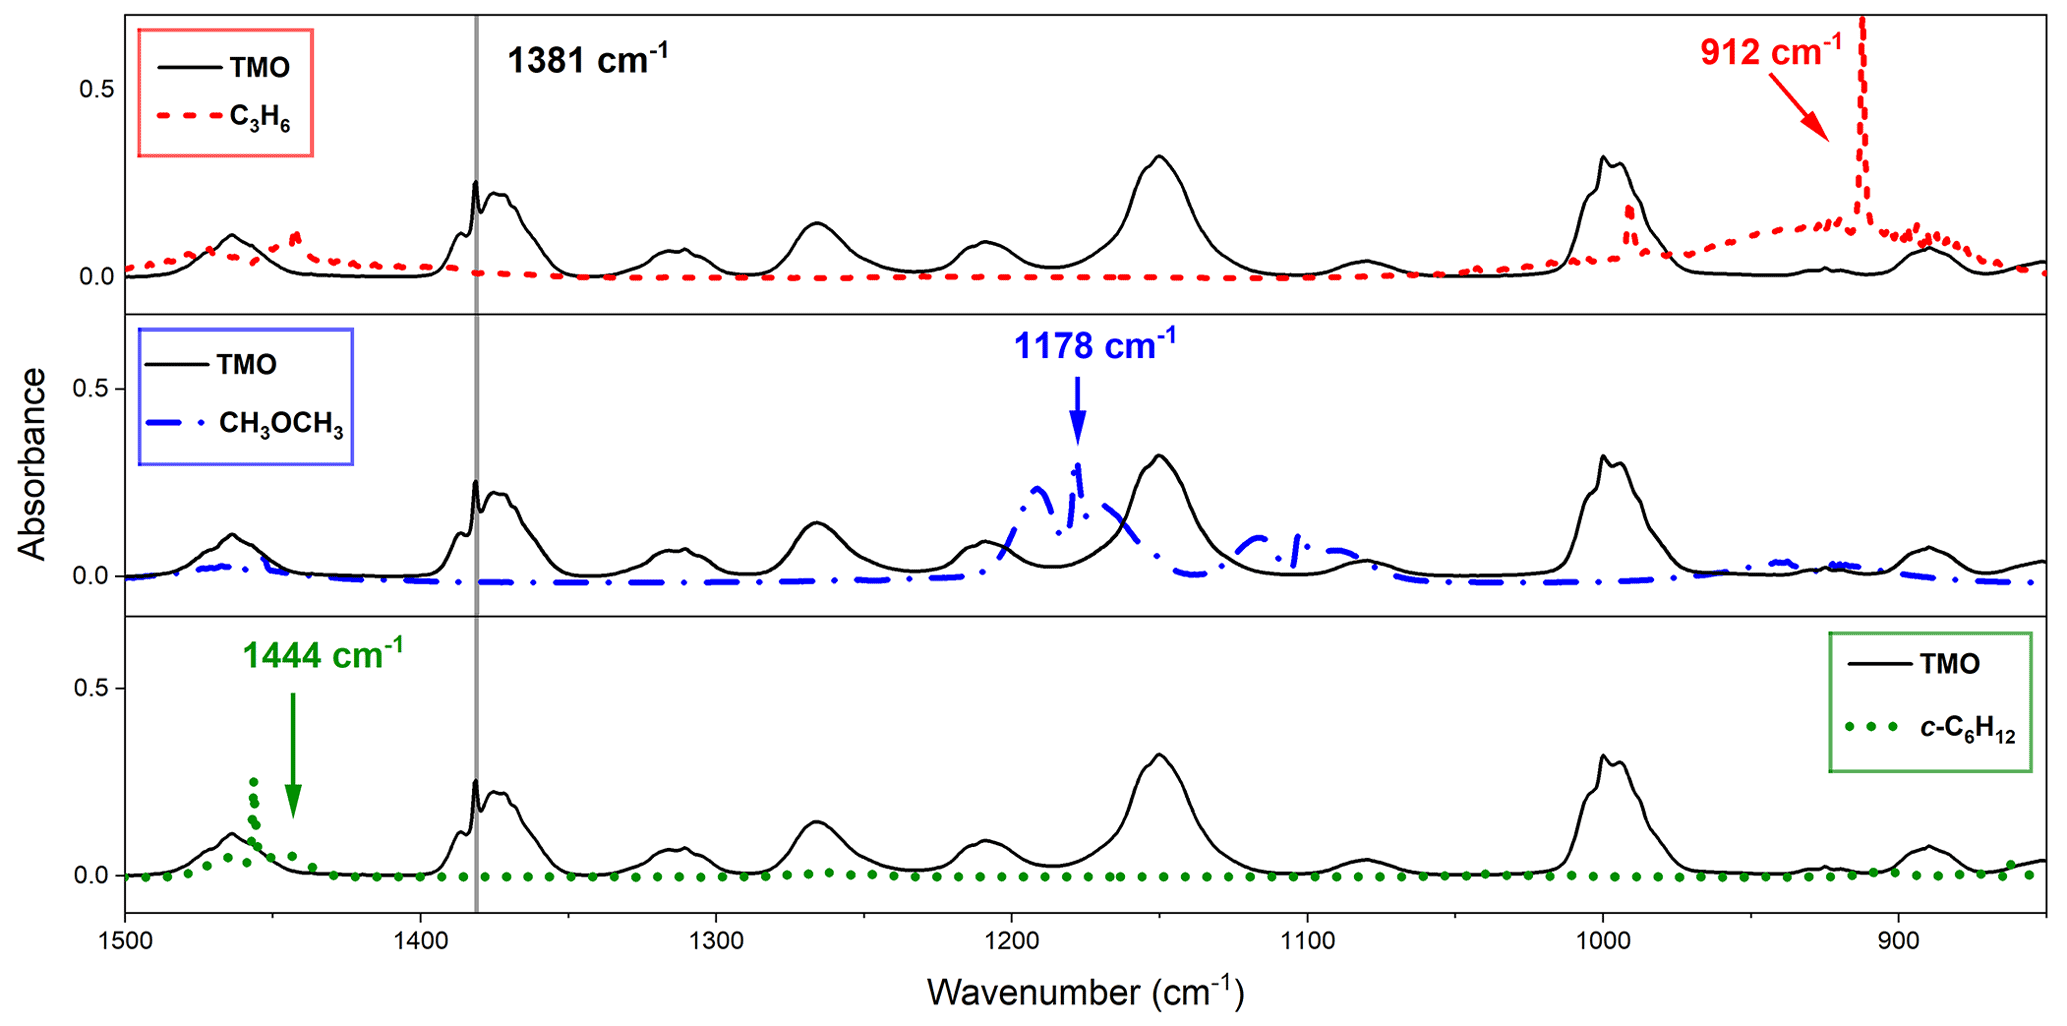
Figure 3Observed FTIR spectra from this work with typical monitoring frequencies indicated: TMO (black solid line), monitored at 1381 cm−1 where reference compounds did not appreciably absorb, for C3H6 (the dashed red line) at 1381 cm−1, and CH3OCH3 (dotted–dashed blue line) and c-C6H12 (dotted green line) at 1444 cm−1.
2.2 Smog chamber studies of Reactions (R1) and (R2)
Relative rate experiments were conducted in the 760 dm3 ESC-Q-UAIC environmental simulation chamber at “Alexandru Ioan Cuza” University of Iasi, Romania (Roman et al., 2022). The quartz chamber was equipped with inlet ports, sampling lines, two sets of UV lamps for photolysis at 365 nm (generation of OH or Cl-atoms) and at 254 nm (generation of OH), and FTIR instrumentation for observation of reference VOC, TMO, and TMO oxidation products. All experiments were conducted at Torr (synthetic air) and K. In preliminary experiments, wall deposition and photolysis rates (365 and 254 nm) were measured to ensure the validity of the experiment and to correct raw (Reaction R1 or R2) kinetic data as necessary. Spectral lines were tested for proportionality to the concentration of TMO and of reference compounds and for available subtraction spectral features of TMO and reference compounds. Two distinct OH generation methods were used. CH3ONO was injected into the chamber for photolysis at 365 nm (Reaction R6). The presence of an excess of NO ensured rapid conversion (Reactions R7 and R8) to OH.
Alternatively, OH was generated directly via 254 nm photolysis of H2O2 (Reaction R4). For all k2 determinations, atomic chlorine was generated by the photolysis of Cl2 at 365 nm (Reaction R9).
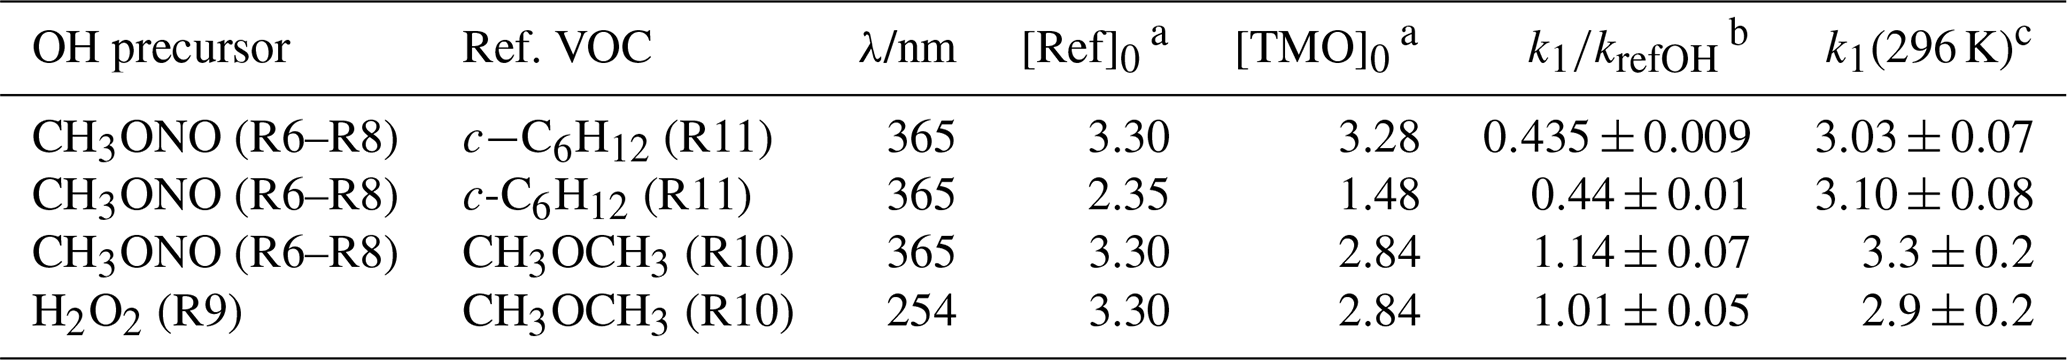
Choice of reference compound for kinetic experiments was informed by two factors. First, regarding FTIR spectra, experimental recorded IR spectra and those existing from NIST library data were used to ensure that reference compound spectra contained strong features that did not overlap with those of TMO (Fig. 3). Second, reference compound k(296 K) data needed to be well characterised and available in the literature (see Table 1); these values were preferably of a similar magnitude to measured (PLP–LIF) or predicted k1 and k2 values. According to these principles, the selected reference compounds for the reaction with OH were dimethylether (CH3OCH3) and cyclohexane (c-C6H12), as represented in Table 1 (Reactions R10 and R11). Since no absolute method was available to study Cl + TMO (Reaction R2), a third reference compound (propene, C3H6) was selected for these relative rate experiments (Table 1, Reactions R12–R14). All reference VOC, TMO, and TMO breakdown products were monitored by FTIR (Fig. 3). Spectra were recorded every 2 min by combining 120 scans for a spectrum, with approximately 15 such spectra at a resolution of 1 cm−1 completing each experiment. Conversion of TMO and reference compounds through the reaction with OH and Cl radicals has been achieved at least to 50 %.
Table 1Literature kinetic data for reference compounds used in determinations of k1(296 K) and k2(296 K).
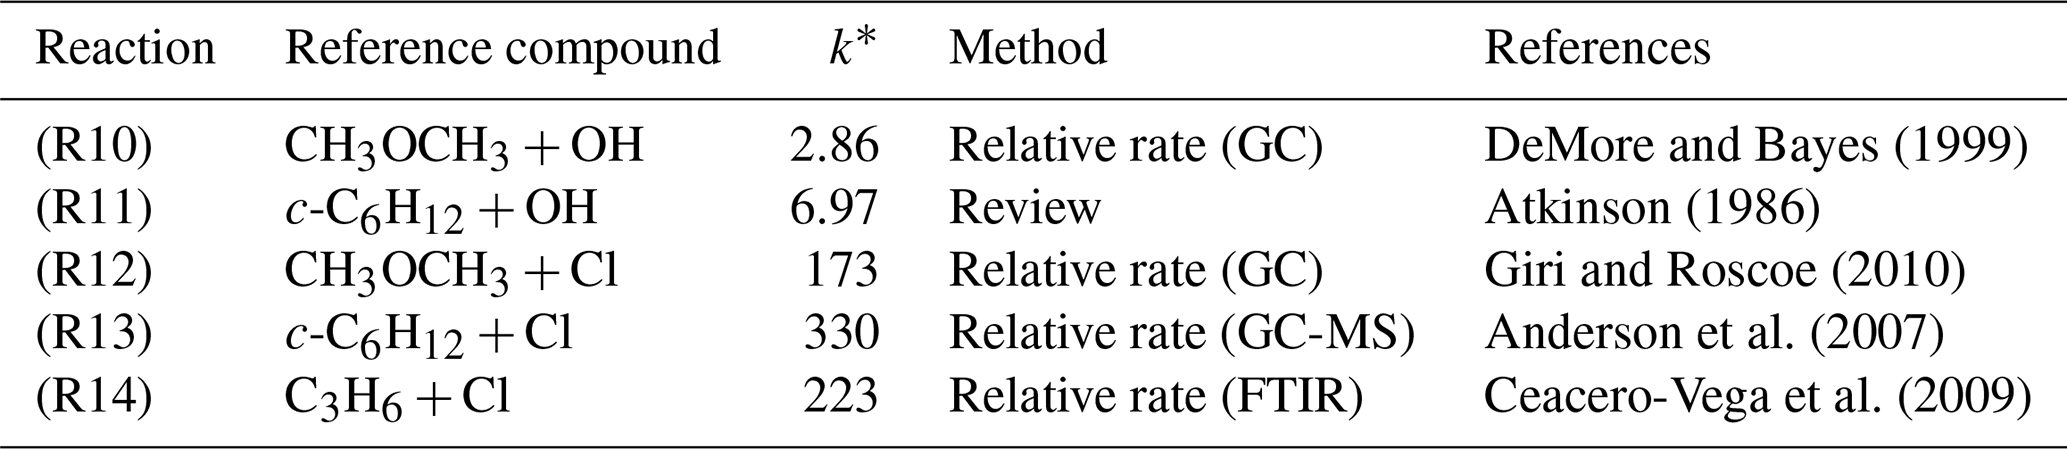
∗ k values in 10−12 cm3 molecule−1 s−1 are for conditions of Torr and K.
Concerning chemicals, liquid samples of the following were supplied to the reactor by direct injection through a septum: H2O2 (60 % in H2O); TMO (>97 %, synthesised within the Green Chemistry Centre of Excellence, University of York); CH3ONO, prepared in the CERNESIM laboratory using an adapted method from Taylor et al. (1980); and CH3OCH3>99.9 % (suitable for GC analysis, Sigma-Aldrich), c-C6H12 99.5 % (anhydrous, Sigma-Aldrich), and C3H6>99.9 % (Sigma-Aldrich) used as supplied.
2.3 Quantum chemical calculations (QCCs)
QCCs were carried out using Gaussian 09 rev. D01 (Frisch et al., 2016) at the complete basis set QB3 (CBS-QB3; Montgomery et al., 1999) and Gaussian-4 (G4; Curtiss et al., 2007) levels of theory. A self-consistent field (SCF) convergence criterion of a.u. was used in all calculations; convergence criteria of , , and a.u. were used for the energy change, rms gradient, and rms displacement, respectively, in all geometry optimisations. All geometries at which properties were evaluated at the CBS-QB3 level were optimised using density functional theory (DFT) at the B3LYP (Becke, 1993; Lee et al., 1988) level with the 6–311G(2d,d,p) (CBSB7) basis set; all geometries at which properties were evaluated at the G4 level were optimised using DFT at the B3LYP level with the 6-31G(2df,p) (GTBAS3) basis set. The proper convergence of all geometry optimisations to the stationary point of interest was verified via vibrational frequency inspection – one imaginary frequency for first-order saddle points (also called transition states, TSs) and no imaginary frequency for local minima.
Results from two experimental studies and from quantum chemical calculations are described below. Section 3.1 details determinations of k1(294–490 K) in direct, absolute laser-based experiments. In Sect. 3.2 the results from complementary relative rate experiments to determine k1(296 K) and k2(296 K) are presented. Section 3.3 contains results from QCCs to explore the structure and reactivity of TMO and its interactions with OH, whilst the discussion in Sect. 3.4 attempts to rationalise these results and to predict products. Uncertainties (±) quoted throughout this work have 2σ statistical significance only, derived from regression analysis, unless specifically stated otherwise.
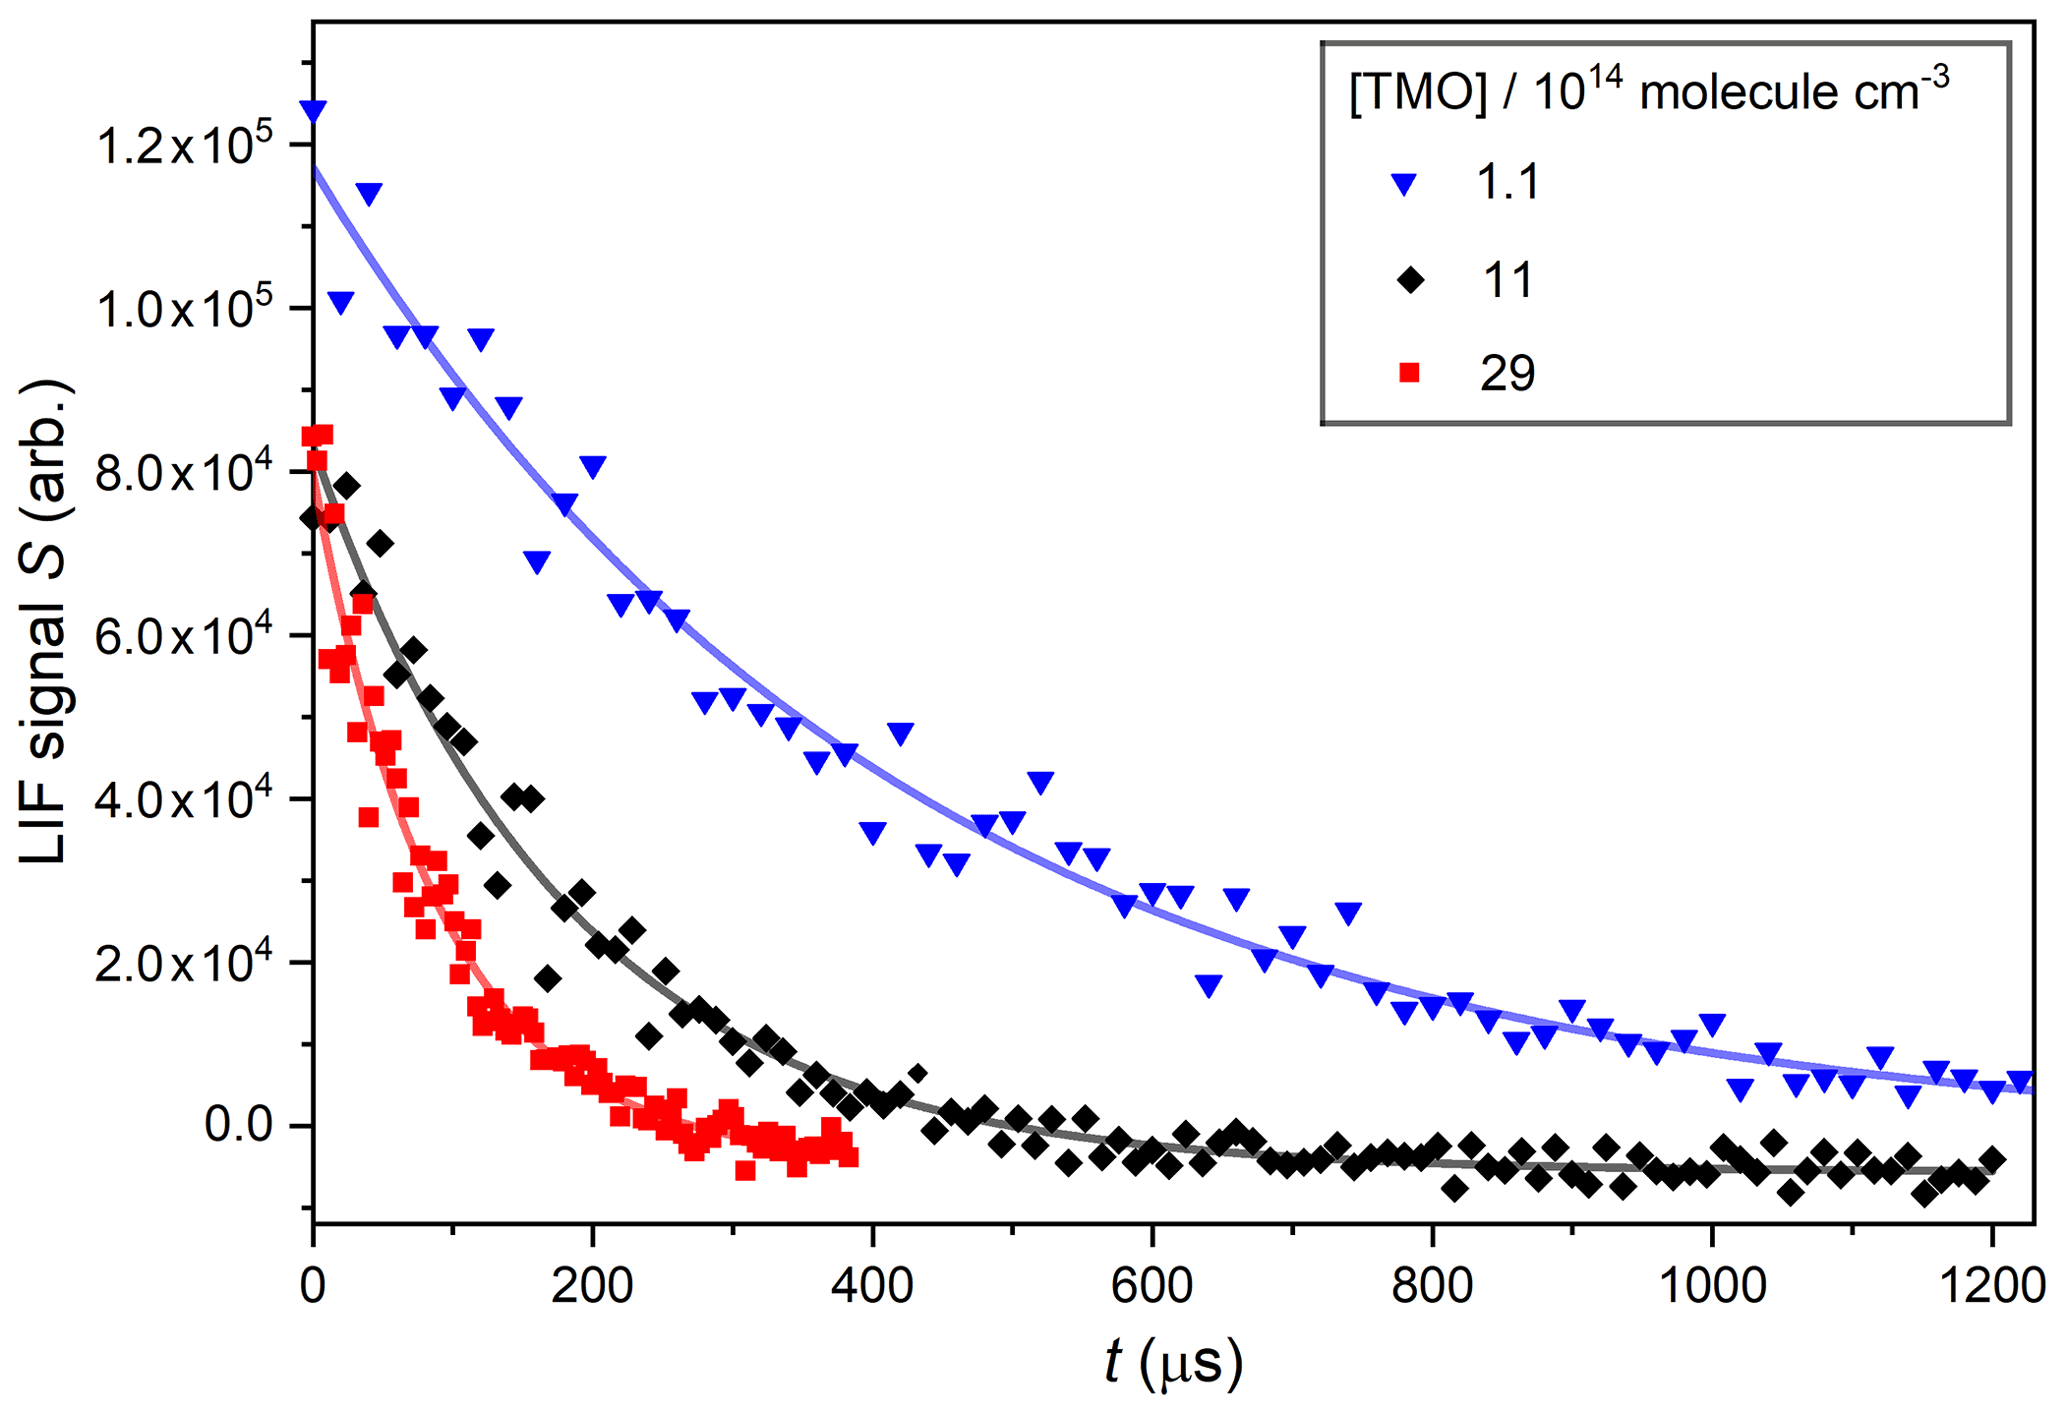
Figure 4Displays OH decays obtained in PLP–LIF experiments using three different [TMO], each fit with Eq. (1) to determine pseudo-first-order rate coefficients: s−1 at [TMO] molecule cm−3, s−1 at [TMO] molecule cm−3, and s−1 at [TMO] molecule cm−3.
3.1 PLP–LIF determinations of k1(T)
PLP–LIF studies were carried under pseudo-first order conditions of [TMO] ≫ [OH] such that (following subtraction of measured baseline) OH LIF time profiles, S(t), were described by a monoexponential decay expression:
The parameter S0 describes (in arbitrary units) the LIF signal at t=0 and is proportional to the initial [OH] produced by the laser pulse in Reaction (R4) or (R5). The parameter B is the pseudo-first-order rate coefficient for OH decay (and includes components from both reactive and transport losses). Figure 4 displays typical OH decay profiles recorded in the presence of three different excess [TMO], whilst other conditions of P=75 Torr (N2), T=296 K, and [H2O2] molecule cm−3 were unchanged. These and other similar OH LIF profiles were typically exponential over at least an order of magnitude and were fit with Eq. (1) to yield values of B with a high degree of precision (standard errors were generally less than ±5 %).
Systematic errors from unwanted radical chemistry were considered unlikely. Use of low [OH] ensured that losses of OH by reaction with itself or with Reaction (R1) or (R5) products were minimal. Further, cyclic/aliphatic ethers do not absorb appreciably at wavelengths longer than 200 nm (Christianson et al., 2021), so preventing generation of organic radical fragments in the laser flash. Nonetheless, two series of experiments were performed to test for the impact of unanticipated secondary chemistry. First, no systematic change in the value of parameter B was obtained upon changing the photolysis laser fluence by a factor of w (via modifications to the Q-switch delay). Second, a series of “back-to-back” experiments were performed where the bath gas was alternated between N2 and air. Once again, no systematic changes in parameter B were observed () from over 30 such paired experiments conducted at pressures of between 20 and 100 Torr. Taken together, these observations indicate that the influence of any secondary chemistry was negligible.
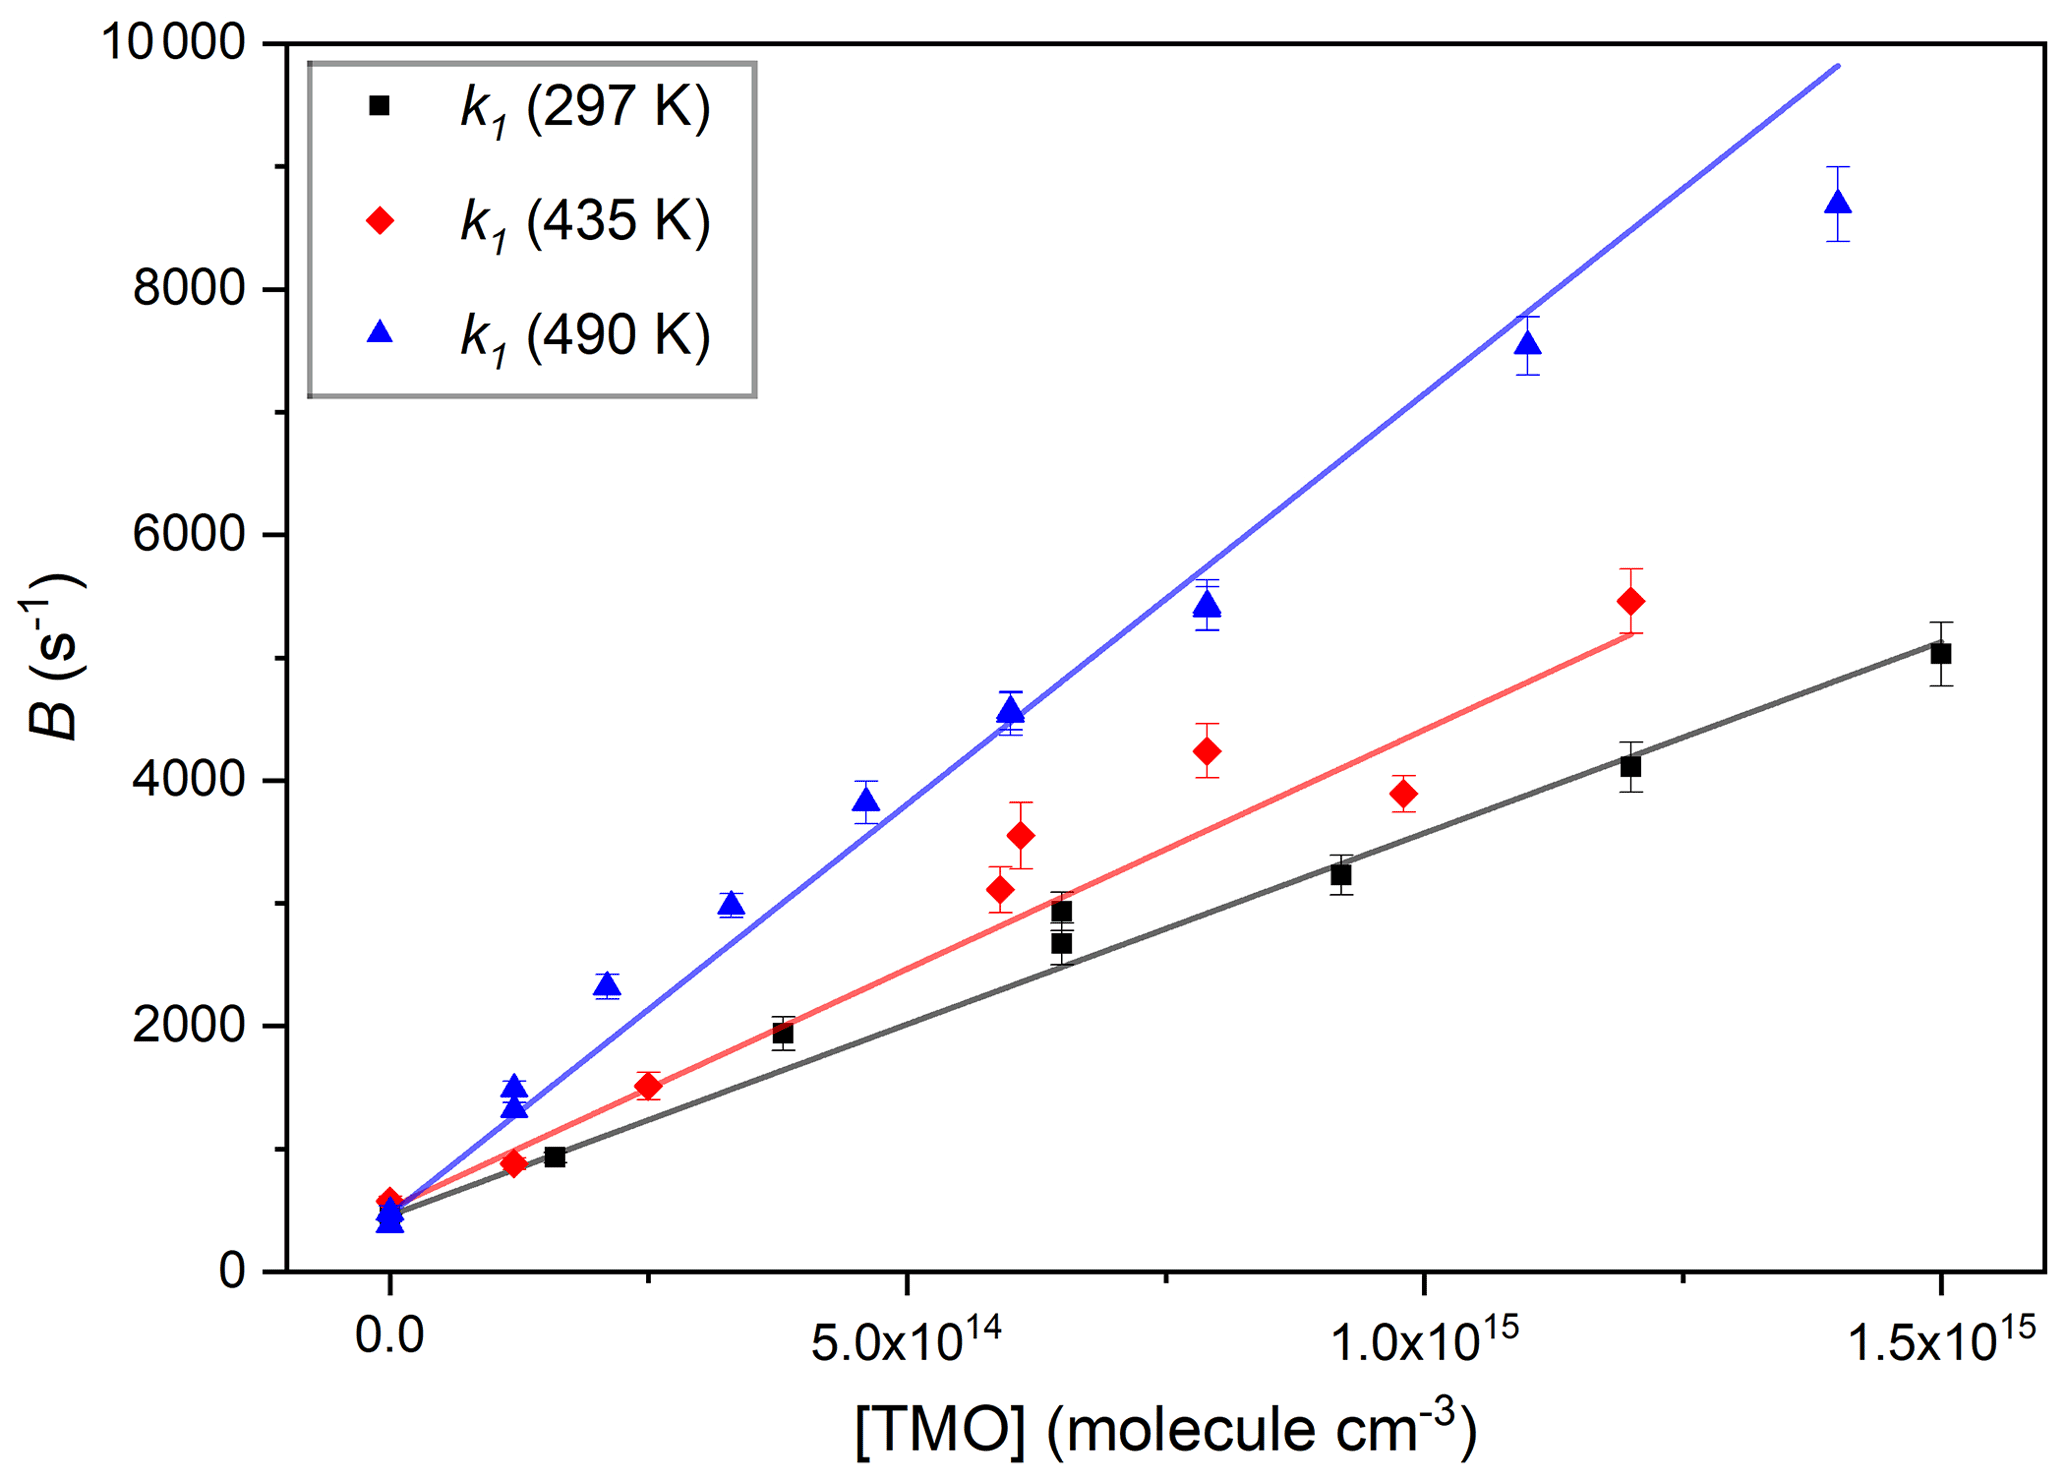
Figure 5Three typical bimolecular plots of B vs. [TMO] used to obtain k1(T) for OH + TMO, each fit with Eq. (2) to obtain k1(297 K) cm3 molecule−1 s−1, from the black squares; k1(441 K) cm3 molecule−1 s−1, from the red diamonds; and k1(502 K) cm3 molecule−1 s−1, from the blue triangles.
Figure 5 displays plots of parameter B vs. [TMO] at three temperatures; each were fit with Eq. (2) to obtain values of k1(T):
where the term kloss (in s−1) accounts for other losses of OH, here dominated by Reaction (R15) with the photolysis precursor H2O2 with some small contribution from diffusion and flow out of the reaction zone.
The data display good linearity, with the slopes identified as k1(T) at three different temperatures and intercept values (around a few hundred per second) in line with the predicted rate for Reaction (R15) with an estimated [H2O2] =1014 molecule cm−3. A mean of four values obtained at around room temperature yielded k1(296 K) = cm3 molecule−1 s−1, independent of the bath gas pressure or identity (N2 or air). To the best of our knowledge, these results represent the first such kinetic data for Reaction (R1). Experimental conditions and results of all PLP–LIF determinations of k1 are listed in Table 2. Note that these absolute determinations of k1 were critically dependent on reliable determination of [TMO] via manometric measurements. Every effort was made to calibrate MFC and pressure gauges and to conduct experiments using a variety of conditions of pressure, flow rate, and different TMO supply bulbs. Many of the experiments to determine k1(T) were conducted “back-to-back” with the well-characterised reaction, Reaction (R16), which is known to proceed with a rate coefficient of an approximately similar magnitude.
Table 2 lists full results for absolute kinetic experiments to determine k1(T) and k16(T) in this work.
Table 2Absolute k1(T) for OH + TMO and k16(T) for OH + CH3OH determined via PLP–LIF in this work.
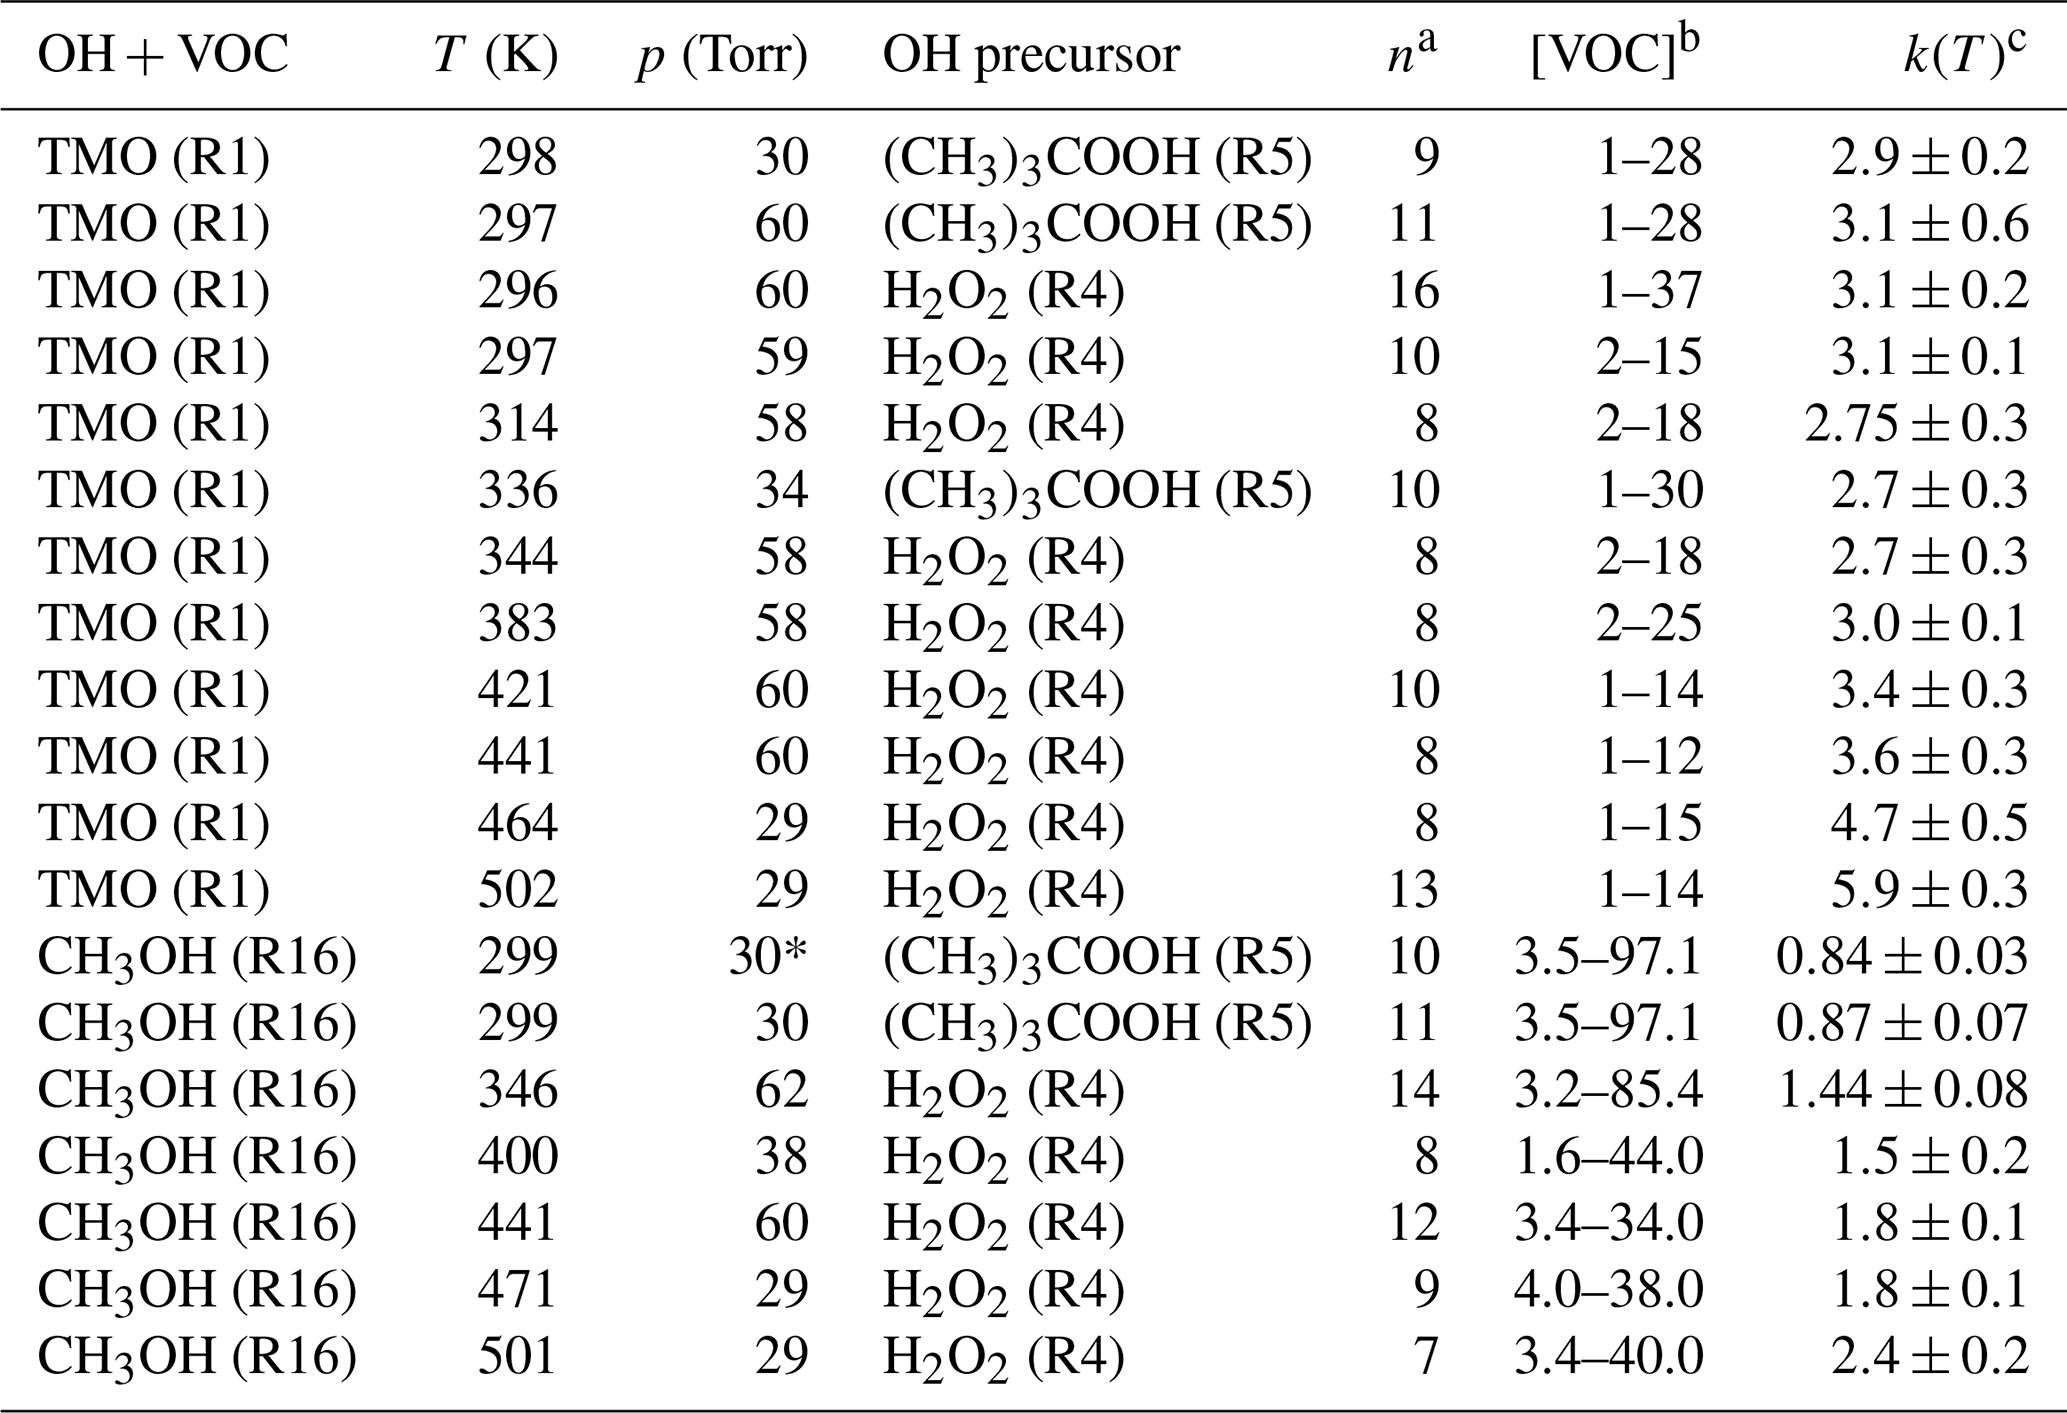
a n is the number of different [VOC] used (not including [VOC] = 0). b Range of [VOC] in units of 1013 molecule cm−3. c k(T) in units of 10−12 cm3 molecule−1 s−1; bath gas M= N2 unless denoted ∗, where M= air.
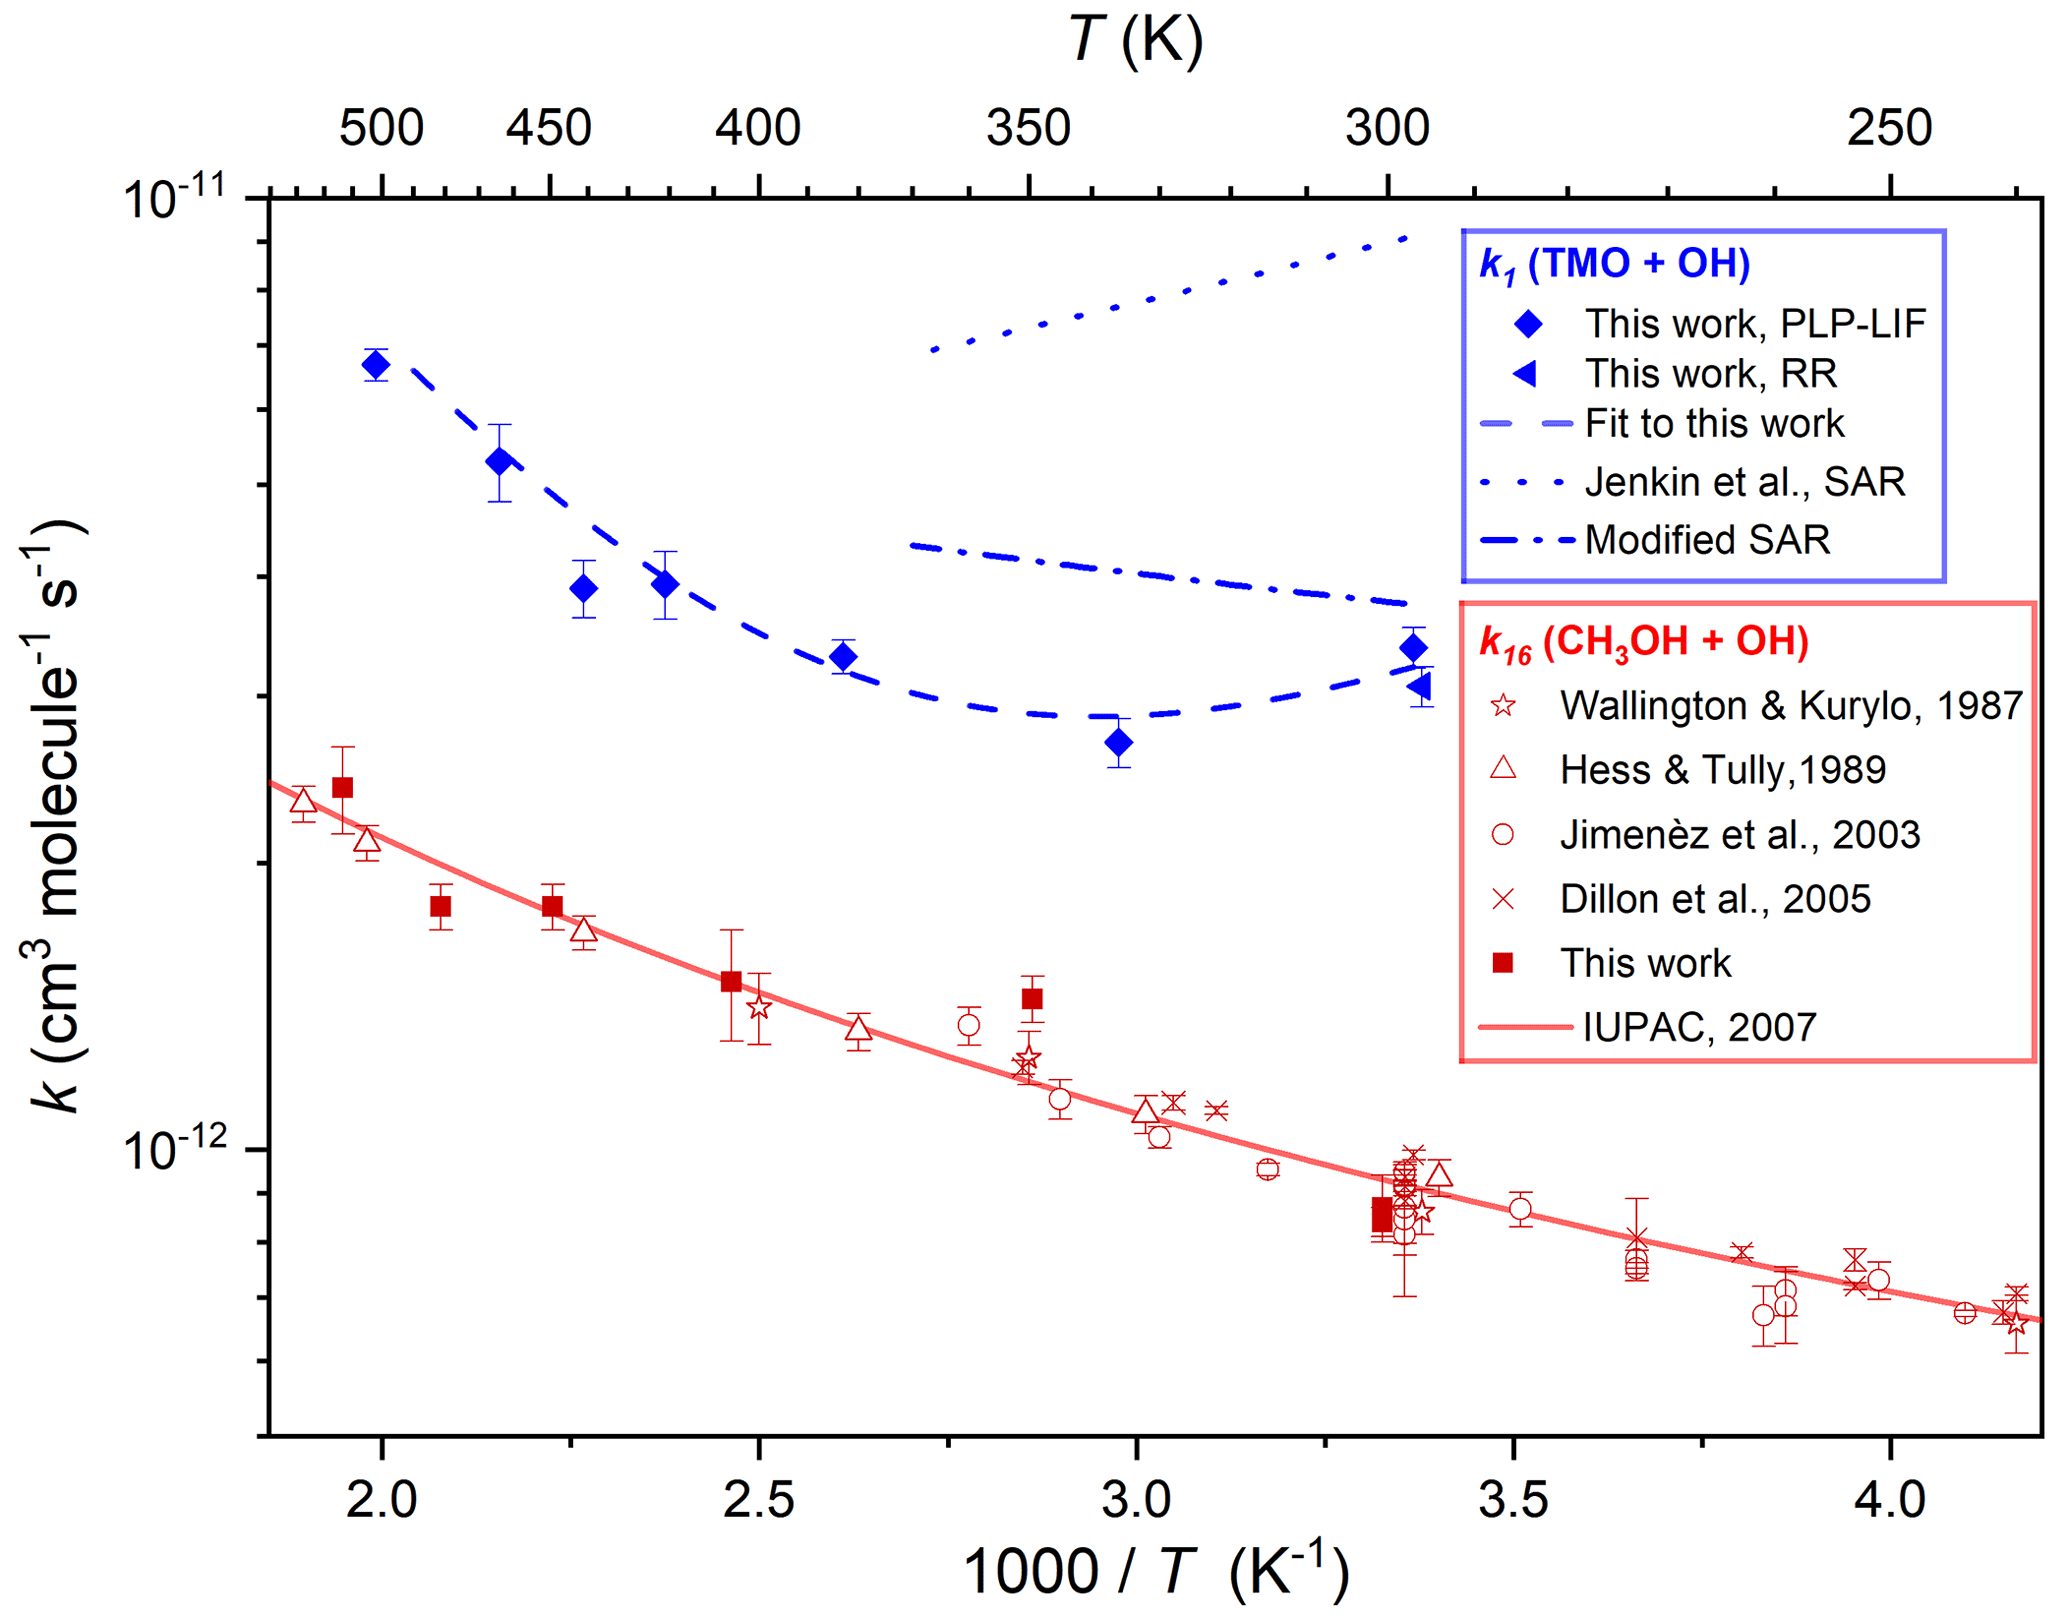
Figure 6Arrhenius plot displaying k1(T) results from this work obtained via PLP–LIF (filled blue diamonds) and RR (filled blue triangle) all fit with the four-parameter expression, Eq. (4), to yield k1(294–502 K) cm3 molecule−1 s−1 (the dashed blue line). Calculated k1(298–370 K) using the SAR proposed by Jenkin et al. (2018) is displayed as the dotted blue line, whilst the dotted–dashed blue line represents a modified SAR calculation (see Sect. 3.4). Also displayed are k16(299–501 K) from this work (filled red squares) alongside literature determinations (Hess and Tully, 1989; Wallington et al., 1988; Jiménez et al., 2003; Dillon et al., 2005) and the most recent evaluation from IUPAC (Atkinson et al., 2006), recommending k16(210–866 K) cm3 molecule−1 s−1 (the solid red line).
Figure 6 presents the results from these PLP–LIF experiments in Arrhenius format. Results for Reaction (R16) were in reasonable agreement with previous determinations (Wallington et al., 1988; Hess and Tully, 1989; Jiménez et al., 2003; Dillon et al., 2005) and with a three-parameter expression, k11(210–866 K) = cm3 molecule−1 s−1, recommended by IUPAC (Atkinson et al., 2006) (see Fig. 6). This satisfactory agreement lends some confidence to the assessment of uncertainties in k1(T) for this work. Over the limited range of temperatures explored in this work, the results for Reaction (R16) appear to conform closely to the Arrhenius equation, with the smallest values of k16(T) found at the lowest temperature. The contrast with the k1(294–490 K) data was stark, where a local minimum was observed at around T=340 K; values of k1 increased to both lower and higher temperatures. Potential explanations for this non-Arrhenius behaviour are explored in Sect. 3.3 below, where QCCs were used to explore OH–TMO interactions. A comparison with results for similarly oxygenated VOC + OH reactions is presented in Sect. 3.4.
3.2 Relative rate determinations of k1(296 K) and k2(296 K)
Figure 3 displays FTIR spectra of TMO recorded at the CERNESIM atmospheric simulation chamber (Roman et al., 2022). Qualitatively, the spectra compare well to predictions (Frisch et al., 2016), thus allowing for deployment of pre-planned reference compounds (Table 1) for relative rate experiments. Experiments conducted in the absence of radical precursors demonstrated that neither TMO nor the various reference VOC (Table 1) were significantly impacted by wall losses or photolytic removal, indicating that corrections to subsequent kinetic data were unnecessary. FTIR peak intensities were directly proportional to species concentrations and were used to calculate the logarithmic depletion for TMO and for the reference compound. Results from studies using c-C6H12 and CH3OCH3 as reference compounds to determine k1(296 K) are displayed in Fig. 7. According to Eq. (3), the slope from this plot should be a straight line with almost “zero” intercept and be identified with the relative rate .
The results obtained from these and a similar series of experiments are presented in Table 3. The spread of values seems reasonable given both statistical uncertainties and the (approximately 20 %) systematic uncertainties in the literature reference k values. A weighted mean value from these four relative rate determinations was k1,RR(296 K) cm3 molecule−1 s−1.
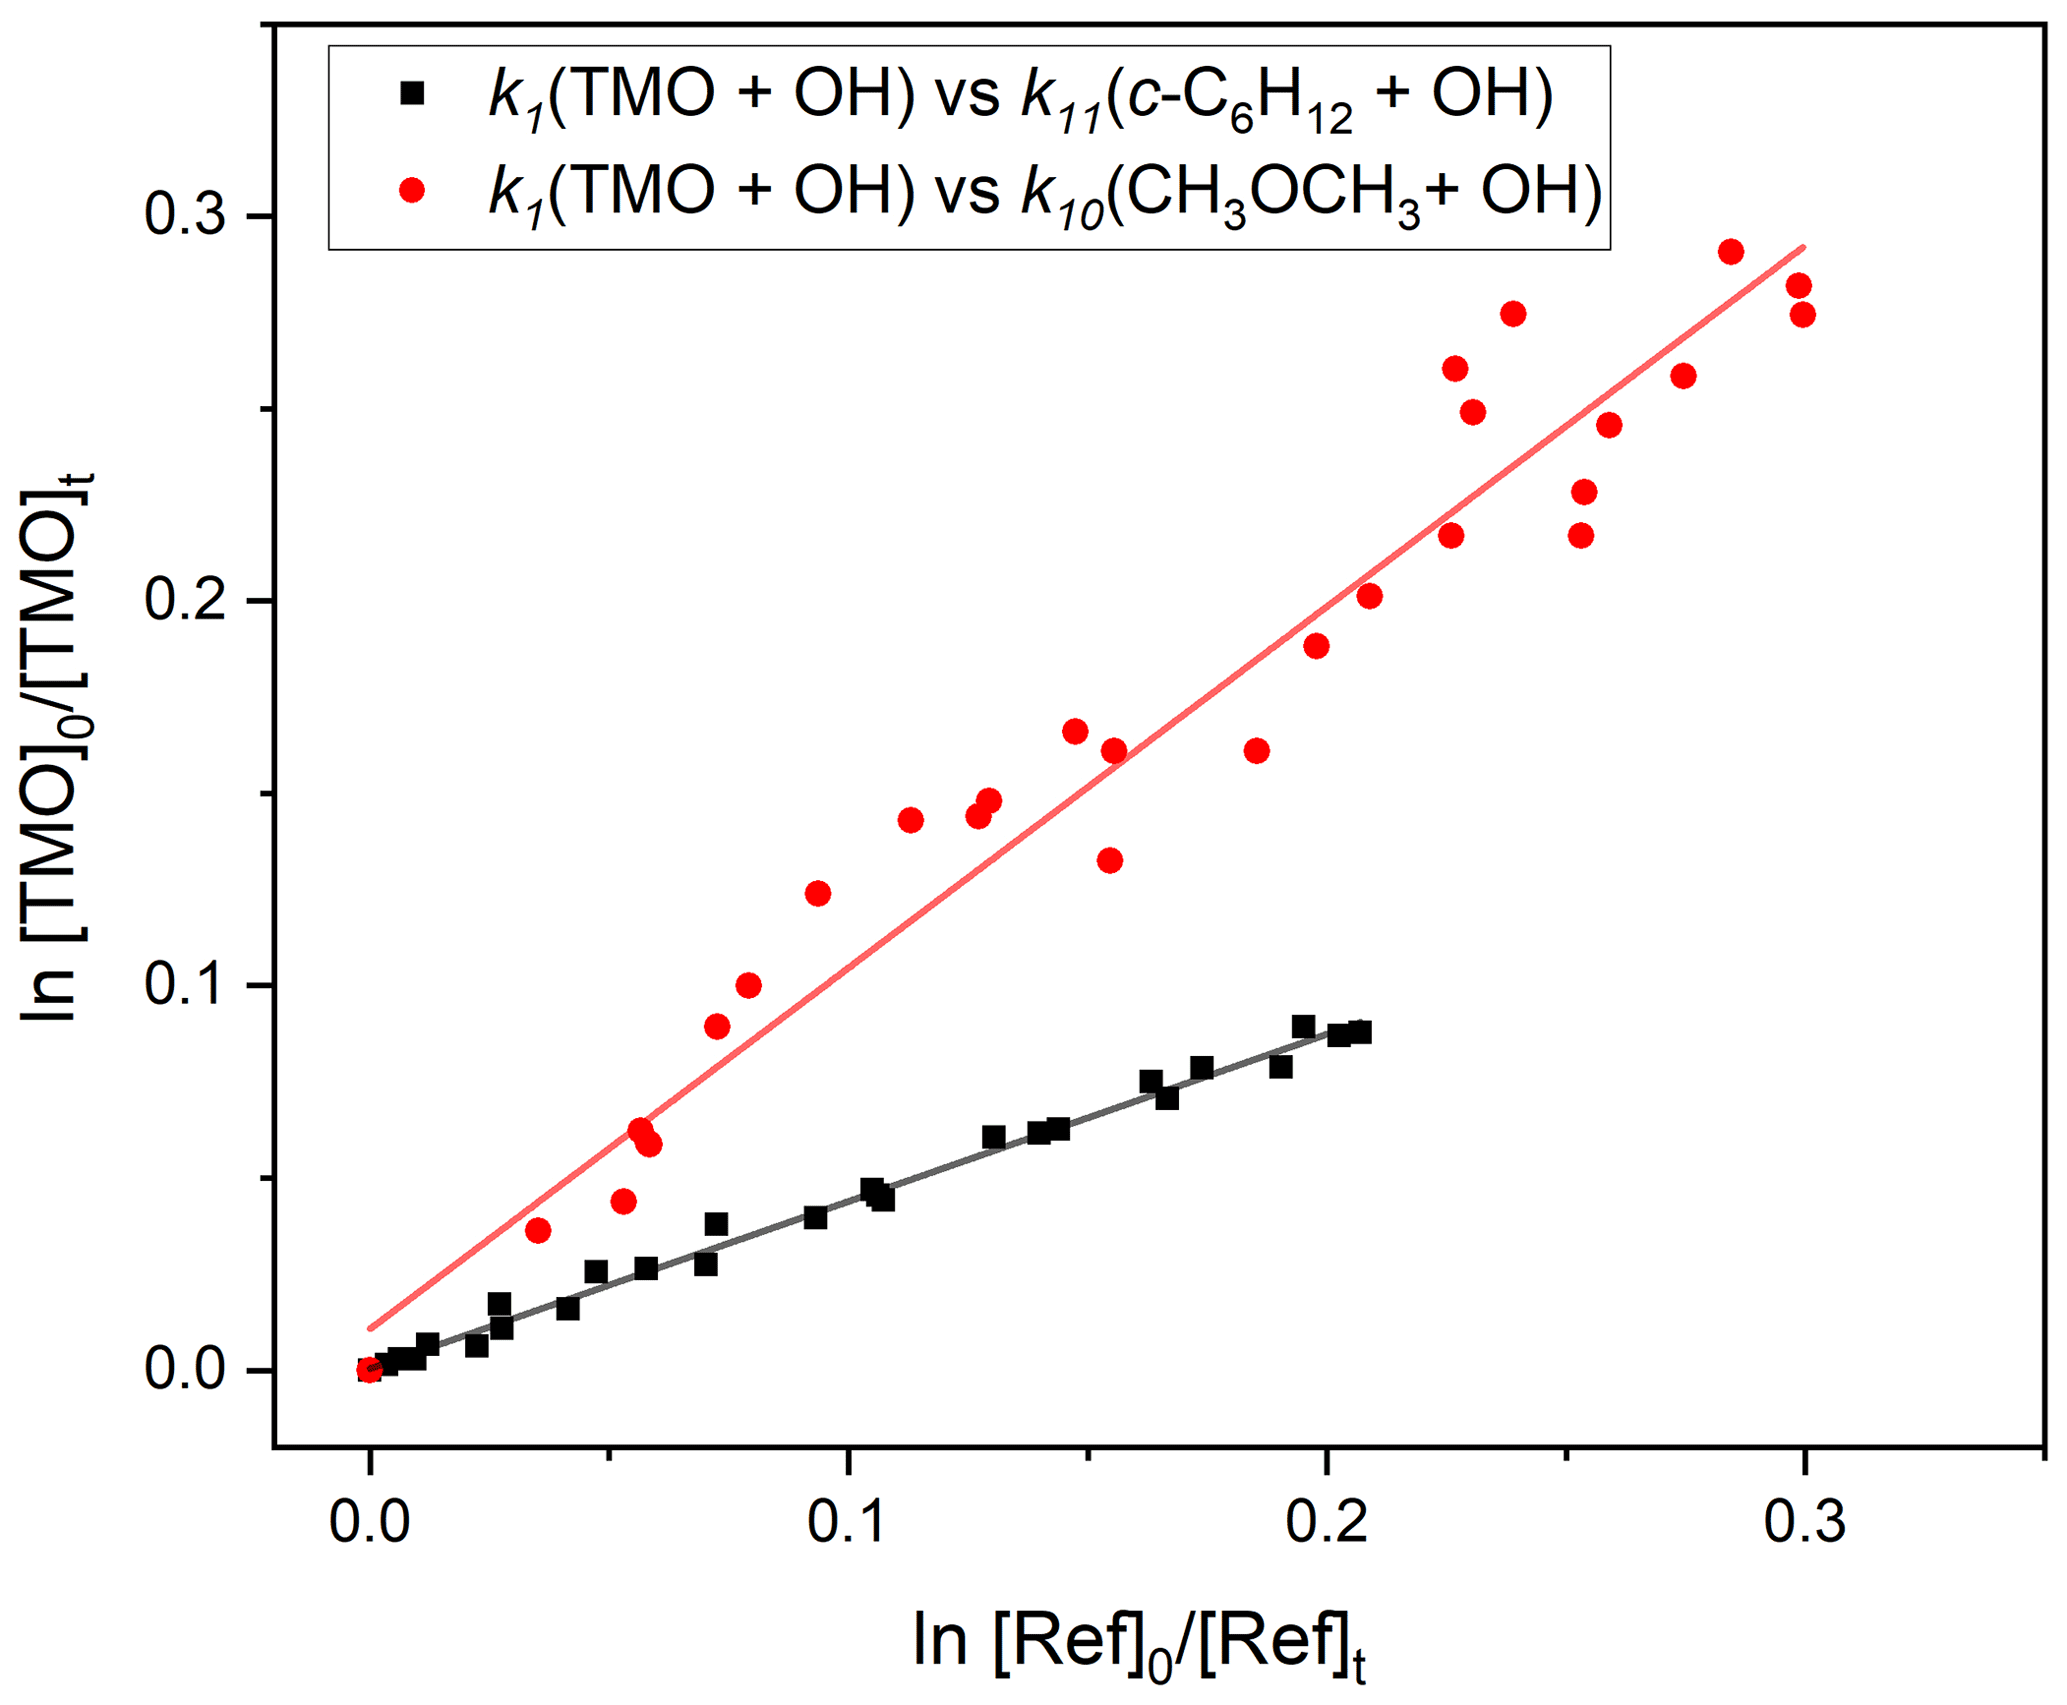
Figure 7Exemplary relative rate plots, used to determine k1(296 K) for OH + TMO (Reaction R1). The red circles correspond to use of CH3OCH3 (Reaction R10) as reference and the black squares c−C6H12 (Reaction R11). The solid lines are linear fits, with gradient values used (Eq. 3) in conjunction with literature data (Table 1) to obtain k1. Each experiment was repeated twice, and the full results, summarised in Table 3, were averaged to obtain k1(296 K) cm3 molecule−1 s−1.
Table 3Results from relative rate experiments to determine k1(296 K) for OH + TMO from this work.
Note that all experiments were conducted at p=1 bar (air) and T=296 K. a Initial [Ref] and [TMO] values calculated from the injected amount (in mass units) in 1013 molecule cm−3. b See Table 1 for values of k12(298 K) and k13(298 K) used here as kref. c k1(296 K) in units of 10−12 cm3 molecule−1 s−1.
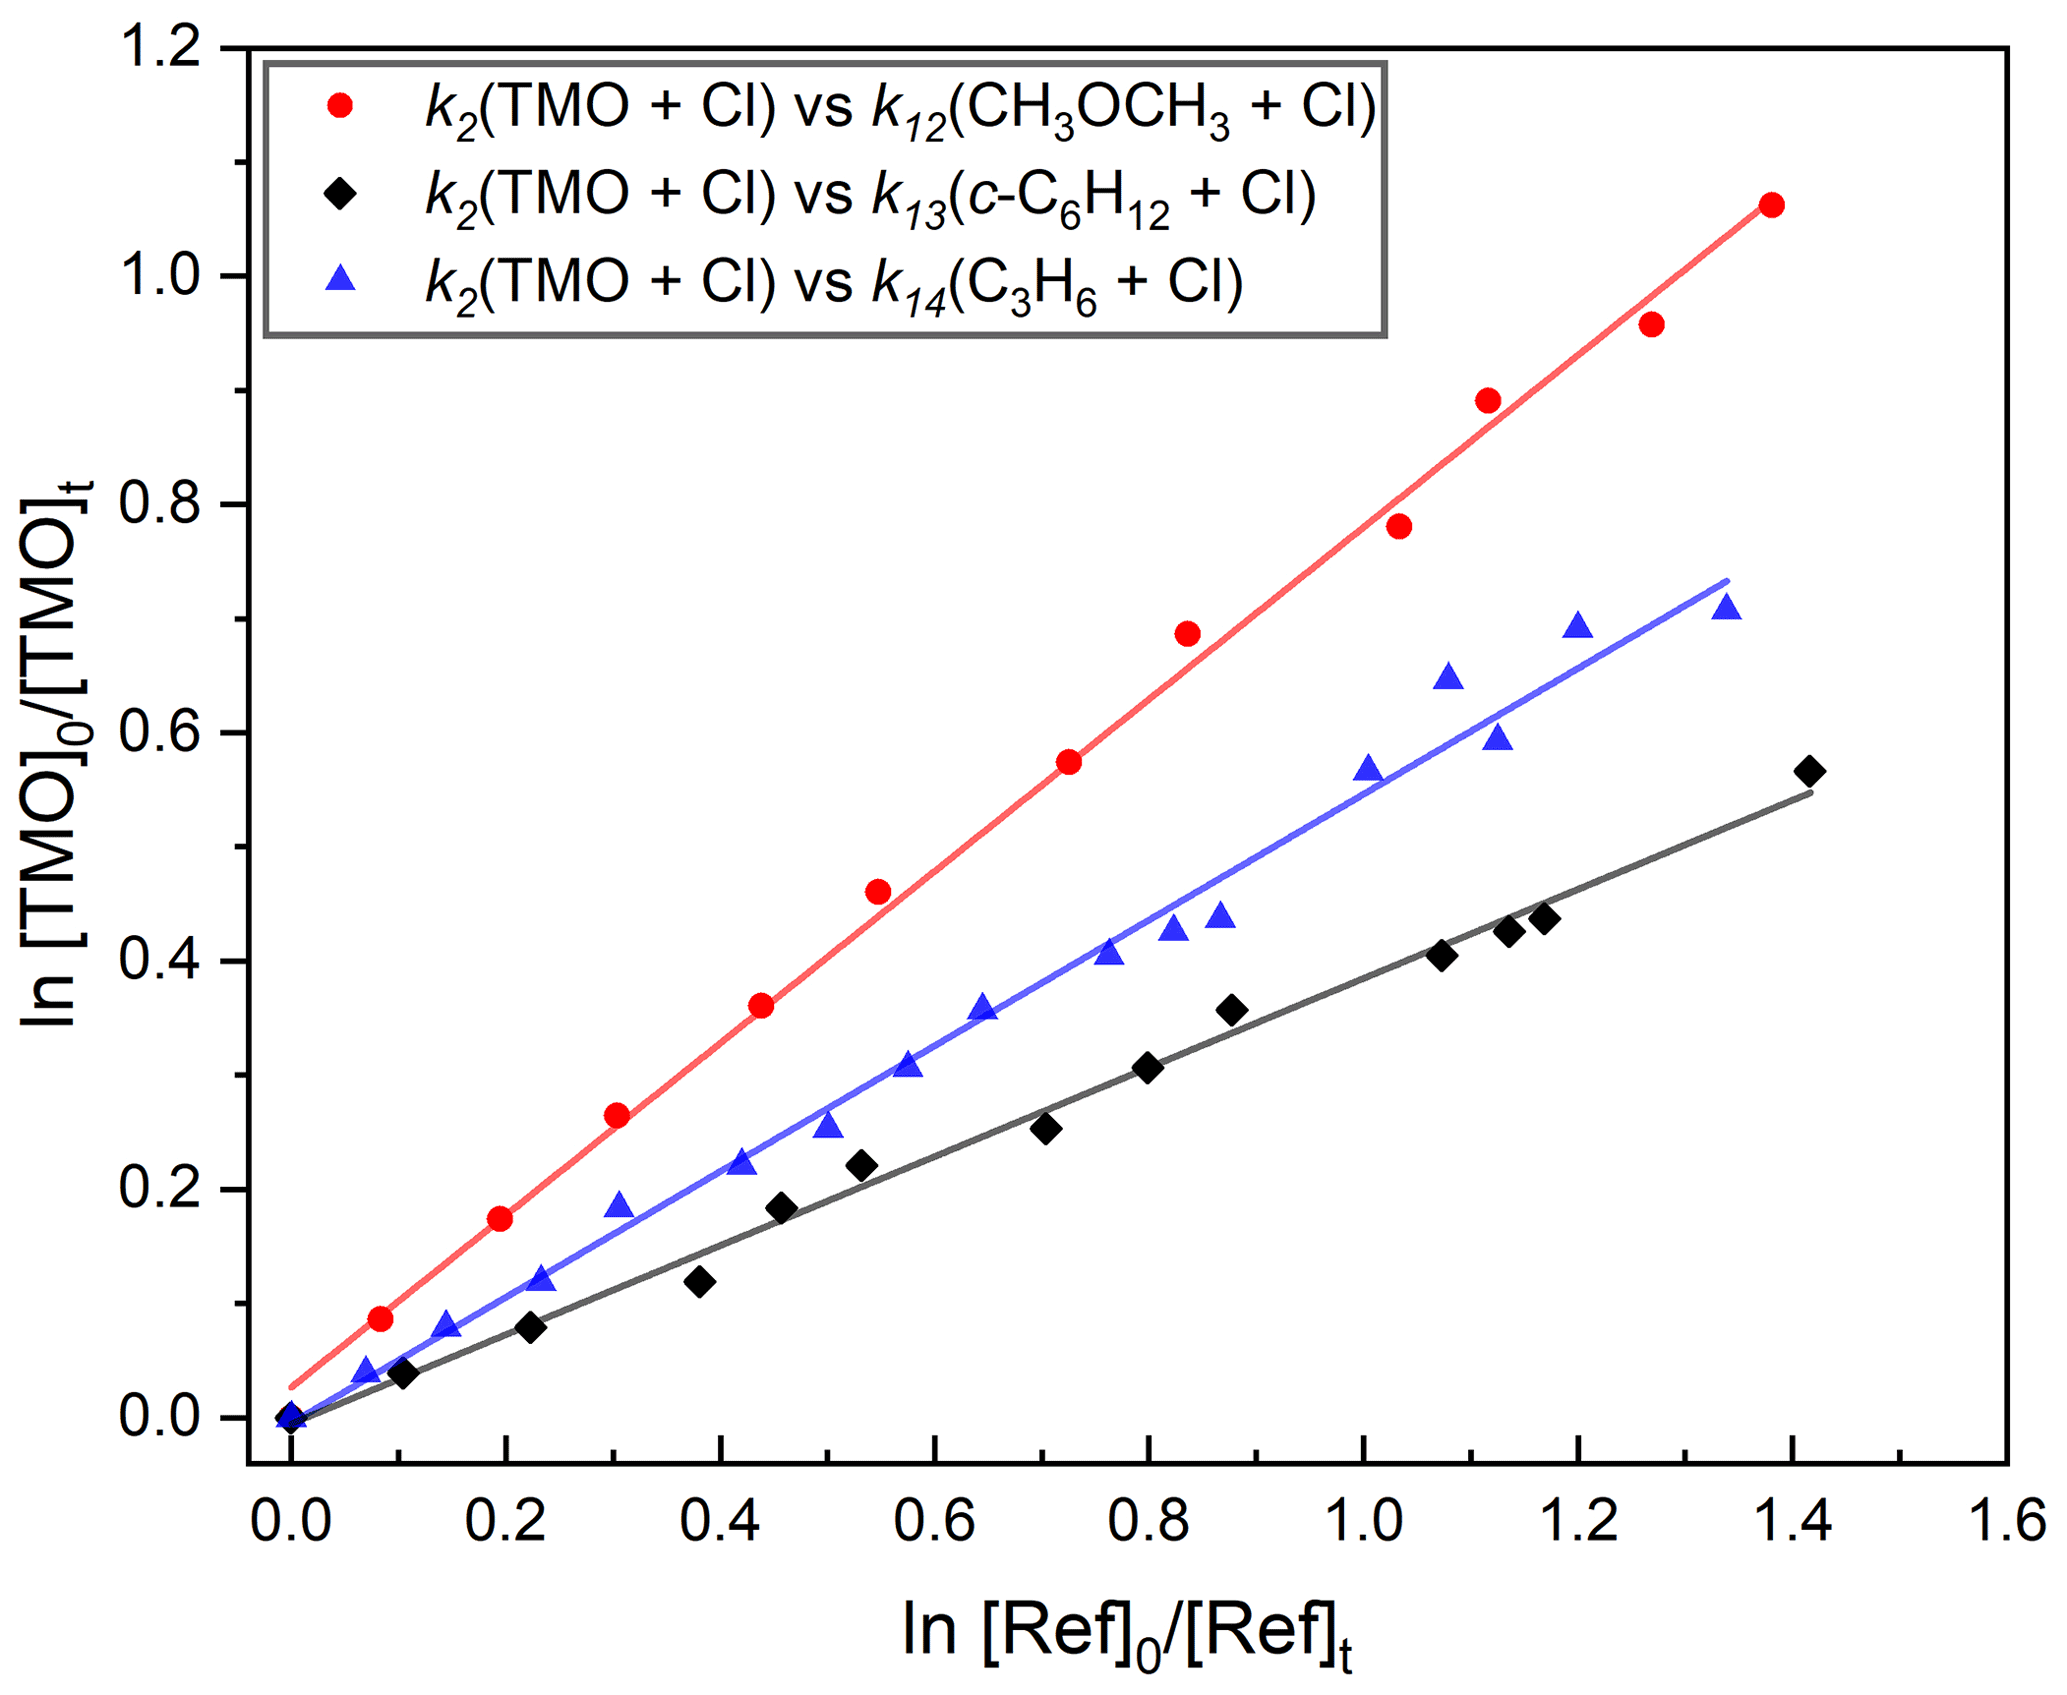
Figure 8Exemplary relative rate plots used to determine k2(296 K) for Cl + TMO (Reaction R2). Gradients obtained from linear fits (the solid lines) were used in conjunction with literature data (Table 1) to obtain k2. Each experiment was repeated twice, and the full results, summarised in Table 4, were averaged to obtain k2(296 K) cm3 molecule−1 s−1.
A similar series of experiments was conducted to determine k2(296 K) for Cl + TMO (Reaction R2). Details of reference compounds used were given in Table 1, exemplary results presented in Fig. 8, and the full dataset summarised in Table 4. The weighted mean value obtained was k2,RR(296 K) = (1.2±0.1) cm3 molecule−1 s−1, with k2(296 K) = cm3 molecule−1 s−1 representing a more realistic overall uncertainty estimate. This result is, to the best of our knowledge, the first such reported value for Reaction (R2).
Table 4Results from relative rate experiments to determine k2(296 K) for Cl + TMO from this work.
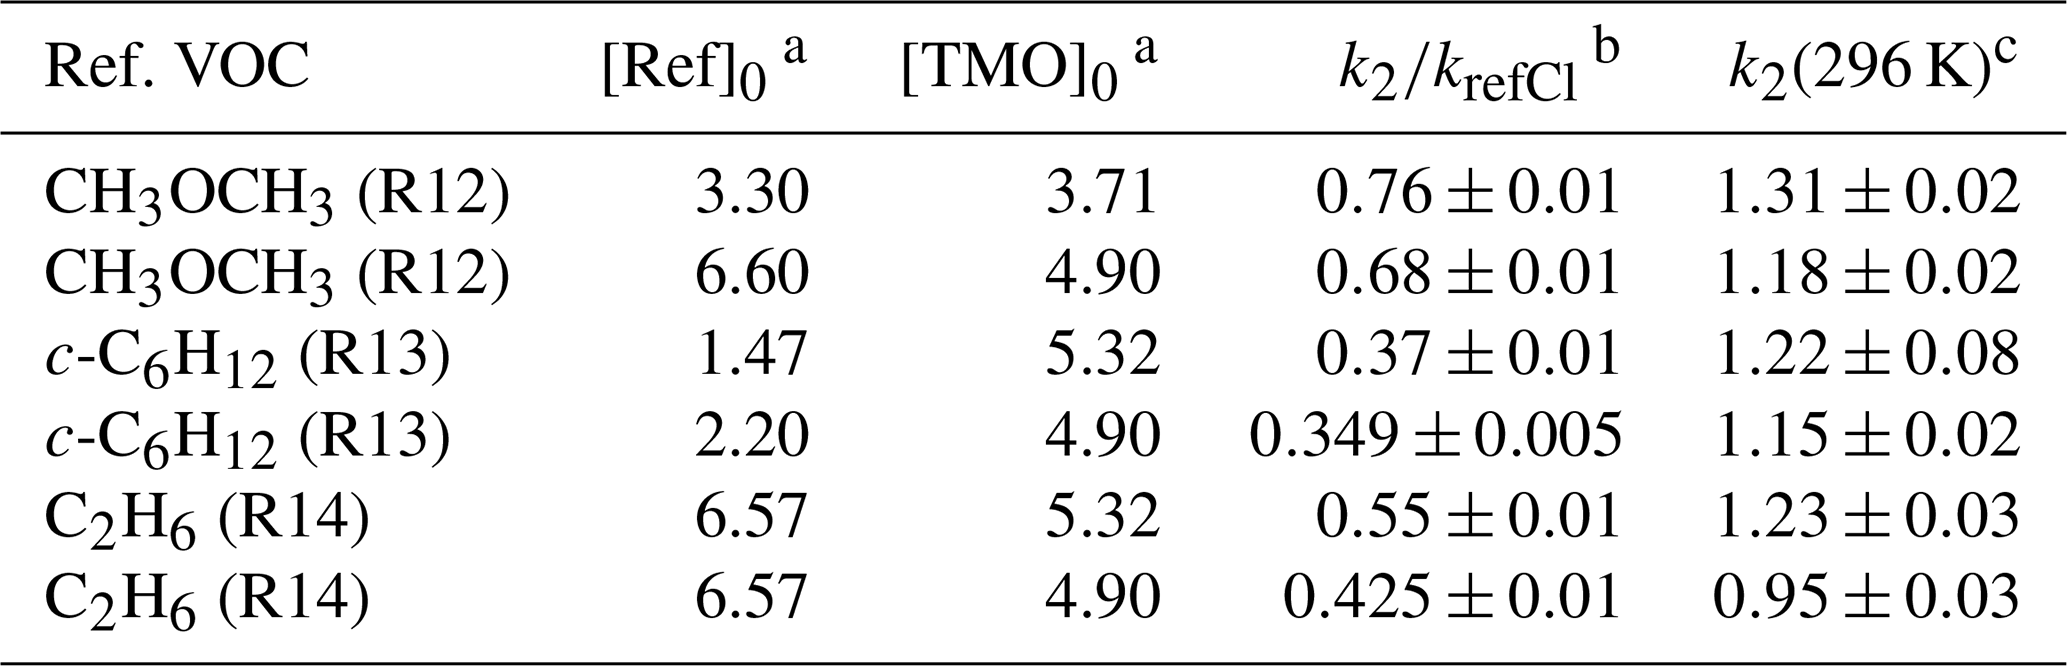
Note that all experiments were conducted at p=750 Torr (air) and T=296 K using 365 nm Cl2 photolysis to generate Cl atoms. a Initial [Ref]0 and [TMO]0 calculated from the injected amount (in mass units) in 1013 molecule cm−3. b See Table 1 for values of kref,Cl used here. c k2(296 K) from this work reported in 10−10 cm3 molecule−1 s−1.

Figure 9The five transition states (TSs) characterised via QCCs (Sect. 3.3) of which , , and are associated with “direct”, non-stabilised hydrogen abstraction, and and are associated with stabilised hydrogen abstraction that proceeds via a hydrogen-bound pre-reaction complex and TS. See Fig. 1 for description of reaction channels proceeding to Reaction (R1a) and (R1b) products.
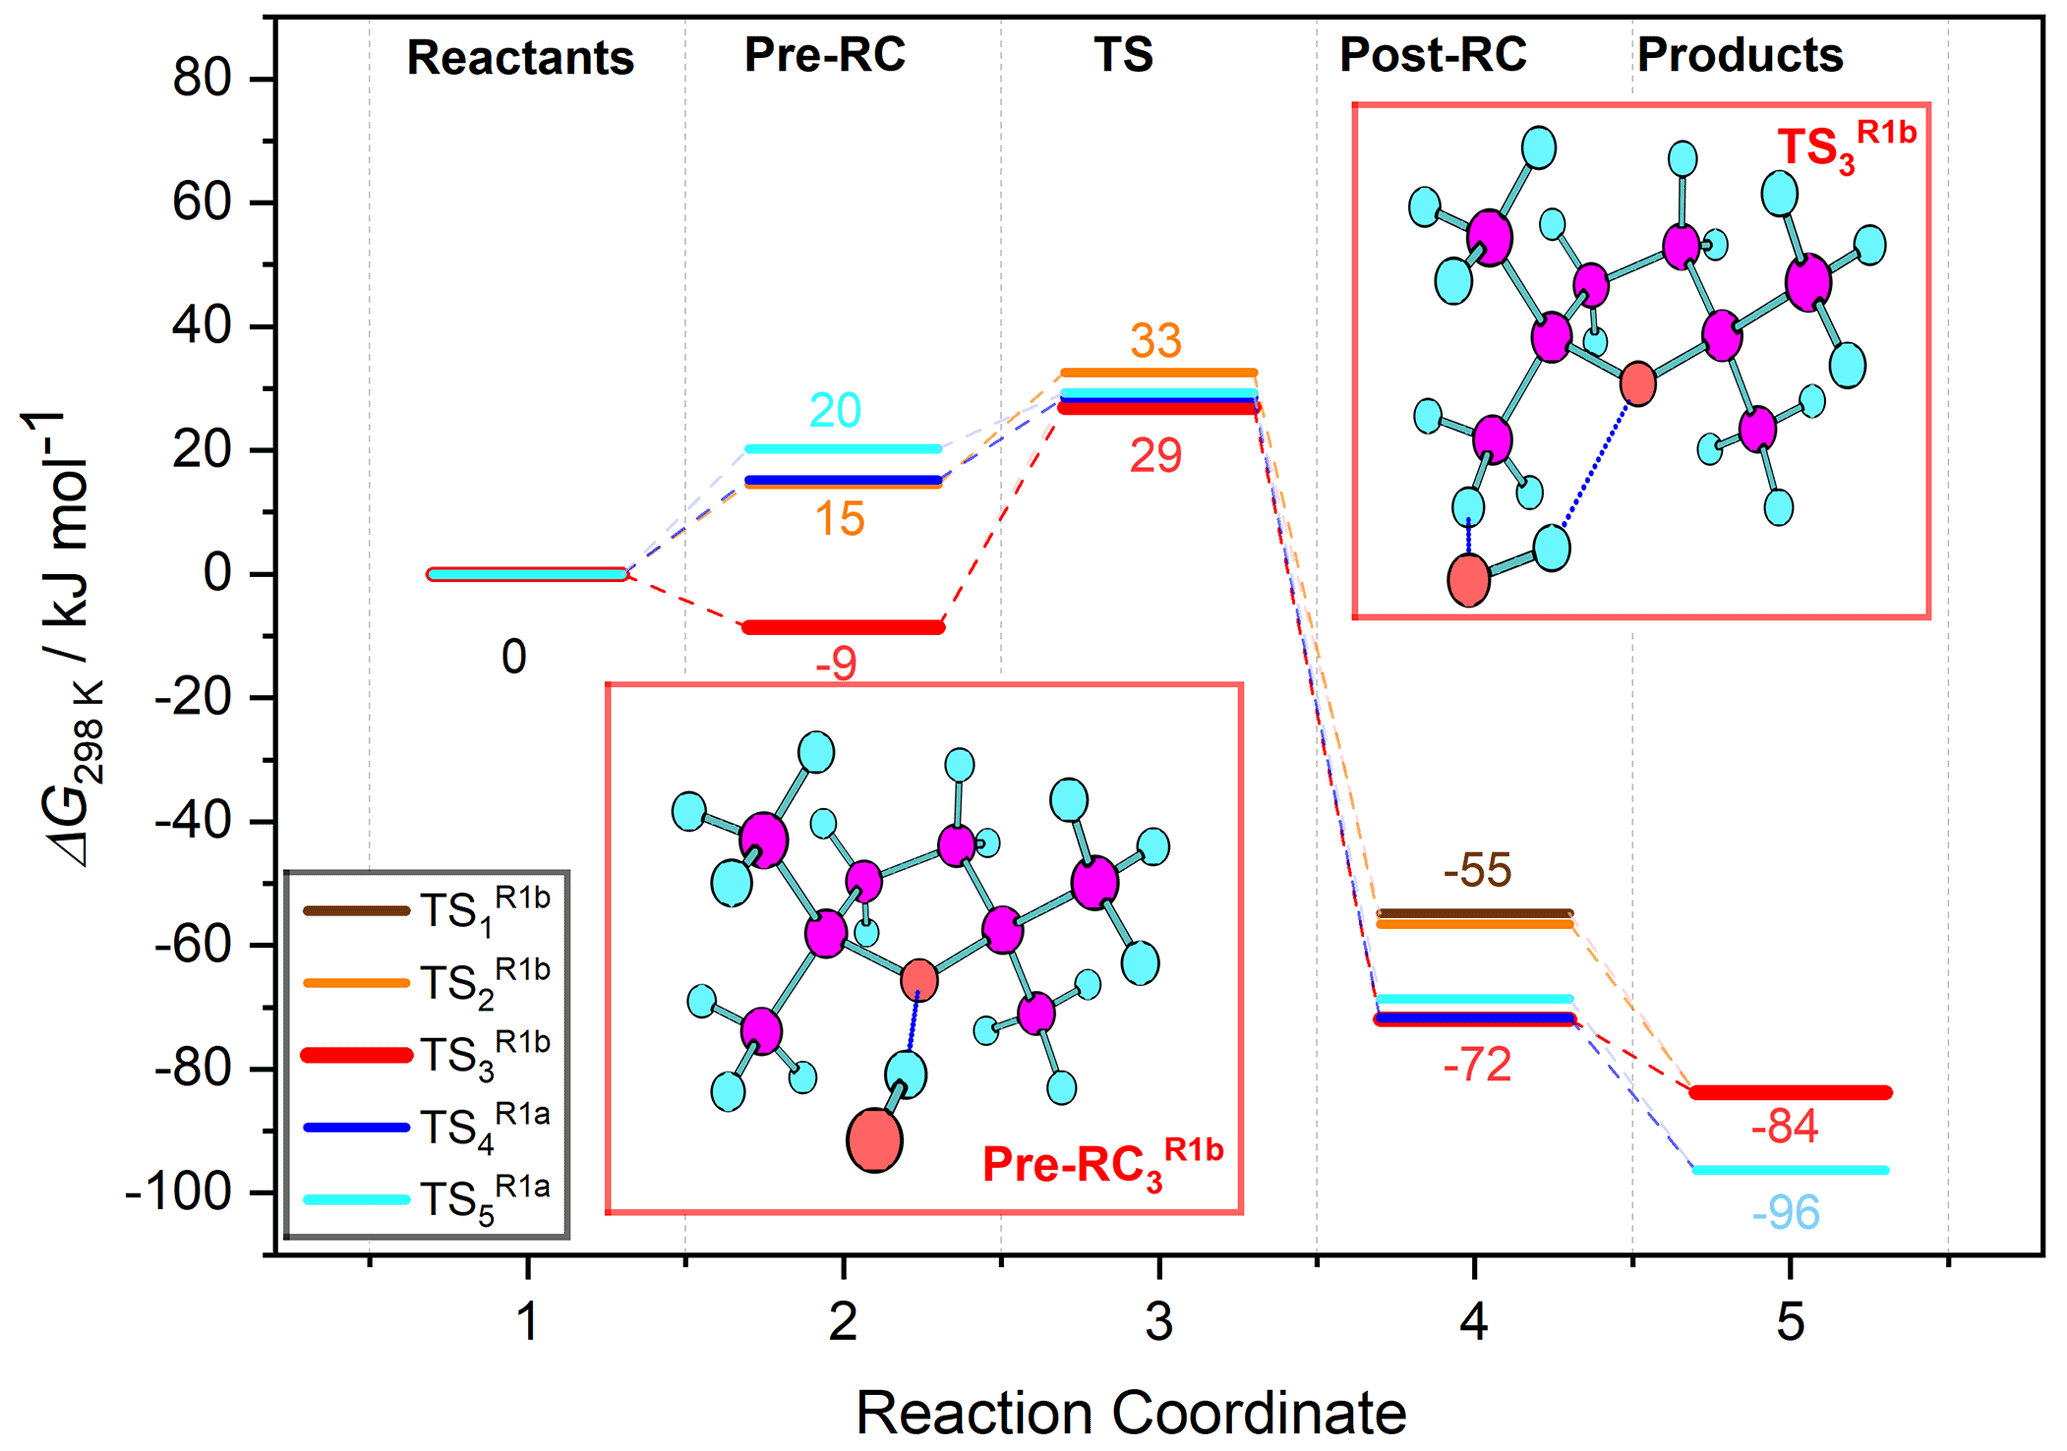
Figure 10Free-energy profile of Reaction (R1) hydrogen abstraction pathways: two leading to Reaction (R1a) products via () and three () leading to Reaction (R1b) products, labelled according to the associated transition state in the legend. For each of the five pathways along the reaction coordinate, five stationary point energies (1 – separated reactants, 2 – pre-reaction complex, 3 – transition state, 4 – post-reaction complex, and 5 – separated products) were calculated using the G4 model chemistry. Several were degenerate or near-degenerate, notably the pre-reaction complexes leading to TS1 and TS3 (see Table 5 for details).
3.3 Quantum chemical calculations on Reaction (R1)
QCCs were carried out at the CBS-QB3 (Montgomery et al., 1999) and G4 (Curtiss et al., 2007) model chemical levels of theory (Sect. 2.3) to investigate the small k1(296 K) and complex k1(T) determined in laboratory studies, explore the hydrogen abstraction pathways (Reactions R1a and R1b) set out in Fig. 1, and thus enable prediction of product yields.
Acknowledging the C2 symmetry of TMO and assuming pseudo-equivalence of the (strictly non-symmetric) methyl substituents, it was possible to characterise a total of five reaction channels. Three were associated with generation of Reaction (R1b) products, corresponding to abstraction of each of the three unique hydrogen atoms at the β position on a methyl (–CH3) substituent; two were associated with Reaction (R1a), corresponding to abstraction of each of the two unique hydrogen atoms of the β methylene (–CH2–) on the aliphatic ring. For each reaction channel, transition states (TS) for hydrogen abstraction were located and characterised ( and depicted in Fig. 9), together with corresponding pre- (OH + TMO) and post- [H2O + TMO(−H)] reaction complexes. Cartesian coordinates for all key geometries are given in Tables S1–S20 (CBS-QB3) and Tables S21–S40 (G4), vibrational frequencies are given in Tables S41–S60 (CBS-QB3) and Tables S61–S80 (G4), rotational constants are given in Tables S81–S100 (CBS-QB3) and Tables S101–S120 (G4), and electronic and free energies at the CBS-QB3 and G4 levels of theory are summarised in Tables S41 and S42, respectively. The energy profiles of the reaction channels are presented in Fig. 10, while a summary of the relative free energies (), mass-weighted distances (MWDs) quantifying the separation in Cartesian space between the TS and pre-reaction complexes, and key structural parameters (rO–H, rO⋯H, and aH–O⋯H) are tabulated for each of the TS in Table 5.
The energetic barrier along the reaction coordinate was similar for hydrogen abstraction pathways (Reactions R1a and R1b); a tight spread of values [31.0→38.3 kJ mol−1 (CBS-QB3); 26.9→32.6 kJ mol−1 (G4)] was calculated by comparison with the spread of ΔG298 K values for either the pre- ( kJ mol−1 (CBS-QB3); kJ mol−1 (G4)) or post-reaction ( kJ mol−1 (CBS-QB3); kJ mol−1 (G4)) complexes. These QCCs indicate a weak preference for hydrogen abstraction proceeding via stabilised, hydrogen-bonded pre-complexes and TS ( and ) over “direct” hydrogen abstraction (, , and ) at the CBS-QB3 level of theory (ca. 4–5 kJ mol−1) that is less pronounced at the G4 level of theory (ca. 1–2 kJ mol−1). Thus, no clear indication of the dominant reaction channel under kinetic control was obtained from inspection of alone. However, is likely not decisive for the outcome of the reaction of OH + TMO; the free-energy surface topography along the reaction coordinate associated with the approach of OH and onwards to pre-complex formation is likely to influence the outcome to a large extent. The loosely bound pre-reaction complexes associated with , , and are located in a less-accessible, higher-energy part of the free-energy surface (ca. 25–30 kJ mol−1 (CBS-QB3), ca. 15–20 kJ mol−1 (G4)), while the hydrogen-bound pre-reaction complex through which the reaction channel bifurcates towards and is submerged (ca. −1.0 kJ mol−1 (CBS-QB3), ca. −8.5 kJ mol−1 (G4)) relative to reactants. The intimation is that the hydrogen-bound pre-reaction complex acts as a funnel on the free-energy surface to bias the reaction towards preferential production of the kinetic (via Reaction R1b), rather than the thermodynamic (via Reaction R1a), radical products (Fig. 1) at lower temperatures. As the temperature is increased, the influence of the hydrogen-bound pre-reaction complex is commensurately reduced, and the reaction is controlled increasingly by ΔG‡. The QCCs predict that control passes over to ΔG‡ at ca. 350–400 K (at which point the hydrogen-bound pre-reaction complex is no longer stabilised relative to the reactants), consistent with the temperature at which k(T) is observed to increase in our experimental data.
Table 5Summary of relative TS free energies ()a, MWDs (d)b between TS and pre-reaction complexes, and key structural parameters (rO–Hc, rO⋯Hd, and aH–O⋯H) for and at the CBS-QB3 and G4 levels of theory.
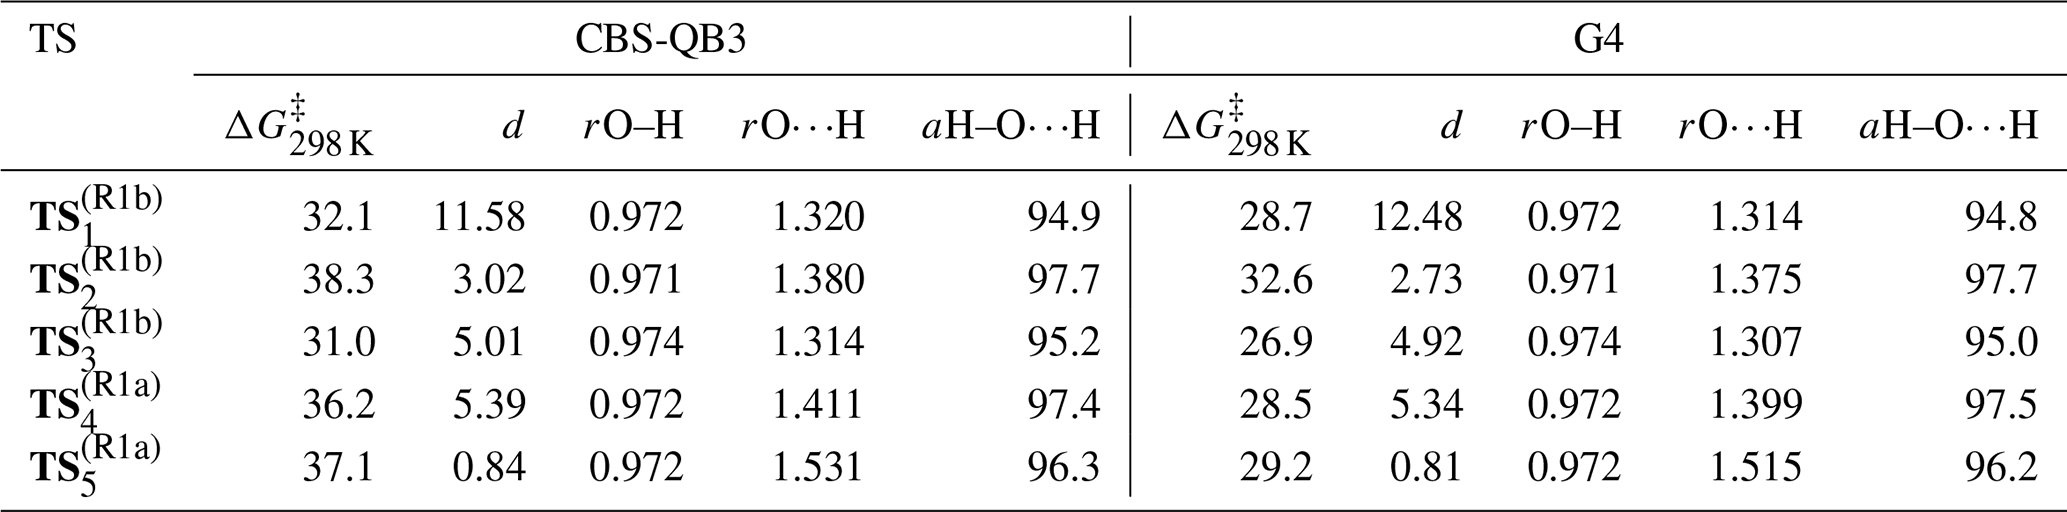
a Tabulated in kJ mol−1 at p=750 Torr (air) and T=298 K relative to the reactants (OH + TMO) at infinite separation. b Tabulated in Å Da. c The O–H internuclear distance in the OH fragment, tabulated in Å. d The O⋯H internuclear distance between the OH and TMO fragments, tabulated in Å.
The formation of hydrogen-bound pre-reaction complexes and TS in the Reaction (R1a) channels is precluded by strong steric interactions with methyl substituents on TMO (cf. hydrogen abstraction from the β position on the aliphatic ring in the unsubstituted analogue, oxolane (tetrahydrofuran), where a hydrogen-bound pre-reaction complex and TS is able to lower effectively the energetic barrier to the Reaction R1a equivalent products), and, although their formation is possible in the Reaction (R1b) channels, the conferred stabilisation is somewhat offset by a combination of (i) weak steric interactions with, and (ii) charge screening by, the methyl substituents.
3.4 Discussion
The lab results from this work of k1(296±2 K) cm3 molecule−1 s−1 (from direct, absolute PLP–LIF) and k1(296 K) cm3 molecule−1 s−1 (relative rate) were in good agreement with one another, especially when considering systematic uncertainties. That these kinetic methods are based upon different critical assumptions (absolute knowledge of [TMO] for PLP–LIF, reference rate coefficients for relative rate) and have complementary strengths and weaknesses lends considerable confidence to these results. Nonetheless, taking into account systematic uncertainties inherent in these experiments (in [TMO] for the PLP–LIF studies; the sizable uncertainties in reference rate coefficients in the relative rate study) we consider it appropriate to quote a more conservative overall k1(296 K) cm3 molecule−1 s−1 from this work. We therefore conclude that, at ambient temperature, OH reacts with TMO considerably more slowly than with other oxolanes, e.g. oxolane (tetrahydrofuran) cm3 molecule−1 s−1 (Moriarty et al., 2003); 2-methyloxolane, cm3 molecule−1 s−1 (Illes et al., 2016); and 2,5-dimethyloxolane for which only data for the reaction with isotopically labelled OD are available and where cm3 molecule−1 s−1 (Andersen et al., 2016). That the measured ambient-temperature k1 values determined in this work were indeed anomalously small is further confirmed by calculations using the most up-to-date structure–activity relationship (SAR) from Jenkin et al. (2018), which may be used to predict k1(298 K) cm3 molecule−1 s−1 and identifies in Reaction (R1a) the preferred H-abstraction route with a branching ratio of 80 %. Even within the estimated factor-of-2 accuracy of the SAR, the values of k1 obtained from this work would appear anomalously small.
Results from the series of QCCs detailed in Sect. 3.3 above offer a potential explanation for the small k1(296 K) values obtained in this work. As is common for reactions of oxygenated VOC, hydrogen-bonded pre-reaction complexes (Fig. 9) were key features of the most facile pathways to Reaction (R1) products (Fig. 10). However, the bulky methyl group substituents of TMO were found to hinder formation of the hydrogen-bonded complexes that would lead to abstraction from the more reactive CH2 groups. Three reaction pathways remain open (Fig. 10), the most favourable proceeding via a H-bonded complex leading to abstraction from the CH3 group, the other two being direct non-stabilised (no H bonds) abstractions. The summative nature of the SAR has allowed for a simple modification to the calculations, whereby we have turned off the Reaction (R1a) channel (Fig. 1) identified by QCCs as sterically hindered (Sect. 3.3) and replaced this with abstraction from the equivalent CH2 group in an unsubstituted aliphatic C5 ring. This modified calculation allows us to use the SAR (Jenkin et al., 2018) to estimate a considerably smaller total k1(298 K) cm3 molecule−1 s−1 for the remaining active channels: complexing followed by abstraction from the terminal CH3 groups (Reaction R1b) and direct abstraction (no complexing) from the cyclic CH2 groups. This modified SAR result is now within satisfactory agreement with the experimentally determined value, given the estimated factor-of-2 accuracy of the SAR.
Some further evidence for the likely participation of hydrogen-bonded complexes was provided by the results obtained with PLP–LIF for k1 over the range of temperatures 294–502 K (Fig. 6). Whilst the Arrhenius-like behaviour for k1(400–500 K) is consistent with a simple direct abstraction mechanism, the U-shaped curve with a minimum at around 340 K is suggestive of an increasingly important role of hydrogen-bonded pre-reaction complexes at lower temperatures. Experimental constraints meant that it was not possible to confirm these observations via the relative rate method, except at ambient temperature. However, confidence in the high-temperature PLP–LIF results may be derived from the good agreement between k11(T) obtained in this work (often “back-to-back” with k1(T) determinations) and an extensive literature dataset (Fig. 6). U-shaped Arrhenius plots have been observed for OH reactions with oxygenated VOC, notably acetone (Wollenhaupt et al., 2000) and methyl pivalate (Wallington et al., 2001). In more recent work, experiments at low temperatures have revealed a dramatic increase in the rate of OH + CH3OH (Reaction R16), with k16(63 K) determined to be almost 2 orders of magnitude larger than k16(200 K) (Shannon et al., 2013).
IUPAC has used a modified four-parameter Arrhenius-like expression, Eq. (4), to represent k(T) data for OH + acetone (Atkinson et al., 2006).
Accordingly, the results from this work were fit with Eq. (4) to yield k1(294–502 K) . Also displayed in Fig. 6 are k1(294–370 K) from the full SAR (Jenkin et al., 2018), exhibiting clear non-Arrhenius behaviour as these calculated values are dominated by the pathway-forming complexes prior to abstraction at the reactive CH2 groups. These calculated values clearly overestimate k1(294–370 K). When the modification was applied whereby this pathway was removed (see above), the modified SAR k1(294–370 K), whilst not capturing the full complexity of k1(T), is now comfortably in agreement (within the SAR estimated accuracy of a factor of 2) with our experimental determinations (Fig. 6). The branching ratio calculated with the modified SAR is now 52 % for Reaction (R1a) and 48 % for Reaction (R1b), a value that is more in line with the QCC predictions compared to the original ratio of 80 % for Reaction (R1a) and 20 % for Reaction (R1b).
Taken together, results from this work would indicate that, for atmospheric modelling purposes, OH + TMO proceeds largely via abstraction from the terminal CH3 groups (Reaction R1b) to generate the aldehyde product (Fig. 1). The best estimate available for an atmospheric removal rate coefficient is the room temperature value determined here of k1(296 K) cm3 molecule−1 s−1. We note that k1 does appear to be increasing at lower temperatures and that this value of k1(296 K) may be an underestimate for cold conditions, e.g. the upper troposphere. Further k1 and k2 experiments at T<296 K would be valuable but were not possible given the apparatus available in York and in Iasi.
An atmospheric lifetime (τ) for TMO may be estimated using Eq. (5), based upon k1(296 K) cm3 molecule−1 s−1 from this work and a value of [OH] molecule cm−3 representative of the troposphere (Lelieveld et al., 2016).
The resultant τ1≈3 d may be an overestimate for two reasons. First, as noted in Sect. 3.4, our ambient-temperature value may underestimate k1 for colder troposphere conditions. Second, in regions highly impacted by atmospheric chlorine, the lifetime of TMO may be constrained by Reaction (R2) with chlorine atoms. Estimates for ambient [Cl] vary widely and will anyway be subject to a high degree of spatial variability. Nonetheless, using k2(296±2 K) cm3 molecule−1 s−1 from this work, and a large estimate of [Cl] molecule cm−3 (Li et al., 2018), we can demonstrate the feasibility of a lifetime with respect to Cl atoms of τ2≈10 d, which, when combined with data for Reaction (R1), could reduce the overall atmospheric lifetime for TMO. Losses of TMO to other atmospheric radicals, to O3, or to photolysis appear unlikely and, to date, unmeasured.
A lifetime calculation for C6H5CH3, using (Eq. 5) with k3(298 K) cm3 molecule−1 s−1 (Mellouki et al., 2021) and [OH] molecule cm−3 yields τ3≈2 d. It is clear, therefore, that TMO has a longer lifetime than the solvent it is proposed to replace. A superficial assessment would indicate that, once emitted, TMO would have more time to disperse, leading to a less spatially concentrated build-up of harmful products such as O3, HCHO, and other aldehydes.
To quantify the potential secondary O3 production deriving from TMO use, POCP (photochemical ozone creation potential) was calculated using the estimated POCP (POCPE) scale formulated by Jenkin et al. (2017). This indicator gives a measure of the ability of VOCs to generate extra O3 emissions relative to that of ethene (CH2=CH2), calculated from the chemical structure of the VOC molecule and the rate coefficient for its reaction with OH.
The POCPE for TMO in the atmospheric conditions of north-western Europe and urban USA was estimated to be respectively 17.6 and 7.0. These estimates are considerably smaller than the corresponding values for toluene (45.2 for NW Europe, 37.6 for urban USA). According to Saunders et al. (1997), toluene, together with ethene, n-butane, and xylene, accounts for more than 33 % of POCP for European emissions. This smaller POCPE for TMO indicates that replacement of toluene by TMO could lead to improved air quality.
In conclusion, the application of two distinctive experimental approaches together with QCCs to the question of the atmospheric fate of TMO has yielded the interesting result that TMO reacts with OH (Reaction R1) more slowly than predicted, with the consequence being that TMO has a longer atmospheric lifetime and a smaller POCPE than C6H5CH3, the solvent it is proposed to replace. Further, the products from Reaction (R1) are not the thermodynamic and kinetic (SAR) predicted products resulting from abstraction from the methylene (CH–H) group (Reaction R1a) but are more likely those resulting from abstraction from the terminal methyl (CH2–H) groups (Reaction R1b). This work has illustrated once again the importance of hydrogen-bonded pre-reaction complexes for OH + oxygenated VOC reactions and the need for combined lab and computational studies to properly understand such reaction mechanisms.
Data used in the writing of this article are available from the National Institute of Standards and Technology at https://webbook.nist.gov/chemistry/ (last access: March 2021). The datasets of the reference list checked for suitability as reference compounds in the relative rate method are available upon request to the corresponding author.
The supplement related to this article is available online at: https://doi.org/10.5194/acp-22-14589-2022-supplement.
Laser-based experiments were designed by TJD and conducted by JVS, CM, AH, and TJD. Chamber experiments were designed by IGB, CA, and RIO and conducted by CM, CR, and IGB. Quantum chemical calculations were carried out by JVS and CDR. The manuscript was written by CM, JVS, CDR, and TJD with assistance from other authors. TJD, FB, and CRM conceived of the overall project.
The contact author has declared that none of the authors has any competing interests.
Publisher's note: Copernicus Publications remains neutral with regard to jurisdictional claims in published maps and institutional affiliations.
The authors thank the York support team, in particular Danny Shaw, Abby Mortimer, Mark Roper, Stuart Murray, and Chris Rhodes, for their constant excellent technical support. Luc Vereecken and Andrew Rickard are thanked for helpful discussions regarding the reactivity of TMO. Finally, the authors thank Katherine Manfred for the precious help with PLP-LIF and LabVIEW and the two referees for their insightful comments.
This work has received funding from the European Union’s Horizon 2020 Research and Innovation programme through the EUROCHAMP-2020 Infrastructure Activity (grant no. 730997) and the UK Engineering and Physical Sciences Research Council (grant no. EP/M508196/1). Claudiu Roman, Cecilia Arsene, Romeo I. Olariu, and Iustinian G. Bejan acknowledge support from the PN-III-P4-PCE2021-0673 60 UEFISCDI project. Juliette V. Schleicher acknowledges support from the EU ERASMUS programme. Caterina Mapelli and Fiona C. Whiting thank the Department of Chemistry at York for their PhD scholarships.
This paper was edited by Andreas Hofzumahaus and reviewed by two anonymous referees.
Andersen, C., Nielsen, O. J., Østerstrøm, F. F., Ausmeel, S., Nilsson, E. J. K., and Sulbaek Andersen, M. P.: Atmospheric Chemistry of Tetrahydrofuran, 2-Methyltetrahydrofuran, and 2,5-Dimethyltetrahydrofuran: Kinetics of Reactions with Chlorine Atoms, OD Radicals, and Ozone, J. Phys. Chem. A, 120, 7320–7326, https://doi.org/10.1021/acs.jpca.6b06618, 2016.
Anderson, R. S., Huang, L., Iannone, R., and Rudolph, J.: Measurements of the 12C/13C kinetic isotope effects in the gas-phase reactions of light alkanes with chlorine atoms, J. Phys. Chem. A, 111, 495–504, https://doi.org/10.1021/jp064634p, 2007.
Ariya, P. A., Niki, H., Harris, G. W., Anlauf, K. G., and Worthy, D. E. J.: Polar sunrise experiment 1995: hydrocarbon measurements and tropospheric Cl and Br-atoms chemistry, Atmos. Environ., 33, 931–938, https://doi.org/10.1016/S1352-2310(98)00254-4, 1999.
Atkinson, R.: Kinetics and mechanisms of the gas-phase reactions of the hydroxyl radical with organic compounds under atmospheric conditions, Chem. Rev., 86, 69–201, https://doi.org/10.1021/cr00071a004, 1986.
Atkinson, R. and Arey, J.: Atmospheric Degradation of Volatile Organic Compounds, Chem. Rev., 103, 4605–4638, https://doi.org/10.1021/cr0206420, 2003.
Atkinson, R. and Aschmann, S. M.: Kinetics of the Gas Phase Reaction of Cl Atoms with a Series of Organics at 296 & 2 K and Atmospheric Pressure, Int. J. Chem. Kinet., 17, 33–41, https://doi.org/10.1002/kin.550170105, 1985.
Atkinson, R., Baulch, D. L., Cox, R. A., Crowley, J. N., Hampson, R. F., Hynes, R. G., Jenkin, M. E., Rossi, M. J., Troe, J., and IUPAC Subcommittee: Evaluated kinetic and photochemical data for atmospheric chemistry: Volume II – gas phase reactions of organic species, Atmos. Chem. Phys., 6, 3625–4055, https://doi.org/10.5194/acp-6-3625-2006, 2006.
Becke, A. D.: Density functional thermochemistry. 3. The role of exact exchange, J. Chem. Phys., 98, 5648–5652, https://doi.org/10.1063/1.464913, 1993.
Bloss, C., Wagner, V., Jenkin, M. E., Volkamer, R., Bloss, W. J., Lee, J. D., Heard, D. E., Wirtz, K., Martin-Reviejo, M., Rea, G., Wenger, J. C., and Pilling, M. J.: Development of a detailed chemical mechanism (MCMv3.1) for the atmospheric oxidation of aromatic hydrocarbons, Atmos. Chem. Phys., 5, 641–664, https://doi.org/10.5194/acp-5-641-2005, 2005.
Byrne, F., Forier, B., Bossaert, G., Hoebers, C., Farmer, T. J., Clark, J. H., and Hunt, A. J.: 2,2,5,5-Tetramethyltetrahydrofuran (TMTHF): a non-polar, non-peroxide forming ether replacement for hazardous hydrocarbon solvents, Green Chem., 19, 3671–3678, https://doi.org/10.1039/C7GC01392B, 2017.
Ceacero-Vega, A. A., Ballesteros, B., Albaladejo, J., Bejan, I., and Barnes, I.: Temperature dependence of the gas-phase reactions of Cl atoms with propene and 1-butene between K, Chem. Phys. Lett., 484, 10–13, https://doi.org/10.1016/j.cplett.2009.10.080, 2009.
Christianson, M. G., Doner, A. C., Koritzke, A. L., Frandsen, K., and Rotavera, B.: Vacuum-ultraviolet absorption cross-sections of functionalized cyclic hydrocarbons: Five-membered rings, J. Quant. Spectrosc. Ra., 258, 107274, https://doi.org/10.1016/j.jqsrt.2020.107274, 2021.
Curtiss, L. A., Redfern, P. C., and Raghavachari, K.: Gaussian-4 theory, J. Chem. Phys., 126, 124105, https://doi.org/10.1063/1.2436888, 2007.
DeMore, W. B. and Bayes, K. D.: Rate Constants for the Reactions of Hydroxyl Radical with Several Alkanes, Cycloalkanes, and Dimethyl Ether, J. Phys. Chem. A, 103, 2649–2654, https://doi.org/10.1021/jp983273d, 1999.
Dillon, T. J., Holscher, D., and Sivakumaran, V.: Kinetics of the reactions of HO with methanol (210–351 K) and with ethanol (216–368 K), Phys. Chem. Chem. Phys., 7, 349–355, https://doi.org/10.1039/b413961e, 2005.
ECHA: Toluene – Substance Information, https://echa.europa.eu/substance-information/-/substanceinfo/100.003.297, last access: May 2022.
EEA: Air quality in Europe – 2020 report9/2020, https://doi.org/10.2800/786656, 2020.
Frisch, M. J., Trucks, G. W., Schlegel, H. B., Scuseria, G. E., Robb, M. A., Cheeseman, J. R., Scalmani, G., Barone, V., Petersson, G. A., Nakatsuji, H., Li, X., Caricato, M., Marenich, A. V., Bloino, J., Janesko, B. G., Gomperts, R., Mennucci, B., Hratchian, H. P., Ortiz, J. V., Izmaylov, A. F., Sonnenberg, J. L., Williams, Ding, F., Lipparini, F., Egidi, F., Goings, J., Peng, B., Petrone, A., Henderson, T., Ranasinghe, D., Zakrzewski, V. G., Gao, J., Rega, N., Zheng, G., Liang, W., Hada, M., Ehara, M., Toyota, K., Fukuda, R., Hasegawa, J., Ishida, M., Nakajima, T., Honda, Y., Kitao, O., Nakai, H., Vreven, T., Throssell, K., Montgomery Jr., J. A., Peralta, J. E., Ogliaro, F., Bearpark, M. J., Heyd, J. J., Brothers, E. N., Kudin, K. N., Staroverov, V. N., Keith, T. A., Kobayashi, R., Normand, J., Raghavachari, K., Rendell, A. P., Burant, J. C., Iyengar, S. S., Tomasi, J., Cossi, M., Millam, J. M., Klene, M., Adamo, C., Cammi, R., Ochterski, J. W., Martin, R. L., Morokuma, K., Farkas, O., Foresman, J. B., and Fox, D. J.: Gaussian 09 Rev. D.01, Gaussian Inc., Wallingford CT, 2009 [code], https://www.gaussian.com (last access: June 2022), 2016.
Giri, B. R. and Roscoe, J. M.: Kinetics of the reactions of Cl atoms with several ethers, J. Phys. Chem. A, 114, 8369–8375, https://doi.org/10.1021/jp1037409, 2010.
Hansen, D. A., Atkinson, R., and Pitts, J. N.: Rate constants for reaction of OH radicals with a series of aromatic hydrocarbons, J. Phys. Chem., 79, 1763–1766, https://doi.org/10.1021/j100584a004, 1975.
Hess, W. P. and Tully, F. P.: Hydrogen-Atom Abstraction from Methanol by OH, J. Am. Chem. Soc., 93, 1944–1947, 1989.
Illes, A., Farkas, M., Zugner, G. L., Novodarszki, G., Mihalyi, M., and Dobe, S.: Direct and relative rate coefficients for the gas-phase reaction of OH radicals with 2-methyltetrahydrofuran at room temperature, React. Kinet. Mech. Catal., 119, 5–18, https://doi.org/10.1007/s11144-016-1037-2, 2016.
Jenkin, M. E., Saunders, S. M., and Pilling, M. J.: The tropospheric degradation of volatile organic compounds: A protocol for mechanism development, Atmos. Environ., 31, 81–104, https://doi.org/10.1016/s1352-2310(96)00105-7, 1997.
Jenkin, M. E., Derwent, R. G., and Wallington, T. J.: Photochemical ozone creation potentials for volatile organic compounds: Rationalization and estimation, Atmos. Environ., 163, 128–137, https://doi.org/10.1016/j.atmosenv.2017.05.024, 2017.
Jenkin, M. E., Valorso, R., Aumont, B., Rickard, A. R., and Wallington, T. J.: Estimation of rate coefficients and branching ratios for gas-phase reactions of OH with aliphatic organic compounds for use in automated mechanism construction, Atmos. Chem. Phys., 18, 9297–9328, https://doi.org/10.5194/acp-18-9297-2018, 2018.
Jiménez, E., Gilles, M. K., and Ravishankara, A. R.: Kinetics of the reactions of the hydroxyl radical with CH3OH and C2H5OH between 235 and 360 K, J. Photochem. Photobiol. A Chem., 157, 237–245, https://doi.org/10.1016/S1010-6030(03)00073-X, 2003.
Jimenez-Gonzalez, C., Ponder, C. S., Broxterman, Q. B., and Manley, J. B.: Using the Right Green Yardstick: Why Process Mass Intensity Is Used in the Pharmaceutical Industry To Drive More Sustainable Processes, Org. Process Res. Dev., 15, 912–917, https://doi.org/10.1021/op200097d, 2011.
Lee, C. T., Yang, W. T., and Parr, R. G.: Development of the Colle-Salvetti correlation-energy formula into a functional of the electron-density, Phys. Rev. B, 37, 785–789, https://doi.org/10.1103/PhysRevB.37.785, 1988.
Lelieveld, J., Gromov, S., Pozzer, A., and Taraborrelli, D.: Global tropospheric hydroxyl distribution, budget and reactivity, Atmos. Chem. Phys., 16, 12477–12493, https://doi.org/10.5194/acp-16-12477-2016, 2016.
Lelieveld, J., Klingmuller, K., Pozzer, A., Poschl, U., Fnais, M., Daiber, A., and Munzel, T.: Cardiovascular disease burden from ambient air pollution in Europe reassessed using novel hazard ratio functions, Eur. Heart J., 40, 1590–1596, https://doi.org/10.1093/eurheartj/ehz135, 2019.
Li, M. Z., Karu, E., Brenninkmeijer, C., Fischer, H., Lelieveld, J., and Williams, J.: Tropospheric OH and stratospheric OH and Cl concentrations determined from CH4, CH3Cl, and SF6 measurements, NPJ Clim. Atmos., 1, 29, https://doi.org/10.1038/s41612-018-0041-9, 2018.
Mellouki, A., Ammann, M., Cox, R. A., Crowley, J. N., Herrmann, H., Jenkin, M. E., McNeill, V. F., Troe, J., and Wallington, T. J.: Evaluated kinetic and photochemical data for atmospheric chemistry: volume VIII – gas-phase reactions of organic species with four, or more, carbon atoms (≥ C4), Atmos. Chem. Phys., 21, 4797–4808, https://doi.org/10.5194/acp-21-4797-2021, 2021.
Montgomery, J. A., Frisch, M. J., Ochterski, J. W., and Petersson, G. A.: A complete basis set model chemistry. VI. Use of density functional geometries and frequencies, J. Chem. Phys., 110, 2822–2827, https://doi.org/10.1063/1.477924, 1999.
Moriarty, J., Sidebottom, H., Wenger, J., Mellouki, A., and Le Bras, G.: Kinetic Studies on the Reactions of Hydroxyl Radicals with Cyclic Ethers and Aliphatic Diethers, J. Phys. Chem. A, 107, 1499–1505, https://doi.org/10.1021/jp021267i, 2003.
Roman, C., Arsene, C., Bejan, I. G., and Olariu, R. I.: Investigations into the gas-phase photolysis and OH radical kinetics of nitrocatechols: implications of intramolecular interactions on their atmospheric behaviour, Atmos. Chem. Phys., 22, 2203–2219, https://doi.org/10.5194/acp-22-2203-2022, 2022.
Saunders, S. M., Jenkin, M. E., Derwent, R. G., and Pilling, M. J.: World wide web site of a master chemical mechanism (MCM) for use in tropospheric chemistry models, Atmos. Environ., 31, 1249, https://doi.org/10.1016/S1352-2310(97)85197-7, 1997.
Saunders, S. M., Jenkin, M. E., Derwent, R. G., and Pilling, M. J.: Protocol for the development of the Master Chemical Mechanism, MCM v3 (Part A): tropospheric degradation of non-aromatic volatile organic compounds, Atmos. Chem. Phys., 3, 161–180, https://doi.org/10.5194/acp-3-161-2003, 2003.
Shannon, R. J., Blitz, M. A., Goddard, A., and Heard, D. E.: Accelerated chemistry in the reaction between the hydroxyl radical and methanol at interstellar temperatures facilitated by tunnelling, Nat. Chem., 5, 745–749, https://doi.org/10.1038/nchem.1692, 2013.
Taylor, W. D., Allston, T. D., Moscato, M. J., Fazekas, G. B., Kozlowski, R., and Takacs, G. A.: Atmospheric photo-dissociation lifetimes for nitromethane, methyl nitrite and methyl nitrate, Int. J. Chem. Kinet., 12, 231–240, https://doi.org/10.1002/kin.550120404, 1980.
Thornton, J. A., Kercher, J. P., Riedel, T. P., Wagner, N. L., Cozic, J., Holloway, J. S., Dube, W. P., Wolfe, G. M., Quinn, P. K., Middlebrook, A. M., Alexander, B., and Brown, S. S.: A large atomic chlorine source inferred from mid-continental reactive nitrogen chemistry, Nature, 464, 271–274, https://doi.org/10.1038/nature08905, 2010.
Wallington, T. J., Dagaut, P., Liu, R., and Kurylo, M. J.: Rate constants for the gas phase reactions of OH with C5 through C7 aliphatic alcohols and ethers: Predicted and experimental values, Int. J. Chem. Kinet., 20, 541–547, https://doi.org/10.1002/kin.550200704, 1988.
Wallington, T. J., Ninomiya, Y., Mashino, M., Kawasaki, M., Orkin, V. L., Huie, R. E., and Kurylo, M. J.: Atmospheric oxidation mechanism of methyl pivalate, (CH3)(3)CC(O)OCH3, J. Phys. Chem. A, 105, 7225–7235, https://doi.org/10.1021/jp010308s, 2001.
Wollenhaupt, M., Carl, S. A., Horowitz, A., and Crowley, J. N.: Rate Coefficients for Reaction of OH with Acetone between 202 and 395 K, J. Phys. Chem. A, 104, 2695–2705, https://doi.org/10.1021/jp993738f, 2000.