the Creative Commons Attribution 4.0 License.
the Creative Commons Attribution 4.0 License.
 | 14 Jul 2023
Atmospheric oxidation of new “green” solvents – Part 2: methyl pivalate and pinacolone
Caterina Mapelli
James K. Donnelly
Úna E. Hogan
Andrew R. Rickard
Abbie T. Robinson
Fergal Byrne
Con Rob McElroy
Basile F. E. Curchod
Daniel Hollas
Lab-based experimental and computational methods were used to study the atmospheric degradation of two promising “green” solvents: pinacolone, (CH3)3CC(O)CH3, and methyl pivalate, (CH3)3CC(O)OCH3. Pulsed laser photolysis coupled to pulsed laser-induced fluorescence was used to determine absolute rate coefficients (in 10−12 cm3 molec.−1 s−1) of k1(297 K) = (1.2 ± 0.2) for OH + (CH3)3CC(O)CH3 (Reaction R1) and k2(297 K) = (1.3 ± 0.2) for OH + (CH3)3CC(O)OCH3 (Reaction R2), in good agreement with one previous experimental study. Rate coefficients for both reactions were found to increase at elevated temperature, with k1(T) adequately described by k1(297–485 K) = 2.1 × 10⁻¹² exp( cm3 molec.−1 s−1. k2(T) exhibited more complex behaviour, with a local minimum at around 300 K. In the course of this work, k3(295–450 K) was obtained for the well-characterised reaction OH + C2H5OH (ethanol; Reaction R3), in satisfactory agreement with the evaluated literature.
UV–Vis spectroscopy experiments and computational calculations were used to explore cross-sections for (CH3)3CC(O)CH3 photolysis (Reaction R4), while (CH3)3CC(O)OCH3 showed no sign of absorption over the wavelengths of interest. Absorption cross-sections for (CH3)3CC(O)CH3, σ4(λ), in the actinic region were larger, and the maximum was red-shifted compared to estimates (methyl ethyl ketone (MEK) values) used in current state-of-science models. As a consequence, we note that photolysis (Reaction R4) is likely the dominant pathway for removal of (CH3)3CC(O)CH3 from the troposphere. Nonetheless, large uncertainties remain as quantum yields φ4(λ) remain unmeasured. Lifetime estimates based upon Reactions (R1) and (R4) span the range 2–9 d and are consequently associated with a poorly constrained estimated photochemical ozone creation potential (POCPE). In accord with previous studies, (CH3)3CC(O)OCH3 did not absorb in the actinic region, allowing for straightforward calculation of an atmospheric lifetime of ≈ 9 d and a small POCPE ≈ 11.
- Article
(3549 KB) - Full-text XML
- Companion paper
-
Supplement
(1071 KB) - BibTeX
- EndNote


Solvents are of fundamental importance to the chemical industry; however many common solvents are sourced from the petrochemical industry and are classed as hazardous pollutants. Their usage should be phased out as we move towards a net-zero carbon economy (Clarke et al., 2018; Byrne et al., 2016; Winterton, 2021). Solvents were the dominant source of volatile organic compound (VOC) emissions in England in 2019 (Jones et al., 2021) and so can have a potentially important impact on air quality. A solvent of particular concern is the monoaromatic species toluene (C6H5CH3) (Calvert et al., 2002), known to pose significant human health and environmental hazards (Byrne et al., 2018) and classified as a significant air pollutant (Montero-Montoya et al., 2018; Zhang et al., 2019). This work follows on from Mapelli et al. (2022), where the atmospheric oxidation of 2,2,5,5-tetramethyloxolane (TMO) (Byrne et al., 2017) was studied in detail (Part 1). Byrne et al. (2018) similarly identified pinacolone (3,3-dimethyl-2-butanone, (CH3)3CC(O)CH3), henceforth PCO, and methyl pivalate (methyl 2,2-dimethylpropanoate, (CH3)3CC(O)OCH3), henceforth MPA, as potential replacements for hazardous volatile non-polar solvents such as toluene. Advantages include low toxicity, sustainable (biomass) sourcing and good solvation characteristics. However, whilst the atmospheric chemistry of toluene is well known and its deleterious air quality impacts have been quantified, the atmospheric breakdown of PCO or of MPA was seldom studied. No air quality considerations were included in their selection as “green” solvents (Byrne et al., 2018).
Industrially, PCO is produced for use in fungicides, herbicides and pesticides (Liu et al., 2022). In addition to direct emission from industry, the Master Chemical Mechanism (MCM; http://mcm.york.ac.uk last access: 12 December 2022) (Saunders et al., 2003; Jenkin et al., 1997), a benchmark detailed description of atmospheric chemistry, reports PCO as a product of gas-phase oxidation of both 2,2-dimethylbutane and 3,3-dimethyl-2-butanol. An important removal process from the troposphere for virtually all VOCs including PCO, is via reaction with the hydroxyl radical, OH (Reaction R1; see Fig. 1).
The ambient temperature rate coefficient of Reaction (R1) was measured by Wallington and Kurylo (1987a) as k1(296 K) = (1.21 ± 0.05) × 10−12 cm3 molec.−1 s−1; this value is used in the MCM, where Reaction (R1) is described as proceeding exclusively via beta CH2−H abstraction (Reaction R1b) (Saunders et al., 2003; Jenkin et al., 1997). An alternative breakdown process for carbonyl-containing VOCs in the atmosphere is photolysis (Reaction R4), where the C = O function may absorb abundant UV light at λ> 290 nm via the electronic transition.
PCO is known to have an absorption maximum at 287 nm in cyclohexane solution (Chimichi and Mealli, 1992) and at 278 nm in water (Pocker et al., 1988), though quantitative absorption cross-sections were not reported. In the absence of quantitative cross-sections or quantum yields, the MCM represents PCO photodissociation (Reaction R4) and subsequent rapid reactions with O2 as exclusively producing (CH3)3CO2 + CH3C(O)O2 and the photolysis rate parameters of PCO (and seven other ketones) via parameters measured for photolysis (Reaction R5) of methyl ethyl ketone (butanone, CH3C(O)C2H6, henceforth MEK).
With a similar branched chemical structure, and different functionality, the ester MPA was also selected by Byrne et al. (2018) as a bio-based replacement for problematic hydrocarbon solvents. A wide range of industries make use of MPA, including as a solvent with low ozone formation potential. Wallington et al. (2001) have studied the principal atmospheric removal reaction for MPA (Reaction R2), reporting k2(298 K) = (1.20 ± 0.03) × 10−12 cm3 molec.−1 s−1 and complex, non-Arrhenius behaviour for k2(250–370 K).
The UV absorption spectrum of MPA was also measured by Wallington et al. (2001), who reported an absorption maximum at around 210 nm but no absorption at wavelengths (λ> 290 nm) where UV light is abundant in the troposphere.
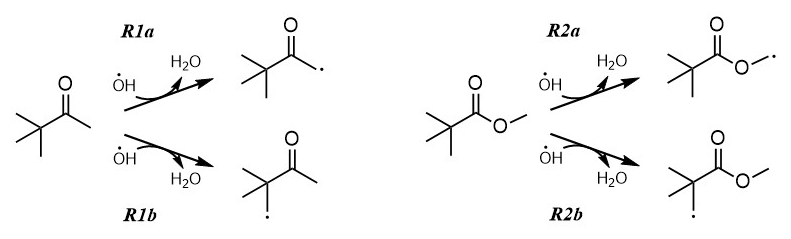
Figure 1Proposed pathways for PCO + OH (Reaction R1), where the H abstraction may proceed at the alpha CH2−H (Reaction R1a) or beta CH2−H (Reaction R1b, as proposed in the MCM). Similarly, two different sites for H abstraction are available for the reaction MPA + OH (Reaction R2). In the atmosphere, these radical products will react rapidly with oxygen to form peroxy radicals (RO2).
Reactions of OH with oxygenated volatile organic compounds (OVOCs) such as PCO and MPA are notoriously complex, with several examples displaying bimodal non-Arrhenius kinetic behaviour at atmospherically relevant temperatures (Calvert et al., 2011; Wollenhaupt et al., 2000). The lack of photochemical data for degradation of PCO and MPA in the troposphere, and OVOCs in general, is therefore concerning. Rate coefficients k1 and k2 were each reported just once (Wallington and Kurylo, 1987a; Wallington et al., 2001; Mapelli et al., 2022). Photolysis (Reaction R4) is potentially the dominant loss process for PCO, yet the state-of-science model MCM (Master Chemical Mechanism) represents Reaction (R4) using absorption cross-sections and quantum yields for a surrogate ketone species, MEK (Saunders et al., 2003). This paucity of data, together with the recent increase in interest around green solvents, was a prime motivation for this work, which aims to improve our knowledge of the atmospheric chemistry of the OVOC species PCO and MPA. Direct, absolute kinetic methods were used to determine temperature dependent rate coefficients for the reaction of PCO and MPA with OH. Absorption cross-sections for PCO were obtained from both laboratory and computational experiments. These fundamental photochemical parameters were then used to calculate lifetimes for the removal of PCO and MPA from the troposphere. Finally, estimated photochemical ozone creation potential (POCPE) values were calculated according to the method proposed by Jenkin et al. (2017), allowing for air quality impact assessments of these molecules for use as green solvents.
Two distinct sets of experiments were used to examine solvent breakdown reactions. In Sect. 2.1, a brief description of the University of York pulsed laser apparatus is provided. This setup, used to obtain absolute rate coefficients k1(295–485 K) and k2(295–485 K), was described more fully in a recent publication (Mapelli et al., 2022). Section 2.2 describes UV–Vis measurements of solution-phase absorption cross-sections, σ(λ) for PCO and for MEK, a compound that has measured gas-phase absorption cross-sections and that, to date, has been used to represent PCO photolysis (as well as a range of structurally similar ketone species) in models of atmospheric chemistry (Jenkin et al., 2003; Saunders et al., 2003). The computational methods used for in silico σ(λ) calculations are presented in Sect. 2.3.
2.1 Pulsed laser photolysis–laser-induced fluorescence (PLP-LIF) experiments
The absolute kinetic technique of pulsed laser photolysis (PLP), coupled to direct pulsed laser-induced fluorescence (LIF) detection of OH, was used to determine rate coefficients k1(295–485 K) and k2(295–485 K). This apparatus was described in detail in a previous publication (Mapelli et al., 2022). Briefly, output from four mass flow controllers was mixed prior to entering a 400 cm3 Pyrex reactor equipped with thermocouples (±2 K) and capacitance manometers. Output from these calibrated analogue devices was digitised and passed to a PC to regulate and log gas temperature, pressure and flow rate (typical flow rate of 1000 sccm at 60 Torr (8.0 kPa, where 1 Torr = 0.1333 kPa). These data were subsequently used for manometric calculation of reagent concentrations; rate coefficient determinations in this work relied critically on accurate knowledge of [OVOC], here estimated to a precision of ±15 %.
The fourth harmonic output (E= 20 mJ cm−2/pulse) from a 10 Hz Nd:YAG laser was directed into the reactor via a quartz Brewster window and used to generate OH via 266 nm PLP of H2O2 (Reaction R6).
Kinetic experiments conducted in the absence of OVOCs and manometric estimates both indicated that [H2O2] ≈ 1014 molec. cm−3 in all experiments. Under these conditions, an estimated [OH] ≈ 1011 molec. cm−3 was generated (Reaction R6). As such, pseudo-first-order conditions of [OVOC] ≫ [OH] applied throughout, save in experiments conducted with [OVOC] = 0. The 282 nm output from a frequency-doubled dye laser (Rhodamine-6G; pumped at 532 nm) was directed through a second quartz Brewster window, co-linear but counter-propagating to the PLP laser. This tuneable laser light was used to pump the Q11 transition of 1) ← X2Π(v= 0) at 281.997 nm for direct, off-resonant LIF detection of OH. Fluorescence decay signals S were monoexponential, allowing for analysis via fitting with Eq. (1):
where S0 refers to the LIF signal at t= 0 and is proportional to the initial concentration of OH generated by Reaction (R6) and B represents the pseudo-first-order rate coefficient.
2.2 Absorption cross-sections, σ(λ), via UV–Vis experiments
UV–Vis studies were carried out using a double-beam Shimadzu UV-2600 spectrometer over the wavelength range 250–400 nm at T= (298 ± 1) K and with a resolution of 1 nm. The spectra were recorded in Hellma Analytics quartz cuvettes with a path length of 10 or 2 mm. As no suitable apparatus was available at the University of York for gas-phase σ4(λ) determinations, all spectra recorded were in solution phase, diluted in cyclohexane (c–C6H12). This choice was based on the work of Nakashima et al. (1982), who studied the solvent effect on the absorption spectra of ketones. Spectra in perfluorohexane (C6F14) were reported as quasi-vapour spectra. In this work, use of C6F14 was avoided for environmental reasons (Tsai, 2009); hence the similarly non-polar and weakly polarisable cyclohexane was chosen to imitate C6F14. Solutions (0.03–0.3 M) were prepared using volumetric flasks and micropipettes, with the concentration uncertainty estimated at around 10 %.
Chemicals
N2 > 99.9999 % was obtained directly from N2(l) boil-off; O2 (99.995 %, BOC) was used as supplied; H2O2 (JT Baker, 60 % in H2O) was prepped to an estimated (vapour pressure) mixing ratio of > 90 % by continuous flow of N2 through the liquid to remove the more volatile H2O component and then supplied via a bubbler maintained at T= 273 K and close to reactor pressure; and MPA (98 %, Sigma-Aldrich), PCO (97 %, Sigma-Aldrich) and C2H5OH (99 %, Sigma-Aldrich) were subject to repeated freeze–pump–thaw cycles at T= 77 K prior to dilution with N2 (mixing ratios ≈ 0.5 %) in 12 dm3 pyrex bulbs for storage and supply. For UV–Vis experiments, reagents MPA, PCO, c–C6H12 (99 % Sigma-Aldrich) and MEK (> 99.7 % Sigma-Aldrich) were used without further purification.
2.3 Computational methods used to determine σ(λ)
Ground-state minimum-energy geometries for PCO and MEK were located with density functional theory (DFT) calculations employing the ωB97XD (Chai and Head-Gordon, 2008) exchange-correlation functional and the def2-TZVP basis set (Weigend and Ahlrichs, 2005), both in gas phase and using an implicit solvent within the IEF-PCM framework (polarizable continuum model using the integral equation formalism variant; using parameters for cyclohexane). Each stationary point located was confirmed to be a minimum by performing a frequency calculation at the very same level of theory. Two different conformers were located for MEK (in gas phase and with the implicit solvent model). The free-energy difference between the two conformers is 0.071 eV in gas phase and 0.059 eV in solution (corresponding to a Boltzmann population ratio of 0.942:0.058 in gas phase and 0.909:0.091 in solvent at 298.15 K).
Photoabsorption cross-sections were calculated following the workflow described by Prlj et al. (2022). In short, a Wigner function for uncoupled harmonic oscillator was created from the frequencies (discarding the lowest-energy mode, < 100 cm−1) and equilibrium geometry for each molecule and each conformer, from which 1000 different geometries were sampled. The nuclear ensemble approach (Crespo-Otero and Barbatti, 2012) was then employed to construct the photoabsorption cross-sections for each molecule (and conformer) from the transition energy and oscillator strength (S1←S0) of each sampled geometry obtained with linear-response time-dependent DFT (LR-TDDFT) within the Tamm–Dancoff approximation (TDA), using the same exchange-correlation functional and basis set as earlier (ωB97XD and def2-TZVP), with and without a LR-PCM (Cammi et al., 2000). This level of electronic-structure theory was benchmarked against equation-of-motion coupled-cluster singles and doubles (EOM-CCSD) and was found to produce reliable excitation energies and oscillator strengths in earlier studies (Sarkar et al., 2021). LR-TDDFT/TDA/ωB97XD/def2-TZVP gives a vertical excitation (oscillator strength) towards S1 of 4.61 eV (0.0000) for MEK and 4.49 eV (0.0002) for PCO, while EOM-CCSD/aug-cc-pVDZ places these transitions at 4.62 eV (0.0000) for MEK and 4.50 eV (0.0001) for PCO. The final photoabsorption cross-section of MEK (in gas phase and in solution) was obtained by averaging the photoabsorption cross-section of each conformer, weighted by the corresponding Boltzmann population. The nuclear ensemble approach (NEA) calculations were performed with Newton-X version 2.4 (Barbatti, 2013; Barbatti et al., 2014), with electronic-structure information provided by Gaussian16 Revision B.01 (Frisch et al., 2016).
Results from absolute kinetic determinations of k1(295–485 K) and k2(295–485 K) are presented in Sect. 3.1. Absorption cross-section data determined in this work are presented in Sect. 3.2 (experimental UV–Vis results) and 3.3 (results from computational studies). In Sect. 3.4, these results are discussed in full, with an emphasis on the relative importance of photolysis vs. the OH reaction route and on outstanding uncertainties.
3.1 Absolute determinations of k1(295–485 K) and k2(295–485 K)
Figure 2 shows a typical exponential LIF signal decay, obtained from a Reaction (R1) experiment conducted at T= 460 K under pseudo-first-order conditions of [PCO] > 1000 × [OH]. The inset in Fig. 2 summarises results from 12 such experiments, with pseudo-first-order rate parameter, B (Eq. 1) plot vs. corresponding [PCO]. The slope from a linear fit to this dataset yields the second-order rate constant k1(460 K).
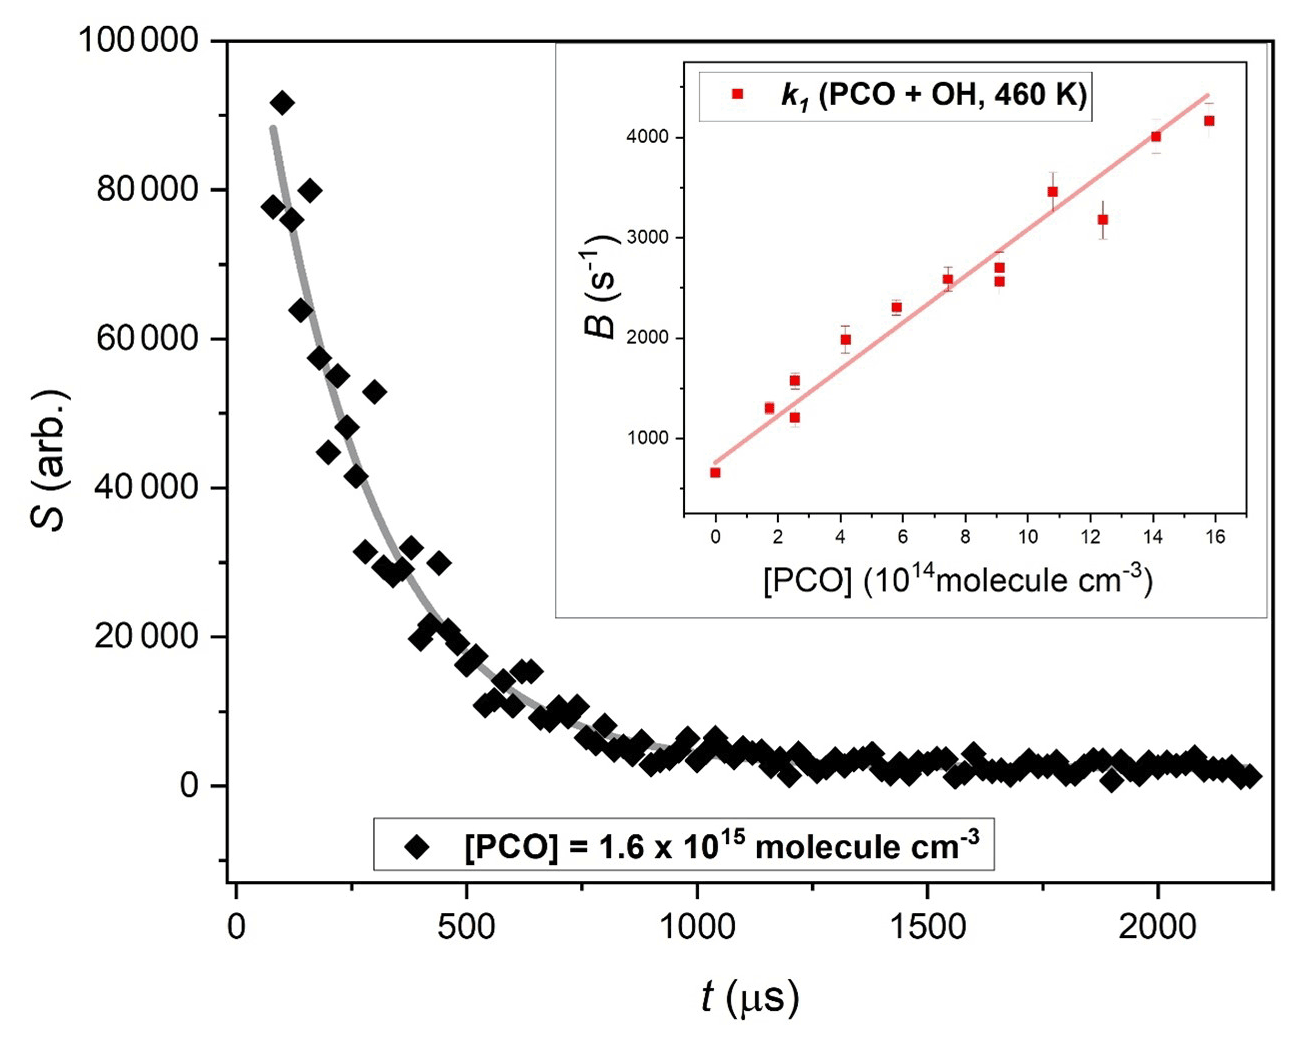
Figure 2Exemplary exponential decay of OH LIF signal in the presence of excess [(CH3)3CC(O)CH3] = 1.6 × 10¹⁵ molec. cm−3, fit with (Eq. 1) to yield pseudo-first-order rate coefficient B = (4090 ± 153) s−1. Inset shows bimolecular plot used to determine k1(460 K) = (2.3 ± 0.1) × 10−12 cm3 molec.−1 s−1.
Similar experiments were conducted at different temperatures and pressures and in the presence/absence of O2. Results from all such k1(T) determinations are listed in Table 1 and displayed in Arrhenius format in Fig. 3. A weighted average of the three values at close to ambient temperature yields k1(297 K) = (1.23 ± 0.09) × 10−12 cm3 molec.−1 s−1, in good agreement with the solitary previous determination of k1(296 K) = (1.21 ± 0.05) × 10−12 cm3 molec.−1 s−1 (Wallington and Kurylo, 1987a). Over the range of temperatures investigated in this work, these results were adequately represented by a two-parameter Arrhenius equation, as k1(297–485 K) = 2.14 × 10⁻¹² exp( cm3 molec.−1 s−1. Also displayed in Fig. 3 are results from this work on the well-characterised reaction between ethanol (CH3CH2OH) and OH (Reaction R3), many of which were obtained in back-to-back experiments alongside those on Reaction (R1).
The satisfactory agreement between the k3(295–447 K) determinations here and the extensive literature dataset (Dillon et al., 2005; Carr et al., 2008; Wallington and Kurylo, 1987b; Hess and Tully, 1988; Jiménez et al., 2003) lends confidence to the k1(T) results from this work.
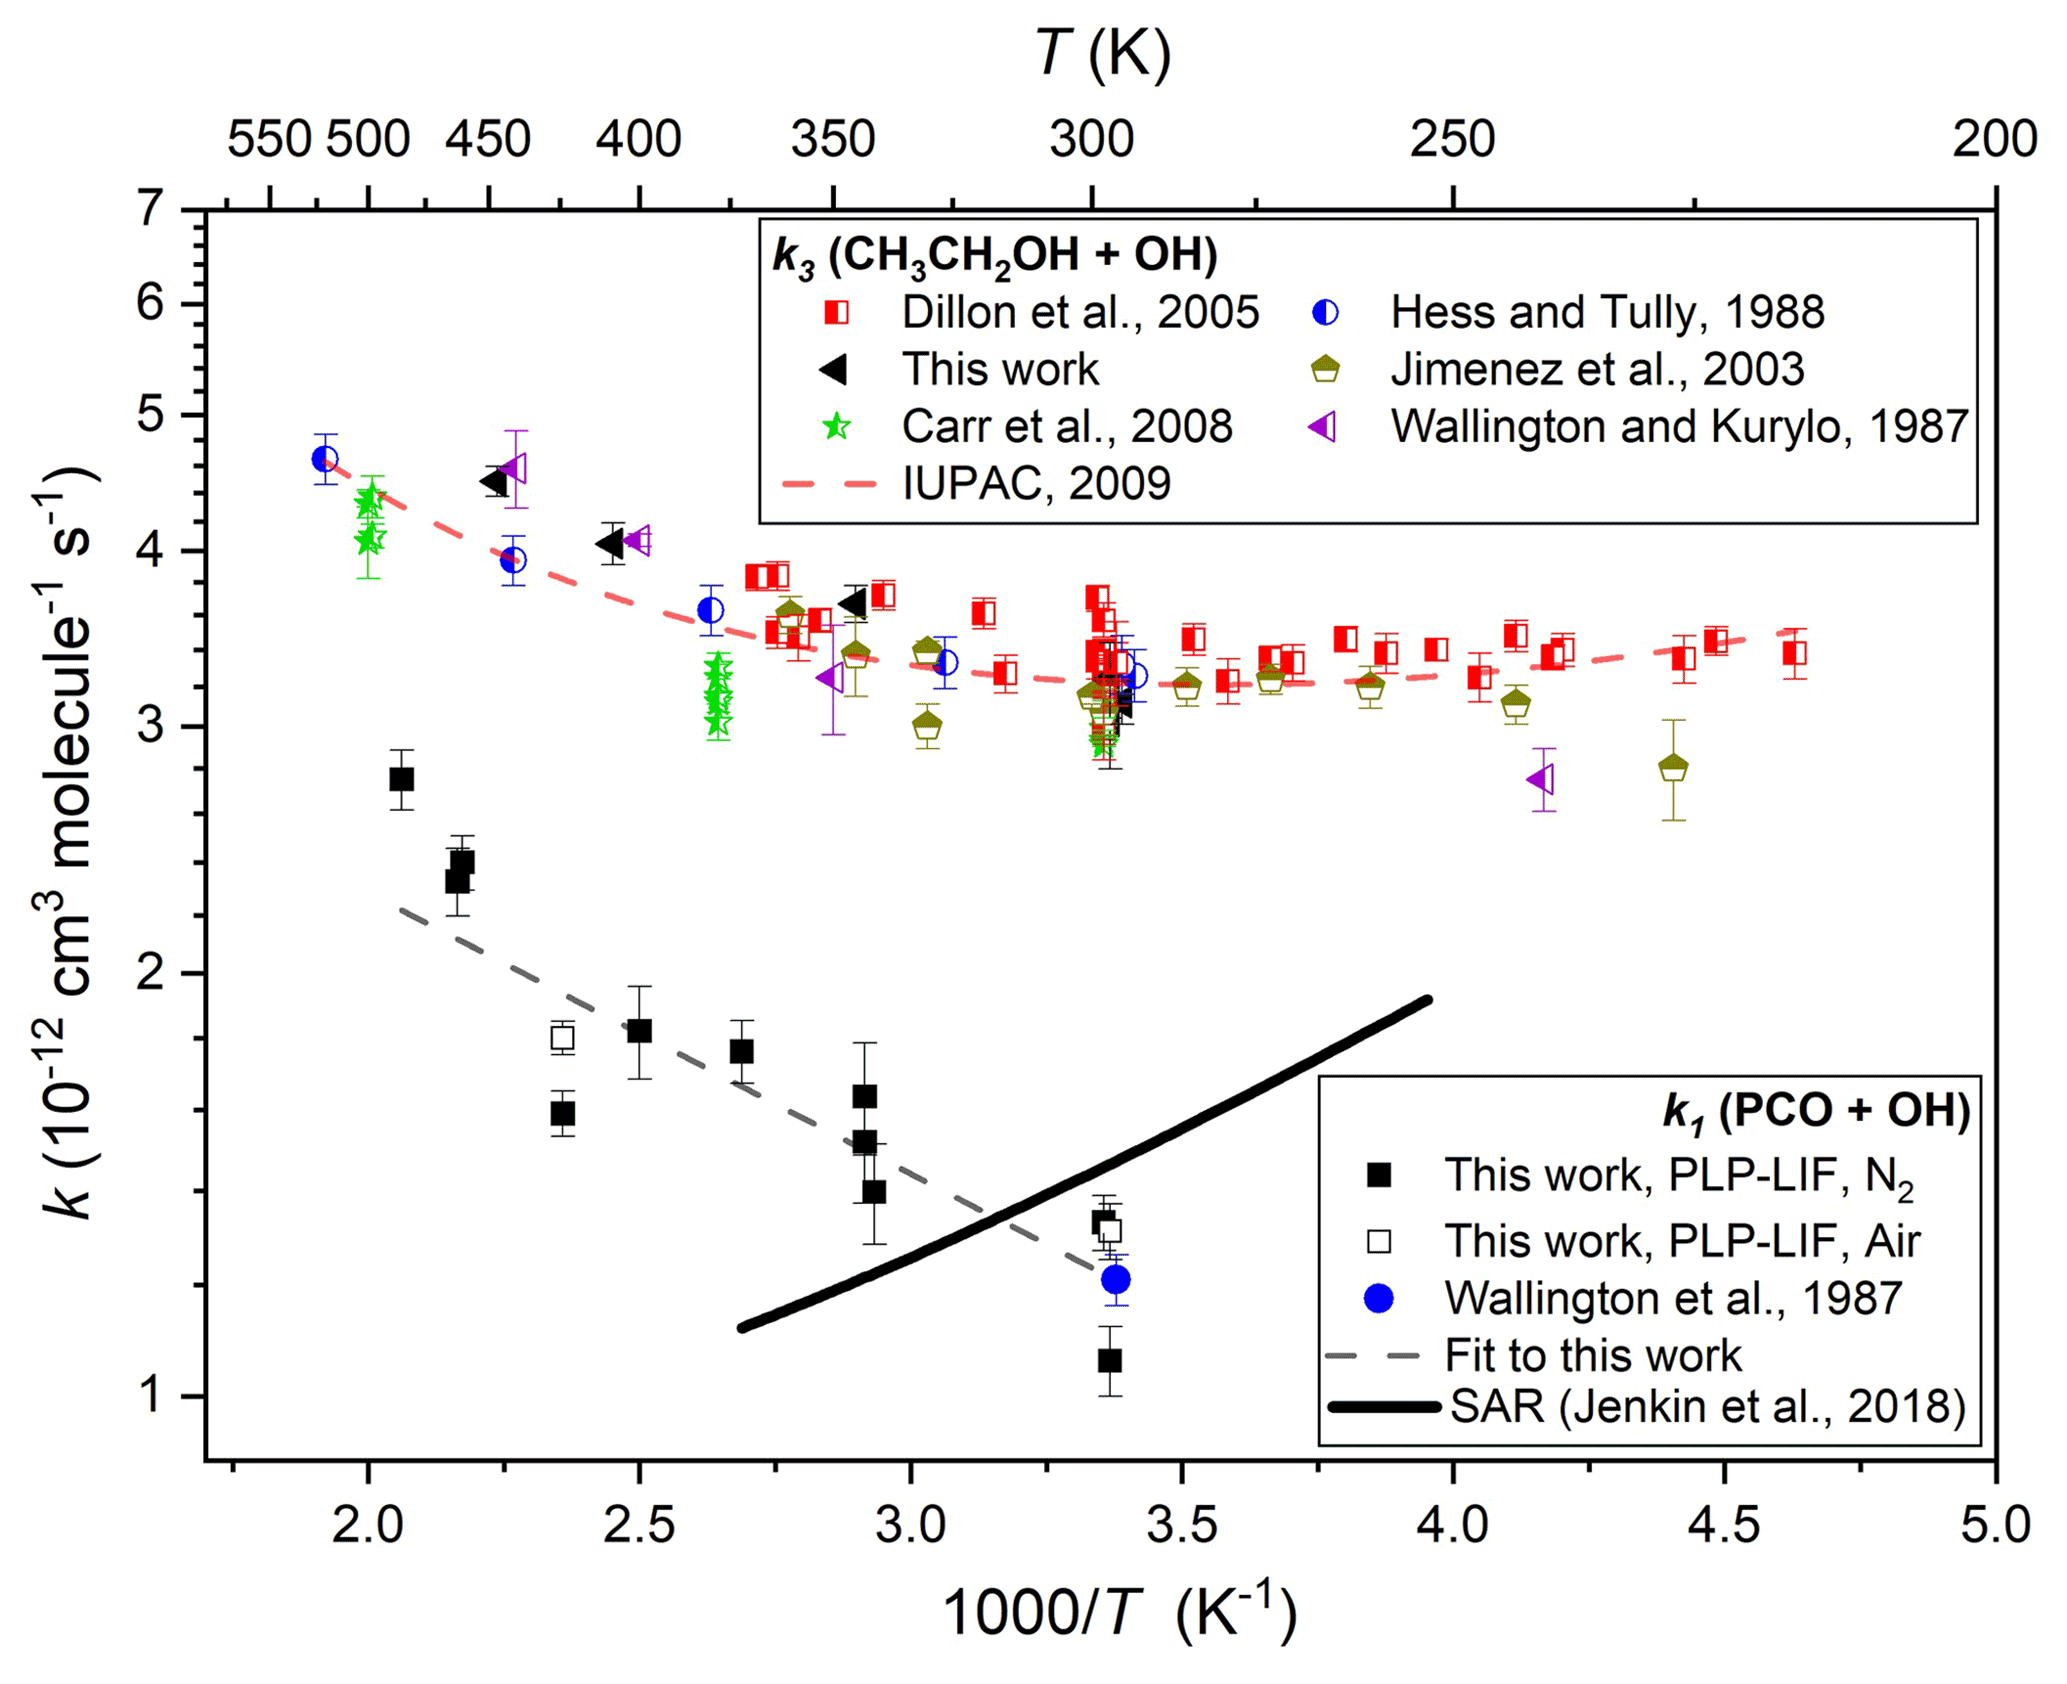
Figure 3Arrhenius plot for the reaction of PCO + OH (Reaction R1): filled black square data points represent k1(T) determinations from this work using N2 bath gas and open black squares using air; the filled blue circle represents the solitary determination from Wallington et al. (1987); the dashed black line denotes an Arrhenius fit to all k1(T) results to yield k1(296 or 297–485 K) = 2.14 × 10⁻¹² exp( cm3 molec.−1 s−1; and the solid black line represents k1(T) calculated using the SAR proposed by Jenkin et al. (2018). Also displayed are k3(T) values from this work (black triangles) and from literature (Dillon et al., 2005; Hess and Tully, 1989; Carr et al., 2008; Wallington and Kurylo, 1987b; Jiménez et al., 2003) together with the corresponding IUPAC evaluation (Atkinson et al., 2006), leading to the three-parameter expression k3(T)= 6.70 × 10⁻¹⁸ T2 exp( cm3 molec.−1 s−1, here represented with a dashed red line.
A similar series of experiments was undertaken to determine k2(295–485 K), results from which are presented in Table 1 and depicted in Arrhenius format in Fig. 4. Control experiments were conducted at different pressures and in both N2 and air bath gas to ensure the reactivity was not affected by these factors; again, many experiments were conducted back to back with equivalent k6 determinations (see above). A weighted mean of the three room temperature determinations led to a value of k2(297 K) = (1.30 ± 0.01) × 10−12 cm3 molec.−1 s−1. This result agrees well with the ambient temperature value reported by Wallington et al. (2001) of k2(296 K) = (1.20 ± 0.03) × 10−12 cm3 molec.−1 s−1 when considering potential systematic uncertainties, notably in [MPA] (see Sect. 3.4 below). As is evident from Fig. 4, results from this work confirmed the complex non-Arrhenius behaviour reported by Wallington et al. (2001), revealing a local minimum in k2(T) close to ambient temperature. Such non-Arrhenius behaviour may be indicative of a change of rate-determining step within the mechanism, with direct hydrogen abstraction dominating at high temperatures, whilst pathways via hydrogen-bonded pre-reaction complexes play an increasingly important role at lower temperatures. A similar trend was observed for reactions of OH with other OVOCs (Wollenhaupt et al., 2000; Vasvári et al., 2001). As displayed by the dashed black line in Fig. 4, the full set of k2(T) results from this work and from Wallington et al. (2001) can be adequately represented by a three-parameter equation k2(250–485 K) = [50.3 exp( + 0.43 exp(] × 10−12 cm3 molec.−1 s−1.
Table 1Absolute determinations of k1, k2 and k3 from this work.
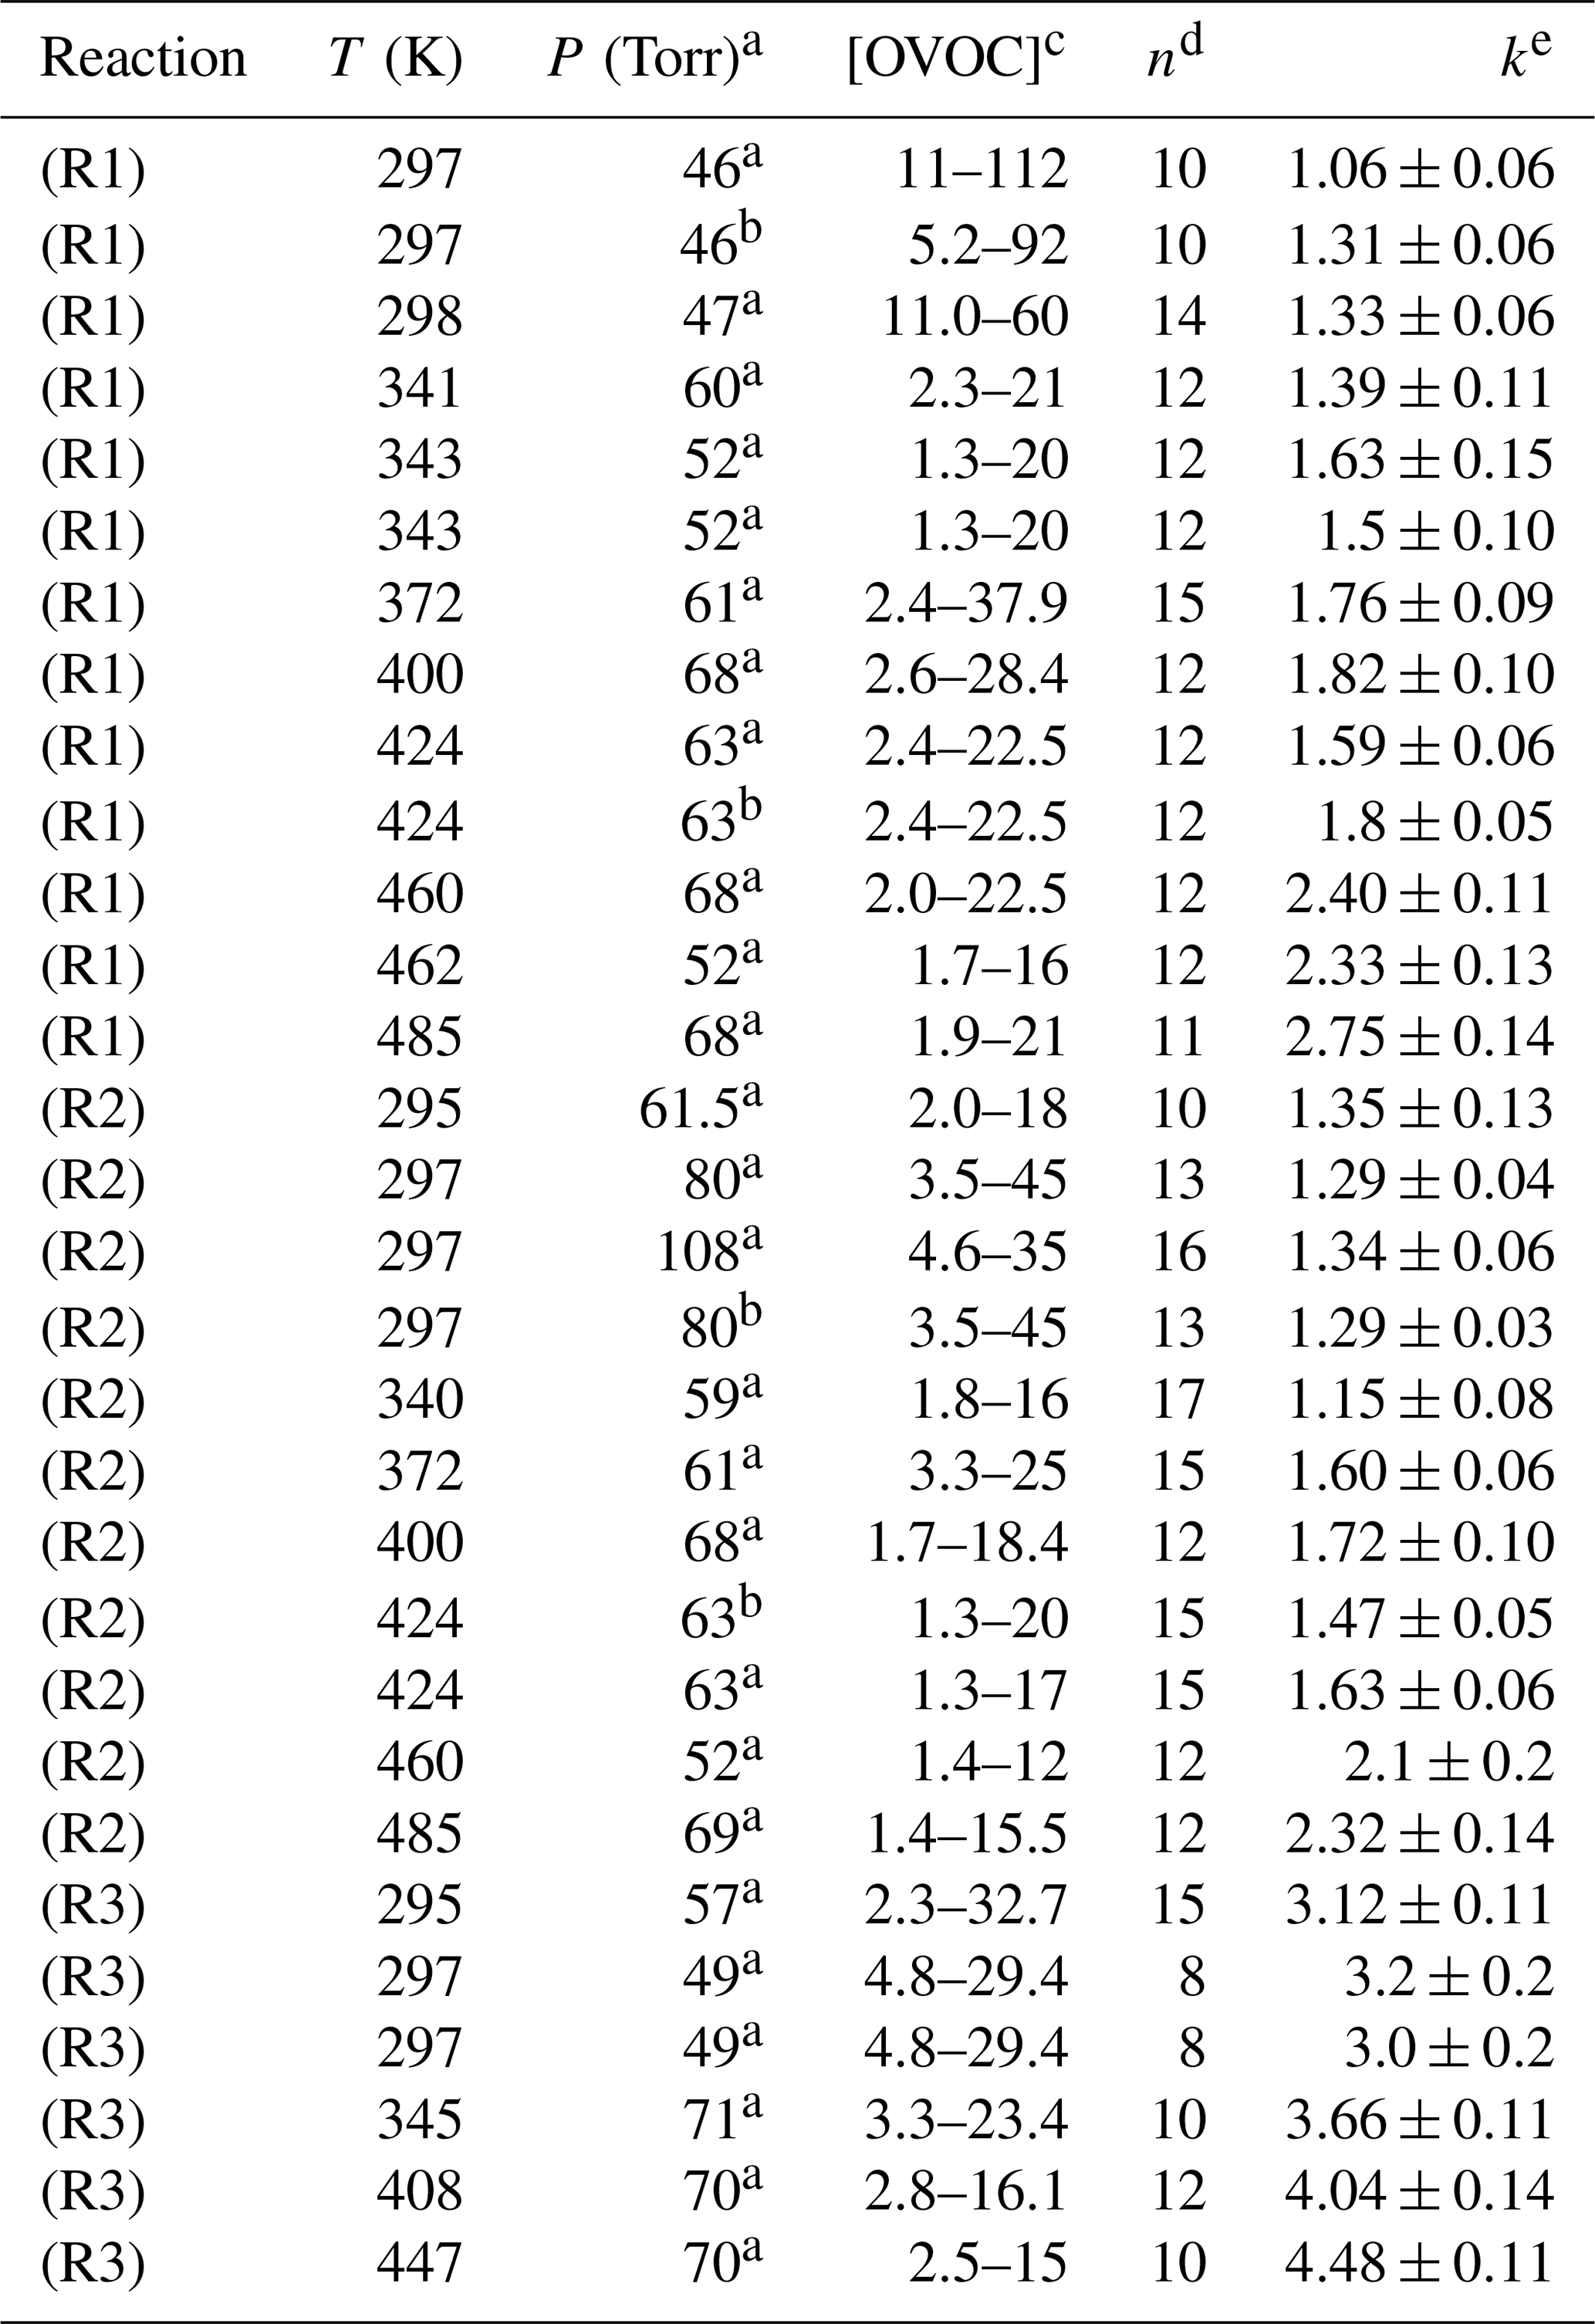
a Pressure of N2 bath gas. b Air bath gas. c Units for [OVOC] were 1014 molec. cm−3. d Number of different [OVOC] values in the bimolecular plot. e k values in units of 10−12 cm3 molec.−1 s−1.
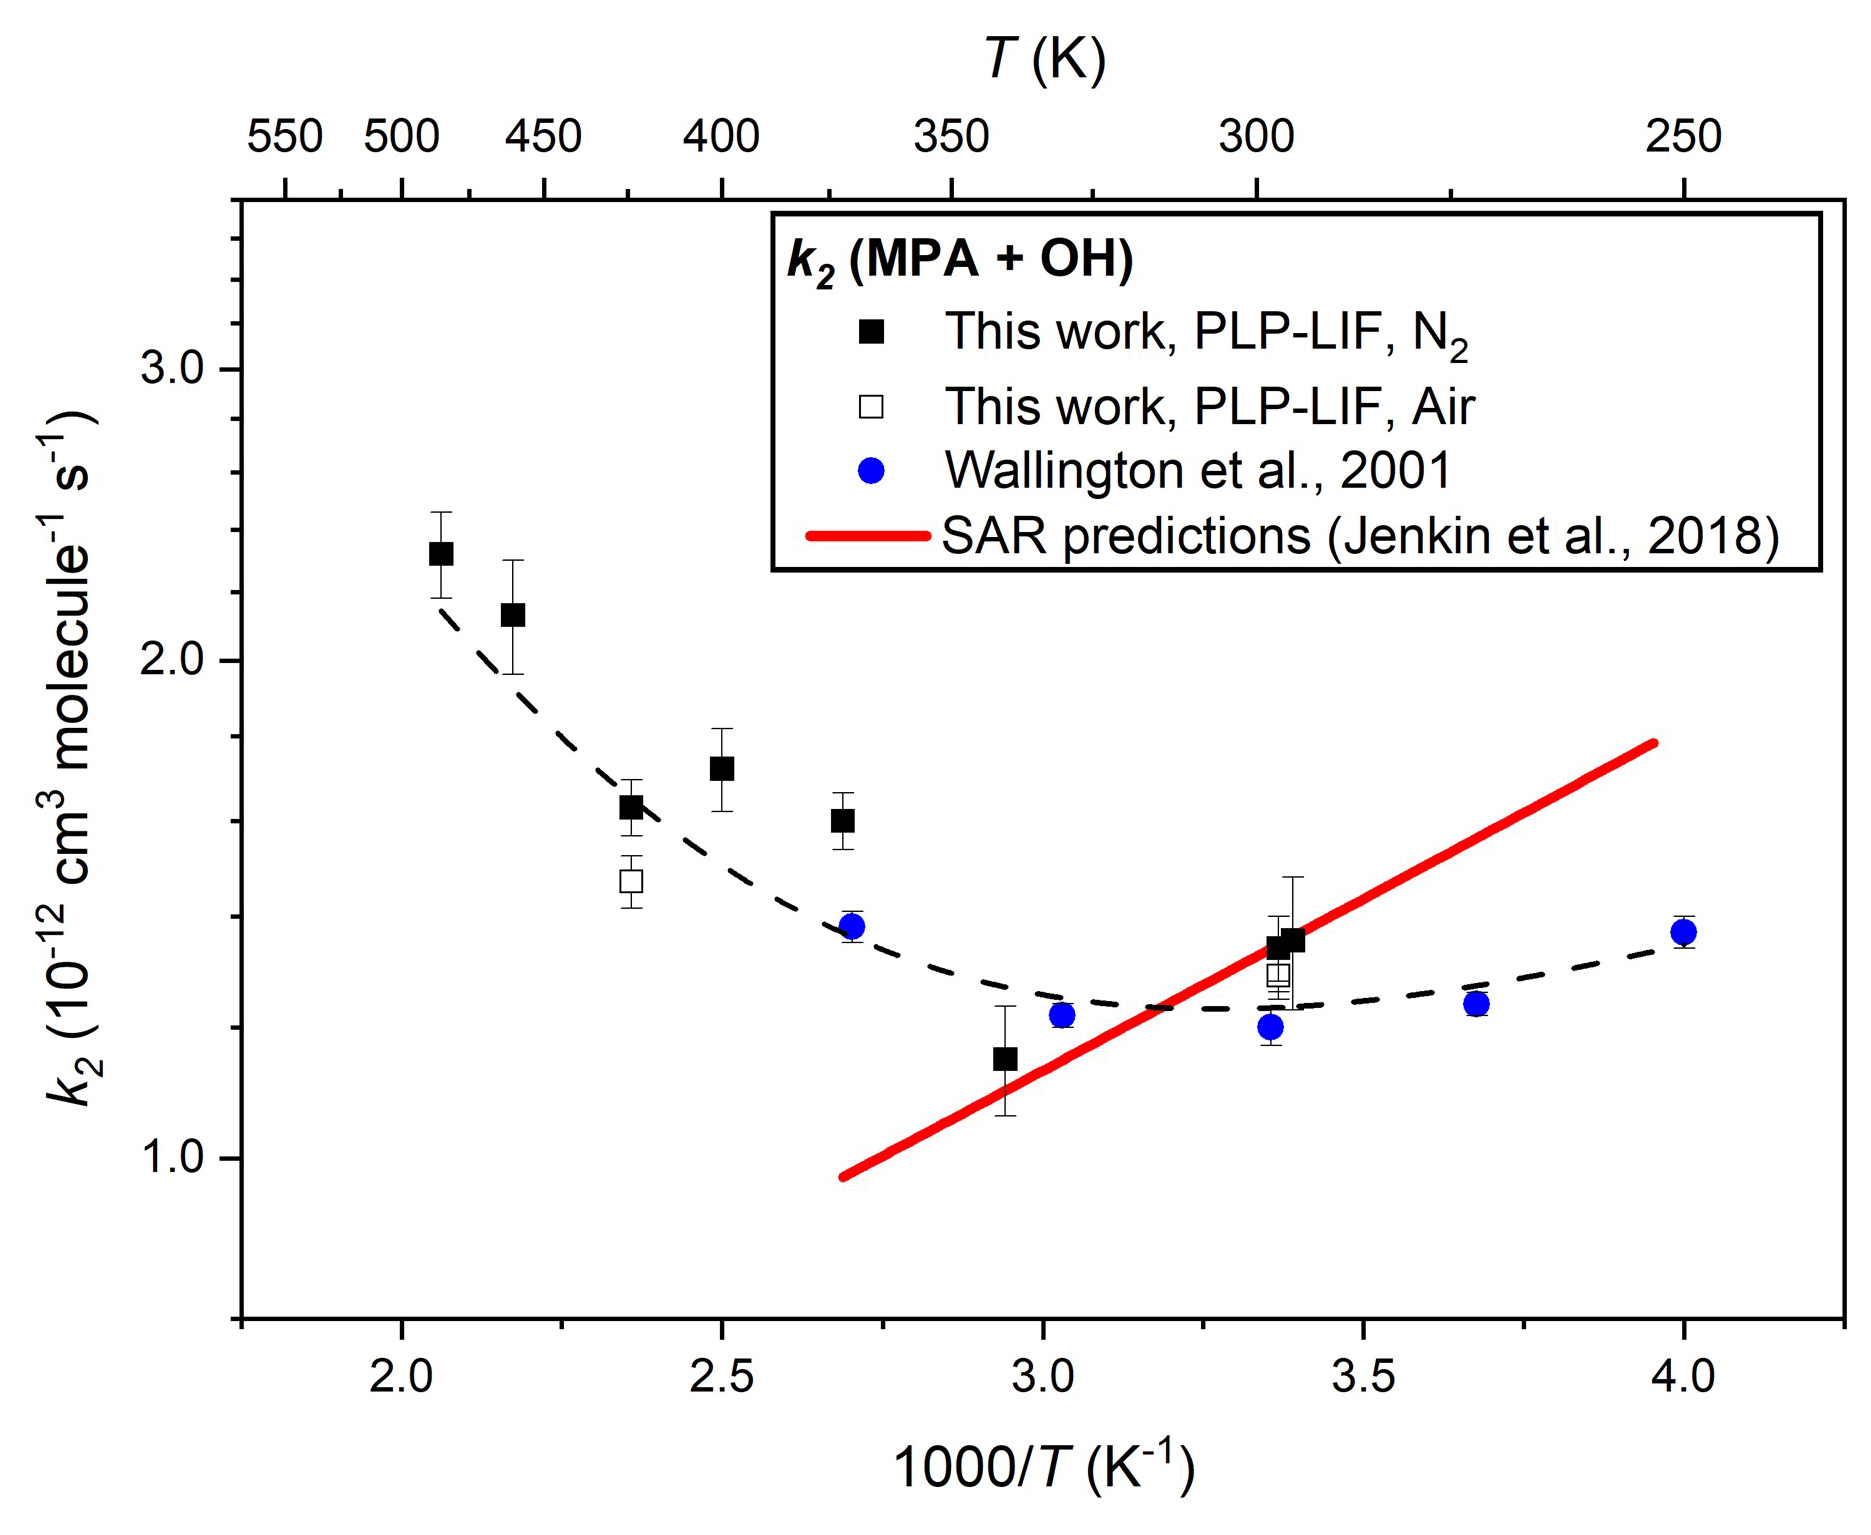
Figure 4Arrhenius plot for the reaction of MPA with OH (Reaction R2): the filled black square data points represent k2(T) determinations from this work using N2 bath gas and open black squares using air; the filled blue circles indicate literature data from Wallington et al. (1987); and the dashed black line represents a fit to all experimental data to yield k2(T)= 5.0 × 10⁻¹¹ exp() + 4.3 × 10⁻¹³ exp(). The solid red line represents k2(T) calculated from the SAR proposed by Jenkin et al. (2018).
3.2 UV–Vis cross-sections σ(λ) determined in the laboratory
Figure 5 displays the solution-phase spectrum for PCO (in cyclohexane) obtained using the methods detailed in Sect. 2.2 above. Previous spectra of PCO over the wavelength range of interest were not available, except for the absorption maximum recorded for PCO in water (Pocker et al., 1988) and in cyclohexane (Chimichi and Mealli, 1992) at 278 and 287 nm respectively. That such dilute, solution-phase spectra can yield useful results is demonstrated by equivalent spectra for MEK. Cross-section values similarly obtained in this work, dilute in cyclohexane, are displayed in Fig. 5 alongside the IUPAC-recommended gas-phase spectrum (Mellouki et al., 2021) reported by Martinez et al. (1992) and confirmed by Brewer et al. (2019) in more recent studies. The solution-phase determinations consistently overestimate reported gas-phase values (e.g. at maximum value, σ(278 nm)= 6.2 × 10⁻²⁰ cm2 molec.−1 from this work vs. σ(278 nm)= 5.8 × 10⁻²⁰ cm2 molec.−1 in the gas phase (Martinez et al., 1992); see the Supplement). Whilst this was within the 10 % uncertainty estimated for this work, observing the spectra over at least three repeats from different solutions, the overestimation appears to be systematic (see Supplement) and was also identified in silico (see Sect. 3.3 below). The inset in Fig. 5 displays Beer–Lambert plots for data recorded in this work at 290 nm, yielding the molar absorption coefficients ε4(290 nm) = (20.6 ± 0.2) cm−1 M−1 for PCO and ε5(290 nm)= (16.4 ± 0.2) cm−1 M−1 for MEK. These coefficients can then be converted to the absorption cross-sections, leading to σ(290 nm)= (8.0 ± 0.8) × 10−20 cm2 molec.−1 for PCO and σ(290 nm)= (6.0 ± 0.6) × 10−20 cm2 molec.−1 for MEK. The UV spectra of PCO determined in this work were clearly characterised by larger cross-sections in the actinic region (see Fig. 6) and by a significantly red-shifted local maximum in absorption (286 vs. 278 nm) when compared to MEK. These observations will therefore have significant implications when revising estimates for photolysis rates of PCO, as more light is available at longer wavelengths (below). In accord with previous observations, UV–Vis spectra recorded for MPA showed no absorption over the wavelength range of interest, 290 < nm < 370 (see Supplement).
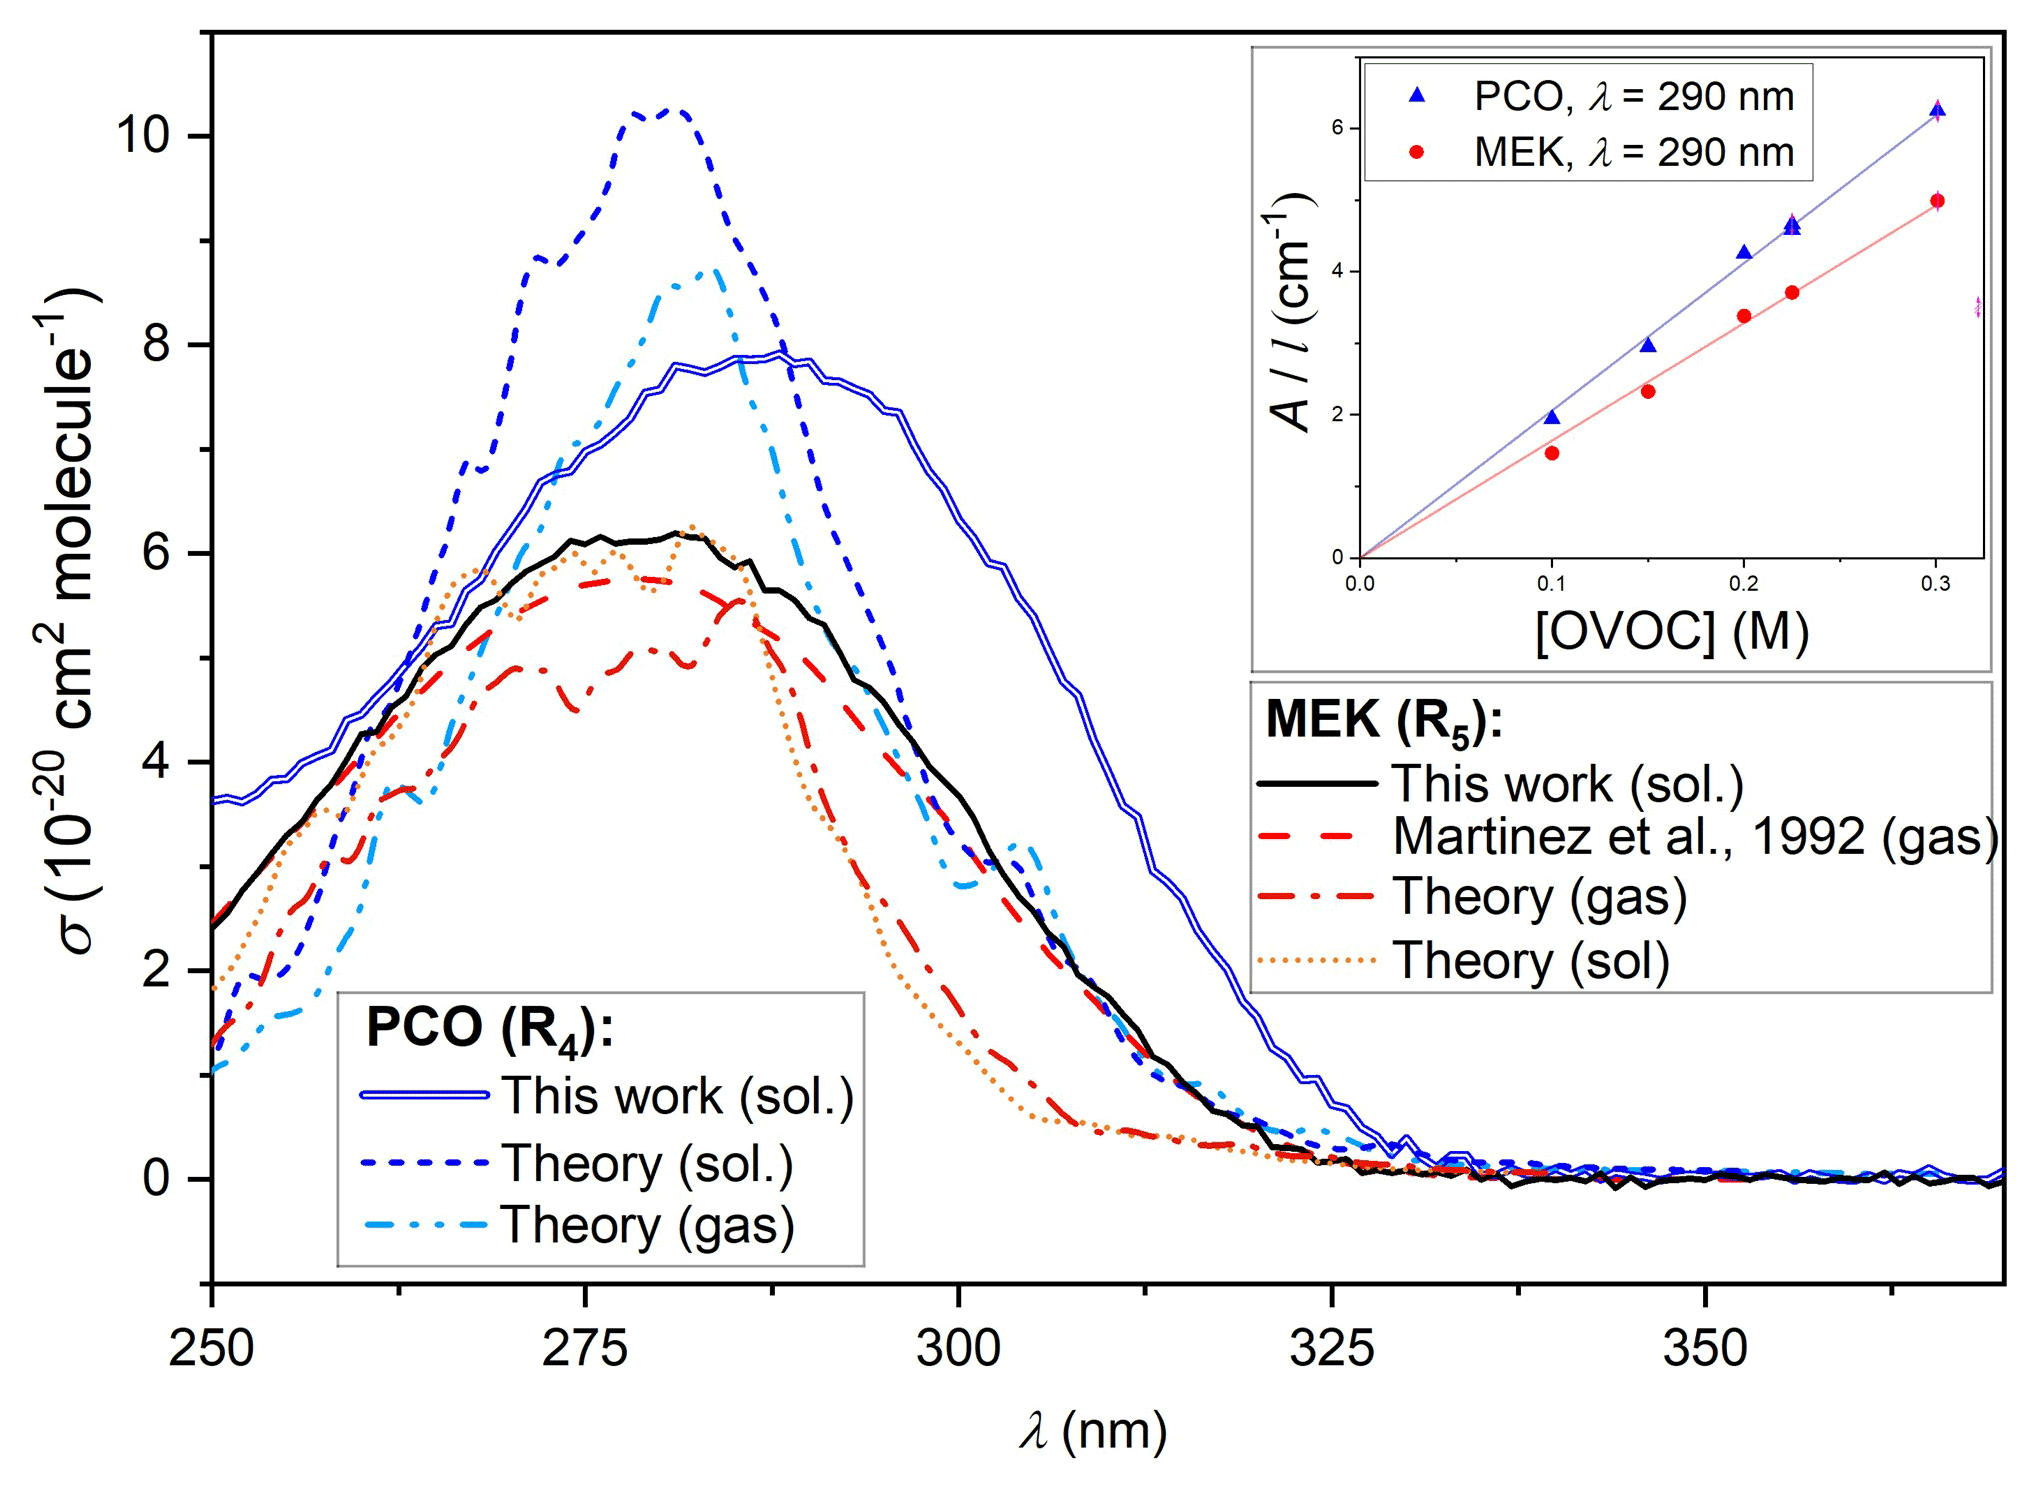
Figure 5Solution-phase spectra of MEK (black line) and PCO (blue line) obtained dilute in cyclohexane in this work, alongside the gas-phase spectrum of MEK (dashed red line) recorded by Martinez et al. (1992) and recommended by the IUPAC. Calculated gas-phase spectrum of MEK (dotted–dashed orange line), calculated spectra of PCO for the gas phase (dotted–dashed light-blue line) and the solution phase (dotted dark-blue line). The inset (top right) displays Beer–Lambert plots obtained at 290 nm in this work, yielding a molar absorption coefficient ε4(290 nm) = (20.6 ± 0.2) cm−1 M−1 for PCO and ε5(290 nm)= (16.4 ± 0.2) cm−1 M−1 for MEK.
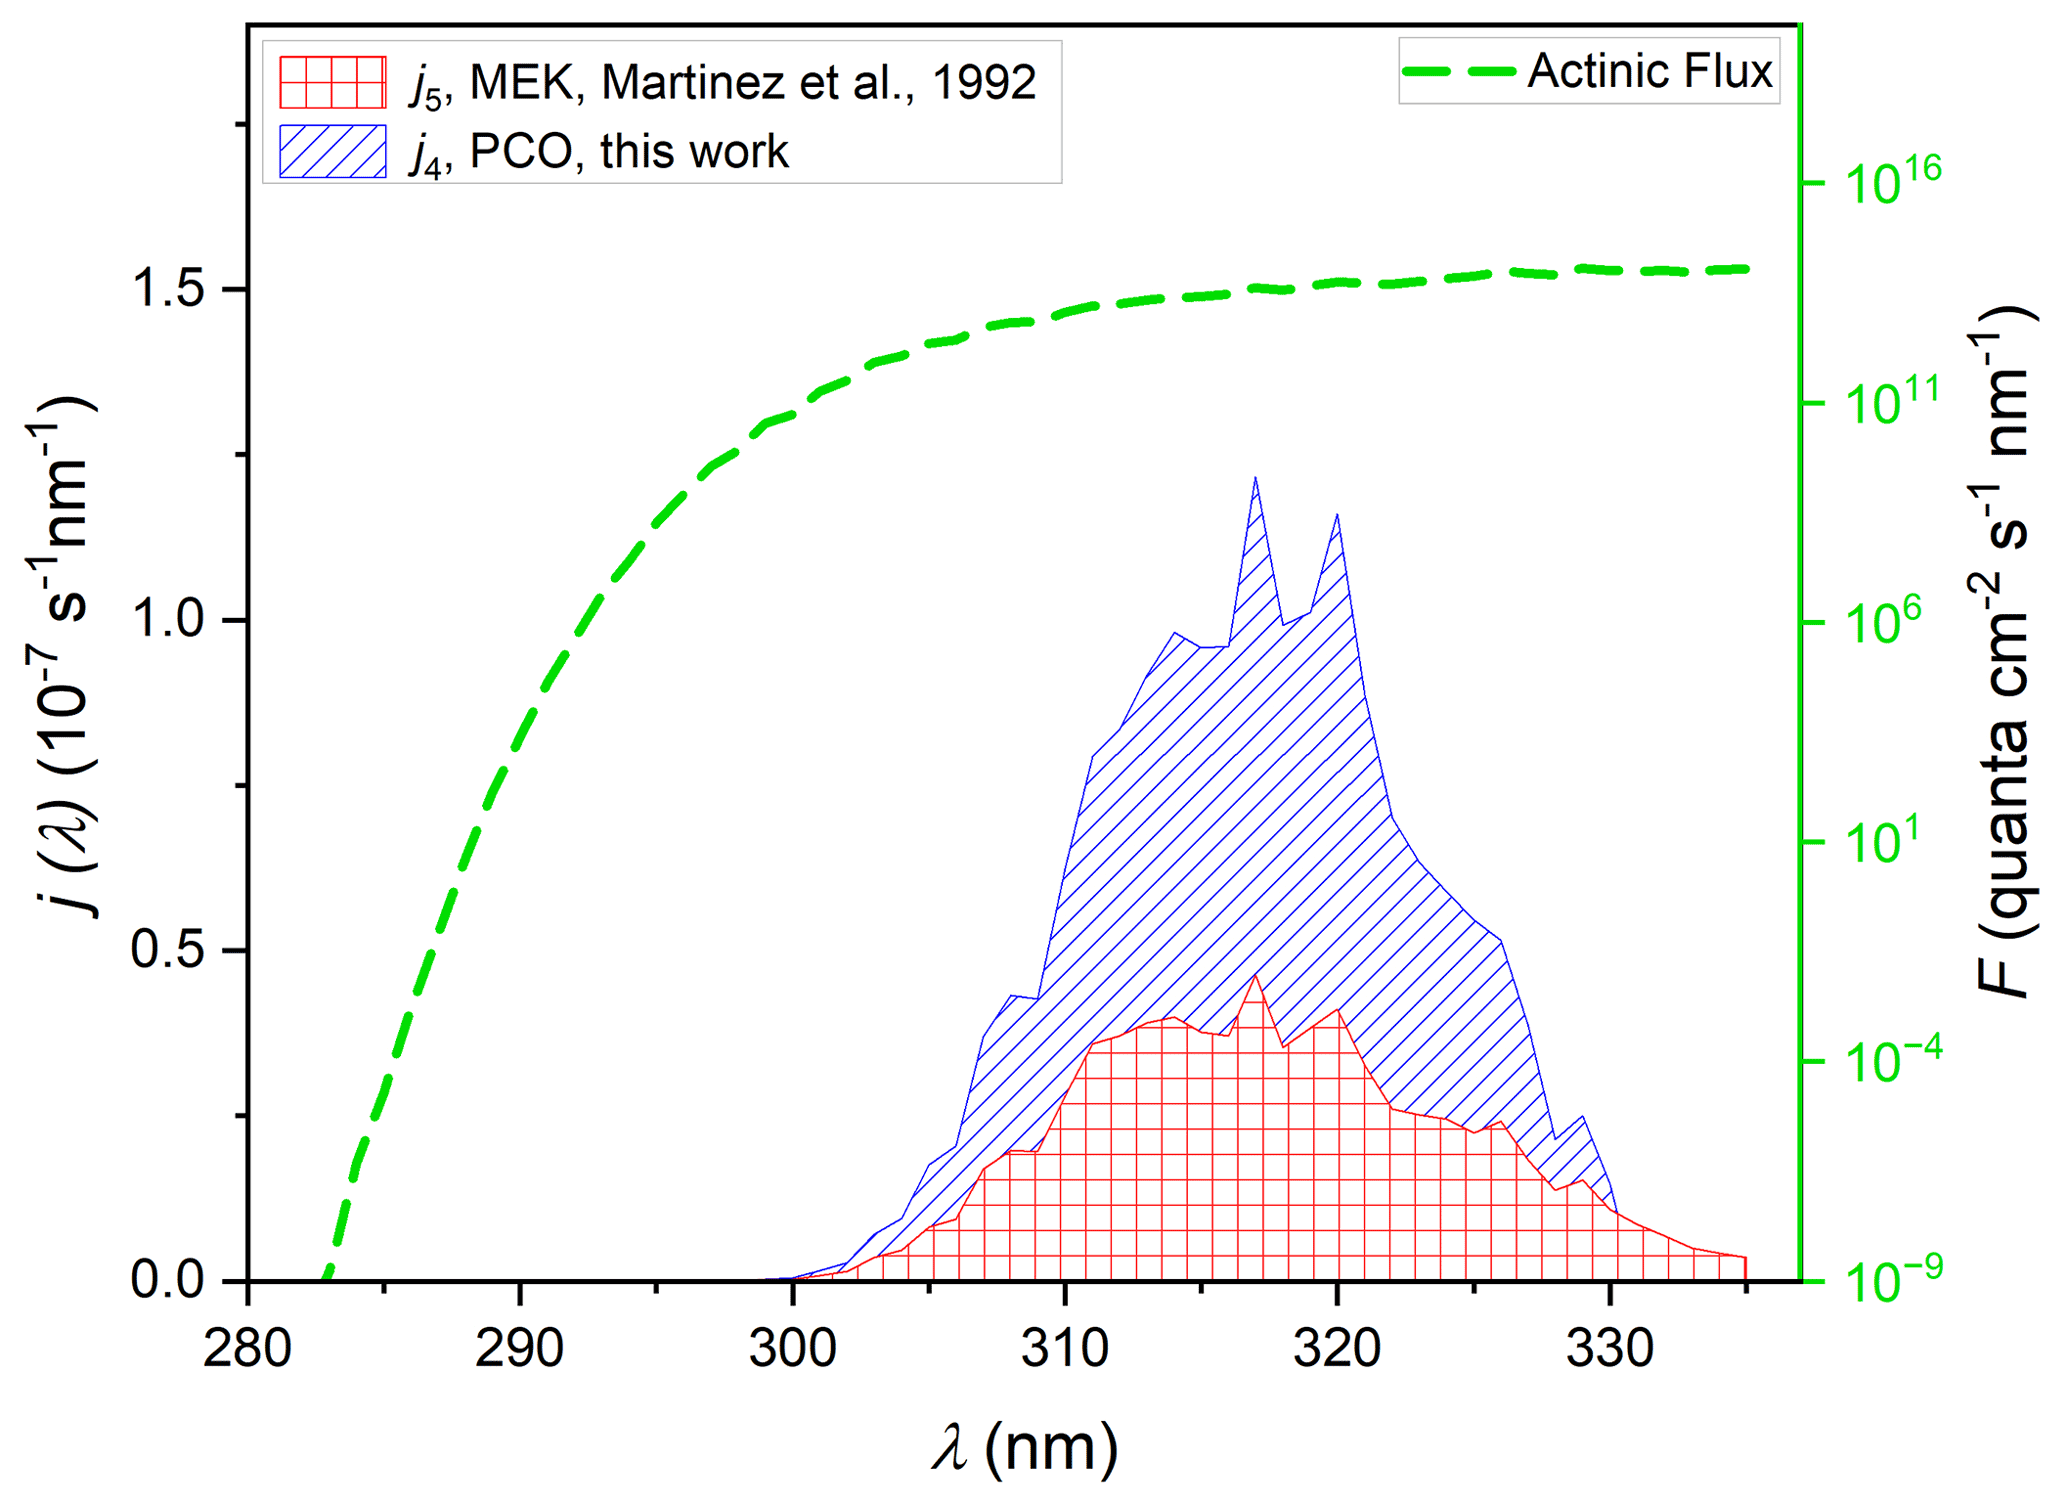
Figure 6j values for the photodissociation of PCO (Reaction R4) and MEK (Reaction R5), calculated via Eq. (2). An actinic flux (the dashed green line), for conditions of ϑ= 60∘ and 350 DU from the NCAR (TUV) Radiation Model, together with ϕ (275–380 nm) = 0.16 was used for all (Eq. 2) j-value calculations. The striped blue area derives from use of σ4(λ) values recorded in experiments using cyclohexane solvent having applied the scaling factor of 0.93 to best reproduce gas-phase σ4(λ) values (see Sect. 3.5), integrating to j4= 2.4 × 10⁻⁶ s−1. Also displayed are j values for photolysis of MEK (Reaction R5) calculated using σ5(λ) from the gas-phase spectrum of Martinez et al. (1992) (red square area, integrated to j5= 0.9 × 10⁻⁶ s−1).
3.3 UV–Vis cross-sections σ(λ) as determined in silico
Computational photochemistry can be used to estimate photoabsorption cross-sections both in gas phase and within an implicit solvent and determine what the theoretical shift in wavelength and intensity caused by cyclohexane is. The nuclear ensemble approach (NEA) (Crespo-Otero and Barbatti, 2012) was used to predict the photoabsorption cross-section for PCO and MEK (see Sect. 2.3 for the computational details), and we propose here a brief discussion of this technique as it is not commonly applied for the calculation of UV–Vis cross-sections. A common strategy to approximate a photoabsorption cross-section using quantum chemistry – the single-point approach – consists in locating the minimum-energy geometry in the ground electronic state for the molecule of interest and to calculate for this geometry the vertical transitions and oscillator strengths towards the excited electronic states. A photoabsorption cross-section can be obtained by broadening this single line with a Gaussian or Lorentzian function. The issue with the single-point approach is that it does not account properly for the quantum delocalisation of the ground-state nuclear wave function and non-Condon effects, that is, the fact that the transition dipole moment may vary with the nuclear configuration – an aspect particularly important for symmetry-forbidden transitions. The NEA offers a rather straightforward strategy to calculate photoabsorption cross-sections that accounts for the broadening coming from quantum delocalisation and the possible enhancement in transition probability caused by non-Condon effects. We note that the NEA does not account for contributions from Franck–Condon factors, that is, overlaps of nuclear wave functions on the ground and excited electronic states, and as such does not reproduce the vibronic structure of a given electronic transition. We refer the interested reader to Prlj et al. (2022) – a recent work where the NEA is discussed in detail in the context of atmospheric photochemistry. We stress that the NEA calculations presented here are predominantly used to investigate the effect of a solvent (cyclohexane) on the photoabsorption cross-section of MEK and PCO.
The NEA photoabsorption cross-section calculated for MEK in gas phase shows a close agreement with the experimental cross-section in terms of intensity and centre of the S1←S0 band, which exhibits a nπ* character. Including an implicit solvent (cyclohexane) leads to a slightly more intense cross-section predicted by the NEA for MEK, again mimicking closely the shift observed experimentally when comparing the gas-phase cross-section with the MEK cross-section measured in cyclohexane. Comparing the MEK cross-section calculated in cyclohexane with that obtained for PCO shows that the latter is more intense and red-shifted, in line with the measured cross-section in cyclohexane. The difference in width between the experimental and theoretical cross-sections is caused by the approximations underlying the NEA (neglect of vibrational progressions). From a theoretical perspective, comparing the changes in photoabsorption cross-sections in gas phase versus cyclohexane for MEK and PCO shows that the gas-phase photoabsorption cross-section is weakly red-shifted (0.0275 eV on average) with respect to the cross-section in cyclohexane, and its intensity is weakened by a factor 0.86.
3.4 Estimation of photolysis rate coefficients (j values)
Having measured the absorption cross-section of PCO, the photolysis rate can then be estimated according to Eq. (2):
where j is the first-order photolysis rate coefficient, ϕ stands for the quantum yield, σ is the absorption cross-section at wavelength λ and temperature T, and F is the actinic flux at wavelength λ and solar zenith angle θ (Fig. 7). As for many other organic compounds, quantum yields for PCO are unknown, and the MCM uses MEK as a surrogate with reasonably established photochemistry. Accordingly, the photolysis rate was calculated using ϕ= 0.16, the quantum yield determined by Pinho et al. (2005) for the wavelength range 275 to 380 nm. This value is different than that recommended by the IUPAC of ϕ= 0.34 (Atkinson et al., 2006), with the value from Pinho et al. (2005) optimised with environmental chamber data. Subsequently, Romero et al. (2005) reported quantum yields lower than the one estimated by Raber and Moortgat (1995), and their work stressed the importance of investigating the temperature dependence and the spectral distribution of quantum yields to avoid overestimation.
The actinic flux used for the estimation of j values was obtained using the NCAR Tropospheric Ultraviolet and Visible (TUV) Radiation Model (Madronich and Flocke, 1997), with a solar zenith angle of 60∘, an O3 column of 350 DU (Dobson units), an altitude of 0 km and the date 30 June 2015.
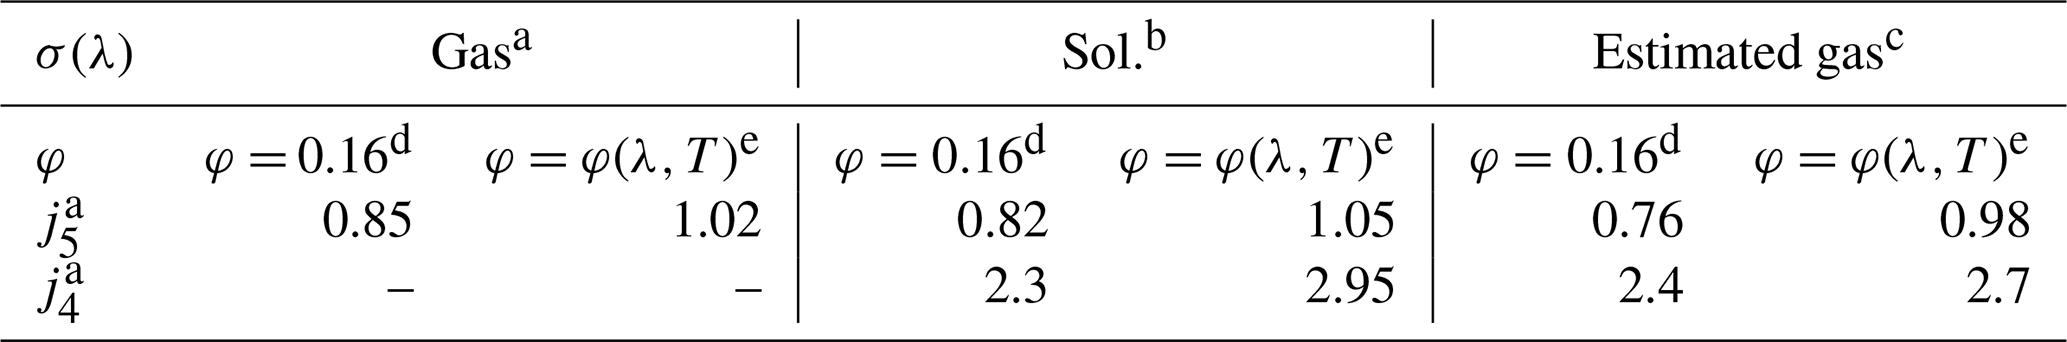
The integrated photolysis rate coefficient calculated via Eq. (2) (φ= 0.16) for PCO gives a value of j4= 2.4 × 10⁻⁶ s−1 in the considered conditions, using σ4(λ) values from the UV–Vis spectrum recorded in cyclohexane, scaled by the solution-to-gas scaling f0.93, determined as described above. Calculation of j for MEK leads to quite a different result (Fig. 6), with j5= 0.8 × 10⁻⁶ s−1 estimated using the cross-sections determined in this work (see Fig. S6 in the Supplement) and j5= 0.9 × 10⁻⁶ s−1, determined using cross-sections from Martinez et al. (1992) (Fig. 6). Photolysis rates were also calculated using the parameterised ϕ(λ, [M], T) formulated by Romero et al. (2005). Using the parameterised quantum yield leads to fairly similar results, with λ-dependent values larger than MCM values by a factor ∼ 1.2. Table 2 summarises the results obtained from all the available cross-sections and quantum yields. All these values are in reasonable agreement with the j5= 1.3 × 10⁻⁶ s−1 calculated according to the MCM parameterisation at a similar zenith angle (Saunders et al., 2003).
Table 2Summary of j values estimated for Reactions (R4) and (R5).
a j values estimated for conditions of ϑ=
60∘ and 350 DU from the NCAR (TUV) Radiation Model.
b
Gas-phase σ(λ) by Martinez et al. (1992). c Solution-phase σ(λ) determined in this
work in cyclohexane.
d Scaled σ(λ) calculated
scaling the solution-phase values by a factor 0.93, estimated from the ratio
between the integrated gas and solution MEK spectra.
e j values calculated for (275–380 nm) ϕ = 0.16, a
constant average value estimated by Pinho et al. (2005).
f j values estimated for , the
parameterised quantum yield formulated by Romero et al. (2005), calculated over the wavelength range 280–335 and at T= 296 K.
3.5 Discussion
The study of Reactions (R1) and (R2) via PLP-LIF to determine the rate coefficients of these reactions led to the values reported above with their (statistical only) standard error. Considering the systemic errors, we quote more realistic values of k1(296 K) = (1.2 ± 0.2) × 10−12 cm3 molec.−1 s−1 and k2(296 K) = (1.3 ± 0.2) × 10−12 cm3 molec.−1 s−1, which take into account the error over the estimation of [VOC]. Both k1 and k2 are in good agreement with the literature data by Wallington and Kurylo (1987a) and by Wallington et al. (2001). Whilst this agreement was pleasing, all three studies used similar PLP methods and thus have a similar reliance on [VOC] measurements; confirmation of these results by, for example, the relative rate technique would be worthwhile in future. These results are also in agreement with the rate coefficients estimated via the structure–activity relationship (SAR) method elaborated by Jenkin et al. (2018) (Table 2). In addition, SAR product distribution for Reaction (R1) is in accordance with the one observed by Wallington and Kurylo (1987a) and recommended by the MCM (Master Chemical Mechanism; Jenkin et al., 2003; Saunders et al., 2003), which indicates Reaction (R1b) as the dominant route (Fig. 1, Table 3).
Table 3Summary of k1 and k2 expressed in units of 10−12 cm3 molec.−1 s−1 and branching ratios.
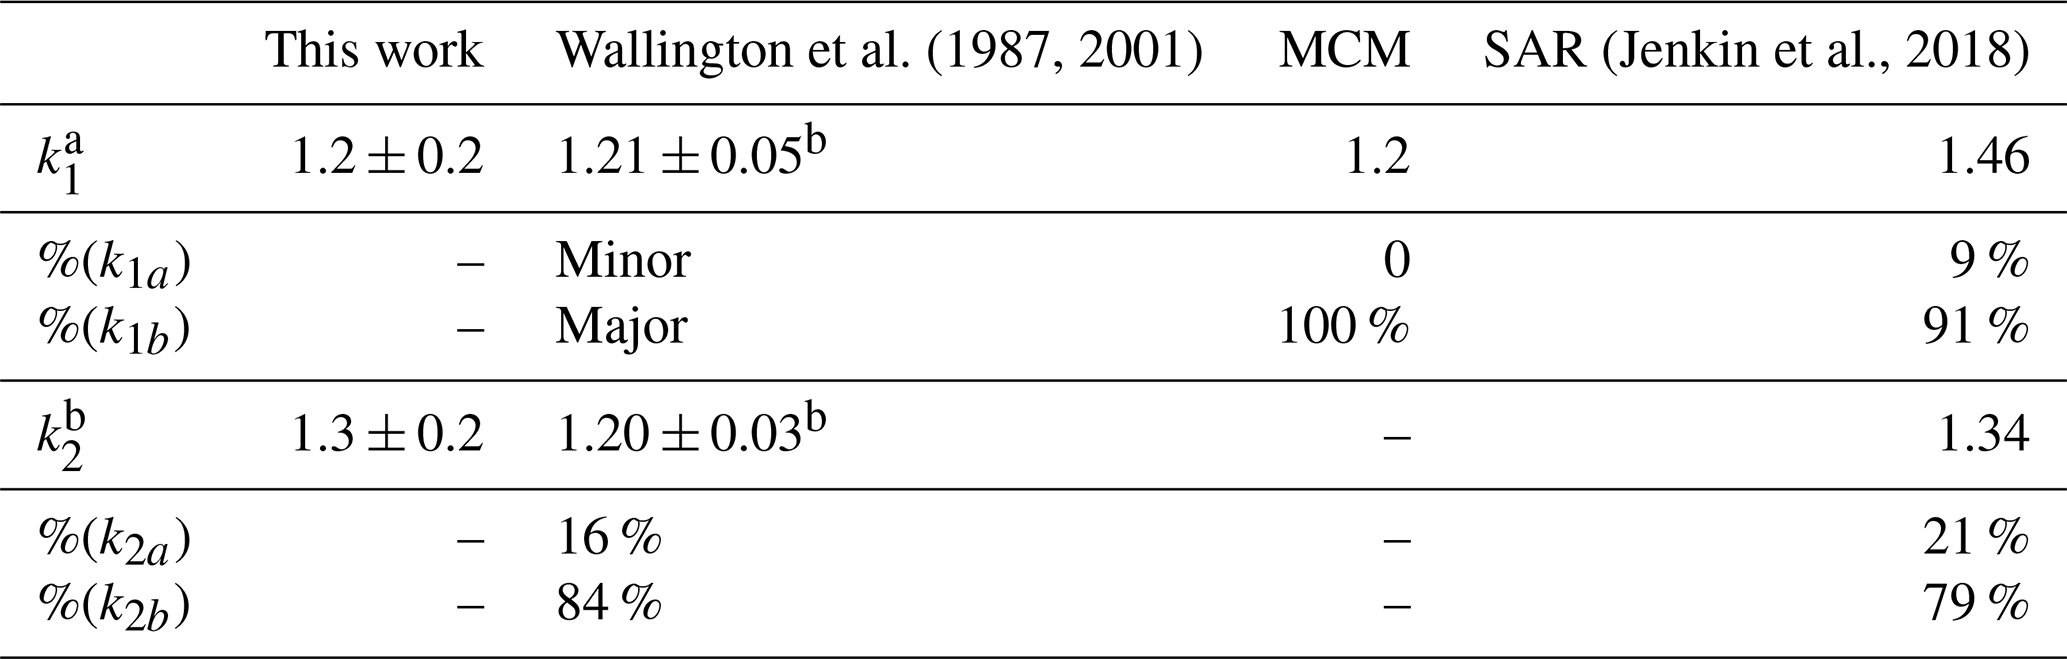
a All k values were recorded at ambient T. b Wallington and Kurylo (1987a). c Wallington et al. (2001). See Supplement for SAR calculation. dk1a and k1b and k2a and k2b refer to Fig. 1.
However, as is evident in Figs. 3 and 4, the temperature dependence of the SAR predictions is still unable to predict those observed experimentally for those two OVOC reactions. In the case of MPA, where results from this work together with literature data from Wallington et al. (2001) reveal a “U-shaped” non-Arrhenius k(T) described by a four-parameter expression, the SAR would appear to underestimate the relative importance of the conventional Arrhenius-like contribution to the overall k(T), especially at T > 300 K. The SAR does appear to account for the complex non-Arrhenius behaviour at lower temperatures, where direct H abstraction is slow, and the reaction proceeds (by analogy with similar OH + OVOC reactions) via formation of six-membered ring complexes featuring a hydrogen bond between the carbonyl function and the OH radical. Jenkin et al. (1998) do note that additional rate coefficient data would be highly valuable for further evaluation and the constraining of the SARs for OVOC and multifunctional species.
For OH + PCO (Reaction R1), the experimental results have not provided enough evidence for any complex non-Arrhenius temperature dependence; experiments at lower temperature may yet bring further clarification. The k(T) values from SAR so predict a non-Arrhenius trend similar to the one calculated for MPA, somewhat different from the experimental results, although in reasonable agreement in ambient temperature. Some caution should therefore be exercised when using the SAR to estimate product yields for Reactions (R1)–(R2), even at T ≈ 298 K, where the SAR appears to predict accurate k values but potentially for the wrong reasons.
The lack of absorption cross-section and quantum yield data for many oxygenated organic molecules is an obstacle to the estimation of photolysis rates. Here, UV–Vis spectra of PCO and MPA were recorded in the actinic light range (λ > 290 nm) to help clarify the role of photolysis as an alternative (to OH reaction) removal path to oxidation. Cyclohexane was selected as a solvent for these solution-phase spectra (Nakashima et al., 1982); tests on the well-characterised molecule indicate that such solution-phase spectra can provide reasonable approximation of the gas-phase equivalent spectra, with a minor overestimation of the gas-phase values (see Fig. 5). Our UV–Vis results indicate a ratio of 0.93 between the integrated gas-phase spectrum by Martinez et al. (1992) and the one recorded in solution in this work (See Supplement) in the spectral range 300–330 nm. Computational photochemistry calculations validated the experimental results, confirming an apparently systematic increase in photoabsorption when measuring the cross-section in a cyclohexane solution. More precisely, a similar factor of 0.86:1 was calculated via NEA for the gas-phase spectra to the solution-phase spectra.
Table 4Lifetime and POCPE for PCO and MPA.
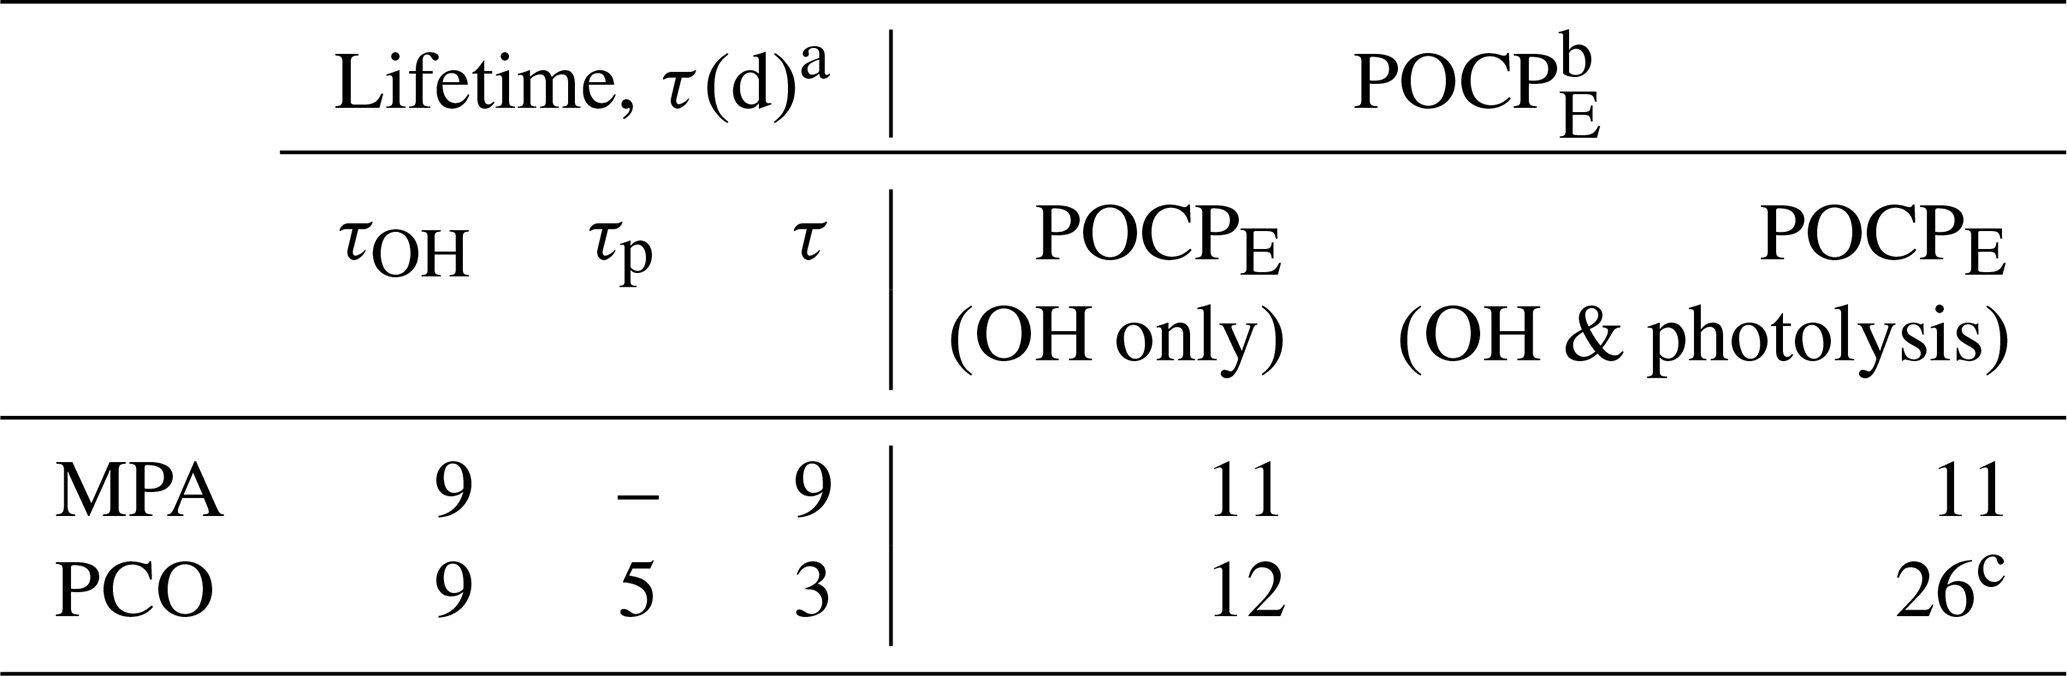
a Atmospheric lifetime (τ) estimated using Eq. (4),
based upon k(296 K) from this work and a value of [OH] = 1.13 × 10⁶ molec. cm−3 (Lelieveld et al., 2016).
b POCPE estimated according to the method by Jenkin et al. (2017); see Supplement for more information.
c Does not take into
account larger j4 values and uses the formula by Jenkin et al. (2017) based on σ5(λ) and φ5(λ).
Assuming then that PCO has a similar behaviour to that observed for MEK, absorption cross-sections recorded in cyclohexane solution may be used in photolysis rate determinations. In the absence of any quantum yield data for PCO, a value of ϕ= 0.16, the quantum yield used for MEK by the MCM, was used here. However, σ4(290–330 nm) values were more intense than σ5(290–330 nm), and the peak was significantly red-shifted (see Fig. 5) to wavelengths where light is abundant in the troposphere. Using the σ4 photolysis rate determined in this work for PCO, we estimated j4= 2.4 × 10⁻⁶ s−1 (Fig. S6), and applying a scaling factor of 0.93 to σ4(λ), we estimated a very similar value of j4= 2.4 × 10⁻⁶ s−1 (Fig. 6). Accordingly, PCO shows a significantly larger photolysis rate than the one estimated for MEK under similar atmospheric conditions (Fig. 6), with j5= 0.9 × 10⁻⁶ s−1. As a confirmation, the spectra recorded in silico for PCO and MEK describe a similar trend, as illustrated in Fig. 5.
Clearly the use of MEK as proxy for PCO in the MCM and other chemical models is not satisfactory and is likely to lead to an underestimation of the role of photolysis as regards PCO degradation. The lack of φ(λ) data means that a more accurate evaluation of the photolysis rate is not possible.
The atmospheric chemistry of PCO and MPA has been investigated and compared to the limited number of previous studies. Both MPA and PCO react slowly with OH when compared to toluene, which reacts with OH about 5 times faster than either of these oxygenates (Mellouki et al., 2021).
From determinations of k1(296 K) and k2(296 K) in this work, we have estimated lifetimes (Eq. 3) for PCO and MPA with respect to reaction with OH in the troposphere:
Using a mean tropospheric [OH] = 1.13 × 10⁶ molec. cm−3 (Lelieveld et al., 2016), the calculated lifetime with respect to OH is 9 d for PCO and 9 d for MPA. These lifetimes suggest a relatively low atmospheric reactivity, especially when compared to toluene (τ= 2 d), and may allow for some dispersal or the primary emission prior to formation of ozone and other secondary pollutants. As discussed above, the UV–visible spectrum of MPA suggests that photolysis in the troposphere (λ > 290 nm) is not significant, and the main chemical loss process is therefore reaction with OH. By contrast, PCO absorbs light at 290 nm and above (Fig. 5) and hence (by analogy to the known photochemistry of other ketones) will incur photolysis losses. The photolysis rate estimated in this work (j4= 2.4 × 10⁻⁶ s−1), using the scaled solution-phase cross-section data and the quantum yield recommended by the MCM, produces a lifetime of 5 d with respect to photolysis (τp) under the selected atmospheric conditions. Overall, the lifetime of PCO can be estimated using Eq. (4), shortening τ to 3 d (Table 4).
Although this result strongly depends on the atmospheric conditions considered, and despite the acknowledged uncertainty on the estimation of j because of lack of gas-phase absorption cross-section and quantum yield data, this shorter lifetime indicates how photolysis represents an important process for PCO and may outcompete reaction with OH as a removal pathway.
Photochemical parameters obtained in this work can further be used in chemical models and in calculations of estimated photochemical ozone creation potential (POCPE) values for environmental assessments. The method was introduced by Jenkin et al. (2017) to take size and structural features of the molecule, reactivity with OH, and the presence of suitable chromophores into account. Here, POCPE values for north-western European conditions were calculated for PCO and MPA (Table 4) using photochemical data determined in this work. The value of POCPE= 11 for MPA may be quoted with some confidence, given the good agreement in rate coefficients determined here and in previous work and the absence of an active chromophore at relevant wavelengths. By contrast, three scenarios were considered for PCO, given the remaining uncertainties in the rate of Reaction (R4). First, following the guidance in Jenkin et al. (2017), whereby one single value is recommended to account for photolysis of all aliphatic ketones, we calculated POCPE= 26 for PCO. However, this photolysis parameter appears to be based upon cross-section and quantum yield values from the MCM, determined for photolysis of MEK (Reaction R5). We cannot rule out that the (unmeasured) quantum yields for PCO photolysis are smaller than 0.16. T dependence of φ should also be considered and investigated, and considering only room temperature φ may lead to overestimation, as pointed out by Romero et al. (2005); in our second scenario we estimate that a consequently small value of POCPE= 12 may be appropriate (φ= 0, so no photolysis; OH loss only). A third scenario would account for the enhanced rate of photolysis of PCO due to the more intense and red-shifted σ4(λ) determined in this work and/or a higher quantum yield (0.16 < φ < 1). However, a quantitative evaluation of this consequently enhanced POCPE > 26 is beyond the scope of this work and would require detailed modelling studies.
Comparing these POCPE values to traditional hydrocarbon solvents that MPA and PCO are meant to replace (Byrne et al., 2018), these sustainable and non-toxic solvents show a much lower POCPE. Toluene, for instance, has a POCPE of 45, which greatly exceeds the POCPE scenarios estimated for PCO and MPA. Taken together, results from this work and elsewhere suggest that MPA has a moderate reactivity in the troposphere. PCO is likely more reactive due to photolysis (Reaction R4). Even if significant uncertainties remain regarding PCO photochemistry, the use of both PCO and MPA would appear to have several advantages and to not adversely impact air quality when compared to traditional harmful and non-sustainable solvents.
The Gaussian16 program (Frisch et al., 2016) can be found at https://gaussian.com/gaussian16/. The NewtonX program (Barbatti, 2013) can be downloaded at https://newtonx.org/download/.
Underlying data are available in the Supplement.
The supplement related to this article is available online at: https://doi.org/10.5194/acp-23-7767-2023-supplement.
Laser-based experiments were designed by TJD and conducted by CM, ÚEH, JKD and TJD. UV–Vis experiments were conducted by CM, ATR and ARR. Quantum chemical calculations were carried out by BFEC and DH. The manuscript was written by CM, BFEC and TJD with assistance from other authors. TJD, FB and CRM conceived of the overall project.
The contact author has declared that none of the authors has any competing interests.
Publisher’s note: Copernicus Publications remains neutral with regard to jurisdictional claims in published maps and institutional affiliations.
Caterina Mapelli thanks the Dept. of Chemistry at York for a PhD scholarship. The authors thank Sacha Madronich (Atmospheric Chemistry Observations and Modeling Laboratory, National Center for Atmospheric Research, Boulder, CO, USA) for the reference actinic flux calculations. David Pugh is thanked for giving access to the UV–Visible spectrometer. The authors thank the York Technical Support team, in particular Danny Shaw, Abby Mortimer, Mark Roper, Stuart Murray and Chris Rhodes. Andrew Rickard acknowledges support provided by the UK NERC National Centre for Atmospheric Science (NCAS) Air Pollution Science Programme.
This project has received funding from the European Research Council (ERC) under the European Union's Horizon 2020 Research and Innovation programme (grant no. 803718, project SINDAM) and the EPSRC grant EP/V026690/1.
This paper was edited by Ivan Kourtchev and reviewed by two anonymous referees.
Atkinson, R., Baulch, D. L., Cox, R. A., Crowley, J. N., Hampson, R. F., Hynes, R. G., Jenkin, M. E., Rossi, M. J., Troe, J., and IUPAC Subcommittee: Evaluated kinetic and photochemical data for atmospheric chemistry: Volume II – gas phase reactions of organic species, Atmos. Chem. Phys., 6, 3625–4055, https://doi.org/10.5194/acp-6-3625-2006, 2006.
Barbatti, M.: NEWTON-X a package for Newtonian dynamics close to the crossing seam Documentation based on NEWTON-X version 1.4, Technical report, https://doi.org/10.13140/2.1.4713.0561, 2013 (code available at: https://newtonx.org/download/).
Barbatti, M., Ruckenbauer, M., Plasser, F., Pittner, J., Granucci, G., Persico, M., and Lischka, H.: Newton-X: a surface-hopping program for nonadiabatic molecular dynamics, WIREs Comp. Mol. Science, 4, 26–33, https://doi.org/10.1002/wcms.1158, 2014.
Brewer, J. F., Papanastasiou, D. K., Burkholder, J. B., Fischer, E. V., Ren, Y., Mellouki, A., and Ravishankara, A. R.: Atmospheric Photolysis of Methyl Ethyl, Diethyl, and Propyl Ethyl Ketones: Temperature-Dependent UV Absorption Cross Sections, J. Geophys. Res., 124, 5906–5918, https://doi.org/10.1029/2019JD030391, 2019.
Byrne, F., Forier, B., Bossaert, G., Hoebers, C., Farmer, T. J., Clark, J. H., and Hunt, A. J.: 2,2,5,5-Tetramethyltetrahydrofuran (TMTHF): a non-polar, non-peroxide forming ether replacement for hazardous hydrocarbon solvents, Green Chem., 19, 3671–3678, https://doi.org/10.1039/C7GC01392B, 2017.
Byrne, F. P., Jin, S., Paggiola, G., Petchey, T. H. M., Clark, J. H., Farmer, T. J., Hunt, A. J., Robert McElroy, C., and Sherwood, J.: Tools and techniques for solvent selection: green solvent selection guides, Sustain. Chem. Process., 4, 7, https://doi.org/10.1186/s40508-016-0051-z, 2016.
Byrne, F. P., Forier, B., Bossaert, G., Hoebers, C., Farmer, T. J., and Hunt, A. J.: A methodical selection process for the development of ketones and esters as bio-based replacements for traditional hydrocarbon solvents, Green Chem., 20, 4003–4011, https://doi.org/10.1039/C8GC01132J, 2018.
Calvert, J. G., Atkinson, R., Becker, K. H., Kamens, R. M., Seinfeld, J. H., Wallington, T. J., and Yarwood, G.: The mechanisms of atmospheric oxidation of aromatic hydrocarbons, New York, Oxford University Press ISBN 9780195146288, 2002.
Calvert, J. G., Mellouki, A., Orlando, J. J., Pilling, M. J., and Wallington, T. J.: The mechanism of atmospheric oxidation of the oxygenates, Oxford University Press ISBN 978-0-19-976707-6, 2011.
Cammi, R., Mennucci, B., and Tomasi, J.: Fast Evaluation of Geometries and Properties of Excited Molecules in Solution: A Tamm-Dancoff Model with Application to 4-Dimethylaminobenzonitrile, J. Phys. Chem. A, 104, 5631–5637, https://doi.org/10.1021/jp000156l, 2000.
Carr, S. A., Baeza-Romero, M. T., Blitz, M. A., Price, B. J. S., and Seakins, P. W.: Ketone photolysis in the presence of oxygen: A useful source of OH for flash photolysis kinetics experiments, Int. J. Chem. Kinet., 40, 504–514, https://doi.org/10.1002/kin.20330, 2008.
Chai, J.-D. and Head-Gordon, M.: Long-range corrected hybrid density functionals with damped atom–atom dispersion corrections, Phys. Chem. Chem. Phys., 10, 6615–6620, https://doi.org/10.1039/B810189B, 2008.
Chimichi, S. and Mealli, C.: A description of the effects of silyl vs. alkyl substituents in ketones in the light of oxygen-17 NMR data and with the help of qualitative MO theory, J. Molec. Struct., 271, 133–148, https://doi.org/10.1016/0022-2860(92)80216-5, 1992.
Clarke, C. J., Tu, W.-C., Levers, O., Bröhl, A., and Hallett, J. P.: Green and Sustainable Solvents in Chemical Processes, Chem. Rev., 118, 747–800, https://doi.org/10.1021/acs.chemrev.7b00571, 2018.
Crespo-Otero, R. and Barbatti, M.: Spectrum simulation and decomposition with nuclear ensemble: formal derivation and application to benzene, furan and 2-phenylfuran, Theor. Chem. Acc., 131, 1237, https://doi.org/10.1007/s00214-012-1237-4, 2012.
Dillon, T. J., Holscher, D., and Sivakumaran, V.: Kinetics of the reactions of HO with methanol (210–351 K) and with ethanol (216–368 K), Phys. Chem. Chem. Phys., 7, 349–355, https://doi.org/10.1039/b413961e, 2005.
Frisch, M. J., Trucks, G. W., Schlegel, H. B., Scuseria, G. E., Robb, M. A., Cheeseman, J. R., Scalmani, G., Barone, V., Petersson, G. A., Nakatsuji, H., Li, X., Caricato, M., Marenich, A. V., Bloino, J., Janesko, B. G., Gomperts, R., Mennucci, B., Hratchian, H. P., Ortiz, J. V., Izmaylov, A. F., Sonnenberg, J. L., Williams-Young, D., Ding, F. L., Egidi, F., Goings, J., Peng, B., Petrone, A., Henderson, T., Ranasinghe, D., Zakrzewski, V. G., Gao, J., Rega, N., Zheng, G., Liang, W., Hada, M., Ehara, M., Toyota, K., Fukuda, R., Hasegawa, J., Ishida, M., Nakajima, T., Honda, Y., Kitao, O., Nakai, H., Vreven, T., Throssell, K., Montgomery Jr., J. A., Peralta, J. E., Ogliaro, F., Bearpark, M. J., Heyd, J. J., Brothers, E. N., Kudin, K. N., Staroverov, V. N., Keith, T. A., Kobayashi, R., Normand, J., Raghavachari, K., Rendell, A. P., Burant, J. C., Iyengar, S. S., Tomasi, J., Cossi, M., Millam, J. M., Klene, M., Adamo, C., Cammi, R., Ochterski, J. W., Martin, R. L., Morokuma, K., Farkas, O., Foresman, J. B., and Fox, D. J.: Gaussian 16, Rev. B.01, Inc. Wallingford CT, Gaussian [code], https://gaussian.com/gaussian16/, 2016.
Hess, W. P. and Tully, F. P.: Catalytic conversion of alcohols to alkenes by OH, Chem. Phys. Lett., 152, 183–189, https://doi.org/10.1016/0009-2614(88)87352-4, 1988.
Hess, W. P. and Tully, F. P.: Hydrogen-Atom Abstraction from Methanol by OH, J. Am. Chem. Soc., 93, 1944–1947, 1989.
Jenkin, M. E., Saunders, S. M., and Pilling, M. J.: The tropospheric degradation of volatile organic compounds: A protocol for mechanism development, Atmos. Environ., 31, 81–104, https://doi.org/10.1016/s1352-2310(96)00105-7, 1997.
Jenkin, M. E., Saunders, S. M., Wagner, V., and Pilling, M. J.: Protocol for the development of the Master Chemical Mechanism, MCM v3 (Part B): tropospheric degradation of aromatic volatile organic compounds, Atmos. Chem. Phys., 3, 181–193, https://doi.org/10.5194/acp-3-181-2003, 2003.
Jenkin, M. E., Derwent, R. G., and Wallington, T. J.: Photochemical ozone creation potentials for volatile organic compounds: Rationalization and estimation, Atmos. Environ., 163, 128–137, https://doi.org/10.1016/j.atmosenv.2017.05.024, 2017.
Jenkin, M. E., Valorso, R., Aumont, B., Rickard, A. R., and Wallington, T. J.: Estimation of rate coefficients and branching ratios for gas-phase reactions of OH with aliphatic organic compounds for use in automated mechanism construction, Atmos. Chem. Phys., 18, 9297–9328, https://doi.org/10.5194/acp-18-9297-2018, 2018.
Jiménez, E., Gilles, M. K., and Ravishankara, A. R.: Kinetics of the reactions of the hydroxyl radical with CH3OH and C2H5OH between 235 and 360 K, J. Photochem. Photobio A, 157, 237–245, https://doi.org/10.1016/S1010-6030(03)00073-X, 2003.
Jones, L., Garland, L., Szanto, C., and King, K.: Air Pollutant Inventories for England, Scotland, Wales, and Northern Ireland: 2005–2019, edited by: National Atmospheric Emissions Inventory, 7–15, 2021.
Lelieveld, J., Gromov, S., Pozzer, A., and Taraborrelli, D.: Global tropospheric hydroxyl distribution, budget and reactivity, Atmos. Chem. Phys., 16, 12477–12493, https://doi.org/10.5194/acp-16-12477-2016, 2016.
Liu, C., Xiang, X., Wan, Y., Yang, J., Li, Y., Zhang, X., Qi, Z., He, L., Liu, W., and Li, X.: Design, Synthesis and Structure-Activity Relationship of Novel Pinacolone Sulfonamide Derivatives against Botrytis cinerea as Potent Antifungal Agents, Molecules, 27, 5468, https://doi.org/10.3390/molecules27175468, 2022.
Madronich, S. and Flocke, S.: Theoretical estimation of biologically effective UV radiation at the Earth's surface, in: Solar ultraviolet radiation, Springer, Berlin, Heidelberg, 23–48, https://doi.org/10.1007/978-3-662-03375-3_3, 1997.
Mapelli, C., Schleicher, J. V., Hawtin, A., Rankine, C. D., Whiting, F. C., Byrne, F., McElroy, C. R., Roman, C., Arsene, C., Olariu, R. I., Bejan, I. G., and Dillon, T. J.: Atmospheric breakdown chemistry of the new “green” solvent 2,2,5,5-tetramethyloxolane via gas-phase reactions with OH and Cl radicals, Atmos. Chem. Phys., 22, 14589–14602, https://doi.org/10.5194/acp-22-14589-2022, 2022.
Master Chemical Mechanism: http://mcm.leeds.ac.uk/MCM, last access: 12 December 2022.
Martinez, R. D., Buitrago, A. A., Howell, N. W., Hearn, C. H., and Joens, J. A.: The near U.V. absorption spectra of several aliphatic aldehydes and ketones at 300 K, Atmos. Environ. A-Gen., 26, 785–792, https://doi.org/10.1016/0960-1686(92)90238-G, 1992.
Mellouki, A., Ammann, M., Cox, R. A., Crowley, J. N., Herrmann, H., Jenkin, M. E., McNeill, V. F., Troe, J., and Wallington, T. J.: Evaluated kinetic and photochemical data for atmospheric chemistry: volume VIII – gas-phase reactions of organic species with four, or more, carbon atoms (≥ C4), Atmos. Chem. Phys., 21, 4797–4808, https://doi.org/10.5194/acp-21-4797-2021, 2021.
Montero-Montoya, R., López-Vargas, R., and Arellano-Aguilar, O.: Volatile Organic Compounds in Air: Sources, Distribution, Exposure and Associated Illnesses in Children, Ann. Glob. Health, 84, 225–238, https://doi.org/10.29024/aogh.910, 2018.
Nakashima, K., Uchida-Kai, K., Koyanagi, M., and Kanda, Y.: Solvent Effect on the Intensities of Forbidden Bands of Molecules, B. Chem. Soc. Jpn., 55, 415–419, 1982.
Pinho, P. G., Pio, C. A., and Jenkin, M. E.: Evaluation of isoprene degradation in the detailed tropospheric chemical mechanism, MCM v3, using environmental chamber data, Atmos. Environ., 39, 1303–1322, https://doi.org/10.1016/j.atmosenv.2004.11.014, 2005.
Pocker, Y., Ronald, B. P., and Anderson, K. W.: Epoxides in vicinal diol dehydration. 7. A mechanistic characterization of the spontaneous ring opening process of epoxides in aqueous solution: kinetic and product studies, J. Am. Chem. Soc., 110, 6492–6497, https://doi.org/10.1021/ja00227a033, 1988.
Prlj, A., Marsili, E., Hutton, L., Hollas, D., Shchepanovska, D., Glowacki, D. R., Slavíček, P., and Curchod, B. F. E.: Calculating Photoabsorption Cross-Sections for Atmospheric Volatile Organic Compounds, ACS Earth Space Chem., 6, 207–217, https://doi.org/10.1021/acsearthspacechem.1c00355, 2022.
Raber, W. H. and Moortgat, G. K.: Photooxidation of selected carbonyl compounds in air: methyl ethyl ketone, methyl vinyl ketone, methacrolein and methylglyoxal, in: Progress and Problems in Atmospheric Chemistry, 318–373, https://doi.org/10.1142/9789812831712_0009, 1995.
Romero, M. T., Blitz, M. A., Heard, D. E., Pilling, M. J., Price, B., Seakins, P. W., and Wang, L.: Photolysis of methylethyl, diethyl and methylvinyl ketones and their role in the atmospheric HOx budget, Faraday Discuss., 130, 73–88, https://doi.org/10.1039/b419160a, 2005.
Sarkar, R., Boggio-Pasqua, M., Loos, P.-F., and Jacquemin, D.: Benchmarking TD-DFT and Wave Function Methods for Oscillator Strengths and Excited-State Dipole Moments, J. Chem. Theory Comput., 17, 1117–1132, https://doi.org/10.1021/acs.jctc.0c01228, 2021.
Saunders, S. M., Jenkin, M. E., Derwent, R. G., and Pilling, M. J.: Protocol for the development of the Master Chemical Mechanism, MCM v3 (Part A): tropospheric degradation of non-aromatic volatile organic compounds, Atmos. Chem. Phys., 3, 161–180, https://doi.org/10.5194/acp-3-161-2003, 2003.
Tsai, W.-T.: Environmental hazards and health risk of common liquid perfluoro-n-alkanes, potent greenhouse gases, Environ. Int., 35, 418–424, https://doi.org/10.1016/j.envint.2008.08.009, 2009.
Vasvári, G., Szilágyi, I., Bencsura, Á., Dóbé, S., Bérces, T., Henon, E., Canneaux, S., and Bohr, F.: Reaction and complex formation between OH radical and acetone, Phys. Chem. Chem. Phys., 3, 551–555, https://doi.org/10.1039/B009601F, 2001.
Wallington, T. J. and Kurylo, M. J.: Flash photolysis resonance fluorescence investigation of the gas-phase reactions of hydroxyl radicals with a series of aliphatic ketones over the temperature range 240–440 K, J. Phys. Chem., 91, 5050–5054, https://doi.org/10.1021/j100303a033, 1987a.
Wallington, T. J. and Kurylo, M. J.: The gas phase reactions of hydroxyl radicals with a series of aliphatic alcohols over the temperature range 240–440 K, Int. J. Chem. Kinet., 19, 1015–1023, https://doi.org/10.1002/kin.550191106, 1987b.
Wallington, T. J., Ninomiya, Y., Mashino, M., Kawasaki, M., Orkin, V. L., Huie, R. E., Kurylo, M. J., Carter, W. P. L., Luo, D., and Malkina, I. L.: Atmospheric Oxidation Mechanism of Methyl Pivalate, (CH3)3CC(O)OCH3, J. Phys. Chem. A, 105, 7225–7235, 10.1021/jp010308s, 2001.
Weigend, F. and Ahlrichs, R.: Balanced basis sets of split valence, triple zeta valence and quadruple zeta valence quality for H to Rn: Design and assessment of accuracy, Phys. Chem. Chem. Phys., 7, 3297–3305, https://doi.org/10.1039/B508541A, 2005.
Winterton, N.: The green solvent: a critical perspective, Clean Technol. Envir., 23, 2499–2522, https://doi.org/10.1007/s10098-021-02188-8, 2021.
Wollenhaupt, M., Carl, S. A., Horowitz, A., and Crowley, J. N.: Rate Coefficients for Reaction of OH with Acetone between 202 and 395 K, J. Phys. Chem. A, 104, 2695–2705, https://doi.org/10.1021/jp993738f, 2000.
Zhang, R. M., Truhlar, D. G., and Xu, X.: Kinetics of the Toluene Reaction with OH Radical, Research, 2019, 5373785, https://doi.org/10.34133/2019/5373785, 2019.
greensafer solvents which present favourable advantages when compared to traditional solvents. Since the assessment of these green solvents often lacks air quality considerations, this study aims to understand the behaviour of these compounds, investigating their reactivity in the troposphere.