the Creative Commons Attribution 4.0 License.
the Creative Commons Attribution 4.0 License.
 | 14 Nov 2022
What caused ozone pollution during the 2022 Shanghai lockdown? Insights from ground and satellite observations
Yue Tan
Shanghai, one of China's most important economic centres, imposed a citywide lockdown in April and May 2022 to contain a resurgence in cases of the coronavirus disease in 2019. Compared with the 2020 lockdown, the 2022 lockdown occurred in a warm season and lasted much longer, thereby serving as a relevant real-world test of the response of ambient ozone (O3) concentrations to emission reductions in a high-O3 season. In this study, we analysed surface observations of O3 and nitrogen dioxide (NO2) concentrations and satellite-retrieved tropospheric NO2 and formaldehyde (HCHO) column concentrations in the first 5 months of 2022 with comparisons to the year 2021. During the 2-month 2022 lockdown, the maximum daily 8 h average (MDA8) O3 concentrations at 1 or more of the city's 19 sites exceeded China's air quality standard of 160 µg m−3 21 times, with the highest value being 200 µg m−3. The city-average MDA8 O3 concentration increased by 13 % in April–May 2022 year-on-year, despite sharp declines in NO2 surface and column concentrations (both by 49 %) and a 19 % decrease in the HCHO column concentration. These results show that the reductions in O3 precursors and other pollutants during the 2022 lockdown did not prevent ground-level O3 pollution. An analysis of meteorological data indicates that there were only small changes in the meteorological conditions, and there was little transport of O3 from the high-O3 inland regions during the 2022 lockdown, neither of which can account for the increased and high concentrations of O3 that were observed during this period. The mean ratio in April–May increased from 1.11 in 2021 to 1.68 in 2022, and the correlation between surface O3 and NO2 concentrations changed from negative in 2021 to positive in 2022. These results indicate that the high O3 concentrations in 2022 were mainly due to large reductions in the emissions of NOx and that the decrease in the concentrations of volatile organic compounds (VOCs) could not overcome the NO titration effect. During the 2022 lockdown, Shanghai's urban centre remained VOC-sensitive despite drastic reductions in road transportation (73 %–85 %) and industrial activities (∼60 %), whereas its semi-rural areas transitioned from VOC-limited to VOC–NOx-co-limited regimes. Our findings suggest that future emission reductions similar to those that occurred during the lockdown, such as those that will result from electrifying transportation, will not be sufficient to eliminate O3 pollution in urban areas of Shanghai and possibly other VOC-limited metropoles without the imposition of additional VOC controls or more substantial decreases in NOx emissions.
- Article
(8369 KB) - Full-text XML
-
Supplement
(1607 KB) - BibTeX
- EndNote


Shanghai is a megacity with over 25 million residents and a land area of 6341 km2. It serves as a financial, transport and logistics centre of mainland China. From 27 March to 1 June 2022, the city imposed a strict 2-month lockdown (LCD) to curb increases in the number of cases of the coronavirus disease in 2019 (COVID-19). Official statistics indicate that both economic activities and human livelihood were severely disrupted by the 2022 Shanghai LCD (hereinafter “2022 LCD”). For example, in April, year-on-year road passenger traffic turnover decreased by 85.5 %, and road cargo turnover decreased by 73.1 % (Shanghai Bureau of Statistics, 2022); total industrial output decreased by 61.6 %, and power generation decreased by 41.7 % (National Bureau of Statistics, 2022); and port cargo throughput at the Port of Shanghai, the world's largest seaport, decreased by 36.5 % (Ministry of Transport of the People's Republic of China, 2022). As Shanghai is the most important transportation and logistics hub of the manufacturing-intensive Yangtze River Delta (YRD) region, the ripple effects of the LCD in Shanghai have disrupted supply chains of its surrounding provinces, other regions of China and the world (Cao et al., 2022; Hale et al., 2022; He, 2022).
Such a reduction in human activity can be expected to drastically decrease emissions of air pollutants, as has been borne out by numerous studies of the 2020 LCD (Wang et al., 2022; Huang et al., 2021; Doumbia et al., 2021). Compared with the 2020 LCD in China, which was imposed in late January–early February, the 2022 LCD in Shanghai was imposed in the high-O3 season and lasted for longer, during which time the O3 concentrations exceeding the air quality standard were frequently observed. In the present study, we aimed to understand how meteorology and non-linear chemistry influenced ground-level O3 concentrations during the 2022 LCD and whether the huge decrease in NOx emission could push a typical volatile organic compound (VOC)-limited megacity to a NOx-limited regime. We first analysed surface observations of O3 and NO2 concentrations and satellite-measured NO2 and HCHO column concentrations to assess changes in the concentrations of these species in Shanghai and its surrounding areas during the 2022 LCD. We then examined the roles of meteorological and chemical conditions in determining O3 concentrations during the 2022 LCD by analysing small- and large-scale meteorological data and chemical indicators of O3 formation regimes. We discuss the implications of our findings for future strategies aimed at reducing O3 concentrations, which is currently the dominant air pollutant in China in warm seasons.
2.1 Surface measurement data
We obtained hourly concentrations of ground-level O3, NO2, and particulate matter of 2.5 µm and smaller (PM2.5) recorded at ∼1700 stations in China during 2019–2022 from the China National Environmental Monitoring Centre (https://quotsoft.net/air/, last access: 5 July 2022). The ambient concentrations of O3, NO2 and PM2.5 are measured by an automated monitoring system at each site and reported to the China National Environmental Monitoring Centre and published online after validation (Wang et al., 2014). O3, NO2 and PM2.5 are measured with UV photometry, chemiluminescence, and micro-oscillating balance or β absorption, respectively, with a detection limit of 2 ppb, 2 ppb and 2 µg m−3, respectively (https://www.mee.gov.cn/, last access: 15 September 2022). The national network has 10 stations in Shanghai in 2019–2020, most of which are situated within the city centre. Since 2021, the number of stations has increased to 20, with most newly added sites located outside the city centre (refer to Figs. 1 and S1 in the Supplement for their locations). (Note there were no data from one site (Dianshanhu) in 2021–2022; thus the data from 19 stations are available for the years 2021 and 2022). The maximum daily 8 h average (MDA8) O3 concentration was calculated for each site as the highest value of the 24 8 h moving average O3 concentrations for a given day. The daily average concentrations of the other pollutants (NO2 and PM2.5) were also calculated from the hourly data. The 14 d moving averages of the surface pollutant concentrations were calculated, as these had fewer fluctuations than daily concentrations and thus better revealed trends. Finally, the daily average mixing ratios of Ox () were calculated to account for the titration effect of nitric oxide (NO) on changes in O3 concentration.
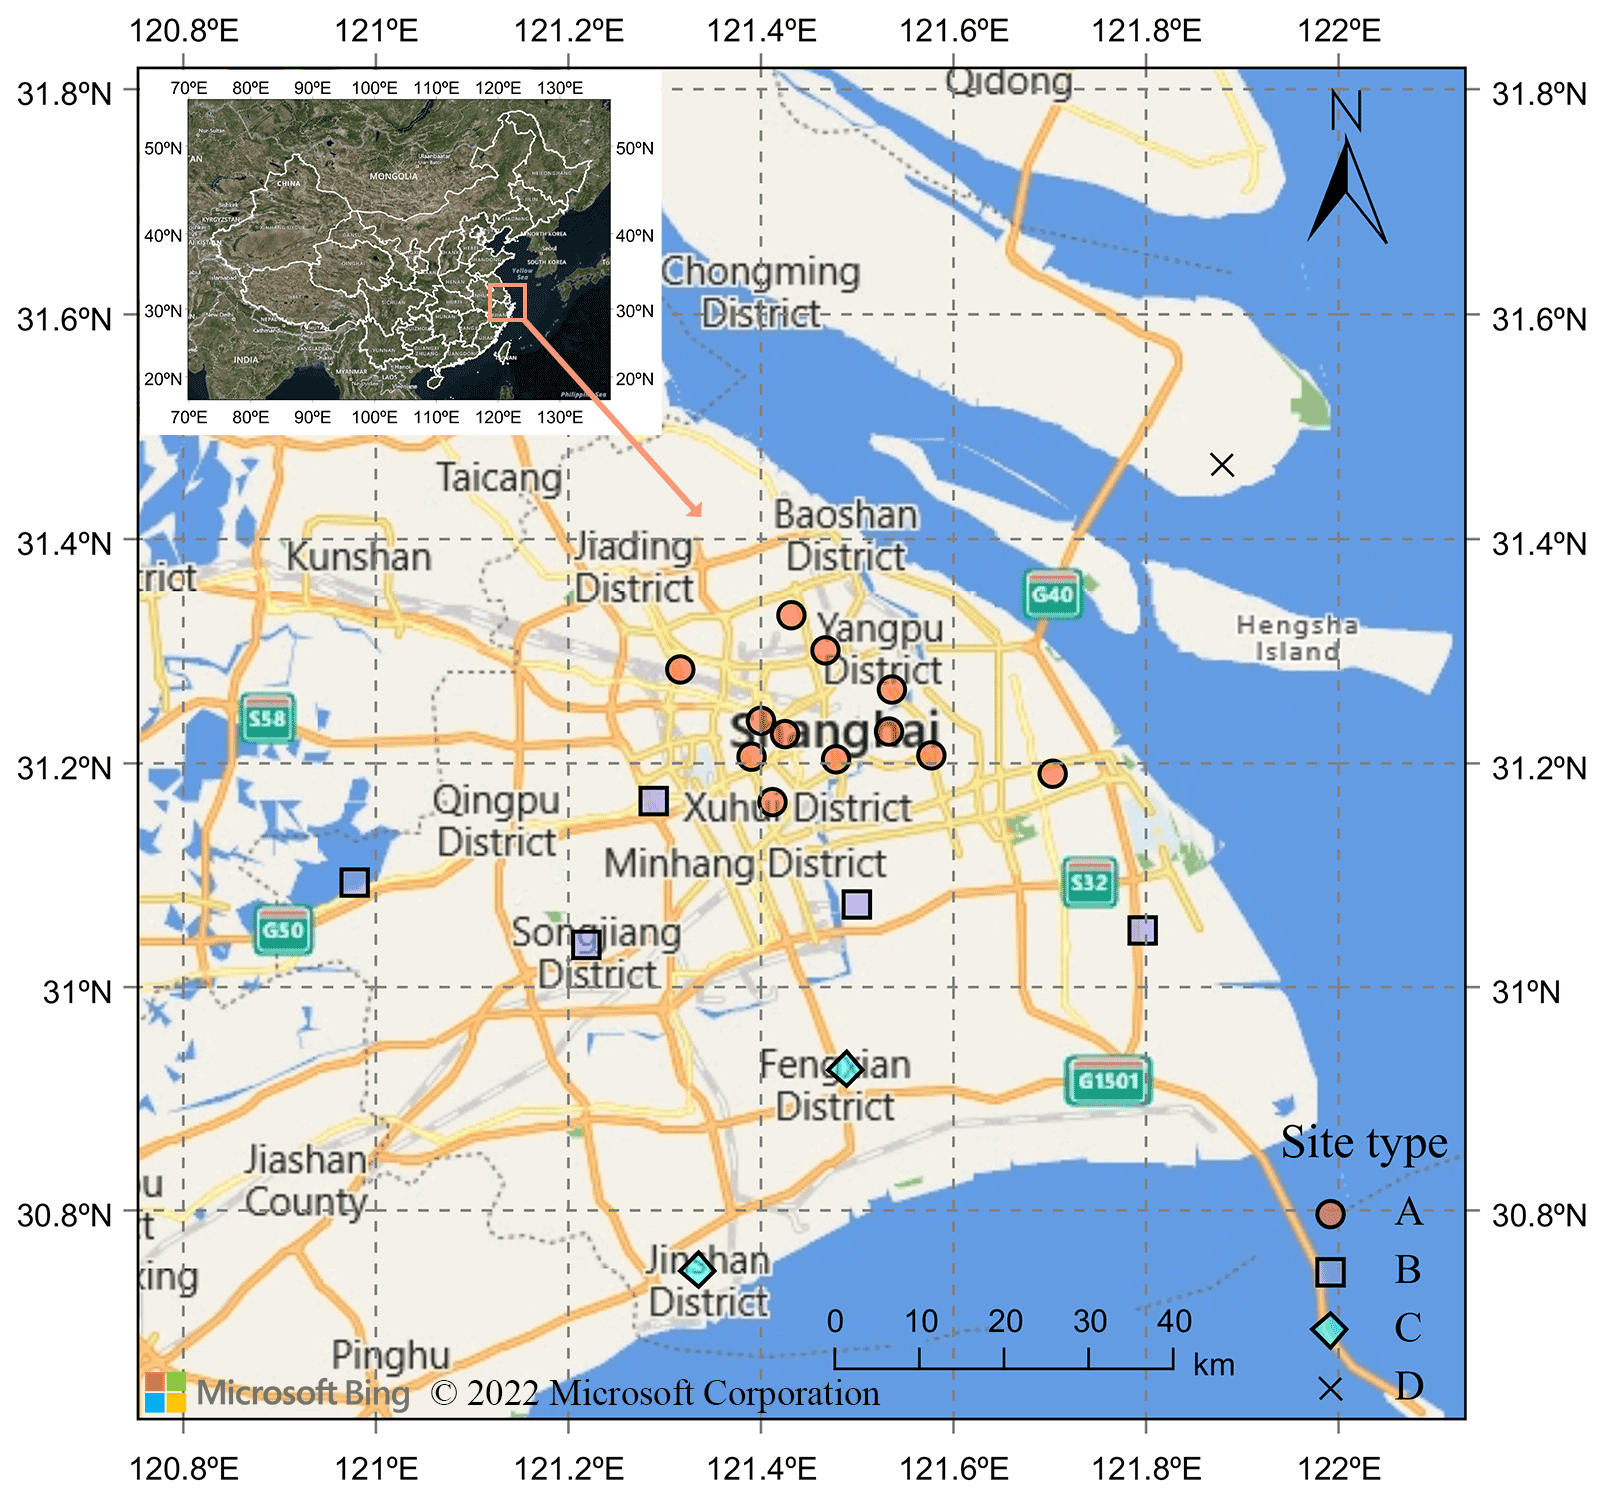
Figure 1Spatial distribution and classification of the 20 environmental monitoring sites in Shanghai. Types A, B, C and D represent sites in the city centre (12 sites, circles), city perimeter (5 sites, squares), semi-rural area (2 sites, diamonds) and the Yangtze River Estuary (1 site, cross), respectively.
2.2 Satellite and meteorological data
Satellite data were used to investigate the spatiotemporal variations in tropospheric formaldehyde (HCHO) and NO2 column concentrations during the 2022 LCD period and the same period in 2021. We obtained Sentinel-5P Level 3 offline products (HCHO and NO2) using the TROPOspheric Monitoring Instrument (TROPOMI) from the Google Earth Engine (GEE; https://earthengine.google.com/, last access: 19 July 2022) cloud-based platform, which is an open-source processing system based on JavaScript (Ghasempour et al., 2021). The Sentinel-5P Level 3 offline products were converted from the original Sentinel-5P Level 2 offline data (at a resolution of 5.5×3.5 km) by GEE using the harpconvert tool (https://cdn.rawgit.com/stcorp/harp/master/doc/html/harpconvert.html, last access: 19 July 2022) and subjected to a data quality control process, in which pixels with data quality values less than 75 % for NO2 and less than 50 % for HCHO were removed. Based on the GEE platform, we imported the daily image collections of HCHO and NO2, cut them in accordance with the administrative boundary shapefiles of Shanghai (generated from publicly available geoscience data on the DataV.GeoAtlas platform; http://datav.aliyun.com/portal/school/atlas/area_generator, last access: 19 July 2022) using a .clip() script (Gorelick et al., 2017), and then averaged the values of all the remaining pixels within the city border to obtain the daily mean concentrations of HCHO and NO2. A similar satellite data processing method was used for the YRD region.
We acquired surface site meteorological data (2 m temperature, 2 m relative humidity (RH), 10 m wind direction and 10 m wind speed) from 78 weather stations in Shanghai during April–May in 2021 and 2022, together with gridded meteorological data (2 m temperature, 1000 hPa RH, downward ultraviolet (UV) radiation at the surface, total cloud cover, total precipitation and boundary layer height) from European Centre for Medium-Range Weather Forecast reanalysis v5 (ERA5) (https://cds.climate.copernicus.eu/cdsapp#!/dataset/reanalysis-era5-single-levels, last access: 12 July 2022; https://cds.climate.copernicus.eu/cdsapp#!/dataset/reanalysis-era5-pressure-levels, last access: 12 July 2022). We calculated monthly averages of the surface-observed meteorological data in 2021 and 2022 and the changes in gridded meteorological data between 2022 and 2021 to determine the spatiotemporal variations in meteorological conditions in Shanghai and its surrounding regions.
2.3 Backward trajectory analysis
The 24 h backward trajectories for Shanghai were calculated at 1 h intervals during April–May 2022 using MeteoInfoMap software (Wang, 2014, 2019) and meteorological data from the Global Data Assimilation System (ftp://arlftp.arlhq.noaa.gov/pub/archives/gdas1/, last access: 18 July 2022). The endpoints of the trajectories were 500 m above ground level of Shanghai (31.23∘ N, 121.47∘ E). Cluster classification was then conducted to divide the trajectories of O3 exceedance days into five groups based on the origins of air mass.
2.4 Site classification and regression analysis
We classified the aforementioned 19 environmental monitoring sites in Shanghai into 4 types based on land use and mean ratios (Figs. 1 and 8b). The type A sites (12 sites) are in the city centre (and almost all are within the Shanghai Outer Ring Expressway) and had the lowest ratios; type B sites are sites in the city perimeter (4 sites) that had moderate ratios; type C sites are semi-rural sites (2 sites) that had the largest ratios; and the type D site (1 site) is located near the wetland park in the East Chongming Tidal Flat and is least affected by urban emissions but may be influenced by ship emissions. Based on the above classification, we conducted regression analyses between the surface MDA8 O3 concentrations and daily mean NO2 concentrations for three types of sites (A, B and C) to examine the O3 formation regime during the 2022 LCD in Shanghai's city centre and city perimeter and at semi-rural sites.
3.1 Spatiotemporal variations in surface MDA8 O3 and NO2 concentrations
Figure 2 presents the MDA8 O3 and daily average NO2 concentrations for the first 5 months of 2021–2022 at the 19 sites in Shanghai. In April–May 2022, the concentrations of NO2, derived largely from fossil-fuel combustion, decreased by 49 % year-on-year, but the average MDA8 O3 concentrations increased by 12.5 %. (In contrast, PM2.5 concentrations fell by 30.3 % in Shanghai; Fig. S2b.) The MDA8 O3 concentrations exceeded 160 µg m−3, which is China's Ambient Air Quality Standard for O3, at 1 or more of the 19 sites on 21 d in April–May 2022, with the highest value being 200 µg m−3. The average Ox (O3+NO2) mixing ratio in April–May 2022 also increased by 2.2 % during the LCD compared with the same period in 2021 (Fig. S2a). These observations indicate that there was significant ground-level O3 pollution in Shanghai during the 2022 LCD, despite the drastic reductions in human activity. The decrease in NO2 concentrations (49 %) during the 2022 LCD was larger than the NO2 decrease during the full-scale LCD phase in 2020 (23 January–12 February), when the average NO2 concentration decreased by 30.5 % from the corresponding period in 2019 (Fig. S3b). During the 2020 LCD, the average MDA8 O3 concentrations in Shanghai increased by 13.8 % but remained far below the ambient O3 concentration standard (Fig. S3a).

Figure 2Temporal variations in surface-level maximum daily 8 h average (MDA8) O3 (a) and NO2 (b) concentrations during the 2022 pre-lockdown (LCD) (1 January to 27 March) and LCD periods (28 March to 31 May) compared with the corresponding periods in 2021. The concentrations are averages from 19 sites in Shanghai. The trend lines represent prior 2-week moving averages. The insert figures show the monthly average concentrations (bars and values indicated by numbers) and standard deviations (error bars). The red background represents the 2022 LCD in Shanghai (SH LCD 2022: 28 March to 31 May). The x-axis labels represent the first day of each month.
Figure 3a–c show the spatial distribution of the MDA8 O3 concentrations in mainland China and the YRD region, which consists of Shanghai and three neighbouring provinces (Jiangsu, JS; Anhui, AH; and Zhejiang, ZJ), and Shanghai during the 2022 LCD, respectively. It can be seen that elevated O3 concentrations were observed at most sites in JS, in the southern part of ZJ and in the eastern part of AH. These provinces are known to have close economic ties to Shanghai.
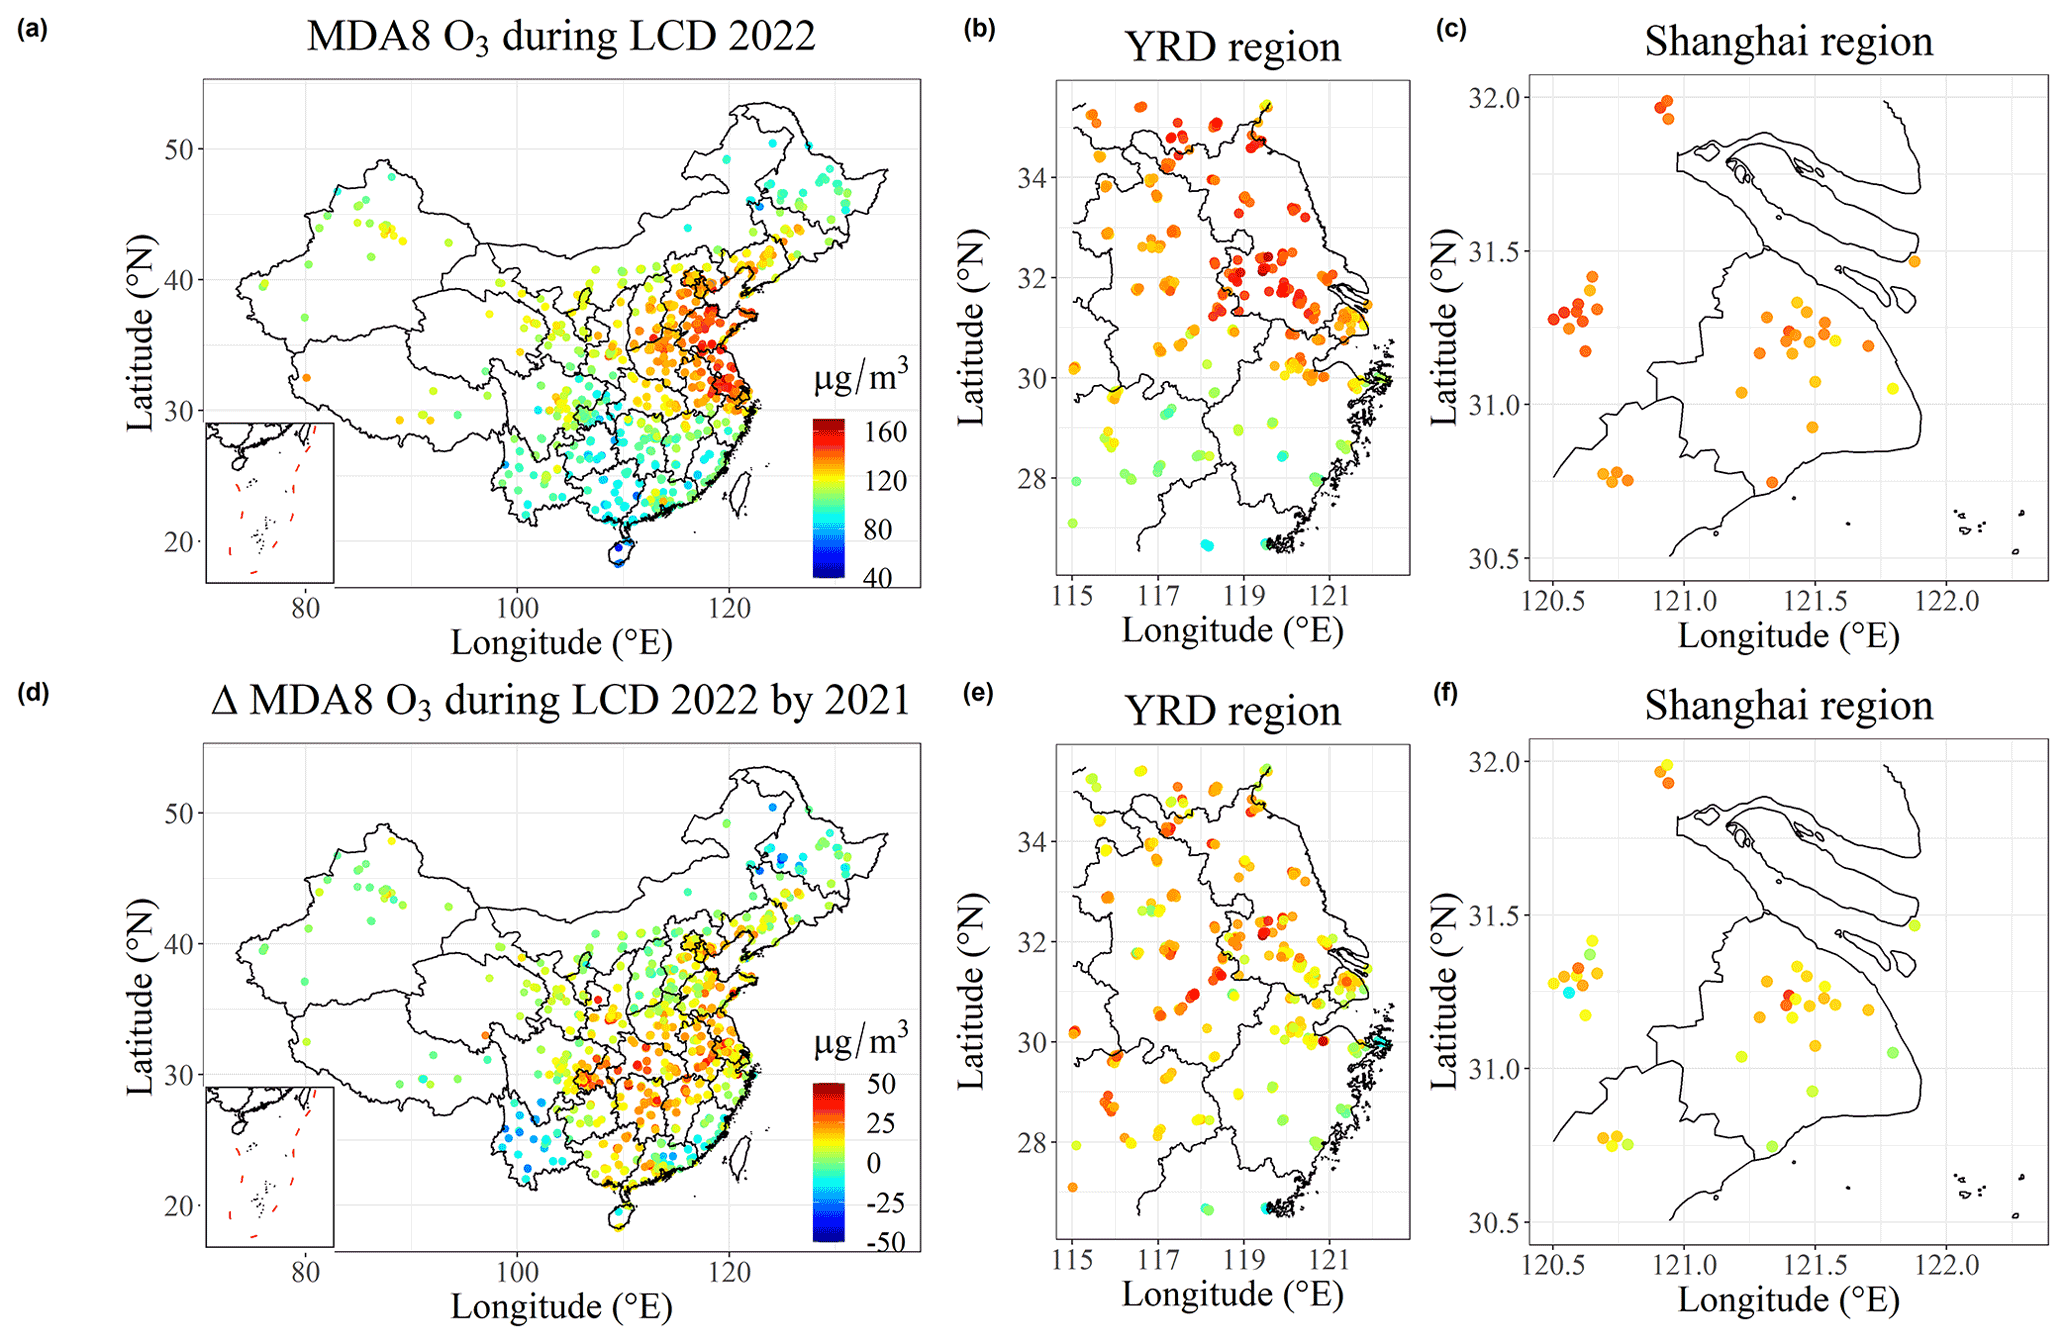
Figure 3Spatial distribution of surface maximum daily 8 h average (MDA8) O3 concentrations in 2022 and changes in the same compared with 2021 across all of mainland China (a, d), in the Yangtze River Delta region (b, e) and in Shanghai (c, f) from 28 March to 31 May 2022. LCD: lockdown.
The increase in MDA8 O3 concentrations during the 2022 LCD was not restricted to Shanghai. Figure 3d–f show the spatial distribution of changes in MDA8 O3 concentrations from 2021 to 2022 at the national, regional and city scales, respectively. The MDA8 O3 concentrations clearly increased in central and eastern regions but decreased in south-western, north-western and north-eastern regions (Fig. 3d). The YRD region recorded one of the greatest increases in MDA8 O3 concentrations (17.4 µg m−3) during the 2022 LCD (Fig. 3e). Within Shanghai, the year-on-year increase in MDA8 O3 concentrations decreased from urban to semi-rural areas, with the largest increase recorded in the Putuo district in the city centre (32.9 µg m−3) (Fig. 3f).
3.2 TROPOMI-based HCHO and NO2 concentrations
Figure 4 depicts the spatial distributions of TROPOMI-based tropospheric column concentrations of HCHO and NO2 and the column ratios in the YRD region. During the 2022 LCD and compared with the same period in 2021, the column concentrations of HCHO, derived from both direct emissions and degradation of anthropogenic and natural VOCs, decreased by 10.8 % (Fig. 4a), and the NO2 column concentrations decreased by 25.1 % (Fig. 4b). The magnitudes of the reductions in HCHO and NO2 column concentrations had similar spatial distributions, with the largest reductions observed in the region's major cities (Shanghai, Suzhou, Nanjing and Hangzhou). This indicated that the reductions in both the NO2 and HCHO column concentrations were related to decreases in anthropogenic activity during the 2022 LCD. Due to a larger decrease in NO2 concentrations than in HCHO concentrations, the average ratio increased from 2.57 in 2021 to 2.96 in 2022 in the YRD region (Fig. 4c). In Shanghai, the HCHO and NO2 column concentrations decreased by 19.4 % and 49.2 %, respectively, during the 2022 LCD (see Sect. 3.3.2 for a detailed discussion). In comparison, the TROPOMI-based HCHO and NO2 column concentrations in February 2020 showed 17 % and 38 % decreases, respectively, in the YRD region compared with the same month in 2019 (Stavrakou et al., 2021). The much larger reduction in NO2 concentrations than in HCHO concentrations during the 2022 LCD is attributable to the fact that NOx is mainly emitted by transportation activities (which exhibited the greatest decrease during the 2022 LCD) and by power generation, whereas VOCs are derived from more diverse sources. In Shanghai, the main VOC sources are vehicular exhaust; evaporation of fuels, paints and solvents; petrochemical industries; liquefied petroleum gas; and biogenic sources (Lin et al., 2020; Han et al., 2022).

Figure 4Spatial distribution of the TROPOspheric Monitoring Instrument-based tropospheric column concentrations of HCHO (a) and NO2 (b) and the ratio (c) in the Yangtze River Delta region during the 2022 lockdown (upper row) and compared with the same period in 2021 (lower row).
3.3 Cause(s) of high O3 concentrations during the 2022 LCD
3.3.1 Effects of meteorological conditions on O3 pollution in Shanghai
A large body of literature has indicated that meteorological conditions can significantly affect O3 concentrations by altering emissions, chemical reaction rates, and distribution and removal processes (e.g. Lu et al., 2019; Liu and Wang, 2020; Liu et al., 2021; Jacob and Winner, 2009; Lin et al., 2008; He et al., 2017). To gain insights into the weather conditions during the 2022 LCD period, we compared several meteorological parameters recorded at surfaces in Shanghai (temperature, RH, and wind speed and direction) (Fig. 5) and the ERA5 reanalysis data for large regions (Fig. 6). The results indicate that during the 2022 LCD, the average surface air temperature and RH decreased compared with the same period in 2021. That is, the mean temperature was 18.4 ∘C in 2022 versus 19.9 ∘C in 2021, and the mean RH was 71.4 % in 2022 versus 74.2 % in 2021 (Fig. 5a–b). The ERA5 reanalysis data revealed there was a decrease in the surface (2 m) temperature in Shanghai, whereas there was an obvious increase in the 2 m temperature in the northern part of the YRD region and a large decrease in the 2 m temperature in the southern part of the YRD region (Fig. 6). The decrease in mean temperature in Shanghai during the 2022 LCD may have slowed O3 production by reducing chemical reaction rates and biogenic emissions. The ERA5 reanalysis data also revealed that during the 2022 LCD there were insignificant changes in cloud cover, downward UV radiation, boundary layer heights and total precipitation in Shanghai but considerable changes in these parameters in the surrounding areas (Fig. 6).
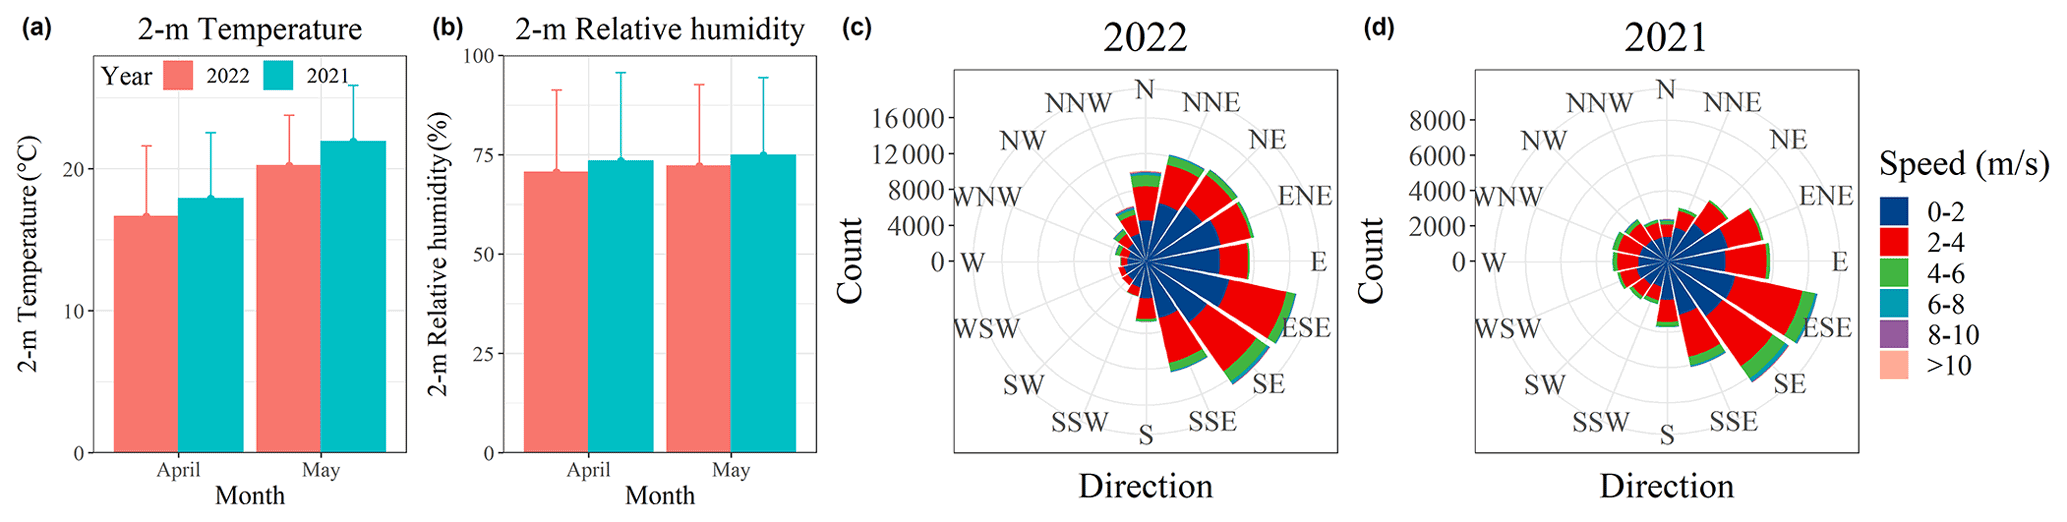
Figure 5A comparison of average temperature (a) and relative humidity (b) in April and May of 2021 and 2022. Wind rose plots for the 2022 lockdown period (c) and the same period in 2021 (d). The data are surface observations.
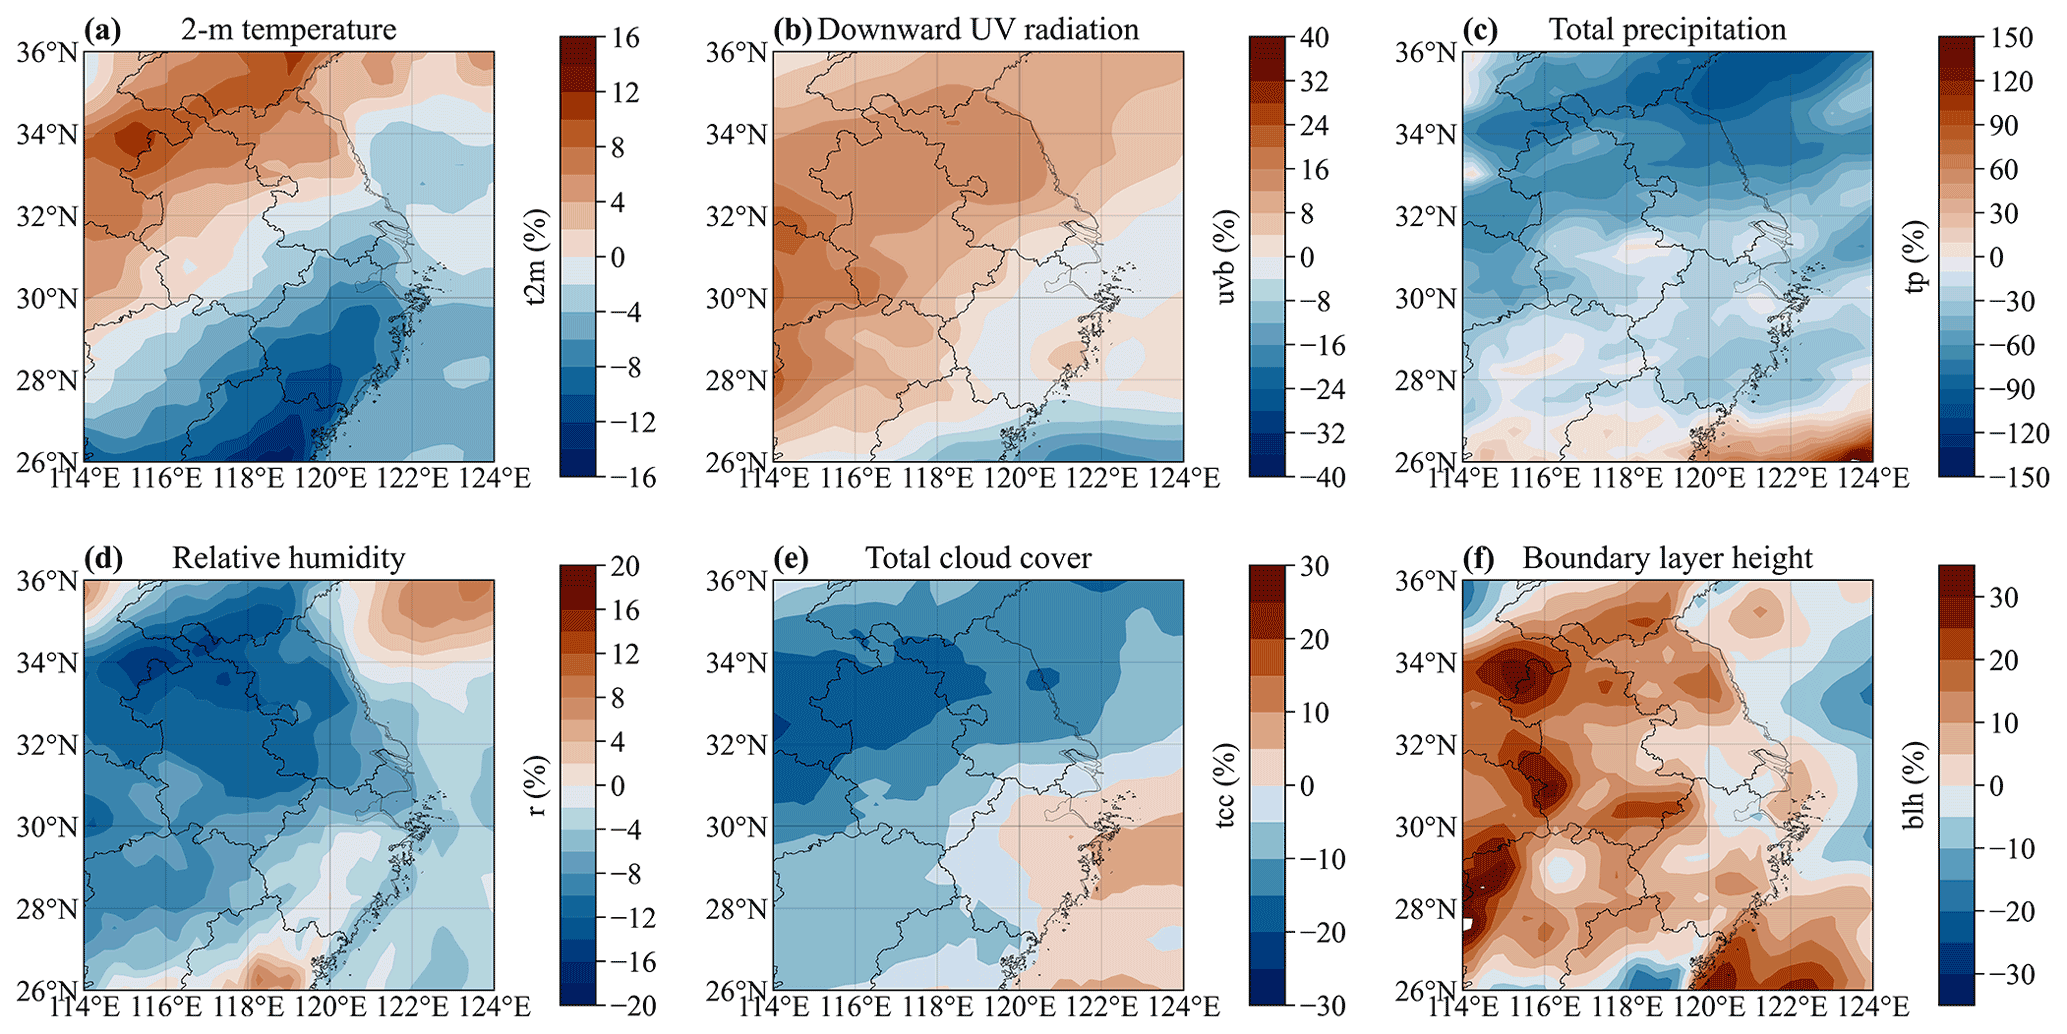
Figure 6Percentage change in the average meteorological parameters of European Centre for Medium-Range Weather Forecast reanalysis v5 data for the Yangtze River Delta and its neighbouring regions. The 2 m temperature (t2m) (a), downward ultraviolet (UV) radiation at the surface (uvb) (b), total precipitation (tp) (c), relative humidity at 1000 hPa (r) (d), total cloud cover (tcc) (e) and boundary layer height (blh) (f).
We also assessed whether there was a significant change in surface airflow in Shanghai during the 2022 LCD compared with the preceding year. An examination of surface winds in Shanghai showed that during the 2022 LCD, predominant surface winds were from the north-east–south-east sectors (Fig. 5c–d), which is consistent with the 24 h calculated back trajectories (Fig. S4). This indicates that for the majority of the 2022 LCD, Shanghai was upwind of other cities in the YRD region. Compared with the same period in 2021, during the 2022 LCD there was an increase in the occurrence of northerly winds and a decrease in the occurrence of westerly winds. To check for transport of O3 from high-O3 areas in the north-west direction, we examined surface wind flows during the 21 O3 exceedance days. Both surface wind flows and back trajectories indicated that during these days air mainly came from the north-east–east–south-east directions (Fig. 7), indicating that air from other YRD cities contributed little to the high-O3 days in Shanghai during the 2022 LCD.

Figure 7(a) The 24 h back trajectories at 1 h intervals at a height of 500 m and (b) surface wind rose plot for the 21 O3 exceedance days during the 2022 lockdown in Shanghai. The inserted percentages represent the percentages of trajectory numbers of each classification in the whole trajectories.
The above results suggest that the increase in O3 concentrations in Shanghai during the 2022 LCD were not due to changes in meteorological conditions but were a result of local chemical production.
3.3.2 Effect of the changes in O3 formation regimes in Shanghai
The photochemical production of O3 is controlled by the non-linear chemistry of NOx (NO and NO2) and VOCs (NRC, 1992). It is well known that in many cities, O3 concentrations decrease as VOC emissions decrease but increase as NOx emissions decrease (e.g. Wang et al., 2022). The literature has shown that Shanghai largely operates within a VOC-limited regime (e.g. Lin et al., 2020). We found observational evidence – the ratios and the relationship between O3 and NO2 concentrations – that shows that the city remained in a VOC-limited regime before the 2022 LCD (both in the earlier months of 2022 and in April–May of 2021) but may have transitioned near a NOx–VOC-co-limited regime during the 2022 LCD. The ratio has been used as a proxy for O3 formation regimes, with low ratios indicating VOC-limited conditions, high ratios indicating NOx-limited conditions and intermediate values indicating a co-limited regime. Figure 8 shows the temporal variations in city-average ratios in January–May of 2021 and 2022 (Fig. 8a) and the spatial variation in the ratios in Shanghai (Fig. 8b). It indicates that the ratios were comparable (0.56 versus 0.58) in the pre-2022-LCD months of 2021 and 2022 but significantly increased during the 2022 LCD (from 1.11 to 1.68) (Figs. 8a and S5). Moreover, the ratios were higher in the southern part than the northern part of Shanghai, which houses the major urban districts (Fig. 8b).
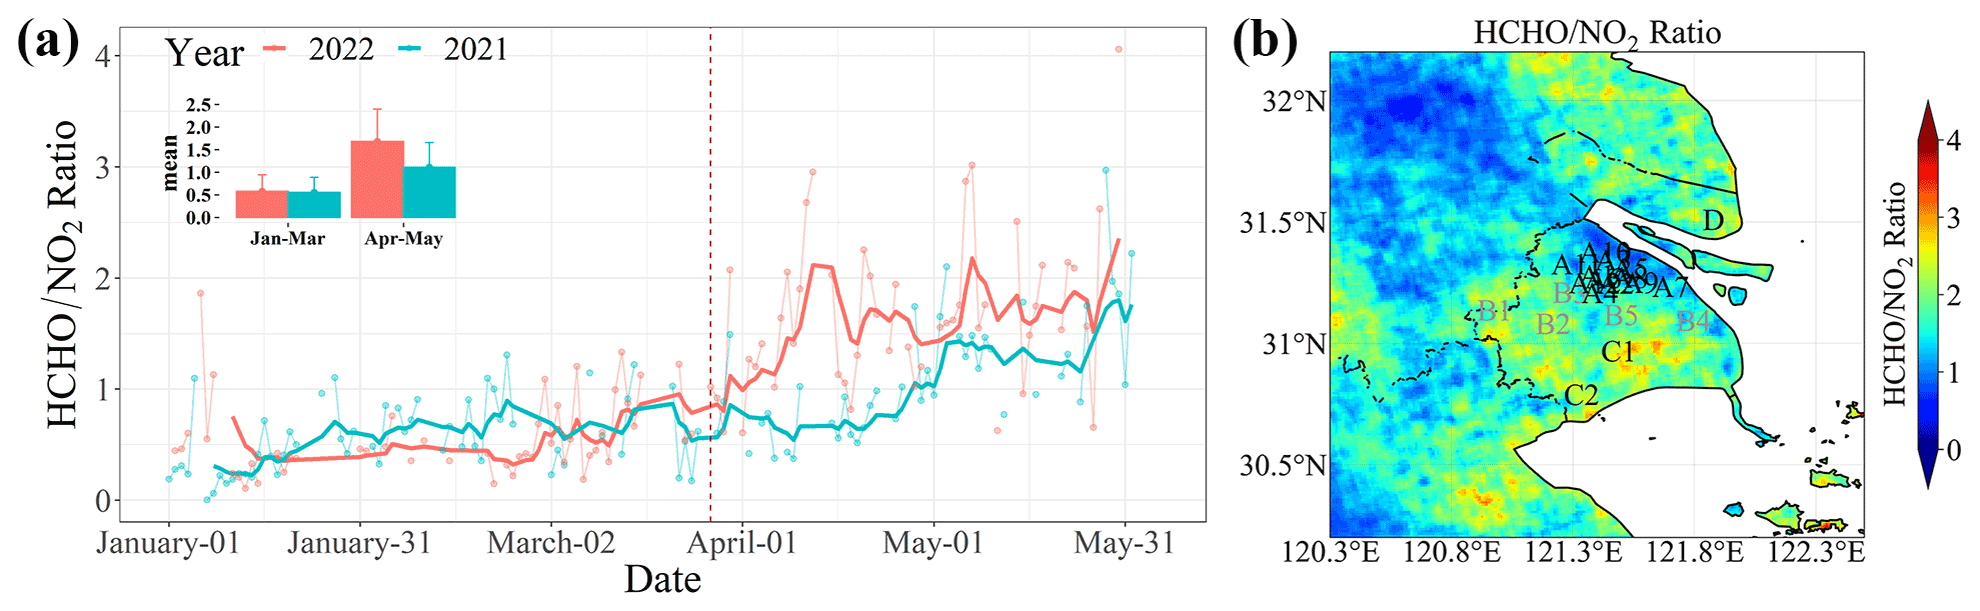
Figure 8Temporal variations in the city-average ratio from 1 January to 31 May of 2021 and 2022 (a). Spatial variations in the ratio in Shanghai and its surrounding regions during the 2022 lockdown (b). The trend lines in panel (a) represent the moving average by 2 weeks. The dashed vertical red line represents the lockdown starting date (27 March), and the insert shows the monthly average ratios with standard deviations.
Previous analysis of the historical Ozone Monitoring Instrument (OMI) ratios in Shanghai indicated a general rising trend in the ratios with values ranging from 0.5–1.5 in 2005–2019 in warm seasons (April–September) (Itahashi et al., 2022; Li et al., 2021; Lee et al., 2022). For April and May, the months when the 2022 Shanghai LCD took place, the ratios ranging from 0.73 to 1.36 were in 9 out of 10 years during 2010–2019, with a higher ratio (1.61) for the year 2014 (Li et al., 2021). This shows that the ratio during LCD 2022 (1.68) was high compared with that of the same months in the past decade, resulting from the sharply reduced NO2 column concentrations during the LCD. Several other megacities in East Asia have also seen increasing ratios during 2015–2019 (Itahashi et al., 2022; Lee et al., 2022).
To determine the regime transition threshold, we adopted an observation-based method similar to that which has been used by previous researchers (Jin et al., 2020; Wang et al., 2021; Schroeder et al., 2022): we plotted the city-average MDA8 O3 concentrations against the ratio for the first 5 months of 2021 and 2022 (Fig. 9). The peak O3 concentrations increased as the ratio increased and plateaued at approximately 2, indicating that a ratio of 2 was the threshold for transition from a VOC-limited to a co-limited regime. This value is similar to that determined (2.3) for other major Chinese cities (Wang et al., 2021); however, it is less than that determined (∼3) for several US cities (Jin et al., 2020) and greater than that derived from model simulations (Duncan et al., 2010; Li et al., 2021). The city-averaged ratio was greater than 2 on 15 d during the 2022 LCD but on just 2 d in 2021 (see Fig. 9). Moreover, a spatial analysis shows that during the 2022 LCD, the southern part of Shanghai was in a VOC–NOx-co-limited regime (with a ratio >2), whereas the city centre in the northern part remained in the VOC-limited regime (Fig. 8b).

Figure 9Scatterplot of Shanghai's average maximum daily 8 h (MDA8) O3 concentrations and ratios in January–May of 2021 (blue dots) and 2022 (red dots). The data points recorded during the lockdown periods are labelled with red crosses.
The relationship between surface O3 and NO2 concentrations supports the inference made based on satellite-derived ratio data. It is known that O3 concentrations are negatively correlated with NOx, NOy or NOz concentrations ( oxidation products of NOx [NOz]) under a NOx-titrated condition; this relationship is slightly positive (with small ratios) in a VOC-limited regime and very positive (with large ratios) in a NOx-limited regime. For example, previous studies have suggested that an afternoon ratio (ppb ppb) less than 4 corresponds to a VOC-limited regime, an afternoon ratio greater than 7 corresponds to a NOx-limited regime, and an afternoon of 4–7 corresponds to a transition regime (Wang et al., 2017). Only NO2 and NOx (not other forms of reactive nitrogen) are measured by most regular air-monitoring networks, including the China Environmental Monitoring Network used in this study. Figure 10 shows the scatterplot of the MDA8 O3 and daily average NO2 concentrations at three types of sites in Shanghai: the city centre (12 sites), the city perimeter (4 sites) and the semi-rural areas (2 sites). The VOC-limited regime at the city centre sites (with an average ratio of 1.43) had the smallest slope (3.4), and that in the transition regime sites (with a ratio of 2.27) had the largest slope (5). In comparison, in 2021, the peak O3 concentration had either a very weak or no correlation with NO2 concentrations, indicative of a typical VOC-limited regime. (The type D site had small positive slopes in both years (0.89–1.17), with high NO2 during the 2022 LCD possibly from the ship emissions in the Yangtze River Estuary; Fig. S6.)
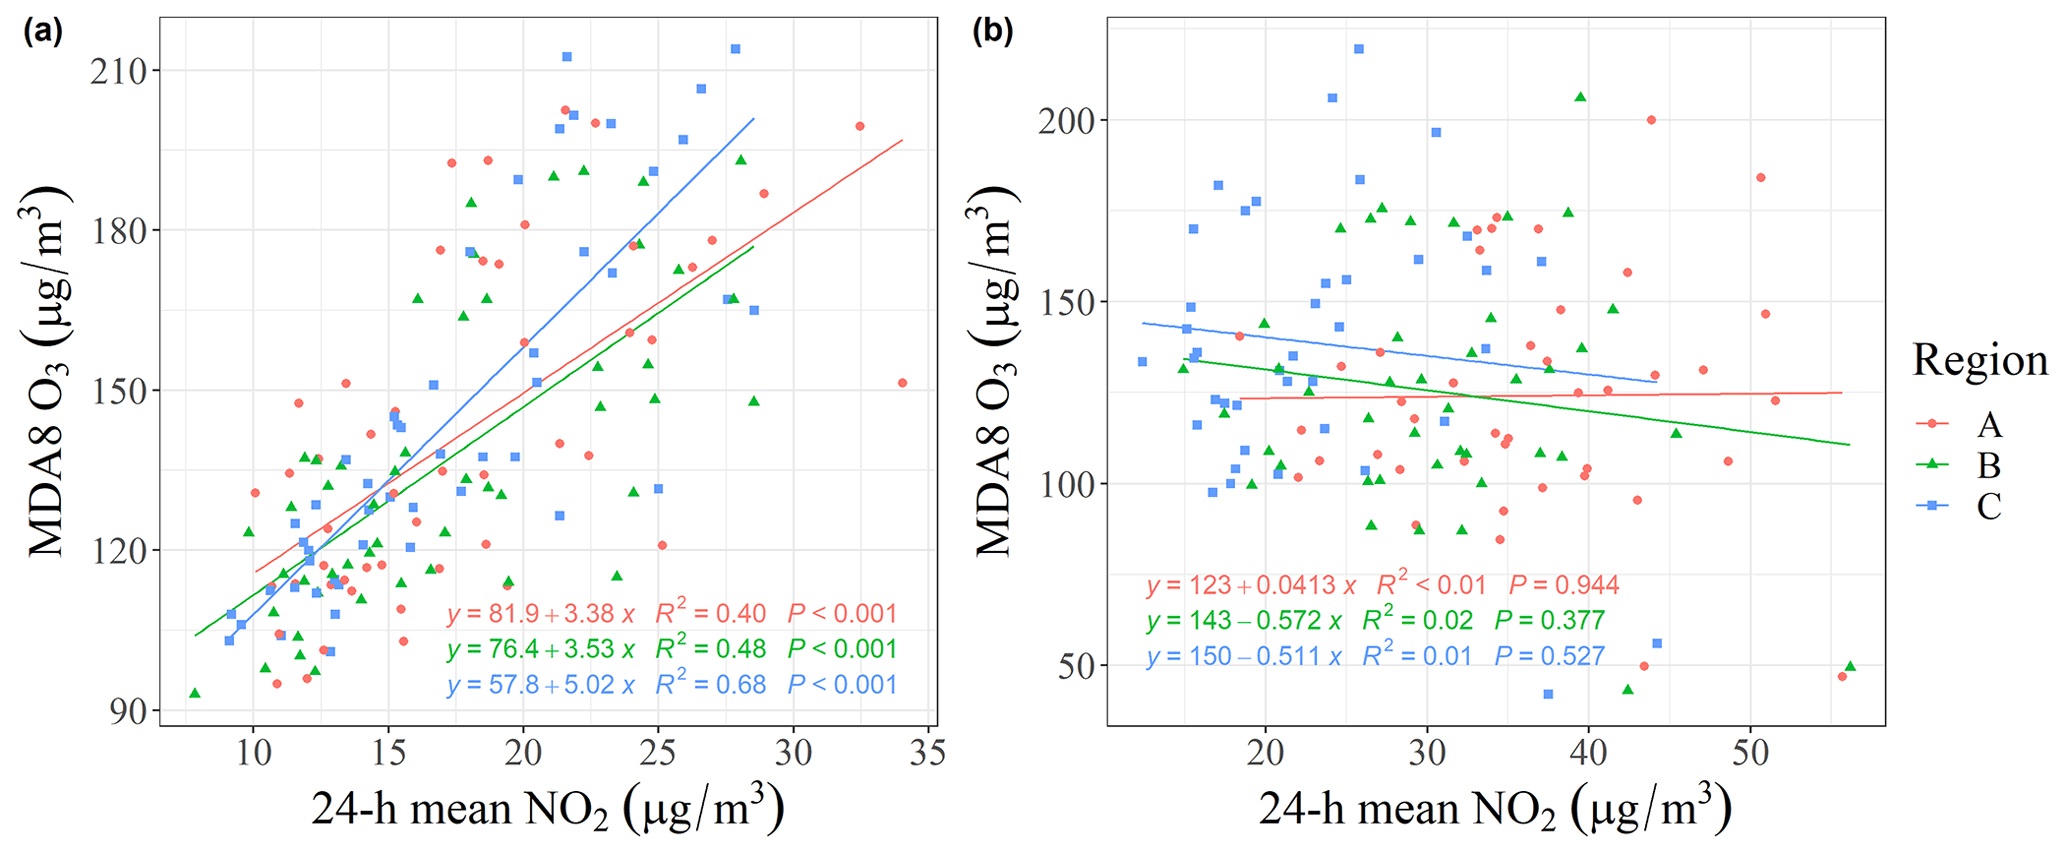
Figure 10Scatterplots of the surface maximum daily 8 h average (MDA8) O3 concentrations versus surface daily NO2 concentrations and their linear regressions (straight lines) during the 2022 lockdown (a) and the same period in 2021 (b) for three types of sites.
The above results suggest that the increased O3 concentrations observed during the 2022 LCD were mainly due to increased O3 production, which resulted from a larger reduction in NOx emissions than in VOC emissions under a VOC-limited condition. Additionally, the decrease in particulate emissions, which reduces the uptake of radicals and O3 and increases radiation, could have increased O3 concentrations. Previous model simulations of the 2020 LCD in central China, which saw similar decreases in emissions (i.e. NOx: ∼50 %; PM: ∼30 %), showed that the decrease in NOx emissions made a much larger contribution than the decrease in PM emissions to the increase in O3 concentrations (Liu et al., 2021). We believe that this also occurred during the 2022 LCD; i.e. the O3 concentration increase was mainly due to enhanced O3 production, which occurred as a result of a large reduction in NOx emissions. The O3 formation regime during the 2022 LCD remained VOC-limited in urban areas but entered co-limiting conditions outside the city centre.
This study analysed the causes of frequent ground-level O3 pollution during the 2022 LCD (April–May 2022) in Shanghai and assessed the increases in O3 concentrations compared with the same periods in previous years using ground and satellite-based observations. We found that despite large reductions in the activities of transportation sectors and industries during the 2022 LCD, frequent exceedances of the O3 air quality standard (∼30 % days) were observed at ground level. Moreover, the O3 concentrations were increased during the 2022 LCD compared with the same period in the preceding year. This increase resulted from a large reduction in NOx emissions (∼50 % from surface and satellite-based measurements) and a small reduction in VOCs (19 % in HCHO column concentrations) within Shanghai. In contrast, meteorology and outside influences had insignificant effects on O3 concentrations during the 2022 LCD. Moreover, O3 formation during the 2022 LCD remained in the VOC-limited regime at most urban and suburban sites but transitioned to a VOC–NOx-co-limited regime in semi-rural areas.
Our findings on the O3 response to the 2022 LCD have implications for mitigating summer O3 pollution, which has become the predominant air-pollution problem during warm seasons in China. O3 pollution is also a persistent environmental hazard in the US and Europe even after a few decades of research and control (e.g. Tao et al., 2022; Derwent and Parrish, 2022). Similar to Shanghai, many of the world's cities, such as Los Angeles and New York, are still in VOC-limited regimes (Jin et al., 2020; Tao et al., 2022). Our results show that drastically decreasing emissions from conventional fossil-fuel-powered transportation sectors during the 2022 LCD can lead to increased and elevated O3 concentrations in VOC-limited urban areas. China is aiming to have its carbon emissions peak by 2030 and to achieve carbon neutrality by 2060, and other countries are also committing to drastically reducing their carbon emissions. This will necessitate the rapid uptake of electric vehicles in many cities. However, although large-scale adoption of electric vehicles will greatly improve overall air quality, VOC emissions from other sectors will need to be decreased at the same time to prevent increases in O3 concentrations from the reductions in NOx (and particulate) emissions in the early stages of phase-out of conventional vehicles. Over time, the wide application and acceptance of renewable energy in transportation and energy production will help cities reach the NOx-limited formation regime, alleviate ground-level O3 pollution and achieve carbon-reduction targets. The aggravated O3 pollution during the 2022 Shanghai LCD after large reductions in transportation emissions suggests that it may take a considerably long time for some cities to reach a NOx-limited regime.
The code and data used in this study are available upon request from Tao Wang (tao.wang@polyu.edu.hk).
The supplement related to this article is available online at: https://doi.org/10.5194/acp-22-14455-2022-supplement.
TW initiated the research and designed the framework of data analysis. YT processed the data and made the figures. TW and YT analysed the results and wrote the paper.
At least one of the (co-)authors is a member of the editorial board of Atmospheric Chemistry and Physics. The peer-review process was guided by an independent editor, and the authors also have no other competing interests to declare.
Publisher's note: Copernicus Publications remains neutral with regard to jurisdictional claims in published maps and institutional affiliations.
We thank Shanshan Wang at Fudan University for providing the OMI ratio data in Shanghai during 2010–2019.
This research has been supported by the Hong Kong Research Grants Council (grant no. T24-504/17-N) and the National Natural Science Foundation of China (grant no. 91844301).
This paper was edited by Jianzhong Ma and reviewed by Hongbo Fu and one anonymous referee.
Cao, A., Zhang, S., and Na, E.: Shanghai, home to Tesla, SMIC and GM and Volkswagen's Chinese partner, is the most important city for China's economy. Here's why, South China Morning Post, 17 May 2022.
Derwent, R. G. and Parrish, D. D.: Analysis and assessment of the observed long-term changes over three decades in ground-level ozone across north-west Europe from 1989–2018, Atmos. Environ., 286, 119222, https://doi.org/10.1016/j.atmosenv.2022.119222, 2022.
Doumbia, T., Granier, C., Elguindi, N., Bouarar, I., Darras, S., Brasseur, G., Gaubert, B., Liu, Y., Shi, X., Stavrakou, T., Tilmes, S., Lacey, F., Deroubaix, A., and Wang, T.: Changes in global air pollutant emissions during the COVID-19 pandemic: a dataset for atmospheric modeling, Earth Syst. Sci. Data, 13, 4191–4206, https://doi.org/10.5194/essd-13-4191-2021, 2021.
Duncan, B. N., Yoshida, Y., Olson, J. R., Sillman, S., Martin, R. V., Lamsal, L., Hu, Y., Pickering, K. E., Retscher, C., Allen, D. J., and Crawford, J. H.: Application of OMI observations to a space-based indicator of NOx and VOC controls on surface ozone formation, Atmos. Environ., 44, 2213–2223, https://doi.org/10.1016/j.atmosenv.2010.03.010, 2010.
Ghasempour, F., Sekertekin, A., and Kutoglu, S. H.: Google Earth Engine based spatio-temporal analysis of air pollutants before and during the first wave COVID-19 outbreak over Turkey via remote sensing, J. Clean. Prod., 319, 128599, https://doi.org/10.1016/j.jclepro.2021.128599, 2021.
Gorelick, N., Hancher, M., Dixon, M., Ilyushchenko, S., Thau, D., and Moore, R.: Google Earth Engine: Planetary-scale geospatial analysis for everyone, Remote Sens. Environ., 202, 18–27, https://doi.org/10.1016/j.rse.2017.06.031, 2017.
Hale, T., Li, G., Dempsey, H., and Olcott, E.: Shanghai Covid lockdown “will have a global effect on almost every trade”, Financial Times, 7 April 2022.
Han, Y., Wang, T., Li, R., Fu, H., Duan, Y., Gao, S., Zhang, L., and Chen, J.: Measurement report: Simultaneous multi-site observations of VOCs in Shanghai, East China: characteristics, sources and secondary formation potentials, Atmos. Chem. Phys. Discuss. [preprint], https://doi.org/10.5194/acp-2022-250, in review, 2022.
He, J., Gong, S., Yu, Y., Yu, L., Wu, L., Mao, H., Song, C., Zhao, S., Liu, H., Li, X., and Li, R.: Air pollution characteristics and their relation to meteorological conditions during 2014–2015 in major Chinese cities, Environ. Pollut., 223, 484–496, https://doi.org/10.1016/j.envpol.2017.01.050, 2017.
He, L.: Lockdowns in Shanghai and other Chinese cities pose a growing threat to the economy, CNN Business, 8 April 2022.
Huang, X., Ding, A., Gao, J., Zheng, B., Zhou, D., Qi, X., Tang, R., Wang, J., Ren, C., Nie, W., Chi, X., Xu, Z., Chen, L., Li, Y., Che, F., Pang, N., Wang, H., Tong, D., Qin, W., Cheng, W., Liu, W., Fu, Q., Liu, B., Chai, F., Davis, S. J., Zhang, Q., and He, K.: Enhanced secondary pollution offset reduction of primary emissions during COVID-19 lockdown in China, National Science Review, 8, nwaa137, https://doi.org/10.1093/nsr/nwaa137, 2021.
Itahashi, S., Irie, H., Shimadera, H., and Chatani, S.: Fifteen-Year Trends (2005–2019) in the Satellite-Derived Ozone-Sensitive Regime in East Asia: A Gradual Shift from VOC-Sensitive to NOx-Sensitive, Remote Sens., 14, 4512, https://doi.org/10.3390/rs14184512, 2022.
Jacob, D. J. and Winner, D. A.: Effect of climate change on air quality, Atmos. Environ., 43, 51–63, https://doi.org/10.1016/j.atmosenv.2008.09.051, 2009.
Jin, X., Fiore, A., Boersma, K. F., Smedt, I. D., and Valin, L.: Inferring Changes in Summertime Surface Ozone–NOx–VOC Chemistry over U.S. Urban Areas from Two Decades of Satellite and Ground-Based Observations, Environ. Sci. Technol., 54, 6518–6529, https://doi.org/10.1021/acs.est.9b07785, 2020.
Lee, H.-J., Chang, L.-S., Jaffe, D. A., Bak, J., Liu, X., Abad, G. G., Jo, H.-Y., Jo, Y.-J., Lee, J.-B., Yang, G.-H., Kim, J.-M., and Kim, C.-H.: Satellite-Based Diagnosis and Numerical Verification of Ozone Formation Regimes over Nine Megacities in East Asia, Remote Sens., 14, 1285, https://doi.org/10.3390/rs14051285, 2022.
Li, D., Wang, S., Xue, R., Zhu, J., Zhang, S., Sun, Z., and Zhou, B.: OMI-observed HCHO in Shanghai, China, during 2010–2019 and ozone sensitivity inferred by an improved ratio, Atmos. Chem. Phys., 21, 15447–15460, https://doi.org/10.5194/acp-21-15447-2021, 2021.
Lin, H., Wang, M., Duan, Y., Fu, Q., Ji, W., Cui, H., Jin, D., Lin, Y., and Hu, K.: O3 Sensitivity and Contributions of Different NMHC Sources in O3 Formation at Urban and Suburban Sites in Shanghai, Atmosphere, 11, 295, https://doi.org/10.3390/atmos11030295, 2020.
Lin, J.-T., Patten, K. O., Hayhoe, K., Liang, X.-Z., and Wuebbles, D. J.: Effects of Future Climate and Biogenic Emissions Changes on Surface Ozone over the United States and China, J. Appl. Meteorol. Clim., 47, 1888–1909, https://doi.org/10.1175/2007JAMC1681.1, 2008.
Liu, Y. and Wang, T.: Worsening urban ozone pollution in China from 2013 to 2017 – Part 1: The complex and varying roles of meteorology, Atmos. Chem. Phys., 20, 6305–6321, https://doi.org/10.5194/acp-20-6305-2020, 2020.
Liu, Y., Wang, T., Stavrakou, T., Elguindi, N., Doumbia, T., Granier, C., Bouarar, I., Gaubert, B., and Brasseur, G. P.: Diverse response of surface ozone to COVID-19 lockdown in China, Sci. Total Environ., 789, 147739, https://doi.org/10.1016/j.scitotenv.2021.147739, 2021.
Lu, X., Zhang, L., and Shen, L.: Meteorology and Climate Influences on Tropospheric Ozone: a Review of Natural Sources, Chemistry, and Transport Patterns, Current Pollution Reports, 5, 238–260, https://doi.org/10.1007/s40726-019-00118-3, 2019.
Ministry of Transport of the People's Republic of China: https://www.mot.gov.cn/shuju/, last access: 21 July 2022.
National Bureau of Statistics: https://data.stats.gov.cn/easyquery.htm?cn=E0101, last access: 21 July 2022.
NRC (National Research Council): Rethinking the Ozone Problem in Urban and Regional Air Pollution, National Academies Press, 525 pp., https://doi.org/10.17226/1889, 1992.
Shanghai Bureau of Statistics: https://tjj.sh.gov.cn/sjfb/index.html, last access: 21 July 2022.
Schroeder, J. R., Cai, C., Xu, J., Ridley, D., Lu, J., Bui, N., Yan, F., and Avise, J.: Changing ozone sensitivity in the South Coast Air Basin during the COVID-19 period, Atmos. Chem. Phys., 22, 12985–13000, https://doi.org/10.5194/acp-22-12985-2022, 2022.
Stavrakou, T., Müller, J.-F., Bauwens, M., Doumbia, T., Elguindi, N., Darras, S., Granier, C., Smedt, I. D., Lerot, C., Van Roozendael, M., Franco, B., Clarisse, L., Clerbaux, C., Coheur, P.-F., Liu, Y., Wang, T., Shi, X., Gaubert, B., Tilmes, S., and Brasseur, G.: Atmospheric Impacts of COVID-19 on NOx and VOC Levels over China Based on TROPOMI and IASI Satellite Data and Modeling, Atmosphere, 12, 946, https://doi.org/10.3390/atmos12080946, 2021.
Tao, M., Fiore, A. M., Jin, X., Schiferl, L. D., Commane, R., Judd, L. M., Janz, S., Sullivan, J. T., Miller, P. J., Karambelas, A., Davis, S., Tzortziou, M., Valin, L., Whitehill, A., Civerolo, K., and Tian, Y.: Investigating Changes in Ozone Formation Chemistry during Summertime Pollution Events over the Northeastern United States, Environ. Sci. Technol., online first, https://doi.org/10.1021/acs.est.2c02972, 2022.
Wang, T., Xue, L., Brimblecombe, P., Lam, Y. F., Li, L., and Zhang, L.: Ozone pollution in China: A review of concentrations, meteorological influences, chemical precursors, and effects, Science of The Total Environment, 575, 1582–1596, https://doi.org/10.1016/j.scitotenv.2016.10.081, 2017.
Wang, T., Xue, L., Feng, Z., Dai, J., Zhang, Y., and Tan, Y.: Ground-level ozone pollution in China: a synthesis of recent findings on influencing factors and impacts, Environ. Res. Lett., 17, 063003, https://doi.org/10.1088/1748-9326/ac69fe, 2022.
Wang, W., van der A, R., Ding, J., van Weele, M., and Cheng, T.: Spatial and temporal changes of the ozone sensitivity in China based on satellite and ground-based observations, Atmos. Chem. Phys., 21, 7253–7269, https://doi.org/10.5194/acp-21-7253-2021, 2021.
Wang, Y., Ying, Q., Hu, J., and Zhang, H.: Spatial and temporal variations of six criteria air pollutants in 31 provincial capital cities in China during 2013–2014, Environ. Int., 73, 413–422, https://doi.org/10.1016/j.envint.2014.08.016, 2014.
Wang, Y. Q.: MeteoInfo: GIS software for meteorological data visualization and analysis, Meteorol. Appl., 21, 360–368, https://doi.org/10.1002/met.1345, 2014.
Wang, Y. Q.: An Open Source Software Suite for Multi-Dimensional Meteorological Data Computation and Visualisation, Journal of Open Research Software, 7, 21, https://doi.org/10.5334/jors.267, 2019.