the Creative Commons Attribution 4.0 License.
the Creative Commons Attribution 4.0 License.
 | 09 Nov 2022
Ammonium adduct chemical ionization to investigate anthropogenic oxygenated gas-phase organic compounds in urban air
Peeyush Khare
Jordan E. Krechmer
Jo E. Machesky
Tori Hass-Mitchell
Junqi Wang
Francesca Majluf
Felipe Lopez-Hilfiker
Sonja Malek
Will Wang
Karl Seltzer
Havala O. T. Pye
Roisin Commane
Brian C. McDonald
Ricardo Toledo-Crow
John E. Mak
Drew R. Gentner
Volatile chemical products (VCPs) and other non-combustion-related sources have become important for urban air quality, and bottom-up calculations report emissions of a variety of functionalized compounds that remain understudied and uncertain in emissions estimates. Using a new instrumental configuration, we present online measurements of oxygenated organic compounds in a US megacity over a 10 d wintertime sampling period, when biogenic sources and photochemistry were less active. Measurements were conducted at a rooftop observatory in upper Manhattan, New York City, USA using a Vocus chemical ionization time-of-flight mass spectrometer, with ammonium (NH as the reagent ion operating at 1 Hz. The range of observations spanned volatile, intermediate-volatility, and semi-volatile organic compounds, with targeted analyses of ∼150 ions, whose likely assignments included a range of functionalized compound classes such as glycols, glycol ethers, acetates, acids, alcohols, acrylates, esters, ethanolamines, and ketones that are found in various consumer, commercial, and industrial products. Their concentrations varied as a function of wind direction, with enhancements over the highly populated areas of the Bronx, Manhattan, and parts of New Jersey, and included abundant concentrations of acetates, acrylates, ethylene glycol, and other commonly used oxygenated compounds. The results provide top-down constraints on wintertime emissions of these oxygenated and functionalized compounds, with ratios to common anthropogenic marker compounds and comparisons of their relative abundances to two regionally resolved emissions inventories used in urban air quality models.
- Article
(5191 KB) - Full-text XML
-
Supplement
(10876 KB) - BibTeX
- EndNote


Non-combustion-related sources are increasingly important contributors of anthropogenic emissions in developed regions and megacities, with implications for tropospheric ozone and secondary organic aerosols (SOA; Coggon et al., 2021; Khare and Gentner, 2018; Mcdonald et al., 2018; Pennington et al., 2021; Shah et al., 2020). These sources include volatile chemical products (VCPs), asphalt, and other products and materials that emit volatile-, intermediate-, and semi-volatile organic compounds (VOCs, IVOCs, SVOCs), which contribute to the atmospheric burden of reactive organic carbon (ROC; Heald and Kroll, 2020). Emissions occur over timescales ranging from minutes to several days and up to years in some cases (Khare and Gentner, 2018). Compounds from VCPs are diverse in terms of chemical composition and depend on application methods and uses of different products and materials. Examples of compound classes found in consumer and commercial products include hydrocarbons, acetates, alcohols, glycols, glycol ethers, fatty acid methyl esters, aldehydes, siloxanes, ethanolamines, phthalates, and acids (Bi et al., 2015; Even et al., 2019, 2020; Khare and Gentner, 2018; Mcdonald et al., 2018).
A subset of compounds from these classes has been investigated in indoor environments for sources like building components (e.g., paints), for household products (e.g., cleaners, insecticides, fragrances), and for some from polymer-based items such as textiles and toys (Bi et al., 2015; Even et al., 2020; Harb et al., 2020; Liang et al., 2015; Noguchi and Yamasaki, 2020; Shi et al., 2018; Singer et al., 2006). Emissions are often dependent on volatilization and thus can exhibit dependence on temperature (Khare et al., 2020). However, other environmental factors such as relative humidity can sustain or enhance indoor air concentrations of a wide range of compounds – including alcohols, glycols, and glycol ethers – for months after the application of paints (Choi et al., 2010b; Markowicz and Larsson, 2015). Similarly, mono-ethanolamines from degreasers and oxygenated third-hand cigarette smoke compounds have also been shown to off-gas and persist in indoor air for days or more after application or use (Schwarz et al., 2017; Sheu et al., 2020).
Single-ring aromatic VOCs (e.g., benzene, toluene, ethylbenzene, xylenes) have historically been well-known contributors to urban ozone and SOA production (Henze et al., 2008; Venecek et al., 2018). On this basis, regulatory policies drove a shift towards oxygenates to replace these aromatics and other unsaturated hydrocarbons as solvents (Council of the European Union, 1999), which has influenced the ambient composition of oxygenated volatile organic compounds (OVOCs; Venecek et al., 2018). Recent top-down measurements have revealed large upward fluxes of OVOCs in urban environments that double the previous urban anthropogenic emission estimates (Karl et al., 2018). Other studies have found substantial VCP-related emissions (e.g., decamethylcyclopentasiloxane or D5) to outdoor environments in several large cities such as Boulder, CO; New York, NY; Los Angeles, CA; and Toronto, Canada (Coggon et al., 2018, 2021; Gkatzelis et al., 2021a, b; Khare and Gentner, 2018; Mcdonald et al., 2018; McLachlan et al., 2010). Offline laboratory experiments with select VCP-related precursors have also shown significant SOA yields from oxygenated aromatic precursors (Charan et al., 2020; Humes et al., 2022). Furthermore, bottom-up estimates suggest that 75 %–90 % of the non-combustion emissions are constituted by functionalized species while only the remaining 10 %–25 % are hydrocarbons (Khare and Gentner, 2018; Mcdonald et al., 2018).
Non-combustion-related emissions of ROC can present health risks through direct exposure in both indoor and outdoor environments and via SOA and ozone production (Bornehag et al., 2005; Choi et al., 2010a; Destaillats et al., 2006; Masuck et al., 2011; Pye et al., 2021; Qin et al., 2020; Wensing et al., 2005). These health impacts will be modulated by the air exchange rates at which indoor emissions of ROC are transferred outdoors (Sheu et al., 2021), but indoor sinks are uncertain and have, until recently, often been neglected in emissions inventory development for VCP-related sources (McDonald et al., 2018; Seltzer et al., 2021). Information on indoor and outdoor concentrations of many ROC compounds is limited due to the historical focus on more volatile hydrocarbons and small oxygenated compounds (e.g., methanol, isopropanol, acetone) and shorter timescales of solvent evaporation (e.g., <1 d). In comparison, emissions of intermediate- and semi-volatile compounds (I/SVOCs, including higher molecular weight oxygenates) and some chemical functionalities (e.g., glycol ethers) are poorly constrained owing to instrumentation challenges and/or long emission timescales (Khare and Gentner, 2018).
To improve observational constraints on the abundances of widely used oxygenated VCPs that are expected to influence urban air quality but are uncertain in emissions inventories, we employed a Vocus chemical ionization time-of-flight mass spectrometer (Vocus CI-ToF MS) using ammonium (NH as a chemical reagent ion to increase sensitivity to compound types that have traditionally provided measurement challenges with other well-known techniques such as iodide (I−)-CIMS and proton-transfer-reaction (PTR)-MS. These techniques have been frequently used in atmospheric studies, with both advantages and limitations. While I−-CIMS has better sensitivity toward highly functionalized extremely low volatility organic compounds (ELVOCs) and also halogens (Robinson et al., 2022; Slusher et al., 2004; Thornton et al., 2010), PTR-MS can detect relatively lighter functionalized species and olefinic or aromatic hydrocarbons, though with highly reduced sensitivity toward certain compound classes – e.g., alcohols, esters, and glycols – due to large fragmentation losses (Gkatzelis et al., 2021a). The ability of NH an adduct to ionize functionalized organic compounds as well as less oxygenated organic precursors with negligible fragmentation across volatile to semi-volatile species is a key advantage (Canaval et al., 2019; Zaytsev et al., 2019b). Furthermore, it operates at relatively lower pressure (1–5 mbar) than (I−)-CIMS does, which could facilitate faster switching with PTR for quantitation of less oxygenated precursor species.
Specifically, using this technique, we (a) evaluated the performance of the CI-ToF for a diverse array of oxygenated VCPs and compare ambient observations between NH and H3O+ reagent ions; (b) examined ambient abundances of a subset of oxygenated gas-phase organics related to VCP-related emissions and their dynamic atmospheric concentrations in New York City (NYC) over a 10 d winter period with reduced biogenic emissions and secondary OVOC production; (c) determined their ambient concentration ratios and covariances with major tracer compounds; and (d) compared ambient observations against two regionally resolved emissions inventories (including all anthropogenic sources) to provide top-down constraints on the relative emissions of a range of oxygenated compounds that may influence urban air quality. The findings of this work highlight the diversity of functionalized organic species emitted from VCPs, with comparisons against inventories that inform our understanding of VCP composition and emission pathways, and thus improve urban air quality models and policy.
The sampling site was located at the Rooftop Observatory at the Advanced Science Research Center of the City University of New York (CUNY ASRC, 85 St. Nicholas Terrace) in Upper Manhattan (Figs. S1 and S2 in the Supplement). The ASRC is built on top of a hill 30 m above the mean sea level, whose surface is naturally elevated above the surrounding landscape. The observatory is 86 m a.m.s.l., and the inlet was at 89 m, with minimally obstructed views to the northwest and east towards the Bronx and Harlem as well as to the south along the island of Manhattan.
Gas-phase VOCs and I/SVOCs were measured using a Vocus CI-ToF with a NHreagent ion source (Krechmer et al., 2018), which had a higher sensitivity than most previous state-of-the-art chemical ionization-ToF instruments (without focusing) by a factor of 20 due to the quadrupole-based ion focusing, a mass-resolving power of ∼10 000 m/Δm, and was quantitatively independent of ambient humidity changes (Fig. 1a; Holzinger et al., 2019). The Vocus CI-TOF sampled at a frequency of 1 Hz continuously throughout the 10 d period from 21 to 31 January 2020. NH ionization coupled with high frequency online mass spectrometry enables measurements of functionalized compounds emitted from diverse, distributed sources in and around New York City. NH has a long history of use as a positive-ion reagent gas in chemical ionization mass spectrometry, but it has only recently been applied to the study of atmospheric chemistry with time-of-flight mass spectrometers (Canaval et al., 2019; Westmore and Alauddin, 1986; Zaytsev et al., 2019a, b). The NH reagent ion forms clusters effectively with polarizable molecules, providing mostly softly ionized NH-molecule adducts, though some protonation, charge transfer, and fragmentation can occur as alternate ionization pathways (Canaval et al., 2019). It has previously been applied in laboratory studies in different configurations than the instrument described here (Canaval et al., 2019; Zaytsev et al., 2019b), and to our knowledge, this is the first published atmospheric field measurement with NHionization.

Figure 1Vocus CI-ToF performance with low-pressure NH ionization as a function of atmospheric conditions and instrument parameters. (a) Minimal effects of relative humidity (RH) on Vocus CI-ToF quantification for several major compounds using the NH Vocus CI-ToF . (b) Ion adduct stability as a function of temperature in the focusing ion molecule reaction (fIMR) region, with ambient measurements made at 50 ∘C in this study.
NH selectively ionizes functionalized species, including ones that have generally been difficult to measure using proton-transfer reaction ionization due to excess fragmentation (e.g., glycols) or low proton affinities (Karl et al., 2018). However, it excludes non-polar hydrocarbons and is not intended to examine emissions from hydrocarbon-dominated non-combustion sources (e.g., mineral spirits, petroleum distillates).
To produce NH reagent ions in the Vocus focusing ion molecule reactor (fIMR), 20 sccm of water (H2O) vapor and 1 sccm of vapor from a 1 % ammonium hydroxide in H2O solution were injected into the discharge ion source. In addition to forming (NH H2O as the primary reagent ion, the relatively large amount of water buffers the source against any changes in relative humidity, removing any quantitative humidity dependence and the need for humidity-dependent calibrations. This lack of RH dependence is shown in Fig. 1. The slight change in the sensitivity of methyl ethyl ketone (MEK) when increasing from 0 % RH likely resulted from the three-body stabilizing effect of water, which enhances ion adduct stability, thereby increasing this compound's sensitivity. Further details on the RH dependence of a wider set of organic species can be found in Xu et al. (2022). The Vocus axial voltage was maintained at a potential difference of 425 V, and the reactor was maintained at a pressure of 3.0 mbar and a temperature of 50 ∘C (to maximize thermal stability, as shown in Fig. 1b), which corresponds to an EN value of 70 Td. Additional characterization tests, including scans of the voltage differentials, are shown in Fig. S3 and were used to inform our choice of instrument settings for the ambient measurements.
The instrument inlet was set up at the southeast corner of the observatory; 100 sccm of air was subsampled into the Vocus CI-ToF from a fluorinated ethylene propylene (FEP) Teflon inlet 5 m long and with a 12.7 mm outer diameter, with a flow rate of 20 L min−1, resulting in a residence time of ∼1 s. Importantly for measurements of semi-volatile VCPs, no particulate filter was used on the inlet to enhance transmission of semi- and low-volatility gases (Krechmer et al., 2016; Pagonis et al., 2017).
The instrument background was measured every 15 min for 1 min by injecting purified air generated by a Pt/Pd catalyst heated to 400 ∘C. Every 4 h, diluted contents from a 14-component calibration cylinder (Apel-Riemer Environmental) were injected for 1 min to measure and track instrument response over time (Table S1 in the Supplement). To quantify CI-ToF signals for additional VCPs of interest, after the campaign, we injected prepared quantitative standards of specific water-soluble VCPs that were observed in field measurements into the instrument from a liquid calibration system (LCS; Tofwerk AG) and measured the instrument response to create multi-point calibration curves. The LCS standards were then normalized using the cylinder calibrations with the same tank during and after the campaign. Although the CI-ToF used the same settings as in the campaigns for calibrations, this normalization accounted for differences in the instrument performance during and after the campaign. A table of the standard compounds along with their instrument responses can be found in Table S2.
Data were processed using Tofware version 3.2.3 (Aerodyne Research Inc.) in the Igor Pro programming environment (Wavemetrics, Inc.). Compounds of interest were detected as NH adducts within 2 ppm mass accuracy, but for clarity, we refer to detected signals after subtracting the ammonium adduct (e.g., C3H6O instead of (NH4) C3H6O+) in the Results and Discussion section below. For this focused analysis of urban emissions, data filtering was also performed on a subset of compounds to remove the influence of biomass burning events, which resulted in elevated benzene to toluene ratios during inflow of air from the less densely populated western direction. These additional contributions from biomass burning-related emissions would not be included in the inventoried emissions and would bias calculations of urban emission ratios in this study. Hourly periods with large contributions from biomass burning were filtered for affected compounds using a benzene to toluene ratio >1.8 (Fig. S4), as acetonitrile was not well correlated with benzene to toluene ratios, which was a better indicator of the influence of biomass burning at the site (Huangfu et al., 2021; Koss et al., 2018; Sheu et al., 2020). Thus, elevated concentrations of oxygenated compounds coincided with inflow from the more densely populated areas of the city.
In addition to online measurements, a subset of adsorbent tube samples were also collected during the Winter 2020 campaign for offline analysis using gas chromatography electron ionization mass spectrometry (GC EI-MS) (Sheu et al., 2018) and were used here, where possible, within the instrument capabilities and range of measured species to confirm the identifications of oxygenated compounds (and their isomers) measured as molecular formulas by the online CI-TOF. These supplemental tube samples were collected periodically during the measurement period, and their use here was intended to provide confirmational identifications of isomers contributing to CI-TOF ion measurements, though they may not be inclusive of all possible OVOCs where compound or instrument configuration limitations exist (e.g., GC transmission, reactivity, thermal instability, adsorbent column configuration). Additional measurements of meteorological parameters (e.g., wind speed and/or direction) (ATMOS 41 weather station) and carbon monoxide (Picarro G2401m) were also collected at the sampling site. A co-located, high-resolution proton transfer reaction time-of-flight mass spectrometer (Ionicon Analytik PTR-ToF 8000) from Stony Brook University also made coincident long-term measurements of a smaller subset of key species, some of which were used to validate the performance of the CI-TOF with NH ionization.
To accompany other anthropogenic sources in the EPA emissions inventory, annual emissions from VCPs in NYC counties were estimated using VCPy.v2.0, with a sector-wide uncertainty of 15 % on average (Seltzer et al., 2021, 2022). These are discussed in subsequent sections together with contributions from other anthropogenic sources (derived from National Emissions Inventory (NEI)) as NEI+VCPy (hereafter VCPy+). Additional NYC-resolved comparisons are made with the FIVE-VCP emissions inventory developed at the US National Oceanic and Atmospheric Administration using methods described by McDonald et al. (Mcdonald et al., 2018) and updated for New York City in Coggon et al. (2021). A major update in the latter study was updating the VCP speciation profiles to the most recent surveys of consumer products, fragrances, and architectural coatings. In VCPy, the magnitude and speciation of organic emissions are directly related to the mass of chemical products used, the composition of these products, the physiochemical properties of the chemical product constituents that govern volatilization, and the timescale available for these constituents to evaporate. The most notable updates to VCPy include the incorporation of additional product aggregations (e.g., 17 types of industrial coatings), variation in the VOC content of products to reflect state-level area source rules relevant to the solvent sector, and the adoption of an indoor emissions pathway.
To facilitate calculation of VCP indoor emissions in VCPy, each product category is assigned an indoor usage fraction. All coating and industrial products are assigned a 50 % indoor emission fraction, all pesticides and automotive aftermarket products are assigned a 0 % indoor emission fraction, and all consumer and cleaning products are assigned a 100 % indoor emission fraction. The lone exception is daily use personal care products, which are assumed to have a 50 % indoor emission fraction. This indoor emission assignment enables the mass transfer coefficient to vary between indoor and outdoor conditions. Typically, the mass transfer coefficient indoors is smaller than the mass transfer coefficient outdoors due to more stagnant atmospheric conditions, and the newest version of the modeling framework reflects these dynamics. Indoor product usage utilizes a mass transfer coefficient of 5 m h−1, and the remaining outdoor portion is assigned a mass transfer coefficient of 30 m h−1 (Khare and Gentner, 2018; Weschler and Nazaroff, 2008). More details about the framework can be found elsewhere (Seltzer et al., 2021). Annual production volumes for the different chemical species used in discussion were taken from US EPA's Chemical Data Reporting database (US Environmental Protection Agency, 2016).
Table 1List of ions calibrated with authentic standards (Table S2), probable contributing isomers, geometric mean concentrations (with standard deviations), annual emissions in each inventory, and mean concentration enhancement ratios (with standard deviations of the mean and linear correlation coefficients) with acetone and other tracers. Isomer identifications marked with asterisks (*) were confirmed in offline GC-EI-MS measurements, with additional possible isomers included in Table S7.

a Notes: for comparison to the emissions inventories, the standard
deviation of the mean was used for the compound ratios to constrain the
uncertainty of the average compound ratios over the 10 d period; yet, we
note that higher time
resolution variations in the observed ratios are
expected, given the spatiotemporal variations in emissions from contributing
sources distributed around the site. The listed mean concentrations are
calculated from hourly averages of data
sampled at 1 Hz throughout the
measurement period. Given the varied correlation coefficients against
tracers (Fig. 6), to reduce bias, background-subtracted geometric means
are used to determine the compound ratios, though the
geometric mean ratios
and slopes are similar, especially for well-correlated compound pairs
(Fig. S13). In the case of glycerol, given its low ambient concentration,
the observed background level (i.e., fifth percentile) was 0.1 ppt below
its
calculated limit of detection. Based on this, the glycerol ratio to acetone
for the purposes of Fig. 7's comparison was determined based on their
regression (5.3E −04 Δmol mol; r=0.74) when removing < LOD values.
This has minimal influence on the glycerol-related conclusions related to
its substantially low relative abundance, as the geometric mean enhancement
ratio calculation yielded a similar result (7.9E −04 mol mol−1) when including
all observations (Fig. S13).
3.1 Instrument response to diverse chemical functionalities
Of the thousands of ions observed in the urban ambient mass spectra (Figs. 2a and S5) during online sampling with ammonium adduct ionization, 148 prominent ion signals were targeted for detailed analysis and were assigned compound formulas representing a diverse range of chemical functionalities (Table S3). These ions were selected based on high signal to noise ratios (>3.0) and likely isomer contributions from VCP-related emissions. To confirm sensitivity toward these functional groups, the instrument was calibrated using 58 analytical standards that are also constituents of various consumer and commercial products. The mass spectrum of individual standards showed high parent ion to background signal and negligible fragmentation products (Fig. 2a). Further analysis also showed ammonium adduct formation to be the dominant ionization pathway for these analytical standards for applied instrument settings (Table S4). This simplified the interpretation of the soft adduct parent ions in ambient air mass spectra in contrast to higher-fragmentation-prone proton transfer reaction spectra.
In laboratory tests with the authentic standards, the instrument showed the highest response factors (i.e., ions ppb−1) toward glycol ethers and ketones (Fig. 3, Table S2), with detection limits below 5 parts per trillion (ppt) for several chemical species (Table S5). The response factors for most aliphatic and aromatic esters were 1 order of magnitude smaller than glycol ethers and ketones. Standards for isomers were also run in some cases of possible different compounds contributing to the same ion signal based on multiple prominent compounds estimated in inventories or well-known VCP components. While some isomers elicited similar responses from the instrument, others produced considerably different sensitivities (Fig. S6; Bi et al., 2021). For seven test cases here, the difference in response factors tended to be most pronounced in the case of isomers with small carbon numbers – e.g., ethyl acetate being 8 times higher than butyric acid – while isomers with larger carbon numbers – e.g., ethylene glycol hexyl ether (EGHE) and 1,2 octanediol – produced similar ion intensities. Overall, this sensitivity analysis showed that the calculated concentrations could have significant differences (by a factor of 0.5–8, with a worst-case relative isomer contribution bias spanning 1:4–4:1), especially for the smaller oxygenated compounds tested here, and that the calculated concentrations are dependent on the relative abundance of contributing isomers due to their effect on the overall mass response factor (Fig. S6). Hence, in each case where isomer sets were tested, the mass response factor for the ion was estimated by averaging the instrument response to individual isomers. This can still potentially cause some over- or under-estimation of ion concentrations in ambient air, depending on the relative contribution of isomers to the ion, which is affected by the magnitude of emissions of individual isomers as well as their sources and sinks (and indoor vs. outdoor emissions). We have further constrained this uncertainty by confirming isomer identities wherever possible via offline GC-EIMS measurements using adsorbent tubes (Table 1).
This variability in instrument response could also depend on other physiochemical properties of the analytes, because some acids – e.g., hexadecanoic, fumaric, adipic, and salicylic acids – also responded poorly to calibration. This may be due, in some cases, to poor water solubility (e.g., adipic and hexadecanoic acid) affecting the calibration mixes; this is in addition to the tendency of lower volatility compounds to partition to surfaces that may reduce their transmission efficiency through the LCS delivery lines and the instrument inlet, thus contributing to this marked difference in instrument response between some isomers.
The signal intensities could also be influenced by changes in environmental factors, such as relative humidity, that can modify the relative importance of different ionization pathways in the reaction chamber. However, systematic tests conducted with acetone, MEK, acetonitrile, and α-pinene found their NH-adduct signal intensities to be independent of any changes in relative humidity in the CI-ToF ionization region (Fig. 1). Thus, day-to-day response factors for individual ions were comparable across the entire sampling period and did not require RH-dependent corrections.
Additionally, the CI-ToF measurements were also validated by comparing the concentration time series of some of the OVOCs (i.e., acetone, methyl vinyl ketone (MVK), and MEK) and monoterpenes across the entire sampling period with parallel measurements from a co-located PTR-ToF instrument. While the measurements largely agreed (within 90 %), validating the performance of the CI-ToF instrument (Fig. S7), the slight differences observed could be caused by variations in relative responses to isomers in different ionization schemes of the two instruments.
In case of ion signals that were not quantified, we have carefully considered factors such as annual usage of likely compounds, their atmospheric reactivity, and ionization efficiency with the NH adduct to inform our discussion of their formula assignments. For example, minimal ethanol ions were observed during instrument calibration, suggesting limitations in its detection with the NH reagent ion (Fig. S8). Yet, C2H5OH ion signal was measured during ambient sampling. Given the densely urban sampling location, we hypothesize that this measured C2H5OH signal was dimethyl ether that is used in personal care products (propellant) and that has some potential use as fuel or refrigerant. It was not calibrated for, and we could not confirm its abundance using another measurement in this study. However, ethanol emissions are still expected to exceed those of dimethyl ether based on the inventories, and instrument settings may affect its relative sensitivity between these two isomers. Similar assessments are made wherever possible in the discussion of temporal trends of uncalibrated ions.

Figure 2(a) Negligible parent ion fragmentation (with high signal to noise ratios) across diverse chemical functionalities in CI-ToF allows for measurements of understudied chemical species (examples from authentic standards shown). (b) Average ToF mass spectra obtained from NH and H3O+ (i.e., PTR) ionization schemes binned over 10 intervals using data from the same Vocus CI-ToF at the site. The CI-ToF spectra observed greater ion signal in the approximate intermediate-volatility into the semi-volatile region (e.g., ≥160 ). Note: in (b), the NH and PTR signals are offset by 18 and 1 , respectively, to account for the difference in the mass of the reagent ion and the averages are from different days when the reagent ion was switched.
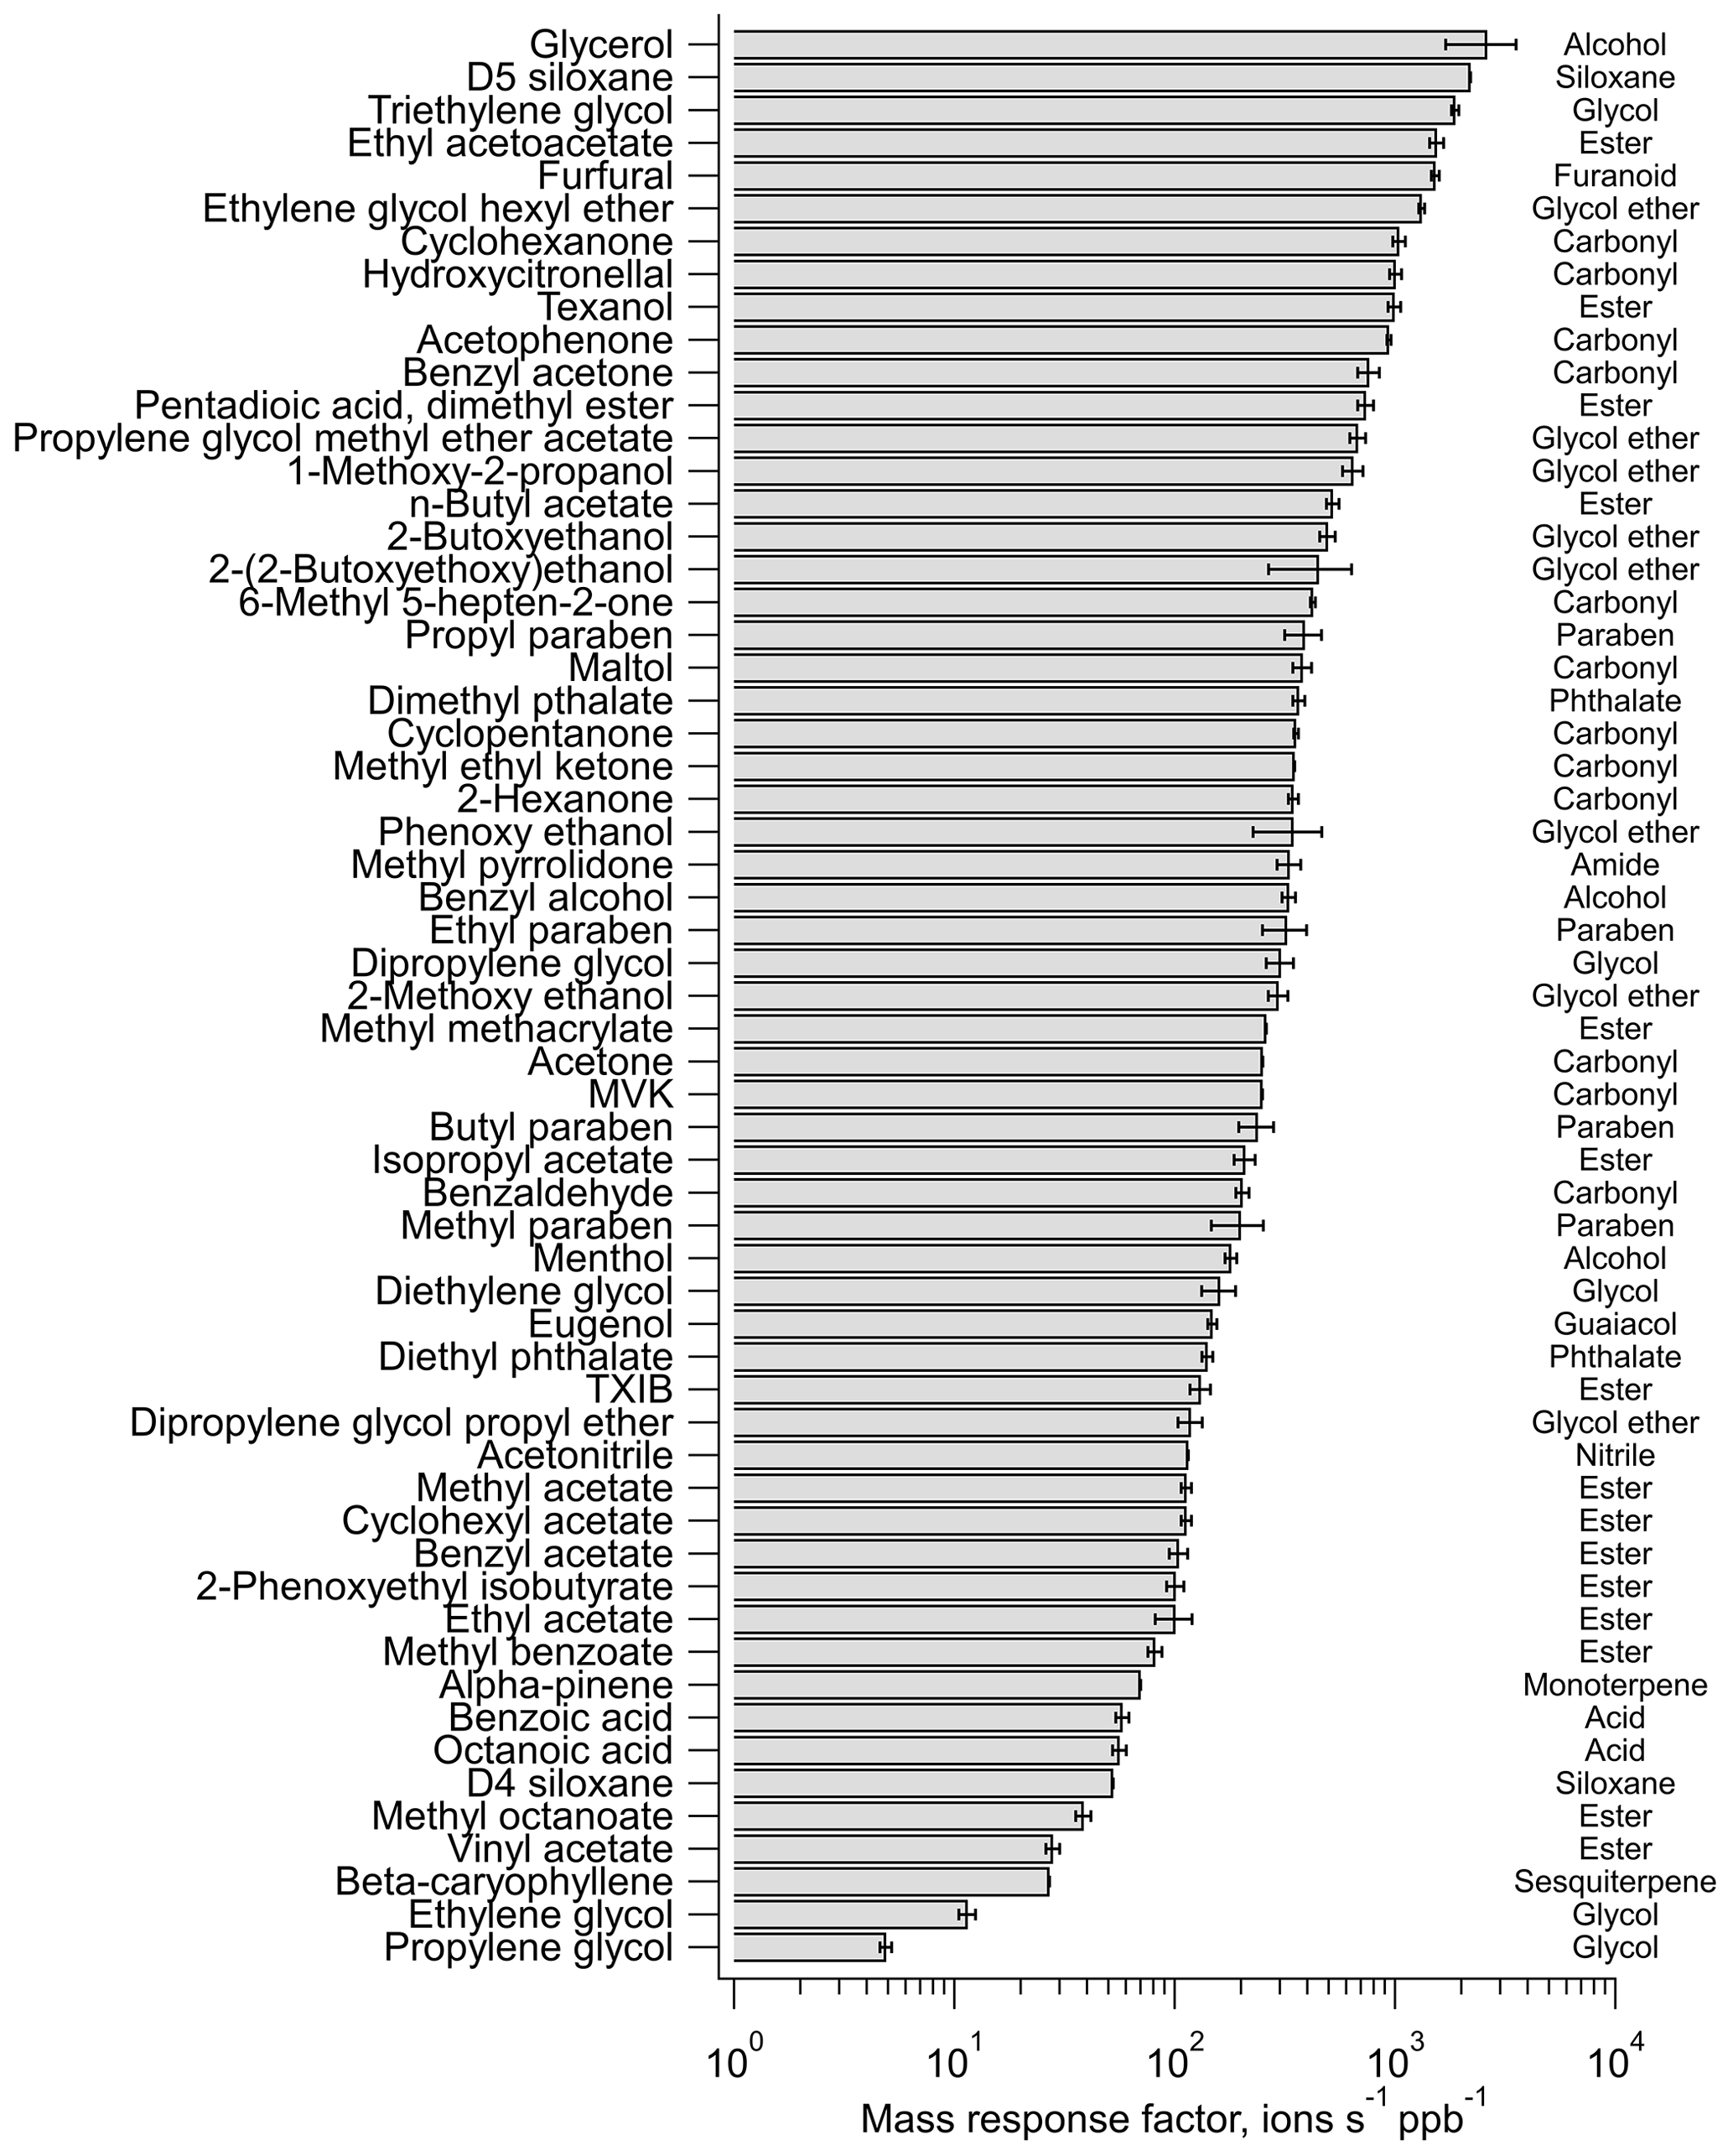
Figure 3The response of the CI-ToF with NH ionization toward select calibration standards containing a diverse range of chemical functional groups and molecular structures, which are listed (right) for reference; however, we note the multi-functionality of some of the compounds.
Vocus CI-ToF captured relatively more ion signal in the 150–350 range (i.e., normalized to the total signal of the mass spectra) when compared with PTR ionization using the same instrument at the same site (Fig. 2b). This was due to the formation of strongly bonded NH-analyte adduct molecules at low collision energies that preserved large functionalized analytes. In comparison, PTR-ToF can strongly fragment certain functionalized analytes (e.g., alcohols) during proton addition, rendering interpretation difficult. Hence, we are able to examine a greater diversity of volatile to semi-volatile functionalized compounds with CI-ToF measurements that are known to be emitted by a wide range of volatile chemical products.
3.2 Influence of atmospheric conditions and transport on observed concentrations
The concentrations of measured ions varied significantly over the 10 d sampling period, influenced by changes in meteorology and dilution as well as by temporal changes in emissions. The concentrations showed clear dependence on wind velocity (4.5 m s−1 avg.) and direction, indicating variations in both emission rates and dispersion across different areas upwind of the site. The highest concentration signals were observed between 22 and 25 January, when slower winds (<5 m s−1) arrived from the southwest, south, and east across various parts of Manhattan leading up to the site (Figs. S2 and S9). These areas are characterized by a high population density and include a wide range of commercial activities that could contribute to the concentration enhancements. Multiple types of diverse sources of OVOCs can exist here and in other urban areas, though current emissions inventories suggest that the inventoried target species in Table 1 are primarily emitted from VCPs in New York City, with minimal or negligible contributions from other sources such as on- and non-road sources and current inventory estimates of cooking and biomass burning (Table S6). Similarly, recent source apportionment using mobile laboratory measurements in NYC also attributes the majority of the signals for several of the highly emitted species observed here (e.g., acetone, C2H4O2, C4H8O) to a general VCP-related source factor (that may include minor contributions from other sources; Gkatzelis et al., 2021b).
Additional concentration spikes and smaller enhancements were observed on 27 January, with similar southwesterly winds at higher speeds. Prolonged concentration enhancements were also observed on 30 and 31 January, with slower (<5 m s−1) winds predominantly from the east, passing over Harlem (Manhattan) after crossing the also densely populated Bronx, which has varied commercial and industrial activities. Observed concentrations at the site were lowest with west-northwesterly and northwesterly winds originating from relatively less densely populated areas as well as in periods of the highest wind speeds.
Concentration trends generally overlapped across all compound classes, with a few exceptions (e.g., C5H8O2), with variations in their covariances (see Sect. 3.3). This demonstrates a major role for meteorology in determining local VOC concentrations at the site and elsewhere in NYC. Still, in some cases (e.g., nitropropane, 2,5 dimethyl furan), the influence of certain short-term sources – such as possible local and/or regional wintertime biomass burning contributions – were observed as temporary sharp spikes in compound abundances.
By influencing the rate of advective transport of pollutants, wind speed also directly impacts the time available for chemical species to undergo oxidation in the atmosphere. Atmospheric oxidation can be an important sink for different chemical species and also a secondary source for some OVOCs (e.g., alcohols, carbonyls; Franco et al., 2021; Mellouki et al., 2015). Therefore, accounting for their reaction timescales is necessary in the interpretation of their relative abundances. During this sampling campaign, with a local average wind speed of 4.5 m s−1 (Fig. S9), this translated to 0.5–2 h of daytime photochemical aging for emissions within 10–30 km of the site (encompassing all of Manhattan, Brooklyn, Queens, the Bronx, and much of urban metro NYC in New Jersey; Fig. S2).
For species under consideration in this study, the rate constants for reaction with hydroxyl radicals (OH•) ranged from 10−11 to 10−13 molec.−1 cm3 s−1, as obtained from the OPERA model and other studies (Aschmann et al., 2001; Mansouri et al., 2018; Picquet-Varrault et al., 2002; Ren et al., 2021). Given wintertime OH concentrations of approximately 106 molec. cm3 in NYC (Ren et al., 2006; Schroder et al., 2018), this puts their daytime atmospheric lifetimes (i.e., e-folding times) between 1–2 d to several months, with some variation across OH concentrations. For average wind speeds observed during sampling, this translated to daytime concentration losses of 10 % or less for the vast majority of measured species if emitted within a distance of 10–15 km of the site (Fig. S10), which includes all of Manhattan and other densely populated areas of NYC and adjacent New Jersey (Fig. S2).
Secondary production represents a major potential source of OVOCs – one that will be at a relative minimum in the wintertime conditions, but long-distance transport of OVOCs in the background air entering NYC will include significant secondary contributions as well as some transport of primary emissions from further upwind. In the subsequent calculations of urban enhancements (Table 1) used in the emission inventory comparison (Sect. 3.5), these incoming background contributions are minimized by subtracting the fifth percentile for each measured species to reduce the influence of non-local primary and secondary sources outside the scope of the NYC-focused inventories used here. These urban enhancement calculations (discussed further in Sect. 3.5) are aided by the very densely populated nature of NYC and the density of VCP-related and other anthropogenic sources – for example, recent mobile measurements show over 95 % reduction in D5 concentrations outside NYC relative to Manhattan and surrounding areas, indicating minimal contributions from urban sources outside of NYC (Coggon et al., 2021). For the select VCP-related species examined in those studies and at our site, the mobile measurements (Coggon et al., 2021; Stockwell et al., 2021) in the relatively less densely populated regions to the north and northwest of NYC show background concentrations comparable to our fifth percentile concentrations, which typically came with winds from that direction and/or periods with high wind speeds of 7–8 m s−1 or greater (enhancing dilution; Figs. 4–5 and S9).

Figure 4The concentration time series of select, widely used acetates and glycol ethers. Time series are shown with major isomers as examples, with a more comprehensive list available in Tables 1 and S7. Displayed uncertainty bands are a function of calibration uncertainties (including for isomer pairs; Table S2).

Figure 5Concentration time series of select prominent ions that include contributions from major VCP-related compounds (examples listed; see Tables 1 and S7 for expanded list).
Despite wintertime conditions, local secondary production of OVOCs via atmospheric oxidation will occur (over the distances described above), with the potential for locally produced OVOCs that could be included in the urban enhancement calculations. However, the field site's location amongst a high density of VCP-related (and other) sources and the observed OVOC enhancements occurring with winds from more densely populated areas (Figs. 4, 5, and S9) supports the dominance of primary emissions in wintertime and drives the well-correlated enhancements with OVOC tracers, which aids the inventory comparison. For context, Gkatzelis et al. (2021b) reported that only ∼20 % of wintertime acetone in NYC is related to secondary production, which would include contributions from oxidation both locally and over longer distances, and the approach here subtracts the latter background contributions.
For future work at the site, we note that daytime OH concentrations in NYC during summer will be higher (e.g., 5 times the winter values in NYC; Ren et al., 2006), which can affect the interpretation of source contributions to more reactive chemical species with shorter lifetimes and secondary production. The other important daytime oxidant ozone is not likely to react significantly in the absence of non-aromatic unsaturated C=C bonds in most targeted ions in this study (de Gouw et al., 2017), especially during the winter. The reaction rate (k) values for nighttime oxidation with the nitrate radicals are 1 to 4 orders of magnitude smaller (–10−15 molec.−1 cm3 s−1), with average NO3 concentrations on the order of 108 molec. cm−3 (Asaf et al., 2010; Cao et al., 2018). Thus, nighttime oxidation is not likely to lead to shorter VOC lifetimes compared to those calculated for daytime OH oxidation. In all, it is unlikely that the emissions of the target compounds in this study were substantially influenced by oxidative losses in the ambient atmosphere and were predominantly driven by the magnitude of emissions in NYC and their atmospheric dilution. Yet, the observed ambient concentrations of different species could potentially be affected by the extent of their indoor vs. outdoor usage, seasonal patterns in applications (e.g., wintertime outdoor use of ethylene glycol as antifreeze), or physical processes related to their sources or sinks (e.g., partitioning).
3.3 Ambient measurements across diverse chemical classes
Within the broader distribution of ion signals across the entire ambient mass spectra, we identified a diversity of chemical species. A selection of the most prominent ions in various compound categories are discussed in this section. Table S7 summarizes different use sectors, but the vast majority have uses in personal care products, fragrances, a wide range of solvents, and/or other volatile consumer products. As such, some of the most abundant ions observed here were related to compounds found in the formulations of these types of products and/or had large annual production volumes (US Environmental Protection Agency, 2016). For some volatile compounds that exhibited low atmospheric abundances despite large annual production, it is possible that a substantial fraction of the production volume goes as feedstock to manufacture derivatives or are otherwise not prone to gas-phase emissions. Yet, seasonal differences in use, partitioning to the gas phase, and/or indoor-to-outdoor transport could also contribute to potential inter-annual variations.
The ions above 100 ppt on average included those with contributions from acetates, C2H6O (e.g., ethylene glycol), C3H6O (e.g., acetone), C2H3N (e.g., acetonitrile), C10H16 (e.g., monoterpenes), C4H8O (e.g., methyl ethyl ketone), and C5H8O2 (e.g., methyl methacrylate; Table 1). A detailed discussion of the trends in concentrations and ion abundances of these and other ions is presented below and separated into distinct categories based on chemical class or use type.
3.3.1 Esters
Prominent esters observed in this study and discussed here include acetates and acrylates. C3H6O2, C4H6O2, C4H8O2, C5H10O2, and C6H12O2 were ions with some of the highest ambient concentrations in our data and whose geometric mean concentrations varied between 0.1–0.8 ppb (Fig. 4a–f). Small acetates (e.g., methyl-, ethyl-, propyl-, and butyl- acetates) are likely major contributors to these ion signals, since they are being extensively used as oxygenated solvents and contribute to natural and designed fragrances and flavorings. The VCPy+ model estimates the annual emissions of these acetates to be on the order of 104−105 kg yr−1 in NYC, but other compounds can also contribute to these ions. For example, hydroxyacetone and propionic acid may add to C3H6O2, diacetyl and γ-butyrolactone to C4H6O2, methyl propionate and butyric acid to C4H8O2, isobutyl formate to C5H10O2, and diacetone alcohol and methyl pentanoate to C6H10O2. However, their estimated emissions are 1–2 orders of magnitude smaller than each of the acetates, likely making them minor contributors to observed ion intensities. C8H14O2 (e.g., cyclohexyl acetate) and C9H10O2 (e.g., benzyl acetate) were also important ions within this category, with average concentrations at 40 ± 20 ppt and peaks reaching up to 150 ppt during the measurement period.
We observed hourly C5H8O2 concentrations exceeding 1 ppb (Fig. 5), which includes methyl methacrylate (MMA) and potential contributions from 2,3-pentanedione and ethyl acrylate, given their use as solvents in various coatings and inks. MMA sees some use in adhesives, paints, and safety glazing (estimated emissions ∼103 kg yr−1; VCPy+) but could also potentially be emitted from the common polymer poly (methyl methacrylate) (PMMA), which is used in plastic materials. With a geometric mean concentration of 100±120 ppt, the possible contributions of PMMA off-gassing and/or degradation as a source of ambient MMA warrant further investigation, though this has been observed in polymer studies (Bennet et al., 2010). In addition to isomer-specific observations of MMA, we note that most of the acetates were also confirmed via offline measurements using adsorbent tubes that were analyzed using GC EI-MS for compound-specific identification (Table 1).
3.3.2 Carbonyls
Carbonyls are also extensively used as replacements for non-polar solvents in various consumer and commercial applications along with use in cosmetics and personal care products. Hence, C3H6O (e.g., acetone), C4H8O (e.g., methyl ethyl ketone), and C6H12O (e.g., methyl butyl ketone) were expectedly present at relatively high concentrations. Given the absence of considerable known emissions of other isomers, the ion intensities were mainly attributed to these carbonyl compounds.
We acknowledge that other primary and secondary sources may also exist for some carbonyl species, including unknown contributions from combustion-related sources, cooking, or other anthropogenically influenced sources. Yet, VCPs are the dominant source of acetone in NYC, as per the latest emissions inventories (VCPy+ and FIVE-VCP) and the recent source apportionment of wintertime mobile measurements in NYC that attribute most of the observed acetone signal to the VCP-related source factor (Gkatzelis et al., 2021b).
Acetone showed the highest average concentrations in urban air among all carbonyl solvents detected (Table 1). Since biogenic and local secondary sources of acetone (i.e., from atmospheric oxidation) are relatively reduced in NYC wintertime conditions, the measurements are consistent with very high anthropogenic emissions in NYC (∼106 kg yr−1) and extensive use in products and by industries (∼109 kg yr−1 nationwide) as well as with recent work on acetone in NYC (Gkatzelis et al., 2021b).
MEK was the second highest carbonyl observed, with C4H8O ion concentration spanning from 50 to over 500 ppt. Its estimated emissions are 0.4–3×10⁵ kg yr−1 or greater in NYC, and it finds significant use in coatings with large annual nationwide consumption (∼108 kg yr−1). Methyl butyl ketone (MBK) and cyclohexanone were the next most abundant in this category. The average concentration of MBK at 58 ± 42 ppt was nearly 50 % of MEK but reached up to 300 ppt during the initial 4 d of the sampling period. Cyclohexanone, however, was much smaller at 12 ± 7 ppt, with its highest concentrations reaching up to only 35 ppt across the measurement period, which was consistent with its emissions in VCPy+ (∼400 kg yr−1) being at least 2 orders of magnitude smaller than other species in this category, though its estimated emissions in FIVE-VCP were much higher (Table 1).
3.3.3 Glycols and glycol ethers
Glycols and glycol ethers are compound classes that have been traditionally challenging to measure in real time with PTR-ToF instruments, being prone to ionization-induced fragmentation during online sampling. With Vocus CI-ToF, we were able to measure signals of several glycol and glycol ether compounds. The most prominent ones included C2H6O2, C3H8O2, C6H14O2, and C4H10O2 ions, whose concentrations ranged between 10–500 ppt across the sampling period (Fig. 4g–l), with C2H6O2 reaching ppb levels.
C2H6O2 (e.g., ethylene glycol) was the most abundant observed compound in this study (Table 1). The emissions of ethylene glycol in NYC are estimated to be on the order of 3–4×10⁵ kg yr−1, which is smaller than acetone by a factor of 3 (∼106 kg yr−1; VCPy+ and FIVE-VCP). Still, the mean concentration of C2H6O2 (2.4 ± 3.6 ppb) was found to be considerably larger than that of C3H6O (0.95 ± 0.73 ppb). This difference in their relative ratio could not be explained by their atmospheric lifetimes, since ethylene glycol is estimated to be considerably shorter lived than acetone (1.5 vs 33 d).
The C3H8O2 ion (20–450 ppt) likely represented propylene glycol, which was the highest emitted isomer in NYC (∼105 kg yr−1; VCPy+ and FIVE-VCP) estimates, with comparatively minor contributions from 2-methoxy ethanol and dimethoxymethane, all of which are used as solvents in varnishes and various cosmetics. C6H14O2, including 2-butoxyethanol, a coupling agent in water-based coatings as well as a solvent in varnishes, inks, cleaning products, and resins, was observed at 10–150 ppt. The estimated emissions of isomer hexylene glycol are 100 times smaller and would likely not have contributed much to the C6H14O2 ion signal.
C4H10O2, which ranged between 10–80 ppt, includes 1-methoxy-2-propanol and 2-ethyoxyethanol, as both are used as organic solvents in industrial and commercial applications. Based on emissions estimates, 1-methoxy-2-propanol is expected to be the dominant contributor to this signal, with NYC emissions of ∼2–3×10³ kg yr−1, which are 30–50 times higher than 2-ethoxyethanol in estimates. C6H12O3 varied over a similar concentration range (5–80 ppt), resulting from propylene glycol methyl ether acetate (a.k.a. PGMEA) emissions (∼0.7–1×10⁴ kg yr−1). The estimated emissions of the other likely isomer, 2-ethoxyethyl acetate, were lower by a factor of 100. Relatively smaller concentrations of C8H10O2, C8H18O2, and C8H18O3 ranging between 2–30 ppt were also observed (Fig. 4j–l); these would include glycol ethers, considering their higher emissions relative to other isomers.
3.3.4 Select compounds related to personal care products
Many personal care products routinely include D5, which is often used as a tracer for emissions from this source category (Gkatzelis et al., 2021a). Hence, we attributed all of the measured C10H30O5Si5 ion abundance to D5 in this study. Both the VCPy+ and FIVE-VCP inventories estimate the annual emissions of D5 to be slightly higher (∼15 kg yr−1) than common oxygenated solvents, e.g., esters. However, its ambient concentration was found to be much lower in comparison to them and other oxygenated solvents, varying from 10 to 140 ppt during the 10 d period, with a geometric mean of 16 ppt. Other studies report similar concentrations in US cities (Coggon et al., 2018; Stockwell et al., 2021). Compared to the emissions inventories, the expected ambient concentrations relative to acetone were lower by a factor of 2 (see Sect. 3.5, Table 1). Hypotheses for this difference include potential variations with wintertime conditions (e.g., partitioning), the relative amount emitted indoors vs outdoors, limitations in indoor-to-outdoor transport with reduced wintertime ventilation, and/or D5's behavior as a semi-volatile species in the presence of indoor condensational reservoirs (Abbatt and Wang, 2020; Wang et al., 2020). The distinct enhancement in ambient concentrations of D5 in the morning and evening hours in incoming winds over Manhattan indicated that people were a dominant emissions pathway of D5 emissions in NYC, which demonstrates relatively less indoor-to-outdoor transport during the day, though this could be influenced by wintertime ventilation conditions (Sheu et al., 2021; Wang et al., 2020). By comparison, while estimated emissions of benzyl alcohol in NYC were only ∼20 % of D5, it had similar average concentrations to D5 (Table 1), ranging from 8 to 40 ppt. With strong correlations with many VCP-related compounds (Fig. 6), wide use in various consumer product formulations, and a similar kOH to m-xylene (i.e., molec.−1 cm3 s−1), benzyl alcohol showed its potential as an additional VCP-related compound for routine monitoring and analysis.
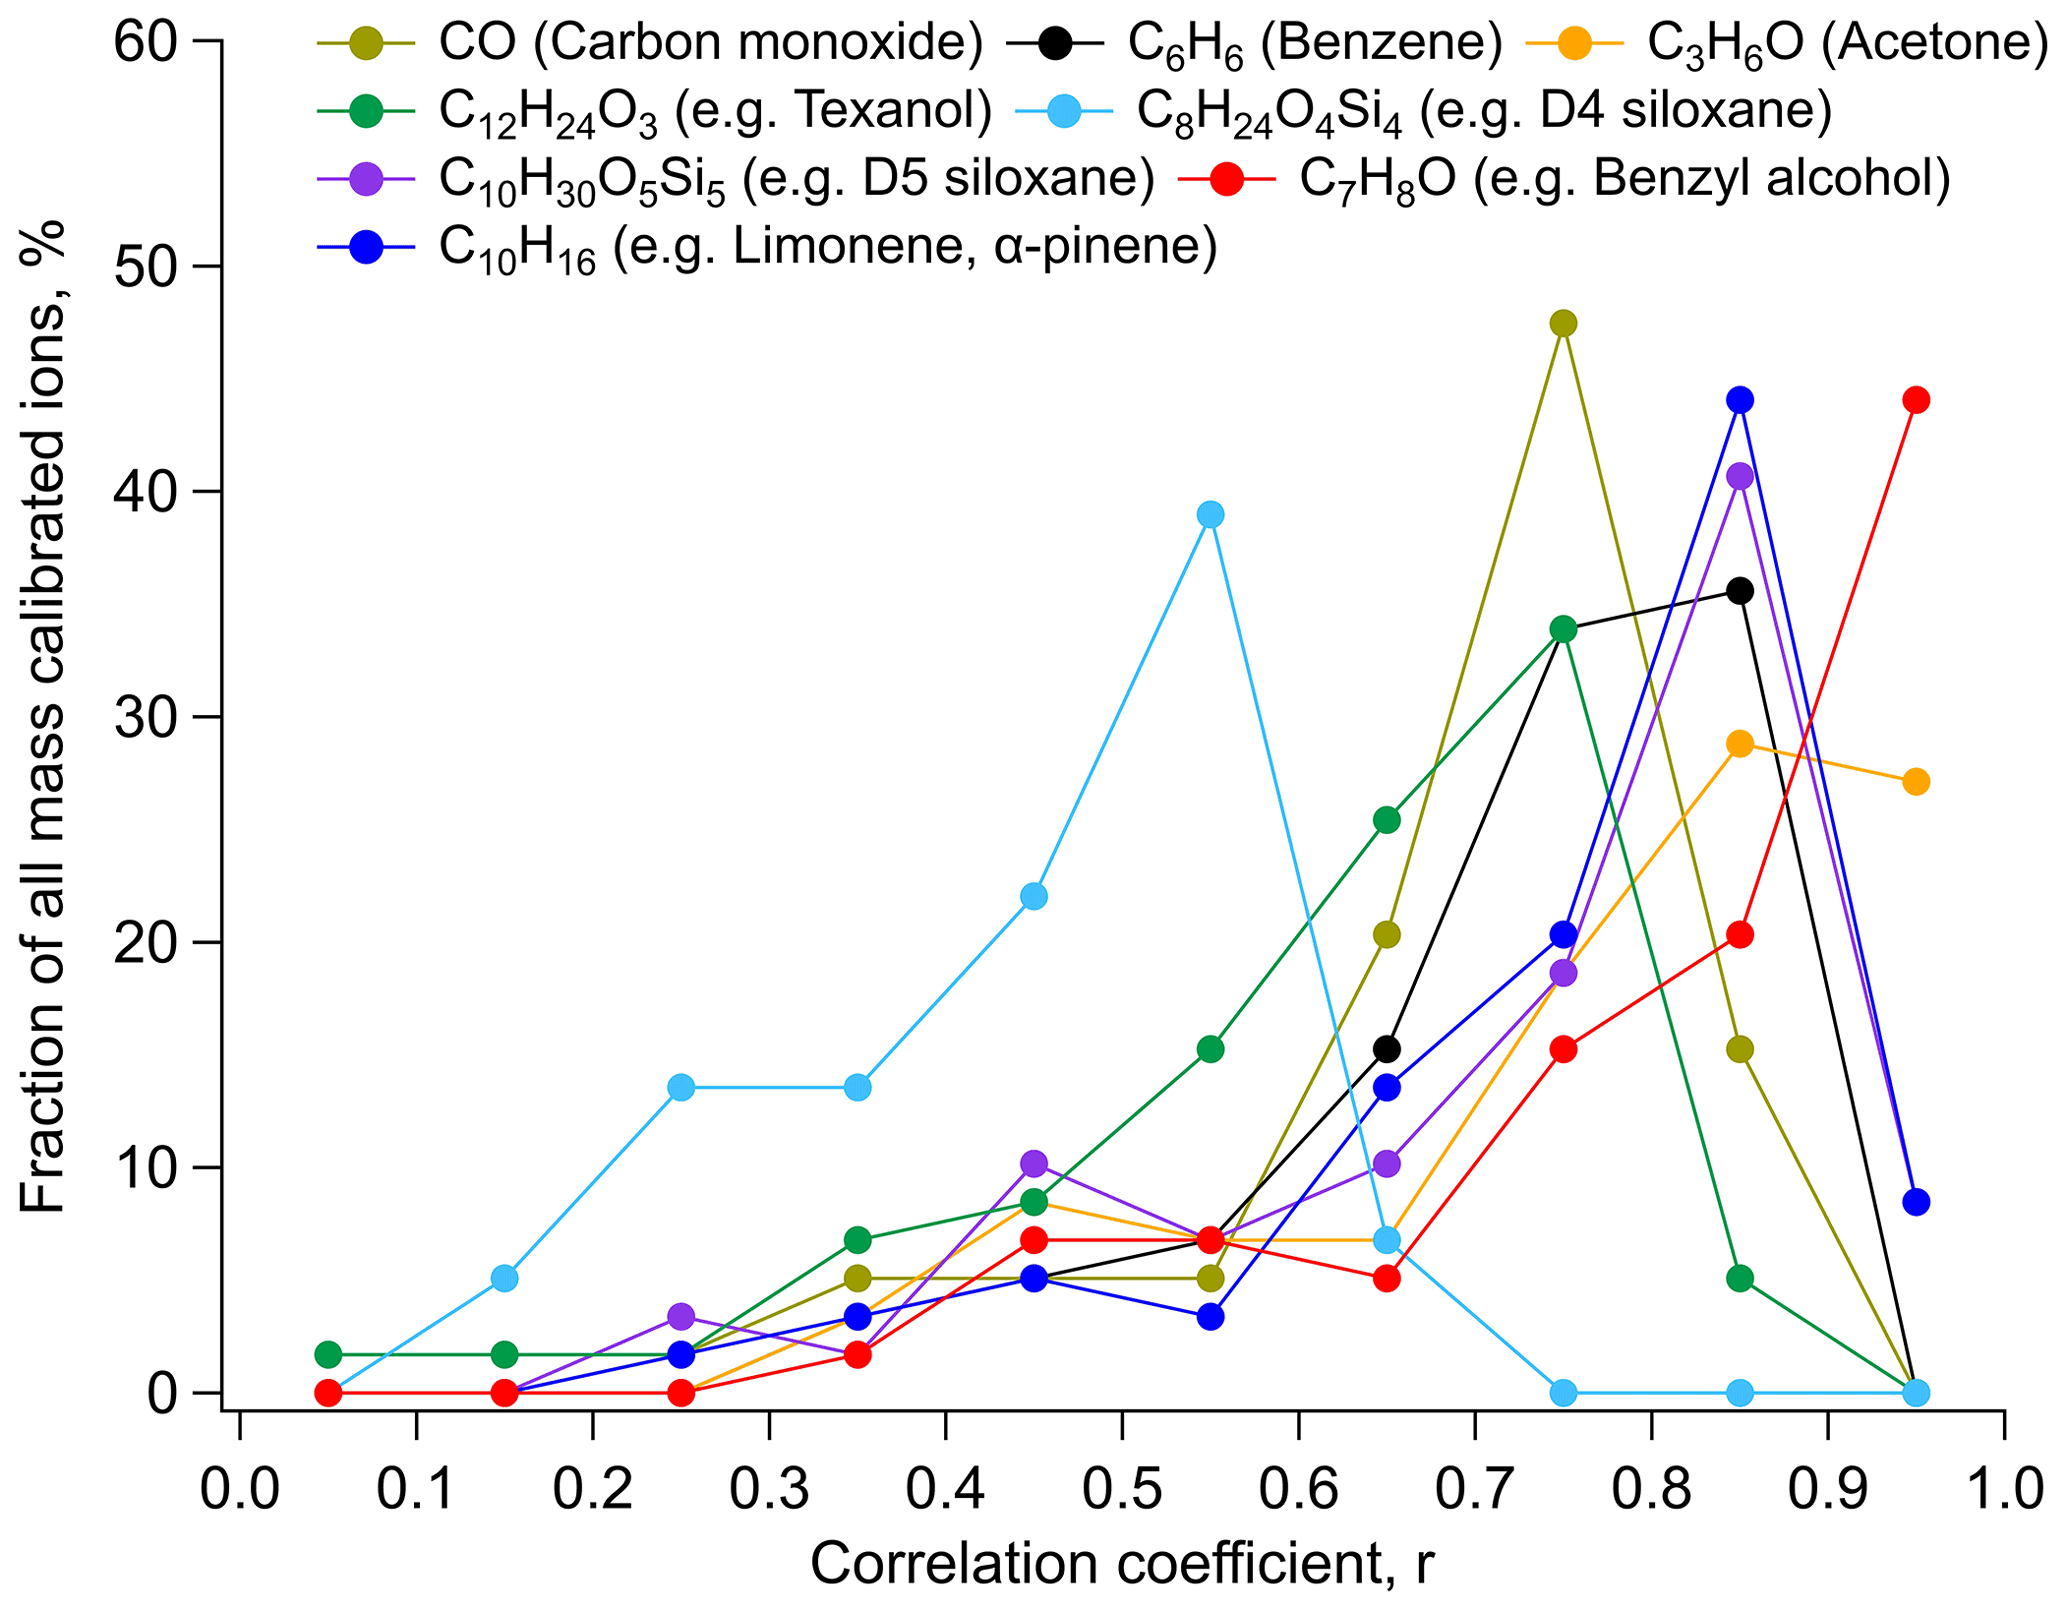
Figure 6A comparison of correlations to major tracer compounds. Distributions of correlation coefficients (using hourly average data) for Table 1 compounds against select prominent compounds used as markers of VCP-related sources or general anthropogenic emissions (e.g., CO, benzene). Results binned into 0.1 intervals; for example, ∼45 % of compounds were highly correlated at with C7H8O (i.e., benzyl alcohol). See SI for similar analysis, including all uncalibrated target ions and correlation comparisons for all target compounds (Figs. S14–S17 and S19).
The glycerol-related C3H8O3 ion was especially interesting. Only 1–7 ppt was detected across the measurement period even though it is widely used in the personal care industry, with estimated annual emissions in NYC on the order of 105 kg yr−1. However, Li et al. (2018) show in a laboratory evaporation study that glycerol evaporation is much slower than expected. Still, glycerol is expected to influence air quality based on its projected emissions (Gkatzelis et al., 2021b), and no other isomers exist with significant known emissions. Yet, the ratio of background-subtracted concentrations of C3H8O3 to D5 (ΔC3H8OD5) was 0.035 despite a much higher ratio of estimated emissions (2, 12 mol mol, FIVE-VCP). This suggests that C3H8O3 is significantly lower than would be expected based on D5-related activities and potentially points to limitations in evaporation, indoor-to-outdoor transport, or atmospheric partitioning – all of which could be influenced by wintertime conditions.
C8H8O3, C9H10O3, C10H12O3, and C11H14O3 are paraben-related ions, but additional isomers (e.g., p-ethoxybenzoic acid for C11H14O3) might also contribute to these ion signals. Several others are less likely to be found in the atmosphere, since they are not directly used in formulations of volatile chemical products but rather as feedstocks for derivatives used in different industries. Some isomers, such as vanillin and vanillylacetone, are also used in food flavoring. Methyl paraben-related C8H8O3 showed the highest concentration among these four ions, ranging from 8 to 35 ppt across the sampling period. The remaining three had concentrations under 10 ppt throughout the sampling duration.
3.3.5 Select IVOCs related to coatings
The C12H24O3 and C16H30O4 ions were primarily attributed to texanol and 2,2,4-trimethyl-1,3-pentanediol diisobutyrate (TXIB) emissions that are widely used in coatings (Gkatzelis et al., 2021a). Even though estimated emissions of texanol (1.9–2.5×10⁵ kg yr−1) are much higher than TXIB (2500 kg yr−1; FIVE-VCP) and even though texanol production on a national scale (45–110 Gg) considerably exceeds TXIB (22–44 Gg; US Environmental Protection Agency, 2016), the concentrations of both these species had a similar range (5–30 ppt), with enhancements in TXIB concentrations above the fifth percentile background being comparable to texanol on average (Table 1). Given reduced photochemistry, this may suggest differences in outdoor vs indoor application, some geographical variability in their use, and/or larger diversity in TXIB sources than in texanol in this particular urban area.
3.3.6 Phthalates and fatty-acid methyl esters (FAMEs)
Phthalates have received considerable attention in indoor environments, but their concentrations in ambient air are relatively less constrained. In this study, the ion intensities of C10H10O4 and C12H14O4 include dimethyl phthalate (DMP) and diethyl phthalate (DEP), respectively, which are two commonly used phthalates in various consumer products. C10H10O4 and C12H14O4 had similar ion abundances across the 10 d sampling period. After accounting for differences in instrument response, C10H10O4 concentrations were found to be smaller than C12H14O4 throughout the campaign, which aligns with DEP emission estimates being greater than DMP in NYC. The ambient concentrations of the two ions ranged between 5–30 ppt and often synchronously peaked between midnight and early morning hours (00:00–06:00), while the lowest daily concentrations were observed during afternoons. These concentration trends indicated that, unlike compounds associated with personal care products, phthalate concentrations were less influenced by outdoor human activities.
FAMEs are also an important class of compounds used in various consumer products. Via CI-ToF, we identified C9H18O2 (e.g., methyl octanoate) and C11H22O2 (e.g., methyl decanoate) ions that varied similarly in their abundances across the campaign period. C9H18O2 concentrations ranged from 50 to 200 ppt and showed slightly higher ion abundances than C11H22O2, even though the annual production of methyl octanoate for use in consumer and commercial products (0.5–9 Gg) is considerably lower than methyl decanoate (4.5–22 Gg; US Environmental Protection Agency, 2016). This suggested that isomers such as heptyl acetate and propyl hexanoate, which are used in perfumes and food flavoring, may have also contributed to C9H18O2 signals. Emissions of pentyl butyrate, which has uses such as being an additive in cigarettes, are also possible. The highest abundances in both C9H18O2 and C11H22O2 corresponded to wind currents from Manhattan as well as the Bronx, which infer comparable emission rates within New York City.
3.4 Other observed ions of interest
Of the total ions measured, a subset of isomers covering diverse chemical functionalities were included for calibration, while others were not calibrated or presented challenges associated with their physiochemical properties that caused transmission issues during LCS calibration. Hence, we will discuss trends in such ions in this subsection in terms of their measured ion abundances (Table S3, Fig. S11). These include ions with likely contributions from ethanolamines, organic acids, large alkyl methyl esters, and some oxygenated terpenoid compounds that are used in a wide range of volatile chemical products.
Anthropogenic sources are major contributors of oxygenated terpenoid compounds (i.e., oxy-terpenoids) in many urban areas, especially during wintertime. Among relevant ions observed, C10H16O (e.g., camphor), C10H18O (e.g., linalool), C10H20O (calibrated with menthol), and C7H10O (e.g., norcamphor) were the most prevalent in terms of measured abundances. A number of isomers that are similarly used in various consumer products likely contributed to their signal intensities. It is interesting to note that C10H16O exhibited higher ion abundance than C10H18O despite comparable estimated emissions of camphor and linalool (∼103 kg yr−1; VCPy+) in NYC. This could be due to differences in CI-ToF response factors, the magnitude of relative isomer contributions, seasonal trends in the use of chemical species, or uncertainties in fragrance speciation within emissions inventories. The peaks in abundances of all oxy-terpenoids were observed synchronously in the morning hours between 08:00–10:00 and in the evening between 18:00–20:00, consistent with major commuting periods, especially when wind currents blew in from over Manhattan from the south and south-east, where the outdoor activity peaks during morning and evening commute hours.
We detected C2H7NO, C4H11NO2, and C6H15NO3 ions at the site, representing ethanolamine, diethanolamine, and triethanolamine, respectively. Of these, C4H11NO2 and C6H15NO3 followed trends of other VCP-related compounds. C4H11NO2 showed the highest ion abundance throughout the campaign, with the exception of a 24 h period between 26 and 27 January when C2H7NO abundances increased dramatically. This peak in C2H7NO was potentially caused by biomass burning, since ions pertinent to 2-methylfuran, methyl isocyanate, nitromethane, and 2,5 dimethylfuran also peaked simultaneously during this period. The influence of biomass burning in all cases was subsequently filtered from the ion abundance time series prior to investigating their linear regressions with other species (Fig. S15). C4H11NO2 showed much greater variations with wind patterns, more similar to other VCPs, and peaks were noted in early morning hours between 06:00–09:00 and during early evening hours around 18:00 C6H15NO3 showed lower signal relative to C2H7NO and C4H11NO2, which could be attributed to its smaller annual production for use in consumer and commercial products (45–113 Gg), variations in CI-ToF response factors, and/or lower volatility that could decrease emission timescales and cause it to partition to available surfaces indoors.
Several other major ions included C7H14O2, C8H16O2, C12H24O2, C16H32O2, and C18H34O2, which were difficult to attribute to individual chemical species because of the prevalence of several possible isomers. These isomers were most probably esters and carboxylic acids that are used in many consumer, commercial, and industrial applications. The esters could have contributed more in some cases, given their higher volatility and also because some carboxylic acids are used as feedstocks to produce esters. We briefly discuss these ions here to guide future measurements.
C7H14O2 was the most abundant ion in this group, likely due to contributions from amyl acetate, isoamyl acetate, and butyl propionate, which are used as solvents, fragrances and flavorings, and in other commercial and industrial applications, with possible contributions from heptanoic acid. C8H16O2 was the next most prominent and is likely related to octanoic acid, hexyl acetate, pentyl propanoate, and butyl butyrate. C8H16O2 emissions ( kg yr−1) were predominantly (90 %) estimated to be hexyl acetate by the VCPy+ model. In comparison, amyl acetate (i.e., C7H14O2) is estimated in much smaller amounts across the two inventories (∼5–500 kg yr−1). Yet, the higher abundance of C7H14O2 suggested major contributions from other isomers and/or variations in CI-ToF sensitivity. By comparison, we calibrated C8H16O2 using octanoic acid, given its widespread use in various personal care and cosmetic products. This gave C8H16O2 concentrations ranging from 50 to 300 ppt across the measurement period, but considerable variation is possible with ester contributions to the ions' mass response factors. Among other ions, the abundance of C12H24O2 was comparable to C8H16O2. The larger ions, C16H32O2 and C18H34O2, showed very small (<10 ions s−1) abundances throughout the campaign. Interestingly, the low ion abundances occurred despite the VCPy+ model's sizable emission estimates of alkyl methyl esters (C16-C18) on the order of 105 kg yr−1 in NYC, which is similar to more volatile esters such as methyl or ethyl acetates. This highlights the importance of further research on these semi-volatile organic compounds across seasons to examine if they have lower emissions or could have partitioned to the particle phase in the atmosphere during the winter.
3.5 Assessment of ambient concentrations relative to current emissions inventories
In our analysis, high emission estimates did not always translate to high average ambient concentrations and vice versa (Figs. 7 and S12), which warrants further examination of ions (and contributing isomers) that were either highly abundant, differed significantly from expected based on emissions inventories, or had limited prior measurements. Though ambient concentrations of a chemical species may not always directly reflect the magnitude of its primary emissions due to atmospheric processes, relative concentrations are frequently used in studies to evaluate the relative magnitude of emissions of various compounds (Gkatzelis et al., 2021a; Mcdonald et al., 2018).
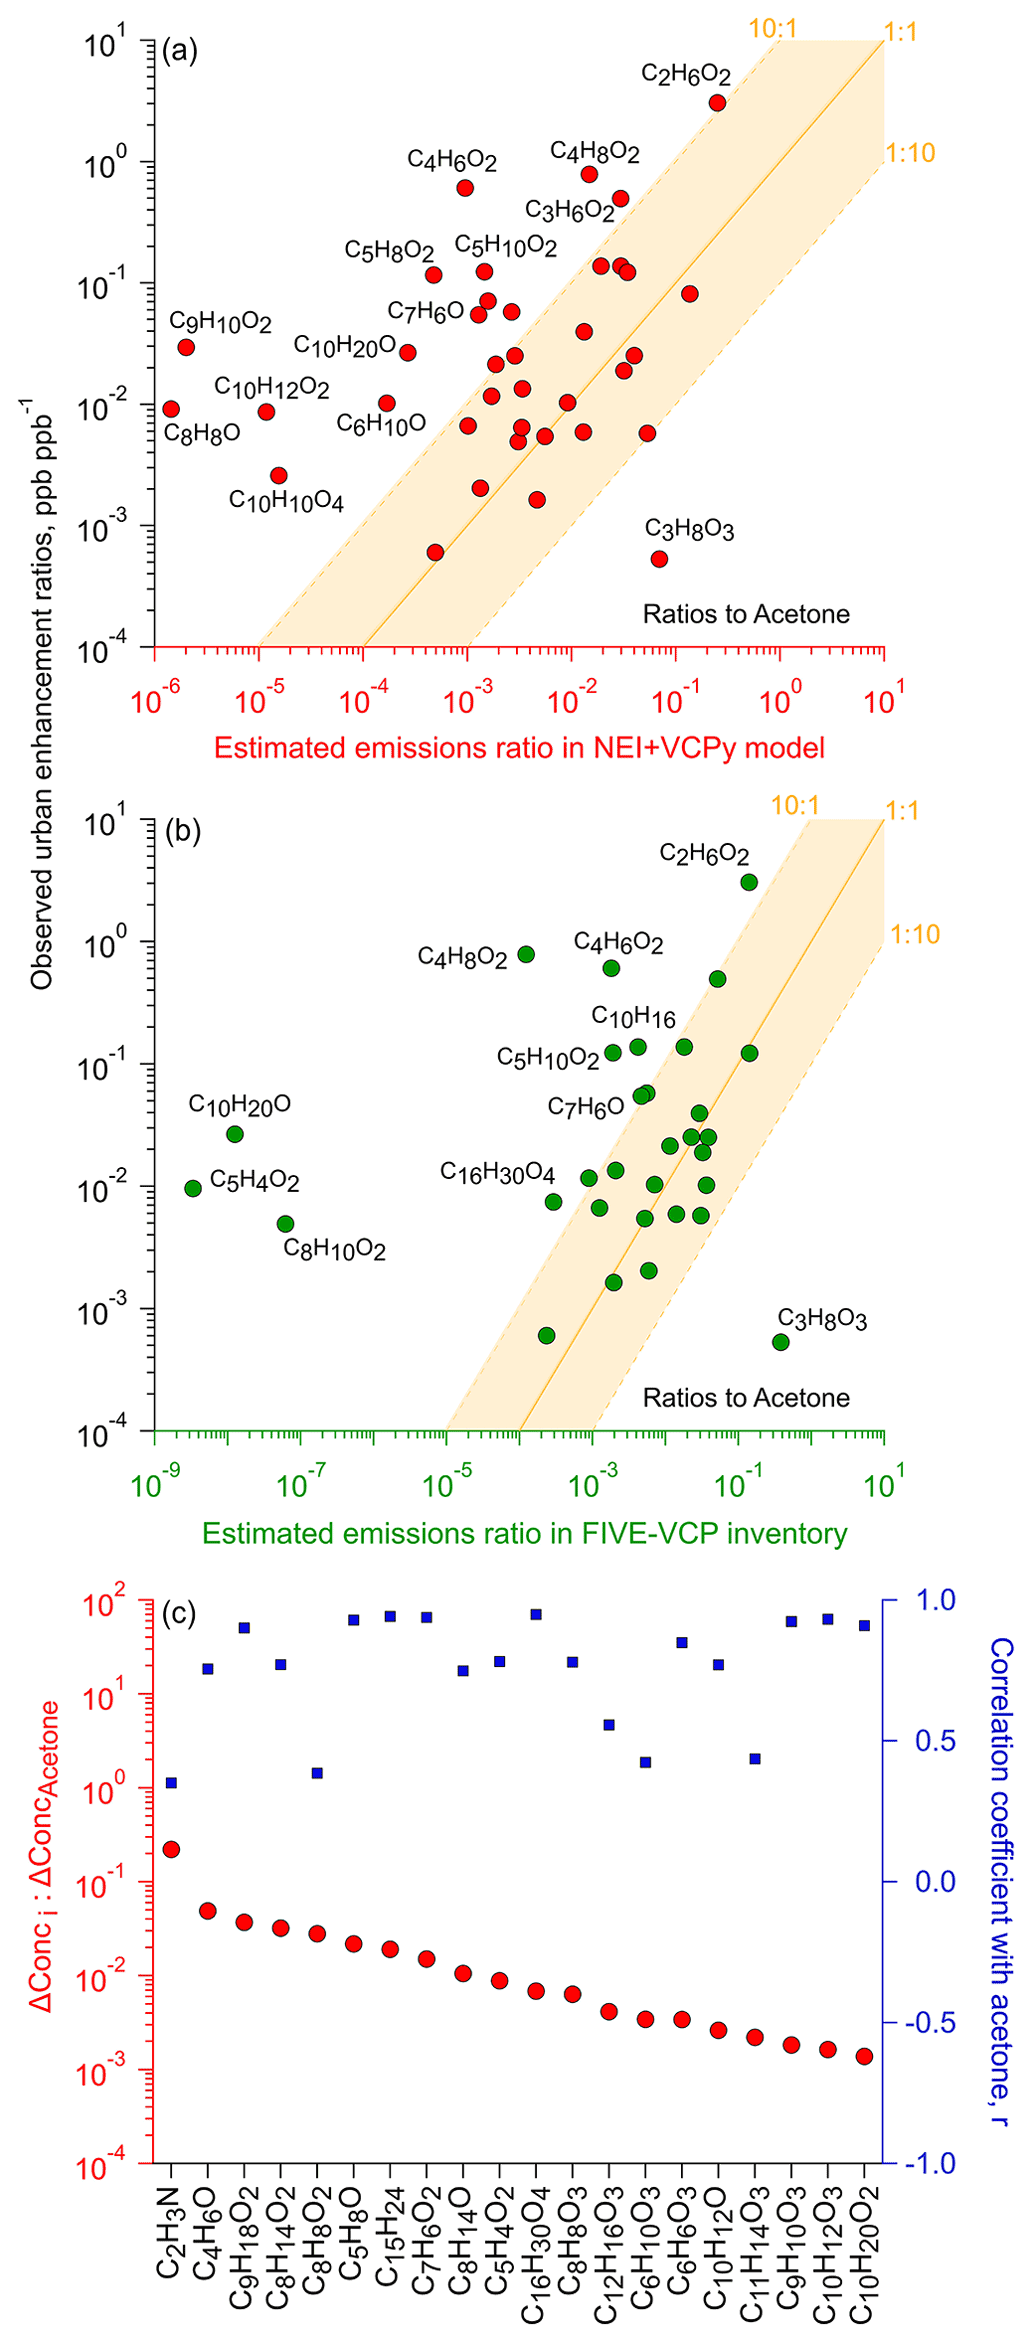
Figure 7Comparison of ambient observations to emission inventories (including all inventoried anthropogenic sources). Urban concentration enhancement ratios against acetone (calculated via background-subtracted geometric means) compared to estimated emission ratios using the (a) VCPy model (plus other anthropogenic sources in NEI) and (b) FIVE-VCP inventory (shown for compounds with explicit estimates in each inventory – see Table 1). (c) Concentration enhancement ratios against acetone (and correlation coefficients) for calibrated ions where emissions data were not available in VCPy (a). Note: examples of isomers contributing to ions in (a) and (b) are listed in Tables 1 and S7.
Figure 7a and b show the prevalence of such ions during the sampling period relative to their estimated annual emissions against two different regionally resolved inventories specifically for NYC. The annual emissions were calculated as the sum of the annual emissions of all isomers reported in inventories that contributed to each ion formula. Both axes in Fig. 7a and b are ratioed to C3H6O (predominantly acetone), since it was among the most abundant ions measured in this study and since its primary isomer, acetone, has extensive, diverse uses in various products and materials, with the majority of anthropogenic emissions in NYC coming from VCP-related sources (Gkatzelis et al., 2021b). Still, we acknowledge that acetone, like many oxygenated compounds, could see contributions from oxidation processes. However, such secondary production would be at its minimum during this January study period, and the short timescales of emitted compounds' transport within the urban footprint reduces (Fig. S2) its potential influence in this analysis. Furthermore, to account for any regional background influence in the calculation of emission ratios for inventory comparisons, we have subtracted the estimated ambient background using a fifth percentile concentration value to focus on enhancements in the urban area during the study.
We also note that choosing an ideal denominator species in the middle of a complex, dense urban environment with a wide array of spatiotemporally dynamic sources is highly challenging. Given the varying correlation coefficients between compounds (Fig. 6), Table 1 and Fig. 7 are presented using geometric mean ratios of concentration enhancements above the observed ambient background (i.e., fifth percentile). This enables comparisons across all measured compounds, though a comparison of concentration ratios versus slopes from least-squares regressions generally yielded comparable results for acetone for well-correlated species (Fig. S13), which also indicates that the subtraction of average regional background to determine mean urban enhancement ratios (Table 1) was similarly effective for inventory comparisons. We note that this comparison is done with data from January in a very densely populated area and that acetone concentrations will have seasonal variations from biogenic and secondary sources that should be considered in future comparisons between seasons and sites. During this 10 d period, the benzene to acetone ratio was close to that predicted by the VCPy+ inventory, albeit slightly greater than expected (i.e., 1.8:1), inferring additional benzene anthropogenic or biomass burning-related emissions than in the inventory (see Sect. 2); nonetheless, this supports that acetone is not overestimated in the inventory when compared to a more commonly used anthropogenic tracer (i.e., benzene).
As common markers of anthropogenic activities, the observed ions were also compared against CO and benzene, but acetone and benzyl alcohol had a greater number of strong correlations () in this densely populated area (Fig. 6, Tables 1 and S8). Wherever appropriate, the following discussion in this subsection also draws upon correlations with other ions that may inform source subtypes or emission pathways (Figs. S14–S17), with more detailed discussion available in the Supplement. There was some variation in the number of speciated compounds included in each inventory, and a subset of calibrated ions in this study were not available in one of the emissions inventories. The compounds not speciated in VCPy are presented in Fig. 7c with mean concentrations relative to acetone.
Of the 58 calibrated ions, emissions of one or more isomers were reported for 38 ions in VCPy+ and 32 ions in FIVE-VCP inventories. The ambient concentration ratios of roughly half of these numbers agreed within 1 order of magnitude (i.e., 1:10, 10:1), with emissions reported in both inventories (Fig. 7a and b). Within this sub-fraction, concentrations of 50 % of ions nearly matched with estimates, though with some variability between inventories. In the case of VCPy+ (Fig. 7a), some of the most accurately estimated ions represented glycol and glycol ether compound categories, such as dipropylene- and triethylene- glycols, 2-butoxyethanol, 2-methoxyethanol (with propylene glycol), and phenoxyethanol as well as D5, pentanedioic acid dimethyl ester, methyl pyrrolidone, benzyl alcohol, monoterpenes, and diethyl phthalate. Several other ions also representing glycols and glycol ethers fell within the 1:10 range (Fig. S18) but not ethylene glycol (see discussion below).
The ions in closest agreement with FIVE-VCP estimates shown in Fig. 7b represented benzyl alcohol, methyl pyrrolidone, MEK, D5, and a smaller number of glycol ethers that included ethylene glycol hexyl ether, and dipropylene and diethylene glycols. Other ions within the tolerance bound included methyl and butyl acetates, 2-hexanone, cyclohexanone, and pentanedioic acid dimethyl ester. It is notable that ambient measurements of glycols and glycol ethers made up approximately half of the total ions that broadly agreed with emission estimates in both emissions inventories. Additionally, the accuracy of benzyl alcohol estimates is also useful, since ∼45 % of all mass-calibrated ions and ∼35 % of the total observed ions in this study correlated strongly () with C7H8O (i.e., benzyl alcohol; Figs. 6, S19, and S20), which may help in constraining emissions in future studies.
The observed ambient ratios of the remaining ∼50 % ions deviated considerably from those in emissions inventory estimates. The majority of these ions had greater concentration ratios in Fig. 7a and b, which suggests that their emissions were higher than that expected based on emissions inventories. These elevated ratios above the 1:1 line could be due to underestimates in VCP-related sources as well as uncertainties in other sources, such as cooking (and the underlying foods and beverages), combustion-related sources, industrial and commercial activities, humans (e.g., skin oil-related products; e.g., 6-MHO), or other understudied, non-traditional sources (e.g., building materials). Additionally, while at its minima in peak wintertime conditions, secondary oxidation products as a result of local chemistry (i.e., not in the regional background that was subtracted) could make minor contributions to the calculated urban enhancements in Table 1. Among glycols in particular, ethylene glycol was abundant, with mean ambient concentration ratios slightly over 10 times the inventory-based value. This result could be influenced by seasonal variations in use, such as wintertime use as a de-icer for surfaces (or aircraft), or by the particularly elevated concentrations (25–35 ppb) during the first 4 d of the measurement period (Fig. 5) compared to the time series of other VOCs (Fig. 4) with wind currents from the southwestern direction to the sampling site. However, this concentration enhancement in ethylene glycol may not translate to other seasons due to changes in the magnitude of its sources (e.g., no de-icing required in non-winter periods). Ethylene glycol also correlated strongly (r>0.9) with a few other ions (e.g., MEK, MVK, cyclopentanone, cyclohexanone, benzyl alcohol), which may suggest a mix of co-located and/or shared source types. Among glycol ethers, the C8H10O2 ion representing phenoxyethanol differed considerably between the two inventories, ranging from near expected in VCPy+ to a much higher ambient abundance relative to FIVE-VCP (Fig. S18). This was likely due to estimated phenoxyethanol emissions being 105 times higher in VCPy+ than in FIVE-VCP. However, 1,4-dimethoxybenzene might have also contributed to C8H10O2 ion signal, given its widespread use in personal care products, but also needs inclusion in emissions inventories. Similarly, monoterpenes during this study slightly exceeded the 10:1 value based on FIVE-VCP estimates (Fig. 7), which were influenced by significantly different limonene emissions between the two inventories (60 206 kg yr−1; VCPy vs 17 107 kg yr−1; FIVE-VCP), which constituted over 90 % of the reported monoterpene emissions. D4-siloxane deviated in the other direction, going from near expected in FIVE-VCP to considerably above the 10:1 bound in VCPy comparisons, which was likely due to a factor of 8 difference in its reported emissions between the two inventories. The cyclohexanone-related C6H10O concentration ratio was somewhat lower than expected based on FIVE-VCP estimates, though it was within the lower tolerance bound, but it substantially exceeded VCPy+ estimates (Fig. S18) given the ∼250-fold difference in cyclohexanone emissions between the two inventories.
Some ions deviated even more substantially in ambient concentration ratios relative to inventory-based expectations (Fig. 7a). The prominent ions in this group represented esters, e.g., C9H10O2 (e.g., benzyl acetate), C4H6O2 (e.g., methyl acrylate), C5H8O2 (e.g., MMA), C5H10O2 (e.g., isopropyl acetate), and C4H8O2 (e.g., ethyl acetate). All these compounds (except MMA) are found in solvents, fragrances, food flavorings, and naturally in some food (e.g., fruits). Some fraction of their discrepancies may be attributed to uncertain fragrances source categories in emissions inventories, which contributes, in part, to their higher than expected concentrations in our analysis. Hence, further work is needed to more comprehensively speciate and constrain synthetic and natural fragrance-related emissions. Other possibilities for these differences include missing sources that need to be accounted for in estimating total emissions for each ion. For example, diacetyl is also a likely isomer of C4H6O2 that is currently excluded from emissions inventories. MMA concentrations at hundreds of parts per trillion (Fig. 5) is an interesting case due to its minimal use in consumer products and, besides contributions from other isomers to C5H8O2 ion, may indicate ambient observations of PMMA off-gassing and/or degradation under ambient conditions. Similarly, higher than expected C10H10O4 (e.g., dimethyl phthalate) concentrations could be contributed to by materials-related off-gassing and emissions from personal care products.
Ions related to benzaldehyde and menthol also exhibited higher than expected concentrations in both inventory assessments. C10H20O (e.g., menthol) showed strong correlations (r>0.95) with 14 other ions that spanned several compound classes, including glycol ethers, carbonyls, esters, and alcohol. This may be also be contributed to by fragrance-related sources (or other isomers, in the case of menthol). C9H10O2 (e.g., benzyl acetate), C10H12O2 (e.g., eugenol), and C6H10O (e.g., cyclohexanone) ions also showed high concentrations in VCPy+ inventory comparisons, while C5H4O2 (e.g., furfural) exceeded expected concentrations based on FIVE-VCP estimates. Furfural could also be contributed to by indoor emissions from wood-based materials (Sheu et al., 2021), though such a source will be lower in NYC than is observed elsewhere, given major differences in Manhattan building construction materials. Some of these isomers – e.g., eugenol, raspberry ketone, and furfural – also appear in foods and are used as flavorings, which remains largely unexplored as a potential source of emissions.
The glycerol-related C3H8O3 ion presents a very interesting case among the few ions that exhibited considerably lower concentrations than expected, with regional background concentrations even dropping below its detection limit (see Table S5). Its annual estimated emissions are comparable to prominent carbonyls and esters, with slight differences between the VCPy+ and FIVE-VCP inventories (∼105 kg yr−1 vs. ∼106 kg yr−1). However, it is uncertain whether its low mean concentration during the sampling period (Table 1) was influenced by seasonal variations in ambient gas-to-particle partitioning and/or in emissions pathways (e.g., reduced evaporation or indoor-to-outdoor transport). Thus, further research would be valuable to evaluate atmospheric levels of glycerol, including during summertime conditions when evaporative emissions from personal care products and indoor-to-outdoor transport are enhanced relative to January. The same factors may have also driven the somewhat lower concentrations of texanol relative to inventory-based predictions (Figs. 7a and b and S18), though its concentrations are similar to summertime observations in NYC (Stockwell et al., 2021).
Among ions without any emissions estimates, C8H8O2 (e.g., methyl benzoate), C9H18O2 (e.g., heptyl acetate), and C7H6O2 (e.g., benzoic acid) had some of the highest concentration ratios to acetone (Fig. 7c) and may warrant inclusion in emission inventories, potentially as part of “fragrances” or other uncertain source types. Observations of sesquiterpenes were 7 % of acetone concentrations on average (Table 1). The mean sesquiterpenes to monoterpenes ratio was ∼0.5 during the measurement period, though it was sensitive to instrument calibration, emphasizing sizable contributions from the highly reactive sesquiterpenes to urban air. Ions including C4H6O (e.g., MVK), C8H14O2 (e.g., cyclohexyl acetate), C5H8O (e.g., cyclopentanone), and C8H14O (e.g., 6-methyl-5-hepten-2-one, a skin oil oxidation product) were not estimated in the inventory but showed very strong correlations () with the acetone-related C3H6O ion.
A Vocus CI-ToF using low-pressure NH as the reagent ion enabled measurements of a wide range of oxygenated species in New York City, whose urban enhancements were primarily attributed to anthropogenic sources, given the peak wintertime conditions, but could vary under different meteorological conditions. Our results highlight the diversity of oxygenated compounds in urban air, including VCP-related compounds that extend considerably beyond the highly volatile, functionalized species found in oxygenated solvents. The measured ions had contributions from VOCs to I/SVOCs, including acetates, glycols, glycol ethers, alcohols, acrylates, and other functional groups. The atmospheric concentrations of these species varied over a large range but reached up to hundreds of ppt and into ppb levels in several cases, which were comparable to the prevalence of known prominent OVOCs such as acetone, MEK, and MVK. While emissions inventories predicted the relative abundance of many species in the atmosphere with relative accuracy (e.g., glycols and glycol ethers), several others showed significantly different ambient concentrations than predicted (e.g., select esters measured over 10 times their expected values; Fig. 7).
While the species target list in this manuscript (Table 1) included an array of compounds that are known to occur in VCPs, the observed underestimates when compared to emission inventories may be contributed not only to VCP-related sources but also to other established or uncertain urban sources in the inventories. Broad source classes, such as cooking (and associated foods and fuels), represent one example that could be a significant source of some of the OVOCs studied here (e.g., esters, carbonyls, fatty acids, terpenoids). Similarly, while large biomass burning influences were filtered from the comparison to the emission inventories, we note that biomass burning remains an important source of regional and/or long-distance OVOCs. Regional and long-distance transport of secondary OVOCs (and associated pollutants) also remain important contributors to urban air quality across all seasons, and non-wintertime conditions will include a greater role for photochemical processing within and near NYC. Yet, local secondary OVOCs can be produced within the city, and future work with longer NH-based summertime datasets can further deconvolve OVOC contributions, including the contributions of local photochemical production (occurring from outdoor or indoor chemistry).
These results inform new avenues for investigating the emissions or atmospheric dynamics of these species both indoors or outdoors as well as for investigating possible additional compounds and source contributions for inclusion in emissions inventories. Given the high ambient prevalence of some species, further research is also warranted to further enhance chemical speciation in inventories (and measurements) that will constrain potential contributions to SOA and ozone formation under varying environmental conditions. Future summertime studies (e.g., Atmospheric Emissions and Reactions Observed from Megacities to Marine Areas, AEROMMA, Warneke et al., 2022; Greater New York Oxidant, Trace gas, Halogen and Aerosol Airborne Mission, GOTHAAM) will also provide valuable opportunities to compare seasonal abundances of observed species and to study different seasonally dependent emission pathways.
The specialized code discussed and employed in this paper is associated with the Vocus instrument and is available from Aerodyne Research Inc.
The data that support the results presented in this paper are publicly accessible and could be found online at https://doi.org/10.6084/m9.figshare.21507798 (Khare, 2022).
The supplement related to this article is available online at: https://doi.org/10.5194/acp-22-14377-2022-supplement.
DRG, JohEM, and JEK conceived the study, and JEK performed the ambient Vocus CI-ToF measurements with support from RTC. PK led data analysis and writing with support from JEK and DRG and with contributions and review from other co-authors. PK, JoEM, and JW prepared calibration mixes. JoEM, JW, and JEK performed in-lab calibrations. THM collected EI-MS samples and conducted related analysis along with JW, WW, SM, and JoEM. KS and HOTP developed the VCPy model, and KMS performed VCPy calculations for this work. BCM provided the FIVE-VCP emissions inventory data used in this study. FM and FLH developed and tested the Vocus CI-ToF instrument for this study. CC and JohEM performed PTR-ToF measurements used for instrument cross-validation in this study. RC provided carbon monoxide data, and RTC helped setting up the measurement site.
Jordan E. Krechmer was formerly employed by Aerodyne Research Inc., which commercializes the Vocus CI-ToF instrument for geoscience research, and Felipe Lopez-Hilfiker is an employee of Tofwerk AG, which manufactures and sells the Vocus CI-ToF instrument used in this study.
The views expressed in this article are those of the authors and do not necessarily represent the views or policies of the US Environmental Protection Agency. Any opinions expressed in this article do not necessarily reflect those of NYSERDA or the State of New York.
Publisher's note: Copernicus Publications remains neutral with regard to jurisdictional claims in published maps and institutional affiliations.
We thank the City University of New York for facilitating sampling at their Advanced Science Research Center. We also thank Mingjiang Zhong (Yale) for helpful discussions.
This research has been supported by Northeast States for Coordinated Air Use Management (NESCAUM) through a contract with the New York State Energy Research and Development Authority (NYSERDA; grant no. 101132) as part of the LISTOS project. The authors also received financial support from US NSF (grant nos. CBET-2011362 and AGS-1764126) and Columbia University.
This paper was edited by Theodora Nah and reviewed by three anonymous referees.
Abbatt, J. P. D. and Wang, C.: The atmospheric chemistry of indoor environments, Environ. Sci. Process. Impacts, 22, 25–48, https://doi.org/10.1039/C9EM00386J, 2020.
Asaf, D., Tas, E., Pedersen, D., Peleg, M., and Luria, M.: Long-Term Measurements of NO3 Radical at a Semiarid Urban Site: 2. Seasonal Trends and Loss Mechanisms, Environ. Sci. Technol., 44, 5901–5907, https://doi.org/10.1021/es100967z, 2010.
Aschmann, S. M., Martin, P., Tuazon, E. C., Arey, J., and Atkinson, R.: Kinetic and product studies of the reactions of selected glycol ethers with OH radicals, Environ. Sci. Technol., 35, 4080–4088, https://doi.org/10.1021/es010831k, 2001.
Bennet, F., Hart-Smith, G., Gruendling, T., Davis, T. P., Barker, P. J., and Barner-Kowollik, C.: Degradation of poly(methyl methacrylate) model compounds under extreme environmental conditions, Macromol. Chem. Phys., 211, 1083–1097, 2010.
Bi, C., Liang, Y., and Xu, Y.: Fate and Transport of Phthalates in Indoor Environments and the Influence of Temperature: A Case Study in a Test House, Environ. Sci. Technol., 49, 9674–9681, https://doi.org/10.1021/acs.est.5b02787, 2015.
Bi, C., Krechmer, J. E., Frazier, G. O., Xu, W., Lambe, A. T., Claflin, M. S., Lerner, B. M., Jayne, J. T., Worsnop, D. R., Canagaratna, M. R., and Isaacman-VanWertz, G.: Quantification of isomer-resolved iodide chemical ionization mass spectrometry sensitivity and uncertainty using a voltage-scanning approach, Atmos. Meas. Tech., 14, 6835–6850, https://doi.org/10.5194/amt-14-6835-2021, 2021.
Bornehag, C. G., Lundgren, B., Weschler, C. J., Sigsgaard, T., Hagerhed-Engman, L., and Sundell, J.: Phthalates in indoor dust and their association with building characteristics, Environ. Health Perspect., 113, 1399–1404, https://doi.org/10.1289/ehp.7809, 2005.
Canaval, E., Hyttinen, N., Schmidbauer, B., Fischer, L., and Hansel, A.: NH association and proton transfer reactions with a series of organic molecules, Front. Chem., 7, 191, https://doi.org/10.3389/fchem.2019.00191, 2019.
Cao, H., Li, X., He, M., and Zhao, X. S.: Computational study on the mechanism and kinetics of NO3-initiated atmosphere oxidation of vinyl acetate, Comput. Theor. Chem., 1144, 18–25, https://doi.org/10.1016/J.COMPTC.2018.09.012, 2018.
Charan, S. M., Buenconsejo, R. S., and Seinfeld, J. H.: Secondary organic aerosol yields from the oxidation of benzyl alcohol, Atmos. Chem. Phys., 20, 13167–13190, https://doi.org/10.5194/acp-20-13167-2020, 2020.
Choi, H., Schmidbauer, N., Sundell, J., Hasselgren, M., Spengler, J. and Bornehag, C. G.: Common household chemicals and the allergy risks in pre-school age children, PLoS One, 5, e13423, https://doi.org/10.1371/journal.pone.0013423, 2010a.
Choi, H., Schmidbauer, N., Spengler, J., and Bornehag, C. G.: Sources of propylene glycol and glycol ethers in air at home, Int. J. Environ. Res. Pu., 7, 4213–4237, https://doi.org/10.3390/ijerph7124213, 2010b.
Coggon, M. M., McDonald, B. C., Vlasenko, A., Veres, P. R., Bernard, F., Koss, A. R., Yuan, B., Gilman, J. B., Peischl, J., Aikin, K. C., Durant, J., Warneke, C., Li, S. M., and De Gouw, J. A.: Diurnal Variability and Emission Pattern of Decamethylcyclopentasiloxane (D5) from the Application of Personal Care Products in Two North American Cities, Environ. Sci. Technol., 52, 5610–5618, https://doi.org/10.1021/acs.est.8b00506, 2018.
Coggon, M. M., Gkatzelis, G. I., McDonald, B. C., Gilman, J. B., Schwantes, R. H., Abuhassan, N., Aikin, K. C., Arendd, M. F., Berkoff, T. A., Brown, S. S., Campos, T. L., Dickerson, R. R., Gronoff, G., Hurley, J. F., Isaacman-Vanwertz, G., Koss, A. R., Li, M., McKeen, S. A., Moshary, F., Peischl, J., Pospisilova, V., Ren, X., Wilson, A., Wu, Y., Trainer, M., and Warneke, C.: Volatile chemical product emissions enhance ozone and modulate urban chemistry, P. Natl. Acad. Sci. USA, 118, e2026653118, https://doi.org/10.1073/pnas.2026653118, 2021.
Council of the European Union: EU Directive 1999/13/EC: Reducing the emissions of volatile organic compounds (VOCs), http://data.europa.eu/eli/dir/1999/13/oj (last access: 10 July 2022), 1999.
de Gouw, J. A., Gilman, J. B., Kim, S. W., Lerner, B. M., Isaacman-VanWertz, G., McDonald, B. C., Warneke, C., Kuster, W. C., Lefer, B. L., Griffith, S. M., Dusanter, S., Stevens, P. S., and Stutz, J.: Chemistry of Volatile Organic Compounds in the Los Angeles basin: Nighttime Removal of Alkenes and Determination of Emission Ratios, J. Geophys. Res. Atmos., 122, 11843–11861, https://doi.org/10.1002/2017JD027459, 2017.
Destaillats, H., Lunden, M. M., Singer, B. C., Coleman, B. K., Hodgson, A. T., Weschler, C. J., and Nazaroff, W. W.: Indoor Secondary Pollutants from Household Product Emissions in the Presence of Ozone: A Bench-Scale Chamber Study, Environ. Sci. Technol., 40, 4421–4428, https://doi.org/10.1021/ES052198Z, 2006.
Even, M., Girard, M., Rich, A., Hutzler, C., and Luch, A.: Emissions of VOCs From Polymer-Based Consumer Products: From Emission Data of Real Samples to the Assessment of Inhalation Exposure, Front. Public Heal., 7, 202, https://doi.org/10.3389/fpubh.2019.00202, 2019.
Even, M., Hutzler, C., Wilke, O., and Luch, A.: Emissions of volatile organic compounds from polymer-based consumer products: Comparison of three emission chamber sizes, Indoor Air, 30, 40–48, https://doi.org/10.1111/ina.12605, 2020.
Franco, B., Blumenstock, T., Cho, C., Clarisse, L., Clerbaux, C., Coheur, P. F., De Mazière, M., De Smedt, I., Dorn, H. P., Emmerichs, T., Fuchs, H., Gkatzelis, G., Griffith, D. W. T., Gromov, S., Hannigan, J. W., Hase, F., Hohaus, T., Jones, N., Kerkweg, A., Kiendler-Scharr, A., Lutsch, E., Mahieu, E., Novelli, A., Ortega, I., Paton-Walsh, C., Pommier, M., Pozzer, A., Reimer, D., Rosanka, S., Sander, R., Schneider, M., Strong, K., Tillmann, R., Van Roozendael, M., Vereecken, L., Vigouroux, C., Wahner, A. and Taraborrelli, D.: Ubiquitous atmospheric production of organic acids mediated by cloud droplets, Nature, 593, 233–237, https://doi.org/10.1038/s41586-021-03462-x, 2021.
Gkatzelis, G. I., Coggon, M. M., McDonald, B. C., Peischl, J., Aikin, K. C., Gilman, J. B., Trainer, M., and Warneke, C.: Identifying Volatile Chemical Product Tracer Compounds in U.S. Cities, Environ. Sci. Technol., 55, 188–199, https://doi.org/10.1021/acs.est.0c05467, 2021a.
Gkatzelis, G. I., Coggon, M. M., McDonald, B. C., Peischl, J., Gilman, J. B., Aikin, K. C., Robinson, M. A., Canonaco, F., Prevot, A. S. H., Trainer, M., and Warneke, C.: Observations Confirm that Volatile Chemical Products Are a Major Source of Petrochemical Emissions in U.S. Cities, Environ. Sci. Technol., 55, 4332–4343, https://doi.org/10.1021/acs.est.0c05471, 2021b.
Harb, P., Locoge, N., and Thevenet, F.: Treatment of household product emissions in indoor air: Real scale assessment of the removal processes, Chem. Eng. J., 380, 122525, https://doi.org/10.1016/j.cej.2019.122525, 2020.
Heald, C. L. and Kroll, J. H.: The fuel of atmospheric chemistry: Toward a complete description of reactive organic carbon, Sci. Adv., 6, eaay8967, https://doi.org/10.1126/sciadv.aay8967, 2020.
Henze, D. K., Seinfeld, J. H., Ng, N. L., Kroll, J. H., Fu, T.-M., Jacob, D. J., and Heald, C. L.: Global modeling of secondary organic aerosol formation from aromatic hydrocarbons: high- vs. low-yield pathways, Atmos. Chem. Phys., 8, 2405–2420, https://doi.org/10.5194/acp-8-2405-2008, 2008.
Holzinger, R., Acton, W. J. F., Bloss, W. J., Breitenlechner, M., Crilley, L. R., Dusanter, S., Gonin, M., Gros, V., Keutsch, F. N., Kiendler-Scharr, A., Kramer, L. J., Krechmer, J. E., Languille, B., Locoge, N., Lopez-Hilfiker, F., Materić, D., Moreno, S., Nemitz, E., Quéléver, L. L. J., Sarda Esteve, R., Sauvage, S., Schallhart, S., Sommariva, R., Tillmann, R., Wedel, S., Worton, D. R., Xu, K., and Zaytsev, A.: Validity and limitations of simple reaction kinetics to calculate concentrations of organic compounds from ion counts in PTR-MS, Atmos. Meas. Tech., 12, 6193–6208, https://doi.org/10.5194/amt-12-6193-2019, 2019.
Huangfu, Y., Yuan, B., Wang, S., Wu, C., He, X., Qi, J., de Gouw, J., Warneke, C., Gilman, J. B., Wisthaler, A., Karl, T., Graus, M., Jobson, B. T., and Shao, M.: Revisiting Acetonitrile as Tracer of Biomass Burning in Anthropogenic-Influenced Environments, Geophys. Res. Lett., 48, e2020GL092322, https://doi.org/10.1029/2020GL092322, 2021.
Humes, M. B., Wang, M., Kim, S., Machesky, J. E., Gentner, D. R., Robinson, A. L., Donahue, N. M., and Presto, A. A.: Limited Secondary Organic Aerosol Production from Acyclic Oxygenated Volatile Chemical Products, Environ. Sci. Technol., 56, 4806–4815, https://doi.org/10.1021/acs.est.1c07354, 2022.
Karl, T., Striednig, M., Graus, M., Hammerle, A., and Wohlfahrt, G.: Urban flux measurements reveal a large pool of oxygenated volatile organic compound emissions, 115, 1186–1191, https://doi.org/10.1073/pnas.1714715115, 2018.
Khare, P.: Supplemental data for article: Ammonium adduct chemical ionization to investigate anthropogenic oxygenated gas-phase organic compounds in urban air, Figshare [data set], https://doi.org/10.6084/m9.figshare.21507798.v3, 2022.
Khare, P. and Gentner, D. R.: Considering the future of anthropogenic gas-phase organic compound emissions and the increasing influence of non-combustion sources on urban air quality, Atmos. Chem. Phys., 18, 5391–5413, https://doi.org/10.5194/acp-18-5391-2018, 2018.
Khare, P., Machesky, J., Soto, R., He, M., Presto, A. A., and Gentner, D. R.: Asphalt-related emissions are a major missing nontraditional source of secondary organic aerosol precursors, Sci. Adv., 6, eabb9785, https://doi.org/10.1126/sciadv.abb9785, 2020.
Koss, A. R., Sekimoto, K., Gilman, J. B., Selimovic, V., Coggon, M. M., Zarzana, K. J., Yuan, B., Lerner, B. M., Brown, S. S., Jimenez, J. L., Krechmer, J., Roberts, J. M., Warneke, C., Yokelson, R. J., and de Gouw, J.: Non-methane organic gas emissions from biomass burning: identification, quantification, and emission factors from PTR-ToF during the FIREX 2016 laboratory experiment, Atmos. Chem. Phys., 18, 3299–3319, https://doi.org/10.5194/acp-18-3299-2018, 2018.
Krechmer, J., Lopez-Hilfiker, F., Koss, A., Hutterli, M., Stoermer, C., Deming, B., Kimmel, J., Warneke, C., Holzinger, R., Jayne, J., Worsnop, D., Fuhrer, K., Gonin, M., and De Gouw, J.: Evaluation of a New Reagent-Ion Source and Focusing Ion- Molecule Reactor for Use in Proton-Transfer-Reaction Mass Spectrometry, Anal. Chem., 90, 12011–12018, https://doi.org/10.1021/acs.analchem.8b02641, 2018.
Krechmer, J. E., Pagonis, D., Ziemann, P. J., and Jimenez, J. L.: Quantification of Gas-Wall Partitioning in Teflon Environmental Chambers Using Rapid Bursts of Low-Volatility Oxidized Species Generated in Situ, Environ. Sci. Technol., 50, 5757–5765, https://doi.org/10.1021/acs.est.6b00606, 2016.
Li, W., Li, L., Chen, C. li, Kacarab, M., Peng, W., Price, D., Xu, J., and Cocker, D. R.: Potential of select intermediate-volatility organic compounds and consumer products for secondary organic aerosol and ozone formation under relevant urban conditions, Atmos. Environ., 178, 109–117, https://doi.org/10.1016/J.ATMOSENV.2017.12.019, 2018.
Liang, Y., Caillot, O., Zhang, J., Zhu, J., and Xu, Y.: Large-scale chamber investigation and simulation of phthalate emissions from vinyl flooring, Build. Environ., 89, 141–149, https://doi.org/10.1016/j.buildenv.2015.02.022, 2015.
Mansouri, K., Grulke, C. M., Judson, R. S., and Williams, A. J.: OPERA models for predicting physicochemical properties and environmental fate endpoints, J. Cheminform., 10, 10, https://doi.org/10.1186/s13321-018-0263-1, 2018.
Markowicz, P. and Larsson, L.: Influence of relative humidity on VOC concentrations in indoor air, Environ. Sci. Pollut. Res., 22, 5772–5779, https://doi.org/10.1007/s11356-014-3678-x, 2015.
Masuck, I., Hutzler, C., Jann, O. and Luch, A.: Inhalation exposure of children to fragrances present in scented toys, Indoor Air, 21(6), 501–511, https://doi.org/10.1111/j.1600-0668.2011.00727.x, 2011.
Mcdonald, B. C., De Gouw, J. A., Gilman, J. B., Jathar, S. H., Akherati, A., Cappa, C. D., Jimenez, J. L., Lee-Taylor, J., Hayes, P. L., Mckeen, S. A., Cui, Y. Y., Kim, S.-W., Gentner, D. R., Isaacman-Vanwertz, G., Goldstein, A. H., Harley, R. A., Frost, G. J., Roberts, J. M., Ryerson, T. B., and Trainer, M.: Volatile chemical products emerging as largest petrochemical source of urban organic emissions, Science, 359, 760–764, https://doi.org/10.1126/science.aaq0524, 2018.
McLachlan, M. S., Kierkegaard, A., Hansen, K. M., Van Egmond, R., Christensen, J. H., and Skjøth, C. A.: Concentrations and fate of decamethylcyclopentasiloxane (D5) in the atmosphere, Environ. Sci. Technol., 44, 5365–5370, https://doi.org/10.1021/es100411w, 2010.
Mellouki, A., Wallington, T. J., and Chen, J.: Atmospheric Chemistry of Oxygenated Volatile Organic Compounds: Impacts on Air Quality and Climate, Chem. Rev., 115, 3984–4014, https://doi.org/10.1021/cr500549n, 2015.
Noguchi, M. and Yamasaki, A.: Volatile and semivolatile organic compound emissions from polymers used in commercial products during thermal degradation, Heliyon, 6, e03314, https://doi.org/10.1016/j.heliyon.2020.e03314, 2020.
Pagonis, D., Krechmer, J. E., de Gouw, J., Jimenez, J. L., and Ziemann, P. J.: Effects of gas–wall partitioning in Teflon tubing and instrumentation on time-resolved measurements of gas-phase organic compounds, Atmos. Meas. Tech., 10, 4687–4696, https://doi.org/10.5194/amt-10-4687-2017, 2017.
Pennington, E. A., Seltzer, K. M., Murphy, B. N., Qin, M., Seinfeld, J. H., and Pye, H. O. T.: Modeling secondary organic aerosol formation from volatile chemical products, Atmos. Chem. Phys., 21, 18247–18261, https://doi.org/10.5194/acp-21-18247-2021, 2021.
Picquet-Varrault, B., Doussin, J. F., Durand-Jolibois, R., Pirali, O., Carlier, P., and Fittschen, C.: Kinetic and Mechanistic Study of the Atmospheric Oxidation by OH Radicals of Allyl Acetate, Environ. Sci. Technol., 36, 4081–4086, https://doi.org/10.1021/ES0200138, 2002.
Pye, H. O. T., Ward-Caviness, C. K., Murphy, B. N., Appel, K. W., and Seltzer, K. M.: Secondary organic aerosol association with cardiorespiratory disease mortality in the United States, Nat. Commun., 12, 7215, https://doi.org/10.1038/S41467-021-27484-1, 2021.
Qin, M., Murphy, B. N., Isaacs, K. K., McDonald, B. C., Lu, Q., McKeen, S. A., Koval, L., Robinson, A. L., Efstathiou, C., Allen, C., and Pye, H. O. T.: Criteria pollutant impacts of volatile chemical products informed by near-field modelling, Nat. Sustain., 4, 129–137, https://doi.org/10.1038/s41893-020-00614-1, 2020.
Ren, X., Brune, W. H., Mao, J., Mitchell, M. J., Lesher, R. L., Simpas, J. B., Metcalf, A. R., Schwab, J. J., Cai, C., Li, Y., Demerjian, K. L., Felton, H. D., Boynton, G., Adams, A., Perry, J., He, Y., Zhou, X., and Hou, J.: Behavior of OH and HO2 in the winter atmosphere in New York City, Atmos. Environ., 40, 252–263, https://doi.org/10.1016/J.ATMOSENV.2005.11.073, 2006.
Ren, Y., El Baramoussi, E. M., Daële, V., and Mellouki, A.: Atmospheric chemistry of ketones: Reaction of OH radicals with 2-methyl-3-pentanone, 3-methyl-2-pentanone and 4-methyl-2-pentanone, Sci. Total Environ., 780, 146249, https://doi.org/10.1016/J.SCITOTENV.2021.146249, 2021.
Robinson, M. A., Neuman, J. A., Huey, L. G., Roberts, J. M., Brown, S. S., and Veres, P. R.: Temperature-dependent sensitivity of iodide chemical ionization mass spectrometers, Atmos. Meas. Tech., 15, 4295–4305, https://doi.org/10.5194/amt-15-4295-2022, 2022.
Schroder, J. C., Campuzano-Jost, P., Day, D. A., Shah, V., Larson, K., Sommers, J. M., Sullivan, A. P., Campos, T., Reeves, J. M., Hills, A., Hornbrook, R. S., Blake, N. J., Scheuer, E., Guo, H., Fibiger, D. L., McDuffie, E. E., Hayes, P. L., Weber, R. J., Dibb, J. E., Apel, E. C., Jaeglé, L., Brown, S. S., Thornton, J. A., and Jimenez, J. L.: Sources and Secondary Production of Organic Aerosols in the Northeastern United States during WINTER, J. Geophys. Res.-Atmos., 123, 7771–7796, https://doi.org/10.1029/2018JD028475, 2018.
Schwarz, J., Makeš, O., Ondráček, J., Cusack, M., Talbot, N., Vodička, P., Kubelová, L., and Ždímal, V.: Single Usage of a Kitchen Degreaser Can Alter Indoor Aerosol Composition for Days, Environ. Sci. Technol., 51, 5907–5912, https://doi.org/10.1021/acs.est.6b06050, 2017.
Seltzer, K. M., Pennington, E., Rao, V., Murphy, B. N., Strum, M., Isaacs, K. K., and Pye, H. O. T.: Reactive organic carbon emissions from volatile chemical products, Atmos. Chem. Phys., 21, 5079–5100, https://doi.org/10.5194/acp-21-5079-2021, 2021.
Seltzer, K. M., Murphy, B. N., Pennington, E. A., Allen, C., Talgo, K., and Pye, H. O. T.: Volatile Chemical Product Enhancements to Criteria Pollutants in the United States, Environ. Sci. Technol., 56, 6905–6913, https://doi.org/10.1021/acs.est.1c04298, 2022.
Shah, R. U., Coggon, M. M., Gkatzelis, G. I., McDonald, B. C., Tasoglou, A., Huber, H., Gilman, J., Warneke, C., Robinson, A. L., and Presto, A. A.: Urban Oxidation Flow Reactor Measurements Reveal Significant Secondary Organic Aerosol Contributions from Volatile Emissions of Emerging Importance, Environ. Sci. Technol., 54, 714–725, https://doi.org/10.1021/acs.est.9b06531, 2020.
Sheu, R., Marcotte, A., Khare, P., Charan, S., Ditto, J., and Gentner, D. R.: Advances in offline approaches for speciated measurements of trace gas-phase organic compounds via an integrated sampling-to-analysis system, J. Chromatogr. A, 1575, 80–90, https://doi.org/10.1016/j.chroma.2018.09.014, 2018.
Sheu, R., Stönner, C., Ditto, J. C., Klüpfel, T., Williams, J., and Gentner, D. R.: Human transport of thirdhand tobacco smoke: A prominent source of hazardous air pollutants into indoor nonsmoking environments, Sci. Adv., 6, eaay4109, https://doi.org/10.1126/sciadv.aay4109, 2020.
Sheu, R., Fortenberry, C. F., Walker, M. J., Eftekhari, A., Stönner, C., Bakker, A., Peccia, J., Williams, J., Morrison, G. C., Williams, B. J., and Gentner, D. R.: Evaluating Indoor Air Chemical Diversity, Indoor-to-Outdoor Emissions, and Surface Reservoirs Using High-Resolution Mass Spectrometry, Environ. Sci. Technol., 55, 10255–10267, https://doi.org/10.1021/acs.est.1c01337, 2021.
Shi, S., Cao, J., Zhang, Y., and Zhao, B.: Emissions of Phthalates from Indoor Flat Materials in Chinese Residences, Environ. Sci. Technol., 52, 13166–13173, https://doi.org/10.1021/acs.est.8b03580, 2018.
Singer, B. C., Destaillats, H., Hodgson, A. T., and Nazaroff, W. W.: Cleaning products and air fresheners: Emissions and resulting concentrations of glycol ethers and terpenoids, Indoor Air, 16, 179–191, https://doi.org/10.1111/j.1600-0668.2005.00414.x, 2006.
Slusher, D. L., Gregory Huey, L., Tanner, D. J., Flocke, F. M., Roberts, J. M., Huey, G., Tanner, D. J., Flocke, F. M., and Roberts, J. M.: A thermal dissociation–chemical ionization mass spectrometry (TD-CIMS) technique for the simultaneous measurement of peroxyacyl nitrates and dinitrogen pentoxide, J. Geophys. Res.-Atmos., 109, 19315, https://doi.org/10.1029/2004JD004670, 2004.
Stockwell, C. E., Coggon, M. M., Gkatzelis, G. I., Ortega, J., McDonald, B. C., Peischl, J., Aikin, K., Gilman, J. B., Trainer, M., and Warneke, C.: Volatile organic compound emissions from solvent- and water-borne coatings – compositional differences and tracer compound identifications, Atmos. Chem. Phys., 21, 6005–6022, https://doi.org/10.5194/acp-21-6005-2021, 2021.
Thornton, J. a, Kercher, J. P., Riedel, T. P., Wagner, N. L., Cozic, J., Holloway, J. S., Dubé, W. P., Wolfe, G. M., Quinn, P. K., Middlebrook, A. M., Alexander, B., and Brown, S. S.: A large atomic chlorine source inferred from mid-continental reactive nitrogen chemistry., Nature, 464, 271–274, https://doi.org/10.1038/nature08905, 2010.
US Environmental Protection Agency: Chemical Data Reporting 2016, https://www.epa.gov/chemical-data-reporting/access-cdr-data (last access: 5 June 2022), 2016.
Venecek, M. A., Carter, W. P. L., and Kleeman, M. J.: Updating the SAPRC Maximum Incremental Reactivity (MIR) scale for the United States from 1988 to 2010, J. Air Waste Manag. Assoc., 68, 1301–1316, https://doi.org/10.1080/10962247.2018.1498410, 2018.
Wang, C., Collins, D. B., Arata, C., Goldstein, A. H., Mattila, J. M., Farmer, D. K., Ampollini, L., DeCarlo, P. F., Novoselac, A., Vance, M. E., Nazaroff, W. W., and Abbatt, J. P. D.: Surface reservoirs dominate dynamic gas-surface partitioning of many indoor air constituents, Sci. Adv., 6, 8973, https://doi.org/10.1126/sciadv.aay8973, 2020.
Warneke, C., Schwantes, R., Veres, P., Rollins, A., Brewer, W. A., Mcdonald, B., Brown, S., Frost, G., Fahey, D., Aikin, K., Mak, J., Holden, B., Giles, D., Tom, P., Tolnet, H., Sullivan, J., Valin, L., Szykman, J., Quinn, T., Bates, T., and Russell, L.: Atmospheric Emissions and Reactions Observed from Megacities to Marine Areas (AEROMMA 2023), https://csl.noaa.gov/projects/aeromma/, last access: 3 June 2022.
Wensing, M., Uhde, E., and Salthammer, T.: Plastics additives in the indoor environment – flame retardants and plasticizers, Sci. Total Environ., 339, 19–40, https://doi.org/10.1016/j.scitotenv.2004.10.028, 2005.
Weschler, C. J. and Nazaroff, W. W.: Semivolatile organic compounds in indoor environments, Atmos. Environ., 42, 9018–9040, https://doi.org/10.1016/j.atmosenv.2008.09.052, 2008.
Westmore, J. B. and Alauddin, M. M.: Ammonia chemical ionization mass spectrometry, Mass Spectrom. Rev., 5, 381–465, https://doi.org/10.1002/MAS.1280050403, 1986.
Xu, L., Coggon, M. M., Stockwell, C. E., Gilman, J. B., Robinson, M. A., Breitenlechner, M., Lamplugh, A., Neuman, J. A., Novak, G. A., Veres, P. R., Brown, S. S., and Warneke, C.: A Chemical Ionization Mass Spectrometry Utilizing Ammonium Ions (NH CIMS) for Measurements of Organic Compounds in the Atmosphere, Atmos. Meas. Tech. Discuss. [preprint], https://doi.org/10.5194/amt-2022-228, in review, 2022.
Zaytsev, A., Koss, A. R., Breitenlechner, M., Krechmer, J. E., Nihill, K. J., Lim, C. Y., Rowe, J. C., Cox, J. L., Moss, J., Roscioli, J. R., Canagaratna, M. R., Worsnop, D. R., Kroll, J. H., and Keutsch, F. N.: Mechanistic study of the formation of ring-retaining and ring-opening products from the oxidation of aromatic compounds under urban atmospheric conditions, Atmos. Chem. Phys., 19, 15117–15129, https://doi.org/10.5194/acp-19-15117-2019, 2019a.
Zaytsev, A., Breitenlechner, M., Koss, A. R., Lim, C. Y., Rowe, J. C., Kroll, J. H., and Keutsch, F. N.: Using collision-induced dissociation to constrain sensitivity of ammonia chemical ionization mass spectrometry (NH CIMS) to oxygenated volatile organic compounds, Atmos. Meas. Tech., 12, 1861–1870, https://doi.org/10.5194/amt-12-1861-2019, 2019b.