the Creative Commons Attribution 4.0 License.
the Creative Commons Attribution 4.0 License.
 | 08 Nov 2022
Stratospheric water vapour and ozone response to the quasi-biennial oscillation disruptions in 2016 and 2020
Mohamadou A. Diallo
Felix Ploeger
Michaela I. Hegglin
Manfred Ern
Jens-Uwe Grooß
Sergey Khaykin
Martin Riese
The quasi-biennial oscillation (QBO) is a major mode of climate variability in the tropical stratosphere with quasi-periodically descending westerly and easterly winds, modulating transport and distributions of key greenhouse gases such as water vapour and ozone. In 2016 and 2020, anomalous QBO easterlies disrupted the QBO's mean period of about 28 months previously observed. Here, we quantify the impact of these two QBO disruption events on the Brewer–Dobson circulation and respective distributions of water vapour and ozone using the ERA5 reanalysis and Microwave Limb Sounder (MLS) satellite observations, respectively. In 2016, both water vapour and ozone in the lower stratosphere decreased globally during the QBO disruption event by up to about 20 %. In 2020, the lower-stratospheric ozone only weakly decreased during the QBO disruption event, by up to about 10 %, while the lower-stratospheric water vapour increased by up to about 15 %. These dissimilarities in the anomalous circulation and the related ozone response between the year 2016 and the year 2020 result from differences in the tropical upwelling and in the secondary circulation of the QBO caused by differences in anomalous planetary and gravity wave breaking in the lower stratosphere near the equatorward upper flanks of the subtropical jet. The anomalous planetary and gravity wave breaking was stronger in the lower stratosphere between the tropopause and the altitude of about 23 km during the QBO disruption events in 2016 than in 2020. However, the differences in the response of lower-stratospheric water vapour to the QBO disruption events between the year 2016 and the year 2020 are mainly due to the differences in cold-point temperatures induced by Australian wildfire, which moistened the lower stratosphere, thereby obscuring the impact of the QBO disruption event in 2020 on water vapour in the lower stratosphere. Our results highlight the need for a better understanding of the causes of the QBO disruption, their interplay with other modes of climate variability in the Indo-Pacific region, including the El Niño–Southern Oscillation (ENSO) and the Indian Ocean Dipole (IOD), and their impacts on water vapour and ozone in the upper troposphere/lower stratosphere in the face of a changing climate.
- Article
(11723 KB) - Full-text XML
-
Supplement
(26480 KB) - BibTeX
- EndNote


The upper troposphere and lower stratosphere (UTLS) form a key region of the Earth's climate system because of a large sensitivity of radiative forcing to greenhouse gas variations in that region, such as water vapour (H2O) and ozone (O3) (Gettelman et al., 2011; Dessler et al., 2013; Nowack et al., 2015). The transport and distribution of these trace gases in the UTLS are determined by the stratospheric Brewer–Dobson circulation (BDC), defined as the meridional overturning circulation which transports air masses upward from the tropics, poleward, and then downward in the extratropics through its transition and shallow branches in the UTLS and its deep branch in the middle and upper stratosphere (Brewer, 1949; Butchart, 2014; Lin and Fu, 2013). Any changes in the composition of these radiatively active trace gases in the UTLS region induced by the BDC and its modulation by the modes of climate variability lead to large impacts on surface climate (e.g. Forster and Shine, 2002, 1999; Solomon et al., 2010; Riese et al., 2012; Butchart, 2014; Diallo et al., 2017, 2018, 2019, 2021).
Ozone is mainly produced in the lower and middle stratosphere between about 16 and 35 km in altitude, often referred to as the ozone layer (Cicerone, 1987; WMO, 2018; Langematz, 2019). In addition, ozone variability in the tropical lower stratosphere is a good proxy for the tropical upwelling of the BDC (Randel et al., 2007; Abalos et al., 2013; Stolarski et al., 2014). The ozone transport and lifetime in the UTLS region are both modulated by the seasonality in the BDC and the modes of climate variability, such as the quasi-biennial oscillation (QBO) (Randel and Thompson, 2011; Diallo et al., 2018). Lower-stratospheric water vapour and its multi-timescale variations ranging from days to decades are mainly controlled by changes in the tropical cold-point temperatures and its modulations by the natural climate variability (Holton and Gettelman, 2001; Hu et al., 2016; Diallo et al., 2018; Tao et al., 2019; Randel and Park, 2019). Therefore, the amount of water vapour in the UTLS region is directly linked to the dehydration (i.e. the process of removing water) of the air parcels crossing through the coldest temperatures in the tropical tropopause layer (e.g. between 14 and 19 km; Fueglistaler et al., 2009).
Mostly driven by gravity waves and equatorially trapped waves, the QBO is a quasi-periodic oscillation between tropical westerly and easterly zonal winds (Baldwin et al., 2001; Ern et al., 2014). The QBO is considered a dominant mode of climate variability of the equatorial stratosphere, and it globally impacts the transport and distributions of stratospheric trace gases, including water vapour and ozone. Both alternating QBO easterly and westerly zonal wind regimes modulate the vertical and meridional components of the BDC and affect temperature structure, thereby impacting the water vapour and ozone composition and radiative feedback in the UTLS region (Plumb and Bell, 1982; Niwano et al., 2003; Diallo et al., 2018).
The quasi-periodic QBO mean cycle of an approximately 28-month period, which alternates between westerly and easterly zonal winds, was subject to two disruptions in the past 5 years. In February 2016 and January 2020, the QBO westerlies in the tropical lower stratosphere were unexpectedly interrupted by anomalous QBO easterlies caused by planetary waves propagating from the mid-latitudes toward the equatorial region combined with equatorial convective gravity waves (Osprey et al., 2016; Coy et al., 2017; Kang et al., 2020; Kang and Chun, 2021). Hitherto, there has been no clear understanding of how these QBO disruption events are linked to anomalously warm or cold sea surface temperatures (Schirber, 2015; Dunkerton, 2016; Christiansen et al., 2016; Barton and McCormack, 2017), volcanic aerosols (Kroll et al., 2020; DallaSanta et al., 2021), wildfire smoke (Khaykin et al., 2020; Yu et al., 2021; Peterson et al., 2021), and climate change (Anstey et al., 2021). However, a recent study based on climate model simulations from Phase 6 of the Coupled Model Intercomparison Project (CMIP6) predicts increased disruption frequencies to the quasi-regular QBO cycle in a changing climate (Anstey et al., 2021). Previous studies also suggest that the QBO amplitude in the tropical stratosphere is decreasing in the lower stratosphere due to the climate-change-induced strengthening of the tropical upwelling (Saravanan, 1990; Kawatani et al., 2011; Kawatani and Hamilton, 2013). Thus, in the context of a changing climate, the predictable QBO signal associated with the quasi-regular phase progression and amplitude as well as its potential impacts on UTLS composition faces an uncertain future. Therefore, it is of particular importance to quantify and better understand the different anomalous circulations and the impacts of the QBO disruption events on UTLS water vapour and ozone, which have the potential to locally and globally affect the radiative forcing of the Earth's climate system through their impacts on surface temperatures (Forster and Shine, 1999; Butchart and Scaife, 2001; Solomon et al., 2010; Riese et al., 2012).
Here, we use satellite observations to quantify the similarities and differences in the strength and depth of perturbed/disrupted QBO impacts in 2016 and 2020 on water vapour and ozone in the lower stratosphere. Also, we analyse the main drivers of the differences in anomalous circulation and UTLS composition changes. Section 2 describes the satellite observational data sets and the multi-variate hybrid regression model used for the quantification. Section 3 describes the anomalous BDC and UTLS composition changes following the 2016 and 2020 QBO disruption events. Section 4 discusses the results of a well-established multi-variate hybrid regression analysis to provide evidence for the impact of the QBO disruption events on lower-stratospheric water vapour and ozone. Finally, we discuss the main reasons for the differences between the 2016 and 2020 impacts of the QBO disruption events on BDC and UTLS composition and the related dynamical processes associated with planetary and gravity wave dissipation, which are likely caused by the anomalous surface conditions associated with the strong El Niño–Southern Oscillation (ENSO) in 2015–2016 and the strong Indian Ocean Dipole (IOD) in 2019–2020. We also discuss the differences in BDC and UTLS composition between 2016 and 2020 in terms of the particularly warm stratosphere in the context of Australian wildfire smoke in 2020.
To quantify the QBO and Australian wildfire smoke impacts, we used the monthly mean, zonal mean ozone and water vapour mixing ratios from Aura Microwave Limb Sounder (MLS) satellite observations covering the 2005–2020 period (Livesey et al., 2017). The version 4.4 MLS data set used here has a vertical resolution of 2.5–3.5 km ranging from 8 to 35 km and from 60∘ S to 60∘ N. The individual profile measurements of this version 4.4 have a precision and systematic uncertainty of about ±10 %–40 % and ±10 %–25 % for H2O and ±0.02–0.04 ppmv and ±0.02–0.05 ppmv + ±5 %–10 % for O3, respectively, with a spatial representativeness of ∼200–300 km along the orbital-track line of sight (Schwartz et al., 2013; Livesey et al., 2017; Santee et al., 2017). Previous findings show that MLS monthly mean, zonal mean H2O mixing ratios show very good agreement with 13 water vapour products from 11 limb-viewing satellite instruments throughout most of the atmosphere (including the UTLS), with mean deviations from the multi-instrument mean between +2.5 % and +5 %, making these random errors irrelevant for the averaged monthly mean, zonal mean H2O anomalies used in this study (e.g. Hegglin et al., 2013, 2021).
In addition to the MLS observation data sets, we also utilize the temperature (T) and zonal mean wind (U) for the 2005–2020 time period from the ERA5 reanalysis of the European Centre for Medium-Range Weather Forecasts (ECMWF) (Hersbach et al., 2020). We have also calculated the residual circulation vertical velocity () using the transformed Eulerian mean (TEM; Andrews et al., 1987) and decomposed the wave drag into planetary wave drag (PWD) and gravity wave drag (GWD) contributions to the circulation anomalies (Ern et al., 2014, 2021). Note that we are using the ERA5 reanalysis data on the original 137 model levels for calculating the TEM budget, but not the coarse conventional pressure-level data, which can cause large uncertainties in the equatorial waves and zonal wind in the tropical stratosphere (Fujiwara et al., 2012; Kim and Chun, 2015; Kawatani et al., 2016). For more details about the ERA5 TEM calculations and wave decomposition, please see Diallo et al. (2021).
We disentangle the QBO impact on the MLS monthly mean, zonal mean stratospheric water vapour and ozone mixing ratios from the other sources of natural climate variability using a multi-variate hybrid regression model for the 2005–2020 period (Eq. 1). In the figures, only the 2013–2020 period is shown to highlight the impact of the two QBO disruption events. The established multi-variate hybrid regression method is appropriate for separating the relative influences of the considered modes of climate variability, including the QBO, on stratospheric water vapour and ozone. Additional details about the multi-variate hybrid regression model and its applications can be found in Diallo et al. (2018). Our multi-variate hybrid regression model decomposes the given monthly zonal mean variable, Vari, into a long-term linear trend, a seasonal cycle, modes of climate variability, and a residual (ϵ). For a given variable Vari (herein H2O, O3, , T, PWD, and GWD), the multi-variate hybrid regression model yields
where Proxyn represents the different climate indices used here. Proxy1 is a normalized QBO index (QBOi) from the 5∘ S–5∘ N ERA5 zonally averaged zonal mean winds with full vertical levels then deseasonalized and normalized by the standard deviation to build the QBOi (Hersbach et al., 2020). Proxy2 is the normalized Multivariate ENSO Index (MEI; Wolter and Timlin, 2011), Proxy3 is the IOD (Saji et al., 1999), Proxy4 is the Madden–Julian oscillation (MJO, Son et al., 2017), and Proxy5 is the aerosol optical depth (AOD) from satellite data (Thomason et al., 2018; Khaykin et al., 2020). Trend is a linear trend. SeasCyc is the annual cycle. The coefficients are the amplitude bn and the lag τn(ylat,zalt) associated with the QBO, ENSO, IOD, MJO, and AOD, respectively. The solar forcing is neglected because our data set is relatively short. Finally, we estimate the uncertainty in the multi-variate hybrid regression model using a Student's t-test technique (von Storch and Zwiers, 1999; Friston et al., 2007).
In February 2016 and January 2020, unexpected tropical QBO easterlies (negative QBOi) developed into the downward-propagating tropical QBO westerlies between the altitudes of 16 km and 25 km, thereby breaking the quasi-regular QBO cycle of alternating easterly and westerly phases (Figs. 1a and S1a, b in the Supplement) (Osprey et al., 2016; Newman et al., 2016; Anstey et al., 2020). Both QBO disruption events have been associated with a combination of extratropical Rossby waves, equatorial planetary waves (Kelvin, Rossby, mixed Rossby gravity, and inertia gravity), and small-scale convective gravity waves, propagating into the deep tropics and depositing their negative momentum forcing (Osprey et al., 2016; Newman et al., 2016; Kang et al., 2020; Kang and Chun, 2021). Both QBO disruption events were primarily triggered by mid-latitude Rossby waves propagating from the Northern Hemisphere in 2016 and from the Southern Hemisphere in 2020 into the deep tropical lower stratosphere. In 2016, the equatorial planetary wave forcing may have pre-conditioned mid-latitude Rossby waves to break easily at the Equator (e.g. Lin et al., 2019), while in 2020, the equatorial planetary and small-scale convective gravity waves propagating into the UTLS predominantly contributed to the disruption (Kang et al., 2020; Kang and Chun, 2021). Note that the potential processes and mechanisms triggering the QBO disruption are still under debate. Recent findings from Match and Fueglistaler (2021) using a one-dimensional theoretical model of the QBO from Plumb and Bell (1982) pointed out the key role of the upwelling and wave dissipation. Details regarding the triggering of QBO disruptions have been the focus of several recent studies (e.g. Schirber, 2015; Dunkerton, 2016; Christiansen et al., 2016; Coy et al., 2017; Barton and McCormack, 2017; Hitchcock et al., 2018; Watanabe et al., 2018; Renaud et al., 2019; Match and Fueglistaler, 2021). Although similar in many respects, including the causes of the sudden development of tropical QBO easterlies into tropical QBO westerlies between the altitudes of 16 and 25 km, the two QBO disruption events also exhibit differences, particularly in the structure (strength and depth) of their impacts and the level at which the shift started (Fig. 1a). Here, we mainly focus on the impact of the QBO disruption events on the lower-stratospheric BDC and on the distributions of trace gases like water vapour and ozone.
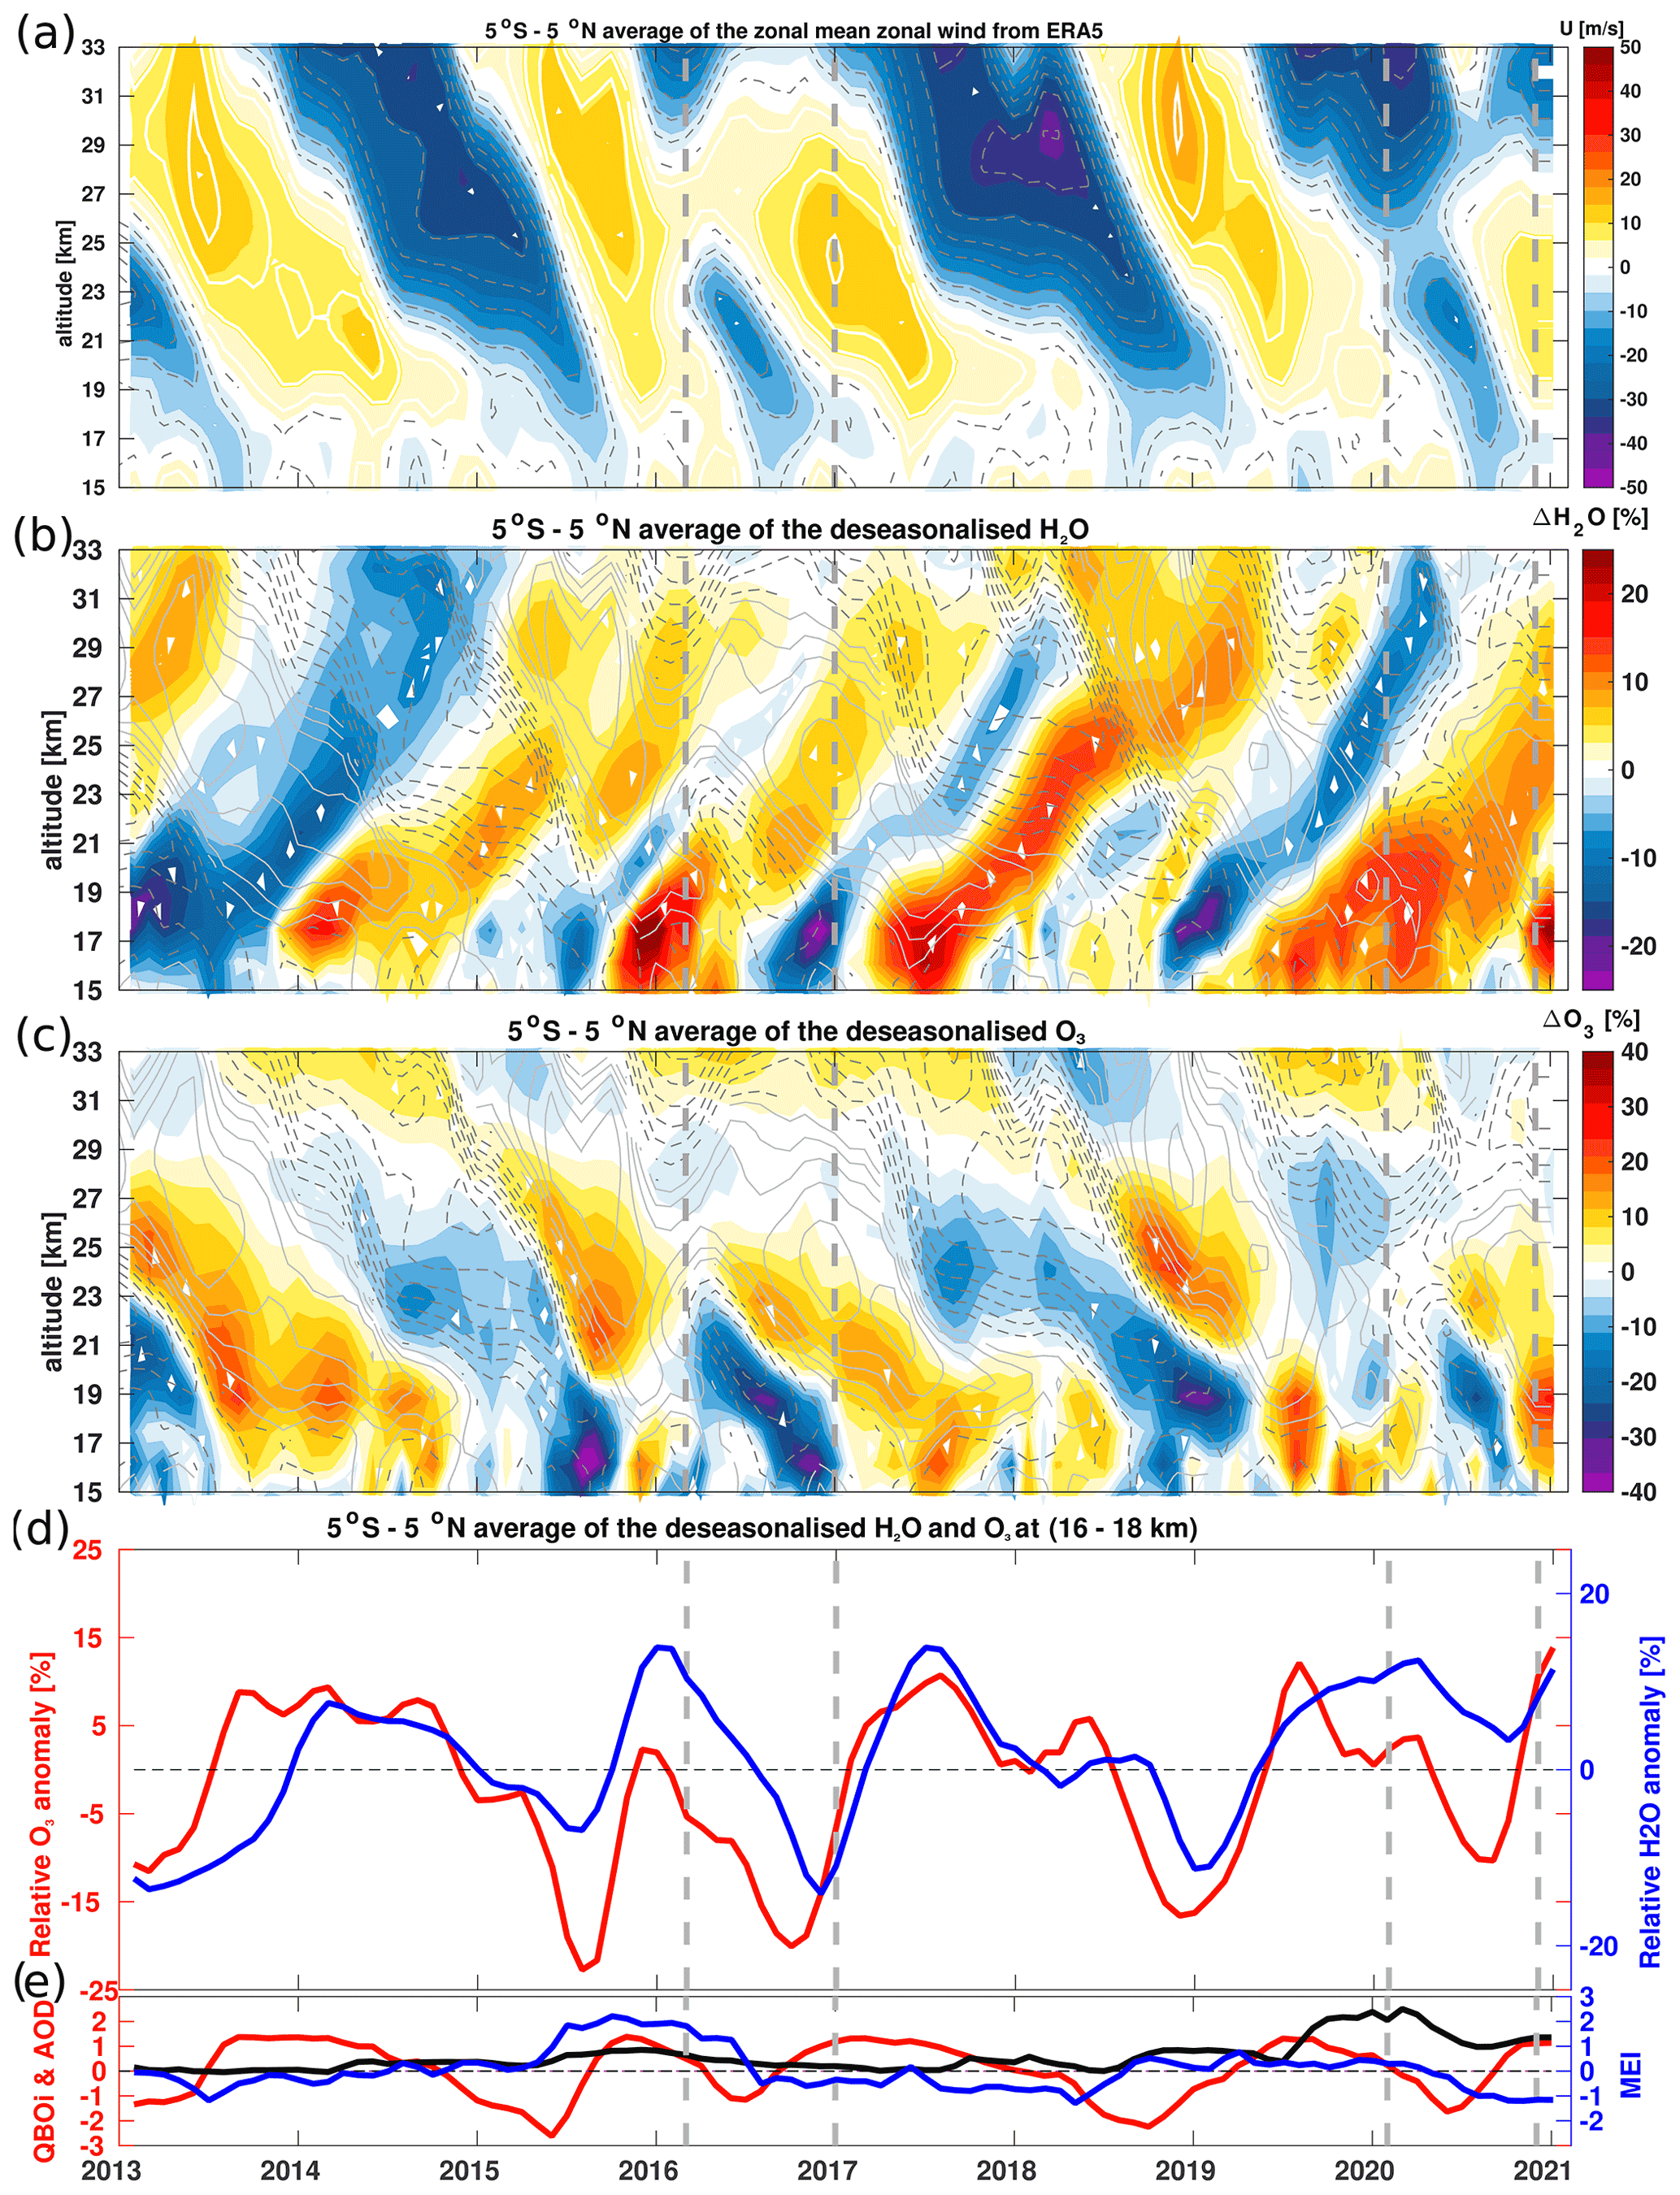
Figure 1Tropical average of the zonal mean zonal wind (U) from the ERA5 reanalysis and deseasonalized stratospheric H2O and O3 time series from MLS satellite observations for the 2013–2020 period in percent change from long-term monthly means as a function of time and altitude. Shown are (a) zonal mean zonal wind U, (b) deseasonalized monthly mean H2O anomalies, and (c) deseasonalized monthly mean O3 anomalies. (d) Tropical average of the deseasonalized lower-stratospheric H2O (blue) and O3 (red) time series between the altitudes of 16 and 18 km. The lowermost panel (e) shows the QBO index at 50 hPa (21 km) in red, the MEI in blue, and the AOD index in black. The vertical grey dashed lines indicate February 2016 and January 2020 for the QBO disruption onset and December 2016 and November 2020 for the QBO disruption offset. The monthly averaged zonal mean zonal wind component, U (m s−1), from the ERA5 reanalysis is overlaid as solid white (westerly wind) and dashed grey (easterly wind) contour lines.
The similarities as well as the differences between the two disruption events are also visible in the inter-annual variability of the tropical lower-stratospheric zonal mean zonal wind (a), H2O (b), and O3 (c) anomalies as a percentage change relative to the monthly mean mixing ratio during the 2013–2020 period (Fig. 1a–c). Both QBO disruption events are expected to impact the tropical upwelling of the BDC through the two-way interactions between the mean flow and wave propagation associated with the QBO phases (Plumb, 1977; Lindzen, 1971; Holton, 1979; Dunkerton, 1980; Plumb and Bell, 1982; Grimshaw, 1984; Match and Fueglistaler, 2021) as well as through its control of the tropical cold-point temperatures (Kim and Son, 2012; Kim and Chun, 2015). The impacts of the QBO disruption events in 2016 and 2020 on the transport and distribution of lower-stratospheric H2O and O3 mixing ratios are most effective when the anomalous QBO easterlies reach the tropical cold-point temperature altitude (∼17 km), with the associated enhanced tropical upwelling driven by the anomalous wave breaking from June to December in 2016 and from June to August in 2020 (Fig. 1) (Tweedy et al., 2017; Diallo et al., 2018). The zonal mean, zonal wind shows that the westerly jet between the onset and offset time periods and at the altitude of 25 km is stronger and deeper during the QBO disruption event in 2016 than during the QBO disruption event in 2020 (Figs. 1a and S1c, d in the Supplement). The QBO disruption event in 2020 shows a clear separation of the westerlies into two parts, while the QBO disruption event in 2016 reestablishes the westerlies at the top of the easterlies, e.g. at the altitude of about 25 km (Fig. 1a). As soon as the downward propagation of tropical QBO easterlies reaches the tropical cold-point temperature altitude (∼17 km) from June to December 2016, the H2O mixing ratios decrease, i.e. turning from positive to negative anomalies. As reported by Diallo et al. (2018), the alignment of the strong El Niño event with a westerly QBO in the early boreal winter of 2015–2016 (September 2015–March 2016) substantially increased H2O mixing ratios and decreased O3 mixing ratios by up to about 20 % in the tropical lower stratosphere between the tropopause (∼16 km) and the altitude of about 23 km (Fig. 1b–d). The sudden occurrence of the QBO disruption event decreased the lower-stratospheric H2O and O3 mixing ratios from late spring to the early following winter by up to about 20 % (Fig. 1b–d).
Conversely, during the QBO disruption event in 2020, Fig. 1b–d show clear differences in the tropical lower-stratospheric trace gas anomalies, particularly in the strength and depth of H2O and O3 anomalies, consistent with the structural zonal mean zonal wind changes (Fig. S1c, d). The tropical lower-stratospheric O3 anomalies are purely responding to the enhanced tropical upwelling of the BDC caused in 2016 by a combination of a strong El Niño event, a negative IOD event, and the QBO disruption event in 2016 and in 2020 by a combination of a weak La Niña, a strong positive IOD event, and the QBO disruption events in 2020 (e.g. easterly winds between 16 and 23 km (100–40 hPa)) (Diallo et al., 2018). The tropical lower-stratospheric O3 anomaly is a good proxy of the tropical upwelling of the BDC as its concentration is modulated by the advection of tropospheric air generally poor in O3 into the stratosphere (Randel et al., 2006; Abalos et al., 2013; Stolarski et al., 2014; Weber et al., 2011; Iglesias-Suarez et al., 2021). The small decrease in the tropical lower-stratospheric O3 anomalies by up to about 10 % in 2020 compared to about 20 % in 2016 between the altitudes of 16 and 23 km suggests a stronger tropical upwelling and its modulations in 2016 than in 2020 (Fig. 1c, d).
The inter-annual variability in large-scale upward advection of the tropical stratospheric H2O anomalies (i.e. tape recorder) is more challenging to interpret because of its regulation by the variability in the tropical cold-point temperatures (Mote et al., 1996; Holton and Gettelman, 2001; Hu et al., 2016; Randel and Park, 2019). The negative tropical lower-stratospheric H2O anomalies induced by the interplay of different modes of natural climate variability, including the QBO, are weaker in 2020 than in 2016 (Figs. 1b, d and S2a, b in the Supplement). The tropical lower-stratospheric H2O anomalies averaged between the altitudes of 16 and 18 km are up to about 20 % more negative in 2016 than in 2020 (Figs. 1b, d and S2a, b in the Supplement). In particular, the 2020 tape recorder shows positive H2O anomalies as large as 15 % even after the QBO disruption event that are of opposite sign to the 2016 H2O anomalies (Fig. 1b, d). This complexity in H2O inter-annual variability lies in its dependency on the interplay of different modes of climate variability, including the QBO (Diallo et al., 2018; Brinkop et al., 2016; Tian et al., 2019; Liess and Geller, 2012), volcanic aerosols (Dessler et al., 2014; Brinkop et al., 2016; Tao et al., 2019; Kroll et al., 2020; DallaSanta et al., 2021), seasons (early or late in the winter), and location (western, central, or eastern Pacific, where the ENSO and IOD maximum occurs; Garfinkel et al., 2013; Smith et al., 2021). Therefore, to elucidate the impact of the two QBO disruption events on the Brewer–Dobson circulation and the respective distributions of lower-stratospheric H2O and O3 anomalies, we performed a regression analysis both without and with explicitly including QBO signals to isolate the QBO impact on these trace gases. The difference between the residual (ϵ in Eq. 1) with and without explicit inclusion of the QBO signals provides the QBO-induced impact on stratospheric H2O and O3 anomalies. Also, the impact of 2020 Australian wildfire smoke on stratospheric H2O anomalies is analogously obtained by differencing the residuals of the regression model. This approach of differencing the residuals is similar to direct calculations, projecting the best fits of the regression onto the QBO basis functions, i.e. the QBO predictor time series (see Supplement Figs. 2 and 4 in Diallo et al., 2017). In addition, this differencing approach avoids the need to reconstruct the time series after the regression analysis.
4.1 Impact of QBO disruptions on UTLS composition
Figure 2a, b show time series of the QBO-induced inter-annual variability in tropical lower-stratospheric H2O and O3 anomalies estimated from the difference between the residual (ϵ in Eq. 1) without and with explicit inclusion of the QBO proxy for the 2013–2020 period. A footprint of both QBO disruption events is clearly visible in lower-stratospheric H2O and O3 anomalies, with a shift from positive anomalies related to the westerly winds (positive QBOi) to negative anomalies related to the easterly winds (negative QBOi). The impacts of the QBO disruption events on lower-stratospheric O3 anomalies clearly follow the monthly mean, zonal mean wind changes. The impacts of the QBO disruption event on lower-stratospheric H2O anomalies are delayed by about 3–6 months compared to the zonal wind anomalies because of the H2O tropospheric origin as well as its dependency on the tropical cold-point temperature anomalies.
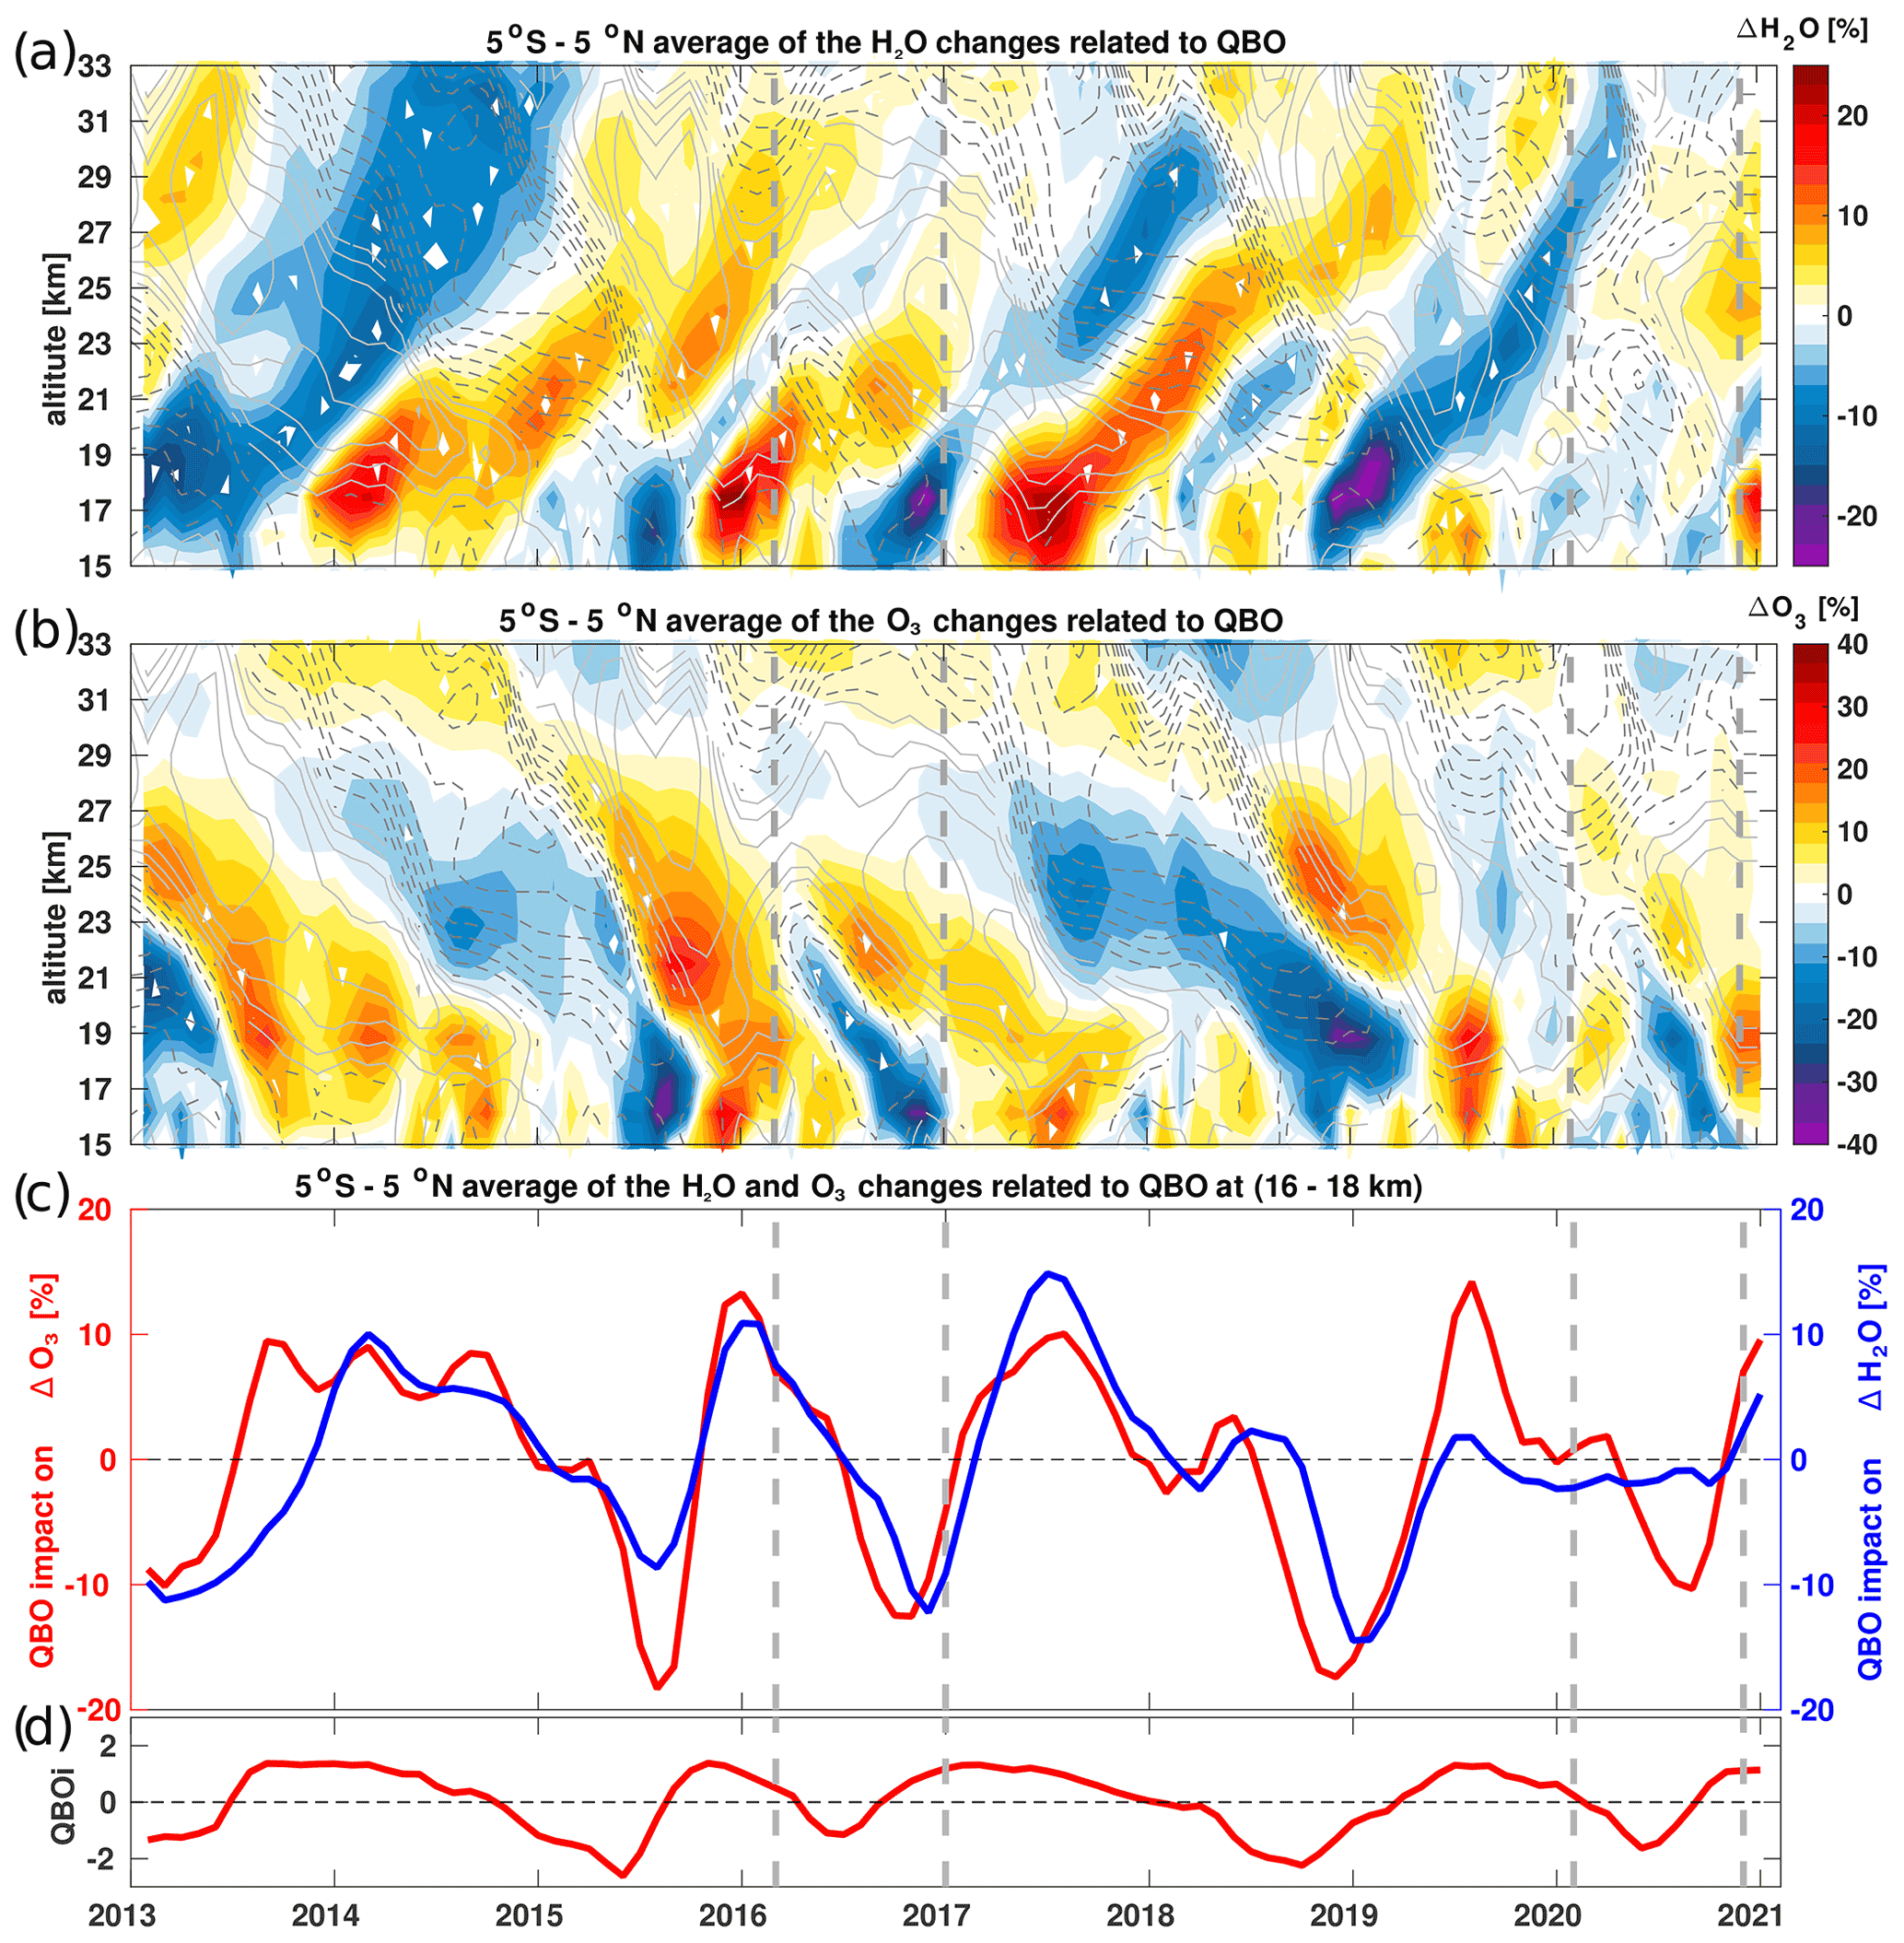
Figure 2QBO impact on the tropical average of the stratospheric H2O (a) and O3 (b) anomalies from the MLS satellite observations for the 2013–2020 period in percent change relative to monthly mean mixing ratios as a function of time and altitude. (c) QBO impact on the tropical average of the lower-stratospheric H2O (blue) and O3 (red) time series between the altitudes of 16 and 18 km. The shown QBO impact on the stratospheric trace gases is derived from the multiple regression fit as the difference between the residual (ϵ in Eq. 1) without and with explicit inclusion of the QBO signal. The lower panel (d) below indicates the QBO index at 50 hPa (21 km) in red. The vertical grey dashed lines indicate February 2016 and January 2020 for the QBO disruption onset and December 2016 and November 2020 for the QBO disruption offset. The monthly averaged zonal mean zonal wind component, U (m s−1), from the ERA5 reanalysis is overlaid as solid grey contours (westerly) and dashed grey contours (easterly).
Besides the good agreement in the structure of both trace gas changes, there are clear differences in the strength and depth of both lower-stratospheric H2O and O3 responses to the QBO disruptions between the 2016 and 2020 events, particularly large for the H2O response. These differences in the impacts of the QBO disruption events are consistent with the observed lower-stratospheric H2O and O3 anomalies (Figs. 1, 2, and S2). During 2016, the QBO shift from westerlies to easterlies at an altitude of about 23 km (40 hPa) in the tropical lower stratosphere induces substantial negative H2O and O3 anomalies of up to about 20 % between the altitudes of 16 and 23 km from the early boreal summer to the next boreal winter for H2O and from the early boreal spring to the next boreal winter for O3 (Fig. 2). This decrease in H2O and O3 mixing ratios is consistent with upward transport of young and dehydrated air and is poor in O3 in the lower stratosphere between the altitudes of 16 and 23 km. As expected, the sudden occurrence of the QBO disruption events caused anomalously low cold-point temperatures and enhanced tropical upwelling in 2016 and 2020, consistent with the decrease in the H2O and O3 mixing ratios induced by the QBO easterly (Fig. 2). However, besides the similarities in the structural changes, the negative H2O and O3 anomalies induced by the QBO disruption are smaller and shallower in 2020 than in 2016. While differences between the 2016 and 2020 impacts of the QBO disruption events on O3 are small, the differences between the 2016 and 2020 O3 anomalies are particularly large due to other modes of natural variability (Fig. 1c, d and 2b, d). The differences in the magnitudes of negative O3 anomalies suggest a weaker modulation of the anomalous tropical upwelling of the BDC by the secondary circulation in 2020 than in 2016, consistent with the differences in the strength and depth of the residual vertical velocity and wave forcing anomalies discussed in Sect. 4.2. The differences in the strength and depth of the H2O response to the QBO disruption events suggest that the tropical cold-point temperature is substantially different between year 2016 and year 2020. In addition, we note that the QBO westerly followed by the shift to the QBO easterly is not the main cause of the large increase in the 2020 lower-stratospheric H2O anomalies. In the following, we assess the potential impact of the unusually strong Australian wildfire smoke on the lower-stratospheric H2O anomalies in 2020 through its impact on the stratospheric temperature anomaly (Khaykin et al., 2020; Yu et al., 2021; Peterson et al., 2021).
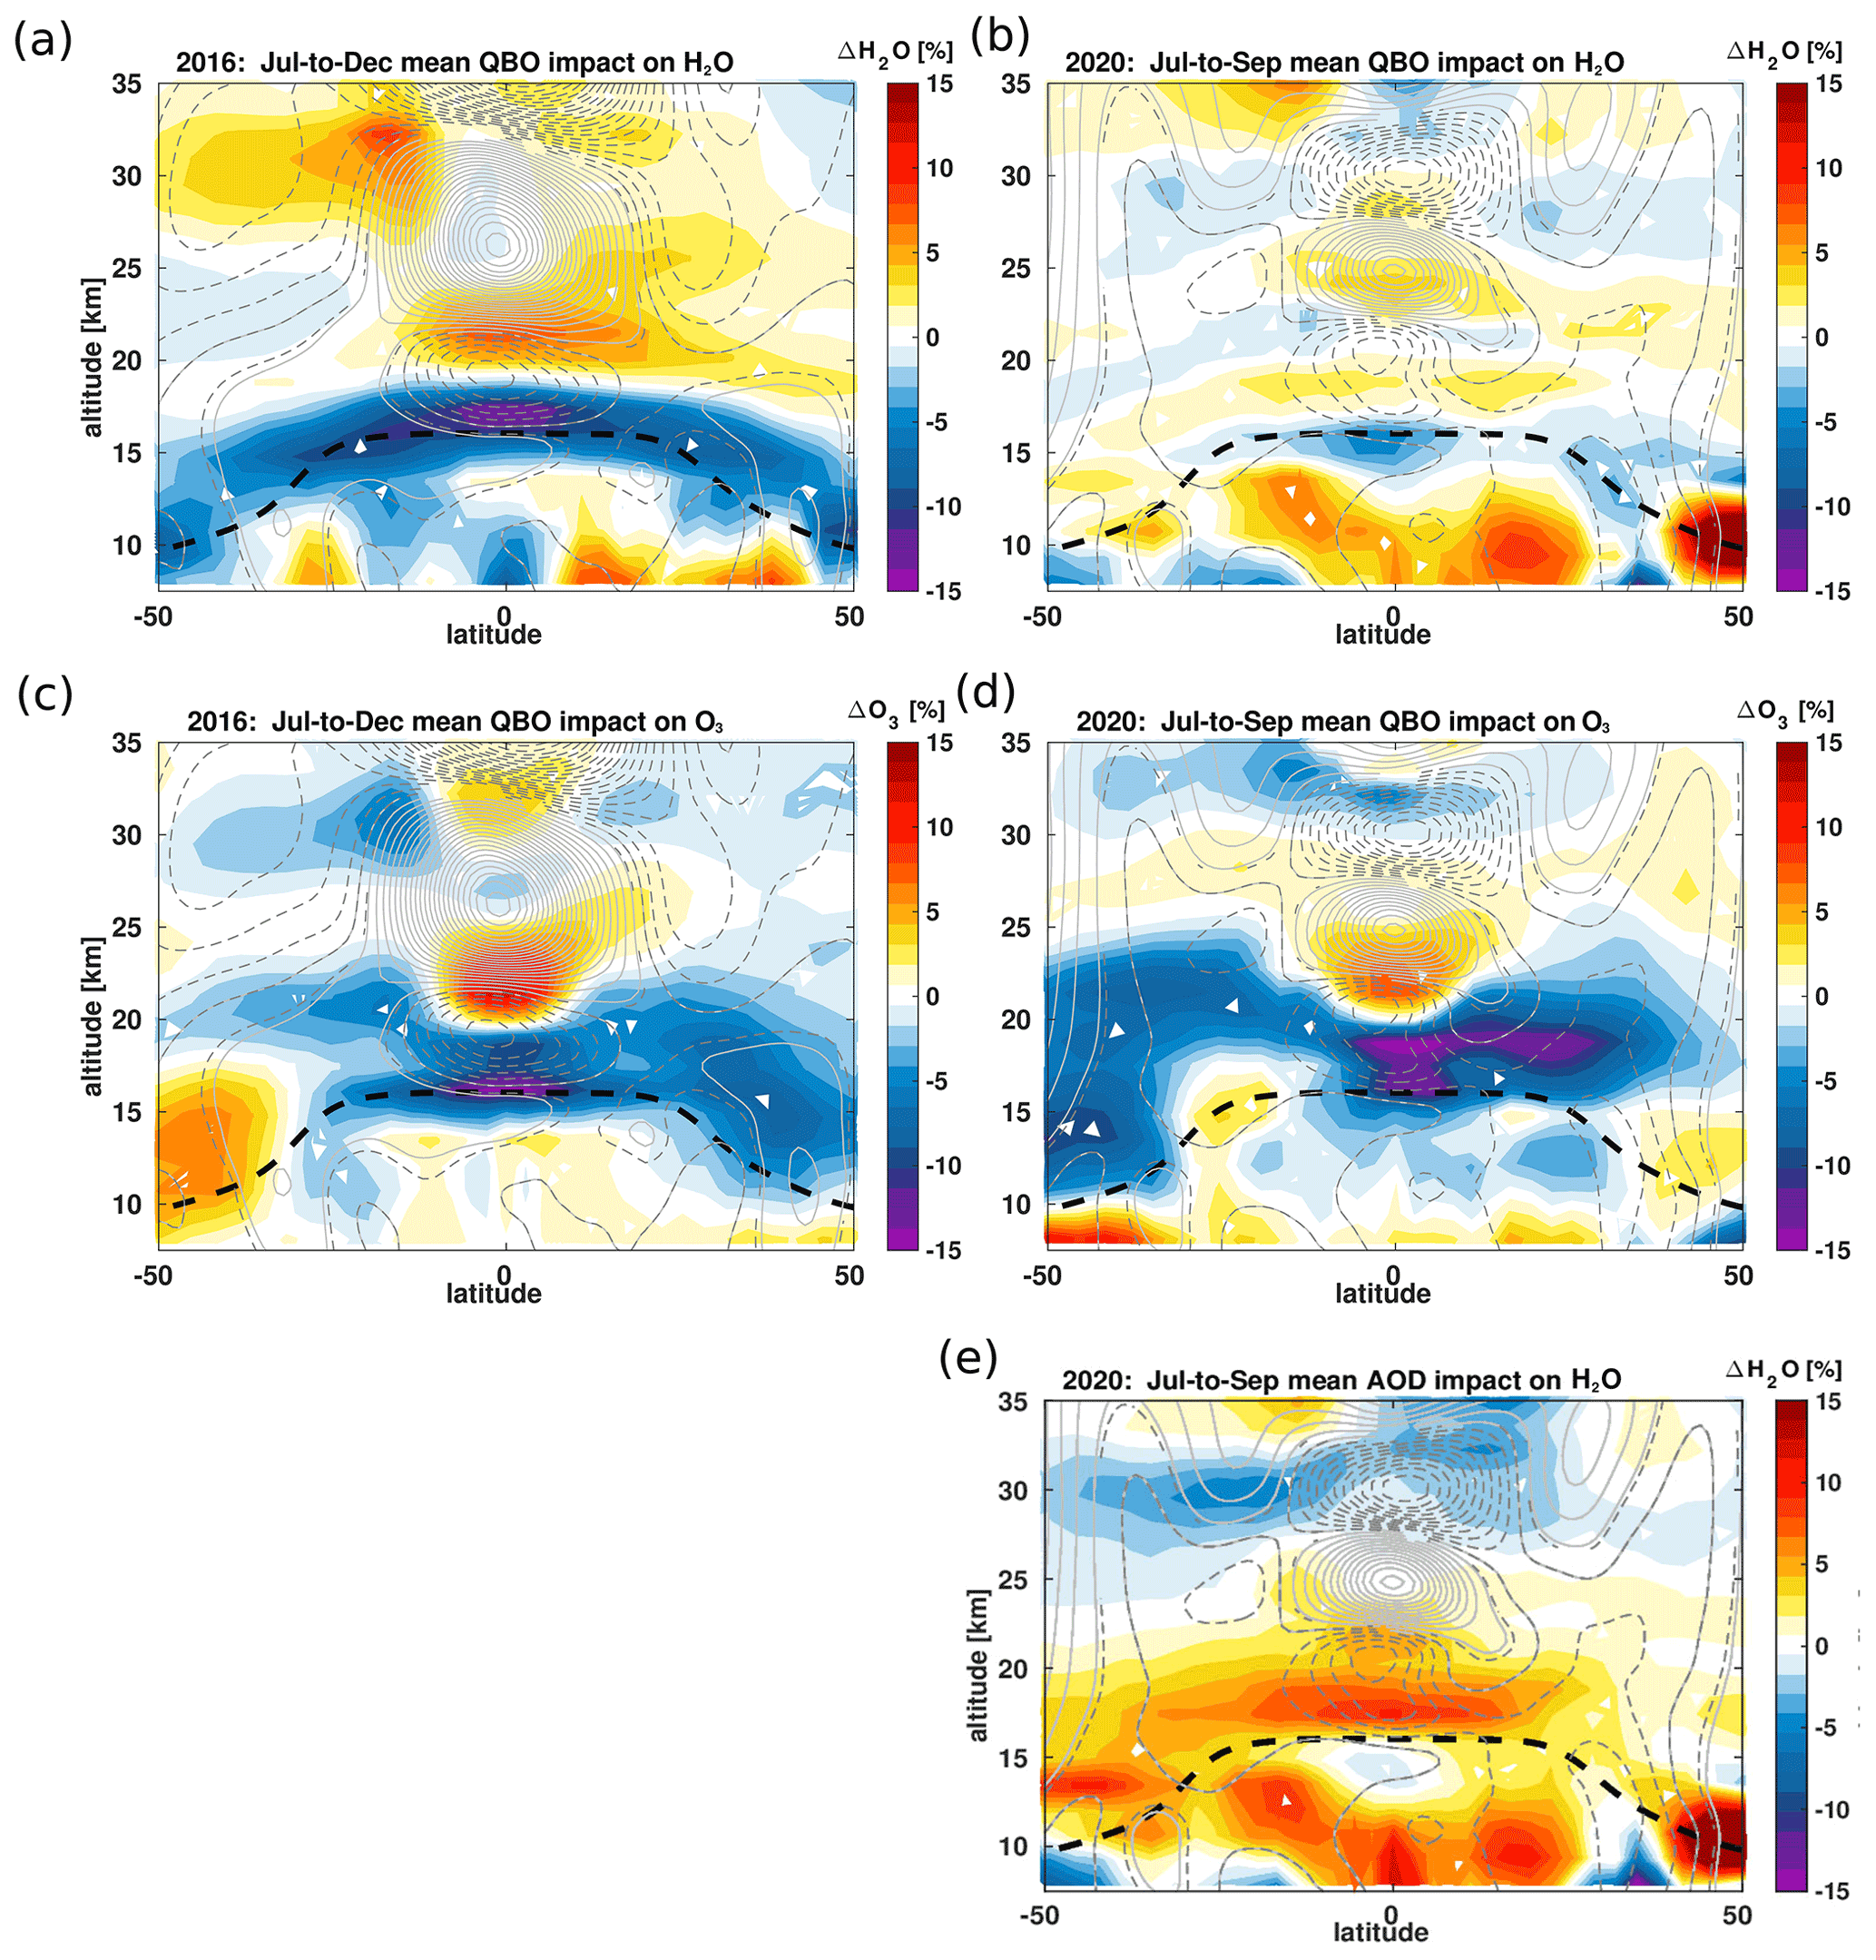
Figure 3Impact of the QBO disruption on the zonal mean lower-stratospheric H2O (a, b) and O3 (c, d) anomalies from MLS satellite observations averaged from July to December for 2016 (a, c) and from July to September for 2020 (b, d). In addition, the impact of the 2020 Australian wildfires on the zonal mean lower-stratospheric H2O is shown (e). All panels show the percentage change relative to 2005–2014 monthly mean mixing ratios as a function of latitude and altitude. The impact of the QBO disruptions and the Australian wildfire on the stratospheric trace gases is derived from the multiple regression fit as the difference between the residual (ϵ in Eq. 1) without and with explicit inclusion of the QBO signal. The black dashed horizontal line indicates the tropopause from the ERA5 reanalysis. The monthly averaged zonal mean zonal wind component, U (m s−1), from the ERA5 reanalysis is overlaid as solid grey (westerly wind) and dashed grey (easterly wind) contours.
Figures 3a–d show the impact of the QBO disruption events on the zonal mean lower-stratospheric H2O and O3 anomalies estimated from the difference between the residual (ϵ in Eq. 1) without and with explicit inclusion of the QBO signal for the 2005–2020 time period. Figure 3e shows the impact of the 2020 Australian wildfire on lower-stratospheric H2O anomalies estimated from the difference between the residual (ϵ in Eq. 1) without and with explicit inclusion of the AOD signal for the 2005–2020 time period. The lower-stratospheric H2O anomalies are averaged from July to December for 2016 and from July to September for 2020, respectively. We chose different averaging periods for 2016 (July–December) and 2020 (July–August–September) to have a similar zonal mean structure of the H2O and O3 responses to QBO disruption events, although their depth and strength are different from each other.
In 2016, the shift to the QBO easterly phase in the tropics significantly dehydrates the global lower stratosphere by up to about 20 % below the altitude of 18 km (Figs. 3a and 1b) (Diallo et al., 2018; Tweedy et al., 2017). This decrease in H2O mixing ratios is due to the enhanced tropical upwelling of the BDC, its modulation by the secondary circulation of the QBO, and the related decrease in tropical cold-point temperatures as discussed later in Sect. 4.2 (Diallo et al., 2018; Jensen et al., 1996; Hartmann et al., 2001; Geller et al., 2002; Schoeberl and Dessler, 2011). Because of the hemispheric asymmetry of the BDC (e.g. stronger in the winter hemisphere) driven by planetary wave activity (e.g. Holton and Gettelman, 2001) and eddy mixing (e.g. Haynes and Shuckburgh, 2000), the rising dehydrated air from the tropics moves toward the middle and high latitudes of both hemispheres. The positive H2O anomalies above the altitude of 18 km are related to the effect of the preceding QBO westerly phase on tropical UTLS temperatures and the upward-propagating tape-recorder signal. The negative H2O anomalies are consistent with the observed negative tropical O3 anomalies below the altitude of 20 km induced by the QBO easterly phase (Figs. 3a, c and S2a, c in the Supplement). These changes indicate an enhanced tropical upwelling of the BDC and its modulation by the QBO easterly phase in the lower stratosphere between the altitudes of 16 and 18 km. The positive tropical O3 anomalies above the altitude of 20 km are associated with the QBO westerly phase (Figs. 3c and S2c in the Supplement). The large variabilities in extratropical O3 anomalies shown in Fig. 3c are related to the QBO influence on the extratropical circulation (Holton and Tan, 1980; Damadeo et al., 2014; Ray et al., 2020), stratospheric major warmings, and chemical processes (WMO, 2018).
In 2020, the impact of the QBO disruption event on the tropical lower-stratospheric H2O and O3 anomalies exhibits a similar structure to the effect of the QBO disruption event in 2016. Note that we use different averaging periods for 2016 (July to December) and 2020 (July to September) to highlight the structural similarities in the QBO impact. Both trace gases show negative anomalies in the tropics, corroborating the enhanced tropical upwelling of the BDC induced by the QBO shift from westerly winds to easterly winds in the tropics (Fig. 3b). However, there are also differences in both the lower-stratospheric H2O and O3 responses to the shift from the tropical QBO westerly phase to the tropical QBO easterly phase between July and December 2016 and between July and September 2020. Note that the differences in the impacts of the QBO disruption events on H2O between the year 2016 and the year 2020 are particularly large, up to about 20 % (Figs. 2a, c and 3a, b). Conversely to the globally dehydrated lower stratosphere in 2016, the sudden development of tropical QBO easterly winds in 2020 led to a small decrease in lower-stratospheric H2O mixing ratios and therefore to small negative lower-stratospheric H2O anomalies up to about 2 %–3 % (Figs. 2c and 3b). Despite the similar zonal mean structures of O3 anomalies induced by both QBO disruption events within these different averaging periods for 2016 (July to December) and 2020 (July to September), the impacts of the QBO disruption events on the zonal mean O3 mixing ratios are weaker when averaged in the entire year of 2020 than in the year 2016 (Figs. 3c, d and S2c, d in the Supplement). The differences in the strength and depth between the 2016 and 2020 H2O and O3 anomalies and their modulation by the QBO disruption events clearly suggest substantial differences in the anomalous tropical upwelling of the BDC and the tropical cold-point temperatures discussed in Sect. 4.2. The smaller negative tropical O3 anomalies suggest that the tropical upwelling of the BDC and its modulation by the QBO-induced secondary circulation are weaker in 2020 than in 2016 (Fig. 3c, d). Simultaneously, the positive tropical H2O anomalies in 2020 that are not related to the QBO disruption event indicate warmer tropical cold-point temperatures potentially induced by the unusually strong Australian wildfire smoke in the stratosphere (Khaykin et al., 2020; Yu et al., 2021; Peterson et al., 2021). The main dynamical causes of these differences are investigated in the following section.
4.2 Mechanisms driving the strength and depth differences
To further investigate and understand the key drivers of the anomalous circulation differences between the 2016 and 2020 impacts of the QBO disruption events, we analyse the differences in the tropical upwelling of the BDC and the secondary circulation induced by the QBO wind shear. Figure 4a–d show time series of the tropical residual circulation vertical velocity and temperature anomalies together with the impacts of the two QBO disruption events on and temperature anomalies during year 2016 and year 2020, respectively. Also, Fig. 5a–h show latitude–altitude sections of the and temperatures together with the associated impacts of the QBO disruption events during the year 2016 and year 2020 periods.

Figure 4Tropical average of the deseasonalized mean residual vertical velocity () and temperature anomaly time series ERA5 reanalysis for the 2013–2020 period together with the impact of QBO disruptions on the tropical mean and temperature anomalies derived from the multiple regression fit as a function of latitude and altitude. (a) Deseasonalized monthly mean tropical upwelling. (b) Disrupted QBO impact on monthly mean tropical upwelling anomalies. (c) Deseasonalized monthly mean tropical temperature. (d) Disrupted QBO impact on monthly mean tropical temperature anomalies. The vertical grey dashed lines indicate February 2016 and January 2020 for the QBO disruption onset and December 2016 and November 2020 for the QBO disruption offset. The lowermost panel (e) shows the QBO index at 50 hPa (21 km) in red. The monthly averaged zonal mean zonal wind component, U (m s−1), from the ERA5 reanalysis is overlaid as solid grey (westerly) and dashed grey (easterly) contours.

Figure 5Zonal mean residual vertical velocity () (a, b) and temperature anomalies (e, f) from the ERA5 reanalysis together with the impact of QBO disruption events on (c, d) and temperature anomalies (g, h) derived from the multiple regression fit for the years 2016 (a, c, e, g) and 2020 (b, d, f, h). The anomalies are as a deviation from the 2005–2014 zonal mean and temperature. The black dashed horizontal line indicates the tropopause from the ERA5 reanalysis. The monthly mean, zonal mean wind component, U (m s−1), from the ERA5 reanalysis is overlaid as solid grey contours (westerly) and dashed grey contours (easterly).
Clearly, Figs. 4 and 5 show that there are substantial differences in the anomalous tropical upwelling of the BDC as disclosed by and temperature anomalies during the two disruption events, consistent with the O3 anomalies (Fig. 1c, d). Also, the modulation of the tropical upwelling by the QBO disruption events exhibits differences smaller than the net anomalous circulation differences during the two periods, consistent with the impact of the QBO disruption events on O3 anomalies (Fig. 2b, c). In 2016, the tropical upwelling anomalies strongly increased, up to about 45 % below the altitude of about 18 km from April to December when the QBO westerly phase shifts to the QBO easterly phase (Fig. 4a). However, in 2020, the tropical upwelling anomalies are weaker and only reach up to about 20 % below the altitude of about 18 km, leading to about 25 % weaker anomalies in 2020 than in 2016 between the altitudes of about 17 and 20 km. At an altitude of about 17 km between the onsets and offsets, anomalies were up to about 10 %–15 % weaker in 2020 than in 2016 (Fig. 4a). In addition to the weaker tropical upwelling in 2020, the impact of the QBO disruption events on anomalies is consistent with the weaker QBO-induced secondary circulation in 2020 than in 2016, with up to about 25 % weaker modulation of the tropical upwelling (Fig. 4b). This weaker tropical upwelling of the BDC and the QBO-induced secondary circulation in 2020 than in 2016 is also visible in the zonal mean cross section of the mean and temperature anomalies (Fig. 5a, b, e, f) together with the impacts of the QBO disruption events on and temperature anomalies for 2016 and 2020 (Fig. 5c, d, g, h). The increase in the tropical upwelling as well as the secondary circulation associated with the QBO easterly wind shear between the tropopause height and altitude of about 18 km is weaker and shallower in 2020 than in 2016 (Figs. 4b and 5c, d). The differences in the anomalous tropical upwelling and secondary circulation are also consistent with the differences in the temperature anomalies as well as in the impacts of the QBO disruption events on temperature anomalies (Figs. 4c, d and 5e–h). In 2016, the tropical temperature anomalies, in particular around the cold-point tropopause at about 17 km, are strongly negative (Fig. 4c). This decrease in tropical temperatures is consistent with the strong tropical upwelling of the BDC and its modulation by the QBO-induced secondary circulation (Figs. 4b, d and 5a, c, e, g), which in turn led to large negative tropical lower stratosphere H2O and O3 anomalies in 2016.
Conversely, the tropical cold-point temperature anomalies are warmer and barely exceed −0.1 K in 2020, consistent with the smaller tropical anomalies (Figs. 4 and 5b, d, f, h) and the shorter lifetimes of tropical O3 anomalies, which last for only about 3 months (Figs. 1 and 2). These warmer tropical cold-point temperature anomalies corroborate the weaker tropical upwelling of the BDC and smaller tropical lower-stratospheric H2O and O3 mixing ratios in the year 2020. Interestingly, the differences in the tropical cold-point temperature anomalies between the year 2016 and the year 2020 are more pronounced, as shown in Fig. 5e, f, than the differences in the impacts of the QBO disruption events on tropical cold-point temperature anomalies (Fig. 5g, h). This anomalously warmer stratosphere, including high cold-point temperatures in 2020, is consistent with recent findings about the impact of Australian wildfire smoke (Khaykin et al., 2020; Yu et al., 2021; Peterson et al., 2021). Therefore, we also pay attention to volcanic eruptions and Australian wildfire smoke in 2020, which can impact lower-stratospheric temperatures and therefore lower-stratospheric H2O and O3 anomalies. Indeed, using our regression analyses, we can show that the Australian wildfire largely moistened the lower stratosphere between the altitudes of 16 and 25 km in 2020 by inducing an anomalously warmer stratosphere, thereby hiding the impact of the QBO disruption event in 2020 on H2O anomalies (Fig. 3e). The removal of Australian wildfire impacts allows us to better highlight the weak structure of the impact of the QBO disruption event in 2020 on lower-stratospheric H2O anomalies between the altitude of 16 km and 25 km, which is similar to the impact of the QBO disruption event in 2016. Regarding the differences in the upwelling of the BDC, in the following, we finally investigate the related wave drag changes.
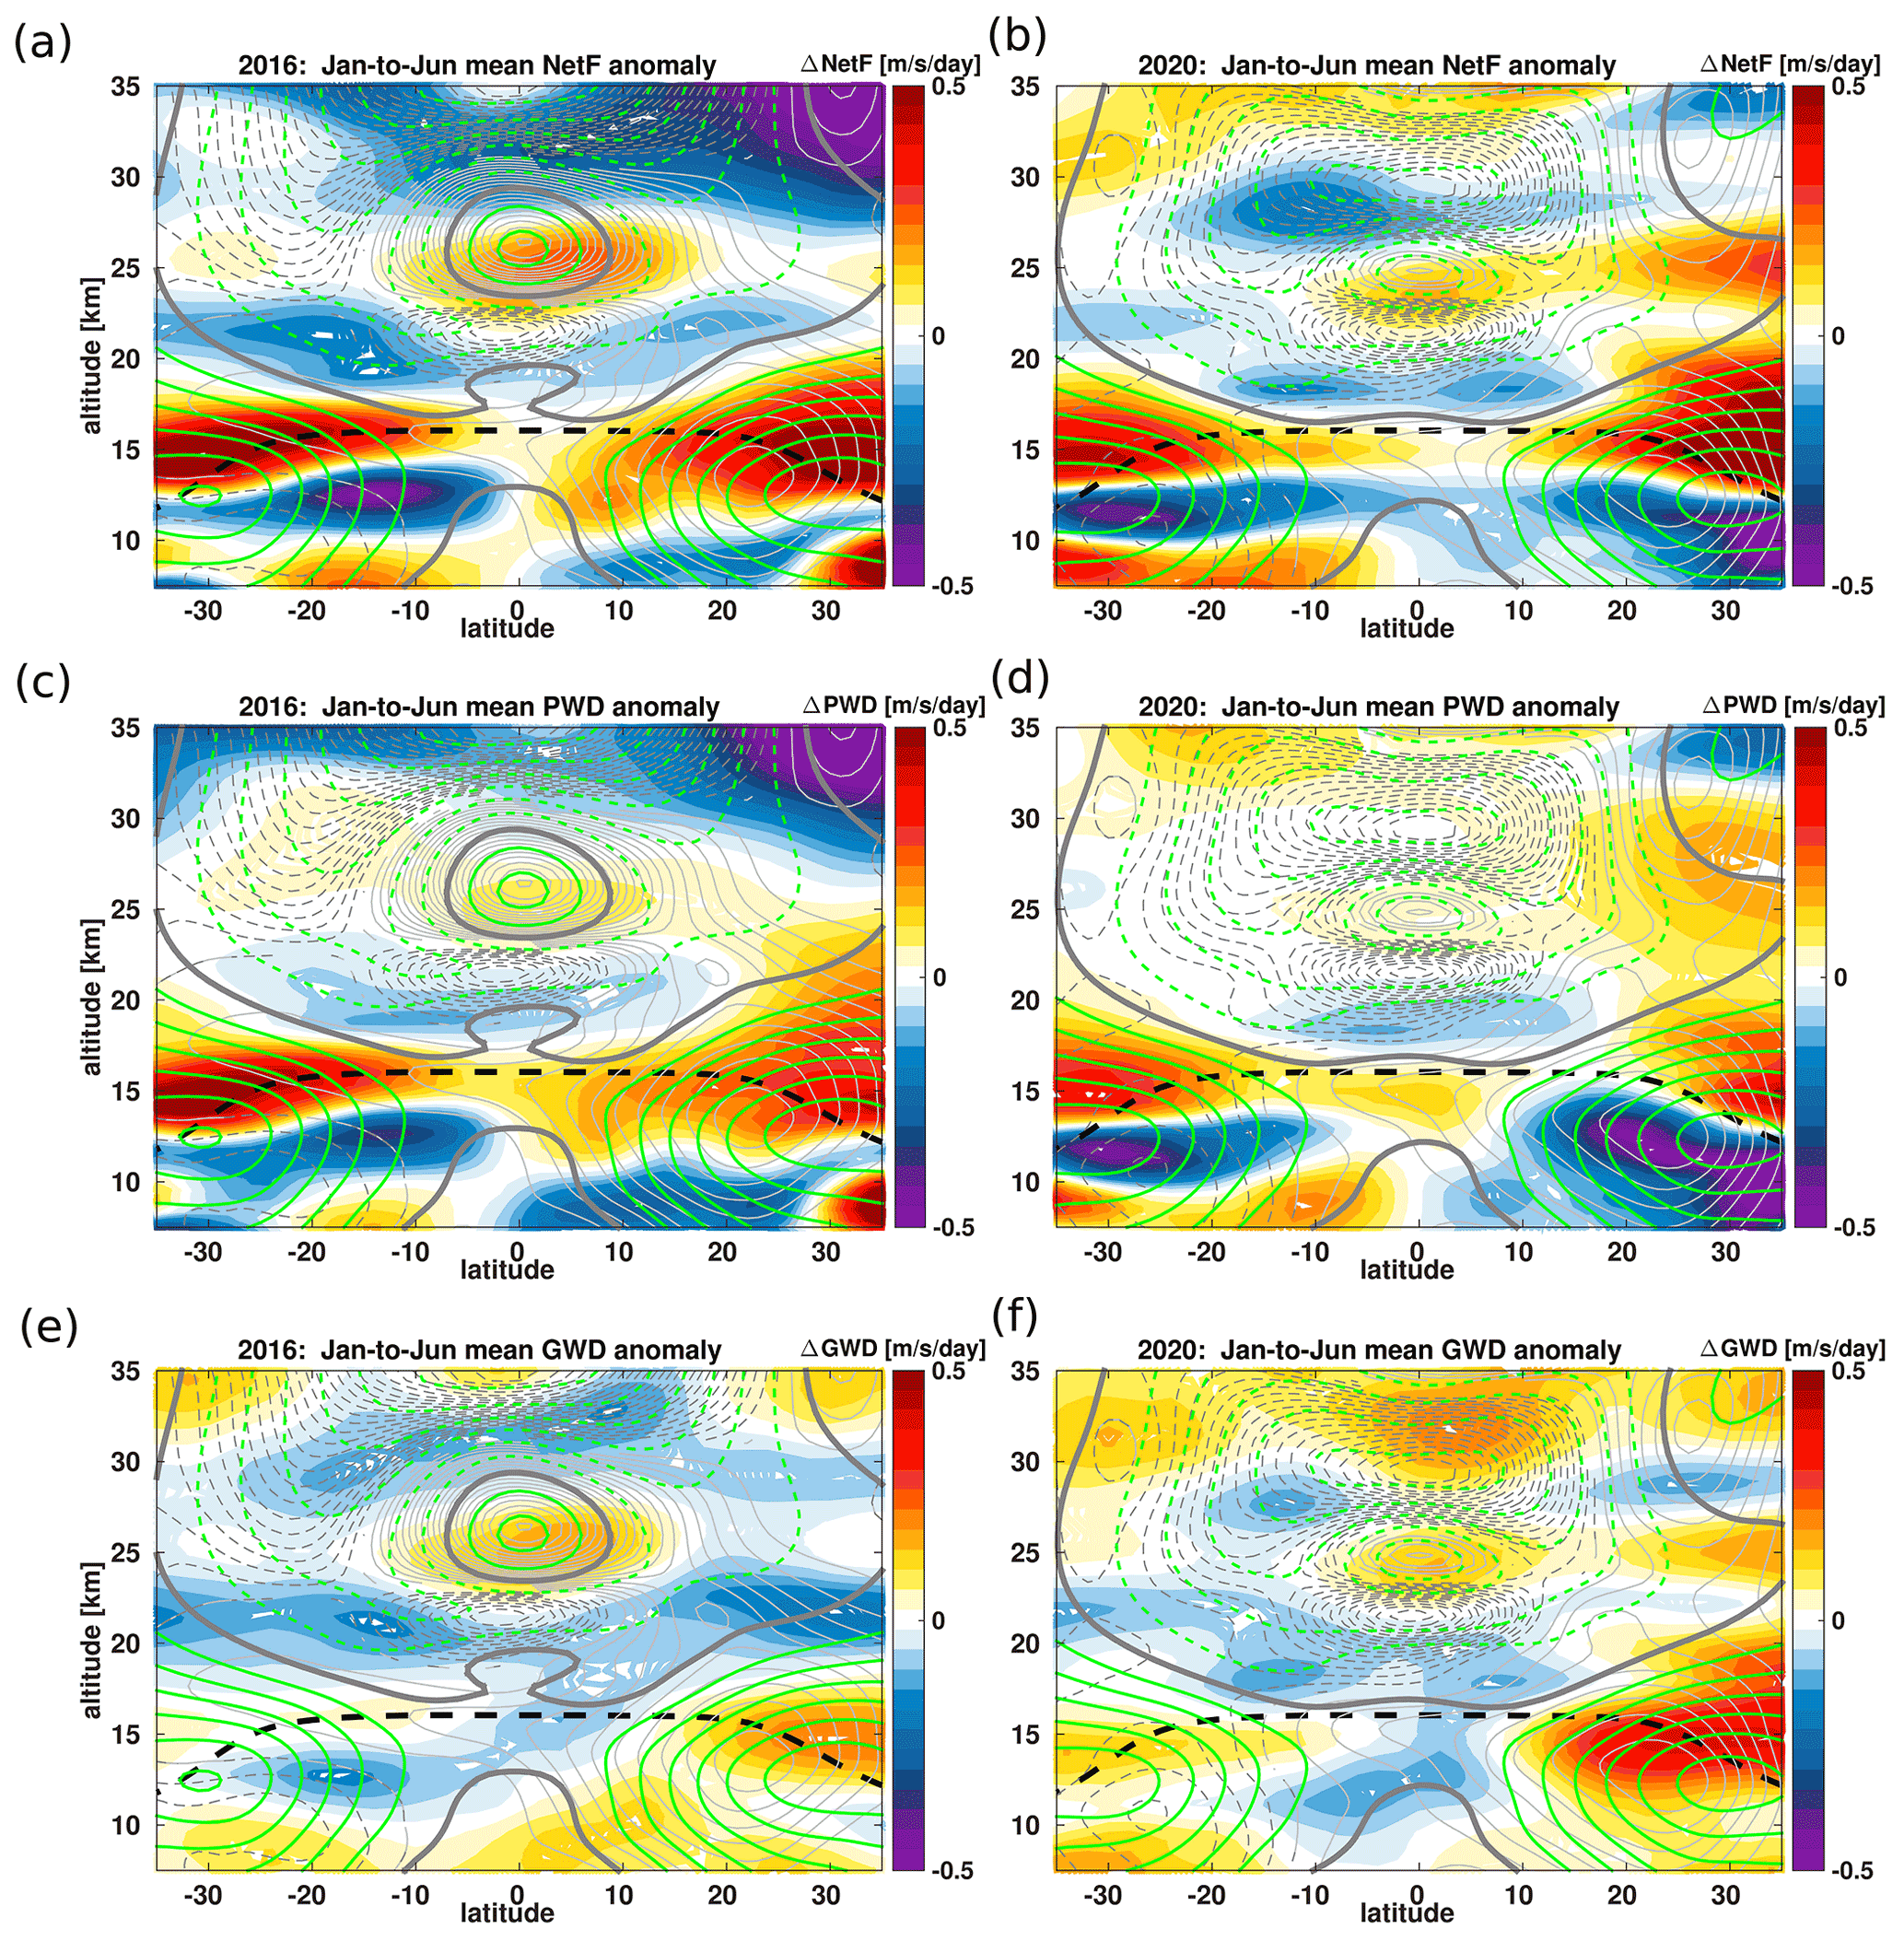
Figure 6January–June 2016 (a, c, e) and 2020 (b, d, f) deviations from the January–June 1979–2014 average of monthly mean, zonal mean net wave forcing (NetF) (a, b), planetary wave drag (PWD) (c, d), and gravity wave drag (GWD) (e, f) from the ERA5 reanalysis (filled contours) together with the January–June 2016 and 2020 zonal mean zonal wind (green contour lines) as a function of latitude and altitude. The black dashed horizontal line indicates the tropopause from the ERA5 reanalysis. The January–June 2016 and 2020 monthly mean, zonal mean wind anomaly component, U (m s−1), from the ERA5 reanalysis is overlaid as solid grey contours (westerly) and dashed grey contours (easterly).
To investigate the main causes of the BDC differences between the year 2016 and the year 2020 during the QBO disruption events, we calculate the planetary and gravity wave drag as well as the net wave forcing. We analyse the differences in terms of wave activities potentially induced by specific sea surface conditions, such as the unusually warm 2015–2016 El Niño and the 2019–2020 strong positive Indian Ocean Dipole, which impact tropical convective activities (Jia et al., 2014). For additional details about the wave decomposition, please see Diallo et al. (2021) and Ern et al. (2014).
The BDC and its inter-annual variability are driven by the planetary and gravity wave breaking in different stratospheric regions (Haynes et al., 1991; Rosenlof and Holton, 1993; Newman and Nash, 2000; Plumb, 2002; Shepherd, 2007). Therefore, any changes in wave drag will lead to circulation and composition changes. Figure 6a–f show the January–June zonal mean of the deseasonalized monthly mean net wave forcing (NetF = PWD + GWD − du dt), PWD, and GWD from the ERA5 reanalysis for years 2016 and 2020, respectively. Note that the net wave forcing is equal to the contribution of the Coriolis force plus meridional advection plus vertical advection to the momentum balance (Ern et al., 2021). Clearly, the net wave forcing anomalies as well as the planetary and gravity wave drag anomalies exhibit differences in strength and depth in the lower stratosphere between the 2016 and 2020 QBO disruption events. During the QBO disruption event in 2016, the net wave breaking is stronger and broader in the lower stratosphere between the tropopause and the altitude of about 23 km than during the QBO disruption in 2020 (Figs. 6a, b and S3a). In particular, the wave breaking near the equatorward upper flanks of the subtropical jet (e.g. the region 30–10∘ S/10–30∘ N and above the tropopause level), known as a major BDC forcing region, is weaker in 2020 than in 2016, and this region is narrower (e.g. more tropically confined) in 2020. These differences in net wave forcing are the main cause of a weaker advective BDC and its modulation by the QBO-induced secondary circulation in 2020 than in 2016, thereby contributing to the anomalous lower-stratospheric H2O and O3 differences in addition to the significant Australian wildfire effect on lower-stratospheric H2O mixing ratios.
In addition, we show the contribution of planetary (Figs. 6c, d, and S3b) and gravity (Figs. 6e, f and S3c) wave drag to better understand the role of each forcing in the circulation anomaly differences during both QBO disruption events. Besides the good agreement in the structure of planetary and gravity wave breaking, our analyses also show differences in wave drag between the 2016 and 2020 QBO disruption events. The planetary and gravity wave anomalies indicate stronger anomalies in wave dissipation in the lower stratosphere near the equatorward upper flanks of the subtropical jet between the tropopause and the altitude of about 23 km during the QBO disruption event in 2016 than during the QBO disruption event in 2020 (Figs. 6c–f and S3b, c in the Supplement). The anomalies in planetary wave dissipation associated with the QBO disruption event in 2016 are stronger and extend from the tropics toward the subtropical jet between the tropopause and the altitude of about 23 km, while for the QBO disruption event in 2020, these anomalies are smaller and are confined to the tropics. In addition to structural differences, the dissimilarities in the strength and depth of the anomalies are even larger in the gravity wave drag. During the QBO disruption event in 2016, gravity waves break in the entire lower stratosphere between the tropopause and the altitude of about 23 km, with a maximum occurring near the upper flank of the subtropical jet, a key region for strengthening the shallow branch of the BDC (Shepherd and McLandress, 2011; Diallo et al., 2019, 2021) (Fig. 6e, f). The differences in the strength and depth of planetary and gravity wave breaking are clearly the main cause of observed differences in the anomalous upwelling strength of the BDC between the year 2016 and the year 2020. This main cause is a combination of planetary wave dissipation in the tropics and particularly strong gravity wave breaking near the equatorward upper flanks of the subtropical jet during the QBO disruption event in 2016, as shown in previous studies (Kang et al., 2020; Kang and Chun, 2021; Osprey et al., 2016). In summary, the strong planetary waves and gravity wave forcing anomalies, which are likely related to ENSO and IOD, are responsible for differences in the anomalous circulation and its modulation by the QBO-induced secondary circulation and therefore the negative lower-stratospheric H2O and O3 anomalies. Regardless of the net wave forcing in 2020, the Australian wildfire led to weaker dehydration in the lower-stratospheric dehydration due to the aerosol-induced warmer stratosphere.
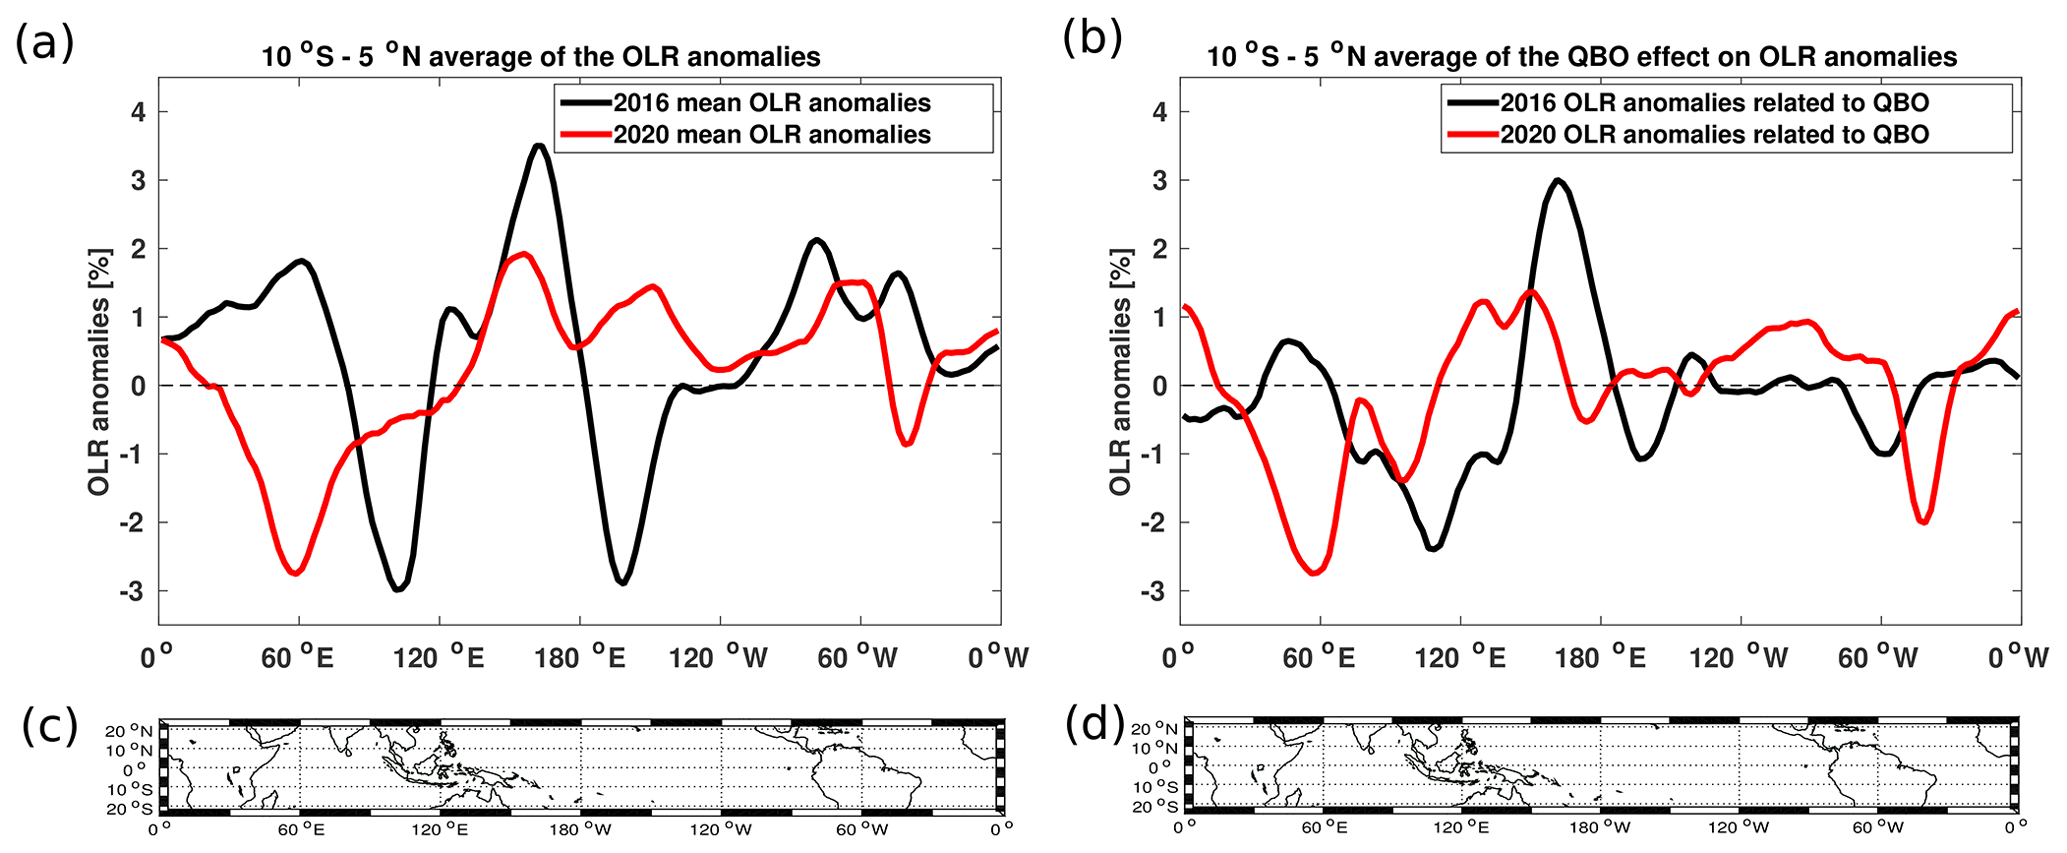
Figure 7Longitudinal variations of the monthly mean outgoing longwave radiation (OLR) anomalies (a) averaged between 20 and 20∘ S together with the 2016 and 2020 QBO effects (b) associated with the convective activity derived from the multiple regression fit. The lowermost panels (c, d) show the tropical region where the OLR time series are averaged.
Note that, during the QBO disruption events in 2016 and 2020, the surface conditions were different in terms of natural variability-induced convective activity. To trace back and link the potential source of convectively generated wave activities to regional differences, we finally analysed the monthly mean outgoing longwave radiation (OLR) (Figs. 7 and S4 in the Supplement). Clearly, there are regional differences in the occurrence of strong convective events between the QBO disruption events in 2016 and 2020. During the QBO disruption event in 2016, the tropical mean OLR anomalies reveal two active convective regions, namely the eastern Indian Ocean associated with the negative IOD in 2016 and the central Pacific Ocean associated with the El Niño in the year 2016. However, during the QBO disruption event in 2020, the tropical mean OLR anomalies show only one strong active convective region, namely the western Indian Ocean and eastern Africa associated with the strong IOD in the year 2020, as the weak La Niña is associated with weak tropical convective activities. Both QBO disruption effects related to OLR variations are linked to strong convective activity in the Indo-Pacific Ocean, thereby suggesting the important role that this region may play in strong wave activities. This additional information related to the strength of convective activities in the Indian Ocean is of great interest for better understanding and relating the origin of the QBO disruption events and their strength based on regional forcings. This regional forcing and interplay of different modes of climate variability will be presented in further studies.
Based on an established multiple regression method applied to Aura MLS observations, we found that both the QBO disruption events in 2016 and 2020 induced similar structural changes in the Brewer–Dobson circulation and respective distributions of the lower-stratospheric H2O and O3 anomalies. Both QBO disruption events induced negative anomalies in H2O and O3, a few months after the sudden shift from the QBO westerly to QBO easterly winds. During the boreal winter of 2015–2016 (September 2015–March 2016), the alignment of the strong El Niño and negative IOD events with the QBO westerlies strongly moistened the lower stratosphere between the tropopause and the altitude of 23 km (positive anomalies of more than 20 %). Analogously, the alignment of the weak La Niña and strong positive IOD events with the strong QBO westerlies and the impact of Australian wildfire smoke strongly moistened the lower stratosphere (positive anomalies of more than 15 %) during the boreal winter of 2019–2020 (September 2019–June 2020). The sudden shift from the QBO westerly to QBO easterly winds reversed the lower-stratospheric moistening, thereby leading to large negative H2O and O3 anomalies of up to about 20 % between 16 and 23 km by the end of summer 2016 and to small negative H2O anomalies of up to about 2 %–3 % and moderate negative O3 anomalies of up to about 10 % in 2020. These decreases in H2O and O3 mixing ratios are due to a strengthening of the tropical upwelling of the BDC, cooling tropical cold-point temperatures and their modulations by the QBO disruption events.
However, differences occur in the strength and depth of the QBO disruption-induced negative H2O and O3 anomalies in the lower stratosphere between 2016 and 2020. We found that the impact of the QBO disruption event on lower-stratospheric trace gases is weaker in 2020 than in 2016, up to about 18 % for H2O anomalies and 10 % for O3 anomalies between 16 km and 23 km, respectively. The differences in the strength and depth of the O3 anomalies and its modulation by the QBO disruption events are due to discrepancies in the anomalous tropical upwelling of the BDC, which was up to about 25 % larger in 2016 than in 2020. The analysis of the wave drag shows that the differences in planetary wave breaking in the tropical lower stratosphere between the tropopause and the altitude of about 23 km and the gravity wave breaking near the equatorward upper flanks of the subtropical jet (e.g. the region between 10 and 30∘ S/N and above the tropopause level) are the main reasons for the differences in the anomalous tropical upwelling of the BDC and secondary circulation between the year 2016 and the year 2020. The main differences in lower-stratospheric H2O anomalies between the year 2016 and the year 2020 are due to discrepancies in the tropical cold-point temperatures induced by the 2020 Australian wildfire smoke. Despite the anomalous planetary waves and gravity wave activities, which are likely related to ENSO and IOD, the 2020 Australian wildfire predominantly raised the cold-point temperatures, thereby leading to less dehydration of the lower stratosphere.
Finally, our results suggest that the interplay of QBO phases with a combination of ENSO and IOD events, and in particular also wildfires and volcanic eruptions, will be crucial for the control of the lower-stratospheric H2O and O3 budget in a changing future climate. In particular, increasing future warming will lead to trends in ENSO (Timmermann et al., 1999; Cai et al., 2014) and IOD (Ihara et al., 2008) as projected by climate models, and a related potential increase in wildfire frequency combined with a decreasing lower-stratospheric QBO amplitude (Kawatani and Hamilton, 2013) is expected in future climate projections. The interplay will change with strong El Niño/negative IOD and La Niña/strong positive IOD likely controlling the lower-stratospheric trace gas distributions and variability more strongly in a future changing climate. Clearly, both ENSO and IOD impact the tropopause height and tropical cold-point temperatures. Further analysis is needed using climate model sensitivity simulations to pinpoint the impact of these future changes in lower-stratospheric trace gases and the related radiative feedback.
MLS water vapour and ozone data were obtained from the Goddard Earth Sciences Data and Information Services Center at https://doi.org/10.5067/Aura/MLS/DATA2508 (Lambert et al., 2020) and https://doi.org/10.5067/Aura/MLS/DATA2516 (Schwartz et al., 2020), respectively. The aerosol optical depth data are available through Khaykin et al. (2020). The ERA5 reanalysis is available at https://apps.ecmwf.int/data-catalogues/era5/?class=ea, last access: 2 September 2022, through Hersbach et al. (2020).
The supplement related to this article is available online at: https://doi.org/10.5194/acp-22-14303-2022-supplement.
MAD designed the study, conducted research, performed the calculation and the complete analysis of the impact of the QBO disruptions, and drafted the first manuscript. ME calculated the wave decomposition. FP, MIH, ME, JUG, SK, and MR provided helpful discussions and comments. MAD edited the final draft, with contributions from all the co-authors for communication with the journal.
The contact author has declared that none of the authors has any competing interests.
Publisher’s note: Copernicus Publications remains neutral with regard to jurisdictional claims in published maps and institutional affiliations.
Mohamadou Diallo's research position is funded by the Deutsche Forschungsgemeinschaft (DFG), individual research grant number DI2618/1-1, and the Institute of Energy and Climate Research, Stratosphere (IEK-7), Forschungszentrum Jülich, for which this work has been carried out. Felix Ploeger is funded by the Helmholtz Association under grant number VH-NG-1128 (Helmholtz Young Investigators Group A-SPECi). Manfred Ern was supported by German Federal Ministry of Education and Research (Bundesministerium für Bildung und Forschung, BMBF) project QUBICC, grant number 01LG1905C, as part of the Role of the Middle Atmosphere in Climate II (ROMIC-II) programme of BMBF. We are grateful to the Earth System Modelling Project (ESM) for funding this work by providing computing time on the ESM partition of the JUWELS supercomputer at the Jülich Supercomputing Centre (JSC). Moreover, we particularly thank the European Centre for Medium-Range Weather Forecasts for providing the ERA5 and ERA-Interim reanalysis data. Finally, our thanks go to the editor and three anonymous reviewers. The article processing charges for this open-access publication were covered by a Research Centre of the Helmholtz Association.
This research has been supported by the Deutsche Forschungsgemeinschaft (grant no. DI2618/1-1).
The article processing charges for this open-access publication were covered by the Forschungszentrum Jülich.
This paper was edited by Suvarna Fadnavis and reviewed by three anonymous referees.
Abalos, M., Ploeger, F., Konopka, P., Randel, W. J., and Serrano, E.: Ozone seasonality above the tropical tropopause: reconciling the Eulerian and Lagrangian perspectives of transport processes, Atmos. Chem. Phys., 13, 10787–10794, https://doi.org/10.5194/acp-13-10787-2013, 2013. a, b
Andrews, D. G., Holton, J. R., and Leovy, C. B.: Middle Atmosphere Dynamics, vol. 40 of International Geophysics Series, Academic Press, San Diego, USA, 1987. a
Anstey, J. A., Banyard, T. P., Butchart, N., Coy, L., Newman, P. A., Osprey, S., and Wright, C. J.: Quasi-biennial oscillation disrupted by abnormal Southern Hemisphere stratosphere, Earth and Space Science Open Archive, https://doi.org/10.1002/essoar.10503358.1, 2020. a
Anstey, J. A., Banyard, T. P., Butchart, N., Coy, L., Newman, P. A., Osprey, S., and Wright, C. J.: Prospect of increased disruption to the QBO in a changing climate, Geophys. Res. Lett., 48, e2021GL093058, https://doi.org/10.1029/2021GL093058, 2021. a, b
Baldwin, M. P., Gray, L. J., Dunkerton, T. J., Hamilton, K., Haynes, P. H., Randel, W. J., Holton, J. R., Alexander, M. J., Hirota, I., Horinouchi, T., Jones, D. B. A., Kinnersley, J. S., Marquardt, C., Sato, K., and Takahashi, M.: The quasi-biennial oscillation, Rev. Geophys., 39, 179–229, https://doi.org/10.1029/1999RG000073, 2001. a
Barton, C. A. and McCormack, J. P.: Origin of the 2016 QBO Disruption and Its Relationship to Extreme El Niño Events, Geophys. Res. Lett., 44, 11150–11157, https://doi.org/10.1002/2017GL075576, 2017. a, b
Brewer, A.: Evidence for a world circulation provided by the measurements of helium and water vapour distribution in the stratosphere, Q. J. R. Meteorol. Soc., 75, 351–363, 1949. a
Brinkop, S., Dameris, M., Jöckel, P., Garny, H., Lossow, S., and Stiller, G.: The millennium water vapour drop in chemistry–climate model simulations, Atmos. Chem. Phys., 16, 8125–8140, https://doi.org/10.5194/acp-16-8125-2016, 2016. a, b
Butchart, N.: The Brewer-Dobson circulation, Rev. Geophys., 52, 157–184, https://doi.org/10.1002/2013RG000448, 2014. a, b
Butchart, N. and Scaife, A. A.: Removal of chlorofluorocarbons by increased mass exchange between the stratosphere and troposphere in a changing climate., Nature, 410, 799–802, https://doi.org/10.1038/35071047, 2001. a
Cai, W., Borlace, S., Lengaigne, M., van Rensch, P., Collins, M., Vecchi, G., Timmermann, A., Santoso, A., McPhaden, M. J., Wu, L., England, M. H., Wang, G., Guilyardi, E., and Jin, F.-F.: Increasing frequency of extreme El Niño events due to greenhouse warming, Nat. Clim. Change, 4, 111–116, https://doi.org/10.1038/nclimate2100, 2014. a
Christiansen, B., Yang, S., and Madsen, M. S.: Do strong warm ENSO events control the phase of the stratospheric QBO?, Geophys. Res. Lett., 43, 10489–10495, https://doi.org/10.1002/2016GL070751, 2016. a, b
Cicerone, R. J.: Changes in stratospheric ozone, Science, 237, 35–42, https://doi.org/10.1126/science.237.4810.35, 1987. a
Coy, L., Newman, P. A., Pawson, S., and Lait, L. R.: Dynamics of the Disrupted 2015/16 Quasi-Biennial Oscillation, J. Clim., 30, 5661–5674, https://doi.org/10.1175/JCLI-D-16-0663.1, 2017. a, b
DallaSanta, K., Orbe, C., Rind, D., Nazarenko, L., and Jonas, J.: Response of the Quasi-Biennial Oscillation to Historical Volcanic Eruptions, Geophys. Res. Lett., 48, e2021GL095412, https://doi.org/10.1029/2021GL095412, 2021. a, b
Damadeo, R. P., Zawodny, J. M., and Thomason, L. W.: Reevaluation of stratospheric ozone trends from SAGE II data using a simultaneous temporal and spatial analysis, Atmos. Chem. Phys., 14, 13455–13470, https://doi.org/10.5194/acp-14-13455-2014, 2014. a
Dessler, A. E., Schoeberl, M. R., Wang, T., Davis, S. M., and Rosenlof, K. H.: Stratospheric water vapor feedback, P. Natl. Acad. Sci. USA, 110, 18087–18091, https://doi.org/10.1073/pnas.1310344110, 2013. a
Dessler, A. E., Schoeberl, M. R., Wang, T., Davis, S. M., Rosenlof, K. H., and Vernier, J.-P.: Variations of stratospheric water vapor over the past three decades, J. Geophys. Res.-Atmos., 119, 12588–12598, https://doi.org/10.1002/2014JD021712, 2014. a
Diallo, M., Ploeger, F., Konopka, P., Birner, T., Müller, R., Riese, M., Garny, H., Legras, B., Ray, E., Berthet, G., and Jegou, F.: Significant Contributions of Volcanic Aerosols to Decadal Changes in the Stratospheric Circulation, Geophys. Res. Lett., 44, 10780–10791, https://doi.org/10.1002/2017GL074662, 2017. a, b
Diallo, M., Riese, M., Birner, T., Konopka, P., Müller, R., Hegglin, M. I., Santee, M. L., Baldwin, M., Legras, B., and Ploeger, F.: Response of stratospheric water vapor and ozone to the unusual timing of El Niño and the QBO disruption in 2015–2016, Atmos. Chem. Phys., 18, 13055–13073, https://doi.org/10.5194/acp-18-13055-2018, 2018. a, b, c, d, e, f, g, h, i, j, k
Diallo, M., Konopka, P., Santee, M. L., Müller, R., Tao, M., Walker, K. A., Legras, B., Riese, M., Ern, M., and Ploeger, F.: Structural changes in the shallow and transition branch of the Brewer–Dobson circulation induced by El Niño, Atmos. Chem. Phys., 19, 425–446, https://doi.org/10.5194/acp-19-425-2019, 2019. a, b
Diallo, M., Ern, M., and Ploeger, F.: The advective Brewer–Dobson circulation in the ERA5 reanalysis: climatology, variability, and trends, Atmos. Chem. Phys., 21, 7515–7544, https://doi.org/10.5194/acp-21-7515-2021, 2021. a, b, c, d
Dunkerton, T. J.: A Lagrangian mean theory of wave, mean-Flow interaction with applications to nonacceleration and its breakdown, Rev. Geophys., 18, 387–400, https://doi.org/10.1029/RG018i002p00387, 1980. a
Dunkerton, T. J.: The quasi-biennial oscillation of 2015–2016: Hiccup or death spiral?, Geophys. Res. Lett., 43, 10547–10552, https://doi.org/10.1002/2016GL070921, 2016. a, b
Ern, M., Ploeger, F., Preusse, P., Gille, J. C., Gray, L. J., Kalisch, S., Mlynczak, M. G., Russell, J. M., and Riese, M.: Interaction of gravity waves with the QBO: A satellite perspective, J. Geophys. Res.-Atmos., 119, 2329–2355, https://doi.org/10.1002/2013JD020731, 2014. a, b, c
Ern, M., Diallo, M., Preusse, P., Mlynczak, M. G., Schwartz, M. J., Wu, Q., and Riese, M.: The semiannual oscillation (SAO) in the tropical middle atmosphere and its gravity wave driving in reanalyses and satellite observations, Atmos. Chem. Phys., 21, 13763–13795, https://doi.org/10.5194/acp-21-13763-2021, 2021. a, b
Forster, P. M. and Shine, K. P.: Stratospheric water vapour changes as a possible contributor to observed stratospheric cooling, Geophys. Res. Lett., 26, 3309–3312, https://doi.org/10.1029/1999GL010487, 1999. a, b
Forster, P. M. and Shine, K. P.: Assessing the climate impact of trends in stratospheric water vapor, Geophys. Res. Lett., 29, 10-1–10-4, https://doi.org/10.1029/2001GL013909, 2002. a
Friston, K., Ashburner, J., Kiebel, S. J., Nichols, T. E., and Penny, W. D., eds.: Statistical Parametric Mapping: The Analysis of Functional Brain Images, Academic Press, http://store.elsevier.com/product.jsp?isbn=9780123725608 (last access: 27 October 2022), 2007. a
Fueglistaler, S., Dessler, A. E., Dunkerton, T. J., Folkins, I., Fu, Q., and Mote, P. W.: Tropical Tropopause Layer, Rev. Geophys., 47, G1004+, https://doi.org/10.1029/2008RG000267, 2009. a
Fujiwara, M., Suzuki, J., Gettelman, A., Hegglin, M. I., Akiyoshi, H., and Shibata, K.: Wave activity in the tropical tropopause layer in seven reanalysis and four chemistry climate model data sets, J. Geophys. Res.-Atmos., 117, https://doi.org/10.1029/2011JD016808, 2012. a
Garfinkel, C. I., Hurwitz, M. M., Oman, L. D., and Waugh, D. W.: Contrasting Effects of Central Pacific and Eastern Pacific El Niño on stratospheric water vapor, Geophys. Res. Lett., 40, 4115–4120, https://doi.org/10.1002/grl.50677, 2013. a
Geller, M. A., Zhou, X., and Zhang, M.: Simulations of the Interannual Variability of Stratospheric Water Vapor, J. Atmos. Sci., 59, 1076–1085, https://doi.org/10.1175/1520-0469(2002)059<1076:SOTIVO>2.0.CO;2, 2002. a
Gettelman, A., Hoor, P., Pan, L. L., Randel, W. J., Hegglin, M. I., and Birner, T.: The extratropical upper troposphere and lower stratosphere, Rev. Geophys., 49, RG3003, https://doi.org/10.1029/2011RG000355, 2011. a
Grimshaw, R.: Wave Action and Wave–Mean Flow Interaction, with Application to Stratified Shear Flows, Annual Rev. of Fluid Mech., 16, 11–44, https://doi.org/10.1146/annurev.fl.16.010184.000303, 1984. a
Hartmann, D. L., Holton, J. R., and Fu, Q.: The heat balance of the tropical tropopause, cirrus, and stratospheric dehydration, Geophys. Res. Lett., 28, 1969–1972, https://doi.org/10.1029/2000GL012833, 2001. a
Haynes, P. H. and Shuckburgh, E.: Effective diffusivity as a diagnostic of atmospheric transport 2. Troposphere and lower stratosphere, J. Geophys. Res., 105, 22795–22810, https://doi.org/10.1029/2000JD900092, 2000. a
Haynes, P. H., McIntyre, M. E., Shepherd, T. G., Marks, C. J., and Shine, K. P.: On the “Downward Control” of Extratropical Diabatic Circulations by Eddy-Induced Mean Zonal Forces, J. Atmos. Sci., 48, 651–678, https://doi.org/10.1175/1520-0469(1991)048<0651:OTCOED>2.0.CO;2, 1991. a
Hegglin, M. I., Tegtmeier, S., Anderson, J., Froidevaux, L., Fuller, R., Funke, B., Jones, A., Lingenfelser, G., Lumpe, J., Pendlebury, D., Remsberg, E., Rozanov, A., Toohey, M., Urban, J., Clarmann, T., Walker, K. A., Wang, R., and Weigel, K.: SPARC Data Initiative: Comparison of water vapor climatologies from international satellite limb sounders, J. Geophys. Res.-Atmos., 118, 11824–11846, https://doi.org/10.1002/jgrd.50752, 2013. a
Hegglin, M. I., Tegtmeier, S., Anderson, J., Bourassa, A. E., Brohede, S., Degenstein, D., Froidevaux, L., Funke, B., Gille, J., Kasai, Y., Kyrölä, E. T., Lumpe, J., Murtagh, D., Neu, J. L., Pérot, K., Remsberg, E. E., Rozanov, A., Toohey, M., Urban, J., von Clarmann, T., Walker, K. A., Wang, H.-J., Arosio, C., Damadeo, R., Fuller, R. A., Lingenfelser, G., McLinden, C., Pendlebury, D., Roth, C., Ryan, N. J., Sioris, C., Smith, L., and Weigel, K.: Overview and update of the SPARC Data Initiative: comparison of stratospheric composition measurements from satellite limb sounders, Earth Syst. Sci. Data, 13, 1855–1903, https://doi.org/10.5194/essd-13-1855-2021, 2021. a
Hersbach, H., Bell, B., Berrisford, P., Hirahara, S., Horányi, A., Muñoz-Sabater, J., Nicolas, J., Peubey, C., Radu, R., Schepers, D., Simmons, A., Soci, C., Abdalla, S., Abellan, X., Balsamo, G., Bechtold, P., Biavati, G., Bidlot, J., Bonavita, M., De Chiara, G., Dahlgren, P., Dee, D., Diamantakis, M., Dragani, R., Flemming, J., Forbes, R., Fuentes, M., Geer, A., Haimberger, L., Healy, S., Hogan, R. J., Hólm, E., Janisková, M., Keeley, S., Laloyaux, P., Lopez, P., Lupu, C., Radnoti, G., de Rosnay, P., Rozum, I., Vamborg, F., Villaume, S., and Thépaut, J.-N.: The ERA5 Global Reanalysis, Q. J. R. Meteorol. Soc., 146, 1999–2049, https://doi.org/10.1002/qj.3803, 2020. a, b
Hitchcock, P., Haynes, P. H., Randel, W. J., and Birner, T.: The Emergence of Shallow Easterly Jets within QBO Westerlies, J. Atmos. Sci., 75, 21–40, https://doi.org/10.1175/JAS-D-17-0108.1, 2018. a
Holton, J. R.: Equatorial Wave-Mean Flow Interaction: A Numerical Study of the Role of Latitudinal Shear, J. Atmos. Sci., 36, 1030–1040, https://doi.org/10.1175/1520-0469(1979)036<1030:EWMFIA>2.0.CO;2, 1979. a
Holton, J. R. and Gettelman, A.: Horizontal transport and the dehydration of the stratosphere, Geophys. Res. Lett., 28, 2799–2802, https://doi.org/10.1029/2001GL013148, 2001. a, b, c
Holton, J. R. and Tan, H.-C.: The Influence of the Equatorial Quasi-Biennial Oscillation on the Global Circulation at 50 mb, J. Atmos. Sci., 37, 2200–2208, https://doi.org/10.1175/1520-0469(1980)037<2200:TIOTEQ>2.0.CO;2, 1980. a
Hu, D., Tian, W., Guan, Z., Guo, Y., and Dhomse, S.: Longitudinal Asymmetric Trends of Tropical Cold-Point Tropopause Temperature and Their Link to Strengthened Walker Circulation, J. Clim., 29, 7755–7771, https://doi.org/10.1175/JCLI-D-15-0851.1, 2016. a, b
Iglesias-Suarez, F., Wild, O., Kinnison, D. E., Garcia, R. R., Marsh, D. R., Lamarque, J.-F., Ryan, E. M., Davis, S. M., Eichinger, R., Saiz-Lopez, A., and Young, P. J.: Tropical Stratospheric Circulation and Ozone Coupled to Pacific Multi-Decadal Variability, Geophys. Res. Lett., 48, e2020GL092162, https://doi.org/10.1029/2020GL092162, 2021. a
Ihara, C., Kushnir, Y., and Cane, M. A.: Warming Trend of the Indian Ocean SST and Indian Ocean Dipole from 1880 to 2004, J. Clim., 21, 2035–2046, https://doi.org/10.1175/2007JCLI1945.1, 2008. a
Jensen, E. J., Toon, O. B., Pfister, L., and Selkirk, H. B.: Dehydration of the upper troposphere and lower stratosphere by subvisible cirrus clouds near the tropical tropopause, Geophys. Res. Lett., 23, 825–828, https://doi.org/10.1029/96GL00722, 1996. a
Jia, J. Y., Preusse, P., Ern, M., Chun, H.-Y., Gille, J. C., Eckermann, S. D., and Riese, M.: Sea surface temperature as a proxy for convective gravity wave excitation: a study based on global gravity wave observations in the middle atmosphere, Ann. Geophys., 32, 1373–1394, https://doi.org/10.5194/angeo-32-1373-2014, 2014. a
Kang, M.-J. and Chun, H.-Y.: Contributions of equatorial waves and small-scale convective gravity waves to the 2019/20 quasi-biennial oscillation (QBO) disruption, Atmos. Chem. Phys., 21, 9839–9857, https://doi.org/10.5194/acp-21-9839-2021, 2021. a, b, c, d
Kang, M.-J., Chun, H.-Y., and Garcia, R. R.: Role of equatorial waves and convective gravity waves in the 2015/16 quasi-biennial oscillation disruption, Atmos. Chem. Phys., 20, 14669–14693, https://doi.org/10.5194/acp-20-14669-2020, 2020. a, b, c, d
Kawatani, Y. and Hamilton, K.: Weakened stratospheric quasibiennial oscillation driven by increased tropical mean upwelling, Nature, 497, 478–481, https://doi.org/10.1038/nature12140, 2013. a, b
Kawatani, Y., Hamilton, K., and Watanabe, S.: The Quasi-Biennial Oscillation in a Double CO2 Climate, J. Atmos. Sci., 68, 265–283, https://doi.org/10.1175/2010JAS3623.1, 2011. a
Kawatani, Y., Hamilton, K., Miyazaki, K., Fujiwara, M., and Anstey, J. A.: Representation of the tropical stratospheric zonal wind in global atmospheric reanalyses, Atmos. Chem. Phys., 16, 6681–6699, https://doi.org/10.5194/acp-16-6681-2016, 2016. a
Khaykin, S., Legras, B., and Bucci, S., Sellitto, P., Isaksen, L., Tencé, F., Bekki, S., Bourassa, A., Rieger, L., Zawada, D., and Jumelet, J.: The 2019/20 Australian wildfires generated a persistent smoket charged vortex rising up to 35 km altitude, Commun. Earth Environ., 1, 22, https://doi.org/10.1038/s43247-020-00022-5, 2020. a, b, c, d, e
Kim, J. and Son, S.-W.: Tropical Cold-Point Tropopause: Climatology, Seasonal Cycle, and Intraseasonal Variability Derived from COSMIC GPS Radio Occultation Measurements, J. Clim., 25, 5343–5360, https://doi.org/10.1175/JCLI-D-11-00554.1, 2012. a
Kim, Y.-H. and Chun, H.-Y.: Momentum forcing of the quasi-biennial oscillation by equatorial waves in recent reanalyses, Atmos. Chem. Phys., 15, 6577–6587, https://doi.org/10.5194/acp-15-6577-2015, 2015. a, b
Kroll, C. A., Dacie, S., Azoulay, A., Schmidt, H., and Timmreck, C.: The impact of volcanic eruptions of different magnitude on stratospheric water vapor in the tropics, Atmos. Chem. Phys., 21, 6565–6591, https://doi.org/10.5194/acp-21-6565-2021, 2021. a, b
Langematz, U.: Stratospheric ozone: down and up through the anthropocene, ChemTexts, 5, 8, https://doi.org/10.1007/s40828-019-0082-7, 2019. a
Lambert, A., Read, W. and Livesey, N.: MLS/Aura Level 2 Water Vapor (H2O) Mixing Ratio V005, Greenbelt, MD, USA, Goddard Earth Sciences Data and Information Services Center (GES DISC) [data set], https://doi.org/10.5067/Aura/MLS/DATA2508, 2020. a
Liess, S. and Geller, M. A.: On the relationship between QBO and distribution of tropical deep convection, J. Geophys. Res.-Atmos., 117, D03108, https://doi.org/10.1029/2011JD016317, 2012. a
Lin, P. and Fu, Q.: Changes in various branches of the Brewer–Dobson circulation from an ensemble of chemistry climate models, J. Geophys. Res.-Atmos., 118, 73–84, https://doi.org/10.1029/2012JD018813, 2013. a
Lin, P., Held, I., and Ming, Y.: The Early Development of the 2015/16 Quasi-Biennial Oscillation Disruption, J. Atmos.-Sci., 76, 821–836, https://doi.org/10.1175/JAS-D-18-0292.1, 2019. a
Lindzen, R. S.: Equatorial Planetary Waves in Shear. Part I, J. Atmos. Sci., 28, 609–622, https://doi.org/10.1175/1520-0469(1971)028<0609:EPWISP>2.0.CO;2, 1971. a
Livesey, N. J., Read, W. G., Wagner, P. A., Froidevaux, L., Lambert, A., Manney, G. L., Millán Valle, L. F., Pumphrey, H. C., Santee, M. L., Schwartz, M. J., Wang, S., Fuller, R. A., Jarnot, R. F., Knosp, B. W., and Martinez, E.: Aura Microwave Limb Sounder (MLS) Version 4.2x Level 2 data quality and description document, Tech. Rep. JPL D-33509 Rev. C, 1–169, https://mls.jpl.nasa.gov/data/v4-2_data_quality_document.pdf (last access: 4 November 2022), 2017. a, b
Match, A. and Fueglistaler, S.: Anomalous Dynamics of QBO Disruptions Explained by 1D Theory with External Triggering, J. Atmos. Sci., 78, 373–383, https://doi.org/10.1175/JAS-D-20-0172.1, 2021. a, b, c
Mote, P. W., Rosenlof, K. H., M. Mclntyre, M. E., Carr, E. S., Gille, J. C., Holton, J. R., Kinnersley, J. S., Pumphrey, H. C., Russell III, J. M., and Waters, J. W.: An atmospheric tape recorder: The imprint of tropical tropopause temperatures on stratospheric water vapor, J. Geophys. Res., 101, 3989–4006, 1996. a
Newman, P. A. and Nash, E. R.: Quantifying the wave driving of the stratosphere, J. Geophys. Res.-Atmos., 105, 12485–12497, https://doi.org/10.1029/1999JD901191, 2000. a
Newman, P. A., Coy, L., Pawson, S., and Lait, L. R.: The anomalous change in the QBO in 2015–2016, Geophys. Res. Lett., 43, 8791–8797, https://doi.org/10.1002/2016GL070373, 2016. a, b
Niwano, M., Yamazaki, K., and Shiotani, M.: Seasonal and QBO variations of ascent rate in the tropical lower stratosphere as inferred from UARS HALOE trace gas data, J. Geophys. Res., 108, 4794, https://doi.org/10.1029/2003JD003871, 2003. a
Nowack, P., Abraham, N., Maycock, A., Braesicke, P., Gregory, J., Joshi, M., Osprey, A., and Pyle, J.: A large ozone-circulation feedback and its implications for global warming assessments, Nat. Clim. Change, 5, 41–45, https://doi.org/10.1038/NCLIMATE2451, 2015. a
Osprey, S. M., Butchart, N., Knight, J. R., Scaife, A. A., Hamilton, K., Anstey, J. A., Schenzinger, V., and Zhang, C.: An unexpected disruption of the atmospheric quasi-biennial oscillation, Science, 353, 1424–1427, https://doi.org/10.1126/science.aah4156, 2016. a, b, c, d
Peterson, D. A., Fromm, M. D., McRae, R. H. D., Campbell, J. R., Hyer, Edward J. Taha, G., Camacho, C. P., Kablick, G. P., Schmidt, C. C., and DeLand, M. T.: Australia’s Black Summer pyrocumulonimbus super outbreak reveals potential for increasingly extreme stratospheric smoke events, npj Clima. Atmos. Sci., 4, 2397–3722, https://doi.org/10.1038/s41612-021-00192-9, 2021. a, b, c, d
Plumb, R. A.: The Interaction of Two Internal Waves with the Mean Flow: Implications for the Theory of the Quasi-Biennial Oscillation, J. Atmos. Sci., 34, 1847–1858, https://doi.org/10.1175/1520-0469(1977)034<1847:TIOTIW>2.0.CO;2, 1977. a
Plumb, R. A.: Stratospheric transport, J. Meteor. Soc. Jpn., 80, 793–809, 2002. a
Plumb, R. A. and Bell, R. C.: A model of the quasi-biennial oscillation on an equatorial beta-plane, Q. J. Roy. Meteorol. Soc., 108, 335–352, https://doi.org/10.1002/qj.49710845604, 1982. a, b, c
Randel, W. and Park, M.: Diagnosing Observed Stratospheric Water Vapor Relationships to the Cold Point Tropical Tropopause, J. Geophys. Res.-Atmos., 124, 7018–7033, https://doi.org/10.1029/2019JD030648, 2019. a, b
Randel, W. J. and Thompson, A. M.: Interannual variability and trends in tropical ozone derived from SAGE II satellite data and SHADOZ ozonesondes, J. Geophys. Res.-Atmos., 116, D07303, https://doi.org/10.1029/2010JD015195, 2011. a
Randel, W. J., Wu, F., Vömel, H., Nedoluha, G. E., and Forster, P.: Decreases in stratospheric water vapor after 2001: Links to changes in the tropical tropopause and the Brewer-Dobson circulation, J. Geophys. Res., 111, 12312, https://doi.org/10.1029/2005JD006744, 2006. a
Randel, W. J., Park, M., Wu, F., and Livesey, N.: A Large Annual Cycle in Ozone above the Tropical Tropopause Linked to the Brewer Dobson Circulation, J. Atmos. Sci., 64, 4479–4488, https://doi.org/10.1175/2007JAS2409.1, 2007. a
Ray, E. A., Portmann, R. W., Yu, P., Daniel, J., Montzka, S. A., Dutton, G. S., Hall, B. D., Moore, F. L., and Rosenlof, K. H.: The influence of the stratospheric Quasi-Biennial Oscillation on trace gas levels at the Earth’s surface, Nat. Geosci., 13, 1752–0908, https://doi.org/10.1038/s41561-019-0507-3, 2020. a
Renaud, A., Nadeau, L.-P., and Venaille, A.: Periodicity Disruption of a Model Quasibiennial Oscillation of Equatorial Winds, Phys. Rev. Lett., 122, 214504, https://doi.org/10.1103/PhysRevLett.122.214504, 2019. a
Riese, M., Ploeger, F., Rap, A., Vogel, B., Konopka, P., Dameris, M., and Forster, P.: Impact of uncertainties in atmospheric mixing on simulated UTLS composition and related radiative effects, J. Geophys. Res., 117, D16305, https://doi.org/10.1029/2012JD017751, 2012. a, b
Rosenlof, K. and Holton, J.: Estimates of the stratospheric residual circulation using the downward control principle, J. Geophys. Res., 98, 10465–10479, 1993. a
Saji, N., Goswami, B., Vinayachandran, P., and Yamagata, T.: A dipole mode in the tropical Indian Ocean, Nature, 401, 360—363, https://doi.org/10.1038/43854, 1999. a
Santee, M. L., Manney, G. L., Livesey, N. J., Schwartz, M. J., Neu, J. L., and Read, W. G.: A comprehensive overview of the climatological composition of the Asian summer monsoon anticyclone based on 10 years of Aura Microwave Limb Sounder measurements, J. Geophys. Res.-Atmos., 122, 5491–5514, https://doi.org/10.1002/2016JD026408, 2017. a
Saravanan, R.: A Multiwave Model of the Quasi-biennial Oscillation, J. Atmos. Sci., 47, 2465–2474, https://doi.org/10.1175/1520-0469(1990)047<2465:AMMOTQ>2.0.CO;2, 1990. a
Schirber, S.: Influence of ENSO on the QBO: Results from an ensemble of idealized simulations, J. Geophys. Res.-Atmos., 120, 1109–1122, https://doi.org/10.1002/2014JD022460, 2015. a, b
Schoeberl, M. R. and Dessler, A. E.: Dehydration of the stratosphere, Atmos. Chem. Phys., 11, 8433–8446, https://doi.org/10.5194/acp-11-8433-2011, 2011. a
Schwartz, M. J., Read, W. G., Santee, M. L., Livesey, N. J., Froidevaux, L., Lambert, A., and Manney, G. L.: Convectively injected water vapor in the North American summer lowermost stratosphere, Geophys. Res. Lett., 40, 2316–2321, https://doi.org/10.1002/grl.50421, 2013. a
Schwartz, M., Froidevaux, L., Livesey, N., and Read, W.: MLS/Aura Level 2 Ozone (O3) Mixing Ratio V005, Greenbelt, MD, USA, Goddard Earth Sciences Data and Information Services Center (GES DISC) [data set], https://doi.org/10.5067/Aura/MLS/DATA2516, 2020. a
Shepherd, T. G.: Transport in the Middle Atmosphere, J. Meteorol. Soc. Jpn. Ser. II, 85B, 165–191, https://doi.org/10.2151/jmsj.85B.165, 2007. a
Shepherd, T. G. and McLandress, C.: A Robust Mechanism for Strengthening of the Brewer–Dobson Circulation in Response to Climate Change: Critical-Layer Control of Subtropical Wave Breaking, J. Atmos. Sci., 68, 784–797, https://doi.org/10.1175/2010JAS3608.1, 2011. a
Smith, J. W., Haynes, P. H., Maycock, A. C., Butchart, N., and Bushell, A. C.: Sensitivity of stratospheric water vapour to variability in tropical tropopause temperatures and large-scale transport, Atmos. Chem. Phys., 21, 2469–2489, https://doi.org/10.5194/acp-21-2469-2021, 2021. a
Solomon, S., Rosenlof, K. H., Portmann, R. W., Daniel, J. S. Davis, S. M., Sanford, T., and Plattner, G.-K.: Contributions of Stratospheric Water Vapor to Decadal Changes in the Rate of Global Warming, Science, 327, 1219–1223, https://doi.org/10.1126/science.1182488, 2010. a, b
Son, S.-W., Lim, Y., Yoo, C., Hendon, H. H., and Kim, J.: Stratospheric Control of the Madden–Julian Oscillation, J. Climate, 30, 1909–1922, https://doi.org/10.1175/JCLI-D-16-0620.1, 2017. a
Stolarski, R. S., Waugh, D. W., Wang, L., Oman, L. D., Douglass, A. R., and Newman, P. A.: Seasonal variation of ozone in the tropical lower stratosphere: Southern tropics are different from northern tropics, J. Geophys. Res.-Atmos., 119, 6196–6206, https://doi.org/10.1002/2013JD021294, 2014. a, b
Tao, M., Konopka, P., Ploeger, F., Yan, X., Wright, J. S., Diallo, M., Fueglistaler, S., and Riese, M.: Multitimescale variations in modeled stratospheric water vapor derived from three modern reanalysis products, Atmos. Chem. Phys., 19, 6509–6534, https://doi.org/10.5194/acp-19-6509-2019, 2019. a, b
Thomason, L. W., Ernest, N., Millán, L., Rieger, L., Bourassa, A., Vernier, J.-P., Manney, G., Luo, B., Arfeuille, F., and Peter, T.: A global space-based stratospheric aerosol climatology: 1979–2016, Earth Syst. Sci. Data, 10, 469–492, https://doi.org/10.5194/essd-10-469-2018, 2018. a
Tian, E. W., Su, H., Tian, B., and Jiang, J. H.: Interannual variations of water vapor in the tropical upper troposphere and the lower and middle stratosphere and their connections to ENSO and QBO, Atmos. Chem. Phys., 19, 9913–9926, https://doi.org/10.5194/acp-19-9913-2019, 2019. a
Timmermann, A., Oberhuber, J., Bacher, A., Esch, M., Latif, M., and Roeckner, E.: El Niño, La Nina, and the Southern Oscillation, Nature, 398, 904–905, https://doi.org/10.1038/19505, 1999. a
Tweedy, O. V., Kramarova, N. A., Strahan, S. E., Newman, P. A., Coy, L., Randel, W. J., Park, M., Waugh, D. W., and Frith, S. M.: Response of trace gases to the disrupted 2015–2016 quasi-biennial oscillation, Atmos. Chem. Phys., 17, 6813–6823, https://doi.org/10.5194/acp-17-6813-2017, 2017. a, b
von Storch, H. and Zwiers, F. W.: Statistical analysis in climate research, Cambridge Unv. Press, https://doi.org/10.1017/CBO9780511612336, 1999. a
Watanabe, S., Hamilton, K., Osprey, S., Kawatani, Y., and Nishimoto, E.: First Successful Hindcasts of the 2016 Disruption of the Stratospheric Quasi-biennial Oscillation, Geophys. Res. Lett., 45, 1602–1610, https://doi.org/10.1002/2017GL076406, 2018. a
Weber, M., Dikty, S., Burrows, J. P., Garny, H., Dameris, M., Kubin, A., Abalichin, J., and Langematz, U.: The Brewer-Dobson circulation and total ozone from seasonal to decadal time scales, Atmos. Chem. Phys., 11, 11221–11235, https://doi.org/10.5194/acp-11-11221-2011, 2011. a
WMO: Scientific Assessment of Ozone Depletion: 2018, Global ozone research and monitoring project – report no. 58, WMO (World Meteorological Organization), Geneva, 2018. a, b
Wolter, K. and Timlin, M. S.: El Nino/Southern Oscillation behaviour since 1871 as diagnosed in an extended multivariate ENSO index (MEI.ext), Int. J. Climatol., 31, 1074–1087, https://doi.org/10.1002/joc.2336, 2011. a
Yu, P., Davis, S. M., Toon, O. B., Portmann, R. W., Bardeen, C. G., Barnes, J. E., Telg, H., Maloney, C., and Rosenlof, K. H.: Persistent Stratospheric Warming Due to 2019-2020 Australian Wildfire Smoke, Geophys. Res. Lett., 48, e2021GL092609, https://doi.org/10.1029/2021GL092609, 2021. a, b, c, d
- Abstract
- Introduction
- Data and methodology
- Characterization of the 2016 and 2020 anomalous circulations
- Driver detection and attribution of the anomalous circulations
- Summary and conclusions
- Data availability
- Author contributions
- Competing interests
- Disclaimer
- Acknowledgements
- Financial support
- Review statement
- References
- Supplement