the Creative Commons Attribution 4.0 License.
the Creative Commons Attribution 4.0 License.
 | 08 Nov 2022
A meteorological overview of the ORACLES (ObseRvations of Aerosols above CLouds and their intEractionS) campaign over the southeastern Atlantic during 2016–2018: Part 2 – Daily and synoptic characteristics
Ju-Mee Ryoo
Leonhard Pfister
Rei Ueyama
Paquita Zuidema
Robert Wood
Ian Chang
Jens Redemann
Part 1 (Ryoo et al., 2021) provided a climatological overview of the ObsErvation of Aerosols above CLouds and their intEractionS (ORACLES) period and assessed the representativeness of the deployment years. In part 2, more detailed meteorological analyses support the interpretation of the airborne measurements for aerosol transport and its interaction with low clouds over the southeastern (SE) Atlantic Ocean during the September 2016, August 2017, and October 2018 deployments at a daily and synoptic scale.
The key meteorological characteristics during the September 2016 deployment are (1) the southern African easterly jet (AEJ-S), centered at around 600 hPa (∼4 km), which strengthens throughout the month in concert with a warming continental heat low, with the strongest winds occurring around 23 September. These advect both aerosol and moisture in the free troposphere. (2) Mid-tropospheric black carbon (BC) is entrained at times into the boundary layer, and (3) convection over land is dry south of about 10∘ S and moist north of 10∘ S. The daily mean low-cloud fraction (low CF) is well correlated with the daily mean high low tropospheric stability (LTS, r=0.44–0.73 over the flight domain; 0–10∘ E, 5–25∘ S) and moderately correlated with the daily mean boundary layer height (BLH, r=0.37–0.52), defined as the altitude of the maximum vertical gradient of moisture. For the August 2017 deployment, the primary meteorological characteristics are that (1) the AEJ-S is at a lower altitude (∼3 km; ∼700 hPa) and further north (5–7∘ S) than in September 2016 and only becomes established by 20 August, with a separate easterly jet present aloft above 500 hPa (∼5.5 km) before that, (2) the mid-tropospheric BC–RH coupling strengthens after the AEJ-S develops, at around 3 km, (3) the daily mean low CF is less closely correlated with the daily mean LTS (r=0.16–0.57) and BLH (r=0.11–0.25) than in September 2016, and (4) dry convection reaches 700 hPa over the Namibian–Kalahari dryland (∼15–25∘ S, ∼18–24∘ E), generating the moist plume subsequently advected over the southeastern Atlantic by the AEJ-S. For the October 2018 deployment, the key meteorological characteristics are that (1) the AEJ-S develops around 600 hPa, driven by the Kalahari heat low (∼10–25∘ S, ∼12–24∘ E), but it diminishes over time as moist continental convection moves southward, (2) the offshore advection of mid-tropospheric BC (∼4 km, 600 hPa) and water vapor are strongly modulated by the AEJ-S around 8–10∘ S in early October, but this decreases as mid-latitude frontal systems develop and the AEJ-S weakens around mid-to-late October, (3) the AEJ-S–low-level jet (LLJ) over the coastal Namibian region relationship is the strongest among all deployment months, and the daily mean low CF is largely reduced by the strong daily mean LLJ, especially to the cloud deck's south, and (4) the relationship of the daily mean low CF with the daily mean BLH and LTS are insignificant compared to the other 2 deployment months, partially due to the variability introduced by the passage of the mid-latitude disturbance.
- Article
(27539 KB) - Full-text XML
- Companion paper
-
Supplement
(4099 KB) - BibTeX
- EndNote


Smoke aerosols due to biomass burning (BB) on the African continent play a large role in the Earth's climate by both directly affecting the radiation field and through aerosol interactions with clouds. The smoke is often transported to the southeastern (SE) Atlantic off the west coast of southern Africa, affecting the marine stratocumulus cloud decks radiatively and microphysically. This smoke plume is often observed to be transported along with moisture from the continent by the mid-tropospheric southern easterly wind (AEJ-S; Adebiyi and Zuidema, 2016; Deaconu et al., 2019; Pistone et al., 2021). Typically, the ocean is the major moisture source region, but this moisture remains in the boundary layer because the strong inversion cap prevents upper movement. Over the southeastern Atlantic, free tropospheric moisture can be laterally transported from the continent, although previous studies do not definitely establish whether the moisture source stems from dry or moist convection. The free troposphere would otherwise be very dry over the ocean over the southeastern Atlantic because of the large-scale subsidence. For example, the corresponding free troposphere over the SE Pacific, where the Andes mountains prevent the westward transport of moisture from the Amazon, has above-cloud water vapor paths of only 1–2 mm (Zuidema et al., 2012). Above-cloud water vapor over the SE Atlantic is about twice as large as that over the SE Pacific (Pistone et al., 2021).
The south Atlantic stratocumulus clouds are also associated with the anticyclonic circulation around the semi-permanent St. Helena high (Klein and Hartman, 1993; Wood, 2015). BB aerosols from fire smoke, because they contain black carbon, absorb shortwave radiation efficiently, so that smoke warms the atmosphere (warming effect), while the low-level stratocumulus clouds reflect sunlight, providing a negative radiative effect (cooling effect). Therefore, depending on how aerosol and low clouds interact, the net radiative effect can be altered. This net radiative effect varies between climate models (Zuidema et al., 2016; Mallet et al., 2021), as the complexity of the interactions is particularly large over the SE Atlantic. Model–observational comparisons reveal large differences (Shinozuka et al., 2020; Doherty et al., 2022).
As a step forward to better understand these aerosol–cloud interactions and their roles in climate, the ObseRvations of Aerosols above CLouds and their intEractionS (ORACLES) project undertook 3 months of aircraft deployments in September 2016, August 2017, and October 2018 to the SE Atlantic Ocean (flight tracks are shown in Fig. 1a). To better interpret the measurements, we first documented the climatological characteristics during the deployment in part 1 of the meteorological overview paper (Ryoo et al., 2021). Its major conclusions are summarized here. (1) During August 2017, the AEJ-S was weaker than the climatological mean (2000–2018), largely due to an additional anomalous upper-level jet aloft around 10∘ S. August 2017 was also drier over the SE Atlantic Ocean and the coast (around 0–15∘ E, 5–10∘ S; around 700 hPa) than climatology, with a stronger low-level jet (LLJ) at 925–950 hPa along the Namibian coast of the SE Atlantic. Consistent with this, the maximum sea level pressure associated with the southern Atlantic anticyclone was stronger and closer to the coast than the August climatological mean (2000–2018). (2) During September 2016, the AEJ-S was comparable to the climatological mean, but the LLJ and the large-scale southern Atlantic anticyclone were stronger than the climatological mean. (3) During October 2018, the AEJ-S was slightly weaker compared to the climatological mean, as were the LLJ and the southern Atlantic anticyclone. October 2018 was wetter over the Benguela coastal region (at 600 hPa) than the climatological mean. During all the deployment months, sea surface temperatures (SSTs) over the SE Atlantic were warmer than the SST climatological mean (2002–2018), but the monthly mean low-level cloud fraction (low CF) was only noticeably lower than the low-cloud climatological mean (2003–2018) in August 2017.
To recap how low cloud can be associated with aerosol and meteorology, the maps of the climatological monthly mean (2003–2018) are shown in Fig. 1b and c, as follows: the Copernicus Atmosphere Monitoring Service (CAMS) mid-tropospheric (600 hPa) black carbon mixing ratio (BC), European Centre for Medium-Range Weather Forecasts reanalysis v5 (ERA5) 600 and 925 hPa zonal wind, 800 hPa relative humidity (RH), 800 hPa subsidence, and the low CF over the deployment region. At a mid-tropospheric level (∼600 hPa), the BC aerosols from land are modulated by the prevailing mid-tropospheric easterly jet around 600 hPa (∼4 km), which is the AEJ-S, propagating into the SE Atlantic Ocean. Pistone et al. (2021) found that pollution indicators, such as carbon monoxide (CO) and aerosol loading, are closely correlated with atmospheric water vapor in the observations and that both are lofted from the continent and advected by the AEJ-S in September 2016. At lower-tropospheric levels (∼925–800 hPa), the low clouds reside over the strong coastal low-level jet and the large-scale subsidence regions off of the Namibian coast. These two levels are closely coupled through the mid-level continental anticyclone and large-scale subsidence because the mid-level (∼600 hPa; ∼4 km) continental anticyclone can return aerosols back to the continent, with subsidence hypothesized to facilitate entrainment of the aerosol into the boundary layer during the month of September (Redemann et al., 2021). The LLJ situated off of the coast of Namibia, coupled to the dominant northwestward boundary layer winds, further encourage aerosol dispersion throughout the southeastern Atlantic marine boundary layer (Christensen et al., 2020; Fig. 1b and c). The microphysical consequences are well observed in the satellite cloud droplet number concentration measurements (Redemann et al., 2021).
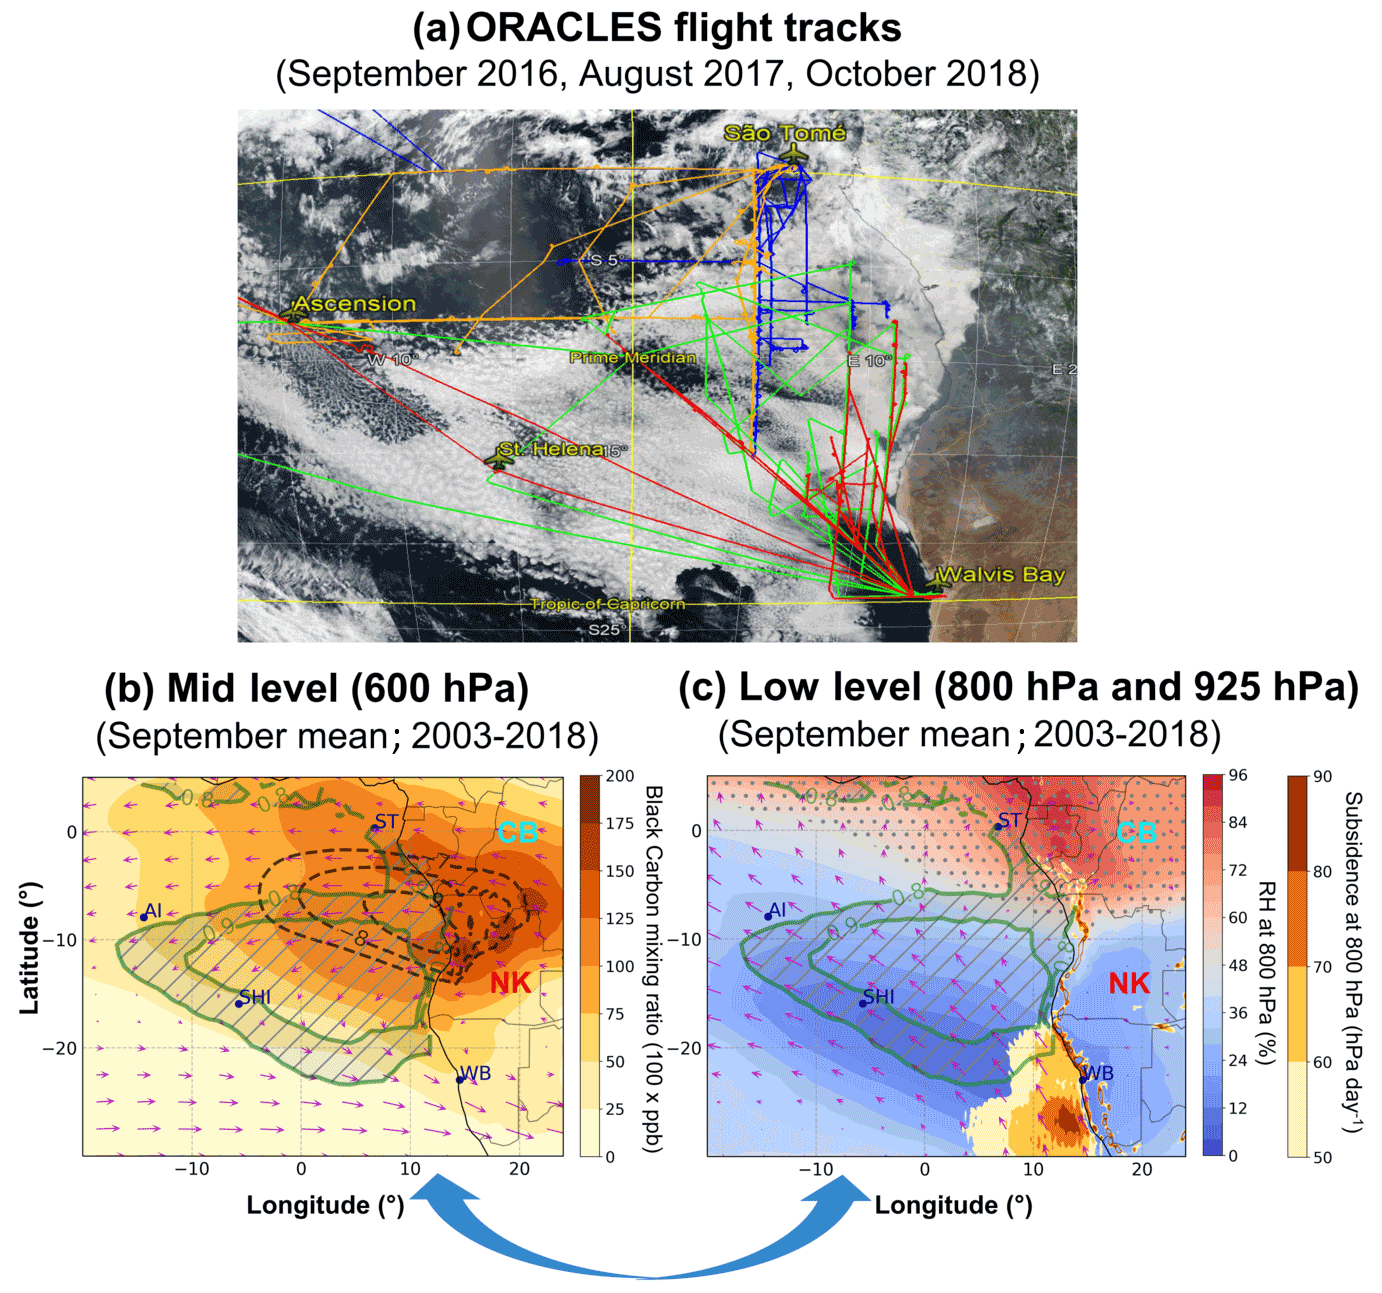
Figure 1(a) ORACLES flight tracks in September 2016 (green for ER-2 flight; red for P-3 flight), August 2017 (orange for P-3 flight), and October 2018 (blue for P-3 flight) overlain on a MODIS Aqua true cloud image and © Google Maps on 13 September 2018 (adapted from Redemann et al., 2021). (b) Map of the September mean (2003–2018) of (a) CAMS 600 hPa black carbon mixing ratio (BC; shading; parts per billion (ppb) ×100) overlaid by the ERA5 600 hPa zonal wind (black contours; −7, −8, and −9 m s−1), 600 hPa horizontal wind vector (magenta; m s−1), and low-cloud fraction (low CF; green contours; 0.8, 0.9). (c) The same as panel (a), except for 800 hPa relative humidity (RH; gray hatch as dot; RH >50, %) overlaid by 800 hPa omega (shading; a positive value is subsidence; hPa d−1), 925 hPa horizontal wind vector (magenta; m s−1), and low CF (green contours; 0.8 and 0.9) over the ORACLES deployment region in the SE Atlantic Ocean. The letters represent São Tomé (ST), St. Helena island (SHI), Ascension Island (AI), and Walvis Bay (WB). CB stands for Congo basin (characterized as cool and moist areas), and NK represents Namibia–Kalahari dryland (characterized as warm and dry areas). The navy arrow indicates the coupling of aerosol and meteorology in mid- and low-level layers, affecting low-cloud decks.
The sizable stratocumulus deck is reinforced in part by mid-latitude westerlies that are deflected by topography, increasing the low-level tropospheric stability (LTS; Richter and Mechoso, 2006). Coupling between meteorology, aerosols, and clouds adds additional complexity (Adebiyi and Zuidema, 2016, 2018). For example, the LTS is modified not only through the surface temperature but also by the absorption of solar radiation by the aerosols residing above the cloud over the ocean (Wilcox, 2010; Sakaeda et al., 2011; Adebiyi et al., 2015; Gordon et al., 2018; Mallet et al., 2019; 2020; Cochrane et al., 2022). Temperature and low clouds can also be affected by the planetary boundary layer structure, but this is also highly modulated by mesoscale (Hegarty et al., 2018) and synoptic-scale circulation (Liu et al., 2019). The variability in temporal and spatial scales across the different meteorological processes can also influence the aerosol and low clouds differently (De Szoeke et al., 2016; Zuidema et al., 2018; Abel et al., 2020; Scott et al., 2020; Christensen et al., 2020; Zhang and Zuidema, 2021). These all suggest that it is critical to untangle the role of the aerosols on low clouds from the effects of meteorology to identify aerosol–cloud interaction processes.
In this paper, part 2, we provide detailed information on the meteorological conditions affecting the aerosol transport and low clouds at daily to synoptic timescales. In the next section, we discuss the dataset and methodology used in this study. In Sect. 3, we focus on the daily–weekly variability in the key meteorological fields during the flight days for each deployment year (September 2016, August 2017, and October 2018). Relationships between low cloud cover and meteorological variables are discussed in Sect. 4, and a summary and conclusions are provided in Sect. 5.
The geographic domain of our study region is as shown in Fig. 1b and c, at 30∘ S–5∘ N and 20∘ W–20∘ E.
2.1 Data
-
ERA5 is used to detail the 3-D wind (u, v, ω), temperature, geopotential height (Z), and specific humidity (q) fields (Hersbach et al., 2020). Hourly and monthly data are available on a 0.25∘ longitude × 0.25∘ latitude grid, with 37 vertical levels ranging from 1000 to 1 hPa. The ERA5 wind structure compares favorably to that of other reanalysis data, such as the Modern-Era Retrospective Analysis for Research and Applications, version 2 (MERRA-2) and Japanese 55-year Reanalysis (JRA55), over the deployment region (Ryoo et al., 2021).
-
The Kalahari heat low (hereafter heat low) is identified by the layer mean temperature indicated by the difference in geopotential height between 850 and 600 hPa over the southern African plateau. We apply a threshold value of 2920 m to indicate the spatial extent of the land heat low.
-
Lower tropospheric stability (LTS) is defined as the θ difference between 800 and 1000 hPa, in order to remain below more of the aerosol layer at 700 hPa, following Adebiyi et al. (2015).
-
The southern African easterly jet (AEJ-S) is defined by zonal winds (zonal winds m s−1; implying easterly winds) around 0–20∘ E, 5–15∘ S at a pressure altitude of 600 hPa for September and October and at 700 hPa for August.
-
The Benguela low-level jet (hereafter LLJ; Nicholson, 2010) is defined by a 925 hPa horizontal wind speed of more than 5 m s−1 off the coast of Namibia (0–10∘ E, 15–25∘ S).
-
Deep, moist convection is defined using brightness temperatures from Meteosat-10 satellite data. Moist convection is defined as brightness temperatures lower than 230 K. The 230 K threshold was chosen based on its previous use to indirectly estimate convective rainfall (Ohsawa et al., 2001; Zuidema, 2003).
-
The daily (day + night mean) low CF on 1∘ longitude × 1∘ latitude grid is derived from level 3 Visible Infrared Imaging Radiometer Suite (VIIRS; Hubanks et al., 2019) data on board the Suomi National Polar-orbiting Partnership (Suomi NPP). The low cloud is defined by cloud-top heights below 2.5 km (Redemann et al., 2021). The monthly mean low-CF product is derived from the level 3 Moderate Resolution Imaging Spectroradiometer (MODIS, Platnick et al., 2015a, b) on board both Terra and Aqua products (1∘ longitude × 1∘ latitude grid resolution).
-
European Centre for Medium-Range Weather Forecasts (ECMWF) Copernicus Atmosphere Monitoring Service (CAMS) global reanalysis (EAC4) is the latest global reanalysis dataset of the atmospheric composition produced by the ECMWF (Inness et al., 2019). The CAMS reanalysis assimilates satellite retrievals of total column CO, tropospheric column nitrogen dioxide (NO2), aerosol optical depth (AOD), and total column, partial column, and profile ozone retrievals. The data are available every 3 h on a 0.75∘ longitude × 0.75∘ latitude grid with 25 pressure levels. CAMS has small biases compared with surface–site observations and the prior Monitoring Atmospheric Composition and Climate (MACC) reanalysis. CAMS reanalysis is also known to be insensitive to cloud cover and satellite overpass time (Witthuhn et al., 2020). That said, an underestimation of CO remains in the boundary layer, along with regional bias and an underresolved vertical structure (Inness et al., 2019).
-
Here we find that the CAMS boundary layer BC mass concentration (900 hPa; ∼1 km) qualitatively agrees with refractory BC mass concentrations (rBC) derived from a single-particle soot photometer observation over Ascension Island in August 2017 and September 2016 (Zhang and Zuidema, 2019, 2021), with a slight overestimate, particularly later, in September 2016 (Figs. S9–S10). No comparison was possible for October 2018, but observations from October 2016 and 2017 (Zhang and Zuidema, 2021) confirm the CAMS portrayal of relatively low October concentrations of boundary layer BC.
2.2 Methodology for the decoupled cloud-topped BLH detection
The boundary layer height (BLH) is estimated using, every 6 h, ERA5 specific humidity (q), based on a heuristic algorithm we have developed. The computed BLH is designed to include the decoupled cloud-topped planetary boundary layer (PBL) in which the cloud layer is above the well-mixed surface-based layer (see Fig. S1 in the Supplement). In this quasi-isentropic exchange, the air mass mixing occurs without changing the potential temperature rapidly. This BLH tends to be higher than the height of the well-mixed sub-cloud layer. The methodology for estimating the decoupled cloud-topped BLH is as follows:
- 1.
Calculate (i.e., a vertical derivative of q, where q is specific humidity (g kg−1), and z is the vertical level in m) up to D, which is the maximum permitted BLH. D is set to 3 km over all the oceanic regions and islands south of 2∘ N and west of 10∘ E. D is 6 km over the land (except for the islands).
- 2.
Find the height at which is a minimum at each horizontal grid point in the domains defined in (1).
- 3.
Find the height where q=10 g kg−1 marching downward from height D. We chose q∼10 g kg−1 as a threshold because this is a reasonable value to indicate influence from the surface. The height at which the threshold q is encountered is not sensitive to the threshold value, as long as q is not so small (e.g., q>4 g kg−1).
- 4.
Pick the higher height of (2) or (3) to find the height at which the cloud layer is above the well-mixed surface layer.
- 5.
Compute a horizontal average over five points surrounding the point, except for the edges.
This method indicates consistently decoupled cloud BLH over the SE Atlantic Ocean during the deployments, while small variations in BLH can occur over land when there is local turbulence or convective outflow, reducing the vertical gradient of q.
3.1 Deployment year 1 (Namibia, September 2016)
The first deployment of ORACLES was based in Walvis Bay (22.96∘ S, 14.51∘ E) on the Namibian coast of southwestern Africa. During September 2016, the AEJ-S was comparable to the climatological mean. The LLJ and the large-scale southern Atlantic anticyclone were stronger than the climatological mean. Sea surface temperatures (SSTs) over the SE Atlantic were warmer than the climatological means, but the monthly mean low CF was not noticeably lower than climatology in September 2016. Characteristics of the synoptic-scale condition and convective features during the September 2016 deployment are summarized in Table 1. Each column in Table 1 represents the dates of occurrence, both ER-2 (Earth Resources 2, NASA's high-altitude airborne science aircraft; NASA ER-2, 2014) and P-3 (NASA's aircraft designed for endurance and range, which are capable of long-duration flights; NASA P-3, 2022) flight days, and the longitude–latitude domain for which the synoptic features were captured.
Table 1Characteristics of synoptic-scale features over SE Atlantic during the September 2016 deployment. The asterisk (*) represents that both P-3 and ER-2 flights were available, while the plus (+) sign represents that only the ER-2 flight was available. No notation indicates that only the P-3 flight was available. MFS represents the mid-latitude frontal system affecting the flight region on that day (whereas the × sign represents no effect).
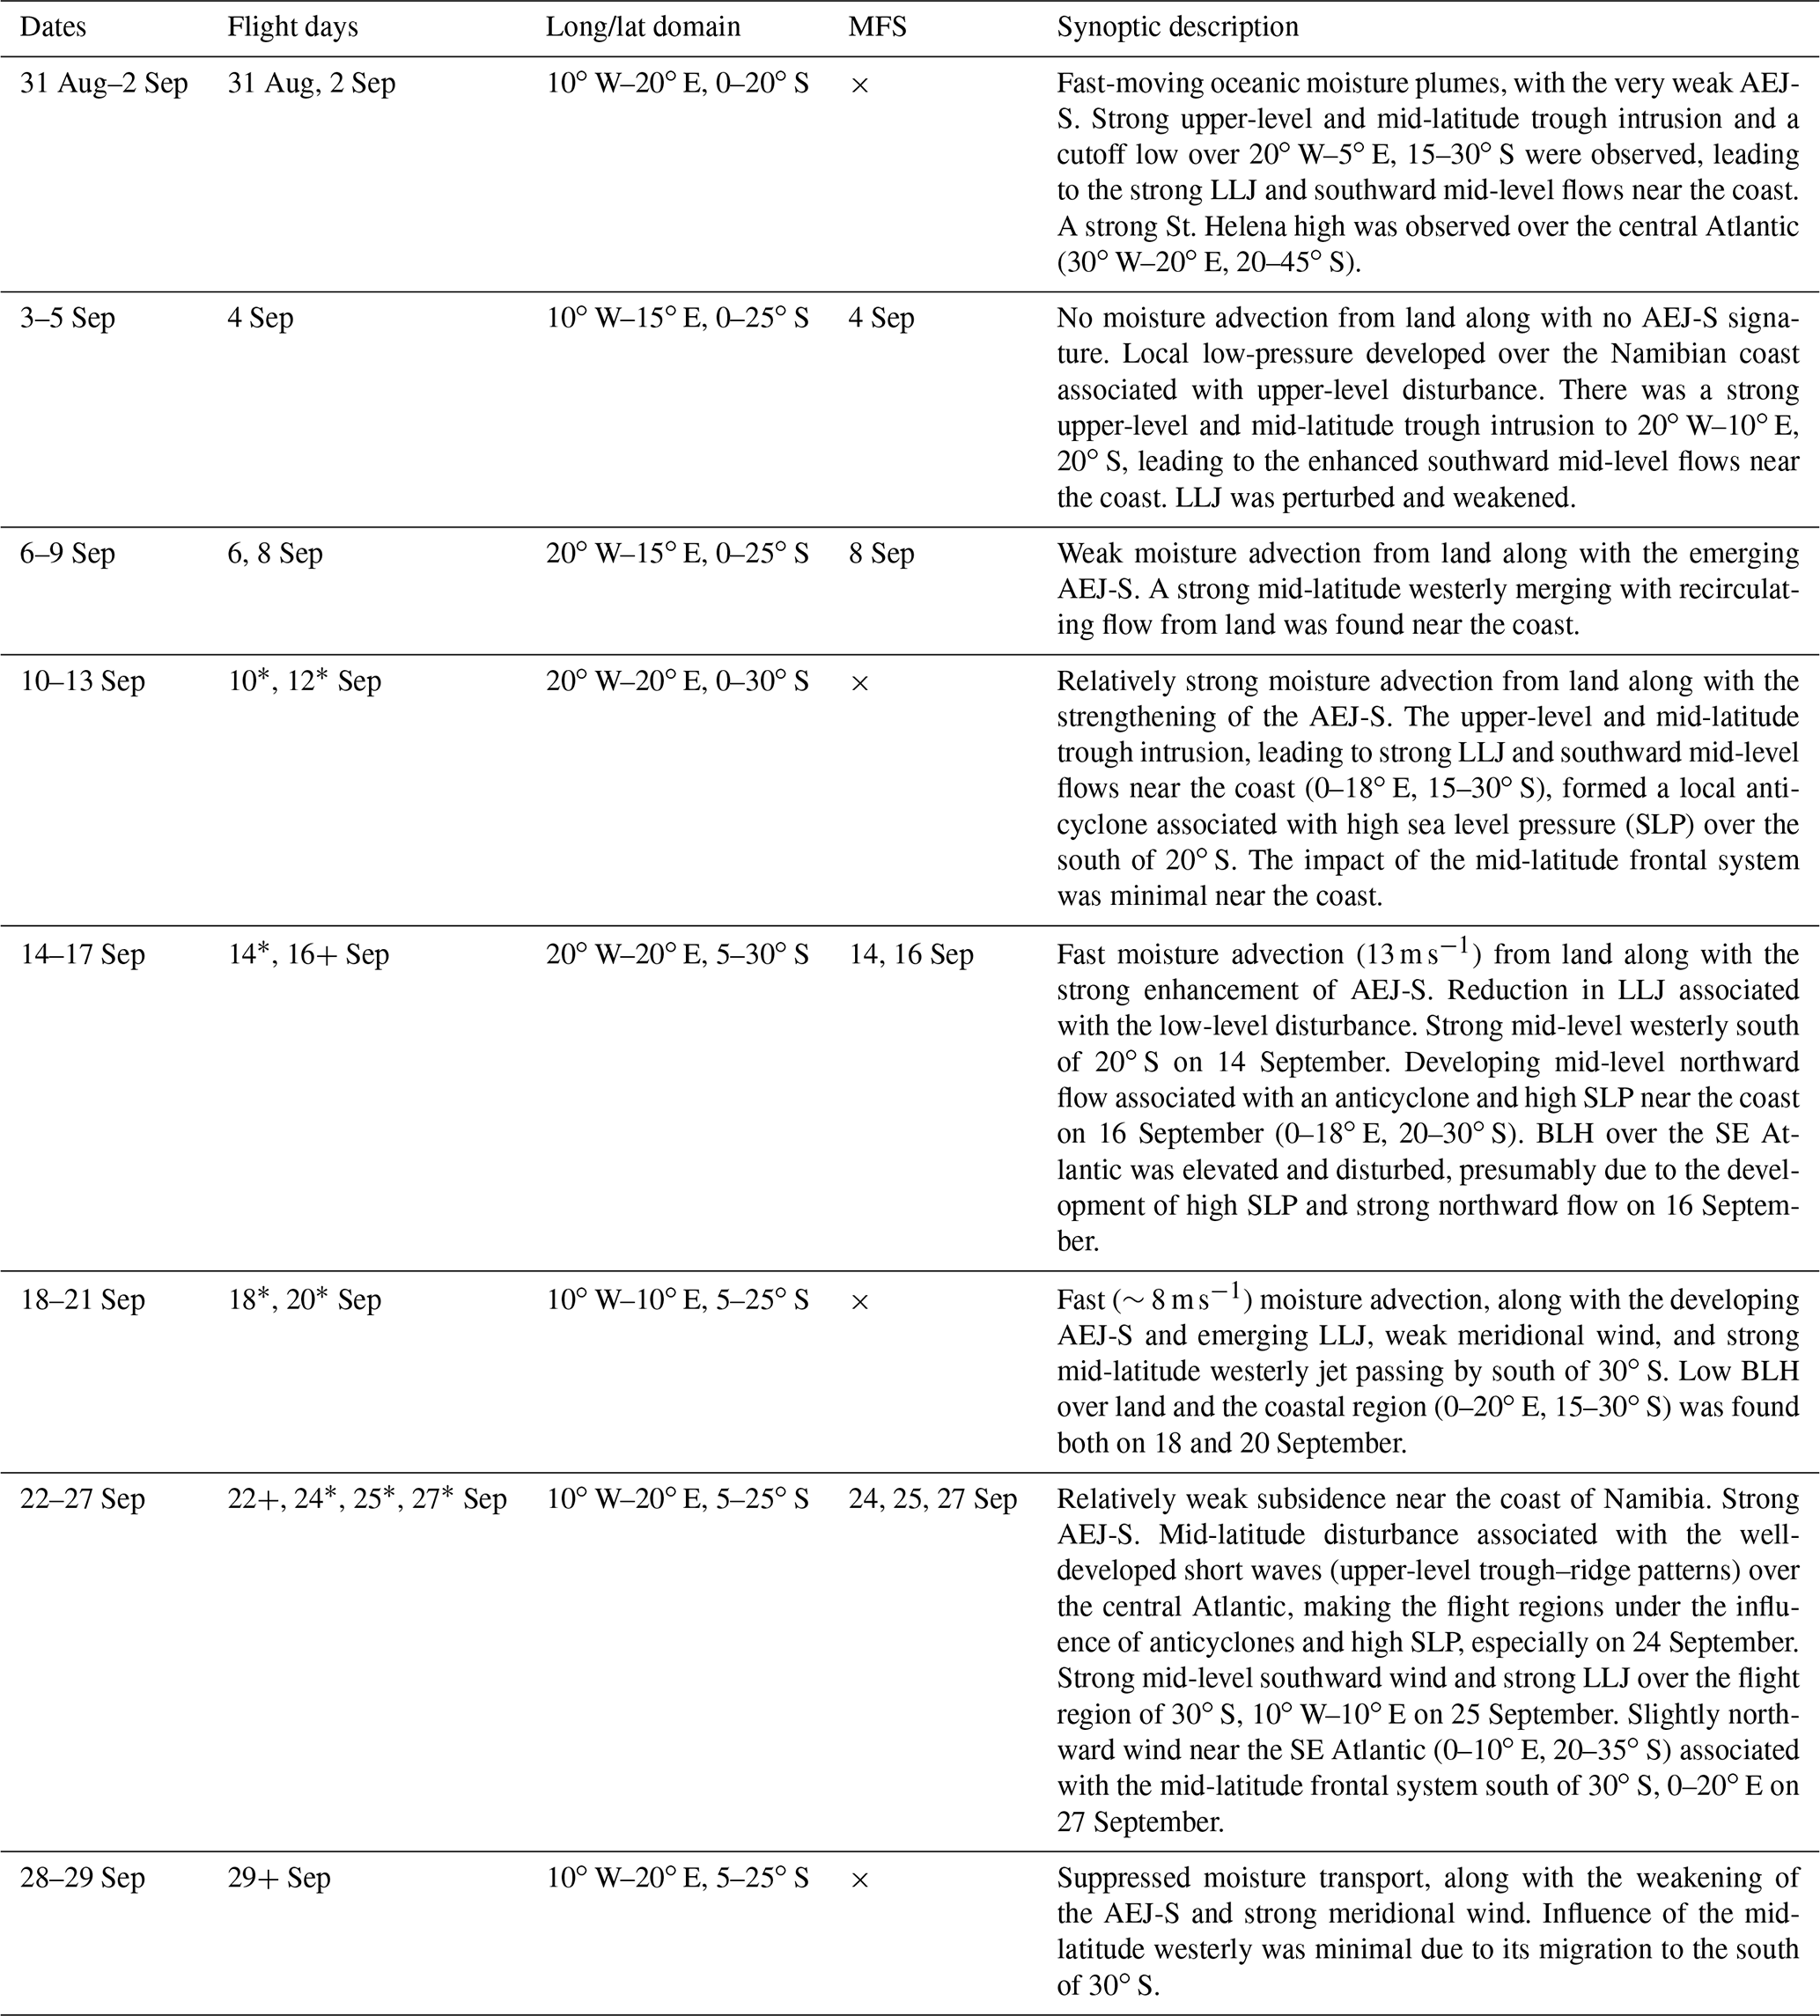
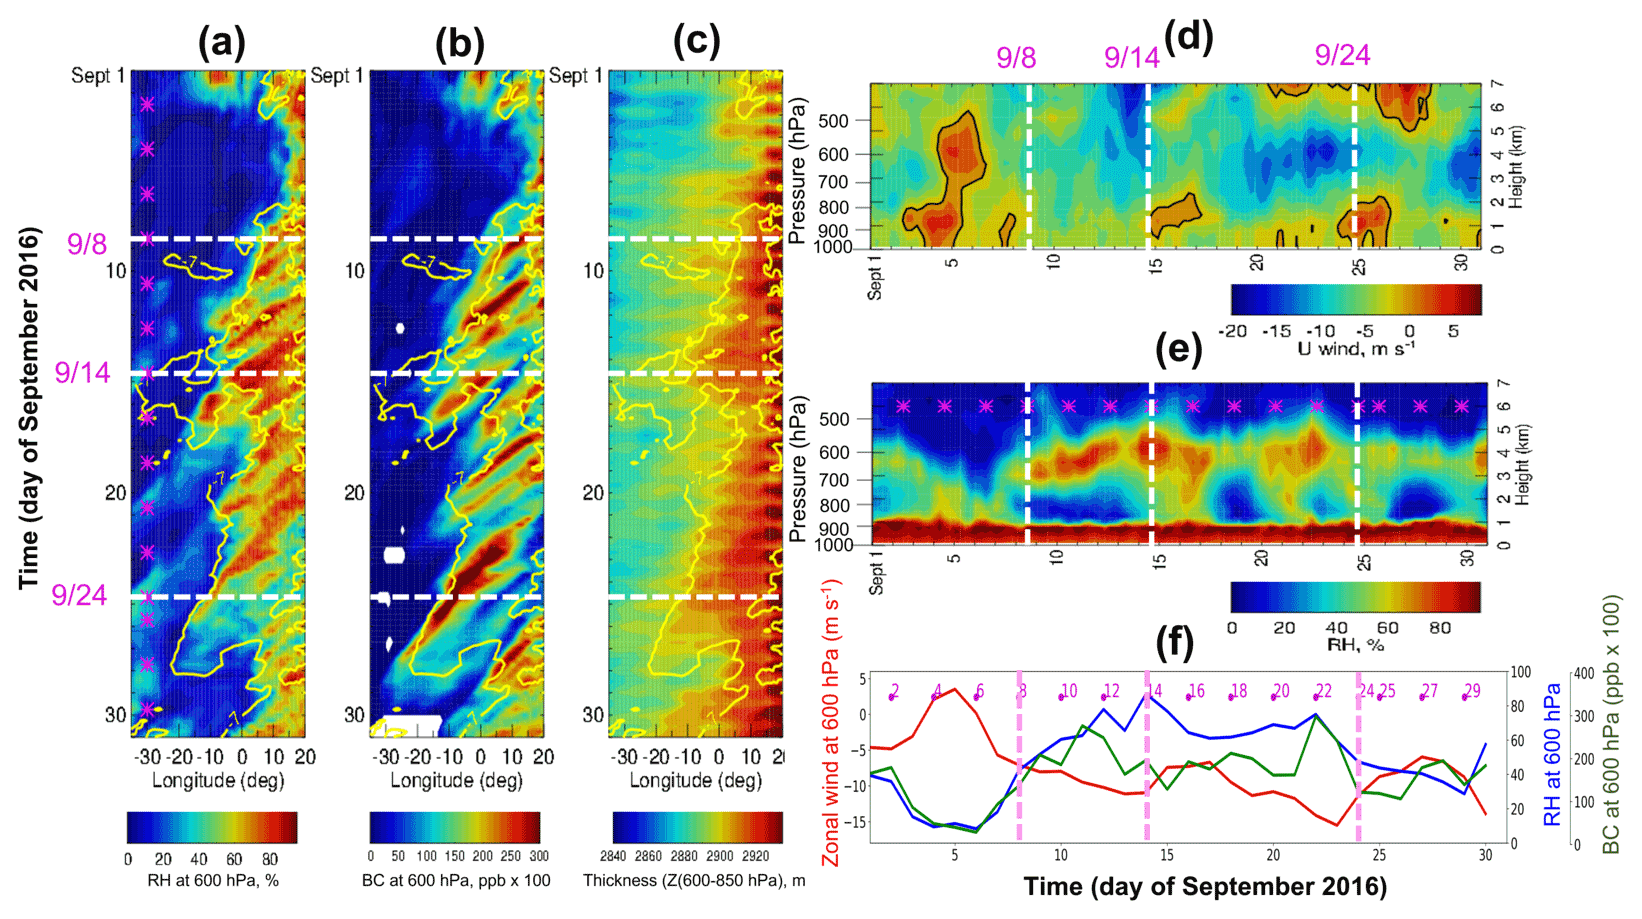
Figure 2Longitude–time cross section of every 6 h of (a) 600 hPa RH (%), (b) 600 hPa BC (shading; ppb ×100), and (c) thickness (geopotential height difference of 600–850 hPa); high values (>2920 m) over a southern African plateau represents the heat low; m) averaged over 8–10∘ S during September 2016. Panels (a)–(c) are overlaid by 600 hPa zonal wind isotach (yellow line; −7 m s−1). (d, e) Altitude–time cross section of zonal wind and RH at 10∘ S, averaged over 0–10∘ E during September 2016. The black contour in panel (d) represents the zero value of zonal wind. (f) Daily time series of the 600 hPa zonal wind (red line; m s−1), 600 hPa RH (blue line; %), and 600 hPa BC (green line; ppb ×100) averaged over 8–10∘ S and 0–10∘ E. The dashed white lines indicate the flight days investigated further in this study, and the magenta asterisks (and numbers in panel f) represent the flight days during the September 2016 deployment. White areas in panel (b) represent the missing data values.
Figure 2 shows the longitude–time cross section (i.e., Hovmöller diagrams) of every 6 h 600 hPa RH, BC, zonal wind, and heat low for September 2016. The AEJ-S is strongly associated with the heat low, consistent with climatology (Ryoo et al., 2021). The diurnal variations in the heat low are one of the major drivers of the AEJ-S (Fig. S2). Coherent variations in RH and the AEJ-S suggest the moisture transport from land is facilitated when the AEJ-S extends further west (Fig. 2a and b; see also Pistone et al., 2021, for examples). The similar westward transport feature is also shown in the water vapor field (Fig. S2). The AEJ-S strengthening from 8–15 September 2016 between 10∘ W and 20∘ E leads to the corresponding RH increases by 0–2 d (Fig. 2a, c, f).
When the AEJ-S is weak, the transport of RH and BC is also weak, as shown on 5–8 September 2016 (Fig. 2a, b, f). The relationship between BC–AEJ-S–RH strengthens as the month evolves, with higher BC mixing ratios occurring when the AEJ-S becomes stronger. Around 24 September, BC mass mixing ratios are high and the AEJ-S is strong, but RH and water vapor (not shown) decrease as they dissipate over the ocean.
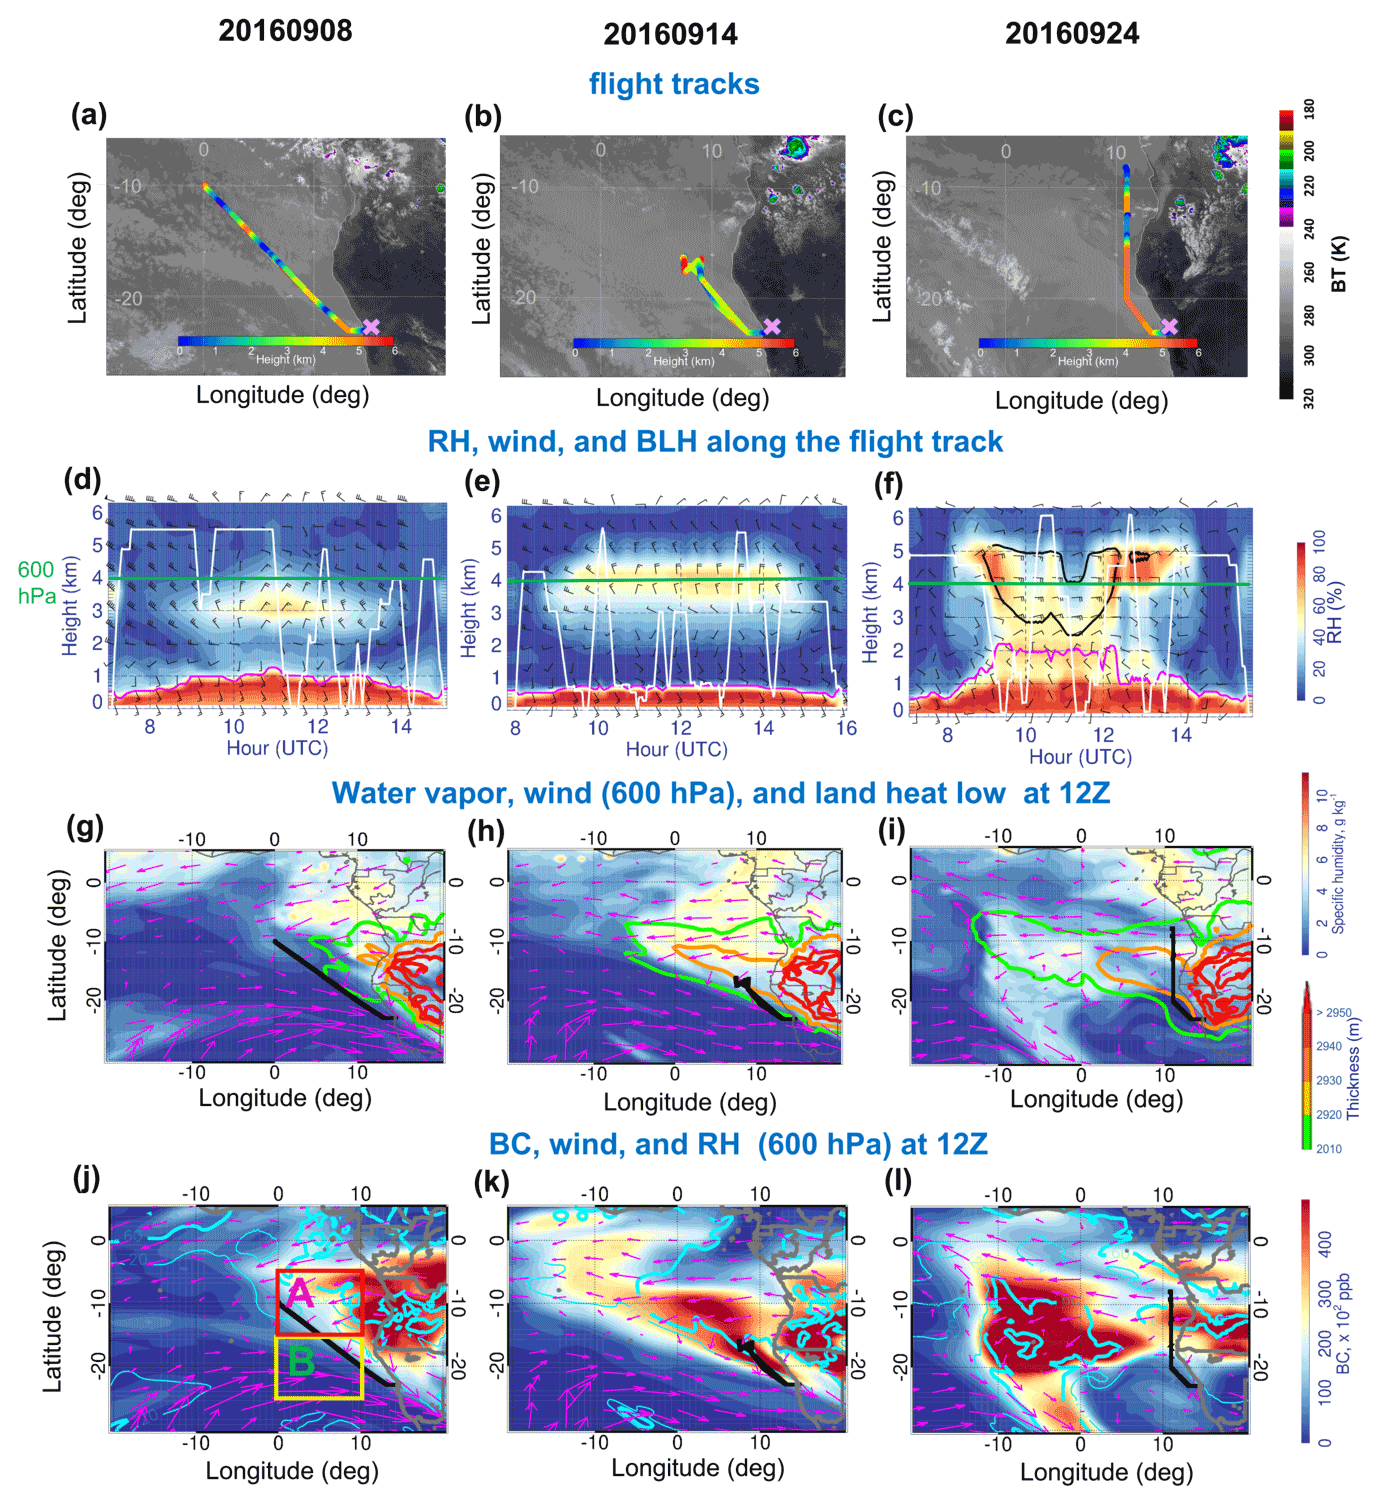
Figure 3(a–c) The horizontal flight tracks during September 2016 ORACLES deployment plotted on the Meteosat IR 10.8 µm imagery at 13:45 UTC (shading is brightness temperature (BT); K). The color of the flight track represents the altitude of the P-3 flight along the horizontal flight track. (d–f) Curtain plot of RH along the P-3 flight track during 8, 14, and 24 September 2016. The white contour represents the flight profile. The magenta line in panels (d)–(f) represents the BLH along the flight track. Bold black contours in panels (d)–(f) indicate the zonal wind isotach of −8 m s−1. The green line in panels (d)–(f) indicates the 600 hPa level. (g–i) Map of 600 hPa specific humidity (q; color shading; g kg−1) and 600 hPa horizontal winds (vectors; m s−1) overlaid by thickness (thickness is the geopotential height (Z) difference between 600 and 850 hPa; color line contour; high values (>2920 m) over land represents the heat low) at 12:00 UTC on 8, 14, and 24 September 2016, respectively. (j–l) Map of 600 hPa BC (shading; ppb ×100) overlaid by 600 hPa RH (thick cyan line is 60; thin cyan line is 20; %) and 600 hPa horizontal winds (vectors; m s−1) at 12:00 UTC on 8, 14, and 24 September 2016. The black line in panels (g)–(l) represents the horizontal flight track on the given day. The magenta (yellow) box in panel (j) refers to region A at 0–10∘ E, 5–15∘ S (region B at 0–10∘ E, 15–25∘ S).
A focus on three distinct flight days helps to elucidate the monthly evolution. The 8 and 14 September 2016 flight days were denoted as “routine” flight days (Fig. 3a and b), designed to build up representative statistics along a fixed track, whereas the targeted flight on 24 September 2016 (Fig. 3c) reached to the far northern edge of a coastal African smoke plume (Redemann et al., 2021). The routine flight on 8 September sampled dry conditions, with the moist plume located further north of 10∘ S (e.g., 5–10∘ S), while the moist plumes with RH ∼50 %–60 % in the range of ∼3–5.5 km were intercepted by the two other flights (Fig. 3d–f). Especially during the 24 September flight, the peak RH lines are aligned with the AEJ-S (black contour; Fig. 3f), where its maximum is observed around 5–10∘ S, 10–20∘ E, originating from the continent. Furthermore, on 24 September, high RH is observed throughout the vertical layers from the bottom, indicative of a slightly deeper marine boundary layer compared with the other 2 highlighted flight days (Fig. 3d–f).
Both water vapor and BC aerosol are transported by the strong zonal wind (e.g., AEJ-S), but these have different patterns on the different flight days (Fig.3g–l). On 8 September 2016, large moisture and BC gradients over the ocean around 5∘ W–10∘ E, 10–20∘ S are accompanied by a relatively weak zonal wind, with a mid-latitude cyclonic circulation expanding northward up to 20∘ S (Fig. 4a). On 14 September 2016, a stronger zonal wind transports moisture and BC over the ocean at 10∘ S, and the jet merges with the subtropical cyclonic circulation evident south of 20∘ S (Fig. 3h). By 24 September, as the heat low continues to strengthen, a large-scale mid-level cyclonic circulation becomes established, pushing the westward-moving mid-latitude jet stream further south (not shown). We separated the flight regions into region A and B because of (1) the different relationship of low cloud cover with the meteorological variables between the regions (see also Andersen et al., 2020) and (2) the latitudinal dependency of the LTS and low-cloud (e.g., stratocumulus) fraction (Wood, 2012). The detailed relationship is further discussed.
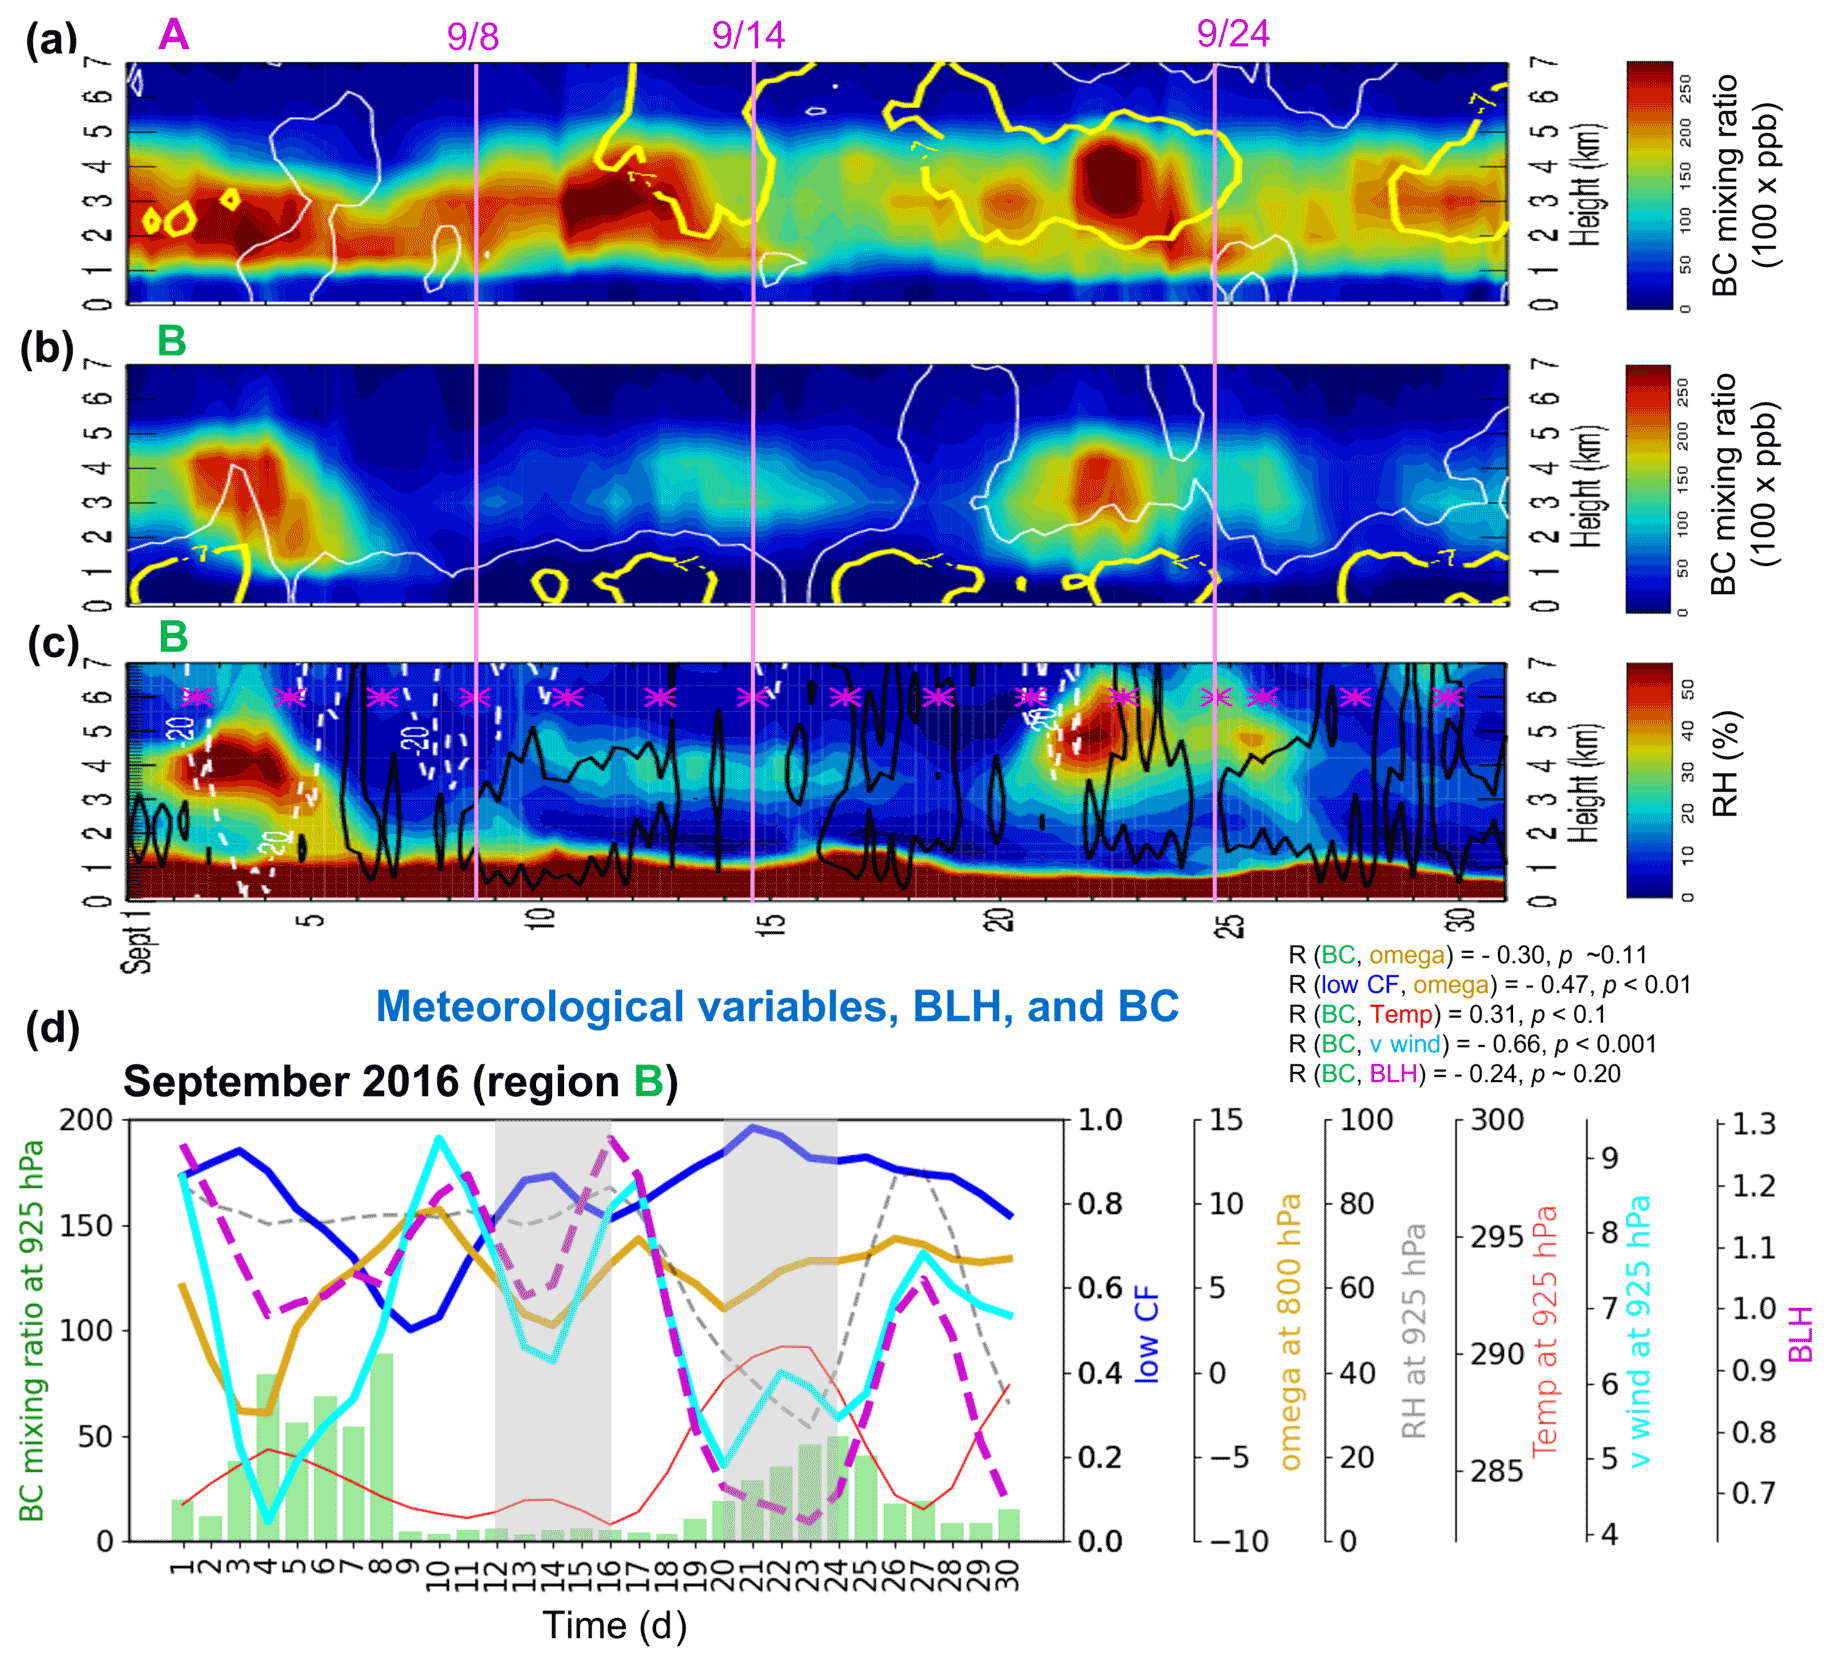
Figure 4(a, b) Time–altitude cross section of every 6 h of BC (shading; ppb ×100) overlaid by zonal wind isotachs at −7 and 0 m s−1 (thick yellow and thin white lines, respectively) averaged over (a) region A (0–10∘ E, 5–15∘ S) and (b) region B (0–10∘ E, 15–25∘ S) in September 2016 for every 6 h. (c) The same as panel (b) but for every 6 h of RH (shading; %) overlaid by every 6 h of vertical velocities of −20 and 50 hPa d−1 (dashed white and solid black lines, respectively; positive values represent subsidence) averaged over region B. (d) Time series of daily mean 925 hPa BC (green bar; ppb ×100), 800 hPa vertical velocity (omega; ω; gold line; hPa d−1), 925 hPa RH (dashed gray line; %), 925 hPa temperature (solid red line; K), 925 hPa meridional wind (solid cyan line; m s−1), BLH (dashed magenta line; km), and low CF (blue line) over region B. Each colored line represents the 3 d running mean. The asterisk in panel (c) represents the September 2016 flight days. The pink solid lines in panels (a)–(c) refer to the 3 flight days. The light gray shadings in panel (d) represent the two periods having different BC–RH conditions. R in panel (d) refers to the Pearson correlation coefficient between two variables in a parenthesis with its statistical significance (p value).
Figure 4 shows the time evolution of BC aerosol, wind, RH, and the cloud deck. For most of September 2016, the low CF is modulated by the synoptic-scale atmospheric circulation, including frontal passages. The width and the intensity of the developing cyclonic circulation shape the moisture and aerosol transport and low CF (Fig. 3j–l). The AEJ-S (wind at 600 hPa over region A) and the LLJ (wind at 925 hPa over region B) is weakly correlated in September 2016 (Pearson correlation (R) =0.32 with p value ∼0.11; see Fig. S3). On some days, the marine boundary layer also contains BC, such as from 21–24 September over region B. HYSPLIT (Hybrid Single-Particle Lagrangian Integrated Trajectory model) back trajectories and the aerosol forecasts used during the deployment indicate that the boundary layer BC is aerosol advected directly westward off of the continent that has not reached the altitude of the AEJ-S, residing near the boundary layer top (Dobracki et al., 2022), where it can be more easily entrained even when the subsidence is weak (not shown).
Aircraft observations do not show BC in the boundary layer for most of September (Shinozuka et al., 2020), except on 31 August 2016 (Diamond et al., 2018), indicating the CAMS reanalysis allows for too much entrainment into the boundary layer (reaching 0.8 ppb, parts per billion, at times). Simultaneously, the temperature increases, and the RH decreases (Fig. 4d). The temperature increase is large enough to suggest that the cause is advection from land, but this is not pursued further. The low CF is not much affected, although a slight decrease is found around 23 September. Similar features are also found in region A (not shown).
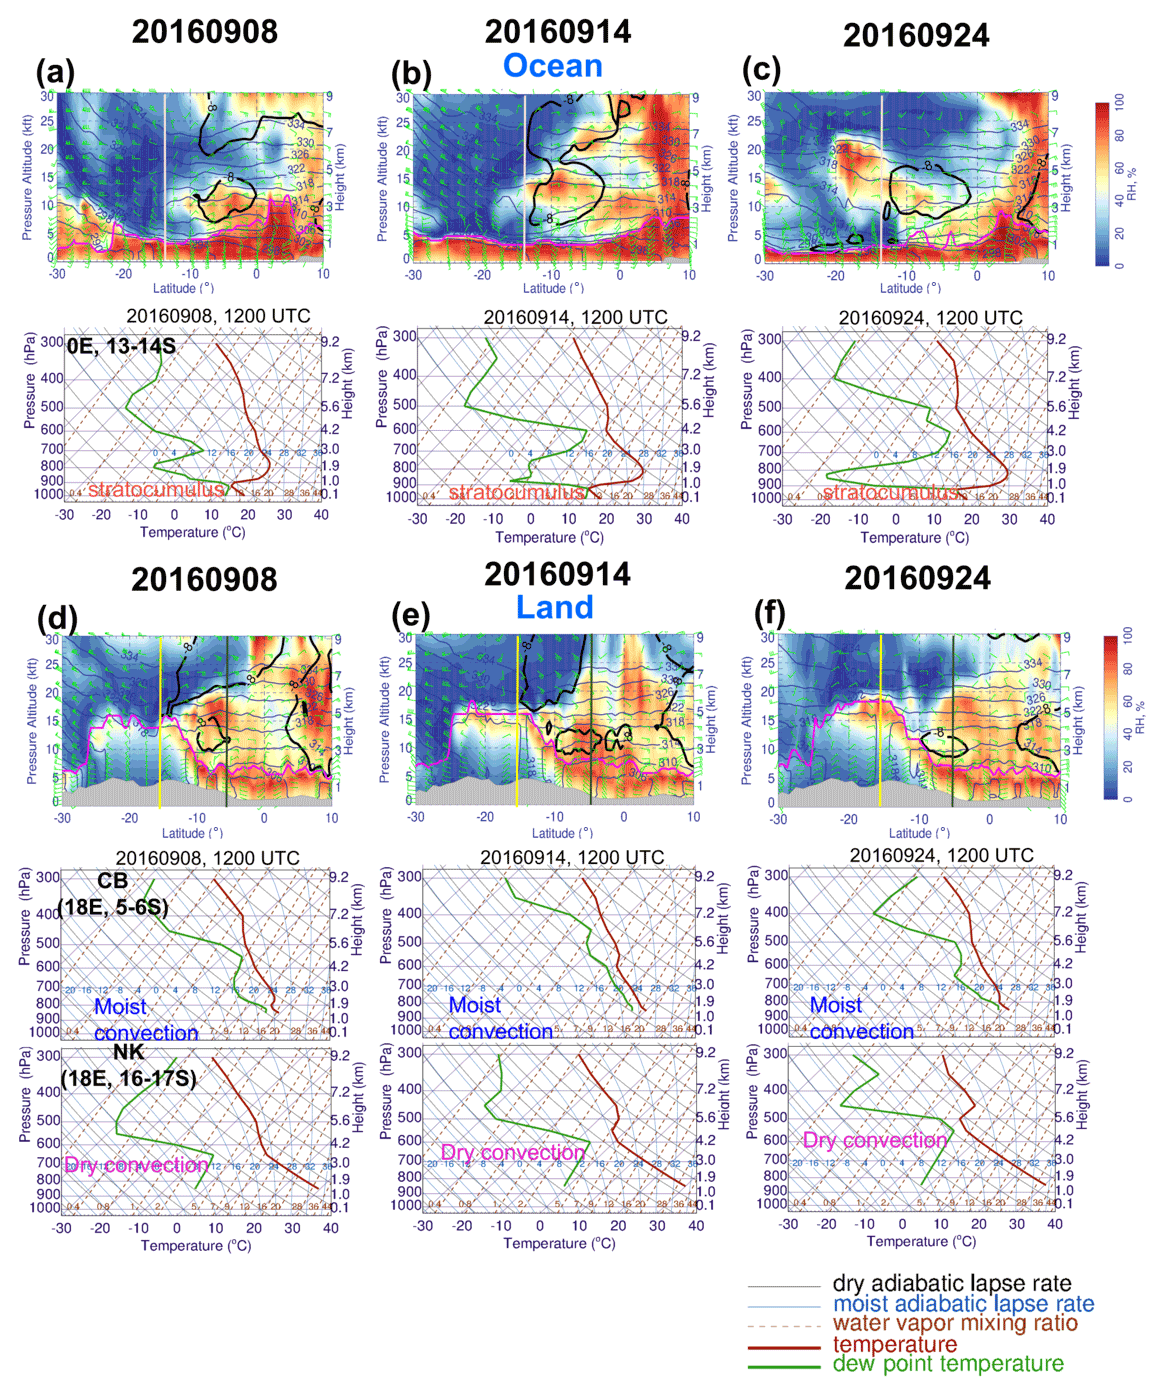
Figure 5(a–c) Ocean, showing the latitudinal cross section of RH (shading; %), horizontal winds (wind barbs; green; m s−1), θ (navy; K), and BLH (magenta; m) at 0∘ E (top) and a Skew-T log-P diagram averaged over 0∘ E and 13–14∘ S (bottom; from the left) at 12:00 UTC on 8, 14, and 24 September 2016. Bold black contours are zonal wind (−8 m s−1). (d–f) Land, showing the same as in panels (a)–(c), except for the cross section at 18∘ E and Skew-T log-P diagram averaged over 18∘ E and 5–6∘ S (CB is the Congo basin) and 18∘ E and 16–17∘ S (NK is Namibian–Kalahari dryland). The gray-filled area represents the topography. The vertical lines in the cross-sectioned plots refer to the latitude we examine.
Whether convection is dry or moist can modulate how transported aerosols and moisture interact with clouds (Tao et al., 2012). To differentiate dry from moist convection, soundings and longitudinal cross sections of RH, winds, and θ over the ocean and the land are shown in Fig. 5. Over the ocean, the oceanic soundings show that the air is saturated when the temperature is equal to the dew point temperature (Alduchov and Eskridge, 1996) at around 900 hPa (Fig. 5a–c), forming stratocumulus. Moisture transported from the continent by the AEJ-S near 600 hPa can lead to occasional saturation, producing scattered mid-level clouds (Adebiyi et al., 2020). In the example of 24 September, the moist plume above stratocumulus resembles a dry-convection-type layer (above 700 hPa). This is indicated by the (1) dew point temperature following a nearly constant water vapor mixing ratio line and (2) air temperature roughly following the dry adiabatic lapse rate. This demonstrates that the dry convective layer propagates out from the land into the ocean (sounding plot of Fig. 5c and e).
Over the land, dry convection is more evident south of 10∘ S. The dew point nears saturation, ultimately favoring high RH, but with insufficient moisture for rainfall below 600 hPa (Fig. 5d–f). RH can exceed 60 %, and thin mid-level clouds can form at times near the top of the dry convection (Adebiyi et al., 2020). Dry convection over the Namibian–Kalahari dryland (16–17∘ S) can reach up to 500 hPa (∼ 5.5 km), especially on 24 September (Fig. 5f). This dry convection results in near-saturated conditions at the top of the deep continental boundary layer, explaining the moist plume that is transported westward by the AEJ-S at or north of the dry convection region. In contrast, moist convection is dominant north of 10∘ S (upper panels at 18∘ E, 5–6∘ S (CB) of Fig. 5d–f). All soundings over land around 5–6∘ S have significant convective available potential energy (CAPE). For all cases, the moisture plume around 600 hPa over the ocean is transported westward from land by the AEJ-S, although moisture can potentially be also modulated from a southern mid-latitude disturbance as well (e.g., 31 August 2016; Adebiyi and Zuidema, 2018; Kuete et al., 2020; Ryoo et al., 2021).

Figure 6Map of the (a–c) daily mean low CF (shading) overlaid by LTS (contour; K) and 925 hPa horizontal winds (vectors; m s−1), (d–f) BLH (shading; m) overlaid by 600 hPa horizontal winds (vectors; m s−1), 600 hPa geopotential height (red lines; m), and sea level pressure (SLP; lines with dark green, low pressure, at 996, 1000, and 1004 and magenta, high pressure, at 1024, 1028, and 1032; hPa) at 12:00 UTC on 8, 14, and 24 September 2016. (g) The top plot shows the time series of the daily mean low CF (blue lines) and daily mean LTS (red lines; K), while the bottom plot shows the daily mean low CF (blue line) and daily mean BLH (magenta lines; m) averaged over region A (0–10∘ E, 5–15∘ S; solid lines) and region B (0–10∘ E, 15–25∘ S; dashed lines) during September 2016. All flight days (8, 14, and 24 September 2016) are marked by an asterisk (gray vertical lines). The purple shading over the land in panels (d)–(f) refers to BLH higher than 3250 m. (h) The 2-D joint probability density function (pdf; shading) with a scatterplot is shown with 1-D histogram (pdf in line) of the (top) daily mean low CF and LTS and (bottom) daily mean low CF and BLH over region A (left) and B (right) during September 2016. The solid line in panel (a) indicates region A (magenta box) and region B (navy box), respectively. The Pearson's r in panel (h) refers to Pearson correlation coefficient with its statistical significance (p value).
Low cloud structure and cover are influenced by the large-scale subsidence, LTS, and BLH (Klein and Hartman, 1993; Wood, 2015), but these relationships will be weaker at synoptic timescales (De Szoeke et al., 2016) compared to the monthly mean variations detailed in Ryoo et al. (2021) and in the complex SE Atlantic environment (Adebiyi and Zuidema, 2018). Here we examine the daily variability in the low CF over the course of 3 flight days in Fig. 6. Clearly shown is that LTS and low CF are spatially and temporally positively correlated (Fig. 6a–c, g). For example, on 14 and 24 September 2016, as the LTS is stronger, low CF increases over most of the regions. However, on 8 September 2016, a mid-latitude system has broken up the sheet of low clouds to the south of 20∘ S (Adebiyi and Zuidema, 2018), possibly reducing the regional low CF and lowering the LTS compared to other days (Fig. 4a). Deeper BLHs tend to have reduced low CF, consistent with entrainment drying. A depressed BLH (<1 km) promotes the occurrence of a high low CF, as seen on 24 September 2016 (Fig. 6b, c, f, h).
The passage of a developing frontal system, indicated by the mid-level (e.g., 600 hPa) trough located on the west of the sea level low pressure, alters the regional circulation, as shown for 8 and 24 September 2016 (Fig. 6f). This is also indicated by the largely different angle between the 600 hPa wind vectors and geopotential lines (Fig. 6d–f), which are more apparent when the low pressure develops south of 30∘ S. The divergence of the ageostrophic wind links the low-, mid-, and upper-level flow through the strong vertical motion (Holton, 2004), aiding anomalous ascent at the southern edge of the stratocumulus deck, cooling the lower free troposphere, reducing LTS, and ultimately decreasing the low CF (Adebiyi and Zuidema, 2018). The LTS–low CF relationship is stronger further south (region B; R∼0.73) than in region A. Figure S13 contains further information on the mid-level flow and SLP patterns on all September 2016 flight days. No sensitivity in the result was found when using either mid-level (e.g., 600 hPa) or upper-level (e.g., 500 hPa) geopotential height and wind to investigate the development and impact of the mid-latitude frontal system (not shown).
3.2 Deployment year 2 (São Tomè, August 2017)
The second deployment occurred in São Tomé (0.34∘ N, 6.73∘ E). August marks the transition from austral winter (July) to austral spring (September) as the Southern Hemisphere warms, and the Kalahari heat low develops. During August 2017, the heat low development was delayed relative to the climatological mean (2000–2018). The August 2017 AEJ-S was weaker than in climatology due to an anomalous upper-level disturbance (wave) at around 10∘ S. The August 2017 lower free troposphere (∼700 hPa) was also drier over the SE Atlantic Ocean and the coast (around 0–15∘ E, 5–10∘ S) than in climatology, with a stronger LLJ at 925–950 hPa along the Namibian coast. Consistent with this, the southern Atlantic anticyclone was stronger and closer to the coast than the August climatological mean. The monthly mean low CF was noticeably lower than climatology in August 2017 and linked to a warm SST anomaly (Ryoo et al., 2021). The characteristics of synoptic-scale features during the flight days in August 2017 deployment are summarized in Table 2.
Table 2Characteristics of synoptic-scale features over SE Atlantic during the August 2017 deployment. P-3 flights were available in August 2017. MFS represents the mid-latitude frontal system affecting the flight region on that day (× sign represents no effect).
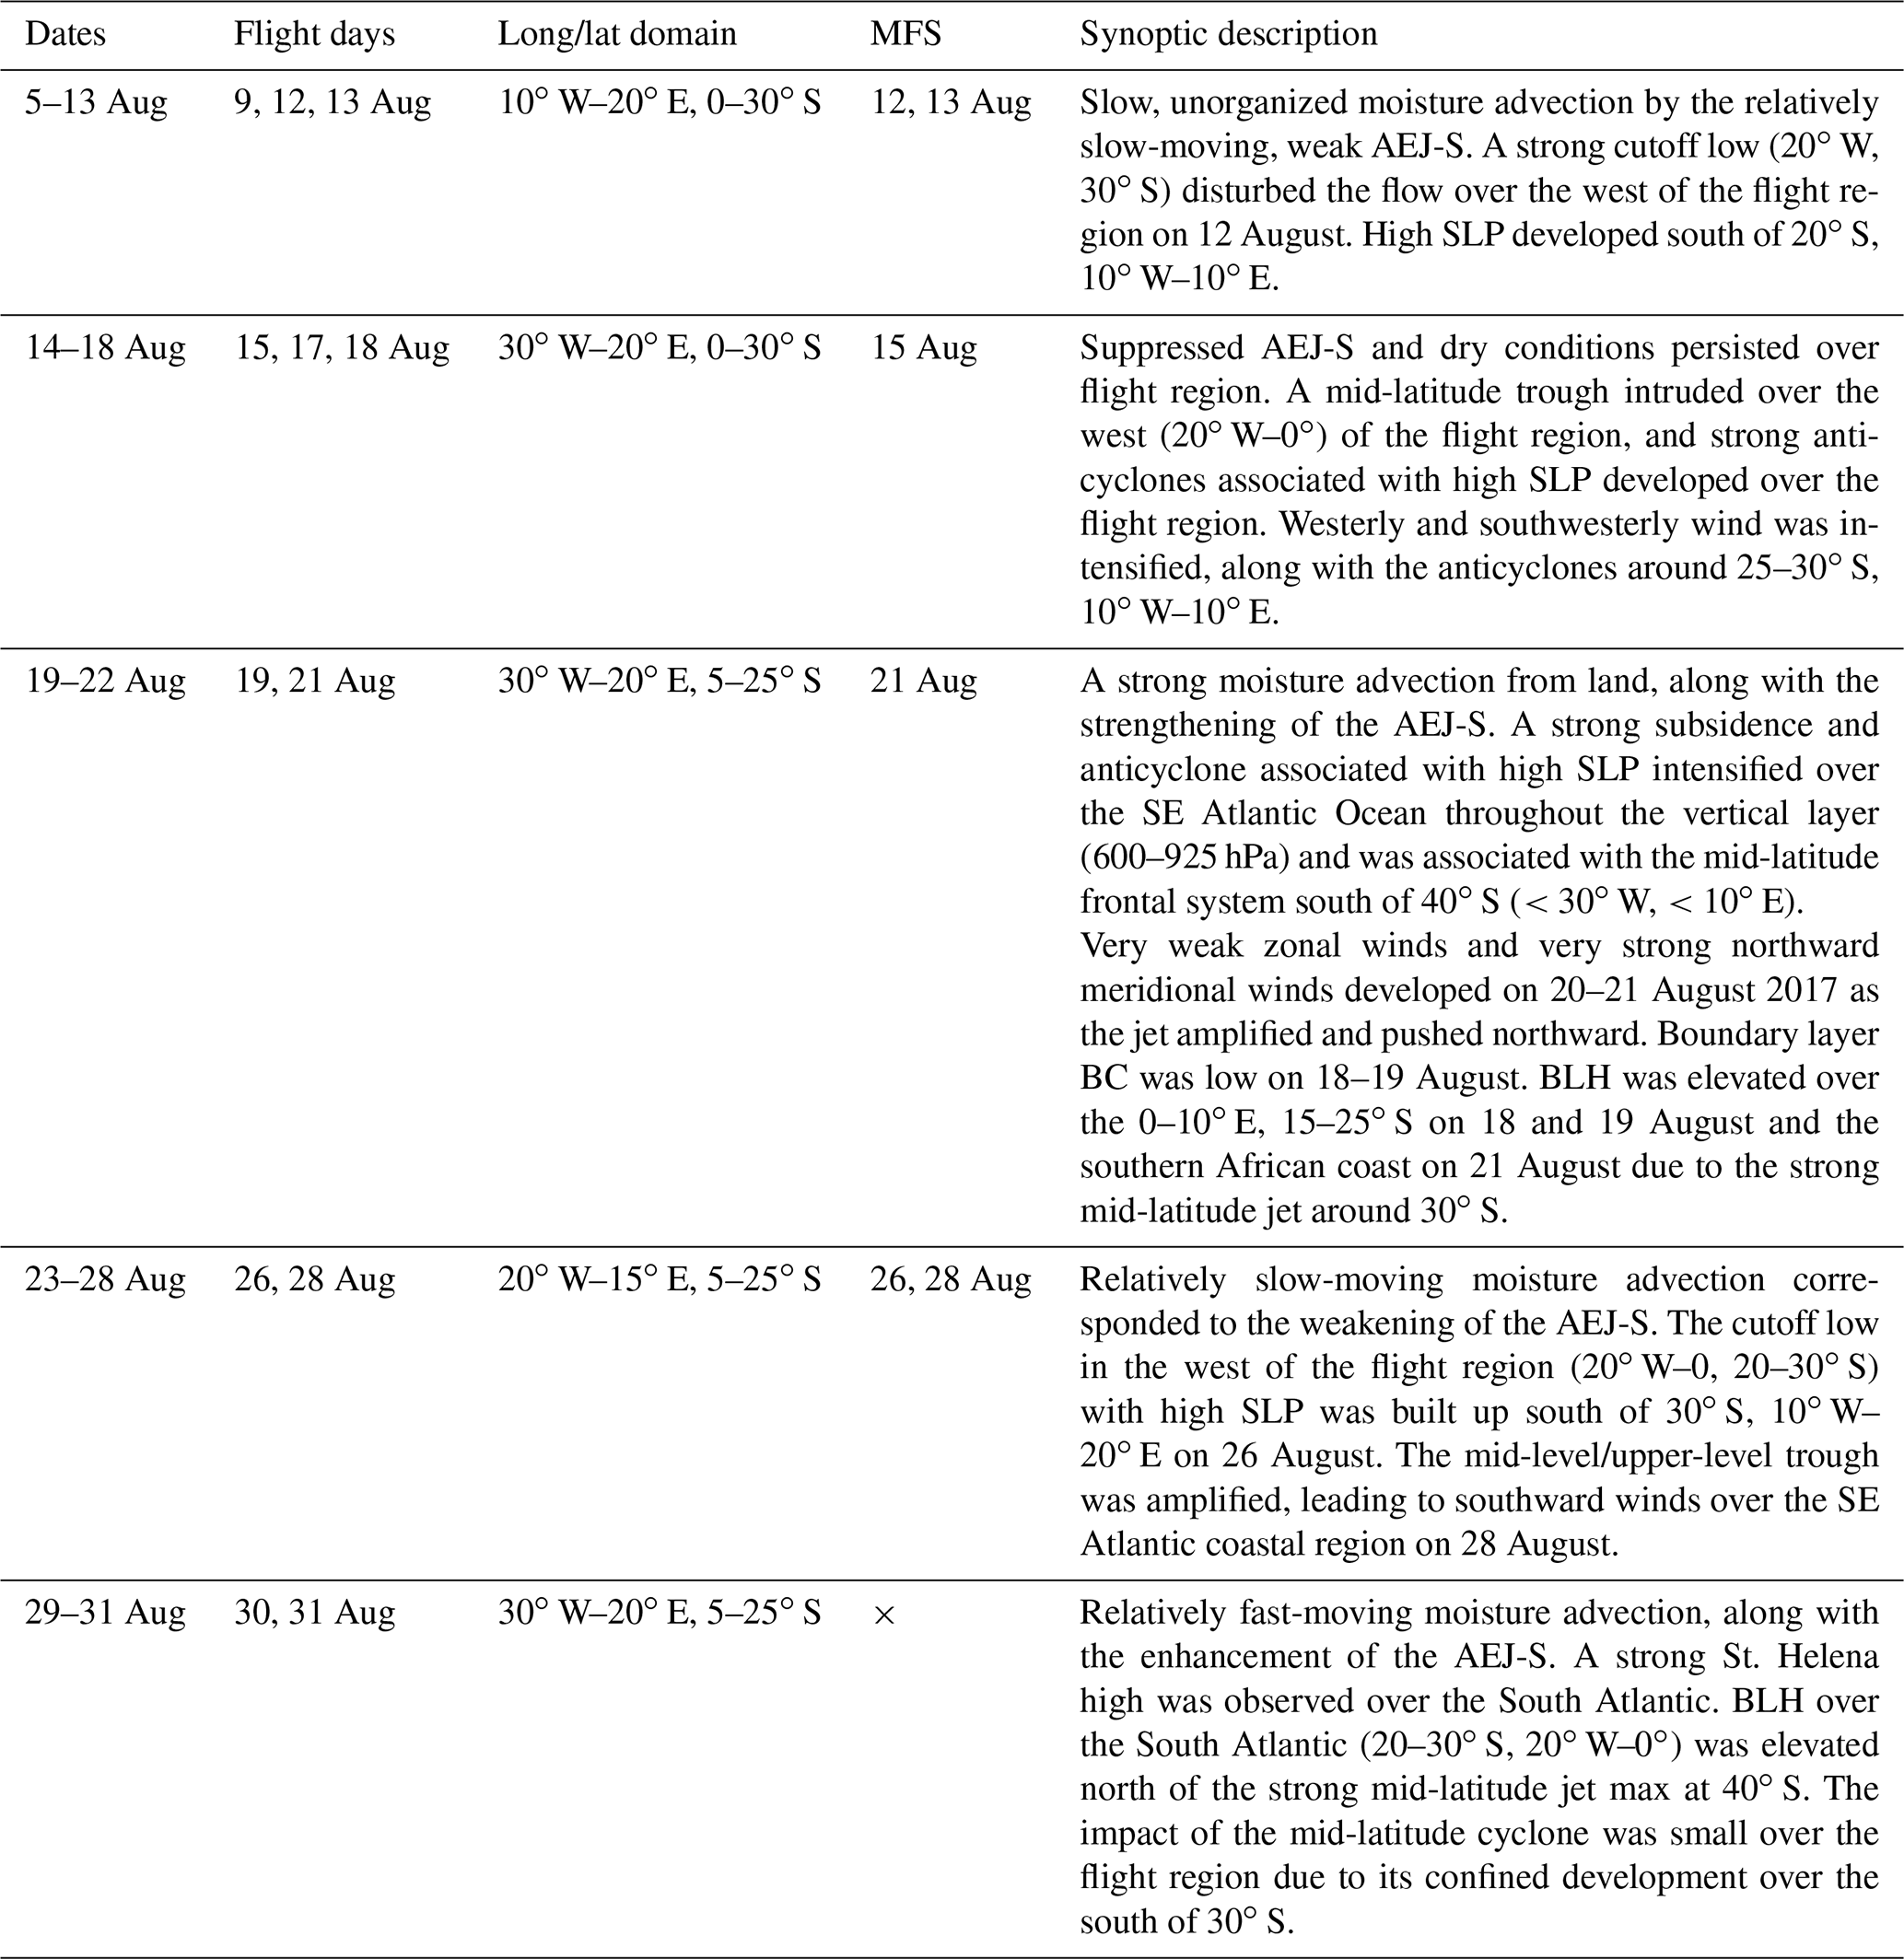
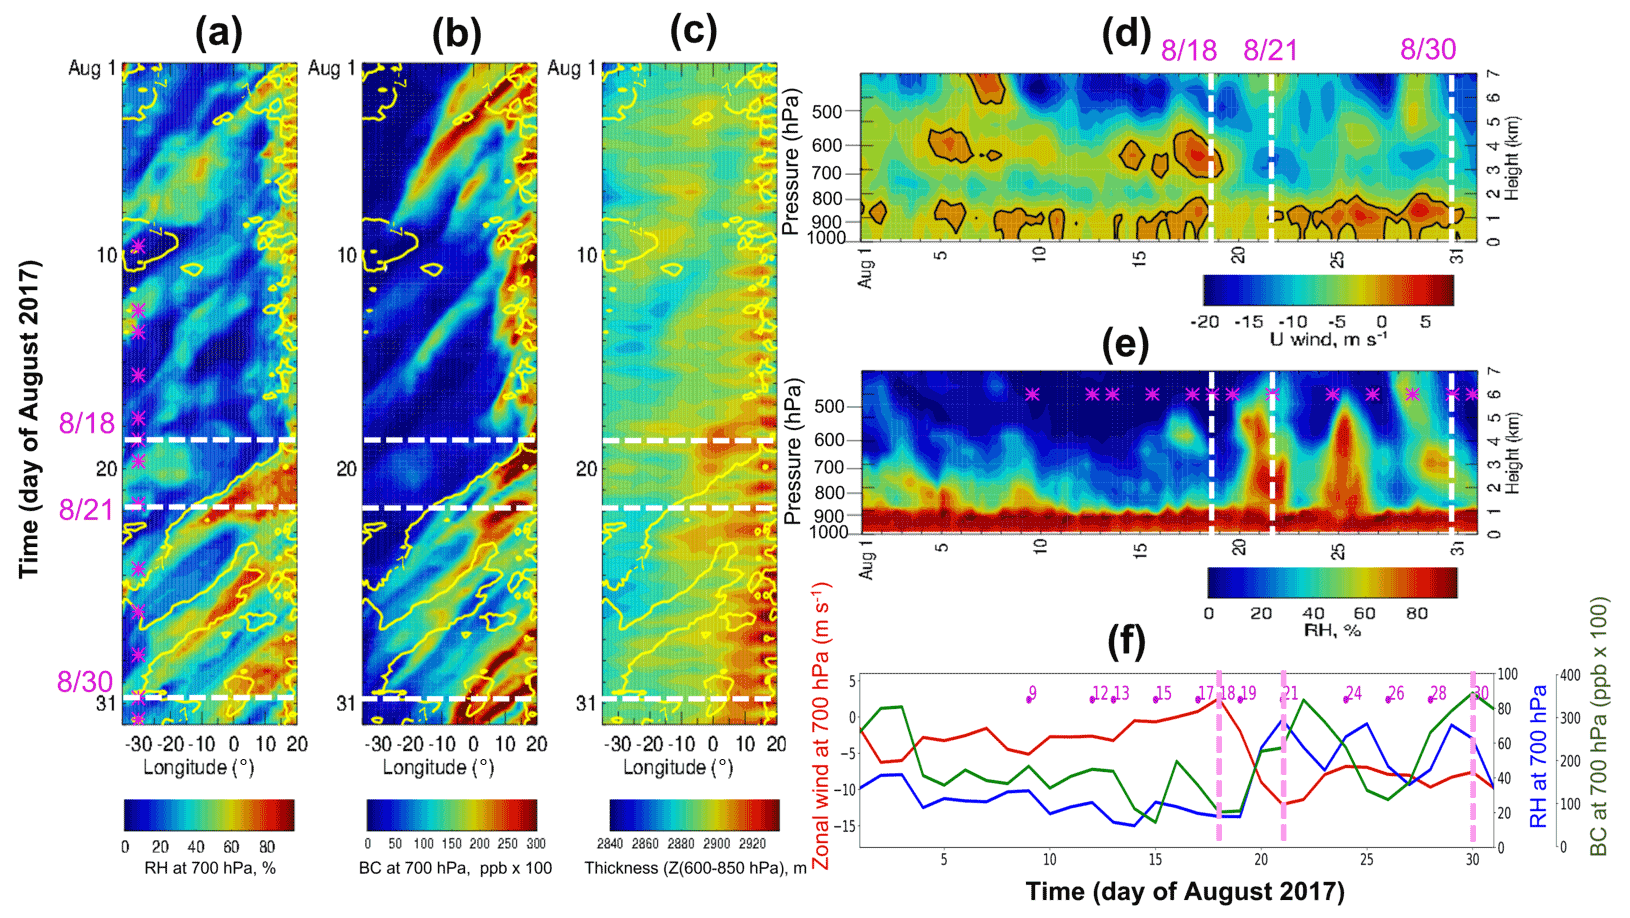
Figure 7Longitude–time cross section of every 6 h (a) 700 hPa RH (%), (b) 700 hPa BC aerosol (shading; ppb ×100), and (c) thickness (geopotential height difference at 600–850 hPa; high values (>2920 m) over a southern African plateau represents the heat low; m) averaged over 5–7∘ S during August 2017. Panels (a)–(c) are overlaid by 700 hPa zonal wind isotach (yellow line; −7 m s−1). (d–e) Altitude–time cross section of zonal wind and RH at 6∘ S, averaged over 0–10∘ E during August 2017. The black contour in panel (d) represents the zero value of zonal wind. (f) Daily time series of the 700 hPa zonal wind (red line; m s−1), 700 hPa RH (blue line; %), and 700 hPa BC (green line; ppb ×100) averaged over 5–7∘ S and 0–10∘ E. The dashed white lines indicate the flight days investigated further in this study, and the magenta asterisks (and numbers in panel f) represent the flight days during the August 2017 deployment.
The strongest free tropospheric winds occur approximately 3∘ further north in August 2017 than in September 2016 or between 5 and 7∘ S (Sect. 3.1). The Hovmöller diagram in Fig. 7 indicates relatively dry conditions until 18 August 2017, with weak easterlies over the Atlantic Ocean (Fig. 7a and b). The BC aerosol layer coincides with the lower altitude of the AEJ-S and RH (Fig. 7b). The heat low strengthens considerably as the month progresses (Fig. 7c). Strongly easterly winds, or the AEJ-S, do not become apparent until 20 August, and their maximum height is lower (∼700 hPa, ∼3 km) in August than in September (Figs. 2, 5, 7d). In August 2017, there is another easterly jet above 500 hPa, and this is unusually strong compared to the climatology (Ryoo et al., 2021; Fig. 7d). Relatively dry free tropospheric conditions (RH is %; q∼8 g kg−1) over the ocean continue until 18 August 2017 and, thereafter, shift to a moist regime after 20 August 2017 when moist plumes develop (Fig. 7e and f), coinciding with the development of the AEJ-S over the continent. A similar feature is evident in the water vapor mixing ratio (Fig. S4).
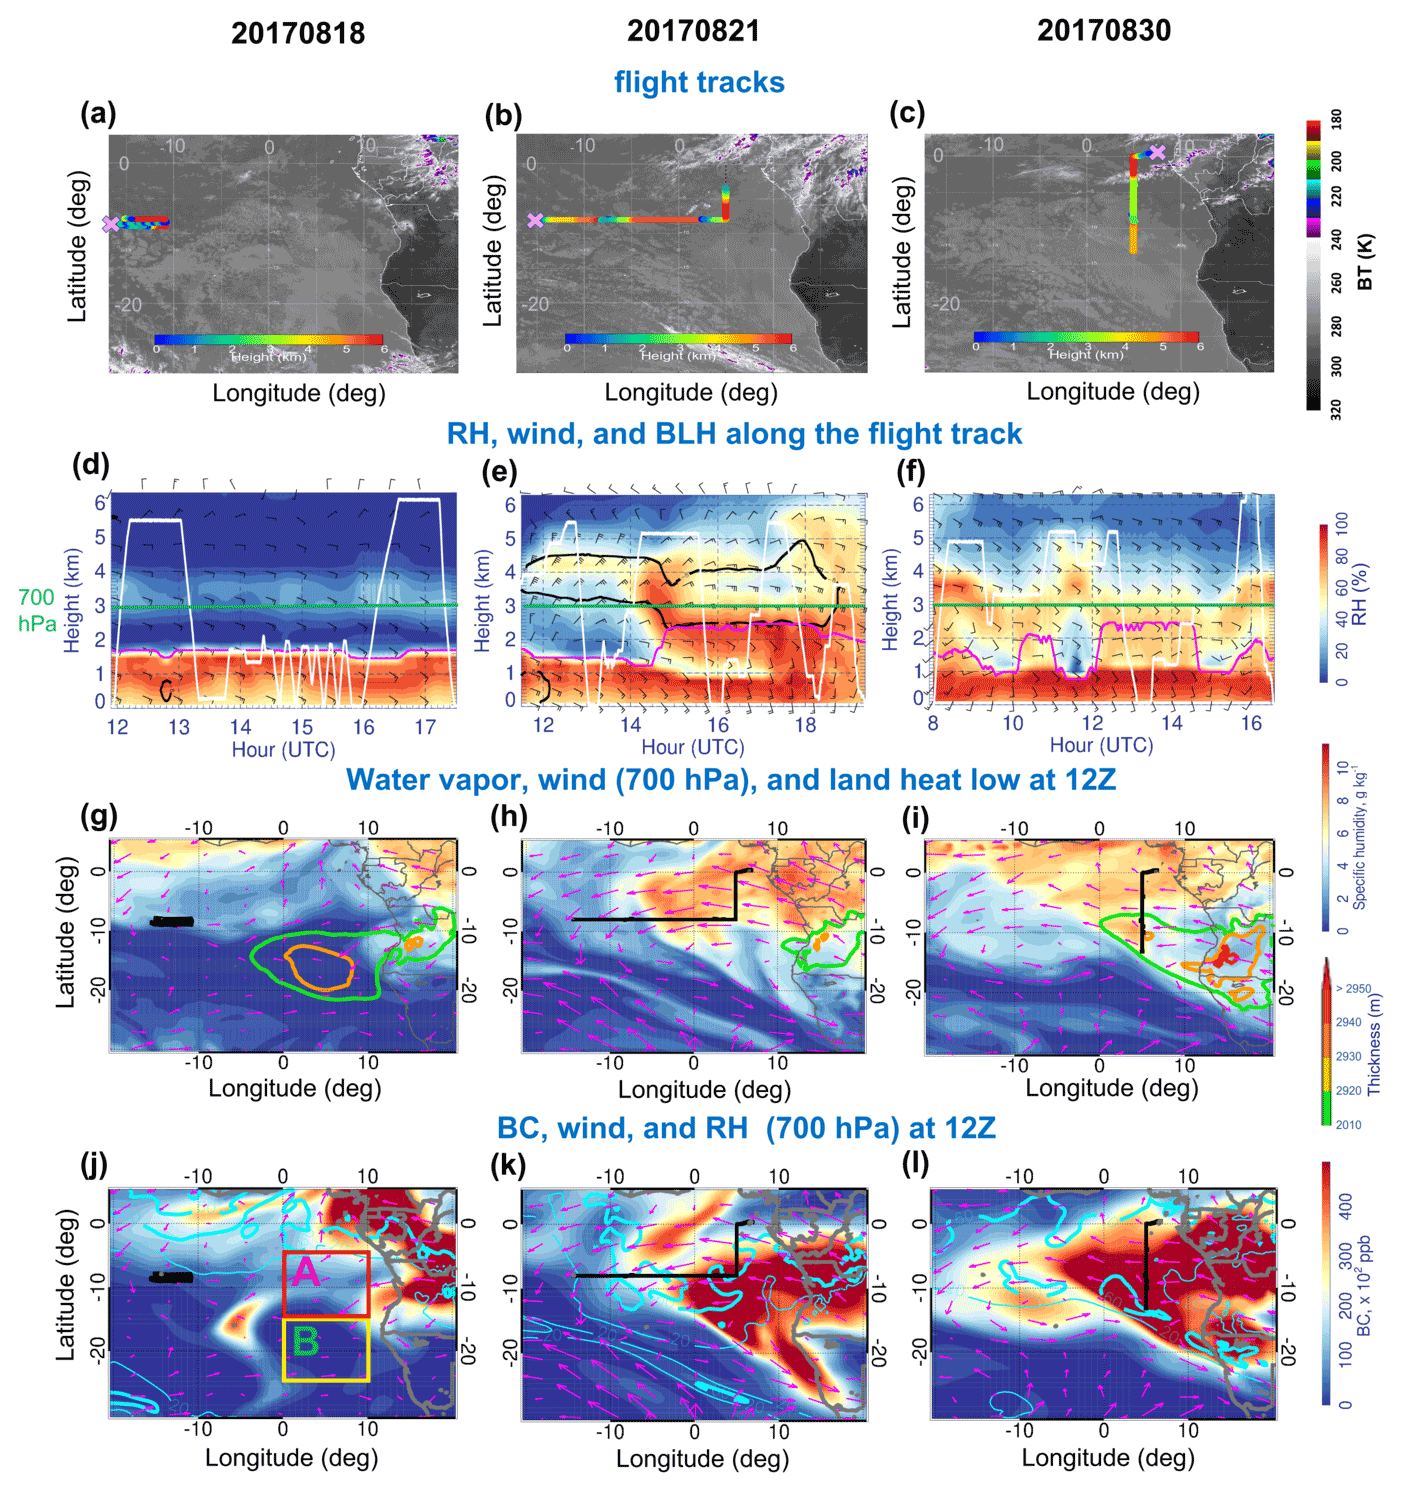
Figure 8(a–c) The horizontal flight tracks during the August 2017 ORACLES deployment plotted on Meteosat IR 10.8 µm imagery at 13:45 UTC (shading is the brightness temperature (BT); K). The color of the flight track represents the altitude of the P-3 flight along the horizontal flight track. (d–f) Curtain plot of RH along the P-3 flight track during 18, 21, and 30 August 2016. The white contour represents the flight profile. The magenta line in panels (d)–(f) represents the BLH along the flight track. Bold black contours in panels (d)–(f) are zonal winds (−8 m s−1). The green line in panels (d)–(f) indicates the 700 hPa level. (g–i) Map of 700 hPa q (color shading; g kg−1) and 700 hPa horizontal winds (vectors; m s−1) overlaid by thickness (thickness is the geopotential height (Z) difference between 600 and 850 hPa; color line contour; high values (>2920 m) over land represent the heat low) at 12:00 UTC on 18, 21, and 30 August 2017, respectively. (j–l) Map of 700 hPa BC (shading; ppb ×100) overlaid by 700 hPa RH (thick cyan line is 60; thin cyan line is 20; %) and 700 hPa horizontal winds (vectors; m s−1) at 12:00 UTC 18, 21, and 30 August 2017. The black line in panels (g)–(l) represents the horizontal flight track on the given day. The magenta (yellow) box in panel (j) refers to region A at 0–10∘ E, 5–15∘ S (region B at 0–10∘ E, 15–25∘ S).
The flight tracks with their altitudes and RH superimposed for three August 2017 flights are shown in Fig. 8. The 18 August 2017 flight was coordinated with one from the CLARIFY (Haywood et al., 2021) campaign out of Ascension Island. The 21 August 2017 flight was a transit flight from Ascension Island back to São Tomé. The 30 August 2017 routine flight went along 5∘ E south to about 13∘ S and back. These flight days possess unique and interesting meteorological characteristics that help interpret the monthly evolution.
The remote atmosphere sampled on 18 August 2017 near Ascension Island was dry (RH <40 %) above ∼5 kft (∼ 1.5 km), with the flight back to São Tomé on 21 August encountering an abrupt change to a moister free troposphere at ∼7∘ W (Fig. 8e). This moisture tongue is tied to northeasterly wind advection from moist convection occurring mostly from the north of 5–10∘ S (Fig. 8b and e). The north–south flight along 5∘ E on 30 August 2017 sampled moist conditions more consistently (Fig. 8e and f). Contrary to the relatively uniform BLH on 18 August 2017 (mainly due to the long duration of the flight over the same location), the BLH on 21 and 30 August 2017 varies, with alternatively dry (RH <40 %) and moist (RH >60 %) boundary layers. The AEJ-S on 21 and 30 August 2017 is strong, penetrating further west (Fig. 8e and f). The BC aerosol is also modulated by the intensity and horizontal extent of zonal wind (e.g., AEJ-S) around 700 hPa around 5–7∘ S, with some recirculated back around the anticyclone to the continents (Fig. 8j–l).
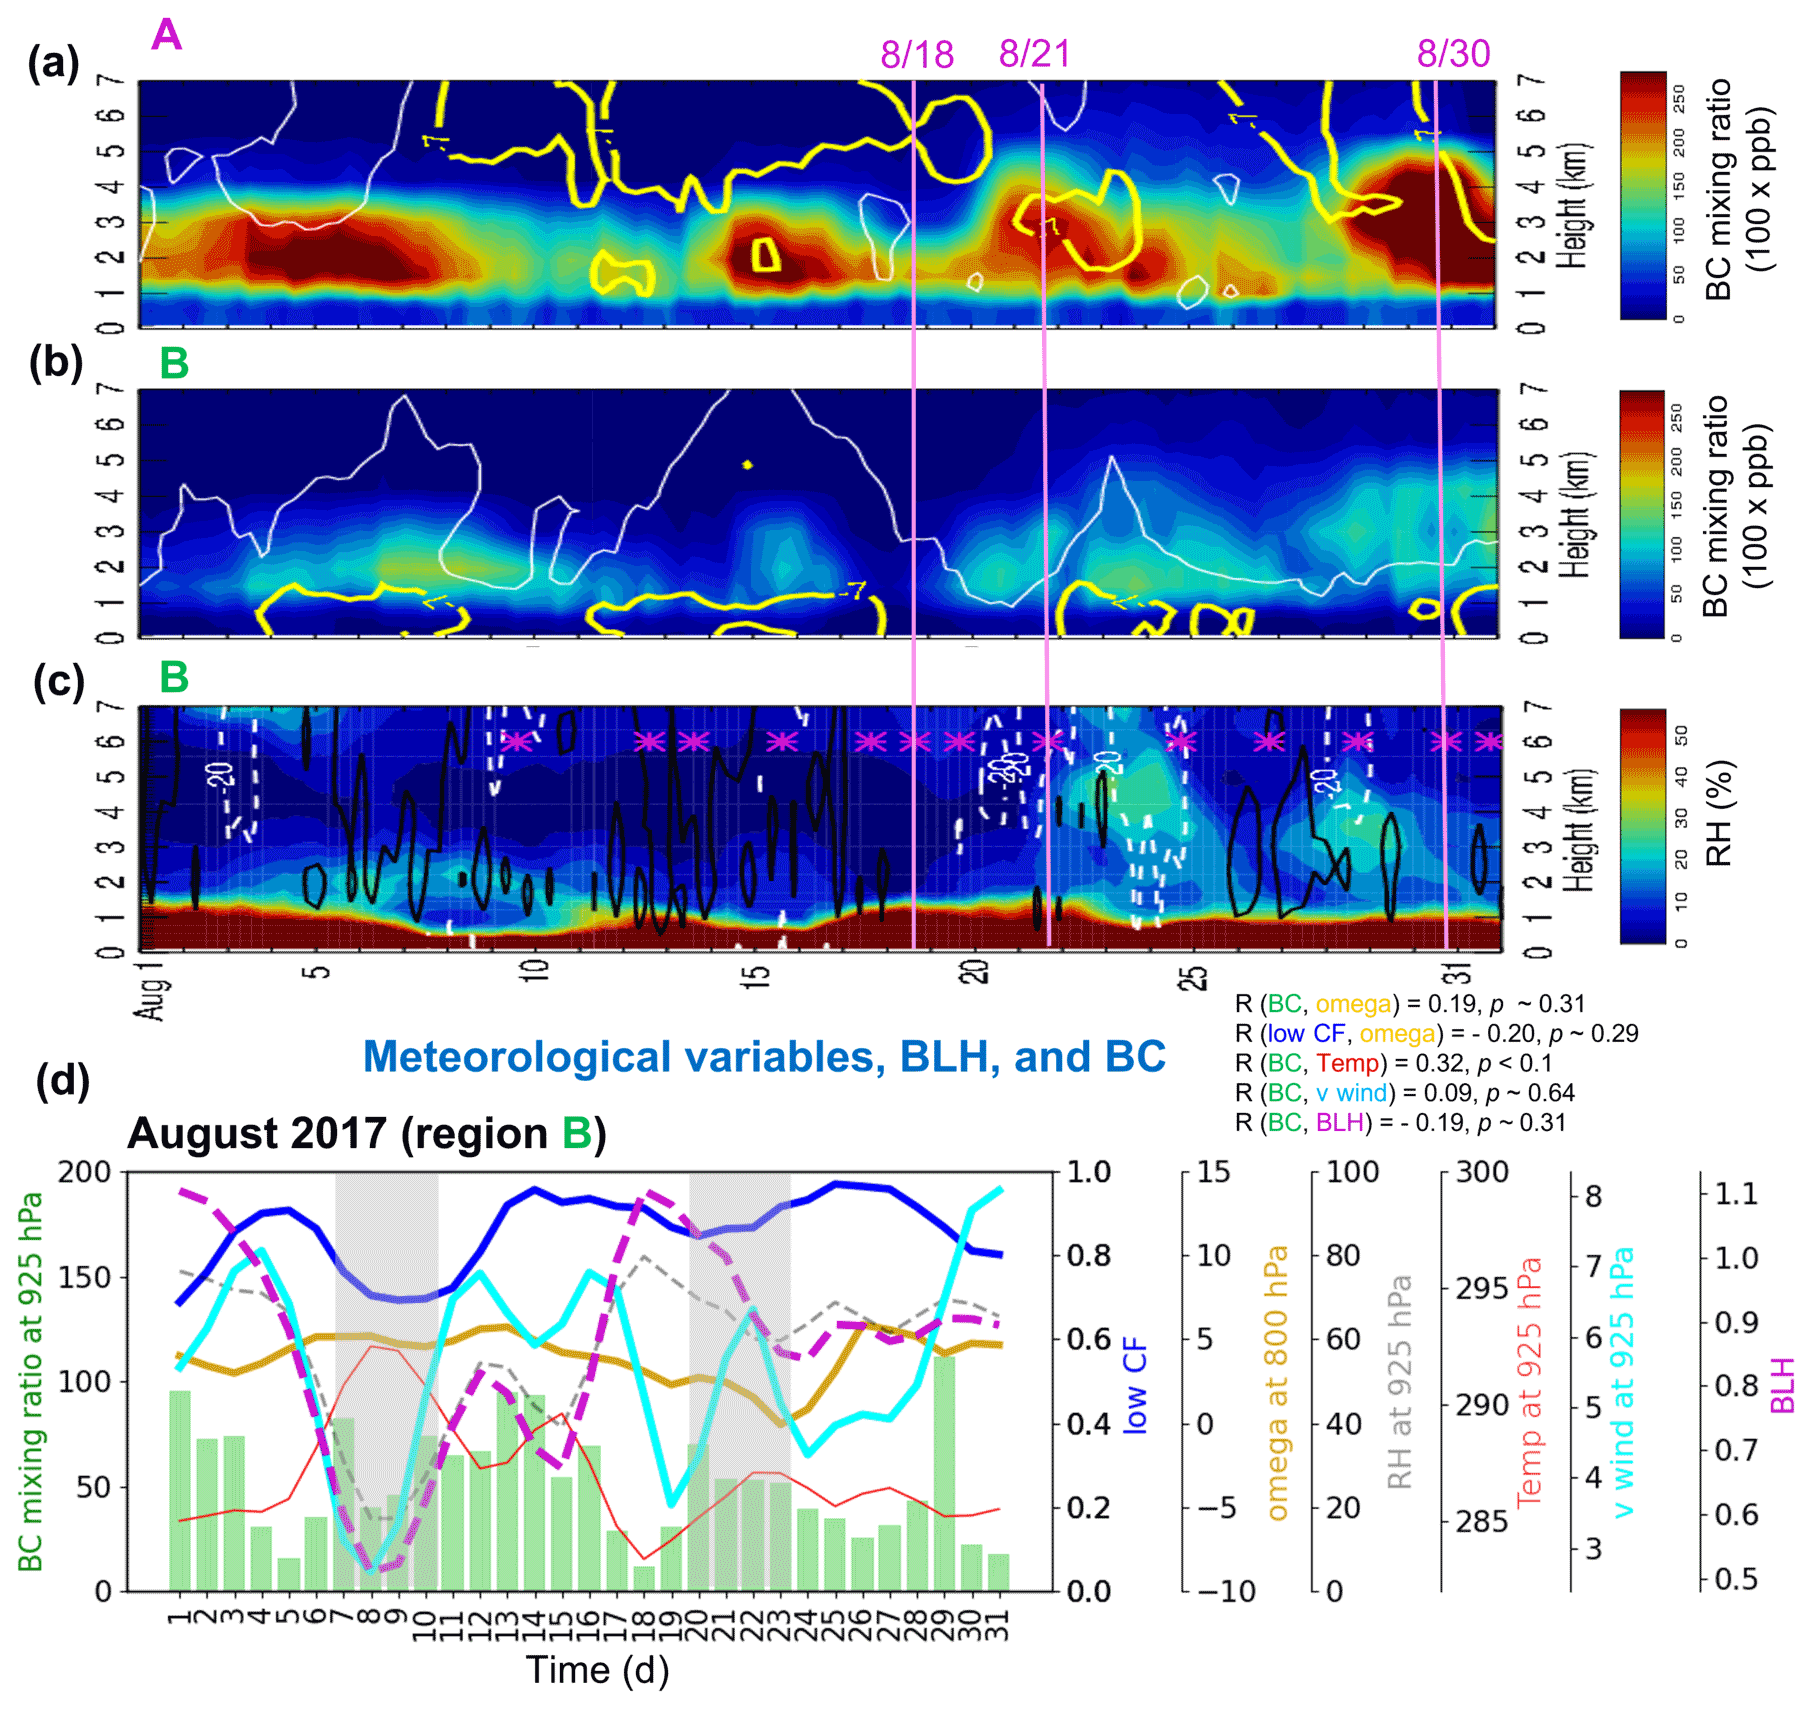
Figure 9(a–b) Time–altitude cross section of every 6 h BC (shading; ppb ×100) overlaid by zonal wind isotachs at −7 and 0 m s−1 (thick yellow and thin white lines, respectively) averaged over (a) region A (0–10∘ E, 5–15∘ S) and (b) region B (0–10∘ E, 15–25∘ S) in August 2017 for every 6 h. (c) The same as panel (b) but for every 6 h RH (shading; %) overlaid by 6 h vertical velocities of −20 and 50 hPa d−1 (dashed white and solid black lines, respectively; positive values represent subsidence) averaged over region B. (d) Time series of daily mean 925 hPa BC (green bar; ppb ×100), 800 hPa vertical velocity (omega; ω; gold line; hPa d−1), 925 hPa RH (dashed gray line; %), 925 hPa temperature (solid red line; K), 925 hPa meridional wind (solid cyan line; m s−1), BLH (dashed magenta line; km), and low CF (blue line) over region B. Each color line represents the 3 d running mean. The asterisk in panel (c) represents the August 2017 flight days. The pink solid lines in panels (a)–(c) refer to the 3 flight days. The light gray shadings in panel (d) represent the two periods having different BC–RH conditions. R in panel (d) refers to the Pearson correlation coefficient between two variables in parenthesis with its statistical significance (p value).
Figure 9 illustrates that most of the BC is located between 2–3 km, increasing in altitude towards the end of August 2017. The BC altitude is generally lower than that in September (compare Figs. 9a and 4a), consistent with a lower AEJ-S core in August compared with September (Fig. 9a and b). BC and RH in the mid-troposphere (∼3–4 km) covary over region B after 20 August 2017. Interestingly, the moisture can extend higher in altitude than the BC within the ERA5/CAMS reanalysis. Boundary layer BC aerosols are slightly more abundant in August 2017 compared to September 2016 (Figs. 4d, 9d), and the smoky boundary layer is well observed near Ascension Island in August 2017 (Zhang and Zuidema, 2019; Pennypacker et al., 2020). The boundary layer BC mixing ratio is higher over region A than region B (Figs. 8h, 9a–b).
Clear relationships exist between low CF and the boundary BC–temperature–RH for a few cases (e.g., 7–9 and 17–19 August 2017), but in general, there is no clear statistically significant correlation. AEJ-S is also less associated with LLJ in August (Fig. S5). Mean subsidence in August 2017 is slightly weaker than in September 2016, and the correlation between subsidence and low CF is insignificant at the daily timescale (Fig. 9d), consistent with De Szoeke et al. (2016) and Adebiyi and Zuidema (2018).
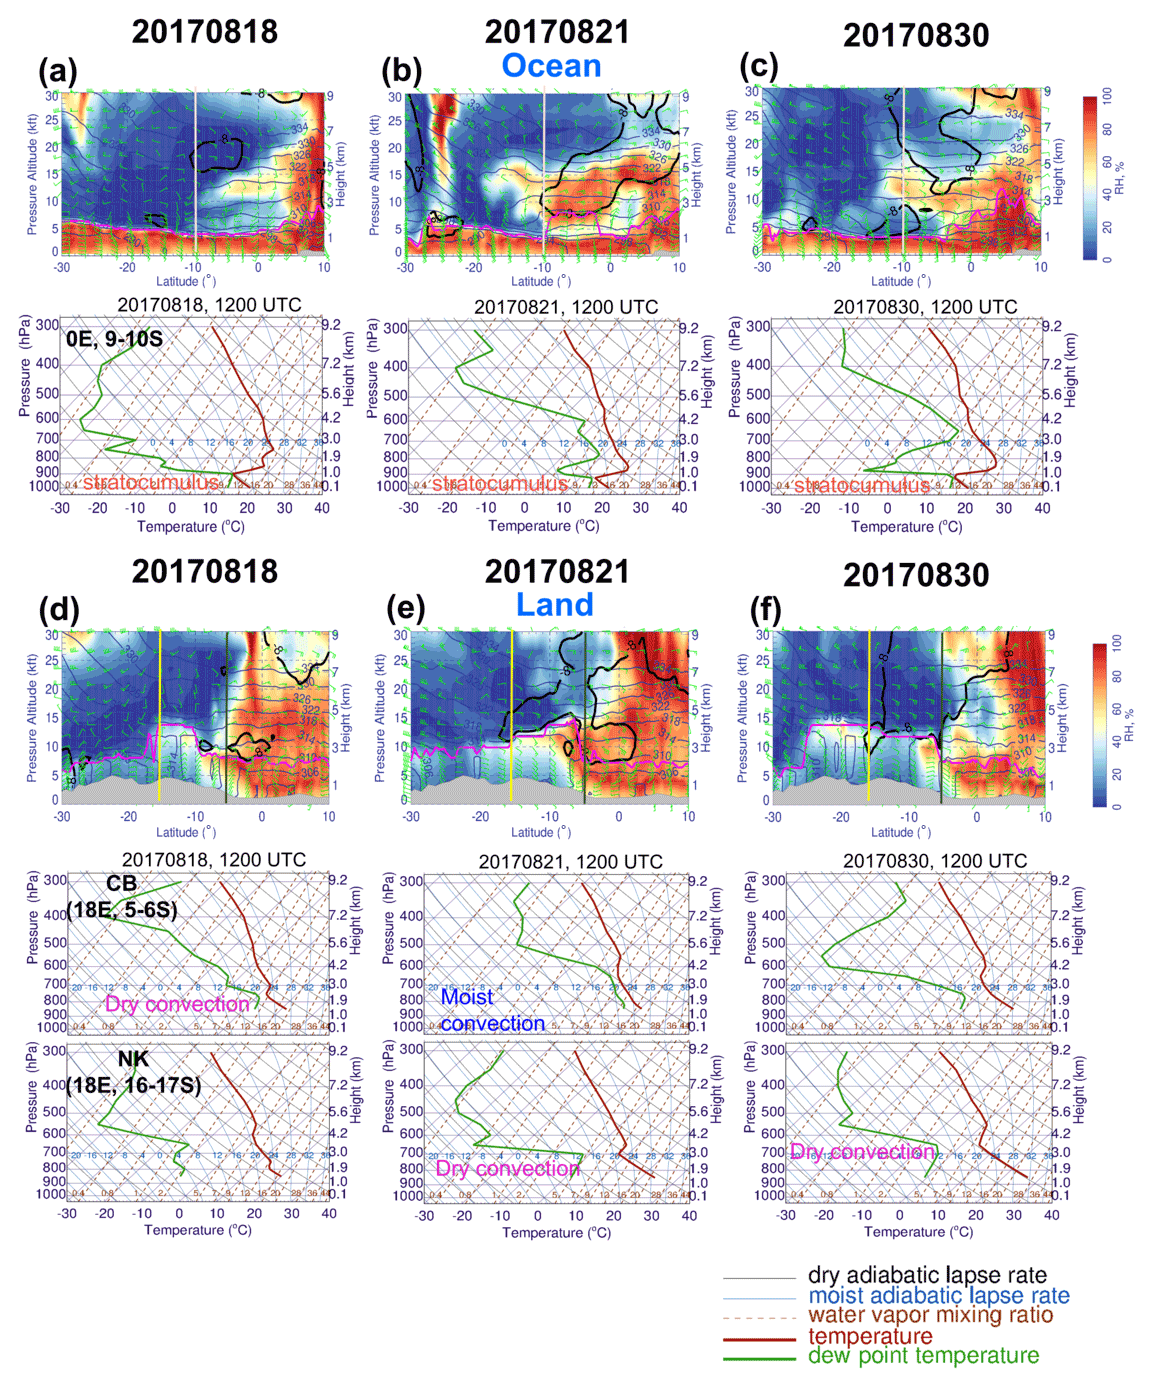
Figure 10(a–c) Ocean, with a latitudinal cross section of RH (shading; %), horizontal winds (wind barbs; green; m s−1), θ (navy; K), and BLH (magenta; m) at 0∘ E (top plot), and a Skew-T log-P diagram averaged over 0∘ E and 9–10∘ S (bottom plot, from the left) at 12:00 UTC on 18, 21, and 30 August 2017. Bold black contours are the zonal wind (−8 m s−1). (d–f) Land, which is the same as in panels (a)–(c), except for the cross section at 18∘ E and Skew-T log-P diagram averaged over 18∘ E and 5–6∘ S (CB is the Congo basin) and 18∘ E and 16–17∘ S (NK is the Namibian–Kalahari dryland). The gray-filled area represents the topography. The vertical lines in the cross-sectioned plots refer to the latitude we examine.
Figure 10 communicates the vertical structure of the moisture during the three flights highlighted in Fig. 8. High humidity levels (RH >60 %) remain confined over the continents on 18 August 2017 (Fig. 10a). After 18 August 2017, moisture began to advect off of the continent at 700 hPa (Fig. 10b). Both moist and dry convection over land were more effective at moistening the mid-levels (700–600 hPa) on 21 and 30 August 2017, after the AEJ-S became active, than on 18 August 2017.
The cross sections show that the horizontal temperature gradient over land is weak, as expected for the tropics (Fig. 10a). Note that the moisture at all levels does not extend as far south as in September. Over the land, the temperature inversion layer sits above the unsaturated, dry layer over the land, and the dew point temperature follows a constant water vapor mixing ratio (21, 30 August in the bottom panels of Fig. 10e and f), confirming that dry convection occurs after 20 August 2017. Considering conditions were uniformly dry before 20 August, neither dry nor moist convection was likely to be initiated in August 2017 over the Kalahari dryland (NK at 18∘ E, 16–17∘ S). Here the surface temperature increases consistently from 18 to 30 August, and the dry convective layer deepens (Fig. 10d–f). This transports more moisture upward, south of 10∘ S, into the 850–600 hPa altitude range. Over the Congo basin (CB at 18∘ E, 5–6∘ S), the depth of the relatively moist near-surface layer is highest on 21 August and highly variable between the three soundings. Unlike September 2016, CAPE is generally low. This is consistent with the lower rainfall in that month as compared to September. Note that we see an increase in surface dew points from 18 to 21 August over land, which can help increase the RH in dry convection regions at 700 hPa and along the flight track in August 2017.
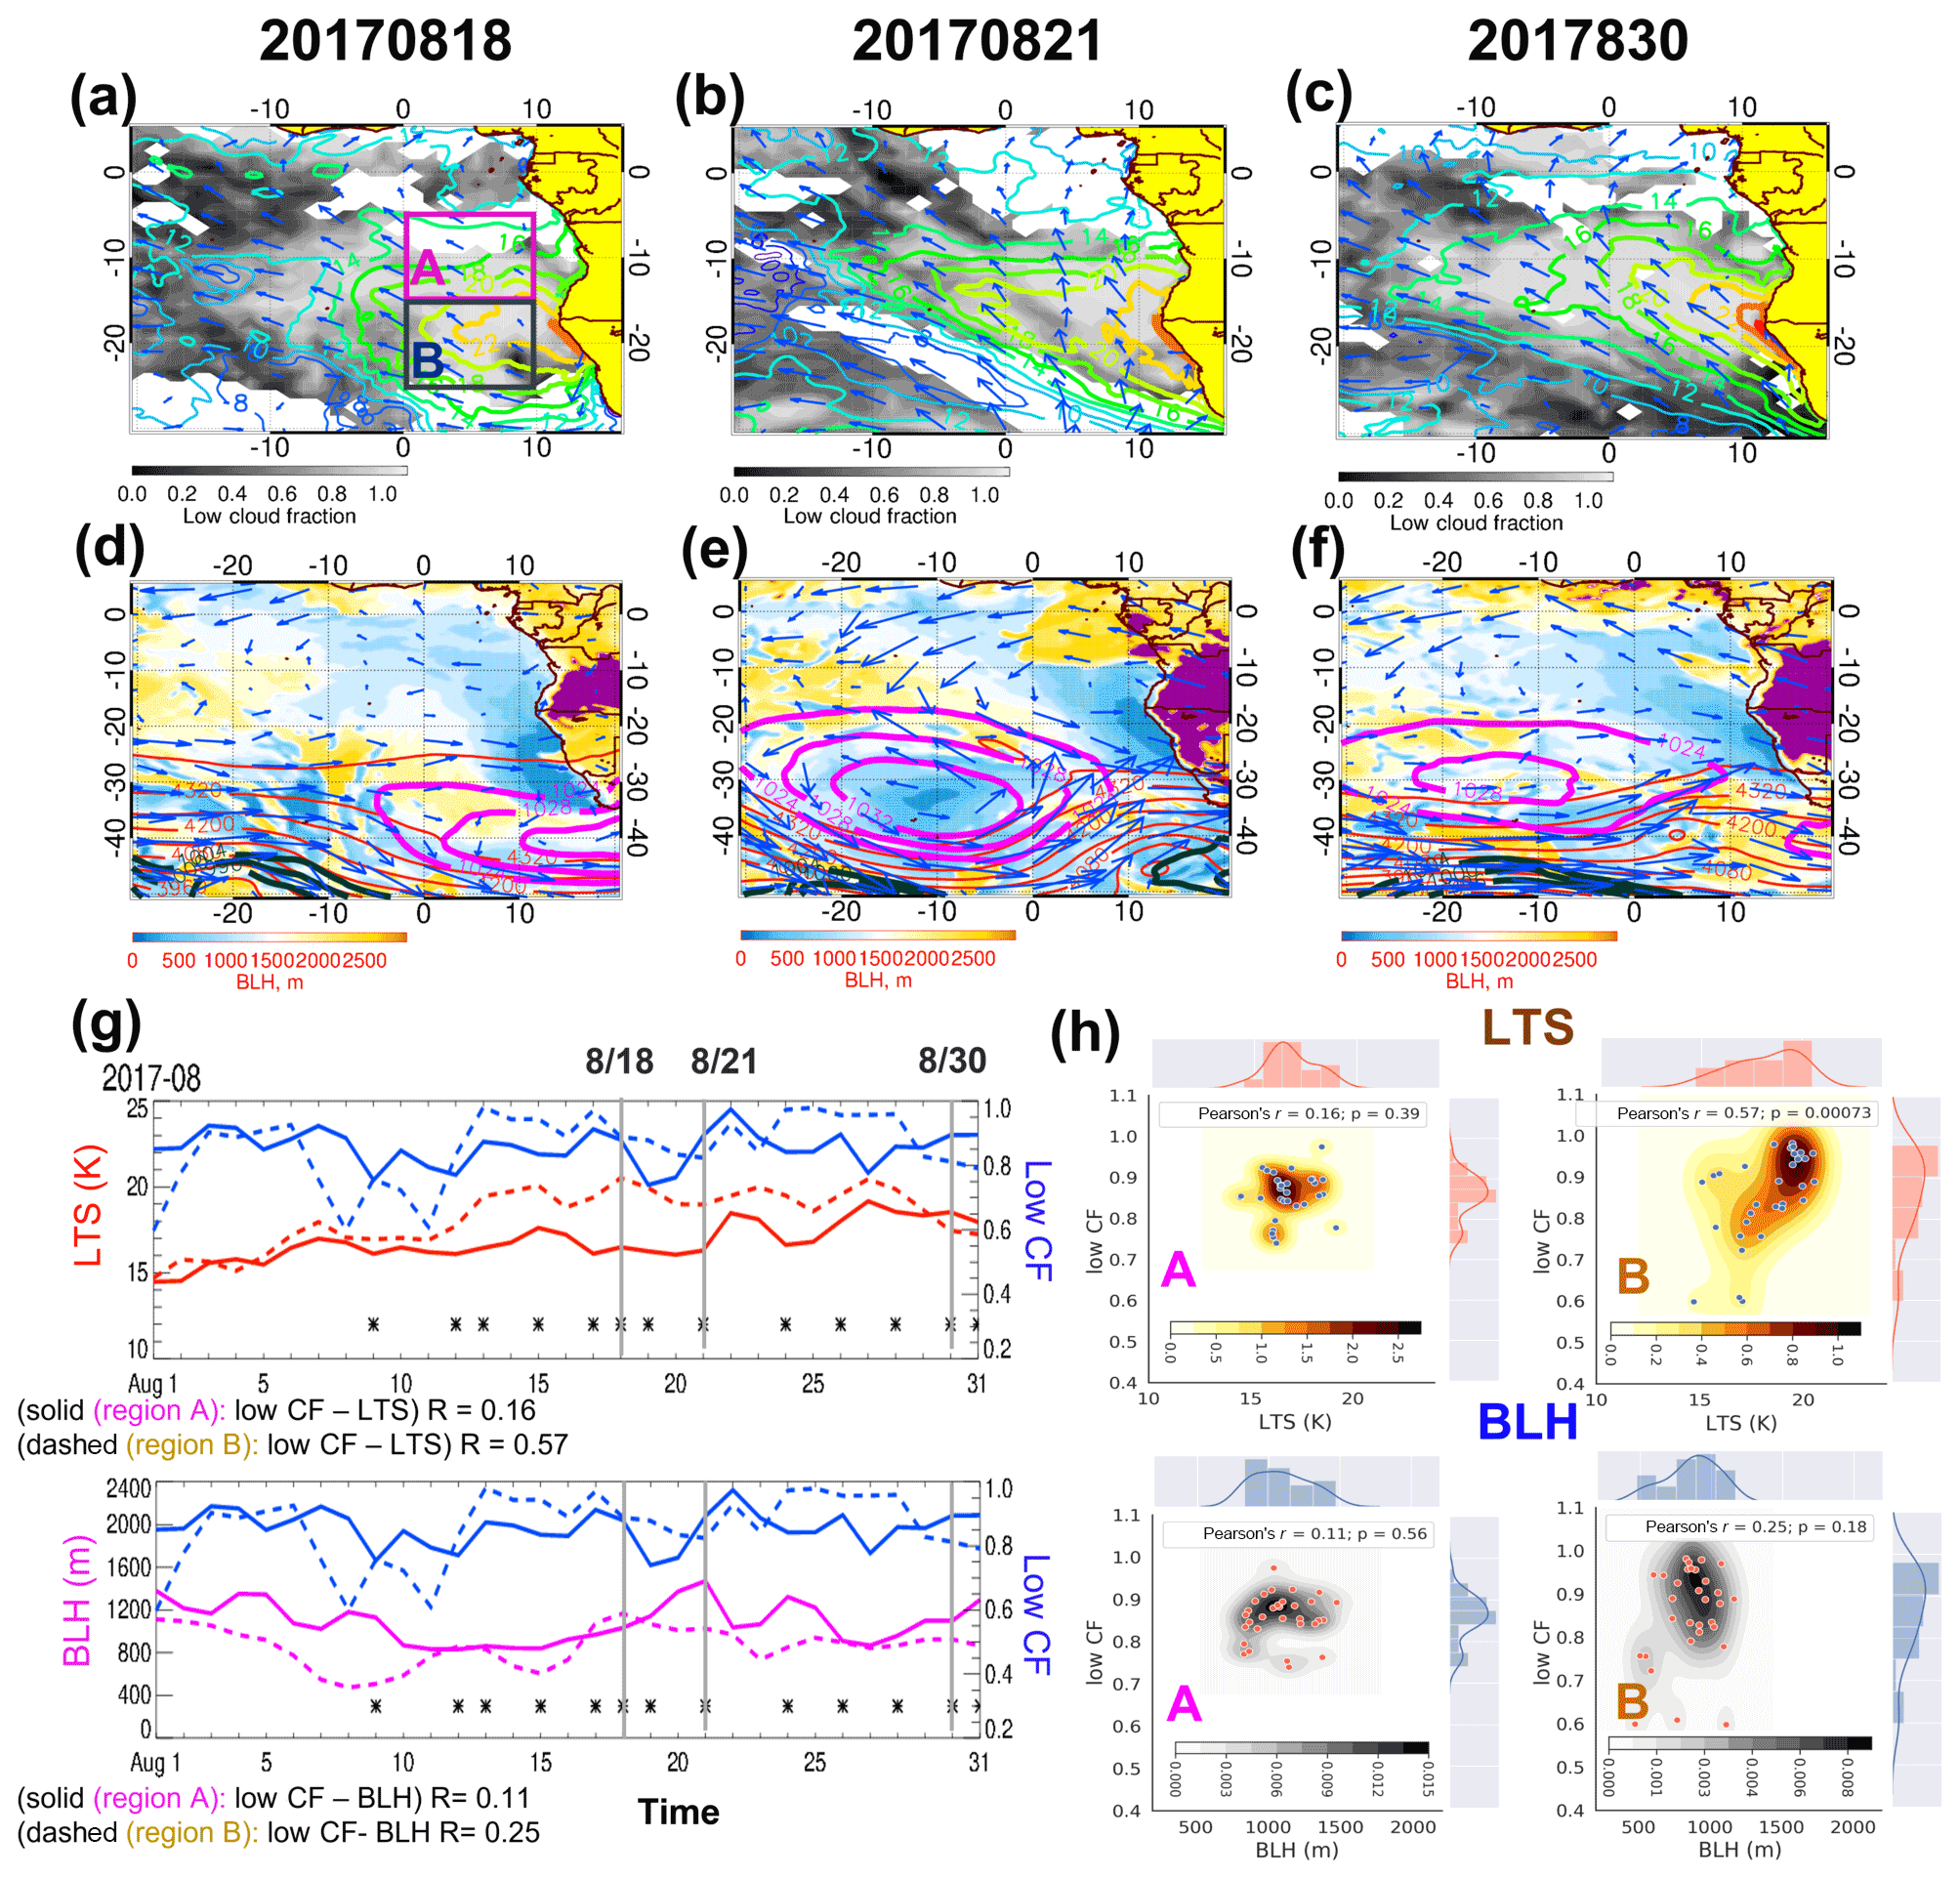
Figure 11Map of (a–c) daily mean low CF (shading) overlaid by LTS (contour; K) and 925 hPa horizontal winds (vectors; m s−1), (d–f) BLH (shading; m) overlaid by 600 hPa horizontal winds (vectors; m s−1), 600 hPa geopotential height (red lines; m), and sea level pressure (SLP; in lines dark green for low pressure at 996, 1000, and 1004 and magenta for high pressure at 1024, 1028, and 1032; hPa) at 12:00 UTC on 18, 21, and 30 August 2017. (g) The top plot shows the time series of daily mean low CF (blue lines) and daily mean LTS (red lines; K), and the bottom plot shows the daily mean low CF (blue lines) and daily mean BLH (magenta lines; m) averaged over region A at 0–10∘ E, 5–15∘ S (solid lines) and region B at 0–10∘ E, 15–25∘ S (dashed lines) during August 2017. All flight days (18, 21, and 30 August 2017) are marked by an asterisk (gray vertical lines). The purple shading over land in panels (d)–(f) refers to BLH higher than 3250 m. (h) The 2-D joint pdf (shading) with a scatterplot are shown with 1-D histogram (pdf in line) of (top) daily mean low CF and LTS and (bottom) daily mean low CF and BLH over region A (left) and region B (right) during August 2017. The solid line in panel (a) indicates region A (magenta box) and region B (navy box), respectively. The Pearson's r in panel (h) refers to Pearson correlation coefficient with its statistical significance (p value).
During August 2017, low CF is also positively correlated with LTS, the strongest in region B, with a similar correlation coefficient as in September 2016 (R∼0.57; top panel of Fig. 11g). The BLH tends to be higher over the open ocean (10–40∘ W, 10–40∘ S) and land than near the west coast of Africa (Fig. 11d–f). The mid-latitude jets are very strong but remain mostly confined south of 30∘ S. The mid-latitude frontal system nevertheless influences the local circulation, enhancing SE Atlantic anticyclones on the west and cyclones on the east of a mid-level trough, leading to cloud clearing on 18 August 2017 (Fig. 11a and d) and 21 August 2017 (Fig. 11b and e). The increased low CF is weakly associated with the low BLH (e.g., 22 August 2017 in Fig. 11g), and low CF is almost larger than 0.8, rendering poor correlations to meteorological variations. The distributions of LTS, BLH, and low CF differ over regions A and B (Fig. 11h), particularly with tight relation between LTS and low CF over region B.
The LTS is generally lower in August than in September over both regions, implying that the atmosphere is less stable in August, with LTS increasing as the month progresses. The decreased atmospheric stability may reflect the influence of the mid-latitude frontal system, especially in region B, where recurrent cloud clearing by local pressure and wind patterns are associated with the intensified mid-latitude frontal systems. The mid-level flow and SLP patterns for all August 2017 flight days are provided in Fig. S14.
3.3 Deployment year 3 (São Tomè, October 2018)
The final deployment of ORACLES also occurred in São Tomé (0.34∘ N, 6.73∘ E) in October 2018. The equatorial deep convective band moves south in October (Adebiyi et al., 2015), and biomass burning is substantially less (Redemann et al., 2021; Zhang and Zuidema, 2021). Thus, despite a pronounced Kalahari heat low supporting strong free tropospheric easterlies to its north, less BC is ultimately advected westwards. Continental convective systems migrate southward from 5∘ S, and mid-latitude frontal systems also assist the transition to austral summer. The AEJ-S was slightly weaker compared to the climatological mean, as were the LLJ and the southern Atlantic anticyclone (Ryoo et al., 2021), especially as the month progressed; the strength of the AEJ-S and heat low over land exceeded the September values from early to mid-October but weakened by late October 2018 (Figs. 12, S11, and S12). The monthly mean low CF is not much lower than the climatological mean, despite a warmer-than-climatology SST. The low CF is the largest of all deployment months, with more mid-tropospheric moisture potentially reducing entrainment drying from above (Zhang and Zuidema, 2021). The characteristics of synoptic-scale and convective features during the flight days in October 2018 deployment are summarized in Table 3.
Table 3Characteristics of synoptic-scale features over SE Atlantic during the October 2018 deployment. The P-3 flights were available in October 2018. MFS represents the mid-latitude frontal system affecting the flight region on that day (× sign represents no effect).


Figure 12Longitude–time cross section of every 6 h of (a) 600 hPa RH (%), (b) 600 hPa BC aerosol (shading; ppb ×100), and (c) thickness (geopotential height difference of 600–850 hPa; high values over a southern African plateau represents the heat low; m) averaged over 8–10∘ S during October 2018. Panels (a)–(c) are overlaid by 600 hPa zonal wind isotach (yellow line; −7 m s−1). (d–e) Altitude–time cross section of zonal wind and RH at 10∘ S, averaged over 0–10∘ E during October 2018. The black contour in panel (d) represents the zero value. (f) Daily time series of the 600 hPa zonal wind (red line; m s−1), 600 hPa RH (blue line; %), 600 hPa BC (green line; ppb ×100) averaged over 8–10∘ S and 0–10∘ E. The dashed white lines indicate the flight days investigated further in this study, and the magenta asterisks (and numbers in panel f) represent the flight days during the October 2018 deployment.
Figure 12 shows the 6 h time series as a function of longitude averaged over the 8–10∘ S latitude band (i.e., Hovmöller diagram) of RH, BC, and zonal wind at 600 hPa and the heat low during October 2018. BC is also well modulated by AEJ-S, but its magnitude decreases significantly by the end of October when the biomass burning season tapers off amidst increasing RH indicative of southward-moving convection (Fig. 12a and b). After the easterlies weaken, the BC aerosol outflow reduces (e.g., 7–14 October and after 26 October; Fig. 12a, b, f). The modulation of the AEJ-S by the heat low is clear, similar to the other deployments (Figs. 2 and 7). The AEJ-S leads to high RH by 1–2 d, indicating that AEJ-S can transport elevated moisture from land to the ocean (Figs. 12f and S6).
This flow changes dramatically as the month progresses, however. From 1–22 October 2018, high RH is propagated over the ocean by a strong AEJ-S. By 23–28 October 2018, RH remains high over the continent, but does not propagate westward, because the mid-tropospheric winds are weak (Fig. 12e and f). The low-level easterly winds are also weak (Fig. 12d).
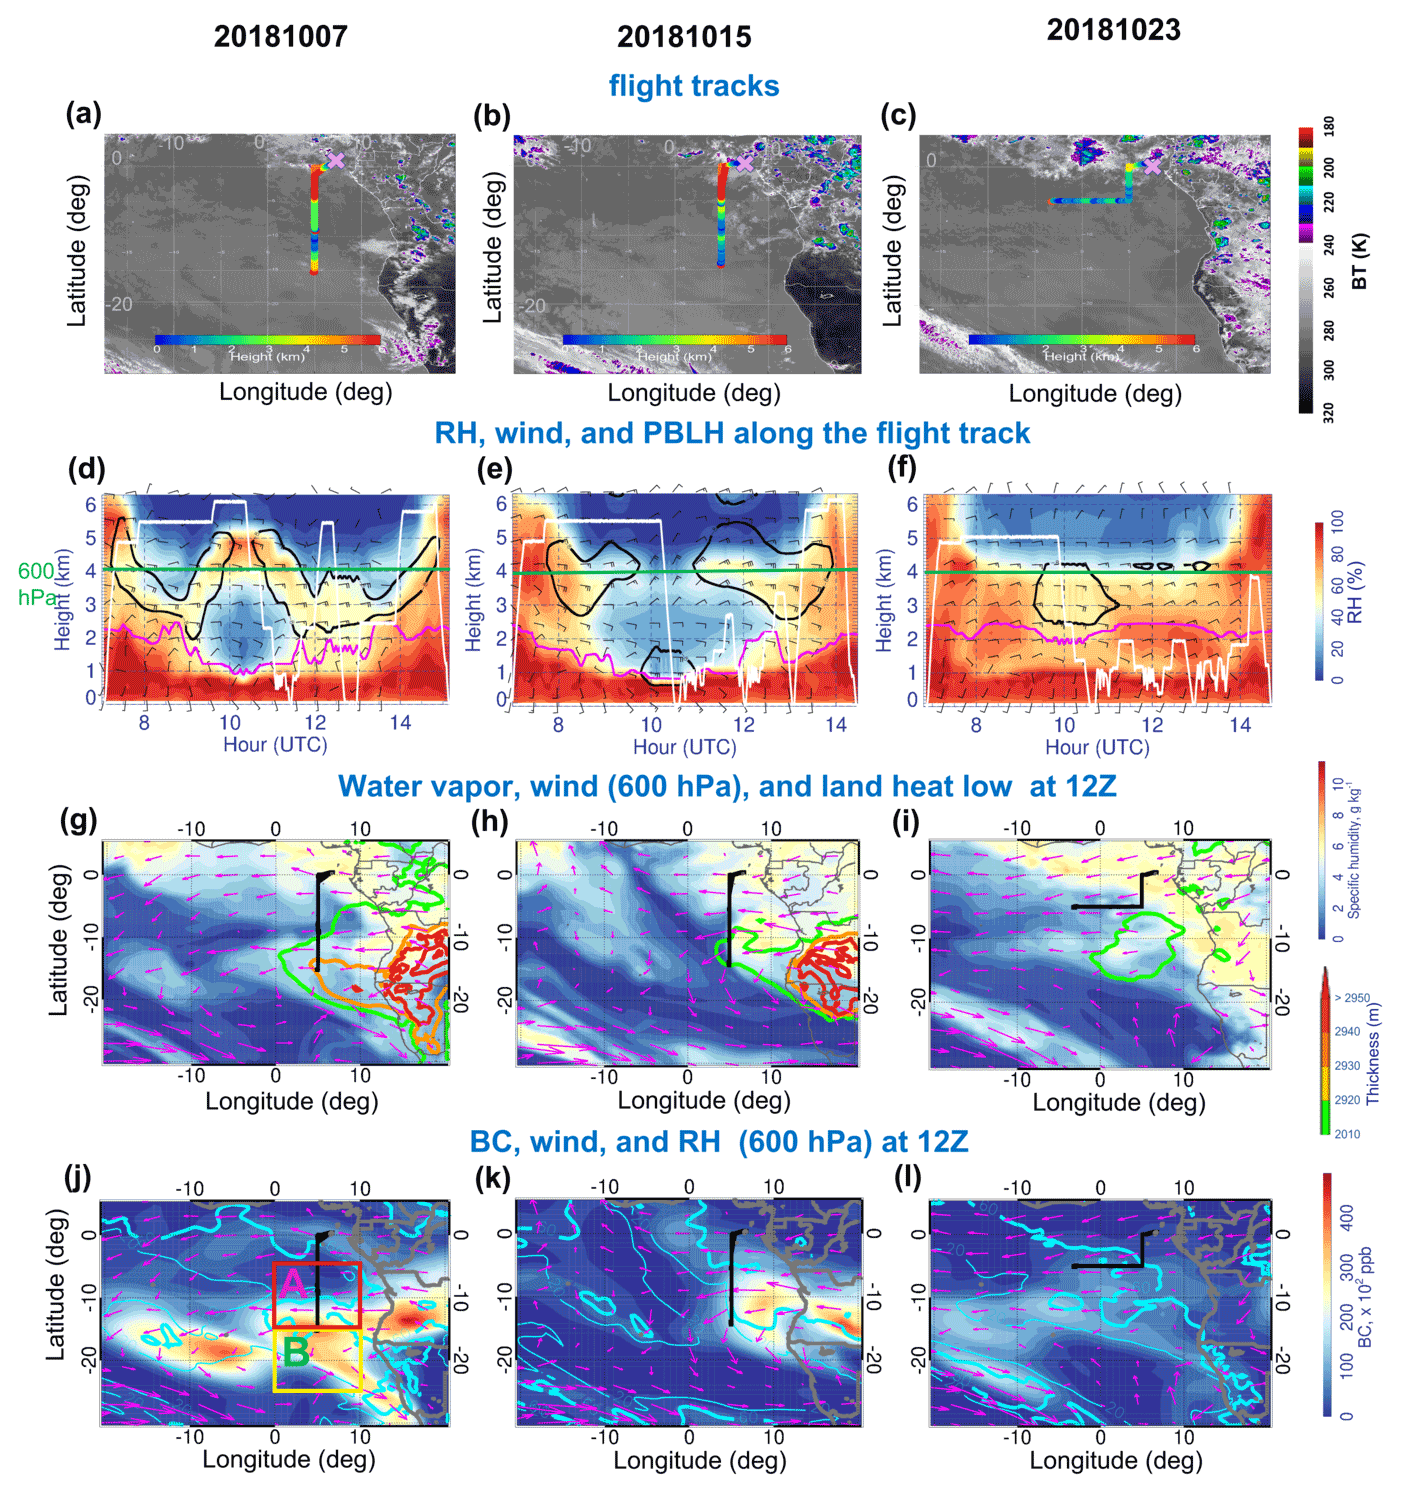
Figure 13(a–c) The horizontal flight tracks during October 2018 ORACLES deployment plotted on Meteosat IR 10.8 µm imagery at 13:45 UTC (shading is the brightness temperature (BT); K). The color of the flight track represents the altitude of the flight along the horizontal flight track. (d–f) Curtain plot of RH along the flight track during 7, 15, and 23 October 2018. The white contour represents the flight profile. The magenta line in panels (d)–(f) represents the BLH along the P-3 flight track. Bold black contours in panels (d)–(f) are zonal wind (−8 m s−1). The green line in panels (d)–(f) indicates the 600 hPa level. (g–i) Map of 600 hPa q (color shading; g kg−1) and 600 hPa horizontal winds (vectors; m s−1) overlaid by heat low (thickness is the geopotential height (Z) difference between 600 and 850 hPa; color line contour; high values (>2920 m) over land represent the heat low) at 12:00 UTC on 7, 15, and 23 October 2018, respectively. (j–l) Map of 600 hPa BC (shading; ppb ×100) overlaid by 600 hPa RH (thick cyan line is 60; thin cyan line is 20; %) and 600 hPa horizontal winds (vectors; m s−1) at 12:00 UTC on 7, 15, and 23 October 2018. The black line in panels (g)–(l) represents the horizontal flight track on the given day. The magenta (yellow) box in panel (j) refers to region A at 0–10∘ E, 5–15∘ S (region B at 0–10∘ E, 15–25∘ S).
Satellite imagery further indicates that substantial deep convection (brightness temperatures <230 K) develops over the continent north of 10∘ S, starting in mid-October 2018 and spreading southward to northern Namibia and Botswana by 23 October 2018 (Fig. 13a and c). Routine flights along 5∘ E occurred on 7 October 2018 to 15∘ S, and on 15 October 2018 to 14∘ S, with the 23 October 2018 survey flight going west along 5∘ S. Like the other deployment months, we chose three October flight cases based on their unique meteorological and aerosol features. RH exceeded 60 % for all three flights (Fig. 13f). Between 7 and 15 October 2018 (around 09:00–11:00 UTC; shown in Fig. 13d and e), a strong mid-level AEJ-S also advected moisture (RH >60 %), leading to moist (RH >60 %) conditions at ∼15 kft (∼4.5 km). Moist air is sampled along the flight track on 23 October 2018, along with an elevated marine BLH (Fig. 13c and f). The core latitude of the AEJ-S varies day by day.
The AEJ-S is strong on 7 and 15 October 2018 but weakens considerably around 10∘ S on 23 October 2018 (Fig. 13f). This could be tied to the collapse of the dome of warm, dry air over the southern African highlands and a breakdown of the 600 hPa anticyclone over southern Africa (Fig. 13i). This also led to weaker moisture transport to the ocean at the south of 10∘ S on 23 October 2018. Two possible causes are that (1) the mid-latitude waves associated with a strong upper-level disturbance influence the breakdown of the dome of hot dry air (Kuete et al., 2021) and that (2) convection reduces the temperature gradient by increasing high cloud cover over the region, limiting surface heating over the Kalahari–Namib dryland (Fig. 13c). The heat low reforms toward the end of the month (Fig. 13g–i). Different BC aerosol transport patterns are also observed in flight days in October 2018. The intensity of the horizontal transport of BC largely aligns with the strength of the AEJ-S and the recirculating flow (Fig. 13j–l). The extensive BC transport over the ocean is much more suppressed on 15 and 23 October than on 7 October 2018.
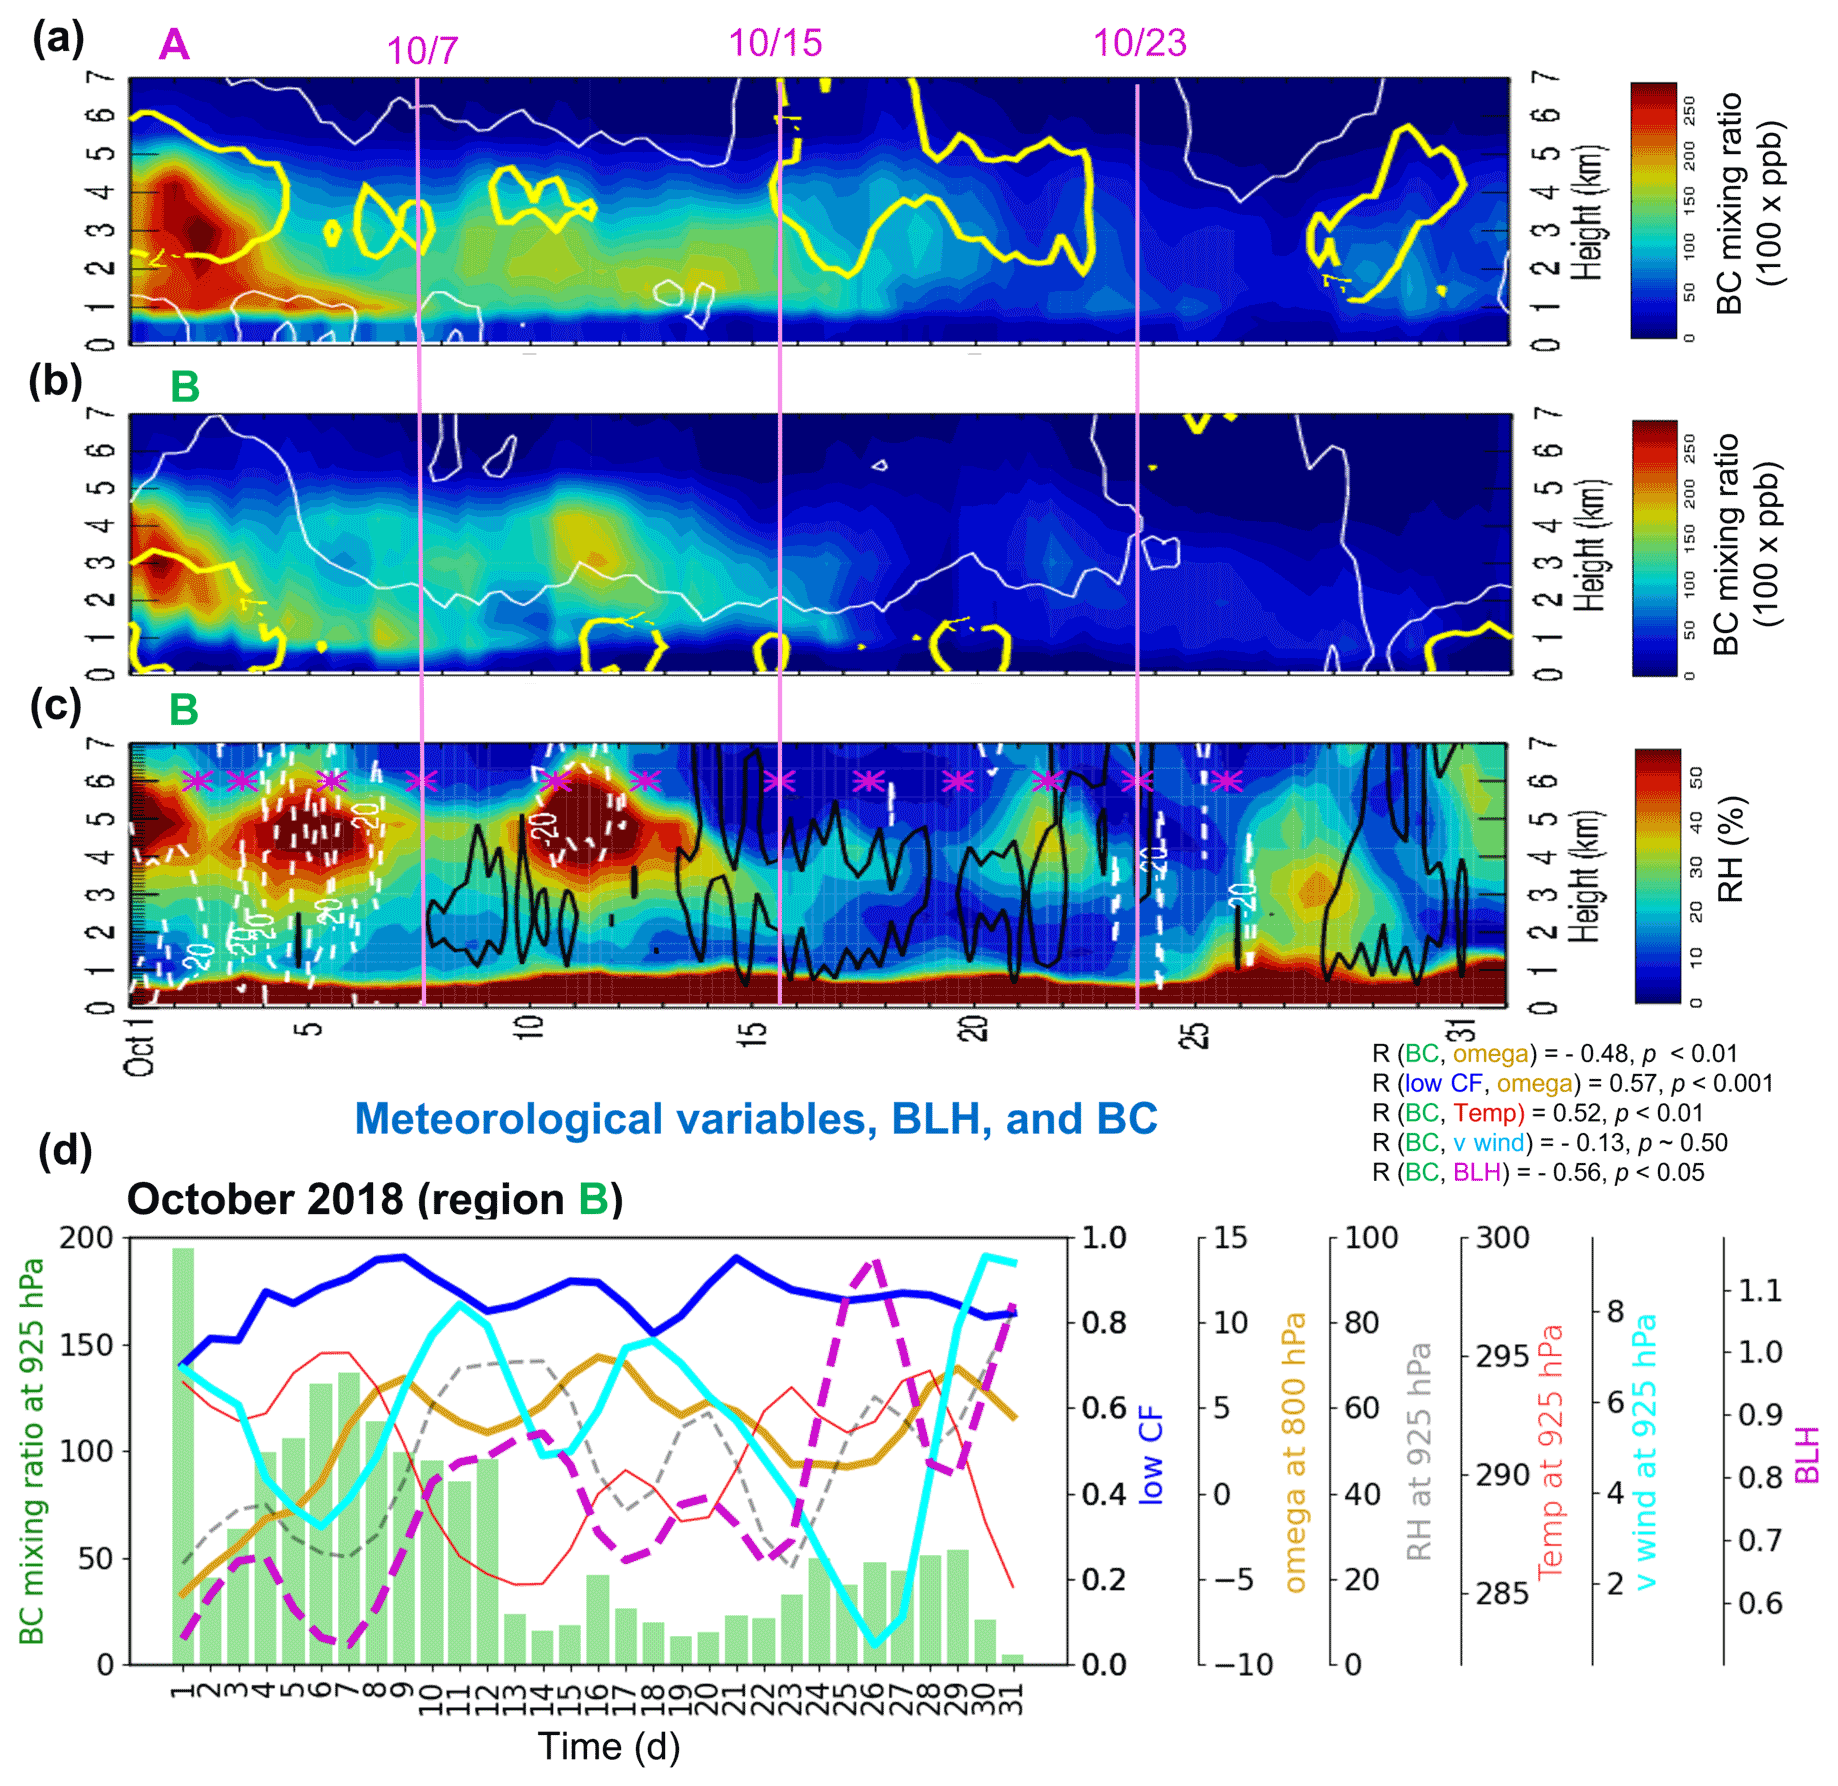
Figure 14(a, b) Time–altitude cross section of every 6 h of BC (shading; ppb ×100) overlaid by zonal wind isotachs at −7 and 0 m s−1 (thick yellow and thin white lines, respectively) averaged over (a) region A (0–10∘ E, 5–15∘ S) and (b) region B (0–10∘ E, 15–25∘ S) in October 2018 for every 6 h. (c) The same as panel (b) but for every 6 h of RH (shading; %) overlaid by vertical velocities of −20 and 50 hPa d−1 (dashed white and solid black lines, respectively; positive values represent subsidence) averaged over region B every 6 h. (d) Time series of daily mean 925 hPa BC (green bar; ppb ×100), 800 hPa vertical velocity (omega; ω; gold line, hPa d−1), 925 hPa RH (dashed gray line; %), 925 hPa temperature (solid red line; K), 925 hPa meridional wind (solid cyan line; m s−1), BLH (dashed magenta line; km), and low CF (blue line) over region B. Each color line represents 3 d running mean. The asterisk in panel (c) represents the October 2018 flight days. The pink solid lines in panels (a)–(c) refer to the 3 flight days. R in panel (d) refers to the Pearson correlation coefficient between two variables in parenthesis with its statistical significance (p value).
Figure 14 illustrates the time evolution of coupled BC aerosol–meteorological variables and how they relate to low CF in October 2018. The covariation between BC–RH in the mid-troposphere (3–4 km) is also observed in October 2018, with the RH increase extending higher in altitude than the BC. The aerosol loading decreases around mid-October 2018, while moisture variations continue; this was clearly shown when a frontal system passed by. An increased BC aerosol loading at 925 hPa correlates with an increased 925 hPa temperature up to 7 October (Fig. 14d). The subsidence–low CF relationship in October 2018 is somewhat different from that in September 2016 and August 2017 in that subsidence and low CF are positively correlated.
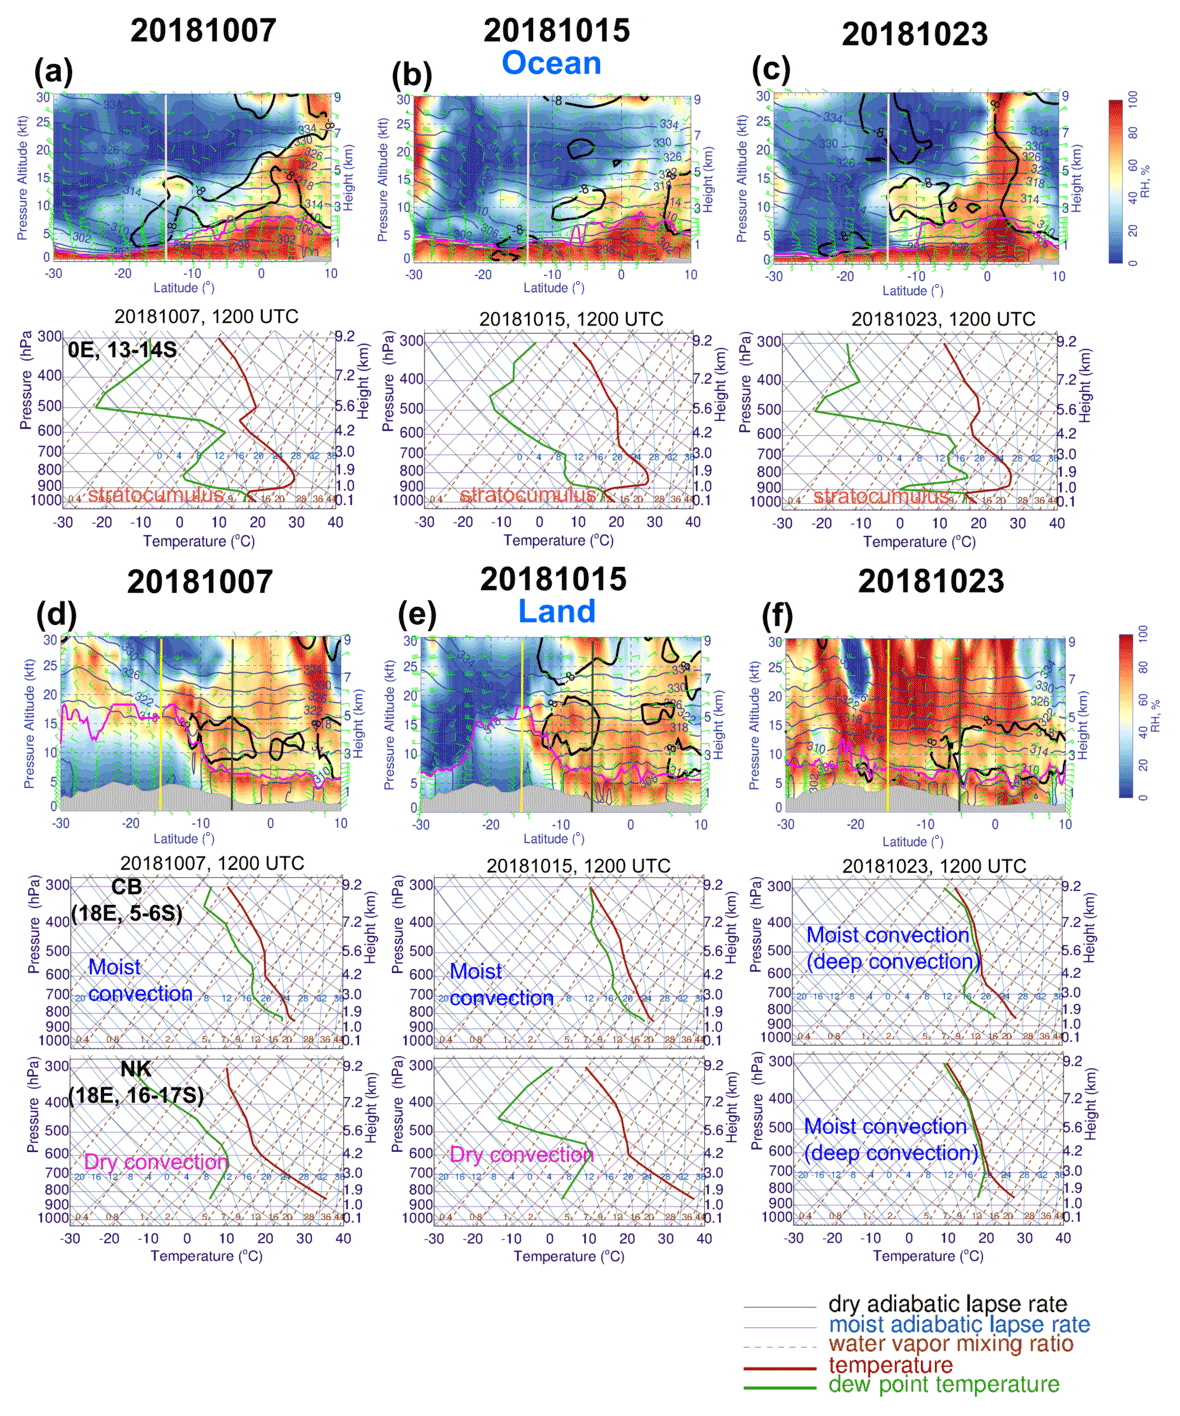
Figure 15(a–c) Ocean, with a latitudinal cross section of RH (shading; %), horizontal winds (wind barbs; green, m s−1), potential temperature (θ; navy; K), and BLH (magenta; m) at 0∘ E (top) and Skew-T log-P diagram averaged over 0∘ E and 13–14∘ S (bottom, from the left) at 12:00 UTC on 7, 15, and 23 October 2018. Bold black contours are zonal wind (−8 m s−1). (d–f) Land, which is the same as in panels (a)–(c), except for the cross section at 18∘ E and Skew-T log-P diagram averaged over 18∘ E and 5–6∘ S (CB is the Congo basin) and 18∘ E and 16–17∘ S (NK is the Namibian–Kalahari dryland). The gray-filled area represents the topography. The vertical lines in the cross-sectioned plots refer to the latitude we examine.
Latitudinal cross sections of moisture and winds, along with soundings from 3 representative flight days, indicate that the transport of moist plumes to the ocean is also a component of the AEJ-S in October (Fig. 15a–c). A noteworthy feature of the 7 October sounding over the ocean is its resemblance to the dry convection layer over land, indicating that this moist plume also likely originated from dry convection over the land and was then advected westward by the AEJ-S (Figs. 5c and 15a). On 7 and 15 October, dry convection was still dominant over the Namibia–Kalahari dryland (18∘ E, 16–17∘ S), while moist convection developed over the Congo basin (18∘ E, 5–6∘ S). Later, as dew point temperature no longer followed the constant water vapor mixing ratio line over the dryland and approached the temperature, this indicated that the dry convection transitioned to deep moist convection (top panel of soundings in Fig. 15d–f). On 23 October, the moist plumes with high RH (>60 %) reached 10–20∘ S (Fig. 15d–f), with moist convection over both Congo basins and Namibia–Kalahari dryland (see satellite image; Fig. 13c). Deep cloud layers, identified by locations where the dew point temperature matches the environmental temperature curves, are clearly shown on 23 October 2018 (soundings in both CB and NK in Fig. 15f). With such deep clouds, RH reaches ∼100 %, indicative of heavy rainfall.

Figure 16Map of (a–c) daily mean low CF (shading) overlaid by LTS (contour; K) and 925 hPa horizontal winds (vectors; m s−1), (d–f) BLH (shading; m) overlaid by 600 hPa horizontal winds (vectors; m s−1), 600 hPa geopotential height (red lines; m), and sea level pressure (SLP; lines in dark green for low pressure at 996, 1000, and 1004 and in magenta for high pressure at 1024, 1028, and 1032; hPa) at 12:00 UTC on 7, 15, and 23 October 2018. (g) Top plot shows the time series of daily mean low CF (blue lines) and daily mean LTS (red lines; K), and the bottom plot shows the daily mean low CF (blue lines) and daily mean BLH (magenta lines; m) averaged over region A (0–10∘ E, 5–15∘ S; solid lines) and region B (0–10∘ E, 15–25∘ S; dashed lines) during October 2018. All flight days (7, 15, and 23 October 2018) are marked by an asterisk (gray vertical lines). The purple shading over the land in panels (d)–(f) refers to BLH higher than 3250 m. (h) The 2-D joint pdf (shading) with a scatterplot are shown with 1-D histogram (pdf in line) of (top) low CF and LTS and (bottom) daily mean low CF and BLH over region A (left) and B (right) during October 2018. The solid line in panel (a) indicates region A (magenta box) and region B (navy box), respectively. The Pearson's r in panel (h) refers to Pearson correlation coefficient with its statistical significance (p value).
The positive correlation between LTS and low CF is weaker in October 2018 (e.g., 10∘ W–0∘, 5–15∘ S) and statistically more insignificant than during the other 2 deployment months (see Fig. 16), partially because neither the LTS nor low CF vary much in October 2018, particularly over the north of 20∘ S. When the subsidence weakens compared to August and September, low CF and LTS remain mildly correlated, especially at intermediate LTS values (16–20 K; Fig. 16hs; Zhang et al., 2009). Similar to August and September, the LTS–low–CF correlation in October is more evident in region B than in region A (Figs. 6g and 11g). As LTS strengthens, the low–CF increases, as shown in Fig. 16a–c. The BLH is higher over the ocean (10–40∘ W, 10–40∘ S) and shallower near the west coast of Africa (Fig. 16d–f). Low CF variability is also relatively invariant with BC aerosol (this is also clear in region A at 0–10∘ E, 5–15∘ S), while a stronger LLJ tends to reduce low CF during October (Fig. S8c). The mid-tropospheric winds and LLJ, both strong during October 2018, are also the most correlated (R∼0.55; p value <0.01) of the 3 deployment months (see the AEJ-S–LLJ correlation analysis in Fig. S7). A sufficiently strong temperature inversion and moist and warm conditions associated with the mid-latitude frontal system may provide favorable conditions for both the AEJ-S and LLJ to develop together (Fig. 16a–f).
In particular, low CF slightly decreased on 23 October 2018 (Fig. 16c and g), but the high cloud cover increased (not shown), indicating not only day-to-day variability but also that a cloud regime transition to a deep convection (Fig. 15f) may occur, especially south of the flight region (<20∘ S). The low clouds also tend to respond to the change in the BLH, and large low CF is weakly associated with a lower BLH on some days (e.g., 6, 18, 25, and 30 October 2018; see the bottom plot in Fig. 16g), but the overall correlation between the BLH and low CF is low and statistically insignificant (Fig. 16g). This can be partially explained by large day-to-day variability from passing mid-latitude frontal systems. The developing mid-latitude frontal systems, indicated by (1) the reduced St. Helena high and LTS, (2) decreasing SLP slightly east of the mid-level trough, and (3) misalignment of mid-level wind vector and mid-level geopotential height, promotes a increased disturbance and vertical motion, eventually intensifying the frontal system (Holton, 2004). The mid-latitude upper-level disturbance also contributes to modulating the temperature gradient over SE Atlantic (Ryoo et al., 2021), ultimately affecting local circulation. Further examination of the mid-level flow and SLP patterns for all October flight days is shown in Fig. S15.
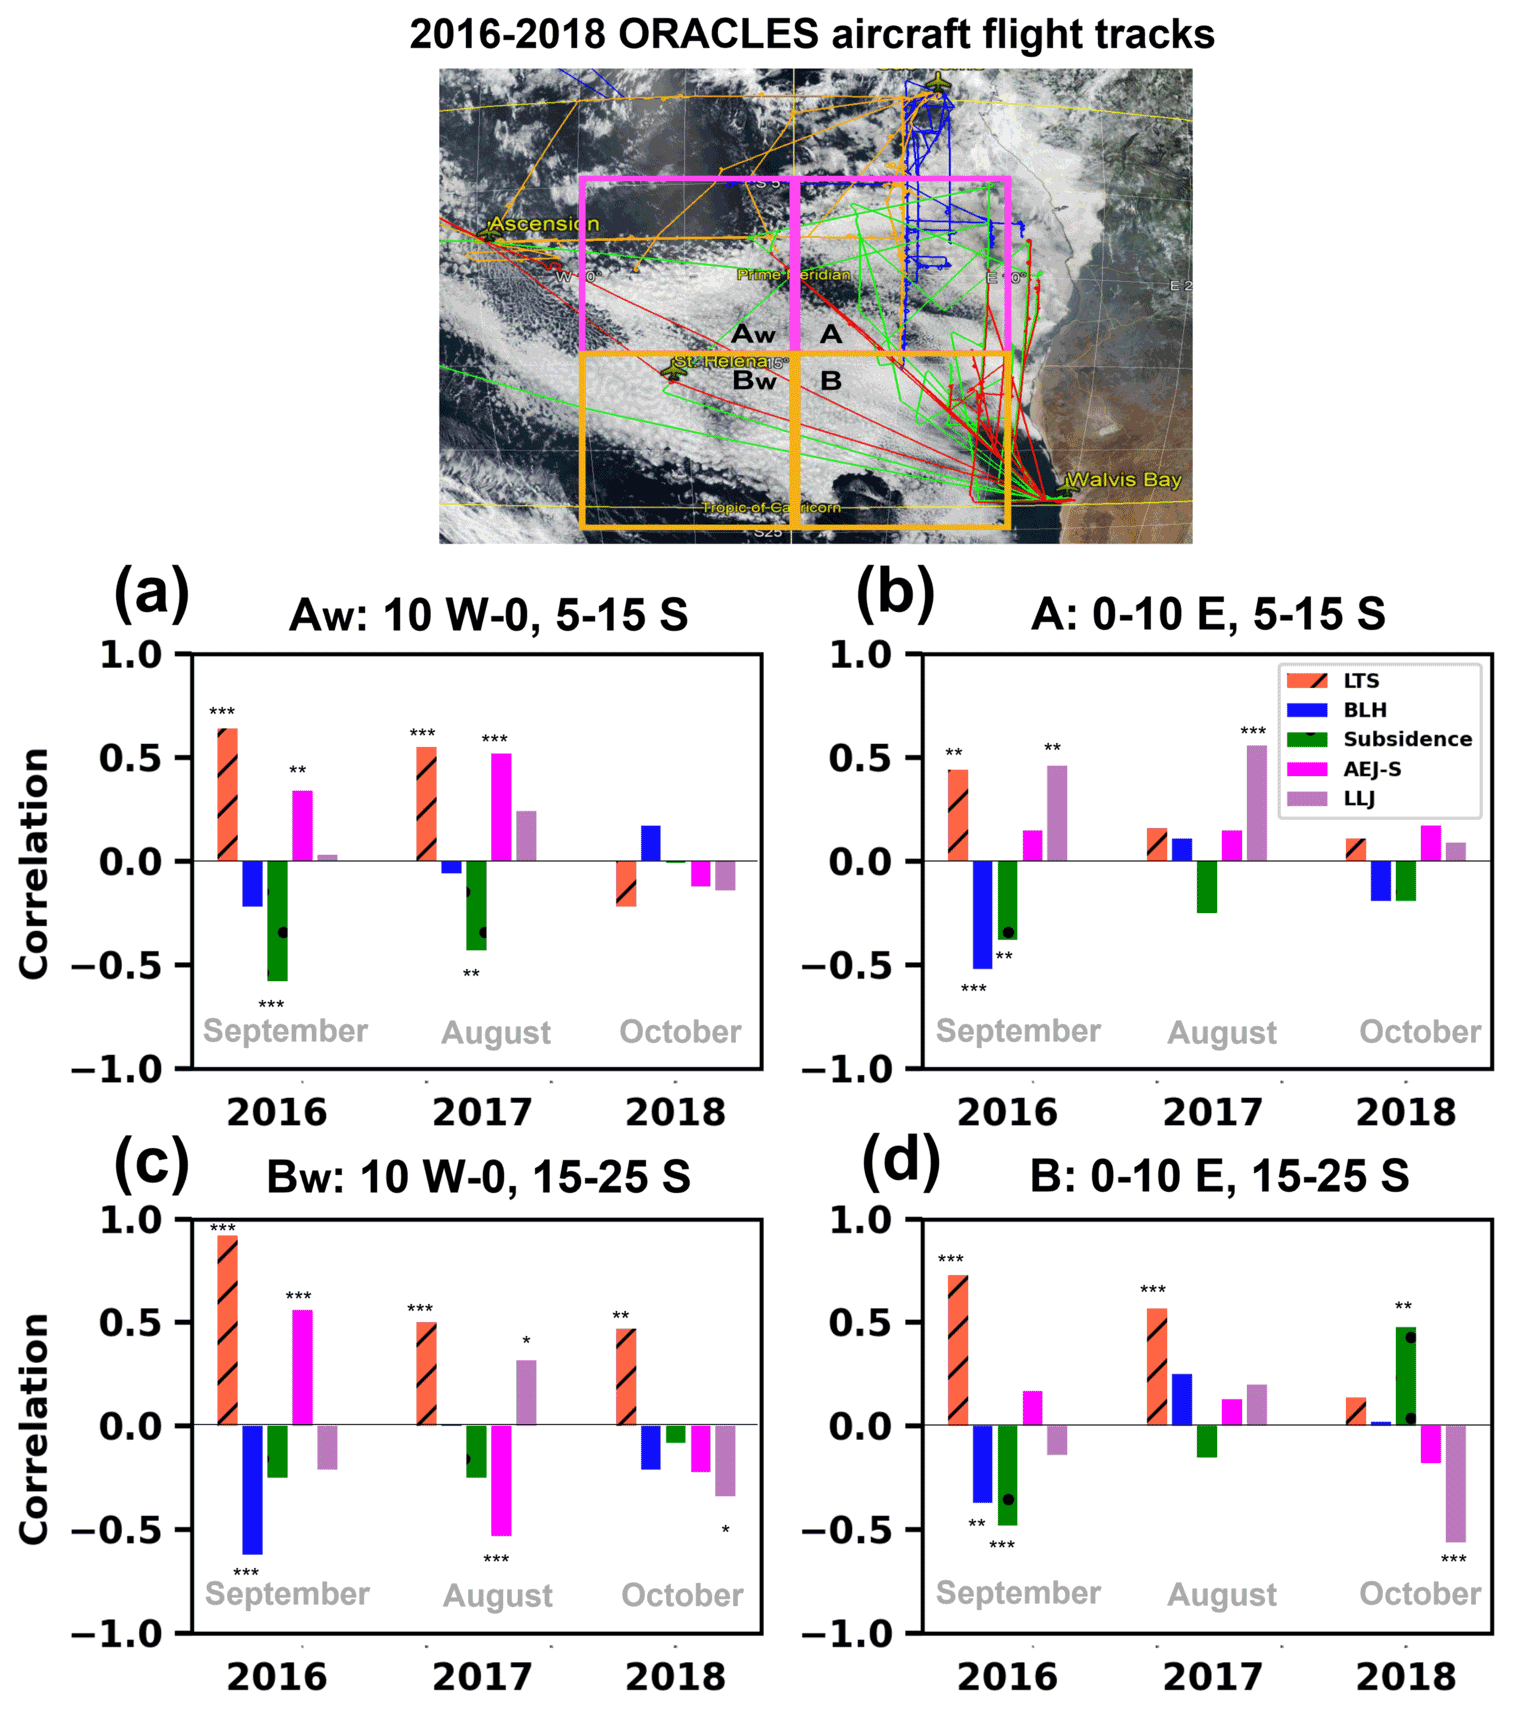
Figure 17Bar plots of the linear correlation between daily mean low CF and daily mean of the meteorological variables (LTS, BLH, subsidence, AEJ-S, and LLJ) averaged over four subregions in the ORACLES flight regions over the SE Atlantic Ocean (a Aw is 10∘ W–0∘, 5–15∘ S; b A is 0–10∘ E, 5–15∘ S; c Bw is 10∘ W–0∘, 15–25∘ S; d B is 0–10∘ E, 15–25∘ S) during the deployment months (marked in the boxed regions over the top image with flight tracks). A and B correspond to the regions A and B shown in the previous figures (e.g., Figs. 3, 4, 6, 8, 9, 11, 13, 14, and 16), while Aw and Bw correspond to the west of the regions A and B, respectively. The asterisks ( and *) denote when the correlation is statistically significant within 99 % (95 % and 90 %) confidence interval (p value <0.01 (<0.05 and <0.1)). The top panel represents the ER-2 flight tracks in 2016 (green) and the P-3 flight tracks in 2016, 2017, and 2018 (red, orange, and blue, respectively). The top panel, with flight tracks on a MODIS image and © Google Maps on 13 September 2018, is adapted from Redemann et al. (2021).
The linear relationship of meteorological variables to low CF over SE Atlantic regions during each deployment month at a daily timescale is shown in Fig. 17. Daily mean low CF is positively associated with LTS for all deployment months, except for the area north of 15∘ S (10∘ W–0∘, 15–5∘ S, Fig. 17c) in October. The LTS–low CF relationship is weakest north of 15∘ S near the coast (0–10∘ E) in the vicinity of AEJ-S, moisture, and BC aerosols (Fig. 17b). BLH is also negatively associated with low CF, especially in September. The relationships to low CF are most pronounced in September for all subregions, with more variability in August and October. Subsidence is typically negatively correlated with low CF, except for the area south of 15∘ S near the coast in October (Fig. 17d) at a daily timescale. Both AEJ-S and LLJ are positively correlated to low CF in September and August north of 15∘ S but are negatively correlated in October (Fig. 17d). The AEJ-S and any aerosol will affect the subsidence, and this may be reflected in the jets (AEJ-S and LLJ) and the subsidence relationship to low CF. Also note that this is reversed both north and south of 15∘ S near the coast (0–10∘ E, Fig. 17b and d), consistent with Andersen et al. (2020), except for September south of 15∘ S. Further offshore (10∘ W–0∘), the LLJ–low CF relationship is weaker, while the AEJ-S–low CF relationship is stronger closer to the coast. In tandem, the mid-tropospheric BC aerosol–low CF relationship is also weaker near the coast than further offshore during both August 2017 and September 2016. For example, the Pearson correlation (r) for 600 hPa BC–low CF north of 15∘ S in September 2016 is 0.56 offshore (10∘ W–0∘, 5–15∘ S; p<0.05) and 0.35 near the coast (0–10∘ E, 5–15∘ S; p<0.05). The mid-tropospheric BC–low CF correlation is highest in September 2016 and lowest in October 2018, while the boundary layer BC–low CF correlation is generally low and statistically insignificant for all 3 months and occasionally negatively correlated (not shown).
Part 2 of the meteorological overview paper describes the daily resolved and synoptic variability in meteorological factors controlling aerosol transport and low cloud during the August, September, and October 2016–2018 deployments of ObseRvations of Aerosols above CLouds and their intEractionS (ORACLES) project. The key synoptic-scale meteorological characteristics that affect aerosol transport during each deployment month are summarized and illustrated in Fig. 18.
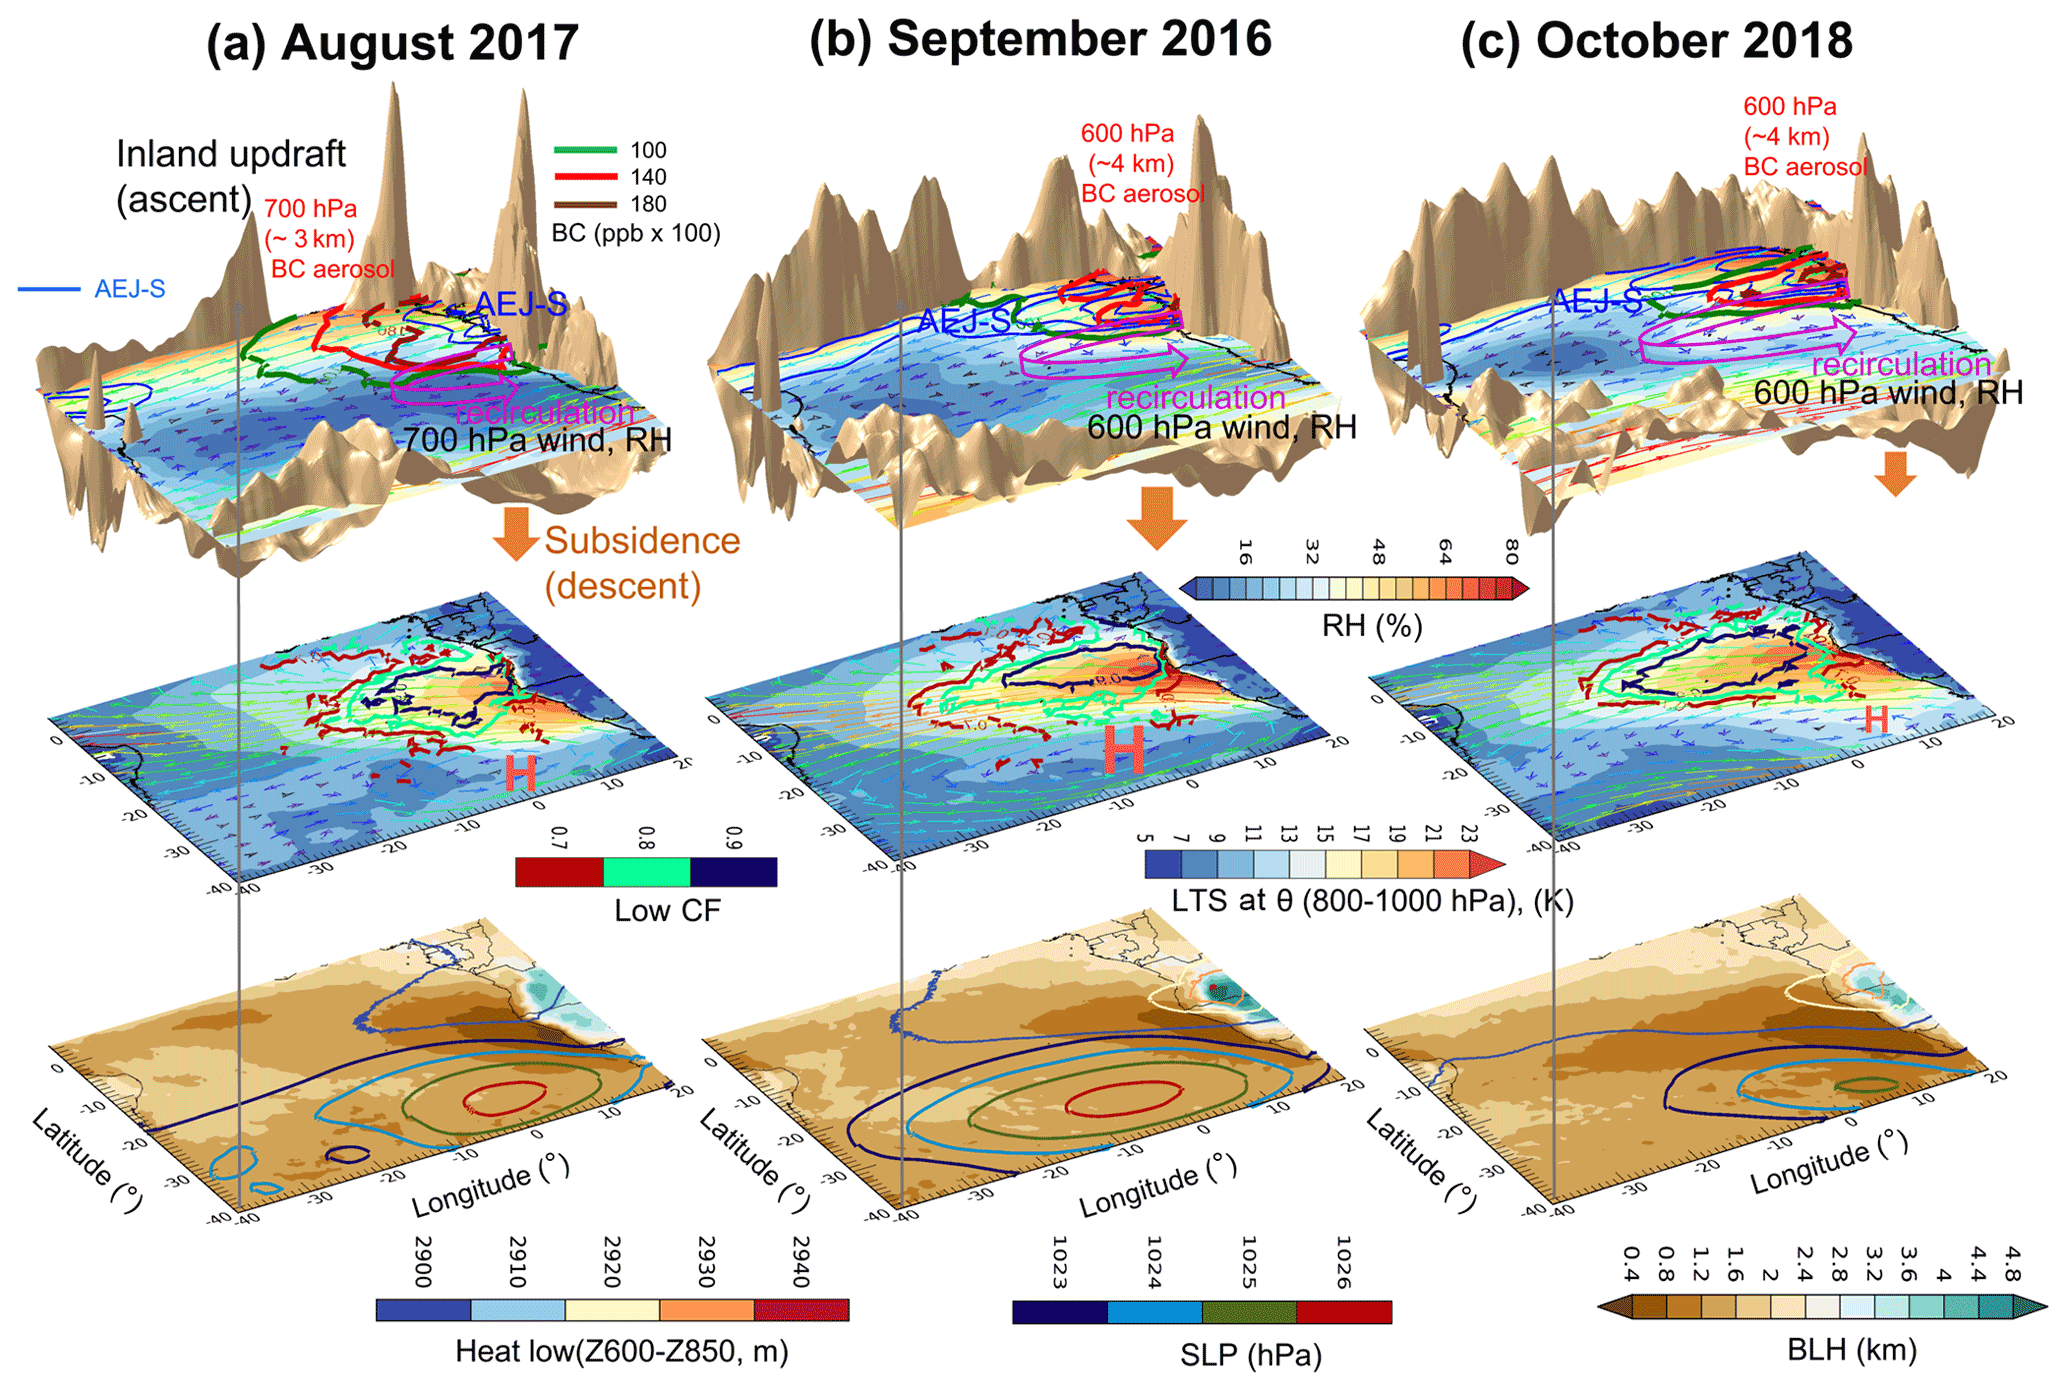
Figure 18Visualization of (top panels) the map of 700 hPa RH (shading; %), 700 hPa horizontal wind (vector; m s−1), and 700 hPa BC aerosols (color lines; ppb ×100) for August 2017 and the same variables, except for 600 hPa in September 2016 and October 2018. The 800 hPa vertical velocity for all months (gold bumpy surface above the RH contour plane is an updraft and below the RH contour plane is subsidence; ω multiplied by −1, i.e., −ω; hPa d−1;). The middle panels show the map of LTS (shading; K) overlaid by 925 hPa horizontal wind (vector; m s−1) and low CF (color contours; 0.7 %–0.9 %). The bottom panels show the map of BLH (color shading; km) overlaid by thickness between 600 and 850 hPa (color contours; m) and sea level pressure (SLP; color contours; hPa) during (a) August 2017, (b) September 2016, and (c) October 2018. The magenta arrow in the top panels represents the recirculating flow to the African continent. The red “H” in the middle panels refers to the anticyclones associated with the St. Helena high.
- –
Deployment 1 (September 2016). September 2016 is characterized by a strong southern African easterly jet (AEJ-S) around 10∘ S, ∼4 km (i.e., 600–650 hPa) after 8 September. Black carbon (BC) aerosols and relative humidity (RH) are transported toward the ocean by the AEJ-S (top panel in Fig. 18b). Aerosol is occasionally present within the boundary layer in the CAMS reanalysis, though this is likely overestimated compared to observations (Shinozuka et al., 2020; Doherty et al., 2022). Daily mean low tropospheric stability (LTS) is positively correlated with daily mean low-cloud fraction (low CF; middle panel in Fig. 18b). High low CF tends to be associated with low boundary layer height (BLH). The St. Helena high extended widely over the South Atlantic (bottom panel in Fig. 18b).
-
Early September 2016 (1–9 September). A strong mid-/upper-level mid-latitude trough intrusion (4 September) and cutoff low over 20∘ W–5∘ E, 15–30∘ S (2 September) strengthened the LLJ and southward mid-level flows near the coast. The St. Helena high extended over (30∘ W–20∘ E, 20–45∘ S) during this period.
-
Mid-September (10–18 September). Moist plumes originating from land and advected by the AEJ-S were associated with moist convection in the north (5–10∘ S) and dry convection in the south (15–25∘ S). A mid-latitude trough intrusion strengthened the LLJ and southward mid-level flows near the coast, forming a local anticyclone south of 20∘ S on 10 and 12 September. The BLH was elevated and disturbed, largely due to a strong northward flow within the boundary layer associated with developing mid-latitude frontal system on 14–16 September. The boundary layer BC aerosol decreased over flight region on 18 September.
-
Late September (19–30 September). Moisture advected quickly as the AEJ-S developed and the LLJ also strengthened. The BLH was low over land and the coastal region (0–20∘ E, 15–30∘ S) on 20 September. Thereafter, a strong mid-latitude disturbance with a pronounced upper-level trough–ridge pattern developed over the central Atlantic, increasing SLP near the coast. The mid-latitude frontal system affected the southern region (0–10∘ E, 15–25∘ S), changing both the lower- and mid-level wind speed and direction, reducing the subsidence, and increasing the BLH at the end of the month.
-
- –
Deployment 2 (August 2017). The AEJ-S became established after mid-August of 2017 as the Southern Hemisphere (SH) moved from its winter towards its spring but mostly at a lower altitude (∼3 km; ∼700 hPa) and further north (5–7∘ S) compared to September, with another easterly jet aloft above 600–500 hPa (>4 km). BC covaried with RH and the AEJ-S in 0–10∘ E, 5–15∘ S region around 3 km (∼700 hPa; top panel in Fig. 18a). The heat low was weaker than in September 2016. Low CF was positively correlated with LTS and particularly high over the southern flight region (middle panel in Fig. 18a). The high SLP is weaker than in September 2016 (bottom panel in Fig. 18a).
-
Early August (5–13 August). Slow and unorganized moisture advection reflected a relatively slow-moving and weak AEJ-S. Strong mid- to upper-level easterly jet strengthened (>4 km) on 12 and 13 August. The St. Helena high persisted over the south Atlantic. Strong southwesterly wind associated with cutoff low over the 30–10∘ W, 20–40∘ S intensified the mid-level wind on 12 August.
-
Mid-August (14–21 August). A suppressed AEJ-S and dry free troposphere persisted over the SE Atlantic. A strong mid- to upper-tropospheric easterly jet prevailed above 500 hPa over 5–15∘ S, 0–10∘ E. The AEJ-S thereafter developed around 20–21 August. Strong anticyclone and high SLP, very weak zonal winds, and intense northward meridional winds developed over the southern African coast throughout the vertical layer (600–925 hPa level) on 20–21 August 2017 as the mid-latitude trough amplified and pushed northward. BLH was elevated over the 0–10∘ E, 15–25∘ S on 18–19 August and along the southern African coast on 21 August. These were associated with strong mid-level (600 hPa) westerly and southwesterly wind.
-
Late August (22–31 August). Moisture was advected by the emerging AEJ-S. A cutoff low developed to the west of the flight region (20∘ W–0∘, 20–30∘ S), with the SLP increasing south of 30∘ S, 10∘ W–20∘ E on 26 August. A mid-/upper-level trough amplified, leading to southward winds over the SE Atlantic coastal region (0–10∘ E, 20–30∘ S) on 28 August. Thereafter, relatively fast-moving moisture was advected by the AEJ-S on 30–31 August. BLH over the South Atlantic (20–30∘ S, 20∘ W–0∘) was elevated north of the strong mid-latitude jet at 40∘ S on 30–31 August.
-
- –
Deployment 3 (October 2018). October 2018 was characterized by a strong AEJ-S around 10∘ S, ∼4 km, transporting aerosol up to mid-October but not thereafter. The AEJ-S slightly weakened as moist convection increased later in the month on 23 October. The impact of the mid-latitude frontal systems increased after the latter half of the month. BC also varied, with AEJ-S and RH around 600 hPa around 8–10∘ S (top panel in Fig. 18c), but its transport was diminished by the weakening AEJ-S for the end of October. The low CF was the highest among the 3 deployment months (middle panel in Fig. 18c). The correlations between LTS, BLH, and low CF are the least significant of the deployment months. The AEJ-S–LLJ and the low CF–LLJ correlations were significant in October 2018, apparently affected by a rapidly developing mid-latitude frontal system associated with upper-level disturbance over the SE Atlantic Ocean. High SLP is noticeably reduced, and BLH is shallowest among the deployment months (bottom panel in Fig. 18c).
-
Early October (1–10 October). Fast-moving (∼12.8 m s−1) convection mostly from developing continental convection (<5∘ N) coincided with a strong AEJ-S. An extensive high St. Helena high pressure developed over the South Atlantic (30∘ W–20∘ E, 25–45∘ S) on 2–3 October, as for September climatological conditions. The highest boundary layer BC aerosol was found in the early period of October.
-
Mid-October (11–21 October). The AEJ-S and moisture transport persisted with some variability as the continental convection was intensified. Subsidence and large-scale anticyclone were weaker than in September 2016. The mid-latitude upper-level flows were tied to the intensification of the surface low to the west of flight region on 15 and 21 October.
-
Late October (22–28 October). Convection marched further south (<20∘ S) over land. The AEJ-S weakened, together with a temperature reduction over land, and a weakening of both the latitudinal moisture and temperature gradient occurred. BLH over land (coast) on 23 October was noticeably lower (higher) compared to other flight days. Moisture transport occurred from land to ocean as the AEJ-S regained strength towards the end of the month.
-
This paper provides a meteorological context for interpreting the airborne measurements gathered during the three ORACLES deployments to support related studies focusing on the detailed investigation of the processes controlling stratocumulus decks, aerosol lifting, transport, and their interactions. The variability in the meteorological fields during each deployment is highly modulated at a daily to synoptic timescale, including in subsidence and dry/moist convection, superimposed on a seasonal trend towards a stronger heat low (August to September) before moist convection intrudes (September to October). Fast-moving dynamic disturbance, such as mid-latitude wave intrusion or frontal systems, will disrupt the relation between stratocumulus and climatological large-scale subsidence, LTS, BLH, and LLJ. One implication of this paper is to enable us to expect when the direct or indirect aerosol radiative effect is dominant. For example, when the AEJ-S is elevated high around 4 km, the aerosol can also be elevated above the cloud deck, which is well observed in September and October. In contrast, when the AEJ-S is less elevated (e.g., August), the lower transport altitudes make it easier for the aerosol to be in contact with the cloudy boundary layer and mix into it, increasing the importance of the boundary layer aerosol indirect and semi-direct effects.
While we examined several large-scale meteorological factors tied to aerosol transport and stratocumulus decks, the detailed investigation of the processes controlling stratocumulus decks, aerosol lifting, and transport is beyond the scope of this study. Future studies can focus on specific scientific questions such as (1) the roles of mid-latitude circulations on the aerosol transport and its boundary layer entrainment, (2) the impact of the continental mesoscale convective system (MCS) on the AEJ-S and the biomass burning (BB) aerosols, (3) further investigation of the aerosol warming effect in the boundary layer by disentangling the meteorological factors from the aerosol-induced cloud adjustment based on the model and airborne measurement, (4) the impact of the unusual-to-climatology meteorological conditions on low cloud, aerosols, and their interactions at different timescale, (5) the influence of smoke-induced aerosol on cloud type and precipitation by adjusting large-scale environmental conditions, and (6) the causal relationship among aerosols, low cloud, and other meteorological factors over the different ocean basins and geography.
The data in this analysis are based on an open-source dataset. ERA 5 data are available from the Copernicus Climate Change Service (C3S) at https://cds.climate.copernicus.eu/ (last access: 30 October 2022; Hersbach et al., 2020). The MODIS Aqua (Terra) level 3 product is from https://doi.org/10.5067/MODIS/MYD08_M3.006 (Platnick et al., 2015a; https://doi.org/10.5067/MODIS/MYD08_M3.006, Platnick et al., 2015b). VIIRS daily level 3 cloud data are from (https://ladsweb.modaps.eosdis.nasa.gov/missions-and-measurements/products/CLDPROP_D3_VIIRS_SNPP, last access: 30 October 2022). ECMWF CAMS global reanalysis monthly mean data are available from https://ads.atmosphere.copernicus.eu/cdsapp#!/dataset/cams-global-reanalysis-eac4-monthly?tab=overview (last access: 30 October 2022; Inness et al., 2019). The ORACLES P-3 flight track data can be obtained from NASA Earth Science Project Office (ESPO) archive at https://doi.org/10.5067/Suborbital/ORACLES/P3/2016_V2 (ORACLES Science Team, 2020a), for the 2016 data, https://doi.org/10.5067/Suborbital/ORACLES/P3/2017_V2 (ORACLES Science Team, 2020b), for the 2017 data, and https://doi.org/10.5067/Suborbital/ORACLES/P3/2018_V2 (ORACLES Science Team, 2020c), for the 2018 data, respectively.
The supplement related to this article is available online at: https://doi.org/10.5194/acp-22-14209-2022-supplement.
RW and PZ envisioned the original ORACLES meteorological overview concept, and JMR, RU, and LP designed the paper structure. IC provided the climatological mean and monthly mean MODIS low-cloud data and assisted JMR with obtaining the VIIRS daily mean cloud data product. LP and JMR developed the methodology of determining the decoupled cloud boundary layer height (BLH). JMR processed the data analysis and wrote the paper. JMR, LP, PZ, RW, and RU organized results, and PZ, LP, and RW provided substantial feedback for further interpretation of the results. All authors provided input and edited the paper. JR, RW, and PZ made critical contributions to the ORACLES field campaigns, and LP and RU led the meteorological forecast briefing during the whole ORACLES field campaigns.
At least one of the (co-)authors is a guest member of the editorial board of Atmospheric Chemistry and Physics for the special issue “New observations and related modelling studies of the aerosol–cloud–climate system in the Southeast Atlantic and southern Africa regions (ACP/AMT inter-journal SI)”. The peer-review process was guided by an independent editor, and the authors also have no other competing interests to declare.
Publisher's note: Copernicus Publications remains neutral with regard to jurisdictional claims in published maps and institutional affiliations.
This article is part of the special issue “New observations and related modelling studies of the aerosol–cloud–climate system in the Southeast Atlantic and southern Africa regions (ACP/AMT inter-journal SI)”. It is not associated with a conference.
The authors give sincere gratitude to all the ORACLES participants who make the project successful. We also thank Kristina Pistone, for helpful discussions in interpreting CAMS aerosol data. The ORACLES campaign was funded by NASA Earth Venture Suborbital-2 (grant no. NNH13ZDA001N-EVS2). We also appreciate two anonymous reviewers, for their insightful comments and thoughtful suggestions.
This research has been supported by the Aeronautics Research Mission Directorate (NASA Earth Venture Suborbital-2; grant no. NNH13ZDA001N-EVS2).
This paper was edited by Yuan Wang and reviewed by two anonymous referees.
Abel, S. J., Barrett, P. A., Zuidema, P., Zhang, J., Christensen, M., Peers, F., Taylor, J. W., Crawford, I., Bower, K. N., and Flynn, M.: Open cells exhibit weaker entrainment of free-tropospheric biomass burning aerosol into the south-east Atlantic boundary layer, Atmos. Chem. Phys., 20, 4059–4084, https://doi.org/10.5194/acp-20-4059-2020, 2020.
Adebiyi, A. A. and Zuidema, P.: The role of the southern African easterly jet in modifying the southeast Atlantic aerosol and cloud environments, Q. J. Roy. Meteor. Soc., 142, 1574–1589, https://doi.org/10.1002/qj.2765, 2016.
Adebiyi, A. A. and Zuidema, P.: Low Cloud Cover Sensitivity to Biomass-Burning Aerosols and Meteorology over the Southeast Atlantic, J. Climate, 31, 4329–4346, https://doi.org/10.1175/JCLI-D-17-0406.1, 2018.
Adebiyi, A., Zuidema, P., and Abel, S.: The convolution of dynamics and moisture with the presence of shortwave absorbing aerosols over the southeast Atlantic, J. Climate, 28, 1997–2024, https://doi.org/10.1175/JCLI-D-14-00352.1, 2015.
Adebiyi, A. A., Zuidema, P., Chang, I., Burton, S. P., and Cairns, B.: Mid-level clouds are frequent above the southeast Atlantic stratocumulus clouds, Atmos. Chem. Phys., 20, 11025–11043, https://doi.org/10.5194/acp-20-11025-2020, 2020.
Alduchov, O. A. and Eskridge, R. E.: Improved Magnus' form approximation of saturation vapor pressure, J. Appl. Meteor., 35, 601–609, 1996.
Andersen, H., Cermak, J., Fuchs, J., Knippertz, P., Gaetani, M., Quinting, J., Sippel, S., and Vogt, R.: Synoptic-scale controls of fog and low-cloud variability in the Namib Desert, Atmos. Chem. Phys., 20, 3415–3438, https://doi.org/10.5194/acp-20-3415-2020, 2020.
Christensen, M. W., Jones, W. K., and Stier, P.: Aerosols enhance cloud lifetime and brightness along the stratus-to-cumulus transition, P. Natl. Acad. Sci. USA, 117, 17591–17598, https://doi.org/10.1073/pnas.1921231117, 2020.
Cochrane, S. P., Schmidt, K. S., Chen, H., Pilewskie, P., Kittelman, S., Redemann, J., LeBlanc, S., Pistone, K., Segal Rozenhaimer, M., Kacenelenbogen, M., Shinozuka, Y., Flynn, C., Ferrare, R., Burton, S., Hostetler, C., Mallet, M., and Zuidema, P.: Biomass burning aerosol heating rates from the ORACLES (ObseRvations of Aerosols above CLouds and their intEractionS) 2016 and 2017 experiments, Atmos. Meas. Tech., 15, 61–77, https://doi.org/10.5194/amt-15-61-2022, 2022.
Deaconu, L. T., Ferlay, N., Waquet, F., Peers, F., Thieuleux, F., and Goloub, P.: Satellite inference of water vapour and above-cloud aerosol combined effect on radiative budget and cloud-top processes in the southeastern Atlantic Ocean, Atmos. Chem. Phys., 19, 11613–11634, https://doi.org/10.5194/acp-19-11613-2019, 2019.
De Szoeke, S. P., Verlinden, K. L., Yuter, S. E., and Mechem, D. B.: The Time Scales of Variability of Marine Low Clouds, J. Climate, 29, 6463–6481, https://doi.org/10.1175/JCLI-D-15-0460.1, 2016.
Diamond, M. S., Dobracki, A., Freitag, S., Small Griswold, J. D., Heikkila, A., Howell, S. G., Kacarab, M. E., Podolske, J. R., Saide, P. E., and Wood, R.: Time-dependent entrainment of smoke presents an observational challenge for assessing aerosol–cloud interactions over the southeast Atlantic Ocean, Atmos. Chem. Phys., 18, 14623–14636, https://doi.org/10.5194/acp-18-14623-2018, 2018.
Dobracki, A., Zuidema, P., Howell, S., Saide, P., Freitag, S., Aiken, A. C., Burton, S. P., Sedlacek III, A. J., Redemann, J., and Wood, R.: An attribution of the low single-scattering albedo of biomass-burning aerosol over the southeast Atlantic, Atmos. Chem. Phys. Discuss. [preprint], https://doi.org/10.5194/acp-2022-501, in review, 2022.
Doherty, S. J., Saide, P. E., Zuidema, P., Shinozuka, Y., Ferrada, G. A., Gordon, H., Mallet, M., Meyer, K., Painemal, D., Howell, S. G., Freitag, S., Dobracki, A., Podolske, J. R., Burton, S. P., Ferrare, R. A., Howes, C., Nabat, P., Carmichael, G. R., da Silva, A., Pistone, K., Chang, I., Gao, L., Wood, R., and Redemann, J.: Modeled and observed properties related to the direct aerosol radiative effect of biomass burning aerosol over the southeastern Atlantic, Atmos. Chem. Phys., 22, 1–46, https://doi.org/10.5194/acp-22-1-2022, 2022.
Gordon, H., Field, P. R., Abel, S. J., Dalvi, M., Grosvenor, D. P., Hill, A. A., Johnson, B. T., Miltenberger, A. K., Yoshioka, M., and Carslaw, K. S.: Large simulated radiative effects of smoke in the south-east Atlantic, Atmos. Chem. Phys., 18, 15261–15289, https://doi.org/10.5194/acp-18-15261-2018, 2018.
Haywood, J. M., Abel, S. J., Barrett, P. A., Bellouin, N., Blyth, A., Bower, K. N., Brooks, M., Carslaw, K., Che, H., Coe, H., Cotterell, M. I., Crawford, I., Cui, Z., Davies, N., Dingley, B., Field, P., Formenti, P., Gordon, H., de Graaf, M., Herbert, R., Johnson, B., Jones, A. C., Langridge, J. M., Malavelle, F., Partridge, D. G., Peers, F., Redemann, J., Stier, P., Szpek, K., Taylor, J. W., Watson-Parris, D., Wood, R., Wu, H., and Zuidema, P.: The CLoud–Aerosol–Radiation Interaction and Forcing: Year 2017 (CLARIFY-2017) measurement campaign, Atmos. Chem. Phys., 21, 1049–1084, https://doi.org/10.5194/acp-21-1049-2021, 2021.
Hegarty, J., Lewis J., McGrath-Spangler, E. L., Henderson, J., Scarino, A. J., Decola, P., Ferrare R., Hicks, M., Adams-Selin, R. D., and Welton, E. J.: Analysis of the Planetary Boundary Layer Height during DISCOVER-AQ Baltimore-Washington, D. C., with Lidar and High-Resolution WRF Modeling, J. Appl. Meterol. Climatol., 57, 2679–2696, https://doi.org/10.1175/JAMC-D-18-0014.1, 2018.
Hersbach, H., Bell, B., Berrisford, P., Hirahara, S., Horányi, A., Muñoz-Sabater, J., Nicolas, J., Peubey, C., Radu, R., Schepers, D., Simmons, A., Soci, C., Abdalla, S., Abellan, X., Balsamo, G., Bechtold, P., Biavati, G., Bidlot, J., Bonavita, M., De Chiara, G., Dahlgren, P., Dee, D., Diamantakis, M., Dragani, R., Flemming, J., Forbes, R., Manuel, F., Geer, A., Haimberger, L., Healy, S., Hogan, R. J., Hólm, E., Janisková, M., Keeley, S., Laloyaux, P., Lopez, P., Lupu, C., Radnoti, G., De Rosnay, P., Rozum, I., Vamborg, F., Villaume, S., and Thépaut, J.-N.: The ERA5 global reanalysis, Q. J. Roy. Meteor. Soc., 146, 1999–2049, https://doi.org/10.1002/qj.3803, 2020.
Holton, J. R.: An Introduction to Dynamic Meteorology, Elsevier Academic Press, 4th edn., edited by: Cynar, F., ISBN 0-12-354015-1, eBook ISBN 9780080470214, 2004.
Hubanks, P., Platnick, S., Meyer, K., King, M., Ackerman, S., Holz, B., Heidinger, A., Li., Y., Frey, R., Walther, A., Dutcher, S., Veglio, P., Quinn, G., Botambekov, D., Wind, G., Amarasinghe, N., Wang, C., Marchant, B., and Ramachandran, B.: L3 CLDPROP User Guide, Version 1.8, 10 October 2019.
Inness, A., Ades, M., Agustí-Panareda, A., Barré, J., Benedictow, A., Blechschmidt, A.-M., Dominguez, J. J., Engelen, R., Eskes, H., Flemming, J., Huijnen, V., Jones, L., Kipling, Z., Massart, S., Parrington, M., Peuch, V.-H., Razinger, M., Remy, S., Schulz, M., and Suttie, M.: The CAMS reanalysis of atmospheric composition, Atmos. Chem. Phys., 19, 3515–3556, https://doi.org/10.5194/acp-19-3515-2019, 2019.
Klein, S. A. and Hartmann, D. L.: The seasonal cycle of low stratiform clouds, J. Climate, 6, 1588–1606, 1993.
Kuete, G., Mba, W. P., and Washington, R.: African Easterly Jet South: Control, maintenance mechanisms and link with Southern subtropical waves, Clim. Dynam., 54, 1539–1552, https://doi.org/10.1007/s00382-019-05072-w, 2020.
Liu, N., Zhou, S., Liu, C., and Guo, J.: Synoptic circulation pattern and boundary layer structure associated with PM2.5 during wintertime haze pollution episodes in Shanghai, Atmos. Res., 228, 186–195, https://doi.org/10.1016/j.atmosres.2019.06.001, 2019.
Mallet, M., Nabat, P., Zuidema, P., Redemann, J., Sayer, A. M., Stengel, M., Schmidt, S., Cochrane, S., Burton, S., Ferrare, R., Meyer, K., Saide, P., Jethva, H., Torres, O., Wood, R., Saint Martin, D., Roehrig, R., Hsu, C., and Formenti, P.: Simulation of the transport, vertical distribution, optical properties and radiative impact of smoke aerosols with the ALADIN regional climate model during the ORACLES-2016 and LASIC experiments, Atmos. Chem. Phys., 19, 4963–4990, https://doi.org/10.5194/acp-19-4963-2019, 2019.
Mallet, M., Solmon, F., Nabat, P., Elguindi, N., Waquet, F., Bouniol, D., Sayer, A. M., Meyer, K., Roehrig, R., Michou, M., Zuidema, P., Flamant, C., Redemann, J., and Formenti, P.: Direct and semi-direct radiative forcing of biomass-burning aerosols over the southeast Atlantic (SEA) and its sensitivity to absorbing properties: a regional climate modeling study, Atmos. Chem. Phys., 20, 13191–13216, https://doi.org/10.5194/acp-20-13191-2020, 2020.
Mallet, M., Nabat, P., Johnson, B., Michou, M., Haywood, J. M., Chen, C., and Dubovik, O.: Climate models generally underrepresent the warming by Central Africa biomass-burning aerosols over the Southeast Atlantic, Sci. Adv., 7, eabg9998, https://doi.org/10.1126/sciadv.abg9998, 2021.
NASA ER-2: https://www.nasa.gov/centers/armstrong/news/FactSheets/FS-046-DFRC.html#:~:text=The%20ER%2D2%20is%20a,65%2C000%20feet%20within%2020%20minutes (last access: 15 August 2022), 2014.
NASA P-3: https://airbornescience.nasa.gov/aircraft/P-3_Orion_-_ WFF, last access: 15 August 2022, 2022.
Nicholson, S.: A low-level jet along the Benguela coast, an integral part of the Benguela current ecosystem, Clim. Change, 99, 613, https://doi.org/10.1007/s10584-009-9678-z, 2010.
Ohsawa, T., Ueda, H., Hayashi, T., Watanabe, A., and Matsumoto, J.: Diurnal variations of convective activity and rainfall in tropical Asia, J. Meteor. Soc. Japan, 79, 333–352, https://doi.org/10.2151/jmsj.79.333, 2001.
ORACLES Science Team: Suite of Aerosol, Cloud, and Related Data Acquired Aboard P3 During ORACLES 2016, Version 2, Moffett Field, CA, NASA Ames Earth Science Project Office (ESPO) [data set], https://doi.org/10.5067/Suborbital/ORACLES/P3/2016_V2, 2020a.
ORACLES Science Team: Suite of Aerosol, Cloud, and Related Data Acquired Aboard P3 During ORACLES 2017, Version 2, Moffett Field, CA, NASA Ames Earth Science Project Office (ESPO) [data set], https://doi.org/10.5067/Suborbital/ORACLES/P3/2017_V2, 2020b.
ORACLES Science Team: Suite of Aerosol, Cloud, and Related Data Acquired Aboard P3 During ORACLES 2018, Version 2, Moffett Field, CA, NASA Ames Earth Science Project Office (ESPO) [data set], https://doi.org/10.5067/Suborbital/ORACLES/P3/2018_V2, 2020c.
Pennypacker, S., Diamond, M., and Wood, R.: Ultra-clean and smoky marine boundary layers frequently occur in the same season over the southeast Atlantic, Atmos. Chem. Phys., 20, 2341–2351, https://doi.org/10.5194/acp-20-2341-2020, 2020.
Pistone, K., Zuidema, P., Wood, R., Diamond, M., da Silva, A. M., Ferrada, G., Saide, P. E., Ueyama, R., Ryoo, J.-M., Pfister, L., Podolske, J., Noone, D., Bennett, R., Stith, E., Carmichael, G., Redemann, J., Flynn, C., LeBlanc, S., Segal-Rozenhaimer, M., and Shinozuka, Y.: Exploring the elevated water vapor signal associated with the free tropospheric biomass burning plume over the southeast Atlantic Ocean, Atmos. Chem. Phys., 21, 9643–9668, https://doi.org/10.5194/acp-21-9643-2021, 2021.
Platnick, S., Hubanks, P., Meyer, K., and King, M. D.: MODIS Atmosphere L3 Monthly Product (08_L3), NASA MODIS Adaptive Processing System (Terra), Goddard Space Flight Center [data set], https://doi.org/10.5067/MODIS/MYD08_M3.006, 2015a.
Platnick, S., Hubanks, P., Meyer, K., and King, M. D.: MODIS Atmosphere L3 Monthly Product (08_L3). NASA MODIS Adaptive Processing System (Aqua), Goddard Space Flight Center [data set], https://doi.org/10.5067/MODIS/MYD08_M3.006, 2015b.
Redemann, J., Wood, R., Zuidema, P., Doherty, S. J., Luna, B., LeBlanc, S. E., Diamond, M. S., Shinozuka, Y., Chang, I. Y., Ueyama, R., Pfister, L., Ryoo, J.-M., Dobracki, A. N., da Silva, A. M., Longo, K. M., Kacenelenbogen, M. S., Flynn, C. J., Pistone, K., Knox, N. M., Piketh, S. J., Haywood, J. M., Formenti, P., Mallet, M., Stier, P., Ackerman, A. S., Bauer, S. E., Fridlind, A. M., Carmichael, G. R., Saide, P. E., Ferrada, G. A., Howell, S. G., Freitag, S., Cairns, B., Holben, B. N., Knobelspiesse, K. D., Tanelli, S., L'Ecuyer, T. S., Dzambo, A. M., Sy, O. O., McFarquhar, G. M., Poellot, M. R., Gupta, S., O'Brien, J. R., Nenes, A., Kacarab, M., Wong, J. P. S., Small-Griswold, J. D., Thornhill, K. L., Noone, D., Podolske, J. R., Schmidt, K. S., Pilewskie, P., Chen, H., Cochrane, S. P., Sedlacek, A. J., Lang, T. J., Stith, E., Segal-Rozenhaimer, M., Ferrare, R. A., Burton, S. P., Hostetler, C. A., Diner, D. J., Seidel, F. C., Platnick, S. E., Myers, J. S., Meyer, K. G., Spangenberg, D. A., Maring, H., and Gao, L.: An overview of the ORACLES (ObseRvations of Aerosols above CLouds and their intEractionS) project: aerosol–cloud–radiation interactions in the southeast Atlantic basin, Atmos. Chem. Phys., 21, 1507–1563, https://doi.org/10.5194/acp-21-1507-2021, 2021.
Richter, I. and Mechoso, C. R.: Orographic Influences on Subtropical Stratocumulus, J. Atmos. Sci., 63, 2585–2601, 2006.
Ryoo, J.-M., Pfister, L., Ueyama, R., Zuidema, P., Wood, R., Chang, I., and Redemann, J.: A meteorological overview of the ORACLES (ObseRvations of Aerosols above CLouds and their intEractionS) campaign over the southeastern Atlantic during 2016–2018: Part 1 – Climatology, Atmos. Chem. Phys., 21, 16689–16707, https://doi.org/10.5194/acp-21-16689-2021, 2021.
Sakaeda, N., Wood, R., and Rasch, P. J.: Direct and semidirect aerosol effects of southern African biomass burning aerosol, J. Geophys. Res., 116, D12205, https://doi.org/10.1029/2010JD015540, 2011.
Scott, R. C., Myers, T. A., Norris, J. R., Zelinka, M. D., Klein, S. A., Sun, M., and Doelling, D. R.: Observed Sensitivity of Low-Cloud Radiative Effects to Meteorological Perturbations over the Global Oceans, J. Climate, 33, 7717–7734, 2020.
Shinozuka, Y., Saide, P. E., Ferrada, G. A., Burton, S. P., Ferrare, R., Doherty, S. J., Gordon, H., Longo, K., Mallet, M., Feng, Y., Wang, Q., Cheng, Y., Dobracki, A., Freitag, S., Howell, S. G., LeBlanc, S., Flynn, C., Segal-Rosenhaimer, M., Pistone, K., Podolske, J. R., Stith, E. J., Bennett, J. R., Carmichael, G. R., da Silva, A., Govindaraju, R., Leung, R., Zhang, Y., Pfister, L., Ryoo, J.-M., Redemann, J., Wood, R., and Zuidema, P.: Modeling the smoky troposphere of the southeast Atlantic: a comparison to ORACLES airborne observations from September of 2016, Atmos. Chem. Phys., 20, 11491–11526, https://doi.org/10.5194/acp-20-11491-2020, 2020.
Tao, W.-K., Chen, J.-P., Li, Z., Wang, C., and Zhang, C.: Impact of aerosols on convective clouds and precipitation, Rev. Geophys., 50, RG2001, https://doi.org/10.1029/2011RG000369, 2012.
Wilcox, E. M.: Stratocumulus cloud thickening beneath layers of absorbing smoke aerosol, Atmos. Chem. Phys., 10, 11769–11777, https://doi.org/10.5194/acp-10-11769-2010, 2010.
Witthuhn, J., Hünerbein, A., and Deneke, H.: Evaluation of satellite-based aerosol datasets and the CAMS reanalysis over the ocean utilizing shipborne reference observations, Atmos. Meas. Tech., 13, 1387–1412, https://doi.org/10.5194/amt-13-1387-2020, 2020.
Wood, R.: Review, Stratocumulus Clouds, Mon. Weather Rev., 140, 2373–2423, https://doi.org/10.1175/MWR-D-11-00121.1, 2012.
Wood, R.: Clouds and Fog, Stratus and Stratocumulus, Encyclopedia of Atmospheric Sciences, 2nd edn., edited by: North, G. R., Pyle, J., and Zhang, F., https://doi.org/10.1016/B978-0-12-382225-3.00396-0, 2015.
Zhang, J. and Zuidema, P.: The diurnal cycle of the smoky marine boundary layer observed during August in the remote southeast Atlantic, Atmos. Chem. Phys., 19, 14493–14516, https://doi.org/10.5194/acp-19-14493-2019, 2019.
Zhang, J. and Zuidema, P.: Sunlight-absorbing aerosol amplifies the seasonal cycle in low-cloud fraction over the southeast Atlantic, Atmos. Chem. Phys., 21, 11179–11199, https://doi.org/10.5194/acp-21-11179-2021, 2021.
Zhang, Y., Stevens, B., Medeiros, B., and Ghil, M.: Low-Cloud Fraction, Lower-Tropospheric Stability, and Large-Scale Divergence, J. Climate, 22, 4827–4844, https://doi.org/10.1175/2009JCLI2891.1, 2009.
Zuidema, P.: Convective Clouds over the Bay of Bengal, Mon. Weather Rev., 131, 780–798, https://doi.org/10.1175/1520-0493(2003)131<0780:CCOTBO>2.0.CO;2, 2003.
Zuidema, P., Leon, D., Pazmany, A., and Cadeddu, M.: Aircraft millimeter-wave passive sensing of cloud liquid water and water vapor during VOCALS-REx, Atmos. Chem. Phys., 12, 355–369, https://doi.org/10.5194/acp-12-355-2012, 2012.
Zuidema, P., Redemann, J., Haywood, J., Wood, R., Piketh, S., Hipondoka, M., and Formenti, P.: Smoke and Clouds above the Southeast Atlantic, Upcoming Fields Campaigns Probe Absorbing Aerosol's Impact on Climate, NOWCAST, https://doi.org/10.1175/BAMS-D-15-00082.1, 2016.
Zuidema, P., Sedlacek, A. J. III, Flynn, C., Springston, S., Delgadillo, R., Zhang, J., Aiken, A. C., Koontz, A., and Muradyan, P.: The Ascension Island boundary layer in the remote southeast Atlantic is often smoky, Geophys. Res. Lett., 45, 4456–4465, https://doi.org/10.1002/2017GL076926, 2018.
- Abstract
- Introduction
- Data and methodology
- Variability in synoptic-scale circulation during the deployments
- Relationships between low cloud cover and meteorological variables
- Summary and discussion
- Data availability
- Author contributions
- Competing interests
- Disclaimer
- Special issue statement
- Acknowledgements
- Financial support
- Review statement
- References
- Supplement