the Creative Commons Attribution 4.0 License.
the Creative Commons Attribution 4.0 License.
 | 28 Oct 2022
Organic enrichment in droplet residual particles relative to out of cloud over the northwestern Atlantic: analysis of airborne ACTIVATE data
Hossein Dadashazar
Andrea F. Corral
Ewan Crosbie
Sanja Dmitrovic
Simon Kirschler
Kayla McCauley
Richard Moore
Claire Robinson
Joseph S. Schlosser
Michael Shook
K. Lee Thornhill
Christiane Voigt
Edward Winstead
Luke Ziemba
Armin Sorooshian
Cloud processing is known to generate aerosol species such as sulfate and secondary organic aerosol, yet there is a scarcity of airborne data to examine this issue. The NASA Aerosol Cloud meTeorology Interactions oVer the western ATlantic Experiment (ACTIVATE) was designed to build an unprecedented dataset relevant to aerosol–cloud interactions with two coordinated aircraft over the northwestern Atlantic, with aerosol mass spectrometer data used from four deployments between 2020–2021 to contrast aerosol composition below, in (using a counterflow virtual impactor) and above boundary layer clouds. Consistent features in all time periods of the deployments (January–March, May–June, August–September) include the mass fraction of organics and relative amount of oxygenated organics ( 44) relative to total organics (f44) increasing in droplet residuals relative to below and above cloud. Detailed analysis comparing data below and in cloud suggests a possible role for in-cloud aqueous processing in explaining such results; an intriguing aspect though requiring more attention is that only approximately a quarter of the cloud cases (29 of 110) showed higher organic mass fractions either below or above cloud. Of those 29 cases, the majority (25) showed higher organic mass fraction below cloud base where the cloud processing signature is presumably more evident as compared to above cloud. These results are consistent with the few past studies analyzing droplet residuals pointing to higher organic enrichment than in adjacent cloud-free areas. The data findings are important as other datasets (e.g., reanalysis) suggest that sulfate is both more abundant than organics (in contrast to this work) and more closely related to drop number concentrations in the winter when aerosol–cloud interactions are strongest. Here we show that organics are more abundant than sulfate in the droplet residuals and that aerosol interaction with clouds potentially decreases particle hygroscopicity due to the increase in organic:sulfate ratio for droplet residuals relative to surrounding cloud-free air. These results are important in light of the growing importance of organics over the northwestern Atlantic in recent decades relative to sulfate owing to the success of regulatory activity over the eastern United States to cut sulfur dioxide emissions.
- Article
(4080 KB) - Full-text XML
-
Supplement
(1546 KB) - BibTeX
- EndNote


The nature of aerosol–cloud interactions over the northwestern Atlantic Ocean is uncertain even though the region has been the target of decades of atmospheric research (Sorooshian et al., 2020). These interactions include a subset of aerosol particles called cloud condensation nuclei (CCN) that activate into cloud droplets, which subsequently undergo aqueous processing to transform into a particle after evaporation varying in size and composition relative to the original CCN. An aspect of these steps that is poorly characterized is the composition of the droplet residuals in cloud relative to particles below and above clouds, which requires airborne measurements. The NASA Aerosol Cloud meTeorology Interactions oVer the western ATlantic Experiment (ACTIVATE) was designed to collect in situ and remote sensing data in and around clouds during different seasons in a region with a wide range of weather conditions (Painemal et al., 2021) and air mass sources (Corral et al., 2021), qualifying as a suitable dataset to examine this very issue.
The annual cycle of aerosol and cloud drop number concentrations (Nd) varies in the northwestern Atlantic, with aerosol parameters (e.g., aerosol optical depth, aerosol index) peaking in summer months in contrast to Nd being highest the winter (Fig. 1). This discrepancy was reconciled by Dadashazar et al. (2021a) who showed that conditions linked to cold air outbreak events (e.g., enhanced turbulence, higher marine boundary layer (MBL) height, higher low-level liquid cloud fraction) promote stronger aerosol–cloud interactions in the winter to help activate particles into drops with higher efficiency than other times of the year. Gradient boosted regression tree analysis revealed that the most influential aerosol parameter in predicting Nd was either surface mass concentration of sulfate (winter) or organics (summer). However, those results were based on reanalysis data without any indication of causal effects between aerosol composition and cloud microphysics. Airborne in situ data are needed to unravel the composition details in and around clouds. Of particular interest related to aerosol chemical characterization around clouds is growing evidence in the literature that in-cloud aqueous processing can generate not only sulfate (Barth et al., 2000; Ervens, 2015) but also secondary organic aerosol (SOA) (Blando and Turpin, 2000; Warneck, 2003; Sorooshian et al., 2006a; Ervens et al., 2011; Heald et al., 2011), which is hypothesized to manifest itself in enhanced organic mass fractions in droplet residuals relative to below and above cloud. Past work over the northwestern Atlantic has pointed to the importance of secondary formation via gas-to-particle conversion processes in influencing the organic carbon budget of aerosol particles (de Gouw et al., 2005; Schroder et al., 2018; Shah et al., 2019). Furthermore, chemical analysis of droplet residuals should lend insight into the properties of aerosol particles that will be released after droplets evaporate, which could control their propensity to activate in a subsequent passage through cloud, with past work showing an important role for organics (Russell et al., 2000; Drewnick et al., 2007; Mertes et al., 2007; Hawkins et al., 2008; Asa-Awuku et al., 2015).

Figure 1(a) Monthly mean values (January 2013–December 2017) of CERES–MODIS cloud droplet number concentration (Nd) for low-level clouds (heights below 700 hPa), MERRA-2 aerosol index, and MERRA-2 total and speciated (sulfate and organic) aerosol optical depth. Data used apply to the spatial area over the northwestern Atlantic where ACTIVATE data were collected (boxes 1–3 in Fig. 2). (b) Monthly mean values of sulfate and organic using ACTIVATE airborne data differentiated by marine boundary layer (BCB/BBL legs) versus free troposphere (ACT/ABL legs); these legs are described in Sect. 2.1.
The goal of this study is to compare aerosol mass spectrometer data over the northwestern Atlantic below, in, and above clouds for different times of the year (January–March, May–June, August–September). Case studies of flights during cold air outbreaks probe deeper to better understand the nature of aerosol and droplet residual particle composition during these events with stronger aerosol–cloud interactions as compared to other times of the year (Dadashazar et al., 2021a; Painemal et al., 2021). The results have implications for aerosol–cloud interactions as droplet residual composition is shown here to deviate from that of aerosol out of cloud.
2.1 Field campaign description
We use airborne in situ data collected aboard the HU-25 Falcon from deployments 1 (14 February–12 March 2020), 2 (13 August–30 September 2020), 3 (27 January–2 April 2021), and 4 (13 May–30 June 2021) of the ACTIVATE mission. Data necessary for this study were only available for two flights in deployment 3 (29 January and 3 February) owing to an aircraft maintenance issue reducing the size of the available payload. ACTIVATE employs a dual aircraft approach with the Falcon acquiring in situ data for trace gases, aerosol particles, and clouds in the MBL while a King Air flies overhead at ∼ 9 km conducting remote sensing measurements and launching dropsondes (Sorooshian et al., 2019). Typical flights are ∼ 3–4 h based out of NASA Langley Research Center in Hampton, Virginia. The Falcon flies in what are termed “ensembles”, which comprise legs in the following nominal order: below cloud base (BCB), above cloud base (ACB), and minimum altitude leg at ∼ 150 m (min. alt.), above cloud top (ACT), below cloud top (BCT), and then descent back to BCB to start a new ensemble. Cloud-free ensembles include the following legs: min. alt., below boundary layer top (BBL), above boundary layer top (ABL), and then descent back down to min. alt. to start a new ensemble. The Falcon flies at ∼ 120 m s−1, with the duration (length) of each leg and cloud ensemble being ∼ 3.3 min (∼ 24 km) and 35 min (∼ 250 km), respectively. Cloud-free ensembles were approximately 15 min (∼ 100 km). The repeated nature of these ensembles has built a large statistical database relevant to aerosol–cloud–meteorology interactions. Clear ensembles were generally closer to the coast.
2.2 Airborne instrument details
The central dataset relevant to aerosol composition in this study comes from the aerodyne high-resolution time-of-flight aerosol mass spectrometer (AMS) (DeCarlo et al., 2008). The instrument measures submicrometer non-refractory aerosol composition in 1 Hz Fast-MS mode with data averaged to 25 s time resolution. We make use of specific mass spectral markers including 43 (mostly C2H3O+) and 44 (), which represent oxygenated organic fragments, with the ratios of the markers relative to total organic mass referred to as f43 and f44, respectively. AMS measurements were conducted downstream of an isokinetic double diffuser inlet (Brechtel Manufacturing Inc.) in cloud-free conditions and downstream of a counterflow virtual impactor (CVI) inlet (Brechtel Manufacturing Inc.) in clouds (Shingler et al., 2012). For classification of data as cloud and cloud-free, we use a liquid water content (LWC) threshold of 0.05 g m−3 based on data from the Fast Cloud Droplet Probe (FCDP; Dp ∼ 3–50 µm) (SPEC Inc.; Kirschler et al., 2022). This LWC threshold has been used in recent work using ACTIVATE data (Dadashazar et al., 2021a). Data for both rain water content and ice water content were used from a two-dimensional stereo probe vertical direction (2DS-V; Dp ∼ 29–1465 µm) (SPEC, Inc.). We also use a proxy for hygroscopicity in the form of f(RH), which is the ratio of total light scattering between relative humidities of 80 % and 20 % as measured by tandem nephelometers (TSI Inc, St. Paul, MN, USA; Model 3563) (Ziemba et al., 2013).
Note that while cloud water samples were also chemically characterized, those data are outside the scope of this work as the partial speciation of organics in the cloud water samples makes it hard to compare to AMS total organics. Furthermore, particle-into-liquid sampler (PILS) data are not used owing to lengthier time resolution (∼ 5 min) and chemical smearing during sample collection (Sorooshian et al., 2006b) preventing a clear assignment of data to individual legs in ensembles.
2.3 Complementary datasets
2.3.1 HYSPLIT and CWT maps
We obtained 5 d back-trajectory data from NOAA's Hybrid Single-Particle Lagrangian Integrated Trajectory (HYSPLIT) model (Stein et al., 2015; Rolph et al., 2017) ending at the Falcon position during any of the 29 164 cloud-free AMS data points. Note that this includes data during cloud ensembles but only when cloud liquid water content was < 0.05 g m−3, and thus data during BCB and ACT legs are included. We relied on the National Centers for Environmental Prediction/National Center for Atmospheric Research (NCEP/NCAR) reanalysis data using the “model vertical velocity” method and obtained data points every 6 h along trajectories.
As this study is mainly focused on organics and sulfate, concentration-weighted trajectory (CWT) maps were generated using HYSPLIT back-trajectories in conjunction with speciated AMS data (Figs. S1 and S2 in the Supplement) to show the predominant sources for each of these two aerosol components (e.g., Hsu et al., 2003). As demonstrated by past works for other regions (e.g., Dadashazar et al., 2019), the method assigns a weighted concentration to grid cells based on mean concentrations passing through each grid cell from all the considered trajectories. CWT profile maps are produced using the GIS-based software called TrajStat (Wang et al., 2009).
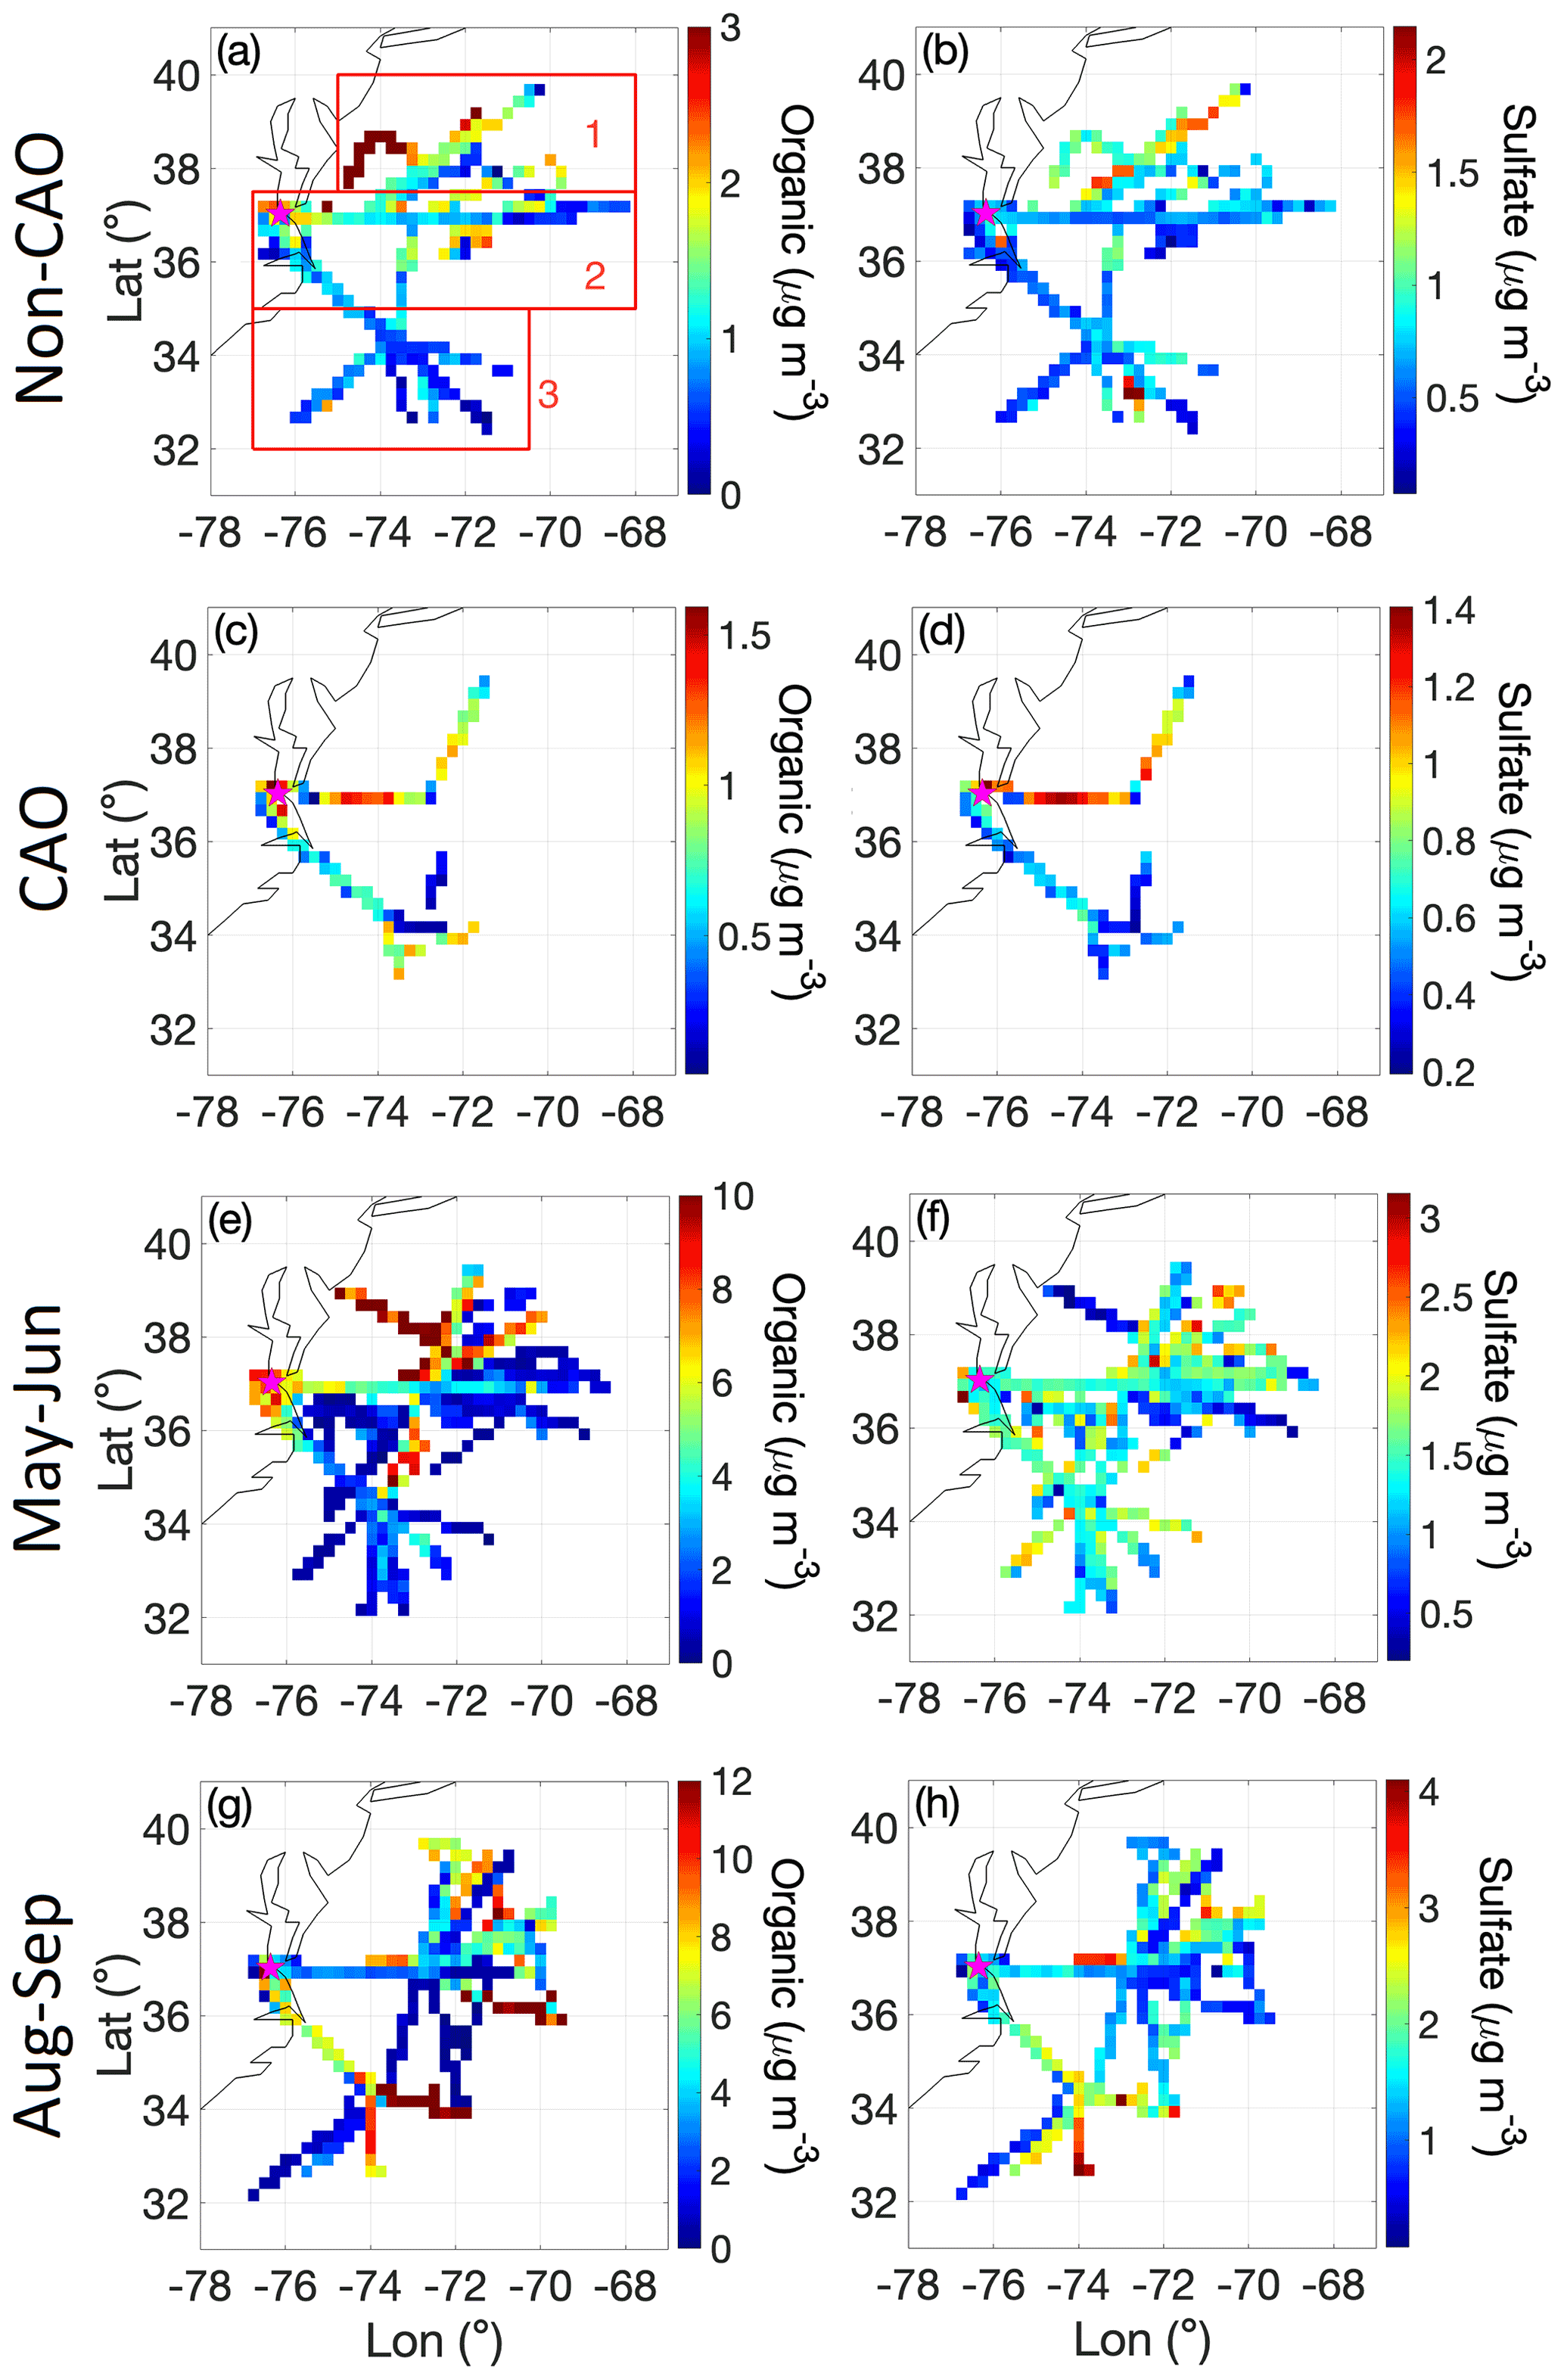
Figure 2Spatial map of cloud-free AMS data for organics and sulfate collected during deployments 1–4 of ACTIVATE spanning from February 2020 to June 2021. Non-CAO and CAO represent non-cold air outbreak and cold air outbreak days, respectively, between January and March. Spatial boxes labeled 1–3 in (a) correspond to domains used for calculations in other parts of this study. Grid cells are 0.25∘ × 0.25∘ and represent an average of data across all vertical levels flown between 0.02 and 8.1 km. Color bar scales differ by panel to highlight variability better within a panel.
2.3.2 MERRA-2
We use both total and speciated (sulfate and organic) aerosol optical depth (AOD) at 550 nm from the Modern-Era Retrospective analysis for Research and Applications-version 2 (MERRA-2) (Gelaro et al., 2017) between January 2013 and December 2017 near Aqua's overpass time (13:30 UTC). We also show results for aerosol index (AI), which is the product of AOD and the Ångström parameter. As the latter accounts for aerosol size, AI is better related to columnar CCN as compared to AOD (Nakajima et al., 2001). Data are used for the spatial area over the northwestern Atlantic, where ACTIVATE data were collected (boxes 1–3 in Fig. 2).
2.3.3 CERES–MODIS
Cloud droplet number concentrations (Nd) are presented for the ACTIVATE region following the specific calculations and filtering methods of Dadashazar et al. (2021a) using Clouds and the Earth's Radiant Energy System (CERES) edition 4 products (Minnis et al., 2011, 2021). CERES retrieval algorithms are applied to MODerate resolution Imaging Spectroradiometer (MODIS)-Aqua radiances as obtained during daytime overpasses around 13:30 LT. Level 3 cloud data were used between January 2013 and December 2017 at 1∘ × 1∘ resolution for low-level clouds (> 700 hPa) based on CERES–MODIS edition 4 Single Scanning Footprint (SSF) products (Loeb et al., 2016). Nd was calculated with an adiabatic cloud model (Grosvenor et al., 2018):
where k represents the droplet spectrum width (assumed to be 0.8 over the ocean), re is cloud drop effective radius, τ is cloud optical depth, Qext is the unitless extinction efficiency factor (assumed to be 2 for liquid droplets), and ρw is the density of water (1 g cm−3). Nd data are used when low-level liquid cloud fraction exceeded 40 %. Data are used for the same spatial area as MERRA-2 data (i.e., boxes 1–3 in Fig. 2).
2.4 Classification of cold air outbreak flights
We determine whether flights occurred during cold air outbreaks (CAOs) leveraging methods in recent ACTIVATE studies (Seethala et al., 2021; Corral et al., 2022). Briefly, Visible Infrared Imaging Radiometer Suite (VIIRS) imagery (NASA Worldview) is used to visually identify cloud streets that are characteristic of CAOs. Flight notes and weather forecast slides were used as additional confirmation, followed by data from dropsondes released from the King Air following the method described in Papritz et al. (2015).
A motivation of this study is the opposite annual pattern of Nd and aerosol parameters shown in Fig. 1a. Notable is that sulfate AOD exceeds that of organic AOD for all months based on MERRA-2 data, which has been shown before in the region (Braun et al., 2021). The ACTIVATE airborne data show that while the total concentrations of both aerosol components are higher in the summer months (similar to related aerosol parameters in Fig. 1a), a difference compared to MERRA-2 speciated AODs is that organic levels exceed those of sulfate (except January in the MBL), regardless of whether the data were collected in the MBL (i.e., BBL and BCB legs) or free troposphere (i.e., ACT and ABL legs) (Fig. 1b). Hegg et al. (1997) concluded for the month of June based on a chemical apportionment study using aerosol column optical depth data off the mid-Atlantic coast of the United States that the three most abundant components (in decreasing order) were water, carbonaceous compounds, and then sulfate. This is an important result with implications for aerosol characteristics such as hygroscopicity. For instance, higher organic:sulfate mass ratios in the MBL correspond to suppressed hygroscopic growth factors at high relative humidities (≥ 85 %) (Hersey et al., 2009).
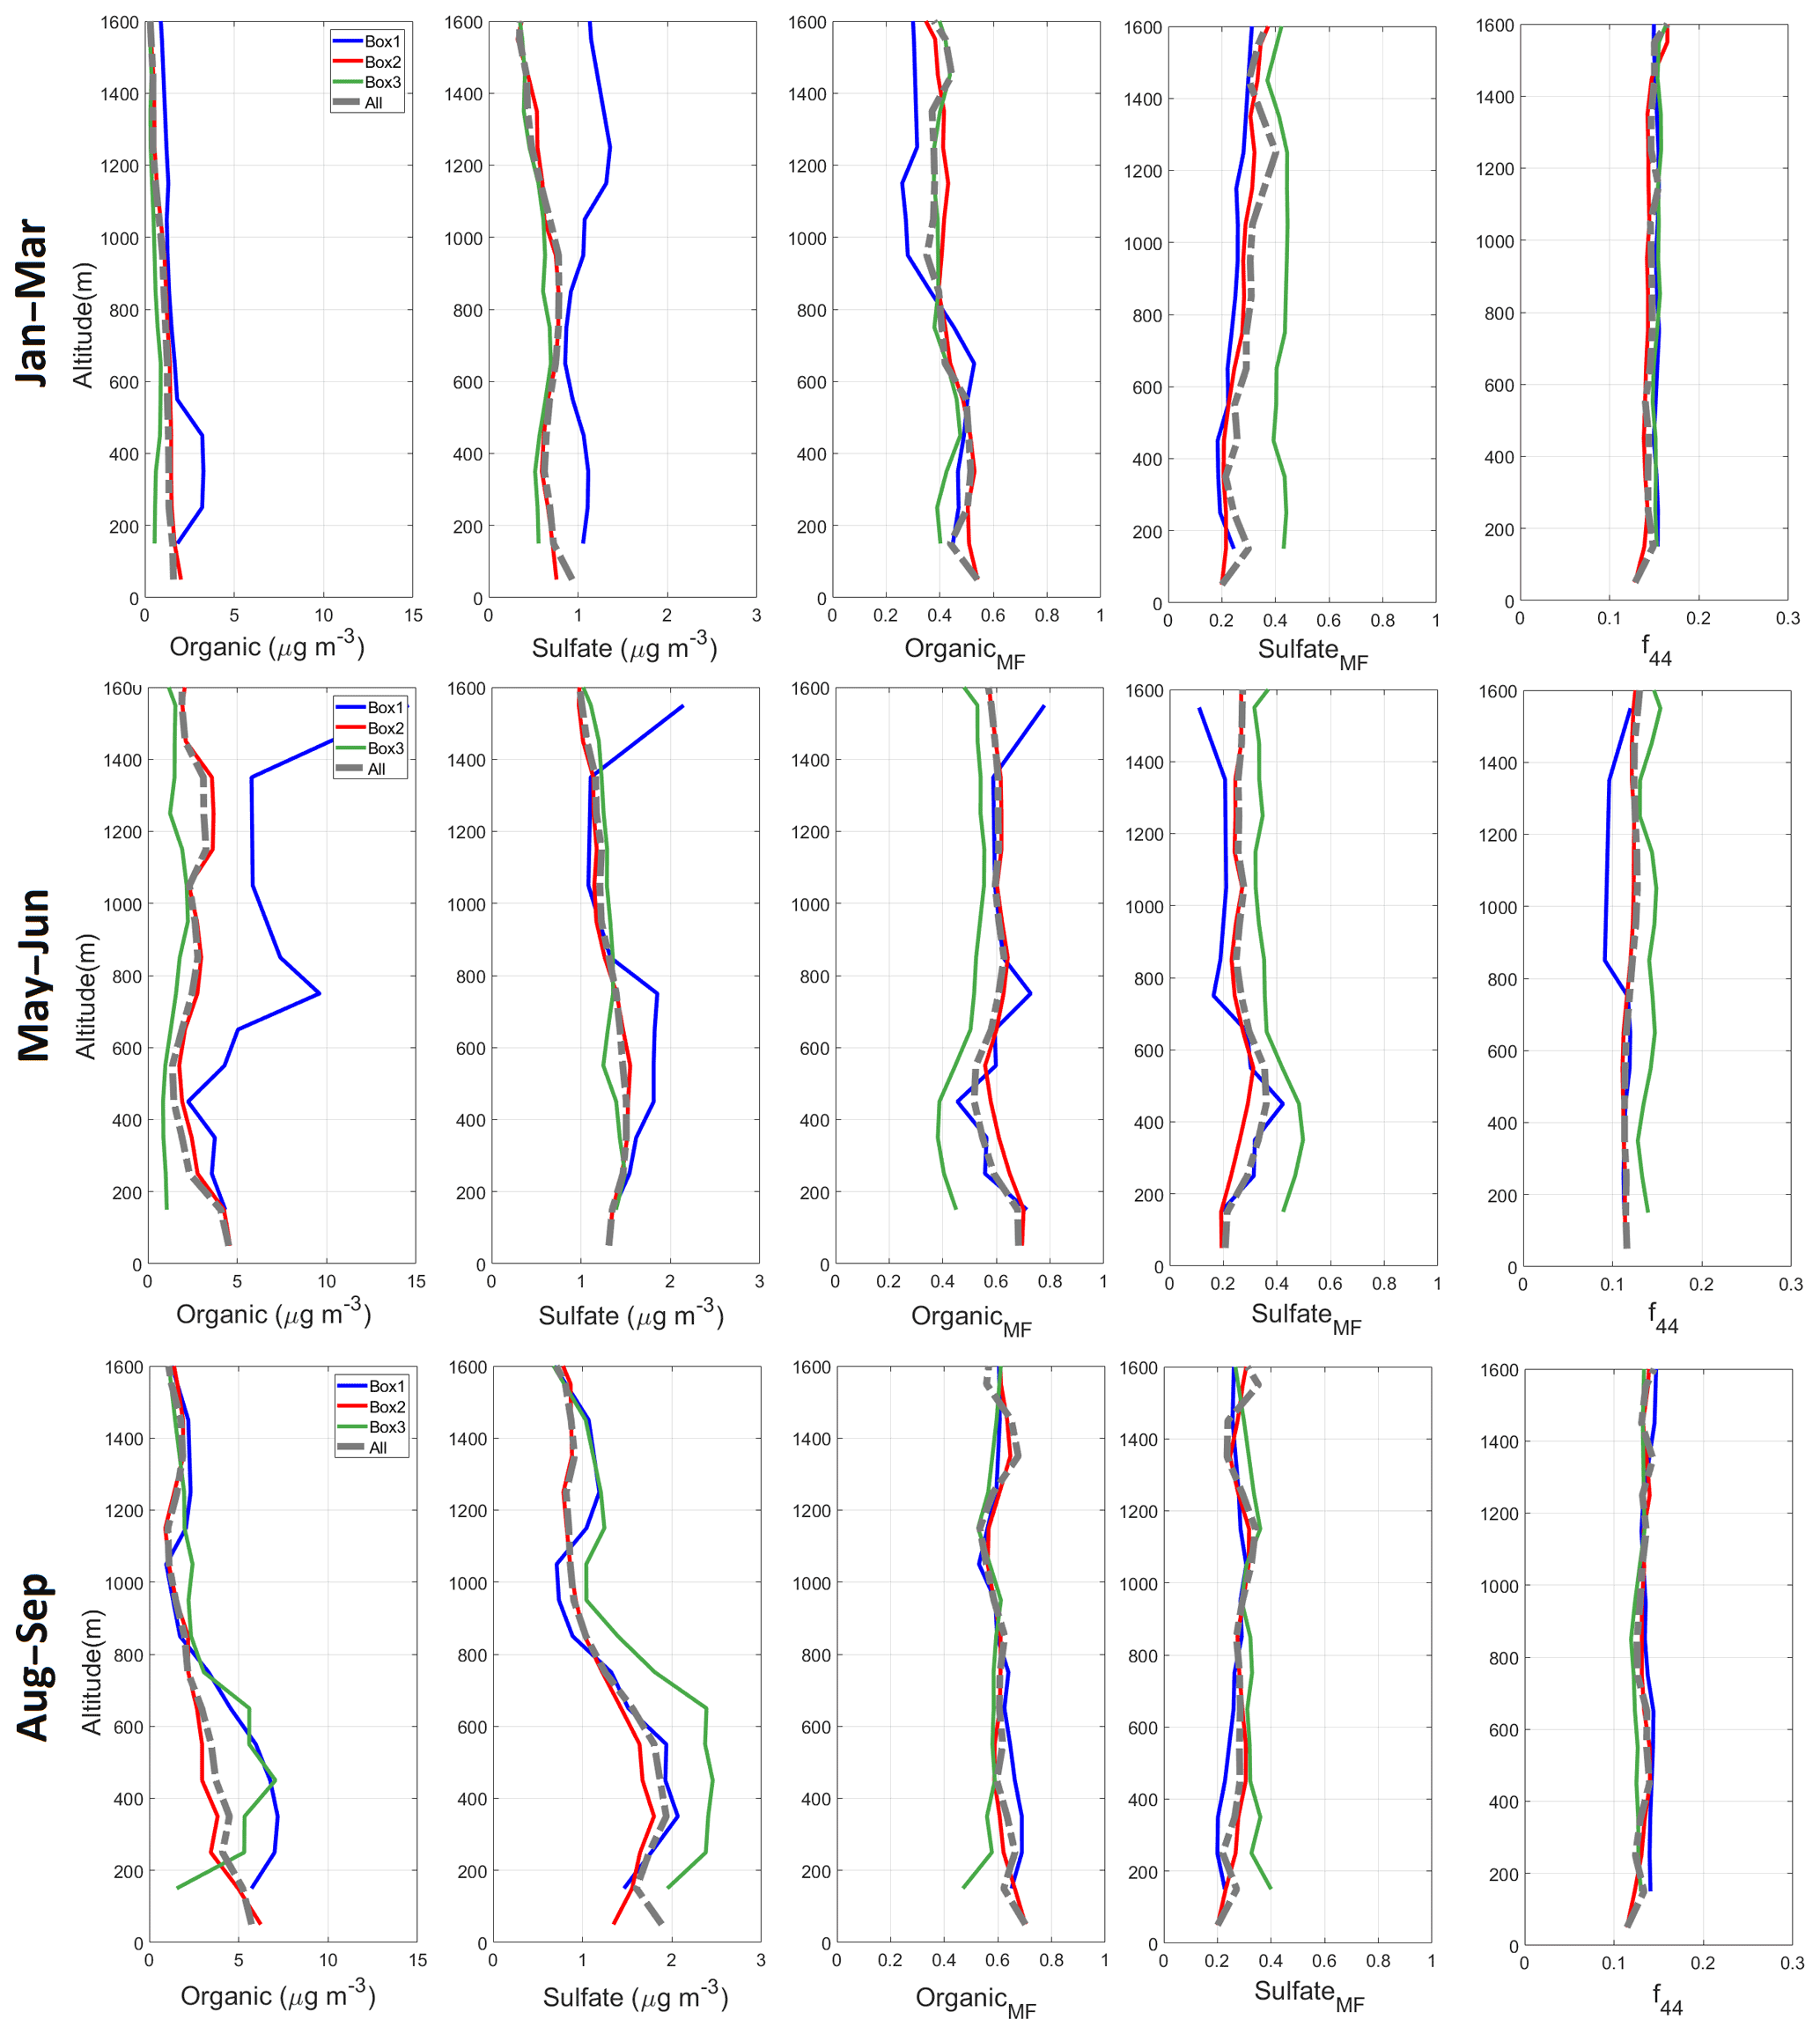
Figure 3Vertically-resolved cloud-free AMS data for the different time periods of ACTIVATE deployments and boxes defined in Fig. 2a. Shown are (left to right) organic and sulfate concentrations, organic and sulfate mass fraction, and the ratio of 44 to total organic (f44). The top row for January–March combines CAO and non-CAO days, which are separated for other parts of the study.
3.1 Multi-season overview of AMS composition
Relative to all AMS species, sulfate and organics are the dominant aerosol components by mass with combined mass fractions being near 75 % usually regardless of season or location relative to clouds (Tables S1 and S2 in the Supplement; spatial maps in Fig. 2); this is consistent with their predictive capability for Nd over the northwestern Atlantic (Dadashazar et al., 2021a). Nitrate and ammonium were the next most abundant components. The highest organic concentrations were in August–September assisted in part by transported wildfire emissions from western North America (Mardi et al., 2021). Mean vertical profiles of organics in each season (Fig. 3) show that in all months, but especially May–June and August–September, there is an enhancement at altitudes exceeding 200 m in the northernmost parts of the study region. Organic aerosol CWT maps reveal significant influence from continental sources based on the highest concentrations along trajectories coming from the US East Coast (Fig. S1). In terms of the nature of the organic aerosol fraction, vertical profiles of f44 were fairly similar between seasons and areas of the study region (Fig. 2), ranging in mean value for the various leg types in Table S1 between 0.11 and 0.27. For reference, the f44 of atomized oxalic acid, a tracer for cloud processing in the absence of biomass burning and coarse aerosol (Hilario et al., 2021 and references therein), is 0.36 (Lambe et al., 2011).
In contrast to organics, sulfate exhibits more spatially homogenous concentrations over the northwestern Atlantic (Fig. 2) owing largely to ocean-emitted dimethylsulfide that undergoes gas and in-cloud oxidation such as what was shown for the eastern North Atlantic (Ovadnevaite et al., 2014). This is supported by how sulfate's seasonal CWT maps (Fig. S2) differ from those of organics with comparable concentrations widespread over the northwestern Atlantic relative to the continent. The August–September CWT map for sulfate reveals more high concentration areas (note the different color bar scale for August–September in Fig. S2) over the continent with concentrations exceeding those over most of the ocean; this is presumably due to more secondary formation stemming from local sulfur dioxide emissions over the eastern US (Yang et al., 2018) aided in part by higher temperatures and humidity (Corral et al., 2021) that co-vary with other conditions favorable for sulfate production such as stagnation and certain air flow patterns (Tai et al., 2010). Figure 3 demonstrates that neither sulfate nor organics exhibit a clear reduction with altitude pointing towards a potential source aloft that might include long-range transport and/or secondary production.
Although based on only two consecutive days of flight data, results from Leaitch et al. (2010) are relevant in that they sampled below, in, and above boundary layer clouds over the northwestern Atlantic. On the first day with more marine influence, sulfate was more abundant than organics in fine particles below cloud. In contrast, the second day had more continental influence with organic levels exceeding those of sulfate below cloud, which was often the case during ACTIVATE (Table S1). They concluded with a parcel model that the impact of anthropogenic carbonaceous components on the cloud albedo effect can exceed that of anthropogenic sulfate, which motivates attention to the droplet residual composition discussed next.
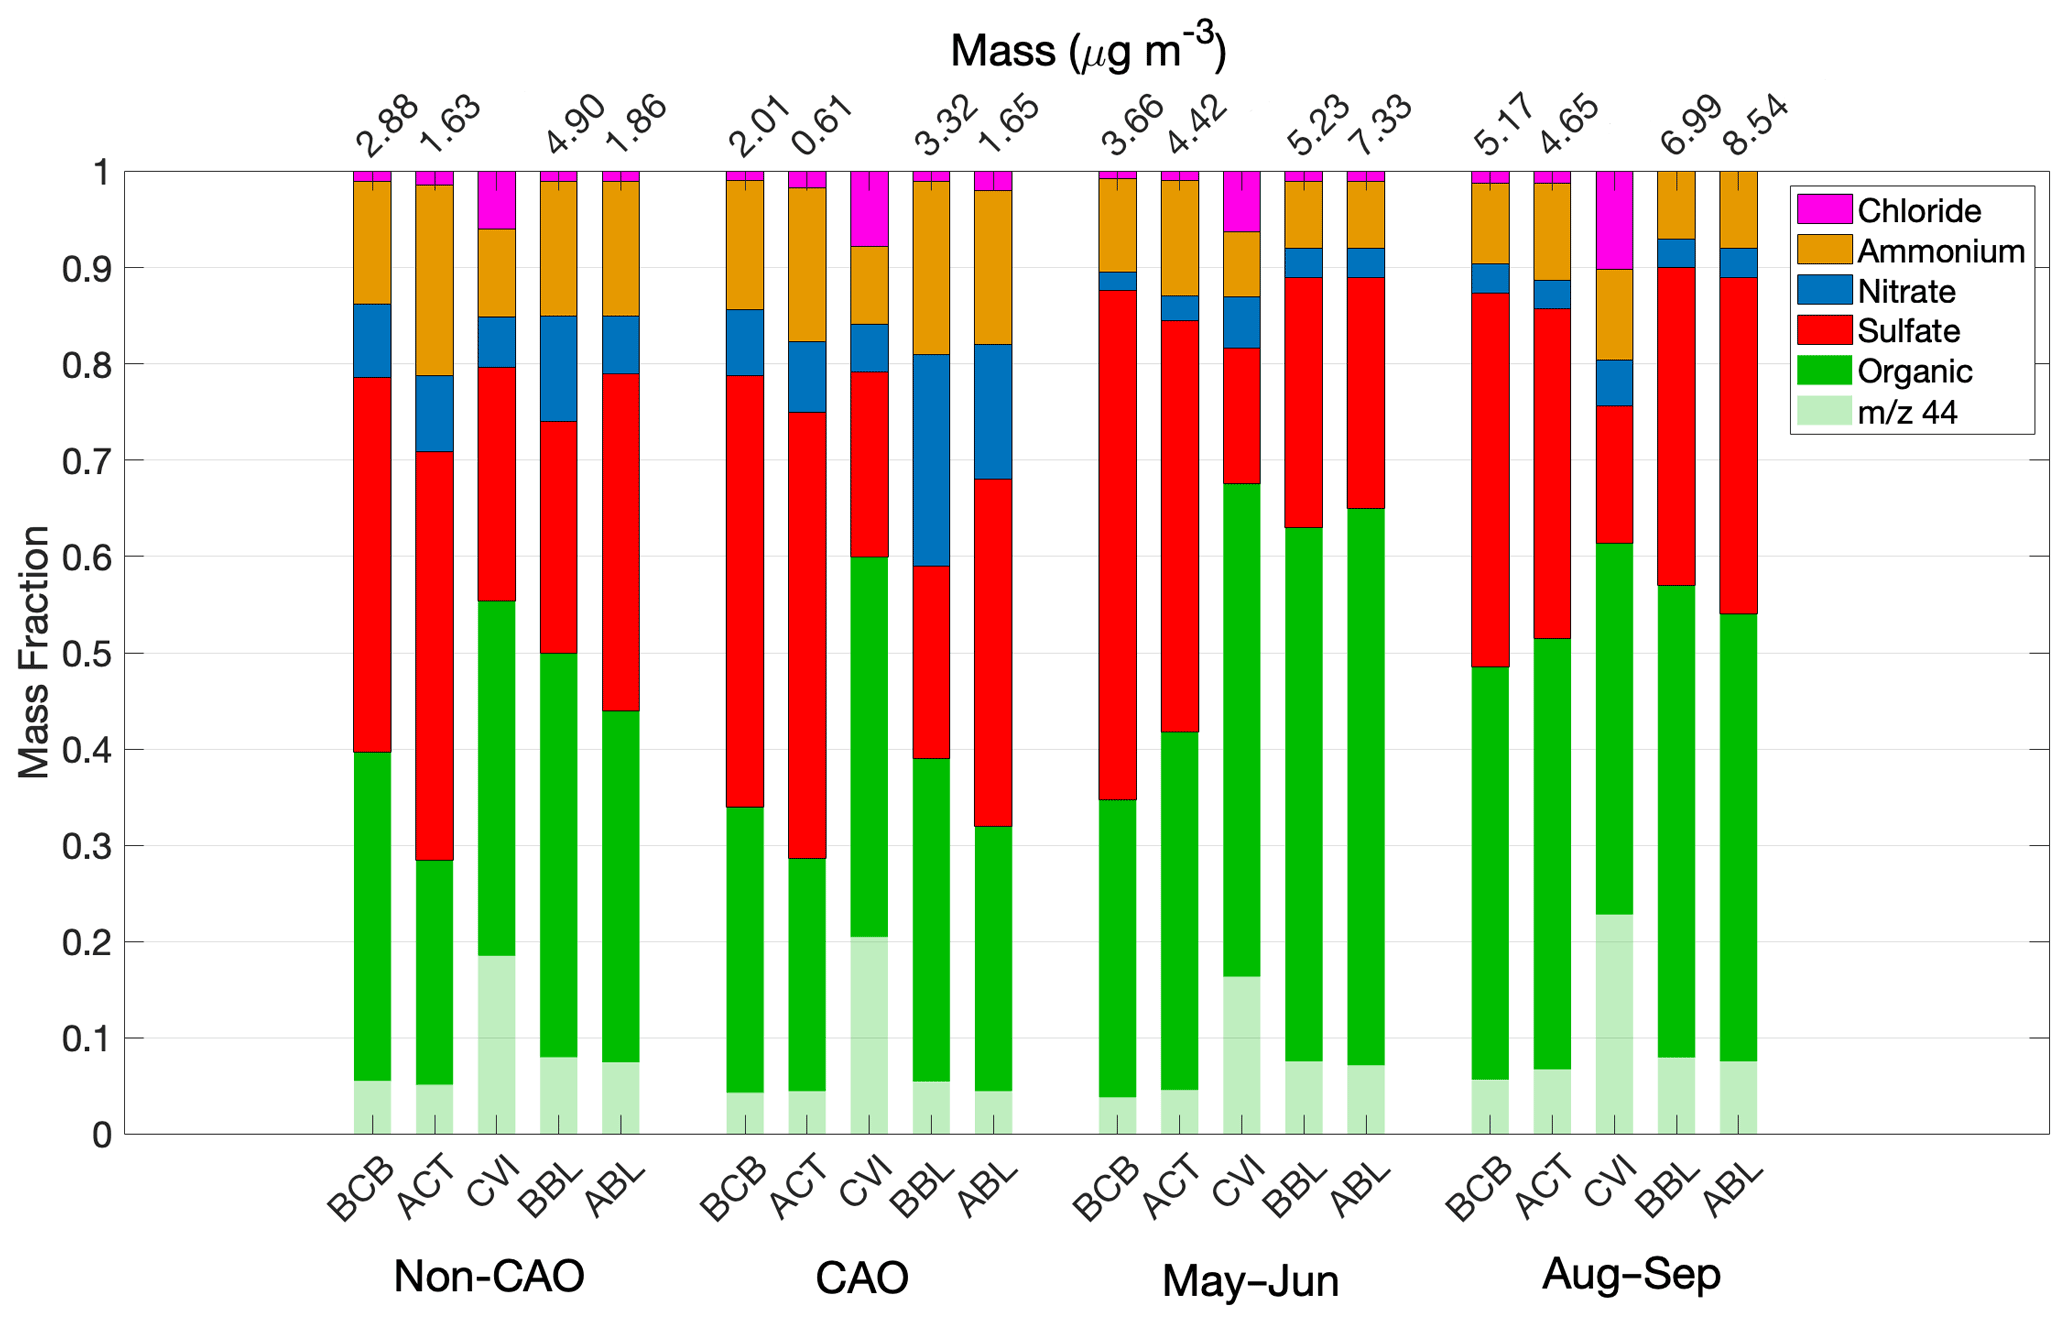
Figure 4Seasonal comparison of AMS mass fractions, including the relative contribution of 44 to total organic (f44). Numbers above each bar represent the mean total AMS mass concentration for that category; note that absolute masses are not reported downstream of a CVI owing to high uncertainties. Note that the non-CAO and CAO categories represent all flight data in January–March (deployments 1 and 3) that were separated using the criteria in Sect. 2.4.
3.2 Droplet residual composition
A striking result in all seasons is that organic mass fraction was higher downstream of the CVI in droplet residual particles in contrast to adjacent BCB and ACT legs in cloud ensembles (Fig. 4 and Table S1). To compensate, sulfate mass fractions decreased in droplet residuals. Furthermore, f44 increased in droplet residuals as compared to BCB and ACT data in each season, indicative of more contribution of oxygenated organic species like carboxylic acids. There was no significant difference in the mass fraction profiles between seasons for a fixed leg type (Fig. 4). The higher organic mass fractions in the BBL/ABL legs of clear ensembles relative to BCB/ACT legs of cloud ensembles can be explained by how most of the clear ensemble data were collected closer to land where there are greater organic levels in the continental outflow relative to farther offshore where sulfate presumably becomes more important due to marine emissions of precursors such as dimethylsulfide. The region's synoptic flow is not always strictly offshore from west to east. Thus, the higher organic content near the coast often could just be due to local emissions that are confined to the coast and are not advected any farther east.
The organic mass fraction and f44 changes in droplet residuals can be explained at least in part by some combination of preferential activation of CCN with these special properties and/or aqueous processing in droplets to generate oxygenated organics. Although not the focus here, the high chloride mass fractions in droplet residuals (Fig. 4) can be explained by how sea salt would preferentially activate into drops owing to its large size and that the AMS has some ability (albeit not efficient) to detect sea salt chloride (Zorn et al., 2008; Ovadnevaite et al., 2012).
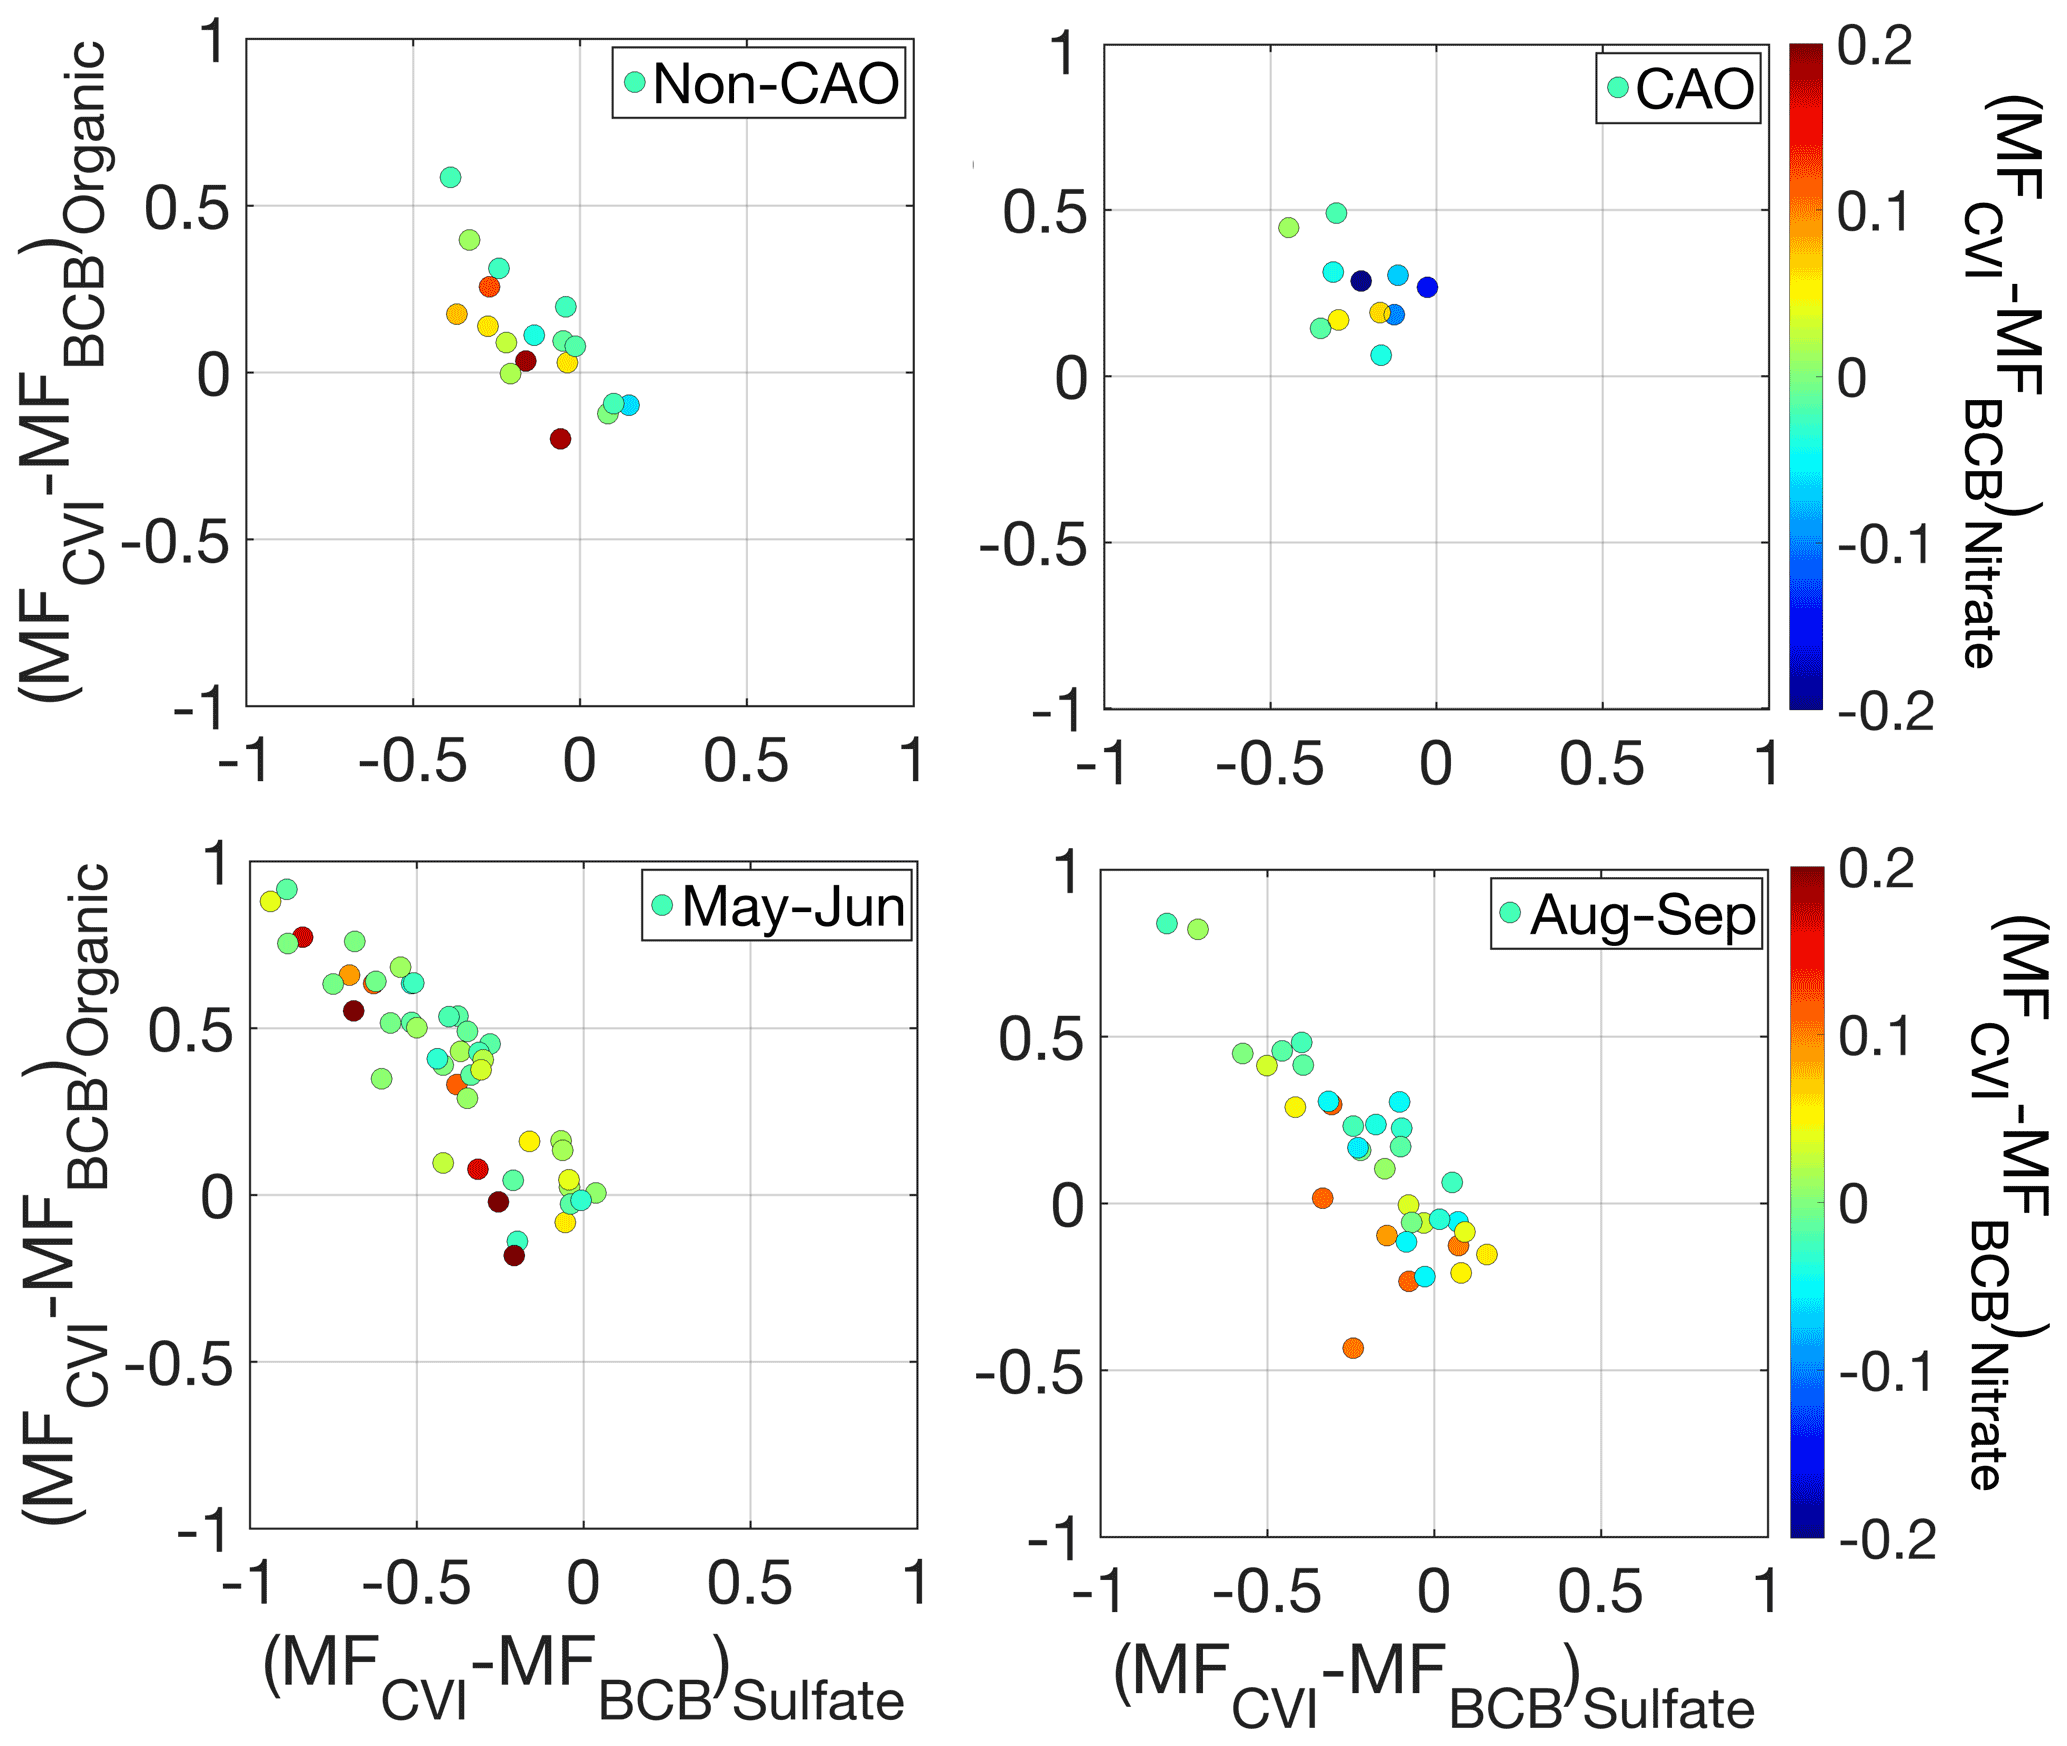
Figure 5Scatterplot of the difference in organic mass fraction in cloud legs with CVI data and below cloud base (BCB) legs for an individual cloud ensemble relative to the analogous difference for sulfate mass fraction between the same pair of legs. Markers are colored by the analogous difference in nitrate mass fraction. Panels represent different seasons with winter deployments (January–March) separated into CAO and non-CAO days.
We next examine scatterplots of organic mass fraction (i.e., organic mass divided by total AMS mass) differences between each cloud leg with CVI–AMS data and its closest BCB leg in the same cloud ensemble versus analogous sulfate mass fraction differences for the same pair of legs (Fig. 5). Aqueous processing to preferentially increase one of the two species relative to the other would presumably translate into a positive value on the more preferred species' axis; in other words, if there was more organic aerosol formation in clouds via aqueous processing relative to sulfate, it would register as a positive (negative) value on the y (x) axis. Regardless of season, the results reveal a consistent feature of increasing (decreasing) organic (sulfate) mass fraction downstream of the CVI relative to BCB samples, suggestive of aqueous processing shifting the composition to be more organic-rich. For the very few points laying to the bottom left of the origin, nitrate is often more enhanced in those droplet residual samples relative to BCB data. Comparing CVI–AMS data to the closest ACT leg in the same ensemble reveals a similar trend (not shown).
A comparison of f44 versus f43 in “triangle plot” format (Ng et al., 2010) shows an important difference between CVI and BCB/ACT data in each season (Fig. 6). Ambient organic aerosols typically converge at the top left of the triangle representative of more atmospheric aging leading to low volatility oxygenated organic aerosol species. The CVI data are systematically higher and to the left of the triangle plot in each season. In contrast, the BCB and ACT data are lower and to the right of the triangle plots without much distinction, suggestive of a similarly lower level of oxygenation relative to droplet residuals.
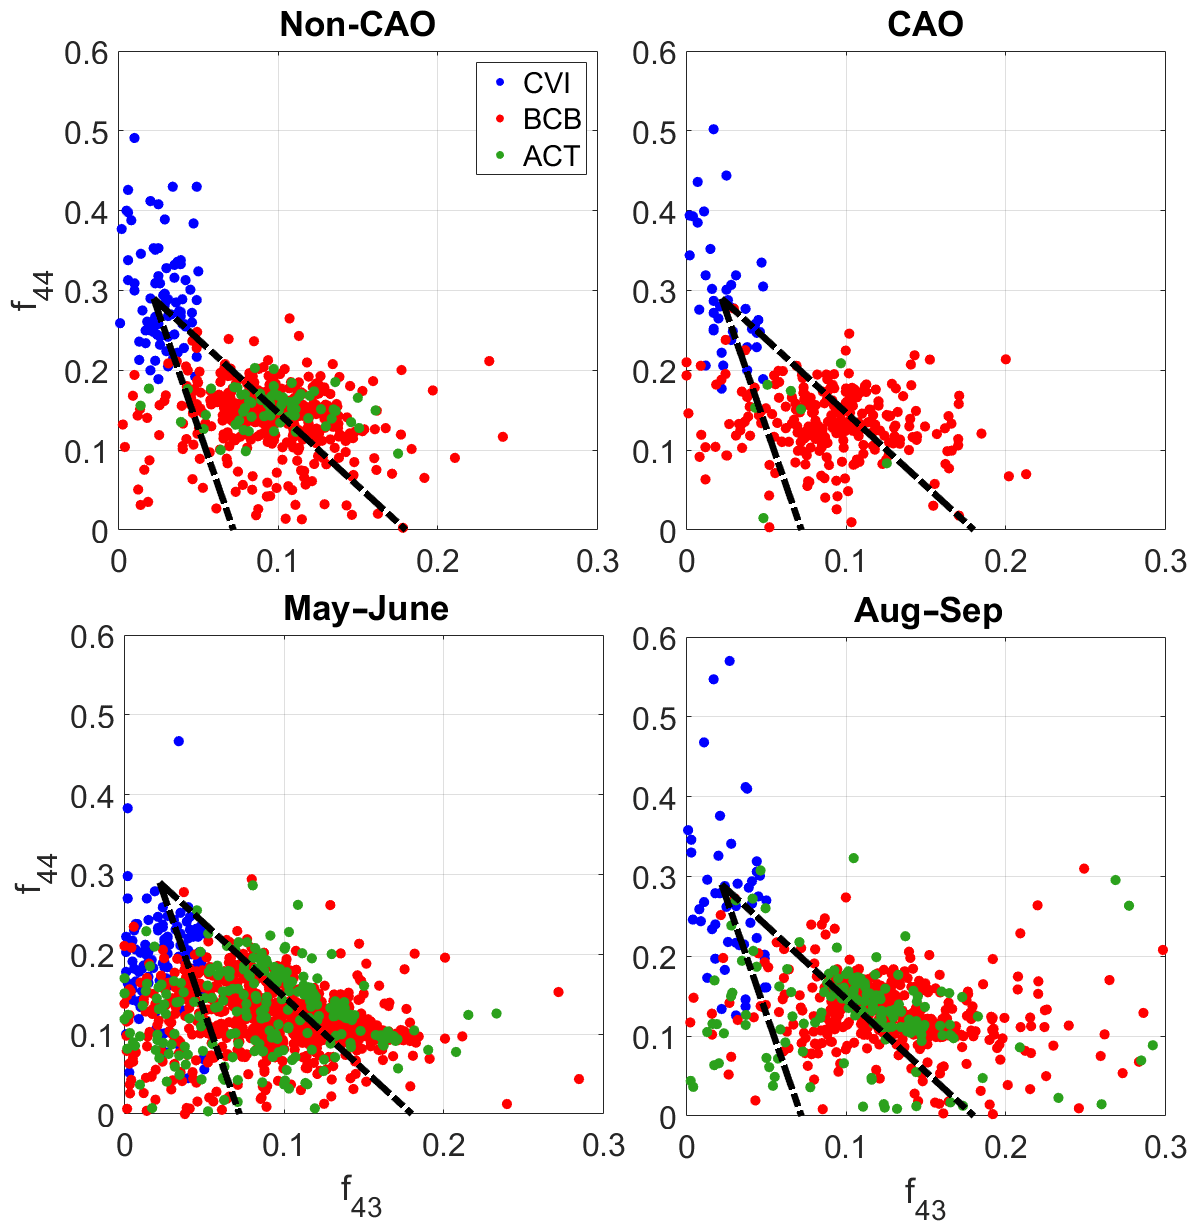
Figure 6Comparison of f44 and f43 for individual BCB and ACT legs out of cloud, in addition to CVI data in cloud legs. Panels represent different seasons with winter deployments (January–March) separated into CAO and non-CAO days. Superimposed on the plots are triangles corresponding to how former work (Ng et al., 2010) compared these ratios. Points with organic mass concentration less than 0.5 µg m−3 were omitted from this analysis.
The CVI droplet residuals are more oxidized because of some combination of aqueous processing effects to yield more oxidized organic species, or because CCN with higher f44 activated into droplets. To probe more into which of the two aforementioned processes could be more responsible for the cluster of CVI points at the top left of the triangle plots, we next examine (analogous to Fig. 5) scatterplots of f44,CVI–f44,BCB versus f43,CVI–f43,BCB, where data are compared between the pair of cloud and BCB legs closest to one another in individual cloud ensembles (Fig. 7). If there was no difference in organic composition between a pair of legs, a marker representing that pair would be at the origin. Aqueous processing is presumed to result in a positive (negative) value on the y (x) axis. Each season consistently exhibits points positioned to the top left of the origin suggestive of aqueous processing leading to the enhanced oxygenation of the organic fraction in droplet residuals relative to BCB legs.
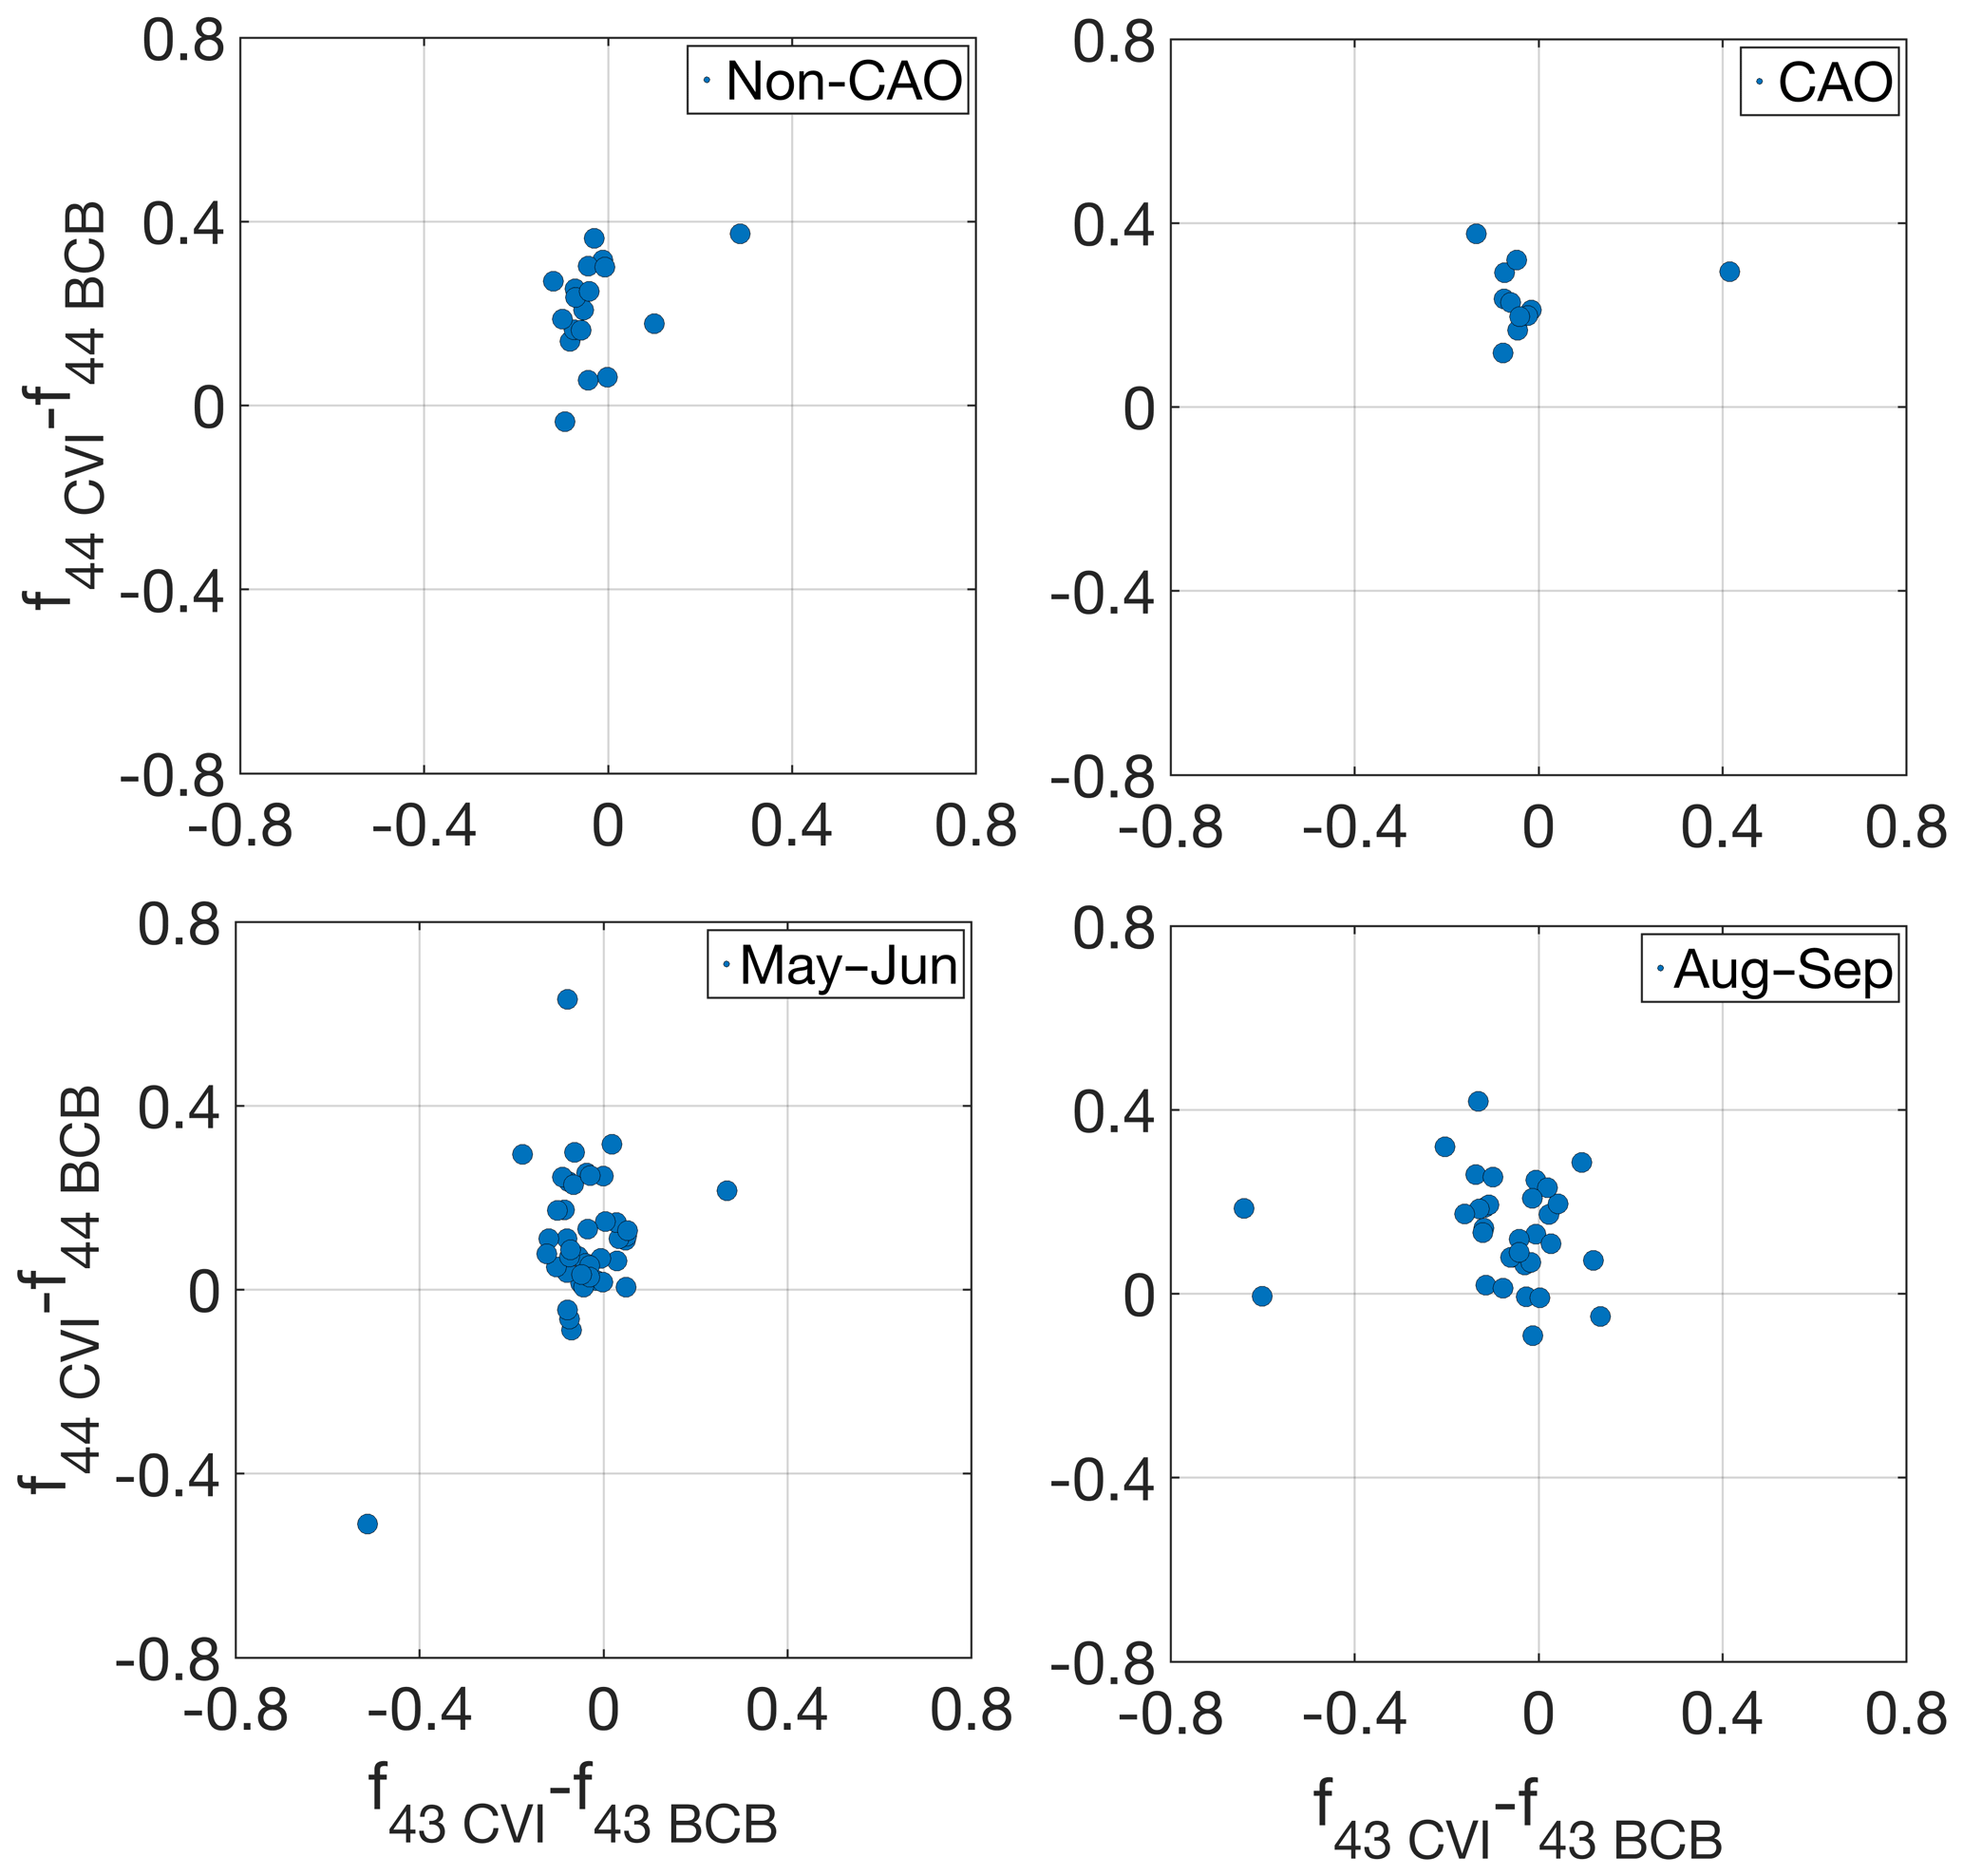
Figure 7Scatterplot of the difference in f44 in cloud legs with CVI data and below cloud base (BCB) legs for an individual cloud ensemble relative to the analogous difference for f43. Panels represent different seasons with winter deployments (January–March) separated into CAO and non-CAO days.
A discussion on possible contributing factors (other than aqueous processing) to the different chemical signature in CVI samples relative to adjacent cloud-free areas is warranted. First, we note that 23 % of BCB/CVI pairs of data points (25 out of 110) exhibited higher organic mass fraction in the BCB leg relative to droplet residuals (Fig. 8). This number increases to 26 % when considering if either the BCB or ACT organic mass fraction was higher than the corresponding CVI data in cloud for an ensemble. Clearly the cases where a higher organic mass fraction was observed out of cloud seems to be most prevalent below cloud suggesting that location is where a cloud processing signature can be more reliably observed. These 26 % of the cases studied demonstrate that the null case exists without an organic enhancement downstream of the CVI, reducing concerns over instrument and sampling artifacts.
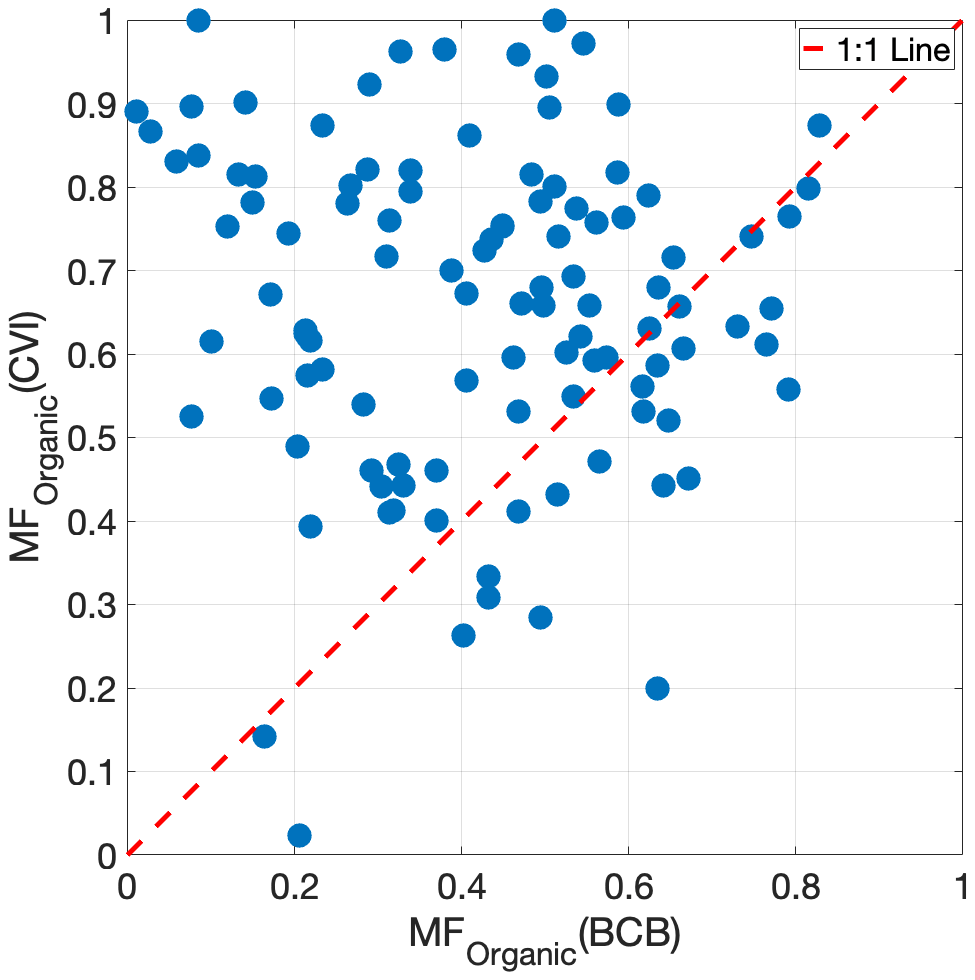
Figure 8Scatterplot of organic mass fraction in droplet residuals (downstream CVI in cloud) and in aerosol sampled during the closest below cloud base (BCB) leg from ACTIVATE deployments 1–4. A total of 25 points out of a total of 110 (23 %) were below the 1:1 line.
In terms of the contamination due to the inlet's material of construction, the CVI inlet was designed with both stainless steel and aluminum yielding negligible organic contamination (Shingler et al., 2012). A way to test this is to conduct CVI sampling in cloud-free conditions. Figure S3 in the Supplement shows a representative time series of AMS data during a flight (research flight 10 on 28 February 2020) with numerous cloud passes and periods when there was still sampling downstream of the CVI inlet outside of cloud. During those three key periods shown out of cloud with CVI sampling, sulfate and organic levels exhibit concentrations close to zero and with concentrations considerably lower than CVI data in cloud. Compared to sulfate, there is more variability in organic levels downstream of the CVI regardless of whether sampling was in or out of cloud or even whether sampling was done using the isokinetic inlet out of cloud. The data reveal that at small timescales there is variability in the organic:sulfate ratio behind the CVI in cloud, specifically when comparing the clouds at 16:18–16:29 UTC versus 16:39–16:43 UTC, with the former being more organic rich. This representative time series provides confidence in the inlet itself not being the source of the significant changes observed downstream the CVI throughout the first four ACTIVATE deployments. This case flight is examined more in Sect. 3.3.
The heated counterflow in the CVI reduces positive artifacts from volatile gaseous species partitioning into sampled droplets such as with volatile organic compounds (VOCs) to form organics or with nitric acid to form nitrate (Prabhakar et al., 2014); in contrast, the heated counterflow would presumably evaporate some fraction of the existing nitrate and organics in the CCN that activated into droplets unlike sulfate which is not volatile. Thus, the heated inlet would tend to favor sulfate in the cloud droplet residuals and could not explain the enhanced organic residual observations here.
Inlets including the CVI can be prone to droplet shatter such as with large drizzle drops (> 100 µm) (Twohy et al., 2013), although drizzle was not always frequent and the particulate artifacts generated would still be representative of droplet residuals. It seems implausible that such drop shatter would lead to an organic enrichment especially as the chemical results we report were consistent across the entire study region. AMS results were compared to both rain water content and ice water content without evidence of a distinct relationship between precipitation levels and whether or not there was a higher organic mass fraction behind the CVI relative to out of cloud.
It is also noteworthy that there can be considerable variability in AMS composition along level legs (BCB, in cloud, ACT) pointing to how a signature of cloud processing out of cloud can be reduced when averaging data. Figure S3 demonstrates variability along individual legs that is not consistent with the organic:sulfate ratio always being enhanced downstream of the CVI.
The previous discussion does not provide support for any form of artifact or contamination explaining why 74 % of the CVI data points exhibited higher organic mass fractions than both the BCB or ACT legs. One could argue that the chemical signature of cloud processing should be evident out of cloud somewhere as ultimately the droplet residual particles will evaporate outside of cloud and return to the aerosol phase. As will be discussed in Sect. 4 though, there is a body of literature pointing to droplet residuals having the strongest signature of cloud processing rather than below or above cloud. Although difficult to prove with this dataset, a plausible explanation is that the processed aerosol dilutes into the MBL at a timescale that is much faster than the production/evaporation cycle.

Figure 9Summary of AMS composition in adjacent BCB, cloud, and ACT legs during back-to-back flights (research flights 17 and 18) in CAO conditions on 8 March 2020. Shown in the bar charts are the mass fractions of AMS components in addition to either total AMS mass (for ACT and BCB legs; such data are not robust for CVI legs due to how the CVI operates) or longitude on the right y axis. Note that some BCB and ACT legs are repeated for different cloud legs as they represent the closest leg to an individual cloud leg. On the far right are Falcon altitude during the flight along with the spatial map with numbers corresponding to the leg set numbers in the bar charts.
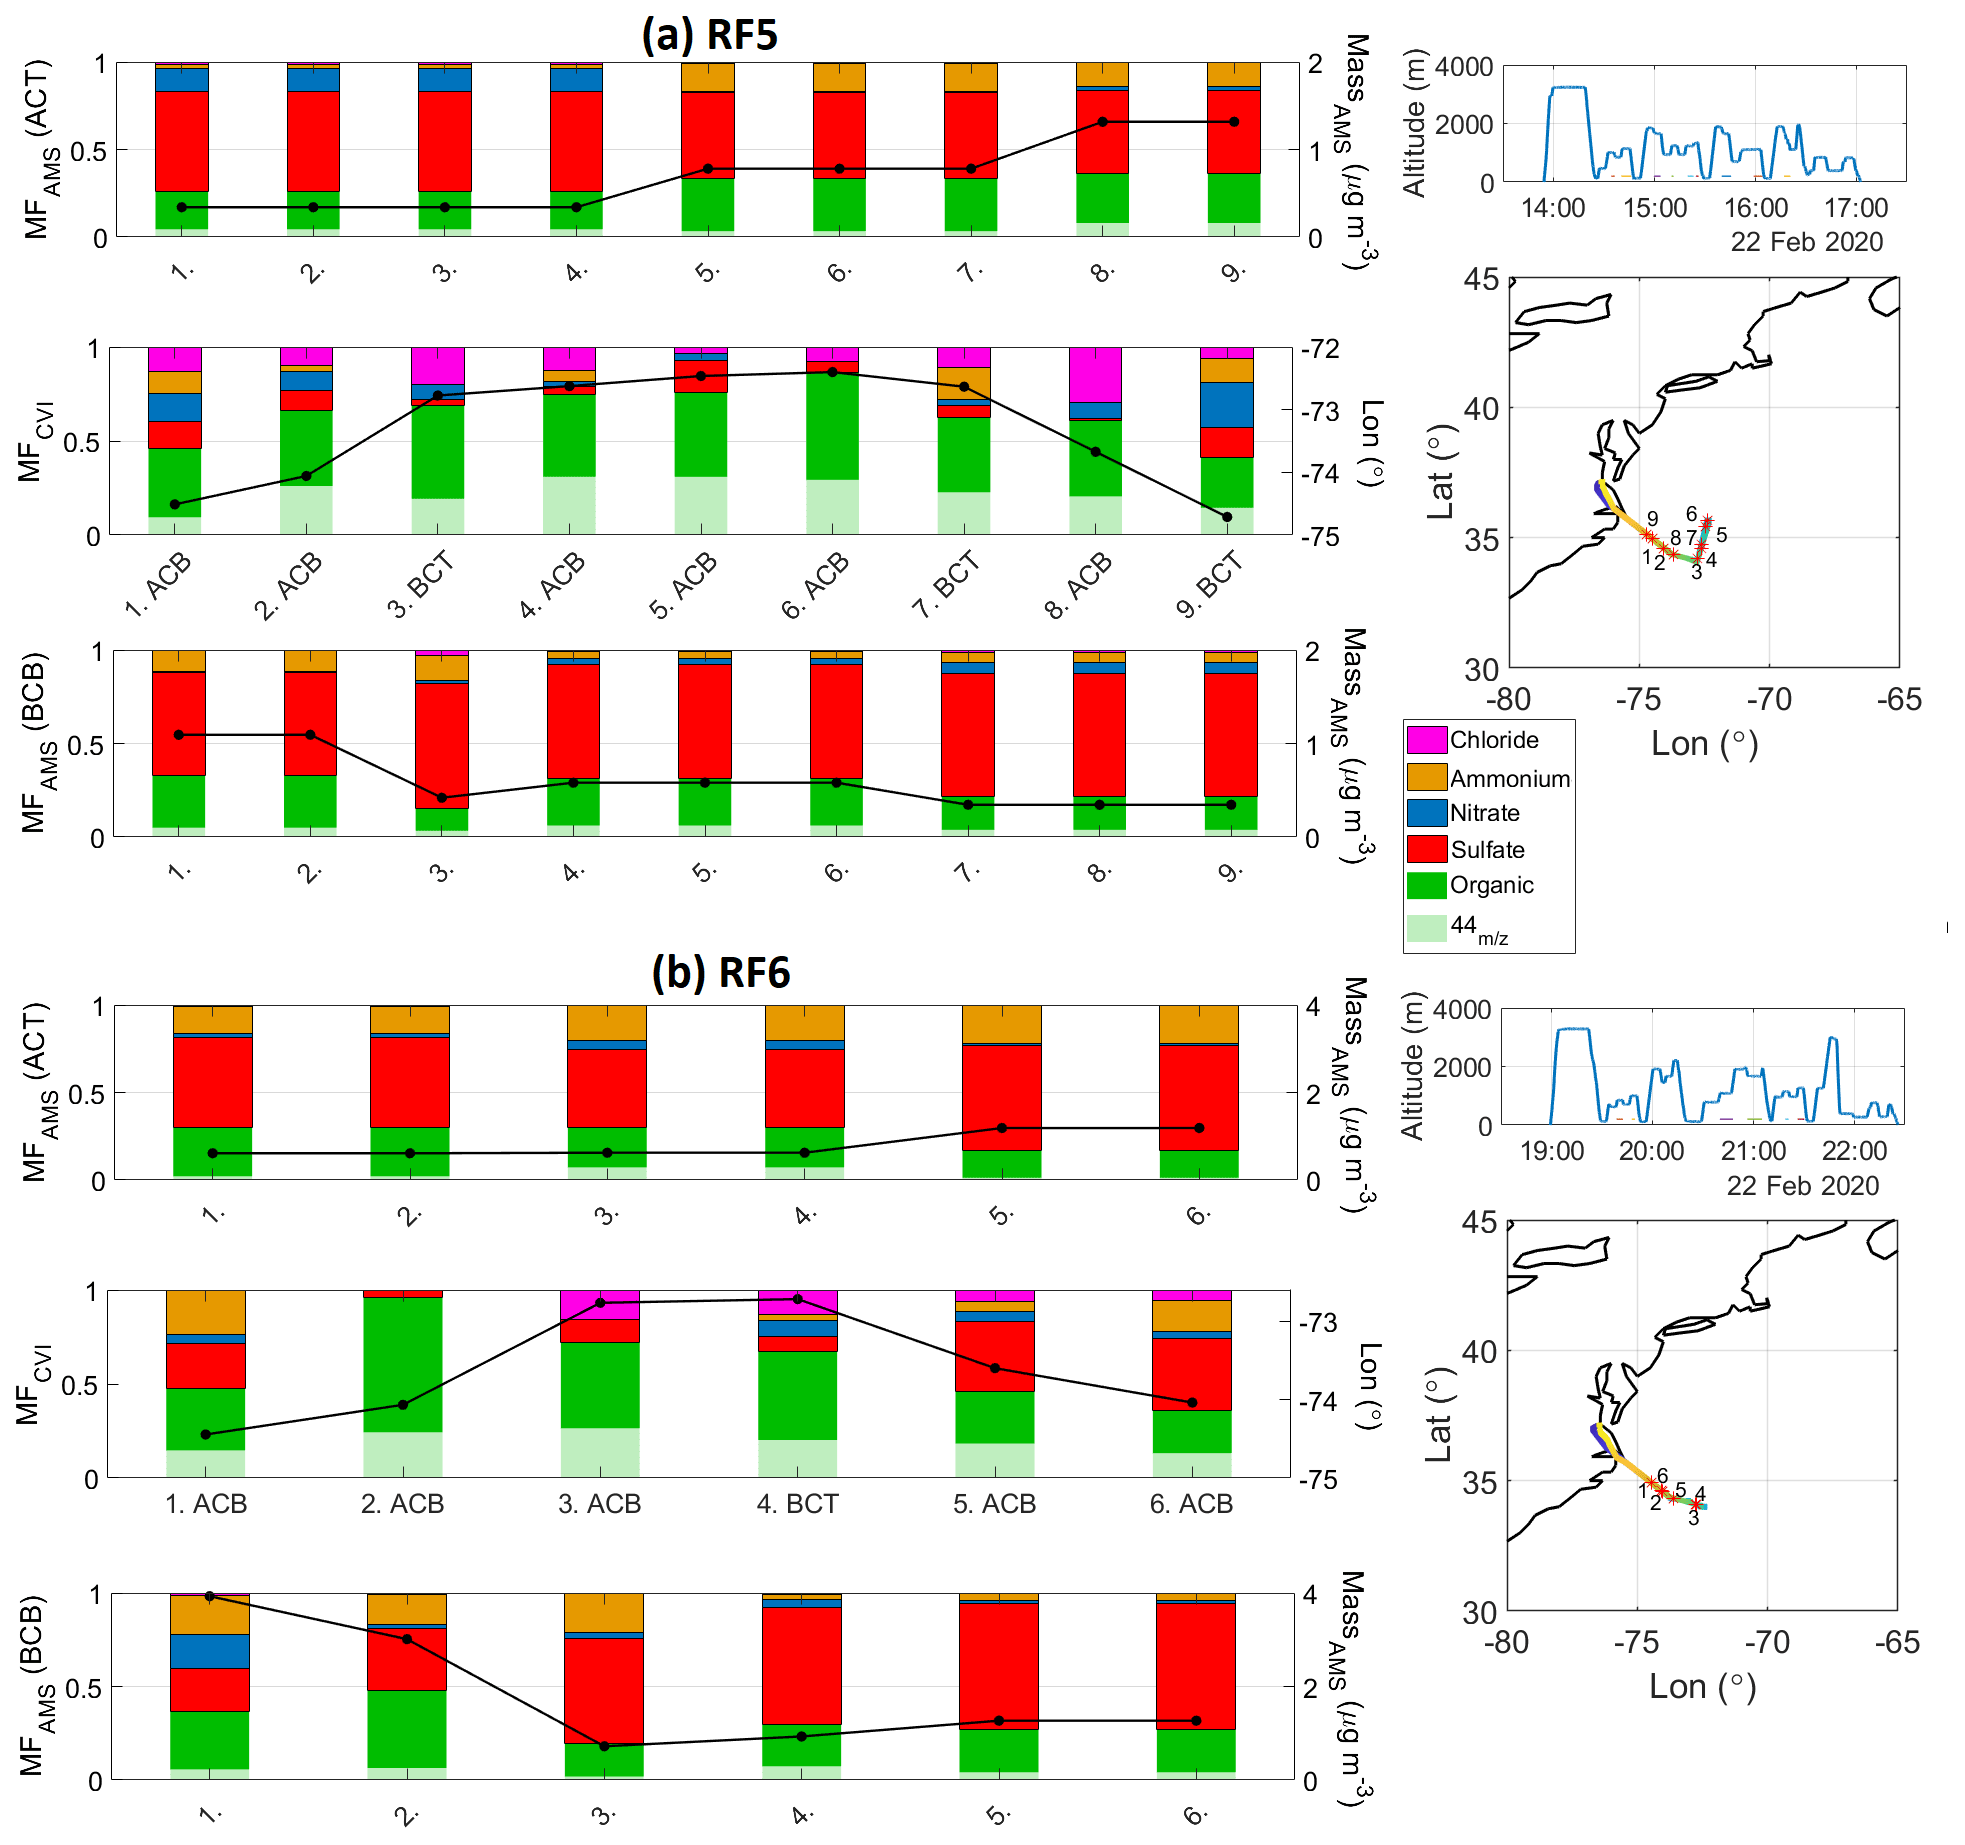
Figure 10Summary of AMS composition in adjacent BCB, cloud, and ACT legs during back-to-back flights (research flights 5 and 6) in CAO conditions on 22 February 2020. Shown in the bar charts are the mass fractions of AMS components in addition to either total AMS mass (for ACT and BCB legs; such data are not robust for CVI legs due to how the CVI operates) or longitude on the right y axis. Note that some BCB and ACT legs are repeated for different cloud legs as they represent the closest leg to an individual cloud leg. On the far right are Falcon altitude time series along with the spatial map with numbers corresponding to the leg numbers in the bar charts.
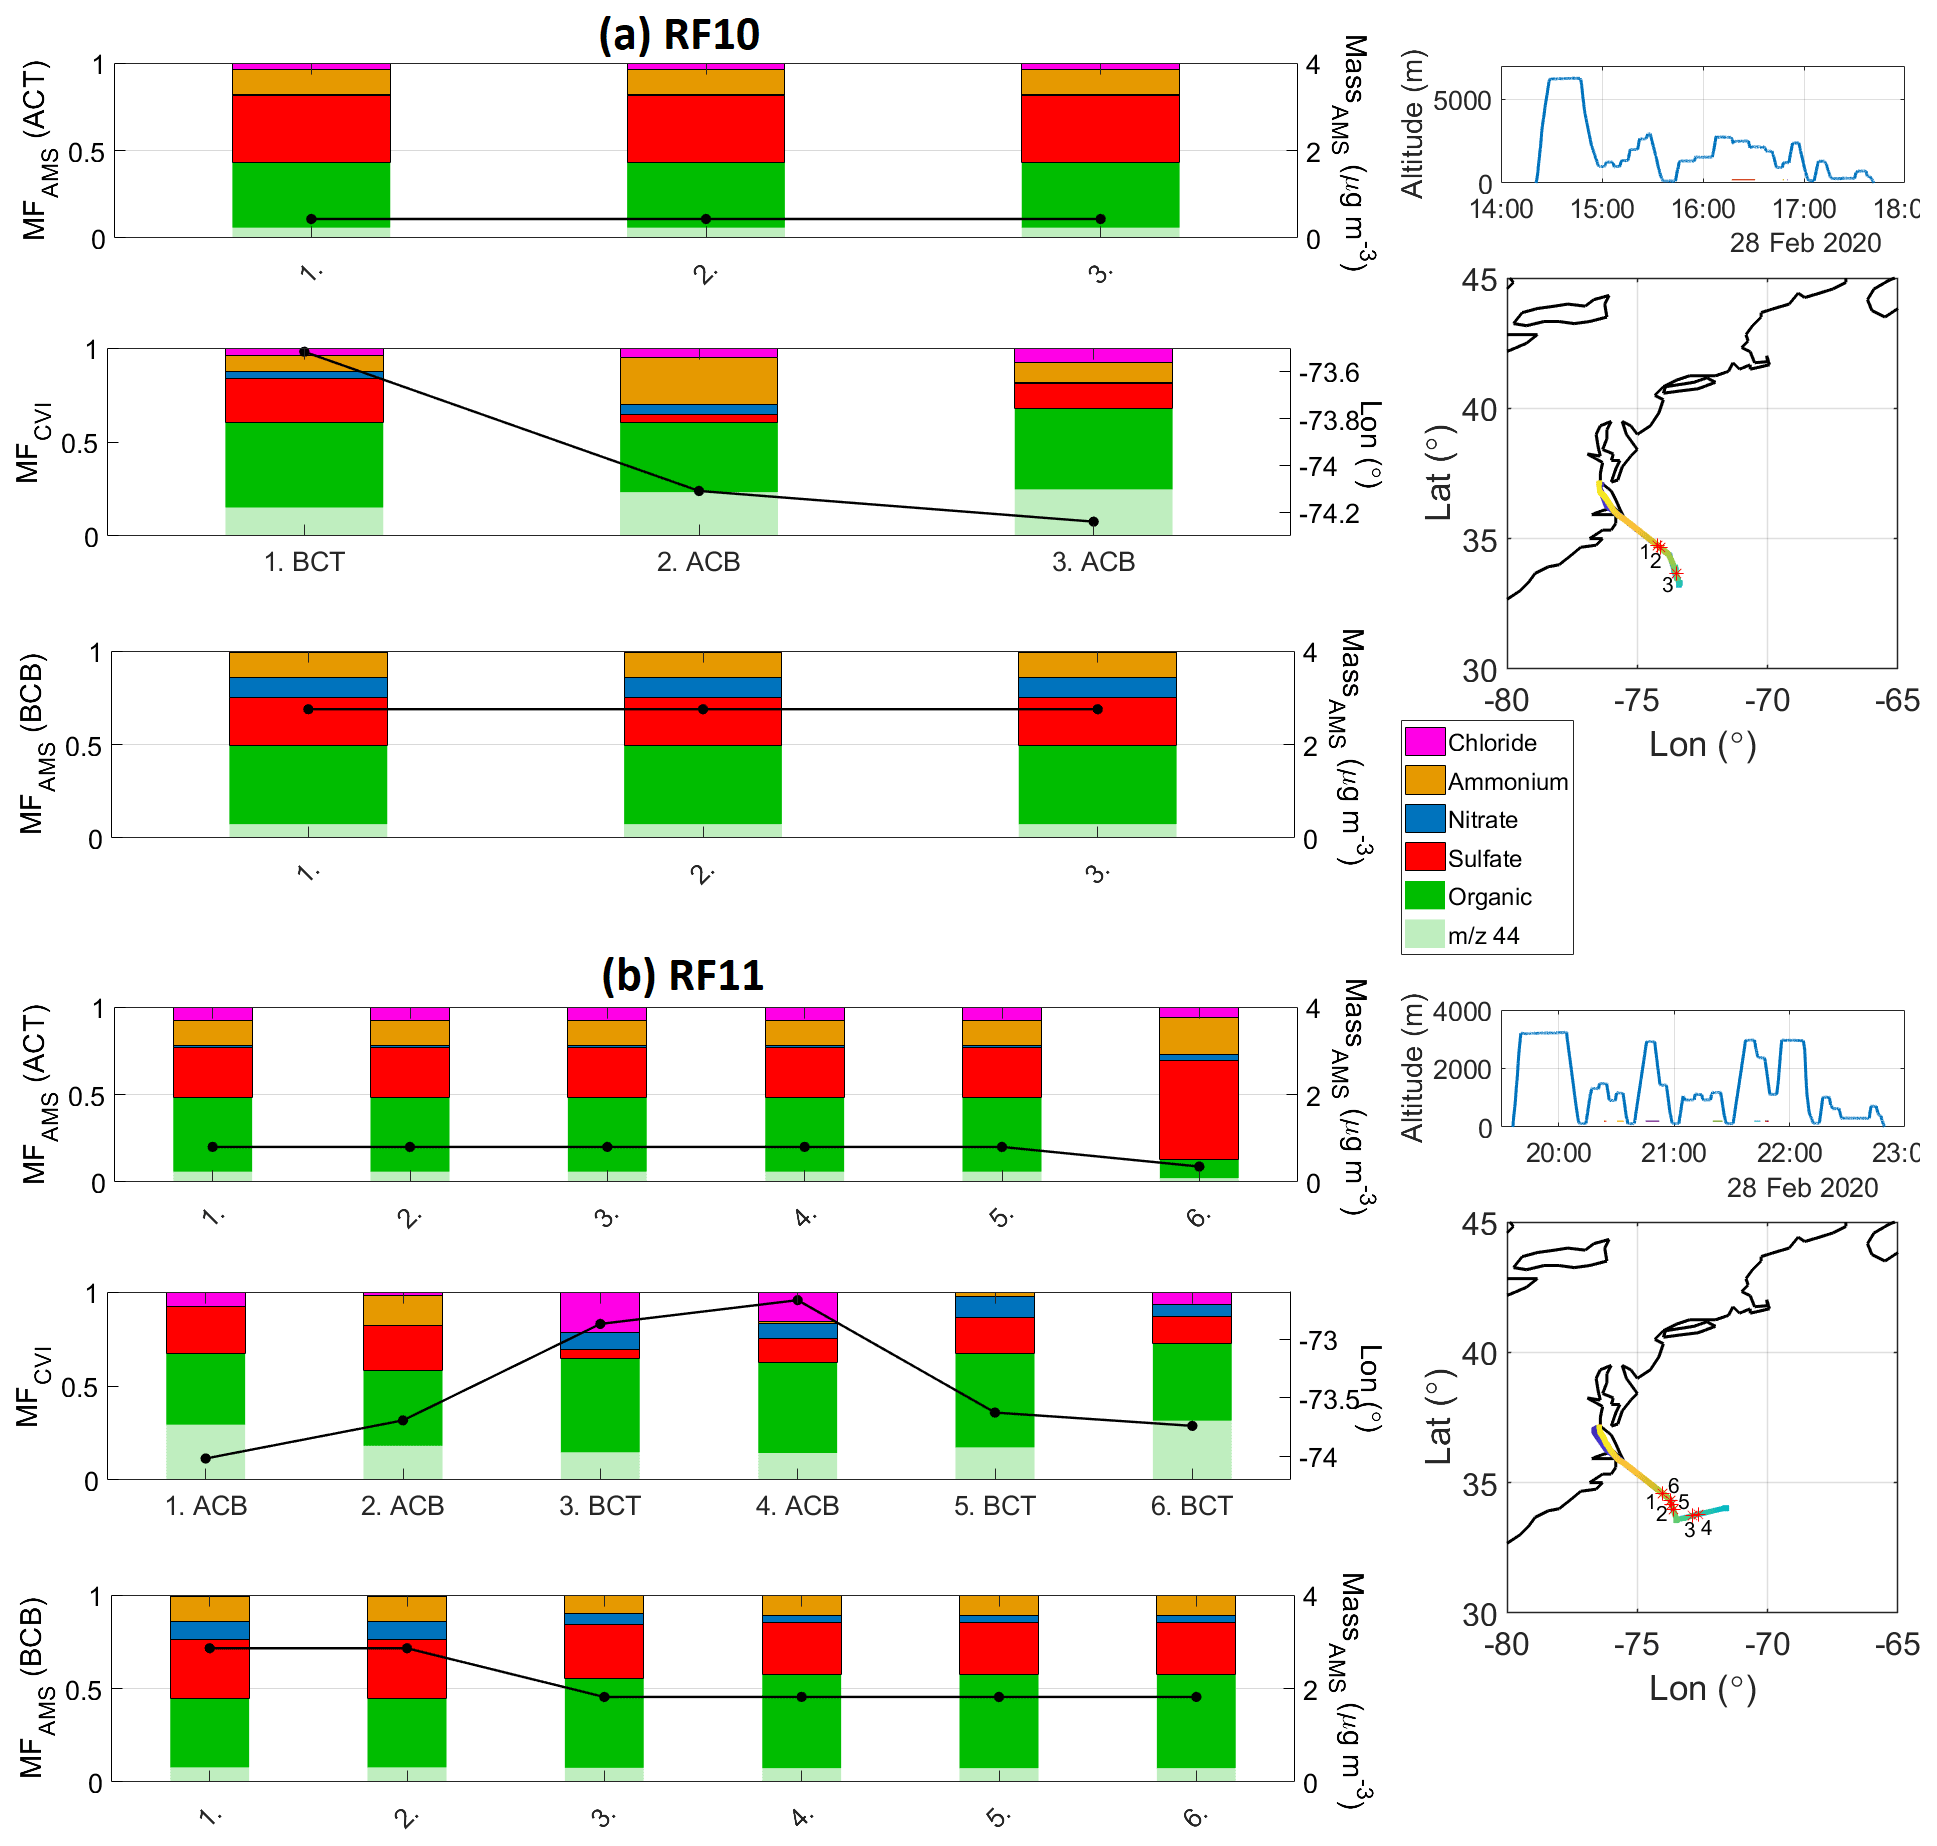
Figure 11Summary of AMS composition in adjacent BCB, cloud, and ACT legs during back-to-back flights (research flights 10 and 11) in cold air outbreak conditions on 28 February 2020. Shown in the bar charts are the mass fractions of AMS components in addition to either total AMS mass (for ACT and BCB legs; such data are not robust for CVI legs due to how the CVI operates) or longitude on the right y axis. Note that some BCB and ACT legs are repeated for different cloud legs as they represent the closest leg to an individual cloud leg. On the far right are flight altitude time series along with the spatial map with numbers corresponding to the leg numbers in the bar charts.
3.3 Cold air outbreak case studies
Owing to interest in the winter season having the strongest aerosol–cloud interactions (Dadashazar et al., 2021a; Painemal et al., 2021), here we examine six case study research flights (RFs) during CAOs to understand the compositional characteristics below, inside, and above clouds. We focus more on the representative day of 8 March 2020 (Fig. 9), which included two consecutive flights (RFs 17 and 18) based out of Hampton, Virginia profiling aerosol and cloud properties in CAO conditions. These two flights were investigated in past work showing enhanced new particle formation in ACT legs (Corral et al., 2022) and that entrainment of free tropospheric air dilutes MBL CCN concentrations (Tornow et al., 2022). The other four flights (Fig. 10: RFs 5–6 on 22 February 2020; Fig. 11: RFs 10–11 on 28 February 2020) exhibited the same general results as those shown for 8 March with higher organic mass fractions and f44 in the cloud legs.
Figure 9 shows the AMS composition profile on the out-and-back flights on 8 March, which involved flying out to a point and repeating the same path back to the airfield. Stacked on top of each other in Fig. 9 are the corresponding legs within individual cloud ensembles including (from top to bottom) ACT, either BCT or ACB legs with CVI data, and BCB. RF17 in the morning comprised 13 different cloud legs with corresponding BCB and ACT legs. The BCB and ACT mass fraction profiles were similar with sulfate being most abundant (mass fractions: 0.34–0.65) followed closely by organics (mass fractions: 0.15–0.42). The f44 fraction of the organics in BCB and ACT legs was quite low (0.00–0.16). The cloud data show a very different profile with organics dominating the mass profile (mass fractions: 0.41–0.86) followed usually by sulfate (mass fractions: 0.00–0.30). Furthermore, there was a significant jump in f44 in the CVI data (0.21–0.48). RF18 later in the day retraced the same flight path and included 10 sets of matching cloud–BCB/ACT legs showing again a similar jump in both organic mass fraction and f44 in droplet residuals. In the second flight there was more variability in the BCB and ACT pairs, with higher sulfate mass fractions (0.34–0.75) in the ACT legs throughout most of the flight excluding the last two sets of legs. The total AMS mass concentrations were slightly higher in the BCB legs (0.49–0.91 µg m−3) relative to ACT legs (0.24–0.50 µg m−3).
Our results represent unique atmospheric data that are scarce in the literature owing to the difficulty of obtaining aerosol chemical data below, in, and above cloud in close spatiotemporal proximity across many flights in different times of the year. Figure 1 provides implications of the results in terms of differences with MERRA-2 speciated AOD. Although we cannot unambiguously prove it with the dataset, the results suggest that the most likely explanation for organic and f44 enrichment in droplet residuals has to do with aqueous processing rather than preferential activation of CCN with enhanced values of the organic:sulfate ratio and f44. That the droplet residuals shift to a more organic-rich signature with more oxygenated organics has implications for the aerosol particle properties remaining after droplet evaporation as they shift in composition and possibly size. Interestingly this study shows though that such a signature out of cloud was absent for 74 % of the cloud cases as organic mass fraction was higher in cloud versus either below or above cloud. These findings are significant in terms of motivating additional research, especially as other studies discussed below also have shown higher levels of organic mass fraction of ratios of oxygenated organics relative to total organic mass in CVI samples as compared to out of cloud.
Coggon et al. (2012) showed increased AMS organic:sulfate ratios with altitude in the MBL over the northeast Pacific Ocean coincident with increased liquid water content, which was attributed to aqueous processing effects to generate more organics relative to sulfate; this was also suggested by past work in that region with a PILS (Sorooshian et al., 2007). Coggon et al. (2012) showed that organics and sulfate were typically the most abundant AMS species both below cloud and in droplet residuals with comparable mass fractions and no consistent trend of either one dominating the droplet residual composition; however, they showed that in 70 % of their cloud cases that the CVI data exhibited higher organic mass fraction relative to out of cloud. Past measurements off the Californian coast and over Texas revealed enhanced f44 values in droplet residuals relative to below and above cloud data and also relative to interstitial aerosol particles in cloud (Sorooshian et al., 2010). That study showed similarly enhanced values of other ratios in droplet residuals indicative of more oxygenated organics (e.g., PILS oxalate : AMS 44, PILS oxalate : AMS organic). Over the Texas area, PILS measurements of oxalate relative to AMS sulfate and organic revealed significant enhancements (factors up to 4 and 13, respectively) downstream a CVI relative to cloud-free conditions at similar altitudes (Wonaschuetz et al., 2012); furthermore, they showed that organic mass fractions increased together with oxalate : organic and oxalate : sulfate ratios as a function of residual cloud fraction, which was a metric representing “cloud processing history” of an air parcel in shallow cumulus cloud fields. CVI–AMS data from a surface site studying warm tropospheric clouds on Mt. Åreskutan in central Sweden in July 2003 showed organics and nitrate activated with higher ease than sulfate (Drewnick et al., 2007); even though our results suggest that the droplet residual changes in composition are likely driven by aqueous processing, and it is relevant that organics have been shown in at least one other region to activate more easily than sulfate.
While a measurement of hygroscopicity of the droplet residuals was not available, we instead examine aerosol hygroscopicity from BCB legs as that is the area out of cloud most commonly exhibiting higher organic mass fractions relative to in cloud. Even if the signature out of cloud is not as clear as one would expect presumably owing to dilution effects, still the influence of cloud processing on organics inevitably should exist to some extent making the subsequent discussion valuable. Having more organics relative to sulfate may reduce hygroscopicity at high RHs (e.g., Hersey et al., 2009), but a compensating factor could be that the organics are more oxygenated, which would increase the hygroscopicity of the organic fraction itself.
Figure 12 shows an inverse relationship between f(RH) and organic mass fraction across all the BCB legs in ACTIVATE deployments 1–4, which is similar to what has been observed over the continental US (Shingler et al., 2016); using the linear best fit line shows that the representative f(RH) value for pure organic aerosol (i.e., organic mass fraction of 1.0) was 1.22 in contrast with 0.92 over the continental United States (Shingler et al., 2016). The f(RH) value for pure inorganic aerosol (i.e., organic mass fraction of 0.0) was 1.39. Results of Fig. 12 along with previous discussion suggests that aerosol interaction with clouds decreases particle hygroscopicity at an RH of 80 % although future work will look deeper into aerosol hygroscopic properties over the ACTIVATE region. This is especially relevant as regulatory activities have reduced sulfate levels over the eastern US in recent decades promoting higher relative amounts of organics (Bates et al., 2005; Hand et al., 2012) with downwind impacts on the northwestern Atlantic due to offshore flow (Keene et al., 2014; Aldhaif et al., 2021; Dadashazar et al., 2021b).
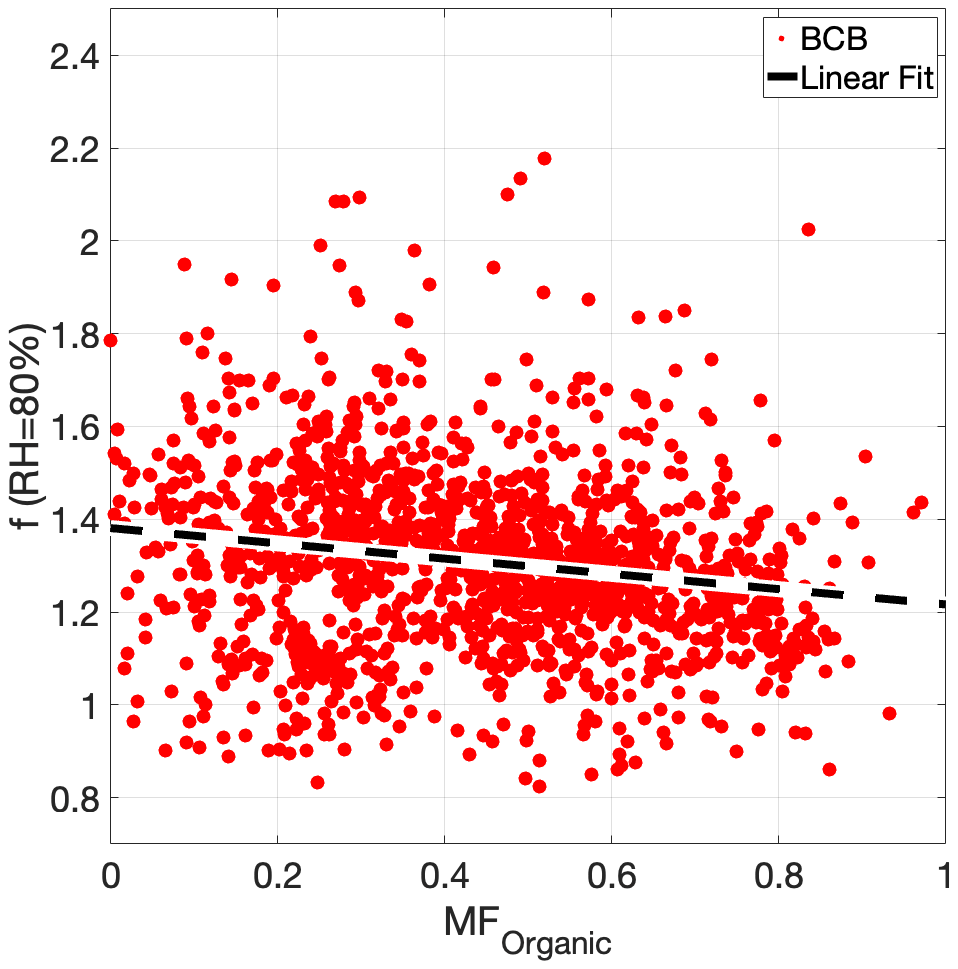
Figure 12Relationship between f(RH) and organic mass fraction for BCB legs during ACTIVATE deployments 1–4. Markers are based on f(RH) data synched to the time resolution of the AMS data. The f(RH) values from the linear fit at a MForganic value of 0.0 and 1.0 are 1.39 and 1.22, respectively.
A large airborne dataset collected over the northwestern Atlantic as part of the NASA ACTIVATE mission reveals a distinctly different chemical signature in cloud droplet residuals (lower sulfate mass fraction, higher organic mass fraction, and higher f44) relative to particles below and above cloud for approximately 75 % of the cloud cases examined. Several case study flights during cold air outbreak conditions are profiled showing the aforementioned compositional changes in droplet residuals. Detailed analysis suggests this shift in composition is driven more by in-cloud aqueous processing rather than preferential activation of CCN with such chemical characteristics. Of the 29 cases (out of 110) with higher organic mass fraction either above or below clouds versus droplet residuals, 25 (4) exhibited higher organic mass fraction below (above) cloud suggestive of the cloud processing signature being more prevalent below cloud. These results are analogous to past work in other regions using different instrumentation showing maximum values of various metrics relevant to organics (e.g., f44, organic mass fraction) downstream of a CVI in cloud relative to either below or above cloud (Sorooshian et al., 2010; Coggon et al., 2012; Wonaschuetz et al., 2012). More work is needed to continue validating whether aqueous processing is the primary reason for the composition changes and to determine if these results apply to other regions.
The results of this study motivate increased attention to both in-cloud formation of oxygenated organics and the composition of particles activating into droplets over the northwestern Atlantic. This work has implications for aerosol–cloud interactions in this region as datasets often relied on in the absence of airborne data such as reanalysis data suggest a different story where sulfate is more enhanced than organics year-round (in contrast to the airborne data) (e.g., Braun et al., 2021). The high relative abundance of organics needs more attention, especially in light of the increasing relative amount of species in aerosol particles other than sulfate due to regulatory activities over the US (Hand et al., 2012).
ACTIVATE airborne data: https://doi.org/10.5067/ASDC/ACTIVATE_Aerosol_AircraftInSitu_Falcon_Data_1 (NASA/LARC/SD/ASDC, 2021a), https://doi.org/10.5067/ASDC/ACTIVATE_Cloud_AircraftInSitu_Falcon_Data_1 (NASA/LARC/SD/ASDC, 2021b), and https://doi.org/10.5067/ASDC/ACTIVATE_MetNav_AircraftInSitu_Falcon_Data_1 (NASA/LARC/SD/ASDC, 2021c).
The supplement related to this article is available online at: https://doi.org/10.5194/acp-22-13897-2022-supplement.
HD conducted the analysis. AS and HD prepared the paper. All authors contributed by providing input and/or participating in airborne data collection.
At least one of the (co-)authors is a member of the editorial board of Atmospheric Chemistry and Physics. The peer-review process was guided by an independent editor, and the authors also have no other competing interests to declare.
Publisher's note: Copernicus Publications remains neutral with regard to jurisdictional claims in published maps and institutional affiliations.
This article is part of the special issue “Marine aerosols, trace gases, and clouds over the North Atlantic (ACP/AMT inter-journal SI)”. It is not associated with a conference.
The work was funded by NASA grant 80NSSC19K0442 in support of ACTIVATE, a NASA Earth Venture Suborbital-3 (EVS-3) investigation funded by NASA's Earth Science Division and managed through the Earth System Science Pathfinder Program Office. We acknowledge use of imagery from the NASA Worldview application (https://worldview.earthdata.nasa.gov/, last access: 19 October 2022), part of the NASA Earth Observing System Data and Information System. We thank pilots and aircraft maintenance personnel of NASA Langley Research Services Directorate for successful execution of ACTIVATE flights.
This research has been supported by the National Aeronautics and Space Administration (grant no. 80NSSC19K0442), the Helmholtz Association (grant no. HGF W2W3-060), and the Deutsche Forschungsgemeinschaft (DFG, German Research Foundation) – TRR 301 – Project-ID 428312742.
This paper was edited by Markus Petters and reviewed by two anonymous referees.
Aldhaif, A. M., Lopez, D. H., Dadashazar, H., Painemal, D., Peters, A. J., and Sorooshian, A.: An Aerosol Climatology and Implications for Clouds at a Remote Marine Site: Case Study Over Bermuda, J. Geophys. Res.-Atmos., 126, e2020JD034038, https://doi.org/10.1029/2020JD034038, 2021.
Asa-Awuku, A., Sorooshian, A., Flagan, R. C., Seinfeld, J. H., and Nenes, A.: CCN Properties of Organic Aerosol Collected Below and within Marine Stratocumulus Clouds near Monterey, California, Atmosphere, 6, 1590–1607, 2015.
Barth, M. C., Rasch, P. J., Kiehl, J. T., Benkovitz, C. M., and Schwartz, S. E.: Sulfur chemistry in the National Center for Atmospheric Research Community Climate Model: Description, evaluation, features, and sensitivity to aqueous chemistry, J. Geophys. Res.-Atmos., 105, 1387–1415, https://doi.org/10.1029/1999JD900773, 2000.
Bates, T. S., Quinn, P. K., Coffman, D. J., Johnson, J. E., and Middlebrook, A. M.: Dominance of organic aerosols in the marine boundary layer over the Gulf of Maine during NEAQS 2002 and their role in aerosol light scattering, J. Geophys. Res.-Atmos. 110, D18202, https://doi.org/10.1029/2005JD005797, 2005.
Blando, J. D. and Turpin, B. J.: Secondary organic aerosol formation in cloud and fog droplets: a literature evaluation of plausibility, Atmos. Environ., 34, 1623–1632, https://doi.org/10.1016/S1352-2310(99)00392-1, 2000.
Braun, R. A., McComiskey, A., Tselioudis, G., Tropf, D., and Sorooshian, A.: Cloud, Aerosol, and Radiative Properties Over the Western North Atlantic Ocean, J. Geophys. Res.-Atmos., 126, e2020JD034113, https://doi.org/10.1029/2020JD034113, 2021.
Coggon, M. M., Sorooshian, A., Wang, Z., Metcalf, A. R., Frossard, A. A., Lin, J. J., Craven, J. S., Nenes, A., Jonsson, H. H., Russell, L. M., Flagan, R. C., and Seinfeld, J. H.: Ship impacts on the marine atmosphere: insights into the contribution of shipping emissions to the properties of marine aerosol and clouds, Atmos. Chem. Phys., 12, 8439–8458, https://doi.org/10.5194/acp-12-8439-2012, 2012.
Corral, A. F., Braun, R. A., Cairns, B., Gorooh, V. A., Liu, H., Ma, L., Mardi, A. H., Painemal, D., Stamnes, S., van Diedenhoven, B., Wang, H., Yang, Y., Zhang, B., and Sorooshian, A.: An Overview of Atmospheric Features Over the Western North Atlantic Ocean and North American East Coast – Part 1: Analysis of Aerosols, Gases, and Wet Deposition Chemistry, J. Geophys. Res.-Atmos., 126, e2020JD032592, https://doi.org/10.1029/2020JD032592, 2021.
Corral, A. F., Choi, Y., Crosbie, E., Dadashazar, H., DiGangi, J. P., Diskin, G. S., Fenn, M., Harper, D. B., Kirschler, S., Liu, H., Moore, R. H., Nowak, J. B., Scarino, A. J., Seaman, S., Shingler, T., Shook, M. A., Thornhill, K. L., Voigt, C., Zhang, B., Ziemba, L. D., and Sorooshian, A.: Cold Air Outbreaks Promote New Particle Formation Off the U. S. East Coast, Geophys. Res. Lett., 49, e2021GL096073, https://doi.org/10.1029/2021GL096073, 2022.
Dadashazar, H., Ma, L., and Sorooshian, A.: Sources of pollution and interrelationships between aerosol and precipitation chemistry at a central California site, Sci. Total Environ., 651, 1776–1787, https://doi.org/10.1016/j.scitotenv.2018.10.086, 2019.
Dadashazar, H., Painemal, D., Alipanah, M., Brunke, M., Chellappan, S., Corral, A. F., Crosbie, E., Kirschler, S., Liu, H., Moore, R. H., Robinson, C., Scarino, A. J., Shook, M., Sinclair, K., Thornhill, K. L., Voigt, C., Wang, H., Winstead, E., Zeng, X., Ziemba, L., Zuidema, P., and Sorooshian, A.: Cloud drop number concentrations over the western North Atlantic Ocean: seasonal cycle, aerosol interrelationships, and other influential factors, Atmos. Chem. Phys., 21, 10499–10526, https://doi.org/10.5194/acp-21-10499-2021, 2021a.
Dadashazar, H., Alipanah, M., Hilario, M. R. A., Crosbie, E., Kirschler, S., Liu, H., Moore, R. H., Peters, A. J., Scarino, A. J., Shook, M., Thornhill, K. L., Voigt, C., Wang, H., Winstead, E., Zhang, B., Ziemba, L., and Sorooshian, A.: Aerosol responses to precipitation along North American air trajectories arriving at Bermuda, Atmos. Chem. Phys., 21, 16121–16141, https://doi.org/10.5194/acp-21-16121-2021, 2021b.
DeCarlo, P. F., Dunlea, E. J., Kimmel, J. R., Aiken, A. C., Sueper, D., Crounse, J., Wennberg, P. O., Emmons, L., Shinozuka, Y., Clarke, A., Zhou, J., Tomlinson, J., Collins, D. R., Knapp, D., Weinheimer, A. J., Montzka, D. D., Campos, T., and Jimenez, J. L.: Fast airborne aerosol size and chemistry measurements above Mexico City and Central Mexico during the MILAGRO campaign, Atmos. Chem. Phys., 8, 4027–4048, https://doi.org/10.5194/acp-8-4027-2008, 2008.
de Gouw, J. A., Middlebrook, A. M., Warneke, C., Goldan, P. D., Kuster, W. C., Roberts, J. M., Fehsenfeld, F. C., Worsnop, D. R., Canagaratna, M. R., Pszenny, A. A. P., Keene, W. C., Marchewka, M., Bertman, S. B., and Bates, T. S.: Budget of organic carbon in a polluted atmosphere: Results from the New England Air Quality Study in 2002, J. Geophys. Res.-Atmos., 110, D16305, https://doi.org/10.1029/2004jd005623, 2005.
Drewnick, F., Schneider, J., Hings, S. S., Hock, N., Noone, K., Targino, A., Weimer, S., and Borrmann, S.: Measurement of Ambient, Interstitial, and Residual Aerosol Particles on a Mountaintop Site in Central Sweden using an Aerosol Mass Spectrometer and a CVI, J. Atmos. Chem., 56, 1–20, https://doi.org/10.1007/s10874-006-9036-8, 2007.
Ervens, B.: Modeling the Processing of Aerosol and Trace Gases in Clouds and Fogs, Chem. Rev., 115, 4157–4198, https://doi.org/10.1021/cr5005887, 2015.
Ervens, B., Turpin, B. J., and Weber, R. J.: Secondary organic aerosol formation in cloud droplets and aqueous particles (aqSOA): a review of laboratory, field and model studies, Atmos. Chem. Phys., 11, 11069–11102, https://doi.org/10.5194/acp-11-11069-2011, 2011.
Gelaro, R., McCarty, W., Suárez, M. J., Todling, R., Molod, A., Takacs, L., Randles, C. A., Darmenov, A., Bosilovich, M. G., Reichle, R., Wargan, K., Coy, L., Cullather, R., Draper, C., Akella, S., Buchard, V., Conaty, A., da Silva, A. M., Gu, W., Kim, G.-K., Koster, R., Lucchesi, R., Merkova, D., Nielsen, J. E., Partyka, G., Pawson, S., Putman, W., Rienecker, M., Schubert, S. D., Sienkiewicz, M., and Zhao, B.: The Modern-Era Retrospective Analysis for Research and Applications, Version 2 (MERRA-2), J. Climate, 30, 5419–5454, https://doi.org/10.1175/jcli-d-16-0758.1, 2017.
Grosvenor, D. P., Sourdeval, O., Zuidema, P., Ackerman, A., Alexandrov, M. D., Bennartz, R., Boers, R., Cairns, B., Chiu, J. C., Christensen, M., Deneke, H., Diamond, M., Feingold, G., Fridlind, A., Hünerbein, A., Knist, C., Kollias, P., Marshak, A., McCoy, D., Merk, D., Painemal, D., Rausch, J., Rosenfeld, D., Russchenberg, H., Seifert, P., Sinclair, K., Stier, P., van Diedenhoven, B., Wendisch, M., Werner, F., Wood, R., Zhang, Z., and Quaas, J.: Remote Sensing of Droplet Number Concentration in Warm Clouds: A Review of the Current State of Knowledge and Perspectives, Rev. Geophys., 56, 409–453, https://doi.org/10.1029/2017RG000593, 2018.
Hand, J. L., Schichtel, B. A., Malm, W. C., and Pitchford, M. L.: Particulate sulfate ion concentration and SO2 emission trends in the United States from the early 1990s through 2010, Atmos. Chem. Phys., 12, 10353–10365, https://doi.org/10.5194/acp-12-10353-2012, 2012.
Hawkins, L. N., Russell, L. M., Twohy, C. H., and Anderson, J. R.: Uniform particle-droplet partitioning of 18 organic and elemental components measured in and below DYCOMS-II stratocumulus clouds, J. Geophys. Res.-Atmos., 113, D14201, https://doi.org/10.1029/2007JD009150, 2008.
Heald, C. L., Coe, H., Jimenez, J. L., Weber, R. J., Bahreini, R., Middlebrook, A. M., Russell, L. M., Jolleys, M., Fu, T.-M., Allan, J. D., Bower, K. N., Capes, G., Crosier, J., Morgan, W. T., Robinson, N. H., Williams, P. I., Cubison, M. J., DeCarlo, P. F., and Dunlea, E. J.: Exploring the vertical profile of atmospheric organic aerosol: comparing 17 aircraft field campaigns with a global model, Atmos. Chem. Phys., 11, 12673–12696, https://doi.org/10.5194/acp-11-12673-2011, 2011.
Hegg, D. A., Livingston, J., Hobbs, P. V., Novakov, T., and Russell, P.: Chemical apportionment of aerosol column optical depth off the mid-Atlantic coast of the United States, J. Geophys. Res.-Atmos. 102, 25293–25303, 1997.
Hersey, S. P., Sorooshian, A., Murphy, S. M., Flagan, R. C., and Seinfeld, J. H.: Aerosol hygroscopicity in the marine atmosphere: a closure study using high-time-resolution, multiple-RH DASH-SP and size-resolved C-ToF-AMS data, Atmos. Chem. Phys., 9, 2543–2554, https://doi.org/10.5194/acp-9-2543-2009, 2009.
Hilario, M. R. A., Crosbie, E., Bañaga, P. A., Betito, G., Braun, R. A., Cambaliza, M. O., Corral, A. F., Cruz, M. T., Dibb, J. E., Lorenzo, G. R., MacDonald, A. B., Robinson, C. E., Shook, M. A., Simpas, J. B., Stahl, C., Winstead, E., Ziemba, L. D., and Sorooshian, A.: Particulate Oxalate-To-Sulfate Ratio as an Aqueous Processing Marker: Similarity Across Field Campaigns and Limitations, Geophys. Res. Lett., 48, e2021GL096520, https://doi.org/10.1029/2021GL096520, 2021.
Hsu, Y.-K., Holsen, T. M., and Hopke, P. K.: Comparison of hybrid receptor models to locate PCB sources in Chicago, Atmos. Environ., 37, 545–562, https://doi.org/10.1016/S1352-2310(02)00886-5, 2003.
Keene, W. C., Moody, J. L., Galloway, J. N., Prospero, J. M., Cooper, O. R., Eckhardt, S., and Maben, J. R.: Long-term trends in aerosol and precipitation composition over the western North Atlantic Ocean at Bermuda, Atmos. Chem. Phys., 14, 8119–8135, https://doi.org/10.5194/acp-14-8119-2014, 2014.
Kirschler, S., Voigt, C., Anderson, B., Campos Braga, R., Chen, G., Corral, A. F., Crosbie, E., Dadashazar, H., Ferrare, R. A., Hahn, V., Hendricks, J., Kaufmann, S., Moore, R., Pöhlker, M. L., Robinson, C., Scarino, A. J., Schollmayer, D., Shook, M. A., Thornhill, K. L., Winstead, E., Ziemba, L. D., and Sorooshian, A.: Seasonal updraft speeds change cloud droplet number concentrations in low-level clouds over the western North Atlantic, Atmos. Chem. Phys., 22, 8299–8319, https://doi.org/10.5194/acp-22-8299-2022, 2022.
Lambe, A. T., Onasch, T. B., Massoli, P., Croasdale, D. R., Wright, J. P., Ahern, A. T., Williams, L. R., Worsnop, D. R., Brune, W. H., and Davidovits, P.: Laboratory studies of the chemical composition and cloud condensation nuclei (CCN) activity of secondary organic aerosol (SOA) and oxidized primary organic aerosol (OPOA), Atmos. Chem. Phys., 11, 8913–8928, https://doi.org/10.5194/acp-11-8913-2011, 2011.
Leaitch, W. R., Lohmann, U., Russell, L. M., Garrett, T., Shantz, N. C., Toom-Sauntry, D., Strapp, J. W., Hayden, K. L., Marshall, J., Wolde, M., Worsnop, D. R., and Jayne, J. T.: Cloud albedo increase from carbonaceous aerosol, Atmos. Chem. Phys., 10, 7669–7684, https://doi.org/10.5194/acp-10-7669-2010, 2010.
Loeb, N. G., Manalo-Smith, N., Su, W., Shankar, M., and Thomas, S.: CERES Top-of-Atmosphere Earth Radiation Budget Climate Data Record: Accounting for in-Orbit Changes in Instrument Calibration, Remote Sens.-Basel, 8, 182, 2016.
Mardi, A. H., Dadashazar, H., Painemal, D., Shingler, T., Seaman, S. T., Fenn, M. A., Hostetler, C. A., and Sorooshian, A.: Biomass Burning Over the United States East Coast and Western North Atlantic Ocean: Implications for Clouds and Air Quality, J. Geophys. Res.-Atmos., 126, e2021JD034916, https://doi.org/10.1029/2021JD034916, 2021.
Mertes, S., Verheggen, B., Walter, S., Connolly, P., Ebert, M., Schneider, J., Bower, K. N., Cozic, J., Weinbruch, S., Baltensperger, U., and Weingartner, E.: Counterflow Virtual Impactor Based Collection of Small Ice Particles in Mixed-Phase Clouds for the Physico-Chemical Characterization of Tropospheric Ice Nuclei: Sampler Description and First Case Study, Aerosol Sci. Tech., 41, 848–864, https://doi.org/10.1080/02786820701501881, 2007.
Minnis, P., Sun-Mack, S., Young, D. F., Heck, P. W., Garber, D. P., Chen, Y., Spangenberg, D. A., Arduini, R. F., Trepte, Q. Z., Smith, W. L., Ayers, J. K., Gibson, S. C., Miller, W. F., Hong, G., Chakrapani, V., Takano, Y., Liou, K. N., Xie, Y., and Yang, P.: CERES Edition-2 Cloud Property Retrievals Using TRMM VIRS and Terra and Aqua MODIS Data—Part I: Algorithms, IEEE T. Geosci. Remote, 49, 4374–4400, https://doi.org/10.1109/TGRS.2011.2144601, 2011.
Minnis, P., Sun-Mack, S., Chen, Y., Chang, F. L., Yost, C. R., Smith, W. L., Heck, P. W., Arduini, R. F., Bedka, S. T., Yi, Y., Hong, G., Jin, Z., Painemal, D., Palikonda, R., Scarino, B. R., Spangenberg, D. A., Smith, R. A., Trepte, Q. Z., Yang, P., and Xie, Y.: CERES MODIS Cloud Product Retrievals for Edition 4—Part I: Algorithm Changes, IEEE T. Geosci. Remote, 59, 2744–2780, https://doi.org/10.1109/TGRS.2020.3008866, 2021.
Nakajima, T., Higurashi, A., Kawamoto, K., and Penner, J. E.: A possible correlation between satellite-derived cloud and aerosol microphysical parameters, Geophys. Res. Lett., 28, 1171–1174, https://doi.org/10.1029/2000GL012186, 2001.
NASA/LARC/SD/ASDC: ACTIVATE Falcon In Situ Aerosol Data, NASA Langley Atmospheric Science Data Center DAAC [data set], https://doi.org/10.5067/ASDC/ACTIVATE_Aerosol_AircraftInSitu_Falcon_Data_1, 2021a.
NASA/LARC/SD/ASDC: ACTIVATE Falcon In Situ Cloud Data, NASA Langley Atmospheric Science Data Center DAAC [data set], https://doi.org/10.5067/ASDC/ACTIVATE_Cloud_AircraftInSitu_Falcon_Data_1, 2021b.
NASA/LARC/SD/ASDC: ACTIVATE Falcon In-Situ Meteorological and Navigational Data, NASA Langley Atmospheric Science Data Center DAAC [data set], https://doi.org/10.5067/ASDC/ACTIVATE_MetNav_AircraftInSitu_Falcon_Data_1, 2021c.
Ng, N. L., Canagaratna, M. R., Zhang, Q., Jimenez, J. L., Tian, J., Ulbrich, I. M., Kroll, J. H., Docherty, K. S., Chhabra, P. S., Bahreini, R., Murphy, S. M., Seinfeld, J. H., Hildebrandt, L., Donahue, N. M., DeCarlo, P. F., Lanz, V. A., Prévôt, A. S. H., Dinar, E., Rudich, Y., and Worsnop, D. R.: Organic aerosol components observed in Northern Hemispheric datasets from Aerosol Mass Spectrometry, Atmos. Chem. Phys., 10, 4625–4641, https://doi.org/10.5194/acp-10-4625-2010, 2010.
Ovadnevaite, J., Ceburnis, D., Canagaratna, M., Berresheim, H., Bialek, J., Martucci, G., Worsnop, D. R., and O'Dowd, C.: On the effect of wind speed on submicron sea salt mass concentrations and source fluxes, J. Geophys. Res.-Atmos., 117, D16201, https://doi.org/10.1029/2011JD017379, 2012.
Ovadnevaite, J., Ceburnis, D., Leinert, S., Dall'Osto, M., Canagaratna, M., O'Doherty, S., Berresheim, H., and O'Dowd, C.: Submicron NE Atlantic marine aerosol chemical composition and abundance: Seasonal trends and air mass categorization, J. Geophys. Res.-Atmos., 119, 11850–811863, https://doi.org/10.1002/2013JD021330, 2014.
Painemal, D., Corral, A. F., Sorooshian, A., Brunke, M. A., Chellappan, S., Afzali Gorooh, V., Ham, S.-H., O'Neill, L., Smith Jr., W. L., Tselioudis, G., Wang, H., Zeng, X., and Zuidema, P.: An Overview of Atmospheric Features Over the Western North Atlantic Ocean and North American East Coast—Part 2: Circulation, Boundary Layer, and Clouds, J. Geophys. Res.-Atmos., 126, e2020JD033423, https://doi.org/10.1029/2020JD033423, 2021.
Papritz, L., Pfahl, S., Sodemann, H., and Wernli, H.: A Climatology of Cold Air Outbreaks and Their Impact on Air–Sea Heat Fluxes in the High-Latitude South Pacific, J. Climate, 28, 342–364, https://doi.org/10.1175/jcli-d-14-00482.1, 2015.
Prabhakar, G., Ervens, B., Wang, Z., Maudlin, L. C., Coggon, M. M., Jonsson, H. H., Seinfeld, J. H., and Sorooshian, A.: Sources of nitrate in stratocumulus cloud water: Airborne measurements during the 2011 E-PEACE and 2013 NiCE studies, Atmos. Environ., 97, 166–173, https://doi.org/10.1016/j.atmosenv.2014.08.019, 2014.
Rolph, G., Stein, A., and Stunder, B.: Real-time Environmental Applications and Display sYstem: READY, Environ. Modell. Softw., 95, 210–228, https://doi.org/10.1016/j.envsoft.2017.06.025, 2017.
Russell, L. M., Noone, K. J., Ferek, R. J., Pockalny, R. A., Flagan, R. C., and Seinfeld, J. H.: Combustion Organic Aerosol as Cloud Condensation Nuclei in Ship Tracks, J. Atmos. Sci., 57, 2591–2606, https://doi.org/10.1175/1520-0469(2000)057<2591:Coaacc>2.0.Co;2, 2000.
Schroder, J. C., Campuzano-Jost, P., Day, D. A., Shah, V., Larson, K., Sommers, J. M., Sullivan, A. P., Campos, T., Reeves, J. M., Hills, A., Hornbrook, R. S., Blake, N. J., Scheuer, E., Guo, H., Fibiger, D. L., McDuffie, E. E., Hayes, P. L., Weber, R. J., Dibb, J. E., Apel, E. C., Jaegle, L., Brown, S. S., Thornton, J. A., and Jimenez, J. L.: Sources and Secondary Production of Organic Aerosols in the Northeastern United States during WINTER, J. Geophys. Res.-Atmos. 123, 7771–7796, 2018.
Seethala, C., Zuidema, P., Edson, J., Brunke, M., Chen, G., Li, X.-Y., Painemal, D., Robinson, C., Shingler, T., Shook, M., Sorooshian, A., Thornhill, L., Tornow, F., Wang, H., Zeng, X., and Ziemba, L.: On Assessing ERA5 and MERRA2 Representations of Cold-Air Outbreaks Across the Gulf Stream, Geophys. Res. Lett., 48, e2021GL094364, https://doi.org/10.1029/2021GL094364, 2021.
Shah, V., Jaegle, L., Jimenez, J. L., Schroder, J. C., Campuzano-Jost, P., Campos, T. L., Reeves, J. M., Stell, M., Brown, S. S., Lee, B. H., Lopez-Hilfiker, F. D., and Thornton, J. A.: Widespread Pollution From Secondary Sources of Organic Aerosols During Winter in the Northeastern United States, Geophys. Res. Lett., 46, 2974–2983, https://doi.org/10.1029/2018gl081530, 2019.
Shingler, T., Dey, S., Sorooshian, A., Brechtel, F. J., Wang, Z., Metcalf, A., Coggon, M., Mülmenstädt, J., Russell, L. M., Jonsson, H. H., and Seinfeld, J. H.: Characterisation and airborne deployment of a new counterflow virtual impactor inlet, Atmos. Meas. Tech., 5, 1259–1269, https://doi.org/10.5194/amt-5-1259-2012, 2012.
Shingler, T., Crosbie, E., Ortega, A., Shiraiwa, M., Zuend, A., Beyersdorf, A., Ziemba, L., Anderson, B., Thornhill, L., Perring, A. E., Schwarz, J. P., Campazano-Jost, P., Day, D. A., Jimenez, J. L., Hair, J. W., Mikoviny, T., Wisthaler, A., and Sorooshian, A.: Airborne characterization of subsaturated aerosol hygroscopicity and dry refractive index from the surface to 6.5 km during the SEAC4RS campaign, J. Geophys. Res.-Atmos., 121, 4188–4210, https://doi.org/10.1002/2015JD024498, 2016.
Sorooshian, A., Varutbangkul, V., Brechtel, F. J., Ervens, B., Feingold, G., Bahreini, R., Murphy, S. M., Holloway, J. S., Atlas, E. L., Buzorius, G., Jonsson, H., Flagan, R. C., and Seinfeld, J. H.: Oxalic acid in clear and cloudy atmospheres: Analysis of data from International Consortium for Atmospheric Research on Transport and Transformation 2004, J. Geophys. Res.-Atmos., 111, D23S45, https://doi.org/10.1029/2005JD006880, 2006a.
Sorooshian, A., Brechtel, F. J., Ma, Y., Weber, R. J., Corless, A., Flagan, R. C., and Seinfeld, J. H.: Modeling and Characterization of a Particle-into-Liquid Sampler (PILS), Aerosol Sci. Tech., 40, 396–409, https://doi.org/10.1080/02786820600632282, 2006b.
Sorooshian, A., Lu, M.-L., Brechtel, F. J., Jonsson, H., Feingold, G., Flagan, R. C., and Seinfeld, J. H.: On the Source of Organic Acid Aerosol Layers above Clouds, Environ. Sci. Technol., 41, 4647–4654, https://doi.org/10.1021/es0630442, 2007.
Sorooshian, A., Murphy, S. M., Hersey, S., Bahreini, R., Jonsson, H., Flagan, R. C., and Seinfeld, J. H.: Constraining the contribution of organic acids and AMS 44 to the organic aerosol budget: On the importance of meteorology, aerosol hygroscopicity, and region, Geophys. Res. Lett., 37, L21807, https://doi.org/10.1029/2010GL044951, 2010.
Sorooshian, A., Anderson, B., Bauer, S. E., Braun, R. A., Cairns, B., Crosbie, E., Dadashazar, H., Diskin, G., Ferrare, R., Flagan, R. C., Hair, J., Hostetler, C., Jonsson, H. H., Kleb, M. M., Liu, H., MacDonald, A. B., McComiskey, A., Moore, R., Painemal, D., Russell, L. M., Seinfeld, J. H., Shook, M., Smith, W. L., Jr., Thornhill, K., Tselioudis, G., Wang, H., Zeng, X., Zhang, B., Ziemba, L., and Zuidema, P.: Aerosol–cloud–meteorology interaction airborne field investigations: Using Lessons Learned from the U. S. West Coast in the Design of ACTIVATE off the U. S. East Coast, B. Am. Meteorol. Soc., 100, 1511–1528, https://doi.org/10.1175/bams-d-18-0100.1, 2019.
Sorooshian, A., Corral, A. F., Braun, R. A., Cairns, B., Crosbie, E., Ferrare, R., Hair, J., Kleb, M. M., Hossein Mardi, A., Maring, H., McComiskey, A., Moore, R., Painemal, D., Scarino, A. J., Schlosser, J., Shingler, T., Shook, M., Wang, H., Zeng, X., Ziemba, L., and Zuidema, P.: Atmospheric Research Over the Western North Atlantic Ocean Region and North American East Coast: A Review of Past Work and Challenges Ahead, J. Geophys. Res.-Atmos., 125, e2019JD031626, https://doi.org/10.1029/2019JD031626, 2020.
Stein, A. F., Draxler, R. R., Rolph, G. D., Stunder, B. J. B., Cohen, M. D. , and Ngan, F.: NOAA’s HYSPLIT Atmospheric Transport and Dispersion Modeling System, B. Am. Meteorol. Soc., 96, 2059–2077, https://doi.org/10.1175/BAMS-D-14-00110.1, 2015.
Tai, A. P. K., Mickley, L. J., and Jacob, D. J.: Correlations between fine particulate matter (PM2.5) and meteorological variables in the United States: Implications for the sensitivity of PM2.5 to climate change, Atmos. Environ., 44, 3976–3984, https://doi.org/10.1016/j.atmosenv.2010.06.060, 2010.
Tornow, F., Ackerman, A. S., Fridlind, A. M., Cairns, B., Crosbie, E. C., Kirschler, S., Moore, R. H., Painemal, D., Robinson, C. E., Seethala, C., Shook, M. A., Voigt, C., Winstead, E. L., Ziemba, L. D., Zuidema, P., and Sorooshian, A.: Dilution of Boundary Layer Cloud Condensation Nucleus Concentrations by Free Tropospheric Entrainment During Marine Cold Air Outbreaks, Geophys. Res. Lett., 49, e2022GL098444, https://doi.org/10.1029/2022GL098444, 2022.
Twohy, C. H., Anderson, J. R., Toohey, D. W., Andrejczuk, M., Adams, A., Lytle, M., George, R. C., Wood, R., Saide, P., Spak, S., Zuidema, P., and Leon, D.: Impacts of aerosol particles on the microphysical and radiative properties of stratocumulus clouds over the southeast Pacific Ocean, Atmos. Chem. Phys., 13, 2541–2562, https://doi.org/10.5194/acp-13-2541-2013, 2013.
Wang, Y. Q., Zhang, X. Y., and Draxler, R. R.: TrajStat: GIS-based software that uses various trajectory statistical analysis methods to identify potential sources from long-term air pollution measurement data, Environ. Modell. Softw., 24, 938–939, https://doi.org/10.1016/j.envsoft.2009.01.004, 2009.
Warneck, P.: In-cloud chemistry opens pathway to the formation of oxalic acid in the marine atmosphere, Atmos. Environ., 37, 2423–2427, https://doi.org/10.1016/S1352-2310(03)00136-5, 2003.
Wonaschuetz, A., Sorooshian, A., Ervens, B., Chuang, P. Y., Feingold, G., Murphy, S. M., de Gouw, J., Warneke, C., and Jonsson, H. H.: Aerosol and gas re-distribution by shallow cumulus clouds: An investigation using airborne measurements, J. Geophys. Res.-Atmos., 117, D17202, https://doi.org/10.1029/2012JD018089, 2012.
Yang, Y., Wang, H., Smith, S. J., Zhang, R., Lou, S., Yu, H., Li, C., and Rasch, P. J.: Source Apportionments of Aerosols and Their Direct Radiative Forcing and Long-Term Trends Over Continental United States, Earths Future, 6, 793–808, https://doi.org/10.1029/2018EF000859, 2018.
Ziemba, L. D., Lee Thornhill, K., Ferrare, R., Barrick, J., Beyersdorf, A. J., Chen, G., Crumeyrolle, S. N., Hair, J., Hostetler, C., Hudgins, C., Obland, M., Rogers, R., Scarino, A. J., Winstead, E. L., and Anderson, B. E.: Airborne observations of aerosol extinction by in situ and remote-sensing techniques: Evaluation of particle hygroscopicity, Geophys. Res. Lett., 40, 417–422, https://doi.org/10.1029/2012GL054428, 2013.
Zorn, S. R., Drewnick, F., Schott, M., Hoffmann, T., and Borrmann, S.: Characterization of the South Atlantic marine boundary layer aerosol using an aerodyne aerosol mass spectrometer, Atmos. Chem. Phys., 8, 4711–4728, https://doi.org/10.5194/acp-8-4711-2008, 2008.