the Creative Commons Attribution 4.0 License.
the Creative Commons Attribution 4.0 License.
 | 19 Oct 2022
Measurement report: Size distributions of urban aerosols down to 1 nm from long-term measurements
Chenjuan Deng
Yiran Li
Jin Wu
Runlong Cai
Dongbin Wang
Yongchun Liu
Juha Kangasluoma
Veli-Matti Kerminen
Markku Kulmala
Jingkun Jiang
The size distributions of urban atmospheric aerosols convey important information on their origins and impacts. Their long-term characteristics, especially for sub-3 nm particles, are still limited. In this study, we examined the characteristics of atmospheric aerosol size distributions down to ∼1 nm based on 4-year measurements in urban Beijing. Using cluster analysis, three typical types of number size distributions were identified, i.e., daytime new particle formation (NPF) type, daytime non-NPF type, and nighttime type. Combining a power law distribution and multiple lognormal distributions can well represent the sharp concentration decrease of sub-3 nm particles with increasing size and the modal characteristics for those above 3 nm in the submicron size range. The daytime NPF type exhibits high concentrations of sub-3 nm aerosols together with other three modes. However, both the daytime non-NPF type and the nighttime type have a low abundance of sub-3 nm aerosol particles together with only two distinct modes. In urban Beijing, the concentration of H2SO4 monomer during the daytime with NPF is similar to that during the daytime without NPF, while significantly higher than that during the nighttime. The concentration of atmospheric sub-3 nm particles on NPF days has a strong seasonality while their seasonality on non-NPF days is less pronounced. In addition to NPF as the most important source, we show that vehicles can emit sub-3 nm particles as well, although their influence on the measured aerosol population strongly depends on the distance from the road.
- Article
(3508 KB) - Full-text XML
-
Supplement
(1860 KB) - BibTeX
- EndNote


Atmospheric aerosol particles originate from both primary and secondary sources, spreading across a wide range of sizes from ∼ 1 nm to hundreds of micrometers. Primary sources directly emit particles over a broad size range, and these sources include natural ones such as windblown dust and sea spray, and anthropogenic ones such as coal combustion, traffic emissions, and biomass burning. Secondary sources produce mainly fine and ultrafine particles (Kumar et al., 2014). Atmospheric new particle formation (NPF), for example, generates a significant number of particles down to ∼ 1 nm, which has been shown to be ubiquitous in the atmosphere (Zhang et al., 2012). Traffic emissions can contain sub-3 nm particles and those particles are detected when measurements are made near the sources (Ronkko et al., 2017). In urban atmospheric environment mixed with various emissions, the size distributions of atmospheric aerosol particles are dynamic and complex, reflecting contributions from many primary and secondary sources.
For decades of development, size distributions of atmospheric particles larger than 3 nm have been well understood in contrast to limited information about sub-3 nm particles. Whitby tri-modal representation (Whitby, 1978) has been widely used to describe atmospheric aerosol size distributions, i.e., nuclei mode (∼ 5–100 nm), accumulation mode (∼ 100 nm–2 µm), and coarse mode (>2 µm). These three modes reflect their origins. For instance, nuclei mode particles are considered to be mainly originated from gas-to-particle conversion. As the understanding of nucleation process extends, a number of studies proposed the presence of nucleation mode in the size range of 3–25 nm which overlaps with Whitby nuclei mode (Covert et al., 1996; Hoppel and Frick, 1990; McMurry et al., 2000). For instance, both modeling and experimental results showed that nucleation mode is present when NPF events occur in the atmosphere (McMurry et al., 2000; Dal Maso et al., 2005; Hussein et al., 2004).
Advancing measurement techniques enables the development of an improved picture of atmospheric aerosol size distributions. Prior to Whitby tri-modal representation, the prevailing size distribution of atmospheric aerosols was the power function model by Junge (1963), which was based on measurements using impactors with a large cut-off size (∼ 0.1 µm) and low size resolution. Developing electrical mobility-based techniques provided data for the tri-modal representation by achieving size distribution measurements down to tens of nanometers with high time resolution and high size resolution (Liu and Piu, 1975; Knutson and Whitby, 1975; Whitby and Clark, 1966). Electrical mobility size spectrometers are now widely used to measure atmospheric aerosol size distributions. During the last decade or so, advanced techniques were developed and improved towards measuring sub-3 nm atmospheric aerosols, such as diethylene glycol-based electrical mobility spectrometer (DEG SMPS) (Jiang et al., 2011a), particle size magnifier (PSM) (Vanhanen et al., 2011), neutral cluster and air ion spectrometer (NAIS) (Mirme and Mirme, 2013), half-mini differential mobility particle sizer (half-mini DMPS) (Kangasluoma et al., 2018), and differential mobility analyzer train (DMA train) (Stolzenburg et al., 2017). Among them, DEG SMPS, PSM, and NAIS have been used in a number of field measurements (Deng et al., 2021; Jiang et al., 2011b; Kontkanen et al., 2016, 2017; Sulo et al., 2021).
These developments and applications improve the understanding about size distributions of atmospheric sub-3 nm particles. Jiang et al. (2011b) first measured atmospheric size distributions down to ∼ 1 nm using DEG SMPS during a short-term campaign in Atlanta and showed the sharp concentration decrease of sub-3 nm particles. The measured aerosol size distribution was further verified by simulation and observation in chamber experiments with sulfuric acid and amine clustering conditions (Chen et al., 2012). Studies measured the concentration of sub-3 nm particles using the PSM at various sites from a boreal forest to polluted megacities (Kontkanen et al., 2017, 2016). Despite these progresses, the characteristics of sub-3 nm particles are still limited. For instance, whether sub-2 nm aerosols always exist with high concentrations in the atmosphere is uncertain, although it is generally agreed that ion clusters in this size range are constantly present. DEG SMPS measurements report high concentrations of sub-2 nm aerosols only during NPF periods (Jiang et al., 2011b) while PSM measurements observe sub-2 nm signals all the time and with elevated concentrations during NPF periods (Kontkanen et al., 2016, 2017). This discrepancy can be partly attributed to different principles of these two instruments (Kangasluoma et al., 2020). Long-term measurements in various atmospheric environments together with improved understanding of their origins will help to better address this. Additionally, extending Whitby tri-modal representation down to sub-3 nm will provide a full picture of atmospheric aerosol size distributions (Kulmala et al., 2021). More importantly, it can provide information on nucleation processes where 1–3 nm is the critical size range, which can contribute to mechanistic, regional, and global atmospheric models.
To reveal the characteristics of atmospheric aerosol size distributions down to ∼ 1 nm, we started long-term atmospheric measurements in urban Beijing since 2018. Key gaseous precursors for the formation of sub-3 nm particles such as sulfuric acid and its clusters are also measured. This study aims to investigate the characteristics of typical aerosol size distributions together with gaseous precursors from the long-term perspective, the representation of the aerosol size distribution down to ∼ 1 nm, and the possible origins of sub-3 nm aerosols. Particularly, this study focuses on the sub-3 nm size range, including its origin and connection with the rest of the submicron size range, especially the nucleation mode and the nuclei mode.
2.1 Measurements
Atmospheric measurements were conducted at two urban sites in Beijing (Fig. 1). Long-term measurements were carried out on the west campus of Beijing University Chemical Technology (BUCT site) since January 2018. This site is situated ∼ 550 m to the west of the third ring road and ∼ 130 m to the southwest of a road, which is likely influenced by traffic emissions (Lu et al., 2019; Cai et al., 2021b; Deng et al., 2020). Due to instrument maintenance, the data used in this analysis included those from 16 January–17 May and 19 October–26 December 2018, 1 January–28 March 2019, and 19 July 2019–31 December 2021 (a total of 1009 available days). In addition, a short-term campaign was conducted on the campus of Tsinghua University (Tsinghua site) during 7 March–6 April 2016 (a total of 31 available days). Different from the BUCT site, the Tsinghua site is considered to be less influenced by traffic emissions because the closest major road is ∼ 1 km away from this site (Cai et al., 2017b; Cai and Jiang, 2017). There are no significant stationary emission sources nearby both two sites. Details about these two sites can be found in previous studies (Deng et al., 2020; Cai et al., 2017b).

Figure 1The locations of two measurement sites in urban Beijing, i.e., Tsinghua site (yellow star) and BUCT site (red star). The BUCT site is more influenced by the traffic emissions. The main roads and their distance from the measurement sites are marked in the figure. Fifth ring road and third ring road are the main roads near the Tsinghua site and the BUCT site, respectively. The maps are from © Google Maps and © Google Earth.
Size distributions of atmospheric aerosols in the range of 1 nm–10 µm (mobility diameter) were measured using a homemade DEG SMPS (1–6.5 nm) (Jiang et al., 2011a; Cai et al., 2017a) and a particle size distribution spectrometer (PSD; 3 nm–10 µm) (Liu et al., 2016). The schematics and pictures of the DEG SMPS and PSD are shown in Fig. S1 in the Supplement. The DEG SMPS is equipped with a core sampling inlet (Fu et al., 2019) for improving their sampling efficiency, a soft X-ray neutralizer (TSI Inc., model 3088), a specially designed miniature cylindrical differential mobility analyzer (Cai et al., 2017a, 2019) for classifying sub-10 nm particles, and a two-stage condensation particle counter which includes a modified DEG-based ultrafine CPC and a conventional CPC (TSI Inc., 3772). The PSD consists of an aerodynamic particle sizer (APS; TSI Inc., model 3321) and two parallel SMPSs using a nano-DMA (model 3085, TSI Inc.) and a long-DMA (model 3081, TSI Inc.), respectively.
Concentrations of sulfuric acid and its clusters were measured using nitrate chemical ionization time-of-flight mass spectrometers (Aerodyne Research Inc.) (Zheng et al., 2015; Cai et al., 2017b; Lu et al., 2019). The sampling configurations and calibration procedures were reported previously (Lu et al., 2019; Zheng et al., 2015). The NO concentration was measured by a trace gas analyzer (42i-TL, Thermo Fisher). The meteorological data, including the temperature, relative humidity, and ambient pressure, were measured using local weather station data acquisition system (Vaisala, AWS310).
2.2 Data analysis
Cluster analysis was used to identify typical atmospheric aerosol number size distributions during the measurement period at both sites. Details about this methodology (Beddows et al., 2009; Wegner et al., 2012) are given in the Supplement. We identified three typical types of aerosol number size distributions in urban Beijing together with H2SO4 and its clusters: C1, C2, and C3 types (Figs. S2 and S3). C1 type has high concentration of sub-3 nm aerosols and is mostly observed during NPF periods (e.g., 9–14) on NPF days. The other two types are mostly observed during non-NPF periods. Thus, they are referred to as daytime NPF type, daytime non-NPF type, and nighttime type, respectively. Their characteristics will be further discussed in the following section. The measurement days were classified into NPF days and non-NPF days according to the criteria and examples reported previously (Deng et al., 2020).
A combination of power law and multiple lognormal distribution functions was used to fit the measured H2SO4 and its clusters and particle number size distributions. When focusing on number size distributions, we fitted only in the submicron size range, because number concentration of coarse mode particles (>2 µm) is comparatively negligible. Note that to be consistent, we used mass diameter when combining size distributions of H2SO4 clusters and particles, otherwise mobility diameter is used for particles. The relation between mobility diameter and mass diameter (Ku and De La Mora, 2009), i.e., mobility diameter is 0.3 nm larger than mass diameter, was used to convert mobility diameter for particles into mass diameter. It should be also noted that, in Figs. 2, 3, S3, S6, S7, and S9, the concentration of H2SO4 monomers and dimers was converted into dN/dlogdp using the method by Jiang et al. (2011b).
For sub-3 nm particles, a power law function is used,
where dp is the particle diameter, nm; is the number size distribution function, cm−3; a and b are two fitting parameters for the power law function.
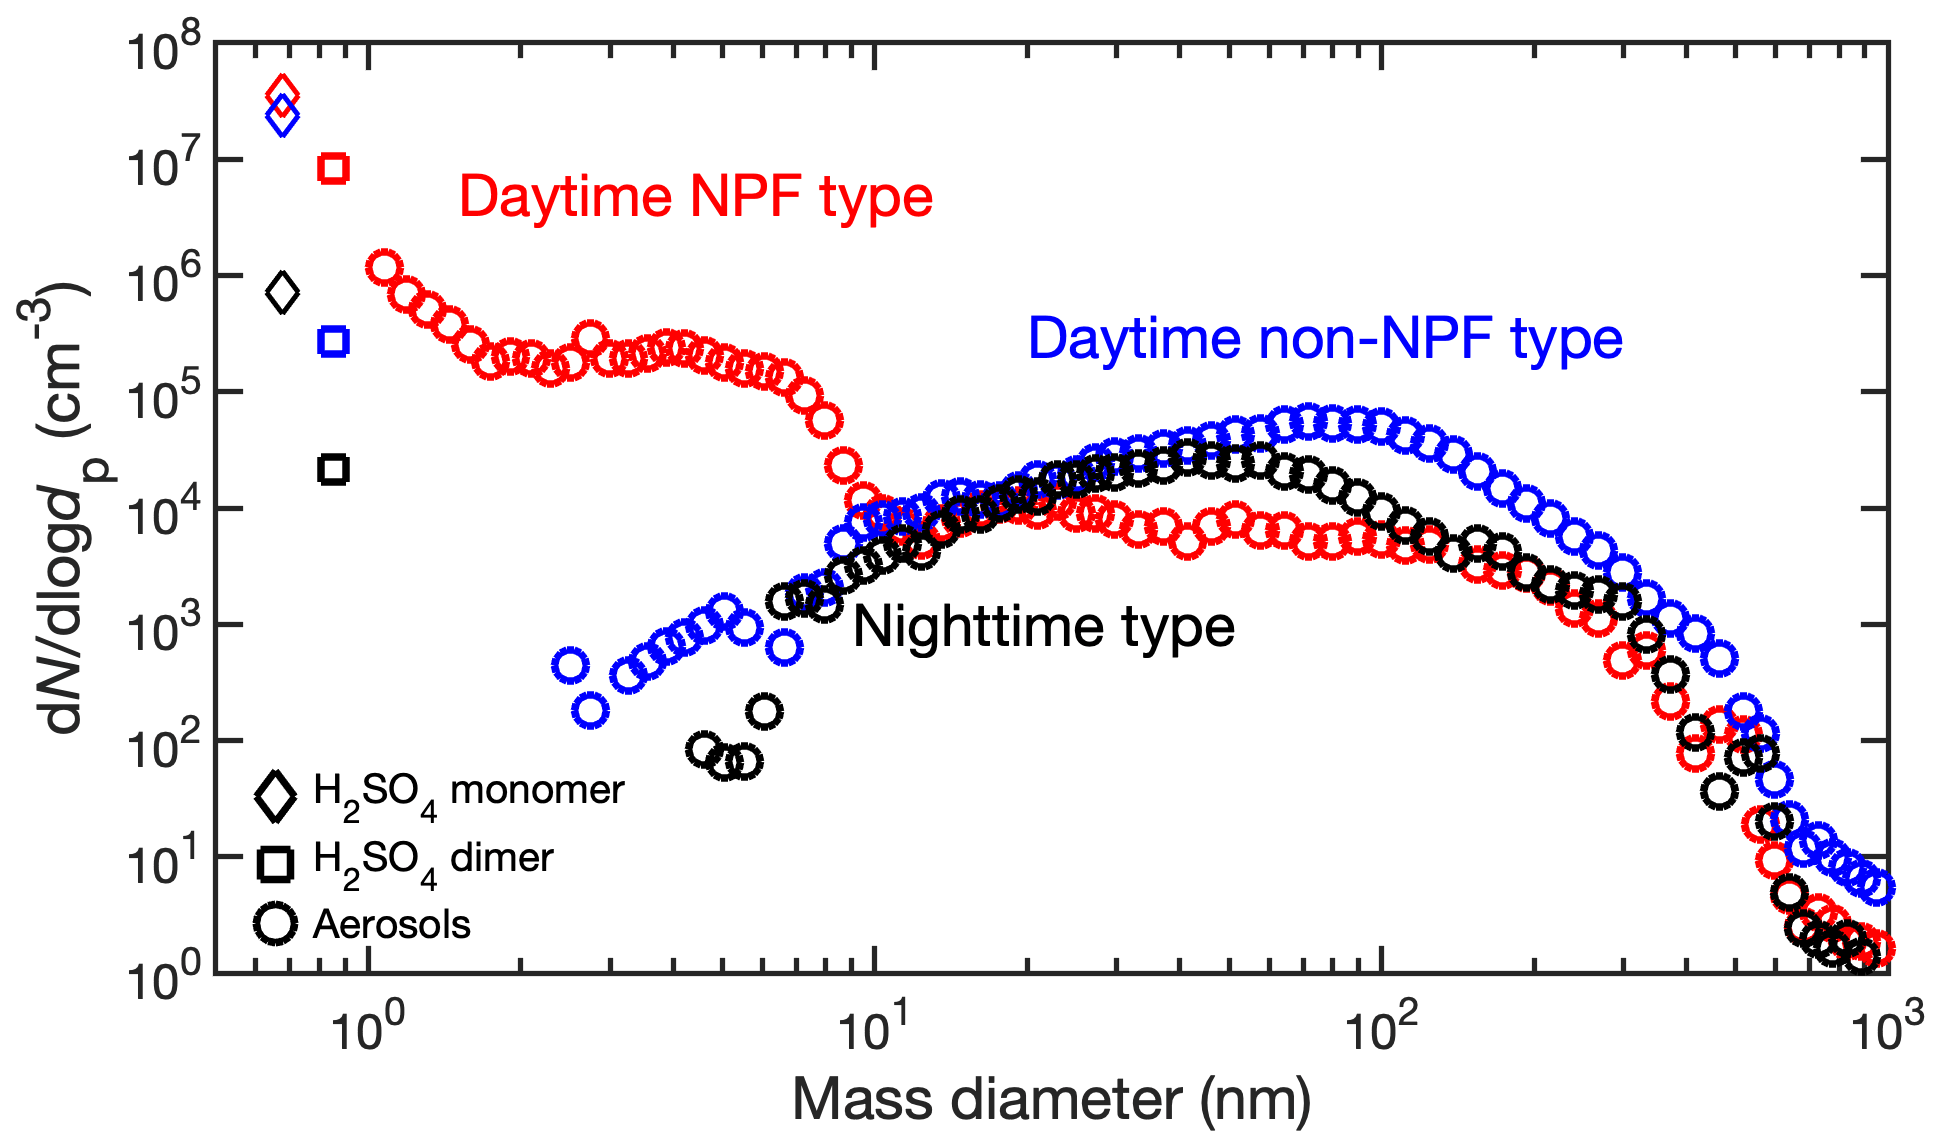
Figure 2Cases of three typical types of number size distributions from H2SO4 monomer to dimer and then to larger aerosol size: the daytime NPF type (red), daytime non-NPF type (blue), and nighttime type (black). The daytime NPF, daytime non-NPF, and nighttime particle number size distribution (PNSD) is selected during the NPF period on a NPF day (16 February 2018, 11:10 LT), during the daytime on a non-NPF day (25 February 2018, 12:25) and during the nighttime (4 April 2018, 00:35). The diamonds, squares, and circles represent the distribution function (dN/dlogdp) of H2SO4 monomers, dimers, and aerosols, respectively.
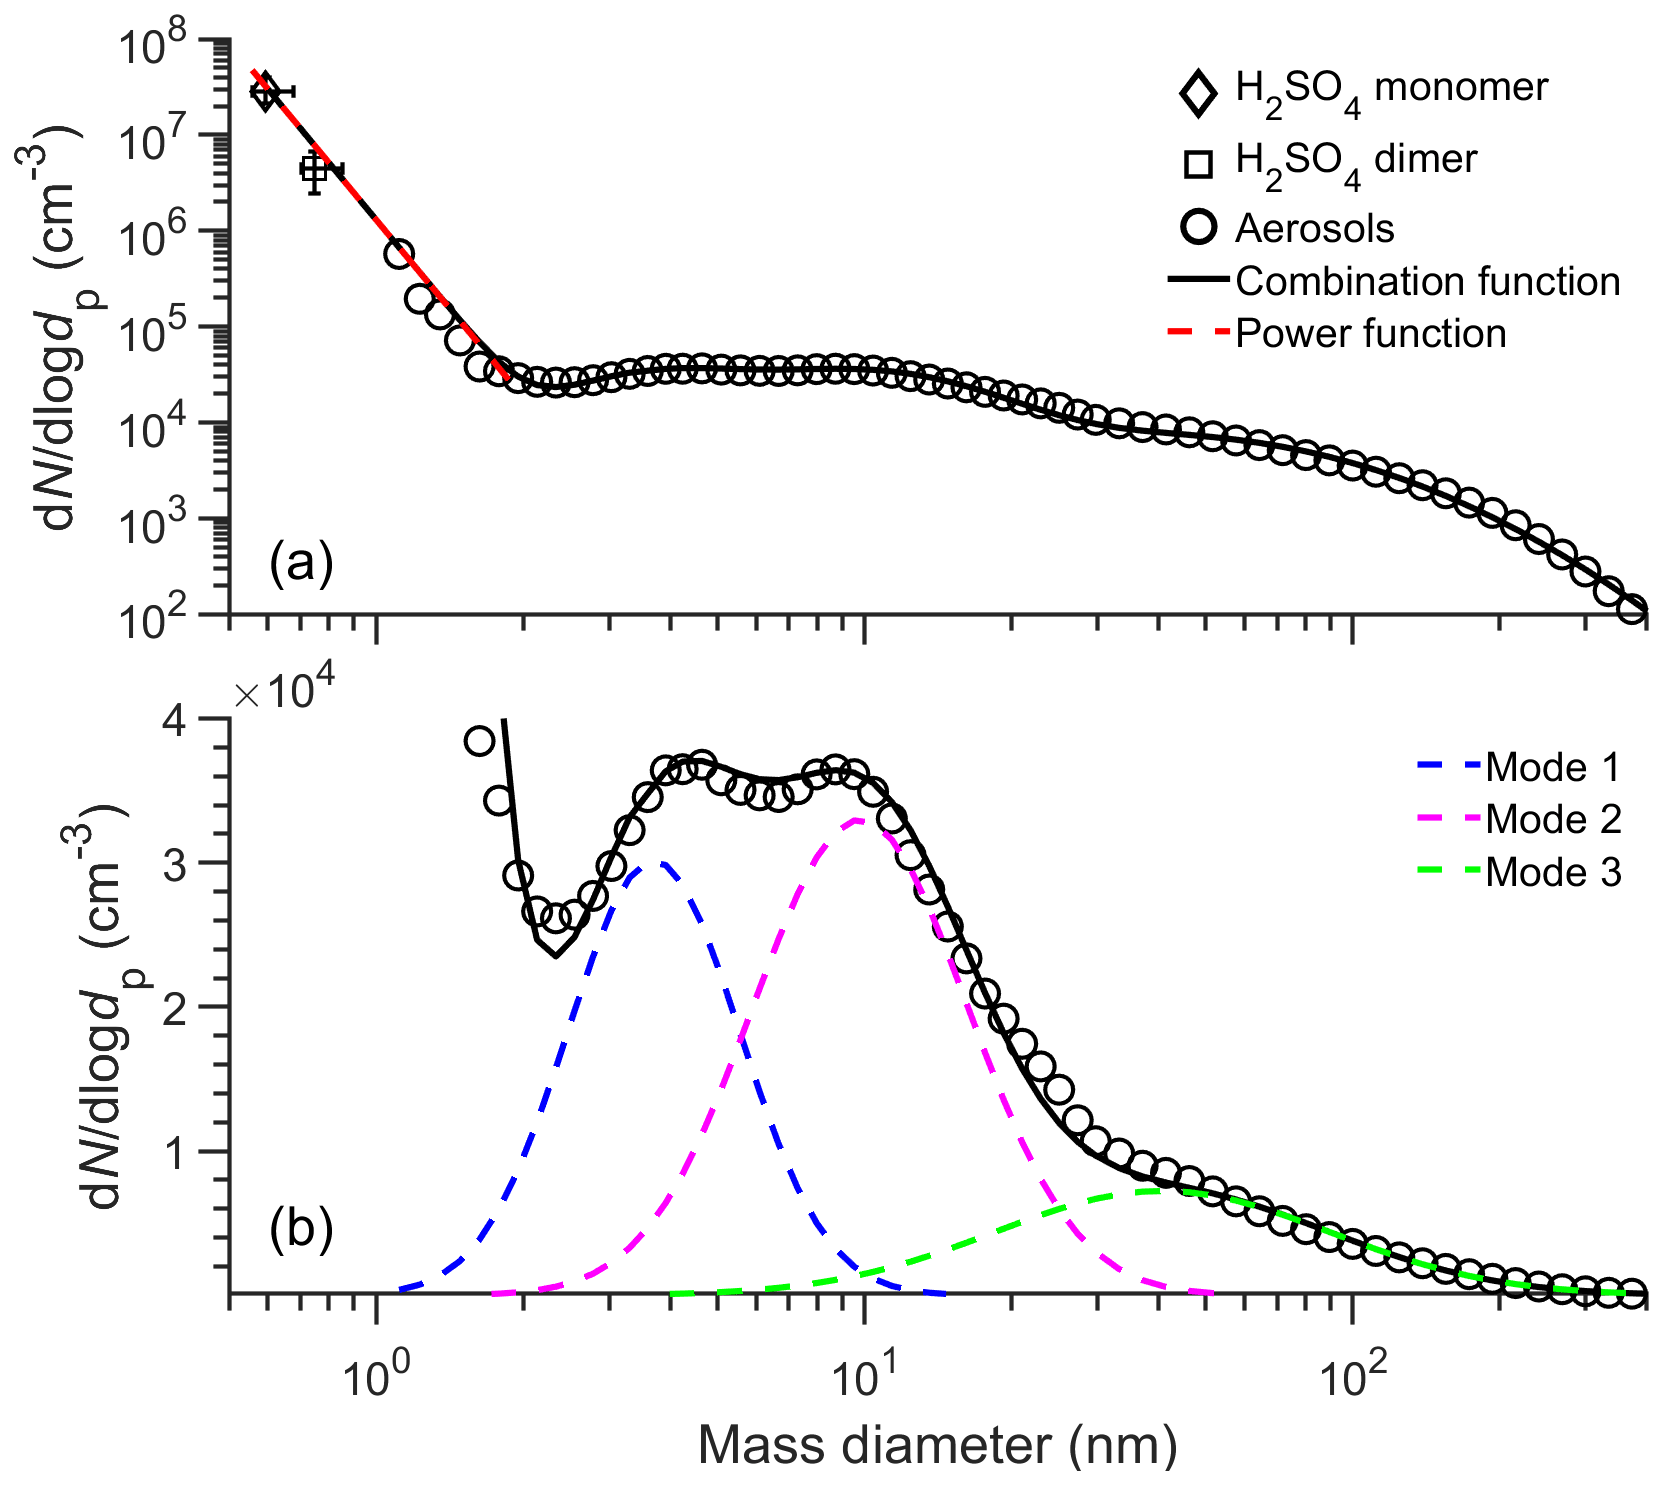
Figure 3The median daytime NPF type number size distributions from H2SO4 monomer to larger aerosols and the fitted size distributions shown in (a) logarithm scale and (b) linear scale of y axis. The x axis error bars of H2SO4 monomers and dimers indicate the variation range of estimated H2SO4 monomers and dimers diameters by assuming the bulk density to be 1000–1800 kg m3. The y axis error bars of H2SO4 monomers and dimers indicate the 25th–75th range of concentrations. The black and red lines indicate the fitted size distribution in the whole size range and in sub-3 nm size range, respectively. The blue, magenta, and green lines present the fitted mode 1, mode 2, and mode 3, respectively. The diamonds, squares, and circles represent the distribution function (dN/dlogdp) of H2SO4 monomers, dimers, and aerosols, respectively.
Note that the power law function was chosen to fit in the sub-3 nm because it can well capture the monotonic decrease from H2SO4 monomer to dimer and then to the sizes representative of aerosol particles. The lognormal distribution function is not a good fit in the sub-3 nm size range (Fig. S4) and especially a “mode” with a peak diameter of ∼ 0.4 nm resulting from such a fit seems not to be reasonable.
For particles above ∼ 3 nm, multiple lognormal distribution functions (Seinfeld and Pandis, 2006) are used:
where dp is the particle diameter, nm; Ni, , and σg,i represent total number concentration (cm−3), geometric mean diameter (nm), and geometric standard deviation (dimensionless) within the mode i.
The intensity of NPF is characterized by the particle formation rate, which measures the growth flux through a certain particle size. A balance formula that enhances the evaluation of coagulation scavenging in the presence of high aerosol loadings was used in this study to evaluate the particle formation rate (Cai and Jiang, 2017),
Here Jk is the particle formation rate at size dk, cm3 s−1, where dk was 1.5 nm in this study, nm; du is the upper size bound of the chosen aerosol population, nm; dmin is the smallest particle size detected by particle size spectrometers, nm; is the number concentration of particles from size dk to du, cm−3; di denotes the lower bound of the ith size bin, nm; β(i,g) is the coagulation coefficient for the collision of two particles with size of di and dg, cm3 s−1; and GRu represents the particle growth rate at size du, nm h−1.
An indicator, I, represents the intensity of the NPF in atmospheric environment governed by H2SO4–amine nucleation, considering the effects of various parameters such as H2SO4 concentration, amine concentration, the stability of H2SO4–amine clusters, and background aerosols (Cai et al., 2021a). This indicator has been used to reveal the governing factor for the seasonal variations of NPF in urban Beijing (Deng et al., 2020). It was calculated using the method by Cai et al. (2021a) (details can be found in the Supplement). Together with other evidence, it is used to explore whether the elevation of sub-3 nm aerosols on non-NPF days is due to nucleation process in Sect. 3.2.
3.1 Typical number size distributions of sub-3 nm aerosols
Figure 2 showed three cases of typical types of aerosol number size distributions. The number size distribution function (dN/dlogdp) was at high levels in the sub-3 nm size range of the daytime NPF type size distribution, and the highest value in this case reached up to ∼ 1.1×106 cm−3. The dN/dlogdp decreased from H2SO4 monomer, H2SO4 dimer to sub-3 nm aerosols, and reached a trough at ∼ 3 nm (note that H2SO4 monomer and dimer are included in the size distribution to provide information about the precursors of nucleation process). This trough can be partly caused by aerosol dynamic processes, which have also been simulated by models (Chen et al., 2012; Li and Cai, 2020). After reaching the trough, the dN/dlogdp slightly increased but then dropped significantly. The dN/dlogdp showed no significant increase or decrease from ∼ 12 nm until it started to decrease substantially at ∼ 300 nm and reached a low level at 1000 nm. In contrast to the daytime NPF type size distributions, the values of dN/dlogdp in the sub-3 nm size range of the daytime non-NPF type and nighttime type size distributions were substantially low. The concentrations of sub-2 nm aerosol particles were near zero. In the 2–3 nm size range, the dN/dlogdp of both daytime non-NPF and nighttime types was low while the dN/dlogdp was high in the larger size range, and higher than that of the daytime NPF type at sizes larger than about 20 nm. Although the daytime non-NPF type and nighttime type showed similar characteristics in the size range above the H2SO4 clusters, the H2SO4 monomer concentration was higher during daytime than nighttime.
From a long-term perspective, the characteristics of the median aerosol number size distributions for each type were similar in four seasons (Fig. S5). For the daytime NPF type, they showed a similarly sharp particle concentration decrease with increasing size in the sub-3 nm size range and local peaks above ∼ 3 nm in four seasons, although the concentration level showed seasonal variations. The seasonal variations of number concentrations of sub-3 nm aerosols will be discussed in the following section. For the daytime non-NPF and nighttime type, both the pattern and concentration level were similar in four seasons.
The median atmospheric aerosol size distributions for the whole measurement time period can be generally well fitted using a combination function of the power law and the lognormal distributions (Figs. 3 and S6–S7). Figure 3 showed that such combination function generally fitted the median daytime NPF type aerosol size distribution for the 4-year measurements well, both in logarithmic and linear scale of ordinate. In Fig. 3a, the power function depicted the characteristics that the concentrations decrease from H2SO4 monomers to ∼ 3 nm particles. Meanwhile, the lognormal function agreed well with the raw distributions. Figure 3b showed the tri-modal lognormal distributions more clearly in the linear scale of ordinate. The daytime NPF type size distribution presented three modes, referred to as mode 1, mode 2, and mode 3, respectively. Unlike the daytime NPF type, the daytime non-NPF and nighttime types only showed two modes in the number size distributions (Figs. S6–S7).
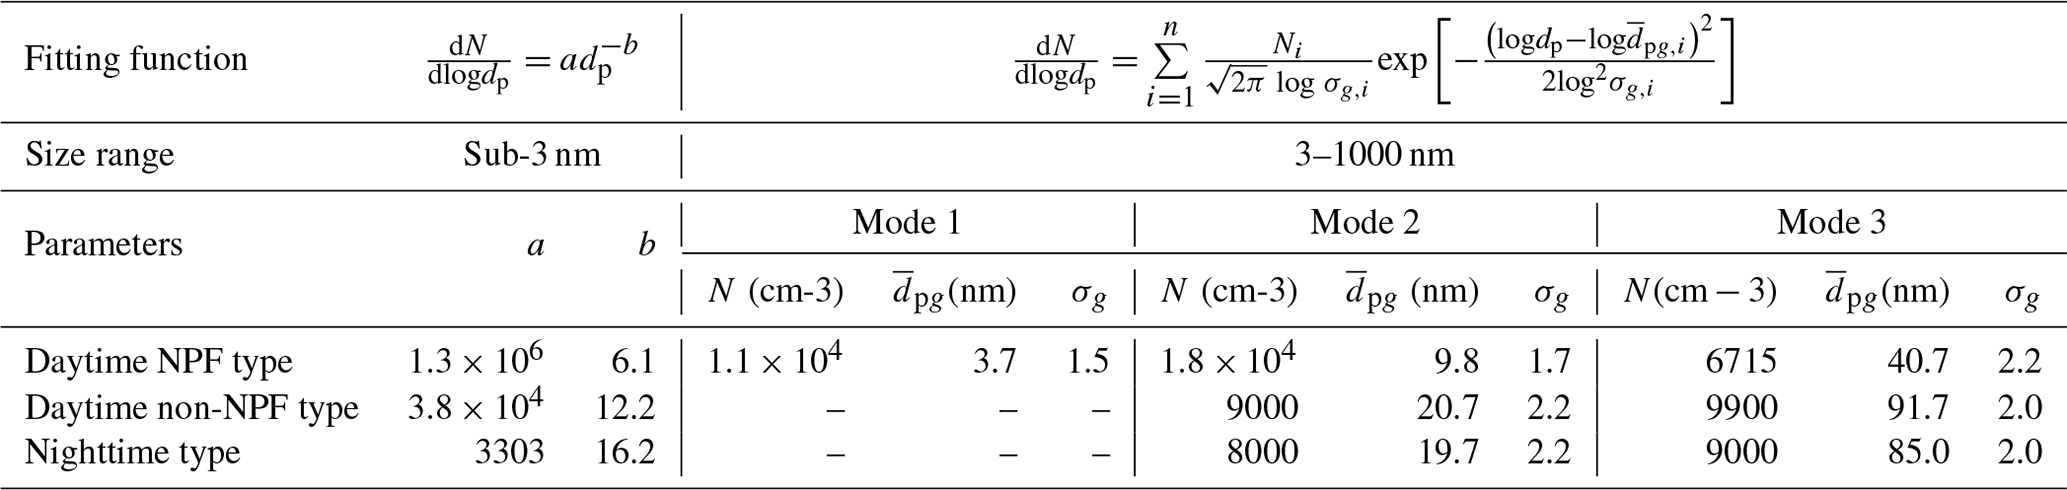
Table 1 summarized the fitted functions and their parameters of those median aerosol number size distributions for the 4 years of measurements in urban Beijing. The combination function consists of the power function and the lognormal distributions. For the power function, the parameters determining the fitting shape of sub-3 nm size distribution are a and b. With a larger b value, the concentrations decrease going from H2SO4 monomer to small clusters and further to particles of a few nanometers is sharper, so b values were much larger for the daytime non-NPF and nighttime types than the daytime NPF type. For the daytime non-NPF and nighttime types, although their concentration in sub-3 nm size range were similarly low, the concentration decrease from H2SO4 monomer to dimer was sharper for the nighttime type, so the b value was larger for the nighttime type than for the daytime non-NPF type. Concerning the lognormal distributions, the number concentration of mode 1 and mode 2 particles were much higher than that of mode 3 for the daytime NPF type. The modal diameters of mode 2 and mode 3 for the daytime non-NPF type and nighttime type were larger than those for the daytime NPF type.
Table 1The fitting parameters for the median daytime NPF, daytime non-NPF, and nighttime type aerosol size distributions of 4-year measurements in urban Beijing by the combination of the power law function and the lognormal distribution function. The power law function includes two parameters, a and b. The lognormal distribution function includes the number concentration within the mode (N), the geometric mean diameter within the mode (dpg), and the standard deviation (σg)
Compared to the Whitby model, our results showed that in Beijing for the daytime NPF type number size distributions, there existed three modes (mode 1, mode 2, and mode 3) in the ultrafine size range. The first two modes are induced by atmospheric nucleation process and they are in the size range of nucleation mode. There was a trough between mode 1 and mode 2 in the daytime NPF type. This is because the nucleation process produces large numbers of small particles and only a fraction of them grows into larger sizes, together with a strong impact of coagulation in the small size range. Mode 3 in the daytime NPF type is mainly from primary emissions (Morawska et al., 1998; Ristovski et al., 1998), which is often called as Aitken mode.
In contrast to daytime NPF type, for the daytime non-NPF and nighttime type, there were only two modes (mode 2 and mode 3) in the ultrafine size range. The modal diameter in mode 2 for the daytime non-NPF and nighttime types was larger than the daytime NPF type. Also, for daytime non-NPF and nighttime types, the range of mode 2 was much broader and the number concentration in this mode was lower than that for the daytime NPF type. These characteristics indicate no influence of atmospheric nucleation process. Note that these fitting parameters are not presumed to be constant because atmospheric processes and emissions vary spatially and temporally.
The accumulation mode (100 nm–2 µm) was not shown for all the types of number size distributions in Figs. 3 and S6–S7 because their contribution in number concentrations was low. However, the accumulation mode obviously presented in the volume size distributions of all the types, and the concentration was lower for the daytime NPF type compared to other two types (Fig. S8). The accumulation mode particles showed high concentration in the surface area size distributions as well. This indicates their important role for scavenging smaller particles and condensing species.
Additionally, we showed that this combination model performs well in the measured aerosol size distributions in Atlanta (Fig. S9). The combination model captured the sharp particle concentration decrease with an increasing size in the sub-3 nm size range and the modal characteristics above 3 nm size of the daytime NPF type aerosol size distribution in Atlanta.
3.2 Potential sources of sub-3 nm aerosols in urban Beijing
NPF process is the most important source of atmospheric sub-3 nm particles (Nsub-3) in urban Beijing. As shown in Fig. 4a, Nsub-3 showed a clear diurnal variation that reached its daily maximum in the noontime on NPF days. The median daily maximum Nsub-3 was ∼ 1.1 × 104 cm−3 on NPF days in urban Beijing. The observed daytime maximum of Nsub-3 results mainly from the formation of the H2SO4 clusters driven by SO2 oxidation through photochemical process during the daytime on NPF days (Figs. 4c, d and S10). When the NPF events occurred, Nsub-3 was overwhelmingly higher than that when there were no NPF events (non-NPF daytime or nighttime). Similar diurnal cycles of Nsub-3 and the dominant contribution of NPF process to the sub-3 nm aerosols were also observed in Shanghai, China (Xiao et al., 2015), Po Valley, Italy (Kontkanen et al., 2016), and Kent, US (Yu et al., 2014), which are relatively polluted atmospheric environments.
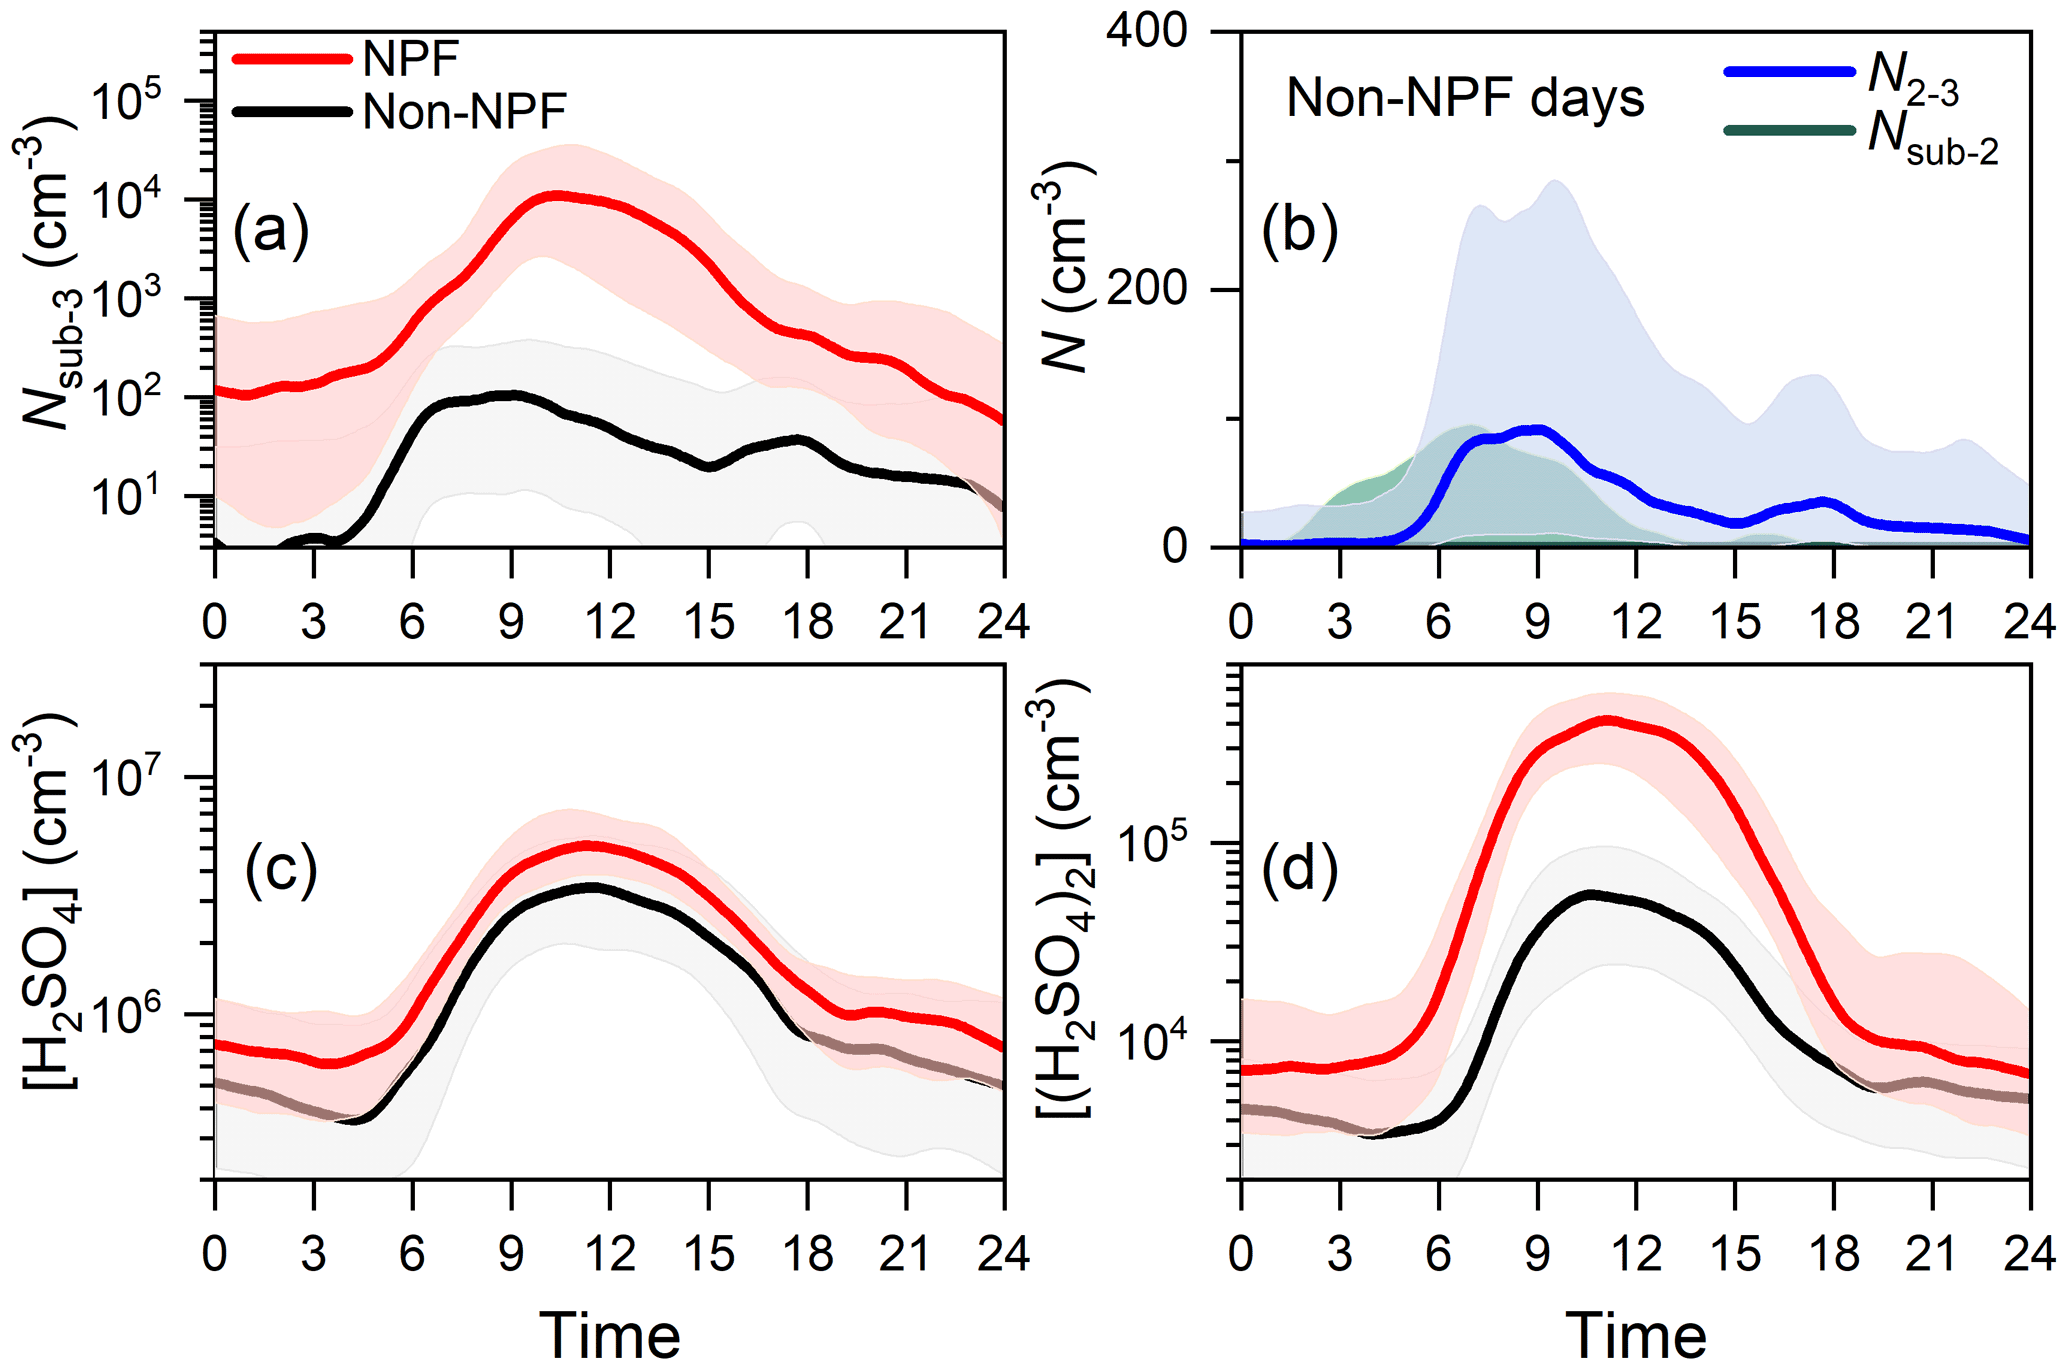
Figure 4The diurnal variations of (a) number concentration of sub-3 nm aerosols (Nsub-3), (c) H2SO4 monomer concentration, and (d) H2SO4 dimer concentration on NPF days and non-NPF days. (b) The diurnal variations of number concentration of sub-2 nm aerosols (Nsub-2) and 2–3 nm aerosols (N2−3) on non-NPF days. The solid lines represent median values and the shading areas indicate 25th–75th percentiles. Note that the median diurnal variations of Nsub-2 are near zero on non-NPF days in (b).
The concentrations of sub-3 nm aerosols showed a strong seasonality on NPF days but had no obvious seasonal variations on non-NPF days (Figs. 5 and S11), supporting that the elevated Nsub-3 was introduced by the NPF process. Nsub-3 was significantly higher in winter than those in summer on NPF days. The median daytime Nsub-3 on NPF days was ∼ 1.2 × 104 cm−3 in winter in contrast to ∼ 200 cm−3 in summer. However, the more important reason is the much lower NPF intensity in summer because the seasonal variation of Nsub-3 on NPF days was consistent with those of H2SO4 dimer concentration and the formation rates of ∼ 1.5 nm aerosols (Fig. S12). This indicates that the seasonal variation of the formation process drives the seasonal variation of Nsub-3 (Deng et al., 2020, 2021). This seasonal variation is different from that observed in Hyytiälä, a boreal forest site in Finland, in which Nsub-3 was the highest in summer or spring and the lowest in winter (Sulo et al., 2021). The highest concentration of small particles in the size range of 1.1–1.7 nm in Hyytiälä was observed during summertime, coinciding with the high photochemical and biogenic activity in summer (Sulo et al., 2021).
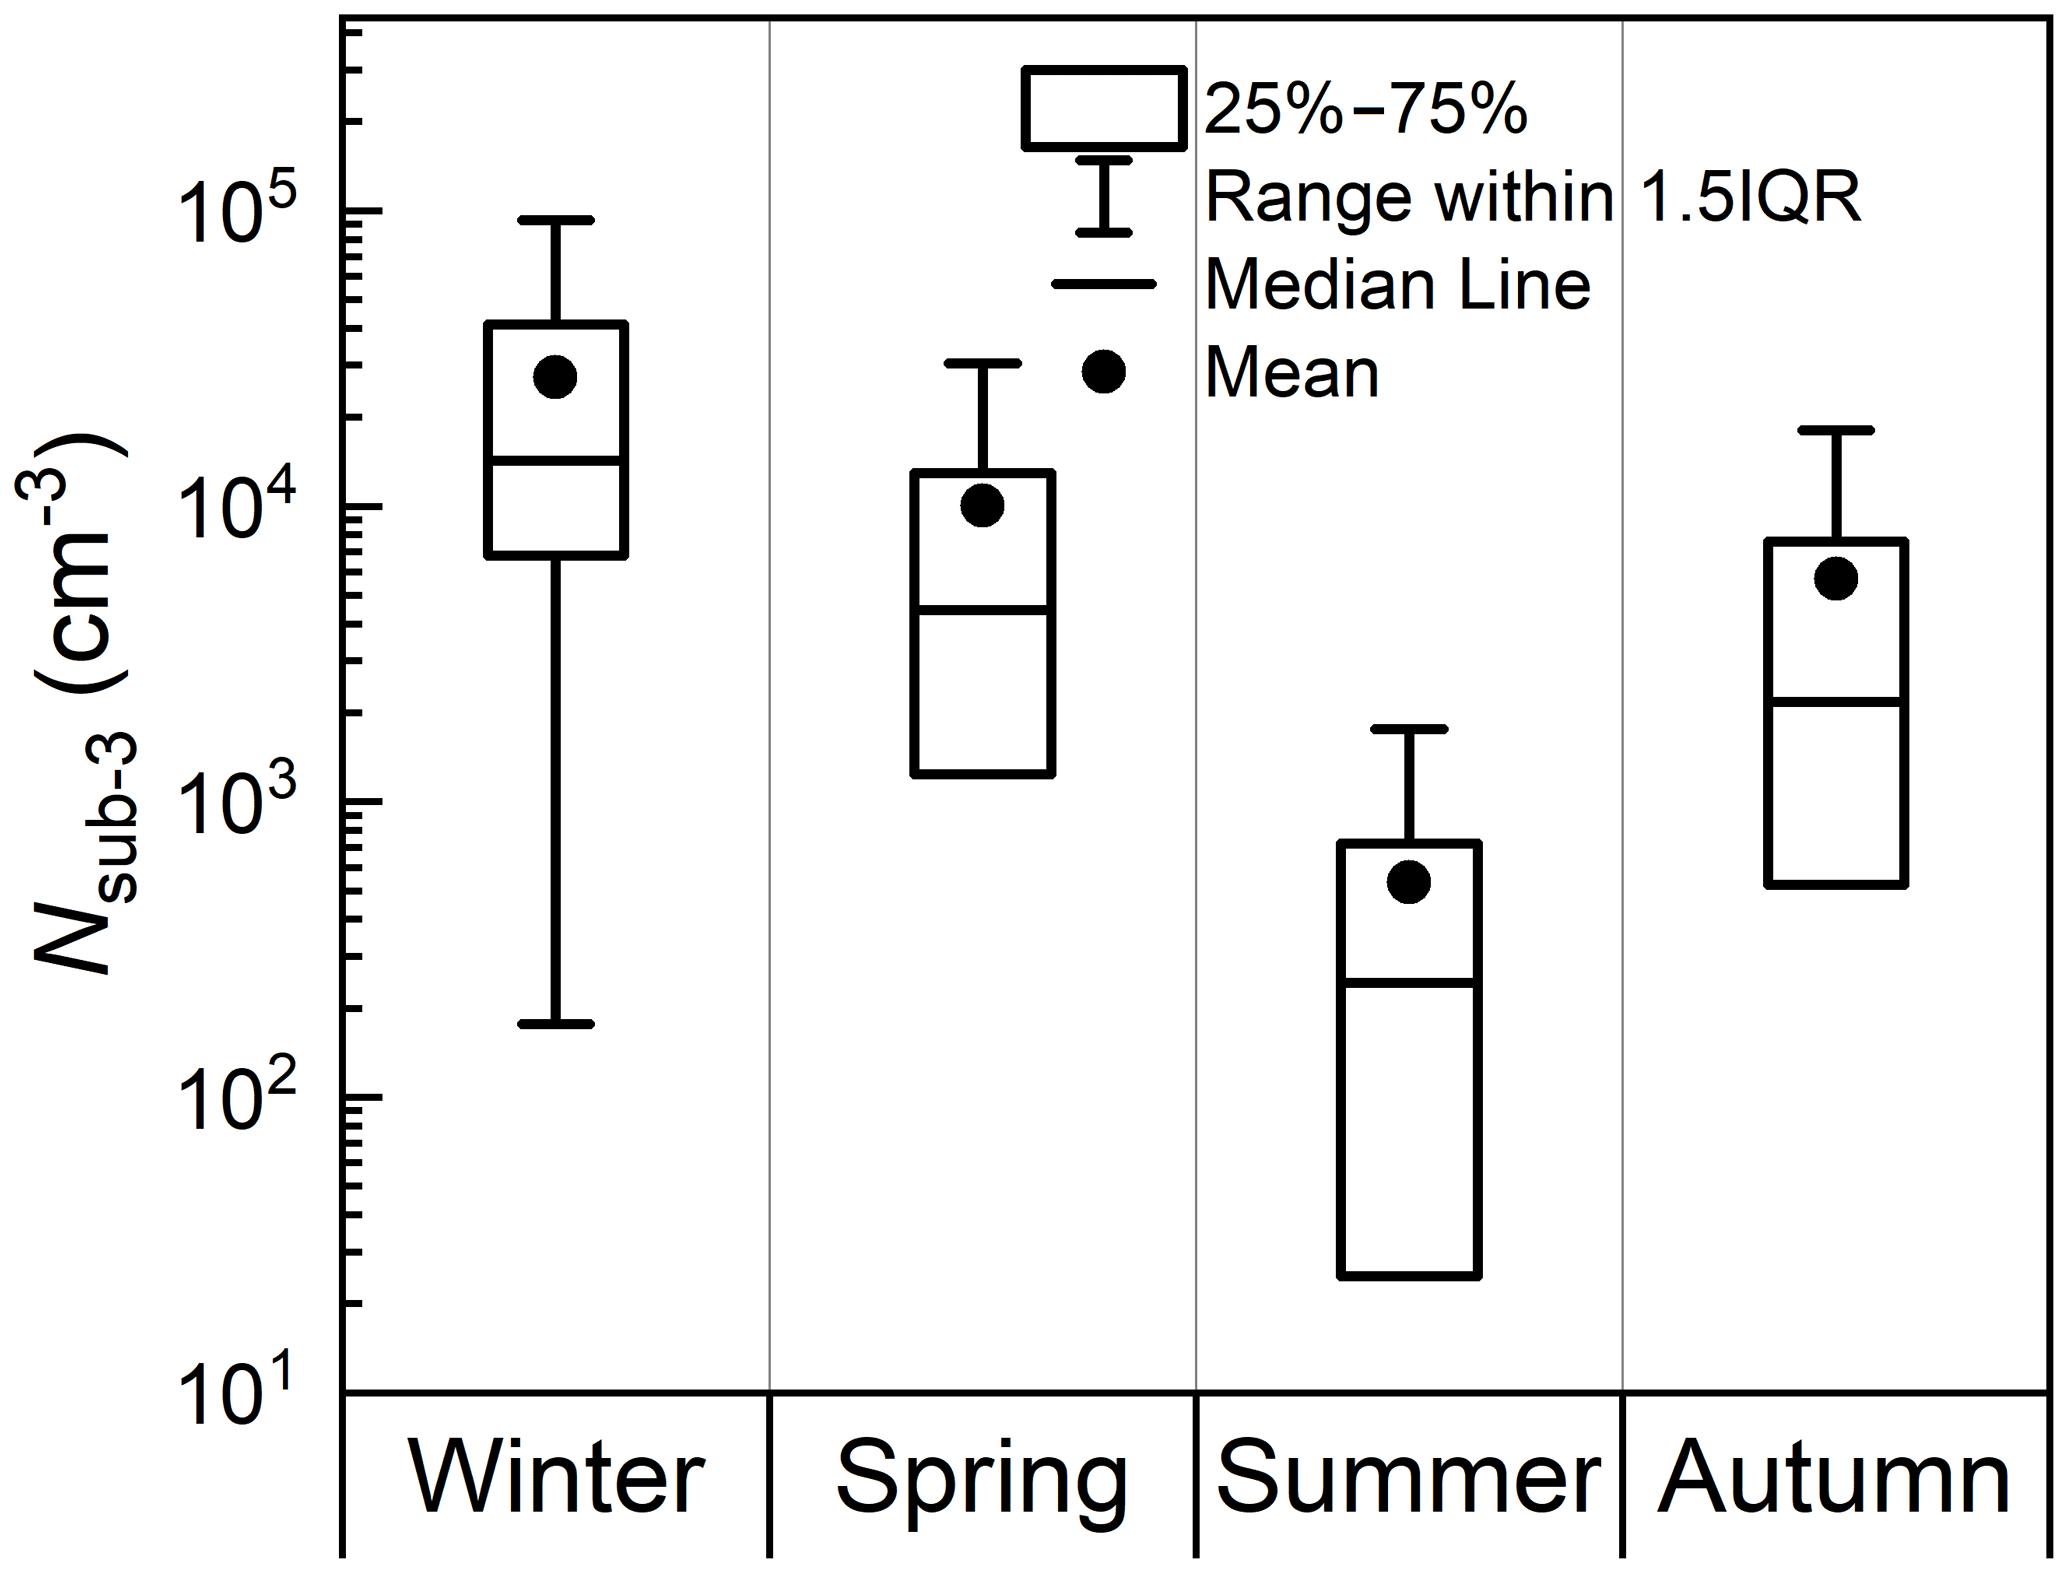
Figure 5The seasonal variations of number concentrations of sub-3 nm aerosols (Nsub-3) on NPF days in urban Beijing. Data during 09:00–14:00 were shown in this figure. The vertical lines and circles in the box indicate the median and mean values, respectively. The top and bottom edges represent 75th and 25th percentiles, respectively. The IQR is the interquartile range.
In addition to atmospheric NPF, sub-3 nm aerosols can also be emitted by primary sources, such as traffic emissions. This is relatively easier to explore during non-NPF days. As shown in Fig. 4a, Nsub-3 showed small morning (∼ 06:00–09:00) and evening (∼ 16:00–19:00) peaks on non-NPF days, roughly corresponding to the traffic rush hours in the morning and evening in urban Beijing. Although number concentrations of sub-2 nm aerosols were very low, those of 2–3 nm aerosols (N2−3) showed diurnal patterns on non-NPF days (Fig. 4b), indicating that the morning and evening peaks are more likely due to primary emissions.
The obvious difference of the N2−3 on non-NPF days between the Tsinghua site and the BUCT site, and between the COVID-19 lockdown period and normal period, further supports that vehicles emit 2–3 nm particles (Fig. 6). The morning and evening peaks of N2−3 on non-NPF days were more prominent at the BUCT site (closer to traffic roads) than at the Tsinghua site that is considered to be less influenced by traffic emissions. In addition, we found that N2−3 was much lower during the strict COVID-19 lockdown period at the BUCT site than normal time period. Traffic flows were extremely low during this strict lockdown period, such that traffic emissions were significantly reduced.
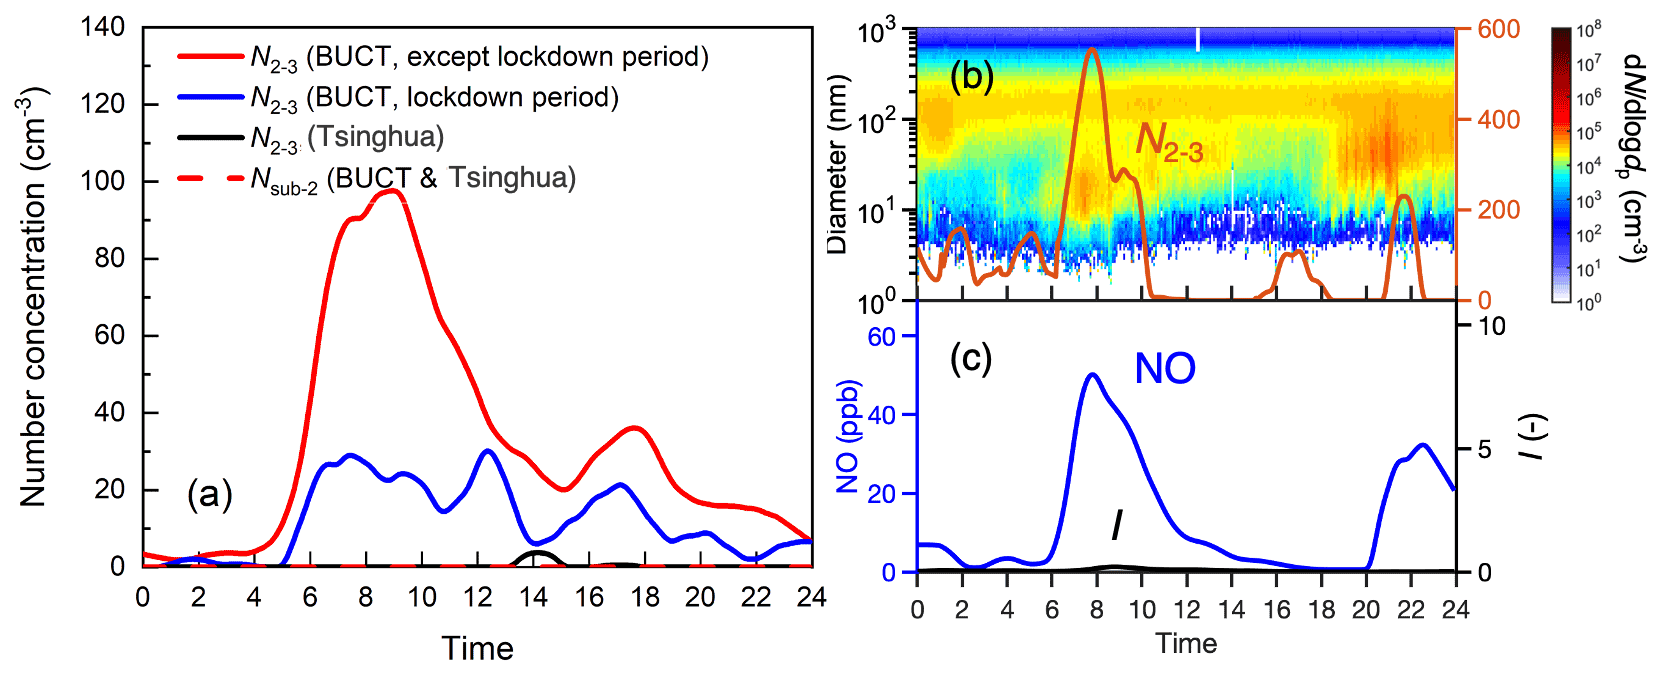
Figure 6(a) Median diurnal variations of number concentrations of 2–3 nm aerosols (N2−3) on non-NPF days at the BUCT site during COVID-19 lockdown period (14 January–25 February 2020) and other time period (except lockdown period), and at the Tsinghua site (7 March 2016–6 April 2016). The median diurnal variations of number concentrations of sub-2 nm aerosols (Nsub-2) are near zero on non-NPF days at both BUCT and Tsinghua sites. The temporal pattern of (b) aerosol size distributions, N2−3, (c) NO concentration, and the indicator I on a non-NPF day (13 March 2018).
A non-NPF case (13 March 2018) was examined to further confirm that vehicles can emit 2–3 nm aerosols (Fig. 6b and c). On this non-NPF day, N2−3 started to increase at around 06:00 and reached the maximum at around 08:00 when the concentration of the gas tracer for the traffic emissions, NO, also showed a peak. Furthermore, the NPF indicator, I, had low values during this morning time, indicating that the increase of 2–3 nm aerosols was unlikely due to nucleation process (Fig. 6c). Previous studies reported that traffic can directly emit sub-3 nm aerosols and thus can be an important source for sub-3 nm aerosols (Ronkko et al., 2017). Our results in urban Beijing support that traffic can emit 2–3 nm particles, but their relative contribution to the total aerosol number is negligible on NPF days.
Figure 6 also showed that, unlike secondary formation process, traffic emissions in terms of sub-3 nm aerosols is of local characteristic and its impact on the measured aerosol population strongly depends on the distance between the traffic road and the measurement site. Nucleation and subsequent growth processes exist not only in the atmosphere but also in the exit of pipelines of vehicles (Giechaskiel et al., 2014). In the large-scale atmosphere, the relative homogeneity of sufficient gaseous precursors for nucleation and growth processes enables the burst of sub-3 nm aerosols. The lifetime of sub-3 nm aerosols is extremely short due to strong coagulation effects in urban Beijing (Deng et al., 2021). Thus, sub-3 nm particles directly emitted from traffic are abundant only if one directly measures near the exhaust (Ronkko et al., 2017). This is supported by the fact that significantly less sub-2 aerosols were observed than 2–3 nm aerosols during the traffic rush hour both at the BUCT site and the Tsinghua site, i.e., due to the higher loss rate of sub-2 nm aerosols than 2–3 nm aerosols.
This study describes and interprets aerosol size distributions down to ∼ 1 nm in urban atmospheric environments. Based on the modified Whitby model, we introduce the simplification of aerosol size distributions in sub-3 nm sizes, i.e., the power function. This fitting function captures well the sharp concentration decrease of sub-3 nm particles with an increasing particle size. Although different nucleation mechanisms exist in different atmospheric environments (Sipilä et al., 2010; Jokinen et al., 2018; Lehtipalo et al., 2018; Yao et al., 2018; Yan et al., 2021; Beck et al., 2022), this simplified representation can be applied because concentrations often decrease with an increasing size when going from precursor molecules to small clusters and further to aerosol particle of a few nanometers (Jiang et al., 2011b; Chen et al., 2012; Kulmala et al., 2021).
The aerosol size distributions down to ∼ 1 nm and their representations are important parameters which can contribute to mechanistic, regional, and global atmospheric models. For instance, for large-scale or regional models, the aerosol size distributions are initial input parameters to estimate aerosol population or CCN budgets (Von Salzen et al., 2000; Adams, 2002). In some models, the aerosol module often takes the modal representation of aerosol size distributions as input to simulate the aerosol dynamics for better computational speed (Binkowski and Roselle, 2003; Vignati et al., 2004). In urban environments with great complexity of precursors and emission sources, the representation of aerosol size distributions could be adjusted according to our findings instead of using the traditional three lognormal modal aerosol size distributions. Another benefit is that size distributions ranging from molecular levels to the submicron size range can help to better simulate the NPF and growth mechanisms. For instance, Zhao and coworkers (2020) used a comprehensive model to investigate the NPF mechanisms in the Amazon free troposphere. They used measured aerosol size distributions with a lower size limit of ∼ 10 nm to compare to simulated ones. Since sub-3 nm is the critical size range where nucleation occurs, it is needed to cover this size range when comparing simulations with atmospheric measurements. This is more important for urban environment mixed with various processes and more complex than pristine environment. Additionally, the power law function can be readily incorporated in models. For instance, in the global climate models, the observed aerosol size distributions are used to compare with simulated ones (Bergman et al., 2012) and the sub-3 nm size range is the key to simulate nucleation process accurately. However, due to relative scarcity of measured particle size distributions in sub-3 nm around the world, the comparison between observed and simulated results is usually lacking this key size range. The power law function, as a simplified representation of sub-3 nm size distributions, can extend the observed particle size distributions above 3 nm to sub-3 nm, thus helping to constrain the aerosol module in the global models.
Based on long-term observational results, we addressed whether high concentrations of sub-2 nm aerosols are always present in the atmosphere. We show that concentrations of atmospheric sub-2 nm aerosols are high when NPF events occur. However, they are significantly lower during non-NPF periods (often not detected by DEG SMPS) compared to NPF periods even though the H2SO4 monomer concentration is often similar. Different from results measured by DEG SMPS, previous studies reported that high concentrations of atmospheric sub-2 nm aerosols measured by PSM are constantly present in the daytime (Kangasluoma et al., 2020; Kulmala et al., 2021). Although the higher noise-to-signal ratio and higher detection sensitivity of PSM may partly contribute (Kangasluoma and Kontkanen, 2017), considering that there is always high concentration of ion clusters in the atmosphere, the high signal of PSM all the time may be because it measures both aerosol particles and ion clusters (Kangasluoma et al., 2020; Kulmala et al., 2021).
Additionally, our study implies that although vehicles can be massive in megacities, their direct emissions of sub-3 nm aerosols only influence within the vicinities of traffic roads rather than the large-scale atmosphere. There are studies indicating that vehicles can emit high concentrations of sub-3 nm aerosols as detected by PSM (Ronkko et al., 2017; Okuljar et al., 2021). This is similar to previous studies showing that concentrations of ultrafine particles emitted by vehicles decrease significantly as the distance from the roads increases, due to the rapid dilution and strong aerosol dynamic processes such as coagulation and condensation in the atmosphere (Zhu et al., 2002). Our study indicates that the decreasing phenomenon is more significant with respect to sub-3 nm aerosols. Thus, though 2–3 nm aerosols emitted from vehicles were detected by DEG SMPS at both sites in urban Beijing, emissions of sub-2 nm aerosols were barely observed. Future studies measuring the size distributions of sub-3 nm aerosols simultaneously at sites with different distances from traffic roads can be performed to further investigate the impacts of vehicle emissions on atmospheric sub-3 nm aerosols without measurement interferences from ion clusters.
In this study, we identify three typical types of number size distributions of urban aerosols based on 4-year measurements using cluster analysis, i.e., daytime NPF type, daytime non-NPF type, and nighttime type, and investigate their characteristics. The daytime NPF type exhibits high concentrations of sub-3 nm aerosols together with other three modes. The first two modes are induced by atmospheric nucleation process and the third mode in the daytime NPF type is mainly from primary emissions. However, both the daytime non-NPF type and the nighttime type have a low abundance of sub-3 nm aerosol particles together with only two distinct modes because they have no influence of nucleation process. In urban Beijing, the concentration of H2SO4 monomer during the daytime with NPF is similar to that during the daytime without NPF, while significantly higher than that during the nighttime. We use a power law distribution and multiple lognormal distributions to represent the sharp concentration decrease of sub-3 nm particles with increasing size and the modal characteristics for those above 3 nm in the submicron size range. This fitting function also performs well for aerosol size distributions measured in Atlanta. We show that NPF is the major source of sub-3 nm particles in urban Beijing. In addition to NPF, we find that vehicles can also emit sub-3 nm particles, although their influence on the measured aerosol population strongly depends on the distance from the road. The representation of aerosol size distributions in sub-3 nm can help to constrain the aerosol module in the global models.
The datasets for this study can be accessed via https://doi.org/10.5281/zenodo.6654175 (Deng et al., 2022). The details are available upon request from the corresponding author.
The supplement related to this article is available online at: https://doi.org/10.5194/acp-22-13569-2022-supplement.
CD and JJ designed the research; CD, YL, JW, CY, YL, MK, and JJ collected the data; CD and JJ analyzed data with the help from RC, DW, YC, VK, and MK; and CD and JJ wrote the paper with inputs from all co-authors.
The contact author has declared that none of the authors has any competing interests.
Publisher's note: Copernicus Publications remains neutral with regard to jurisdictional claims in published maps and institutional affiliations.
We acknowledge the technical support from Qiang Zhang, Jianguo Deng and other staff at the Tsinghua site and BUCT sites.
This research has been supported by the National Natural Science Foundation of China (grant nos. 22188102 and 92044301) and Samsung PM2.5 SRP. This research has also been supported by the following projects: ACCC Flagship (grant no. 337549) and Academy professorship (grant no. 302958) by the Academy of Finland, Academy of Finland projects (grant nos. 1325656, 311932, 316114, 332547, and 325647), “Quantifying carbon sink, CarbonSink+ and their interaction with air quality” INAR project by Jane and Aatos Erkko Foundation, European Research Council (ERC) project ATM-GTP (grant no. 742206).
This paper was edited by Zhibin Wang and reviewed by two anonymous referees.
Adams, P. J.: Predicting global aerosol size distributions in general circulation models, J. Geophys. Res., 107, 4370, https://doi.org/10.1029/2001jd001010, 2002.
Beck, L. J., Schobesberger, S., Sipilä, M., Kerminen, V.-M., and Kulmala, M.: Estimation of sulfuric acid concentration using ambient ion composition and concentration data obtained with atmospheric pressure interface time-of-flight ion mass spectrometer, Atmos. Meas. Tech., 15, 1957–1965, https://doi.org/10.5194/amt-15-1957-2022, 2022.
Beddows, D. C. S., Dall'Osto, M., and Harrison, R. M.: Cluster Analysis of Rural, Urban, and Curbside Atmospheric Particle Size Data, Environ. Sci. Technol., 43, 4694–4700, https://doi.org/10.1021/es803121t, 2009.
Bergman, T., Kerminen, V.-M., Korhonen, H., Lehtinen, K. J., Makkonen, R., Arola, A., Mielonen, T., Romakkaniemi, S., Kulmala, M., and Kokkola, H.: Evaluation of the sectional aerosol microphysics module SALSA implementation in ECHAM5-HAM aerosol-climate model, Geosci. Model Dev., 5, 845–868, https://doi.org/10.5194/gmd-5-845-2012, 2012.
Binkowski, F. S. and Roselle, S. J.: Models-3 Community Multiscale Air Quality (CMAQ) model aerosol component 1. Model description, J. Geophys. Res.-Atmos., 108, 4183, https://doi.org/10.1029/2001jd001409, 2003.
Cai, R. and Jiang, J.: A new balance formula to estimate new particle formation rate: reevaluating the effect of coagulation scavenging, Atmos. Chem. Phys., 17, 12659–12675, https://doi.org/10.5194/acp-17-12659-2017, 2017.
Cai, R., Chen, D.-R., Hao, J., and Jiang, J.: A miniature cylindrical differential mobility analyzer for sub-3 nm particle sizing, J. Aerosol Sci., 106, 111–119, https://doi.org/10.1016/j.jaerosci.2017.01.004, 2017a.
Cai, R., Yang, D., Fu, Y., Wang, X., Li, X., Ma, Y., Hao, J., Zheng, J., and Jiang, J.: Aerosol surface area concentration: a governing factor in new particle formation in Beijing, Atmos. Chem. Phys., 17, 12327–12340, https://doi.org/10.5194/acp-17-12327-2017, 2017b.
Cai, R., Zhou, Y., and Jiang, J.: Transmission of charged nanoparticles through the DMA adverse axial electric field and its improvement, Aerosol Sci. Technol., 54, 21–32, https://doi.org/10.1080/02786826.2019.1673306, 2019.
Cai, R., Yan, C., Worsnop, D. R., Bianchi, F., Kerminen, V.-M., Liu, Y., Wang, L., Zheng, J., Kulmala, M., and Jiang, J.: An indicator for sulfuric acid–amine nucleation in atmospheric environments, Aerosol Sci. Technol., 1–11, 1059–1069, https://doi.org/10.1080/02786826.2021.1922598, 2021a.
Cai, R., Yan, C., Yang, D., Yin, R., Lu, Y., Deng, C., Fu, Y., Ruan, J., Li, X., Kontkanen, J., Zhang, Q., Kangasluoma, J., Ma, Y., Hao, J., Worsnop, D. R., Bianchi, F., Paasonen, P., Kerminen, V.-M., Liu, Y., Wang, L., Zheng, J., Kulmala, M., and Jiang, J.: Sulfuric acid–amine nucleation in urban Beijing, Atmos. Chem. Phys., 21, 2457–2468, https://doi.org/10.5194/acp-21-2457-2021, 2021b.
Chen, M., Titcombe, M., Jiang, J., Jen, C., Kuang, C., Fischer, M. L., Eisele, F. L., Siepmann, J. I., Hanson, D. R., Zhao, J., and McMurry, P. H.: Acid-base chemical reaction model for nucleation rates in the polluted atmospheric boundary layer, P. Natl. Acad. Sci. USA, 109, 18713–18718, https://doi.org/10.1073/pnas.1210285109, 2012.
Covert, D. S., Wiedensohler, A., Aalto, P., Heintzenberg, J., Mcmurry, P. H., and Leck, C.: Aerosol number size distributions from 3 to 500 nm diameter in the arctic marine boundary layer during summer and autumn, Tellus B: Chem. Phys. Meteorol., 48, 197–212, 1996.
Dal Maso, M., Kulmala, M., Riipinen, I., Wagner, R., Hussein, T., Aalto, P. P., and Lehtinen, K. E.: Formation and growth of fresh atmospheric aerosols: eight years of aerosol size distribution data from SMEAR II, Hyytiala, Finland, Boreal Environ. Res., 10, 323–336, 2005.
Deng, C., Cai, R., Yan, C., Zheng, J., and Jiang, J.: Formation and growth of sub-3 nm particles in megacities: impact of background aerosols, Faraday Discuss., 226, 348–363, https://doi.org/10.1039/d0fd00083c, 2021.
Deng, C., Yan, C., Li, Y., Wu, J., Cai, R., Wang, D., Liu, Y., Kangasluoma, J., Kerminen, V.-M., Kulmala, M., and Jiang, J.: Datasets to: Measurement report: Size distributions of urban aerosols down to 1 nm from long term measurements, Zenodo [data set], https://doi.org/10.5281/zenodo.6654175, 2022.
Deng, C., Fu, Y., Dada, L., Yan, C., Cai, R., Yang, D., Zhou, Y., Yin, R., Lu, Y., Li, X., Qiao, X., Fan, X., Nie, W., Kontkanen, J., Kangasluoma, J., Chu, B., Ding, A., Kerminen, V. M., Paasonen, P., Worsnop, D. R., Bianchi, F., Liu, Y., Zheng, J., Wang, L., Kulmala, M., and Jiang, J.: Seasonal Characteristics of New Particle Formation and Growth in Urban Beijing, Environ. Sci. Technol., 54, 8547–8557, https://doi.org/10.1021/acs.est.0c00808, 2020.
Fu, Y., Xue, M., Cai, R., Kangasluoma, J., and Jiang, J.: Theoretical and experimental analysis of the core sampling method: Reducing diffusional losses in aerosol sampling line, Aerosol Sci. Technol., 53, 793–801, https://doi.org/10.1080/02786826.2019.1608354, 2019.
Giechaskiel, B., Manfredi, U., and Martini, G.: Engine Exhaust Solid Sub-23 nm Particles: I. Literature Survey, SAE Int. J. Fuels Lubric., 7, 950–964, https://doi.org/10.4271/2014-01-2834, 2014.
Hoppel, W. and Frick, G.: Submicron aerosol size distributions measured over the tropical and south Pacific, Atmos. Environ. A, 24, 645–659, 1990.
Hussein, T., Puustinen, A., Aalto, P. P., Mäkelä, J. M., Hämeri, K., and Kulmala, M.: Urban aerosol number size distributions, Atmos. Chem. Phys., 4, 391–411, https://doi.org/10.5194/acp-4-391-2004, 2004.
Jiang, J., Chen, M., Kuang, C., Attoui, M., and McMurry, P. H.: Electrical Mobility Spectrometer Using a Diethylene Glycol Condensation Particle Counter for Measurement of Aerosol Size Distributions Down to 1 nm, Aerosol Sci. Technol., 45, 510–521, https://doi.org/10.1080/02786826.2010.547538, 2011a.
Jiang, J., Zhao, J., Chen, M., Eisele, F. L., Scheckman, J., Williams, B. J., Kuang, C., and McMurry, P. H.: First Measurements of Neutral Atmospheric Cluster and 1–2 nm Particle Number Size Distributions During Nucleation Events, Aerosol Sci. Technol., 45, ii–v, https://doi.org/10.1080/02786826.2010.546817, 2011b.
Jokinen, T., Sipilä, M., Kontkanen, J., Vakkari, V., Tisler, P., Duplissy, E.-M., Junninen, H., Kangasluoma, J., Manninen, H., Petäjä, T., Kulmala, M., Worsnop, D., Kirkby, J., Virkkula, A., and Kerminen, V. M.: Ion-induced sulfuric acid–ammonia nucleation drives particle formation in coastal Antarctica, Sci. Adv., 4, eaat9744, https://doi.org/10.1126/sciadv.aat9744, 2018.
Junge, C. E.: Air Chemistry and Radioactivity, Academic Press, New York, 382 pp., https://doi.org/10.1002/qj.49709038422, 1963.
Kangasluoma, J. and Kontkanen, J.: On the sources of uncertainty in the sub-3 nm particle concentration measurement, J. Aerosol Sci., 112, 34–51, https://doi.org/10.1016/j.jaerosci.2017.07.002, 2017.
Kangasluoma, J., Ahonen, L. R., Laurila, T. M., Cai, R., Enroth, J., Mazon, S. B., Korhonen, F., Aalto, P. P., Kulmala, M., Attoui, M., and Petäjä, T.: Laboratory verification of a new high flow differential mobility particle sizer, and field measurements in Hyytiälä, J. Aerosol Sci., 124, 1–9, https://doi.org/10.1016/j.jaerosci.2018.06.009, 2018.
Kangasluoma, J., Cai, R., Jiang, J., Deng, C., Stolzenburg, D., Ahonen, L. R., Chan, T., Fu, Y., Kim, C., Laurila, T. M., Zhou, Y., Dada, L., Sulo, J., Flagan, R. C., Kulmala, M., Petäjä, T., and Lehtipalo, K.: Overview of measurements and current instrumentation for 1–10 nm aerosol particle number size distributions, J. Aerosol Sci., 148, https://doi.org/10.1016/j.jaerosci.2020.105584, 2020.
Knutson, E. and Whitby, K.: Aerosol classification by electric mobility: apparatus, theory, and applications, J. Aerosol Sci., 6, 443–451, 1975.
Kontkanen, J., Järvinen, E., Manninen, H. E., Lehtipalo, K., Kangasluoma, J., Decesari, S., Gobbi, G. P., Laaksonen, A., Petäjä, T., and Kulmala, M.: High concentrations of sub-3 nm clusters and frequent new particle formation observed in the Po Valley, Italy, during the PEGASOS 2012 campaign, Atmos. Chem. Phys., 16, 1919–1935, https://doi.org/10.5194/acp-16-1919-2016, 2016.
Kontkanen, J., Lehtipalo, K., Ahonen, L., Kangasluoma, J., Manninen, H. E., Hakala, J., Rose, C., Sellegri, K., Xiao, S., Wang, L., Qi, X., Nie, W., Ding, A., Yu, H., Lee, S., Kerminen, V.-M., Petäjä, T., and Kulmala, M.: Measurements of sub-3 nm particles using a particle size magnifier in different environments: from clean mountain top to polluted megacities, Atmos. Chem. Phys., 17, 2163–2187, https://doi.org/10.5194/acp-17-2163-2017, 2017.
Ku, B. K. and de la Mora, J. F.: Relation between Electrical Mobility, Mass, and Size for Nanodrops 1–6.5 nm in Diameter in Air, Aerosol Sci. Technol., 43, 241–249, https://doi.org/10.1080/02786820802590510, 2009.
Kulmala, M., Stolzenburg, D., Dada, L., Cai, R., Kontkanen, J., Yan, C., Kangasluoma, J., Ahonen, L. R., Gonzalez-Carracedo, L., Sulo, J., Tuovinen, S., Deng, C., Li, Y., Lehtipalo, K., Lehtinen, K. E. J., Petäjä, T., Winkler, P. M., Jiang, J., and Kerminen, V.-M.: Towards a concentration closure of sub-6 nm aerosol particles and sub-3 nm atmospheric clusters, J. Aerosol Sci., 159, 105878, https://doi.org/10.1016/j.jaerosci.2021.105878, 2021.
Kumar, P., Morawska, L., Birmili, W., Paasonen, P., Hu, M., Kulmala, M., Harrison, R. M., Norford, L., and Britter, R.: Ultrafine particles in cities, Environ. Int., 66, 1–10, https://doi.org/10.1016/j.envint.2014.01.013, 2014.
Lehtipalo, K., Yan, C., Dada, L., Bianchi, F., Xiao, M., Wagner, R., Stolzenburg, D., Ahonen, L. R., Amorim, A., and Baccarini, A. J. S. A.: Multicomponent new particle formation from sulfuric acid, ammonia, and biogenic vapors, Sci. Adv., 4, eaau5363, https://doi.org/10.1126/sciadv.aau5363, 2018.
Li, C. and Cai, R.: Tutorial: The discrete-sectional method to simulate an evolving aerosol, J. Aerosol Sci., 150, 105615, https://doi.org/10.1016/j.jaerosci.2020.105615, 2020.
Liu, B. Y. H. and Pui, D. Y. H.: On the performance of the electrical aerosol analyzer, J. Aerosol Sci., 6, 249–264, https://doi.org/10.1016/0021-8502(75)90093-2, 1975.
Liu, J., Jiang, J., Zhang, Q., Deng, J., and Hao, J.: A spectrometer for measuring particle size distributions in the range of 3 nm to 10 µm, Front. Environ. Sci. Eng., 10, 63–72, https://doi.org/10.1007/s11783-014-0754-x, 2016.
Lu, Y., Yan, C., Fu, Y., Chen, Y., Liu, Y., Yang, G., Wang, Y., Bianchi, F., Chu, B., Zhou, Y., Yin, R., Baalbaki, R., Garmash, O., Deng, C., Wang, W., Liu, Y., Petäjä, T., Kerminen, V.-M., Jiang, J., Kulmala, M., and Wang, L.: A proxy for atmospheric daytime gaseous sulfuric acid concentration in urban Beijing, Atmos. Chem. Phys., 19, 1971–1983, https://doi.org/10.5194/acp-19-1971-2019, 2019.
McMurry, P. H., Shan Woo, K., Weber, R., Chen, D.-R., and Pui, D. Y.: Size distributions of 3–10 nm atmospheric particles: Implications for nucleation mechanisms, Philos. Trans. Roy. Soc. London Series A, 358, 2625–2642, 2000.
Mirme, S. and Mirme, A.: The mathematical principles and design of the NAIS – a spectrometer for the measurement of cluster ion and nanometer aerosol size distributions, Atmos. Meas. Tech., 6, 1061–1071, https://doi.org/10.5194/amt-6-1061-2013, 2013.
Morawska, L., Bofinger, N. D., Kocis, L., and Nwankwoala, A.: Submicrometer and supermicrometer particles from diesel vehicle emissions, Environ. Sci. Technol., 32, 2033–2042, 1998.
Okuljar, M., Kuuluvainen, H., Kontkanen, J., Garmash, O., Olin, M., Niemi, J. V., Timonen, H., Kangasluoma, J., Tham, Y. J., Baalbaki, R., Sipilä, M., Salo, L., Lintusaari, H., Portin, H., Teinilä, K., Aurela, M., Dal Maso, M., Rönkkö, T., Petäjä, T., and Paasonen, P.: Measurement report: The influence of traffic and new particle formation on the size distribution of 1–800 nm particles in Helsinki – a street canyon and an urban background station comparison, Atmos. Chem. Phys., 21, 9931–9953, https://doi.org/10.5194/acp-21-9931-2021, 2021.
Ristovski, Z. D., Morawska, L., Bofinger, N. D., and Hitchins, J.: Submicrometer and Supermicrometer Particulate Emission from Spark Ignition Vehicles, Environ. Sci. Technol., 32, 3845–3852, https://doi.org/10.1021/es980102d, 1998.
Ronkko, T., Kuuluvainen, H., Karjalainen, P., Keskinen, J., Hillamo, R., Niemi, J. V., Pirjola, L., Timonen, H. J., Saarikoski, S., Saukko, E., Jarvinen, A., Silvennoinen, H., Rostedt, A., Olin, M., Yli-Ojanpera, J., Nousiainen, P., Kousa, A., and Dal Maso, M.: Traffic is a major source of atmospheric nanocluster aerosol, P. Natl. Acad. Sci. USA, 114, 7549–7554, https://doi.org/10.1073/pnas.1700830114, 2017.
Seinfeld, J. and Pandis, S.: Atmospheric Chemistry and Physics: From Air Pollution to Climate Change, 2nd edn., John Wiley & Sons, USA, 1203 pp., https://doi.org/10.1021/ja985605y, 2006.
Sipilä, M., Berndt, T., Petäjä, T., Brus, D., Vanhanen, J., Stratmann, F., Patokoski, J., Mauldin, R. L., Hyvärinen, A.-P., Lihavainen, H., and Kulmala, M.: The Role of Sulfuric Acid in Atmospheric Nucleation, Science, 327, 1243–1246, https://doi.org/10.1126/science.1180315, 2010.
Stolzenburg, D., Steiner, G., and Winkler, P. M.: A DMA-train for precision measurement of sub-10 nm aerosol dynamics, Atmos. Meas. Tech., 10, 1639–1651, https://doi.org/10.5194/amt-10-1639-2017, 2017.
Sulo, J., Sarnela, N., Kontkanen, J., Ahonen, L., Paasonen, P., Laurila, T., Jokinen, T., Kangasluoma, J., Junninen, H., Sipilä, M., Petäjä, T., Kulmala, M., and Lehtipalo, K.: Long-term measurement of sub-3 nm particles and their precursor gases in the boreal forest, Atmos. Chem. Phys., 21, 695–715, https://doi.org/10.5194/acp-21-695-2021, 2021.
Vanhanen, J., Mikkilä, J., Lehtipalo, K., Sipilä, M., Manninen, H. E., Siivola, E., Petäjä, T., and Kulmala, M.: Particle Size Magnifier for Nano-CN Detection, Aerosol Sci. Technol., 45, 533–542, https://doi.org/10.1080/02786826.2010.547889, 2011.
Vignati, E., Wilson, J., and Stier, P.: M7: An efficient size-resolved aerosol microphysics module for large-scale aerosol transport models, J. Geophys. Res.-Atmos., 109, D22202, https://doi.org/10.1029/2003jd004485, 2004.
von Salzen, K., Leighton, H. G., Ariya, P. A., Barrie, L. A., Gong, S. L., Blanchet, J. P., Spacek, L., Lohmann, U., and Kleinman, L. I.: Sensitivity of sulphate aerosol size distributions and CCN concentrations over North America to SOx emissions and H2O2concentrations, J. Geophys. Res.-Atmos., 105, 9741–9765, https://doi.org/10.1029/2000jd900027, 2000.
Wegner, T., Hussein, T., Hämeri, K., Vesala, T., Kulmala, M., and Weber, S.: Properties of aerosol signature size distributions in the urban environment as derived by cluster analysis, Atmos. Environ., 61, 350–360, https://doi.org/10.1016/j.atmosenv.2012.07.048, 2012.
Whitby, K. T.: The physical characteristics of sulfur aerosols, in: Sulfur in the Atmosphere, Elsevier, 135–159, 1978.
Whitby, K. T. and Clark, W. E.: Electric aerosol particle counting and size distribution measuring system for the 0.015 to 1 µ size range 1, Tellus, 18, 573–586, 1966.
Xiao, S., Wang, M. Y., Yao, L., Kulmala, M., Zhou, B., Yang, X., Chen, J. M., Wang, D. F., Fu, Q. Y., Worsnop, D. R., and Wang, L.: Strong atmospheric new particle formation in winter in urban Shanghai, China, Atmos. Chem. Phys., 15, 1769–1781, https://doi.org/10.5194/acp-15-1769-2015, 2015.
Yan, C., Yin, R., Lu, Y., Dada, L., Yang, D., Fu, Y., Kontkanen, J., Deng, C., Garmash, O., Ruan, J., Baalbaki, R., Schervish, M., Cai, R., Bloss, M., Chan, T., Chen, T., Chen, Q., Chen, X., Chen, Y., Chu, B., Dällenbach, K., Foreback, B., He, X., Heikkinen, L., Jokinen, T., Junninen, H., Kangasluoma, J., Kokkonen, T., Kurppa, M., Lehtipalo, K., Li, H., Li, H., Li, X., Liu, Y., Ma, Q., Paasonen, P., Rantala, P., Pileci, R. E., Rusanen, A., Sarnela, N., Simonen, P., Wang, S., Wang, W., Wang, Y., Xue, M., Yang, G., Yao, L., Zhou, Y., Kujansuu, J., Petäjä, T., Nie, W., Ma, Y., Ge, M., He, H., Donahue, N. M., Worsnop, D. R., Veli-Matti, K., Wang, L., Liu, Y., Zheng, J., Kulmala, M., Jiang, J., and Bianchi, F.: The Synergistic Role of Sulfuric Acid, Bases, and Oxidized Organics Governing New-Particle Formation in Beijing, Geophys. Res. Lett., 48, e2020GL091944, https://doi.org/10.1029/2020gl091944, 2021.
Yao, L., Garmash, O., Bianchi, F., Zheng, J., Yan, C., Kontkanen, J., Junninen, H., Mazon, S. B., Ehn, M., Paasonen, P., Sipila, M., Wang, M., Wang, X., Xiao, S., Chen, H., Lu, Y., Zhang, B., Wang, D., Fu, Q., Geng, F., Li, L., Wang, H., Qiao, L., Yang, X., Chen, J., Kerminen, V. M., Petaja, T., Worsnop, D. R., Kulmala, M., and Wang, L.: Atmospheric new particle formation from sulfuric acid and amines in a Chinese megacity, Science, 361, 278–281, https://doi.org/10.1126/science.aao4839, 2018.
Yu, H., Hallar, A. G., You, Y., Sedlacek, A., Springston, S., Kanawade, V. P., Lee, Y. N., Wang, J., Kuang, C., and Mcgraw, R. L.: Sub-3 nm Particles Observed at the Coastal and Continental Sites in the United States, J. Geophys. Res.-Atmos., 119, 860–879, https://doi.org/10.1002/2013JD020841, 2014.
Zhang, R., Khalizov, A., Wang, L., Hu, M., and Xu, W.: Nucleation and growth of nanoparticles in the atmosphere, Chem. Rev., 112, 1957–2011, https://doi.org/10.1021/cr2001756, 2012.
Zhao, B., Shrivastava, M., Donahue, N. M., Gordon, H., Schervish, M., Shilling, J. E., Zaveri, R. A., Wang, J., Andreae, M. O., Zhao, C., Gaudet, B., Liu, Y., Fan, J., and Fast, J. D.: High concentration of ultrafine particles in the Amazon free troposphere produced by organic new particle formation, P. Natl. Acad. Sci. USA, 117, 25344–25351, https://doi.org/10.1073/pnas.2006716117, 2020.
Zheng, J., Yang, D., Ma, Y., Chen, M., Cheng, J., Li, S., and Wang, M.: Development of a new corona discharge based ion source for high resolution time-of-flight chemical ionization mass spectrometer to measure gaseous H2SO4 and aerosol sulfate, Atmos. Environ., 119, 167–173, https://doi.org/10.1016/j.atmosenv.2015.08.028, 2015.
Zhu, Y., Hinds, W. C., Kim, S., Shen, S., and Sioutas, C.: Study of ultrafine particles near a major highway with heavy-duty diesel traffic, Atmos. Environ., 36, 4323–4335, 2002.