the Creative Commons Attribution 4.0 License.
the Creative Commons Attribution 4.0 License.
 | 26 Jan 2022
Modelling changes in secondary inorganic aerosol formation and nitrogen deposition in Europe from 2005 to 2030
Jan Eiof Jonson
Hilde Fagerli
Thomas Scheuschner
Svetlana Tsyro
Secondary inorganic PM2.5 particles are formed from SOx (), NOx (NO+NO2), and NH3 emissions, through the formation of either ammonium sulfate ((NH4)2SO4) or ammonium nitrate (NH4NO3). EU limits and WHO guidelines for PM2.5 levels are frequently exceeded in Europe, in particular in the winter months. In addition the critical loads for eutrophication are exceeded in most of the European continent. Further reductions in NH3 emissions and other PM precursors beyond the 2030 requirements could alleviate some of the health burden from fine particles and also reduce the deposition of nitrogen to vulnerable ecosystems.
Using the regional-scale EMEP/MSC-W model, we have studied the effects of year 2030 NH3 emissions on PM2.5 concentrations and depositions of nitrogen in Europe in light of present (2017), past (2005), and future (2030) conditions. Our calculations show that in Europe the formation of PM2.5 from NH3 to a large extent is limited by the ratio between the emissions of NH3 on one hand and SOx plus NOx on the other hand. As the ratio of NH3 to SOx and NOx is increasing, the potential to further curb PM2.5 levels through reductions in NH3 emissions is decreasing. Here we show that per gram of NH3 emissions mitigated, the resulting reductions in PM2.5 levels simulated using 2030 emissions are about a factor of 2.6 lower than when 2005 emissions are used. However, this ratio is lower in winter. Thus further reductions in the NH3 emissions in winter may have similar potential to SOx and NOx in curbing PM2.5 levels in this season.
Following the expected reductions of NH3 emission, depositions of reduced nitrogen () should also decrease in Europe. However, as the reductions in NOx emission are larger than for NH3, the fraction of total nitrogen (reduced plus oxidised nitrogen) deposited as reduced nitrogen is increasing and may exceed 60 % in most of Europe by 2030. Thus the potential for future reductions in the exceedances of critical loads for eutrophication in Europe will mainly rely on the ability to reduce NH3 emissions.
- Article
(11501 KB) - Full-text XML
- BibTeX
- EndNote


Concentrations of particles with a diameter of less than 2.5 µm (PM2.5) have been decreasing in most of Europe since the turn of the century as a combined result of reductions in anthropogenic emissions of primary particles and gaseous PM2.5 precursors. Emissions of NH3 play a central role in the secondary particle formation and are also major contributors to the exceedances of critical loads for eutrophication (Tsyro et al., 2020). In most parts of Europe emissions of in particular SOx (emitted predominantly as SO2 but also as ), and NOx (NO+NO2), have been steadily decreasing in the past decades. At the same time, emissions of NH3 have changed much less, decreasing in some European countries and increasing in others (see Sect. 3 and Appendix B in EMEP Status Report 1/2020, 2020). Further reductions of SOx, NOx, and NH3 emissions are required by the year 2030 according to the EU NEC2030 directive (https://www.eea.europa.eu/themes/air/air-pollution-sources-1/national-emission-ceilings, last access: 14 December 2021), but the projected percentage reductions in NH3 emissions in NEC2030 are smaller than for SOx and NOx. In the atmosphere SO2 is oxidised to and NOx to HNO3. Contrary to SOx and NOx, more than 90 % of the NH3 emissions are from agriculture, with only minor contributions from industry and traffic (IIASA, 2020). As a result these emissions are in general not co-located with the SOx and NOx emissions. In addition the temporal distribution of the emissions differ, with NH3 emissions peaking in spring and summer, whereas anthropogenic SOx and NOx emissions in general peak in winter. In the fine mode, ammonium sulfate ((NH4)2SO4) particles are first formed from NH3 and . Any excess NH3 can then form ammonium nitrate (NH4NO3) in thermodynamic equilibrium with HNO3 (see e.g. Simpson et al., 2012). When NH3 is in excess relative to both concentrations and the equilibrium with HNO3, the formation of salts will slow down at some point (when there is less acid available to react with NH3), and free NH3 (NH3 in excess of ) will be present. With NH3 emissions greatly exceeding SOx and NOx emissions already before 2005, one could question the effects of small or moderate reductions in NH3 emissions on secondary inorganic aerosols (SIA25), a major component in PM2.5.
Using emissions as described in Jiang et al. (2020), Aksoyoglu et al. (2020) showed that the fraction of in SIA25 was similar when calculated with 1990 versus 2030 emissions. With 1990 versus 2030 emissions, the fraction of in SIA25 dropped significantly, whereas the fraction increased, compensating for the reduction in . In many air pollution episodes in Europe involving PM2.5, NH4NO3 has accounted for a large portion of the aerosol mass (Petit et al., 2017; Vieno et al., 2016). With a large surplus of NH3 relative to HNO3 it could be that NH4NO3 formation will be virtually unaffected by changes in NH3 emissions. Both NOx and NH3 are relatively short-lived, with a lifetime in the atmosphere of about 1 d (Seinfeld and Pandis, 2016). Given the difference in both spatial and temporal distribution in the sources of NH3, NOx, and SOx, substantial local variability in the ratio between NH3 on one hand and and/or HNO3 on the other hand can be expected. Thus, locally the formation of SIA25 may be limited by the availability of either NH3 or HNO3 and due to the lack of co-location in both space and time of the sources of these species.
Here we apply the EMEP MSC-W model to investigate how PM2.5 concentrations, and deposition of reduced nitrogen (), have changed from 2005 to 2017. But the main focus is on model calculations for 2030, assuming that the NEC2030 requirements will be met. Given that NH3 concentrations in Europe are generally in substantial excess of HNO3 concentrations, we explore to what extent additional reductions in NH3 emissions will contribute to further reductions in and subsequently to reductions in PM2.5 levels, and to what extent the response to further NH3 emissions is linear. We try to answer this with a sensitivity study for PM2.5 for post NEC2030, applying additional step-wise NH3 emission reductions on top of the NEC2030 requirements holding all other emissions constant. At the same time we also investigate to what extent reductions in NH3 emissions may affect deposition of reduced nitrogen and the exceedance of critical loads for nitrogen deposition.
The model calculations have been made with the EMEP MSC-W model (hereafter “EMEP model”), version rv4.34, on 0.1×0.1∘ resolution for the domain between 30∘ W and 45∘ E and between 30 and 75∘ N. A detailed description of the EMEP model can be found in Simpson et al. (2012), with later model updates described in Simpson et al. (2020) and references therein. In the EMEP model the composition of the metastable aqueous aerosols of the inorganic system containing and and water and the system containing NH3 and HNO3 in the gas phase is calculated using the MARS equilibrium model (Binkowski and Shankar, 1995). In Tsyro and Metzgert (2019) the EMEP model results using the MARS model are compared to model calculations with EQUSAM4clim (Metzger et al., 2016, 2018), giving very similar results.
The EMEP model is available as open-source code (see code availability) and is under continuous development, receiving feedback from a host of users. It is regularly evaluated against measurements (see Gauss et al. (2017, 2018, 2019, 2020)) for the most recent evaluations. Scatter plots of model versus measurements for the concentrations of several key species, as well as for the wet depositions of reduced and oxidised nitrogen, are shown in Appendix A. The model performance is comparable for both 2005 and 2017, even though the selection of measurement sites differs for the two years. Measurements are also available for subsets of common sites for the two years, in general showing comparable biases between the model and measurements for the concentrations of key species for the years 2005 and 2017. The EMEP model has also participated in model intercomparisons and model evaluations in a number of peer-reviewed publications (Karl et al., 2019; Colette et al., 2011, 2012; Jonson et al., 2018). In Vivanco et al. (2018) depositions of sulfur and nitrogen species in Europe have been calculated by 14 regional models and compared to measurements, and in Theobald et al. (2019) the model-calculated trends in the wet deposition of as well as reduced and oxidised nitrogen from six models, including the EMEP model, are compared to measurements from 1990 to 2010. These two studies showed good results for the EMEP model. Out of the 14 models included in the study by Vivanco et al. (2018), the EMEP model was one of very few with low fractional biases compared to measurements for the wet depositions of reduced nitrogen (−0.01), oxidised nitrogen (−0.05), and (−0.11). For the trend studies presented in Theobald et al. (2019), the fractional bias for the years 1990 to 2010 was −0.18, −0.02, and 0.22 for the wet deposition of reduced nitrogen, oxidised nitrogen, and respectively, but the overall overestimation of was mainly caused by an overestimation in the first years of the period. Running the EMEP model in global mode, Ge et al. (2021) showed that the model captures the overall spatial and seasonal variations well for the major inorganic pollutants NH3, NO2, SO2, HNO3, , , and and wet depositions in East Asia, Southeast Asia, Europe, and North America.
Definition of the critical load for eutrophication
A critical load (CL) is defined as “a quantitative estimate of an exposure to one or more pollutants below which significant harmful effects on specified sensitive elements of the environment do not occur according to present knowledge” (Nilsson and Grennfelt, 1988). CLs are calculated for different receptors (e.g. terrestrial ecosystems, aquatic ecosystems), and a sensitive element can be any part (or the whole) of an ecosystem or ecosystem process. CLs have been derived for several pollutants and different negative effects. Here we restrict ourselves to CL defined to avoid the eutrophying effects of nitrogen deposition (CLeutN). Like sulfur, nitrogen can also have acidifying impacts in ecosystems, but the areas affected by acidification are strongly decreasing in Europe compared to earlier decades, and therefore the focus of this paper is on the eutrophying effects (Slootweg et al., 2015; EEA, 2014; Hettelingh et al., 2017).
The CLeutN for a site is either empirically derived or calculated from steady-state simple mass balance (SMB) equations. In the SMB method, non-harmful nitrogen-fixing processes are described mathematically and combined with a chemical criterion (e.g. an acceptable N concentration in the soil solution). This summation is then compared to the corresponding deposition value. Methods to compute CLs are summarised in the Mapping Manual of the ICP Modelling and Mapping CLRTAP (2017) (see also De Vries et al., 2015), which is used within the Convention on Long-range Transboundary Air Pollution (https://unece.org/40-years-clean-air, last access: 14 December 2021).
If the deposition of the pollutant under consideration is greater than the CL at a site, the CL is designated as exceeded. Such site-specific exceedances can be summarised for different spatial entities (e.g. grid cells, countries). This method is called average accumulated exceedance and is defined as the weighted average of exceedances for all ecosystems within the selected region, where the weights are the respective ecosystem areas (Posch et al., 2001).
The CL exceedances presented here were calculated using the current CL database, which is described in Hettelingh et al. (2017) and stored by the current Coordination Centre for Effects (CCE) at the German Federal Environmental Agency. The calculation is based on an extensive set of input data and equations. A detailed description is included in the Mapping Manual of the ICP Modelling and Mapping. (CLRTAP, 2017, Sect. 5). This dataset is also used, among other things, to support European assessments and negotiations on emission reductions (Hettelingh et al., 2001; Reis et al., 2012; EEA, 2014).
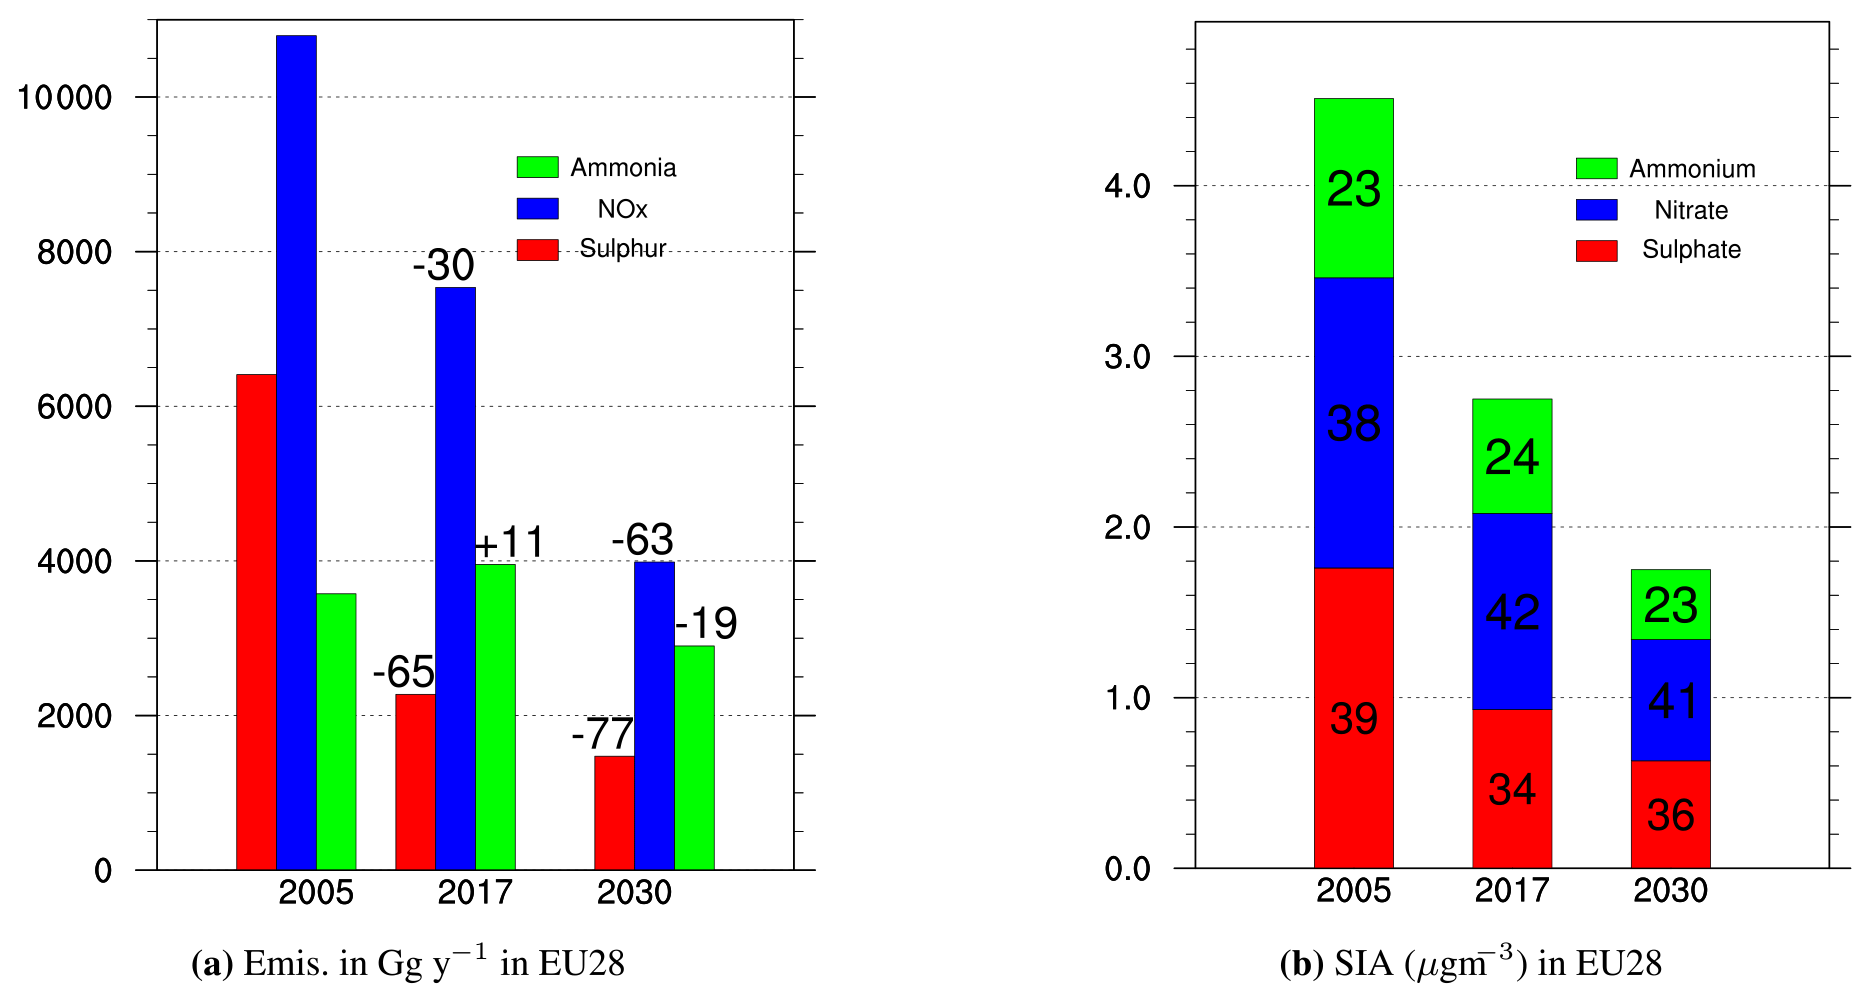
Figure 1(a) Emissions of SOx as SO2, NOx as NO2, and NH3 summed up for the EU28 countries. Percentage change in emissions from 2005 is given above the bars. (b) Concentrations of SIA (µg m−3) split into sulfate (), nitrate (), and ammonium () and averaged over the EU28 countries. Percentage contributions to SIA are printed inside the bars.
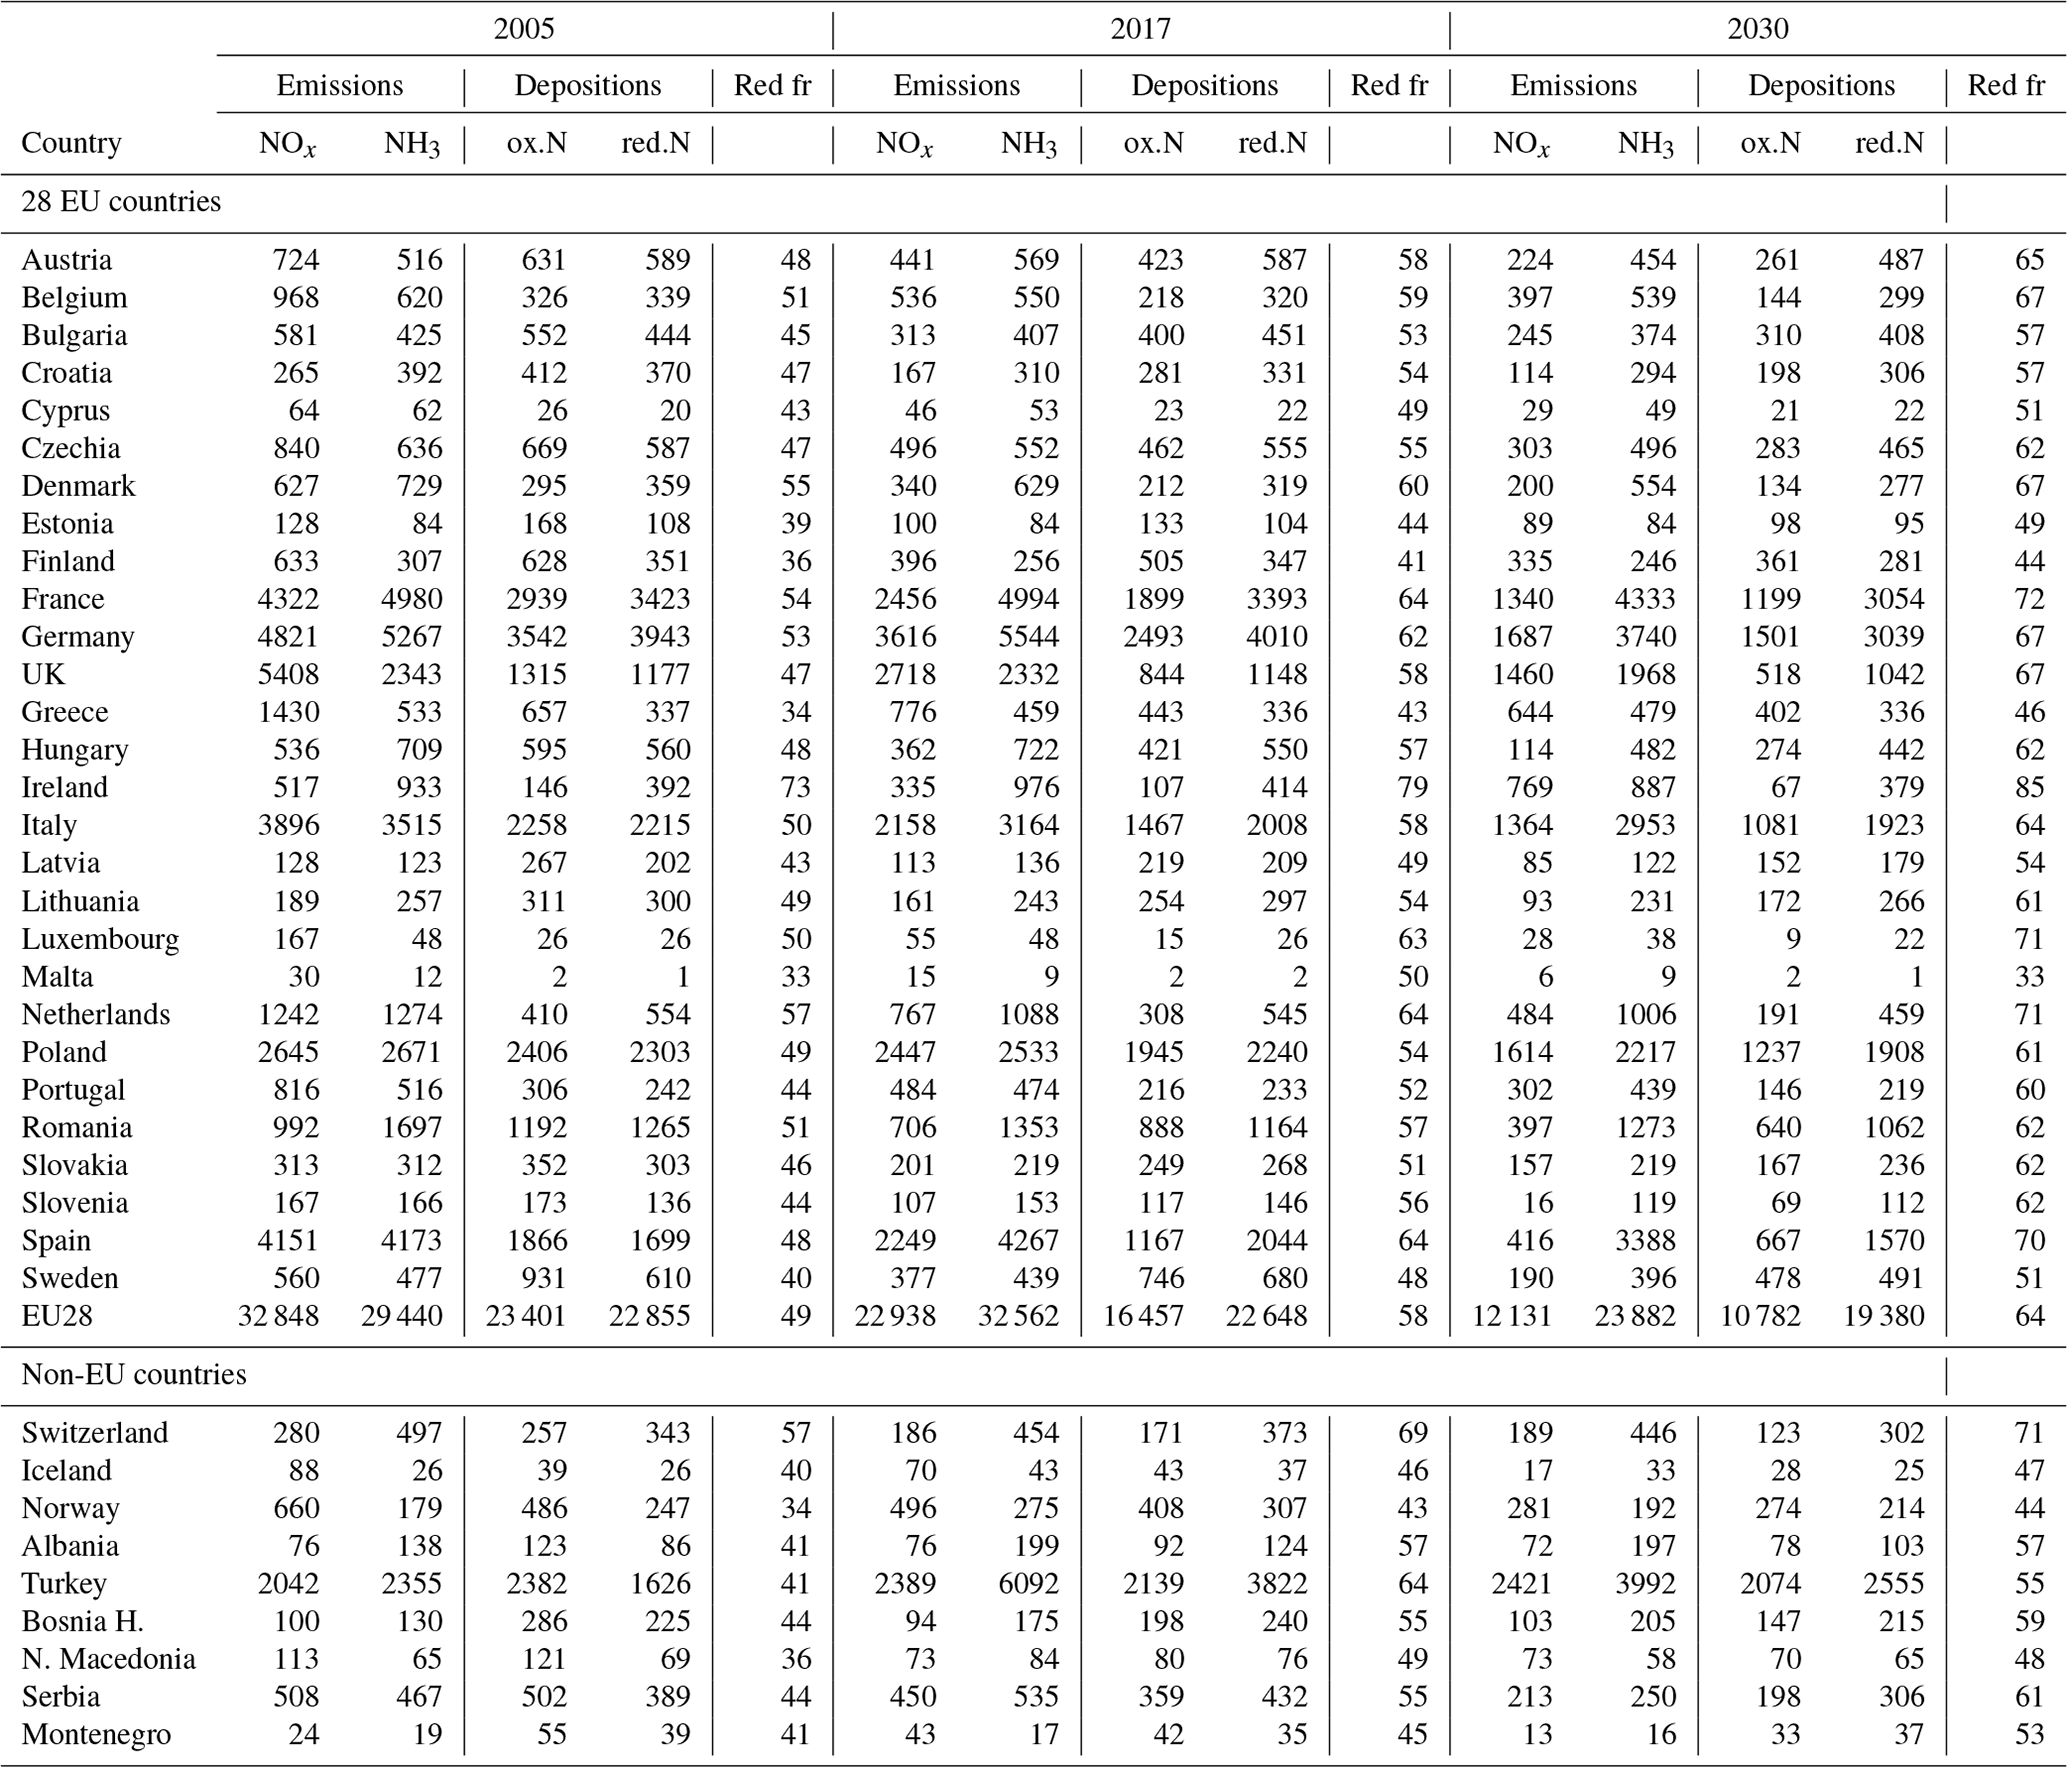
The EMEP model runs have been performed with 2017 meteorological conditions. In these model runs, emissions estimated for the years 2005 and 2017 and projected for 2030 have been used. The EMEP emissions are used as far as possible and supplemented by ECLIPSE (see below) emissions where needed. The model run with 2017 emissions is previously reported in the 2019 EMEP report (EMEP Status Report 1/2019, 2019). For the EU28 countries (EU28 includes the current EU27 countries and United Kingdom), the official EMEP emissions have been used for both the 2005 and 2017 model runs. For the model run with 2017 emissions, the EMEP emissions are also used for other countries and regions. The 2005 and 2017 EMEP emissions are listed in appendix B in the EMEP Status Report 1/2020 (2020). For the 2030 model runs the emissions for the individual EU28 countries are scaled from the 2005 emissions according to the NEC2030 obligations. The total emissions of NH3, SOx, and NOx in the EU28 countries in 2005, 2017, and 2030 are illustrated in Fig. 1a. For all other countries and regions the 2005 and 2030 emissions have been provided by the International Institute for Applied Systems Analysis (IIASA) within the European FP7 project ECLIPSE (http://www.iiasa.ac.at/web/home/research/researchPrograms/air/ECLIPSEv5.html, last access: 14 December 2021). In this study we use ECLIPSE version 6a (hereafter referred to as “ECLIPSEv6a”), which is a global emission dataset widely used by the scientific community. Some of the methods used in ECLIPSEv6a are described in the recent publication of Höglund-Isaksson et al. (2020). NH3 and NOx emissions from all EU28 countries and selected non-EU European countries are listed in Table 1. For year 2005 non-EU28 EMEP and ECLIPSEv6a, emissions are very similar for NOx, but for NH3 the EMEP emissions are in general higher.
Table 1Emissions of NOx and NH3, depositions of oxidised and reduced nitrogen, and the ratio of reduced to total (reduced + oxidised) deposition of nitrogen (Red fr). Emissions and deposition are listed in 100 Mg of N. Bosnia H. is Bosnia and Herzegovina, and N. Macedonia is North Macedonia. UK is the United Kingdom of Great Britain and Northern Ireland.
In order to explore the effects that further emission reductions of NH3 in 2030 may have on PM2.5 concentrations and nitrogen depositions, additional model sensitivity runs have been made. The 2030 NH3 emissions have been reduced by up to 50 % in steps of 10 %. In addition the 2030 emissions of SOx and NOx have been reduced by 10 % and the 2005 NH3 emissions by 10 %. All model runs are listed in Table 2.
Table 2Model runs performed. All model runs have been performed with 2017 meteorological conditions as described in Sect. 3. Base denotes model runs with all emissions for the years 2005, 2017, and 2030. For 2005, emissions in the EU28 are based on EMEP 2005 official emissions. Remaining land-based emissions from ECLIPSEv6a. For 2017 all emissions are as reported in the EMEP Status Report 1/2020 (2020) Appendix B. For 2030 EU28 emissions are scaled according to the NEC2030 obligations based on the 2005 emissions. Remaining land-based emissions from ECLIPSEv6a. Emissions and model runs are also described in Sect. 3. The additional model sensitivity runs reducing the emissions in steps of 10 % are also listed.

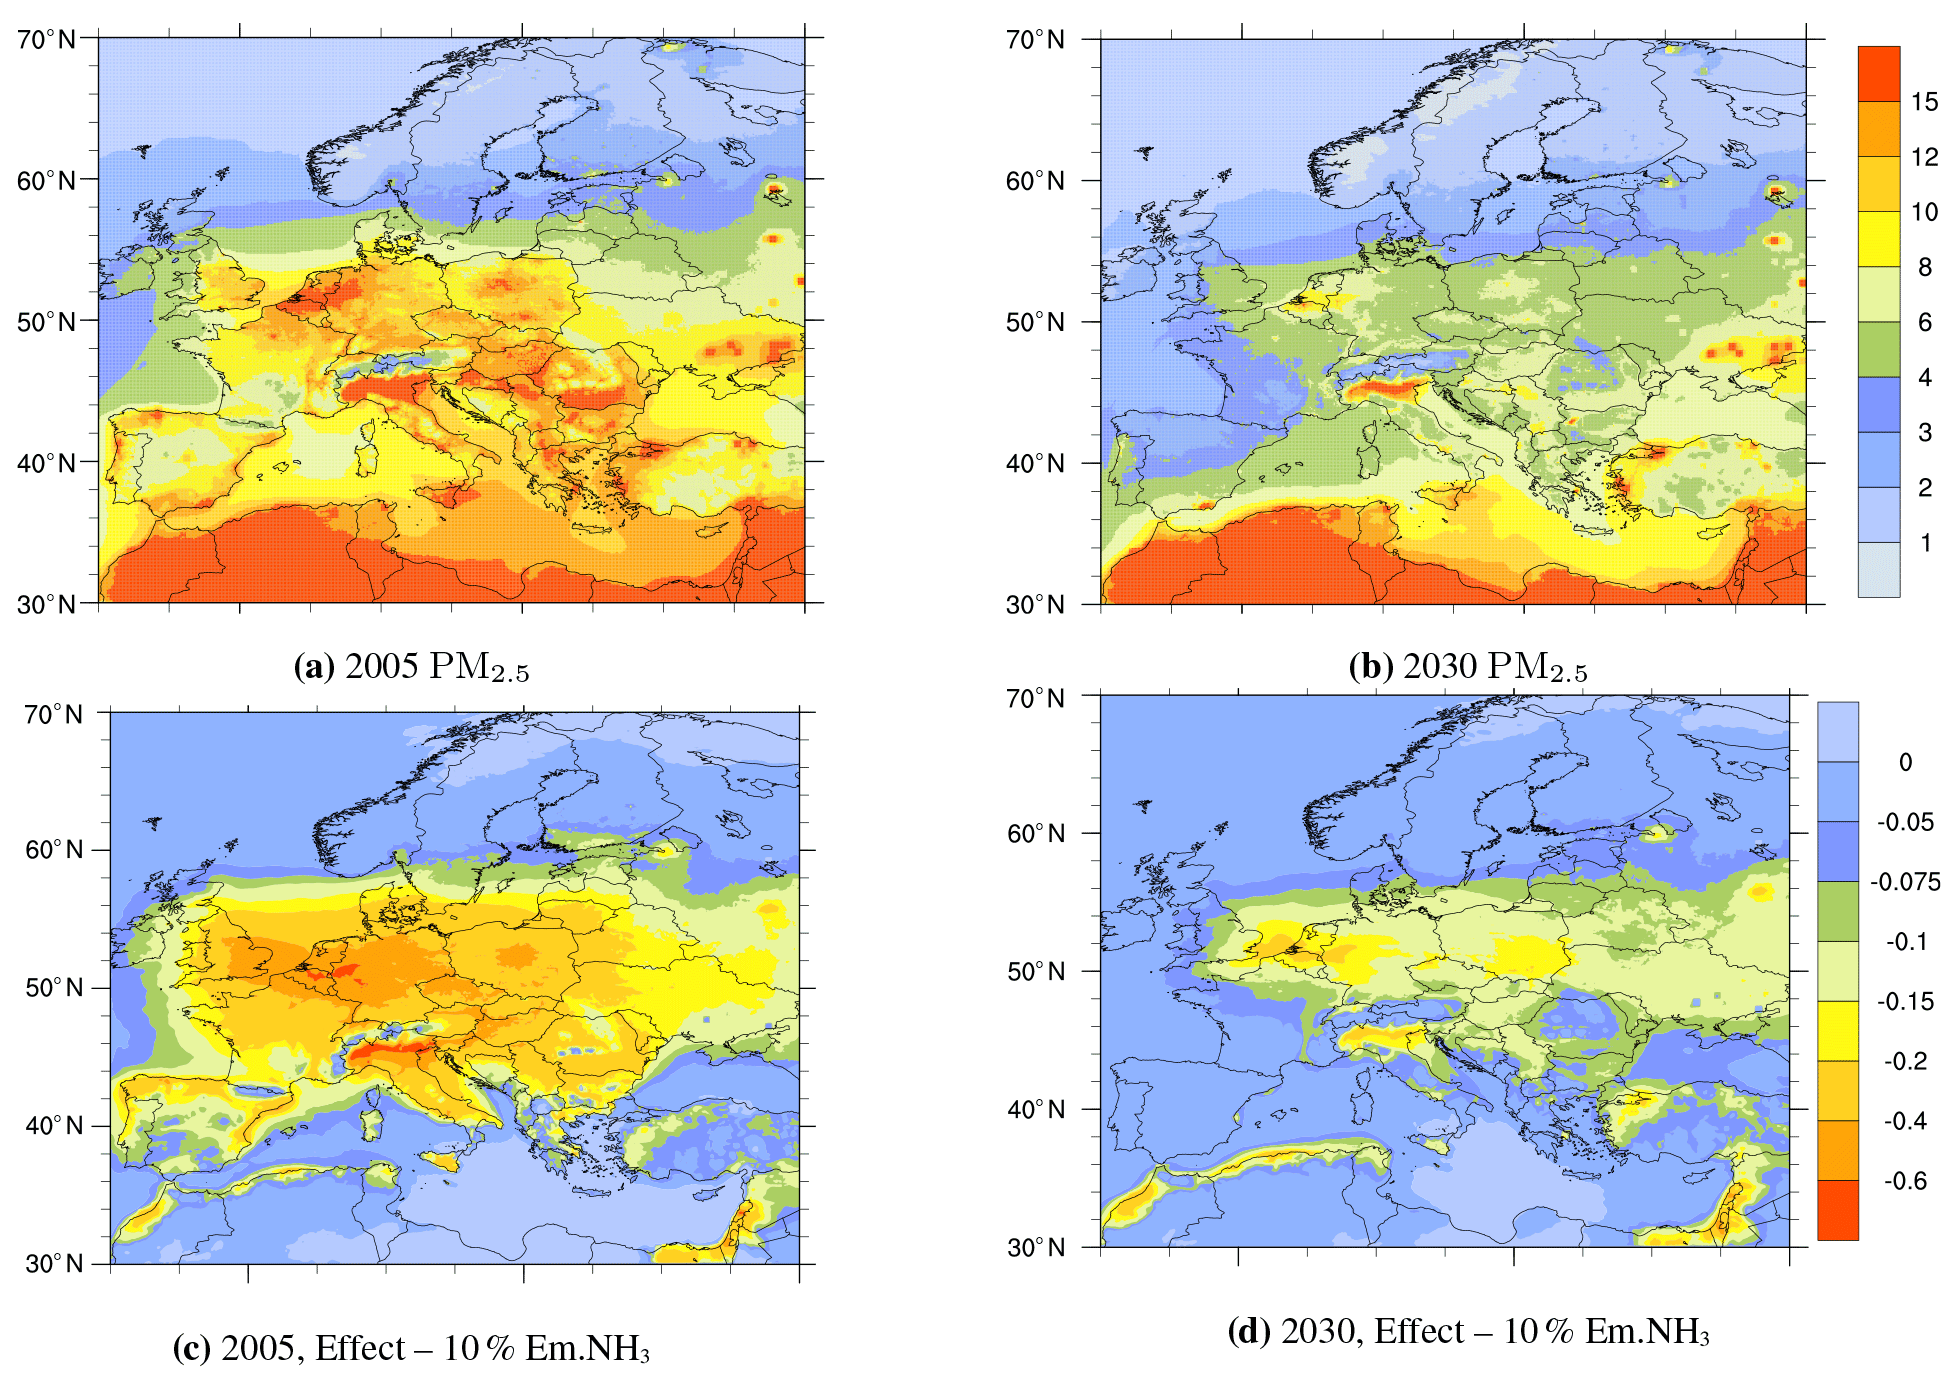
Figure 2PM2.5 in 2005 (a) and in 2030 (b). Effects of 10 % further reductions in NH3 emissions in 2005 (c) and in 2030 (d) (µg m−3).
4.1 PM2.5
Figure 2 upper panels show concentrations of PM2.5 as calculated with 2005 emissions (upper left) and 2030 emissions (upper right). The high PM2.5 levels over North Africa in both 2005 and in 2030 are caused by large natural sources of mineral dust. As shown in Fig. 2, substantial reductions in PM2.5 concentrations are expected from 2005 to 2030, caused by reductions in NH3 emissions, and even larger reductions in SOx and NOx emissions, in Europe. Even so, in 2030 elevated PM2.5 concentrations still persist in some areas, notably in the Po Valley in Italy and the Benelux countries (Belgium, the Netherlands, and Luxembourg). In these areas, anthropogenic primary PM2.5 and PM2.5 precursor emissions are expected to also remain high in 2030. As a result, the limit values for PM2.5 recommended by WHO (WHO, 2005) are expected to also be exceeded in these locations in 2030.
Figure 1b shows the concentrations of SIA25 averaged over the EU28 countries in 2005, 2017, and 2030 split by component (, , and ). Even if the reductions in NH3 emissions in the EU28 are much smaller than the corresponding reductions in SOx and NOx, the calculated percentage contributions to SIA25 from are virtually unchanged between 2005, 2017, and 2030, confirming the findings in Aksoyoglu et al. (2020) for the Payerne measurement site in Switzerland. The lack of change in the fraction of is not surprising, as is associated either with (NH4)2SO4 or with NH4NO3. As the molecular weight is 18 g mol−1 for NH4, 96 g mol−1 for , and 62 g mol−1 for NO3, the resulting percentage contribution by weight from NH4 for both NH4NO3 and (NH4)2SO4 is roughly 25 %, consistent with the contributions shown in Fig. 1b. Between 2005 and 2017 the percentage reductions in SOx emissions in the EU28 were more than twice as large as the reductions in NOx, resulting in an increase in the nitrate fraction in SIA25. From 2017 to 2030 the EU28 reductions in NOx are expected to be larger than for SOx, resulting in a slight decrease in the fraction of and a corresponding increase in the fraction in SIA25.
Table 3Exceedance of CL for eutrophication (CLex eut.) by deposition (Dep.) of total nitrogen. Exceedance are expressed as share (%) of the receptor area.
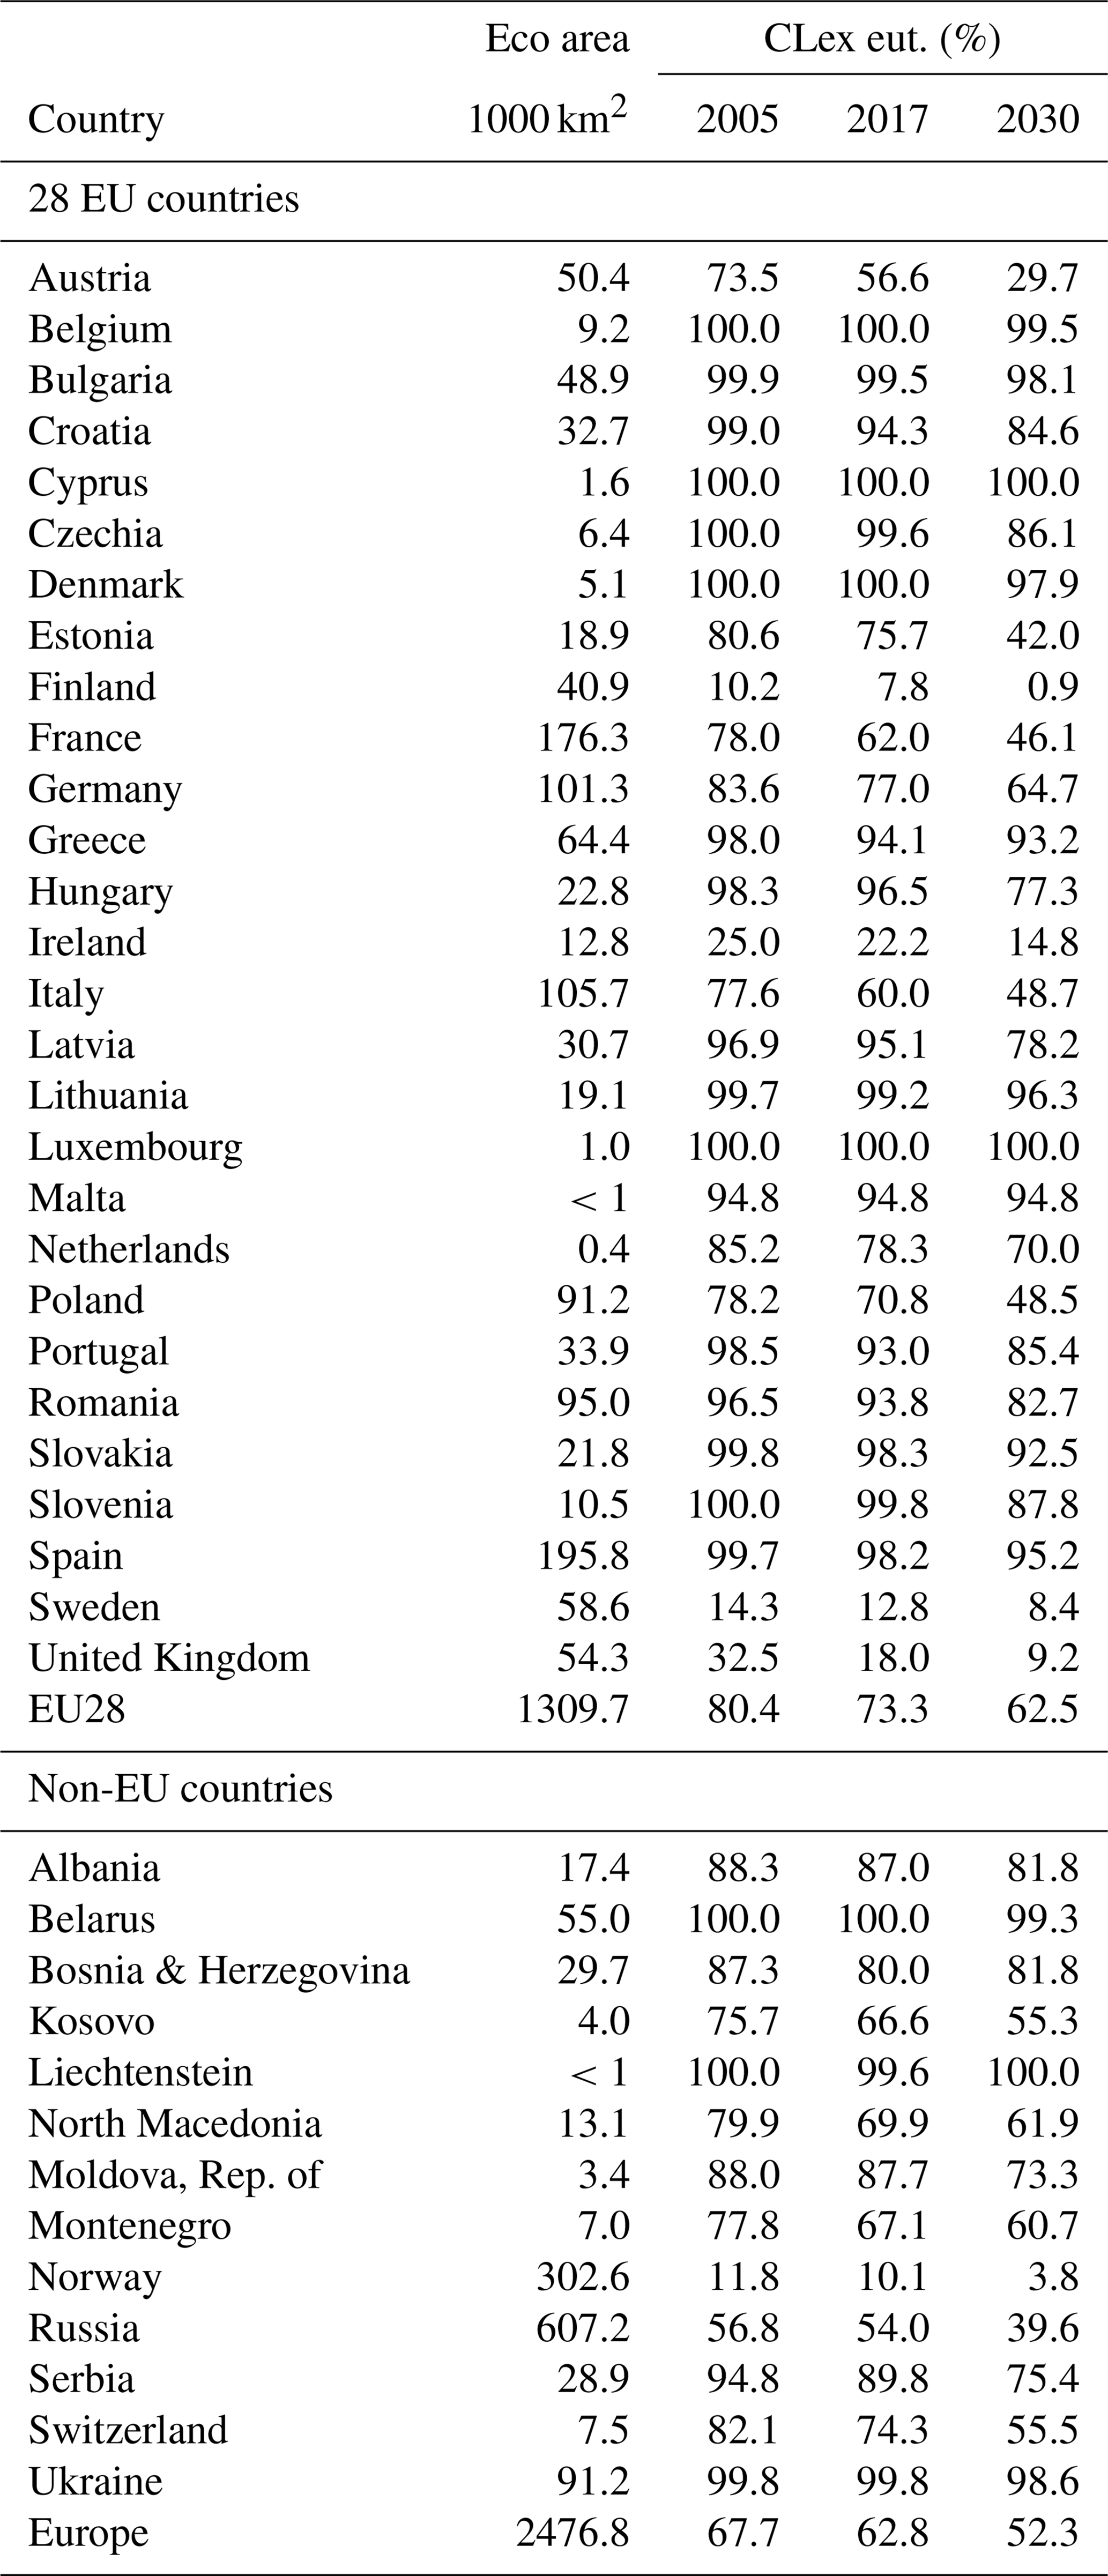
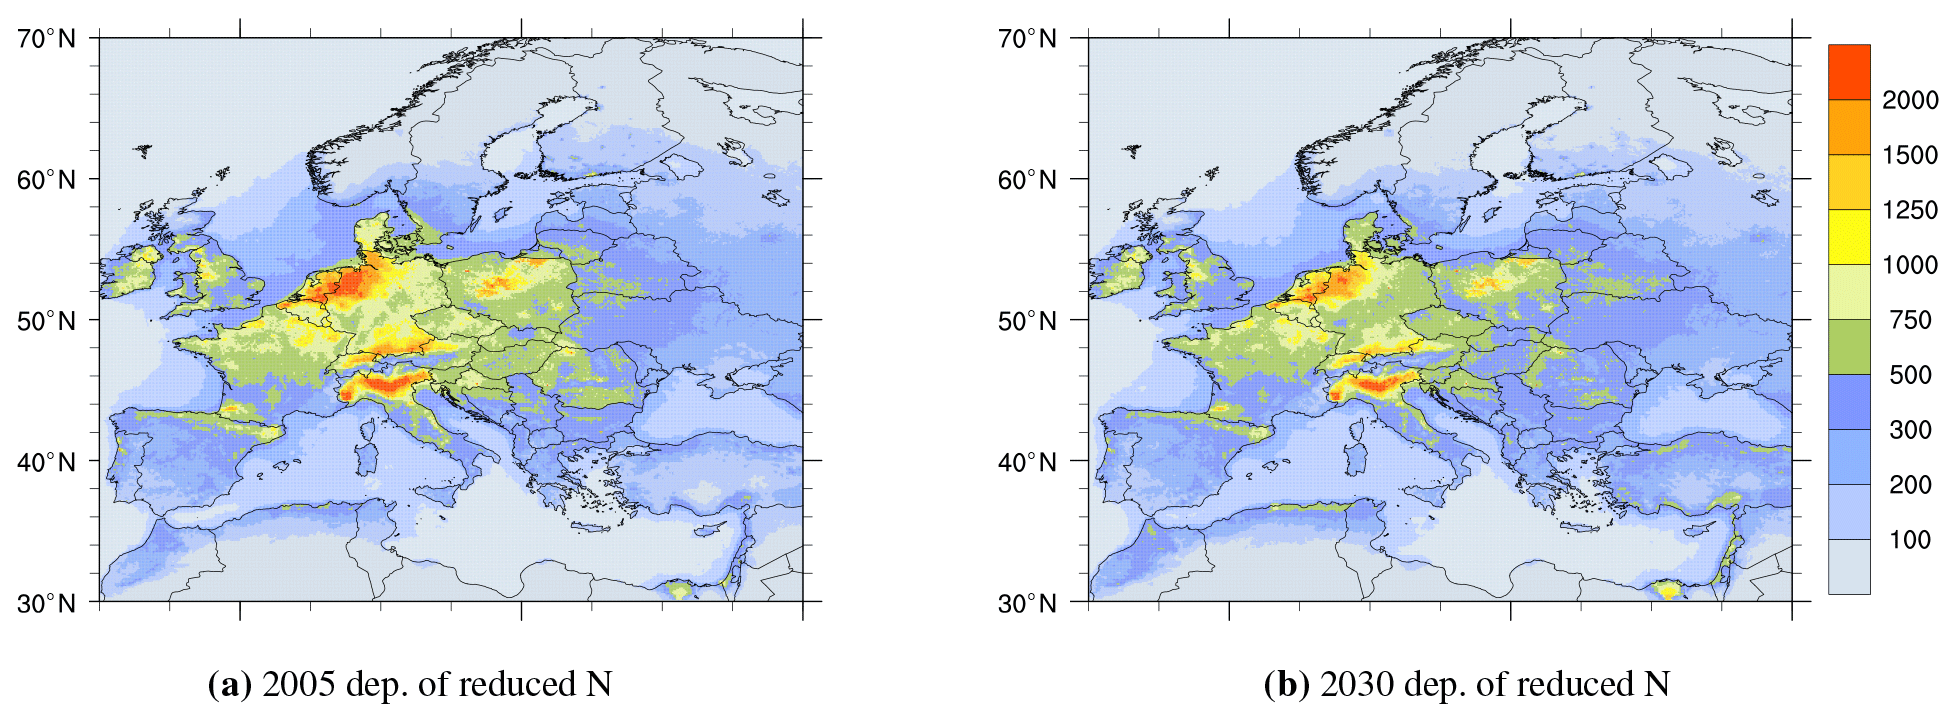
Figure 3Deposition of reduced N in 2005 (a) and in 2030 (b) (mg N m−2 yr−1).
4.2 Deposition of reduced nitrogen
Figure 3 shows the depositions of reduced nitrogen in 2005 (left) and in 2030 (right). As for PM2.5, the Po Valley and the Benelux countries stand out, receiving large amounts of reduced nitrogen depositions both in 2005 and in 2030. The total amount of deposition of reduced nitrogen (and also oxidised nitrogen) per country in 2005, 2017, and 2030 is listed in Table 1. In most central European high-emitting countries less reduced nitrogen is deposited than is emitted. Several countries facing the sea, with very few upwind sources, exemplified by Ireland and Portugal, receive far less deposition than they emit. At the same time the Nordic countries (Norway, Sweden, and Finland) and the Baltic countries (Estonia, Latvia, and Lithuania), located downwind of central Europe, receive more deposition of reduced nitrogen than they emit. For the European Union as a whole, the fraction of deposited over emitted reduced nitrogen is between 0.7 and 0.8 for all three emission years considered. The remaining 0.2–0.3 is deposited either at sea or in non-EU countries. About 15 % of the NH3 emitted within the model domain is advected out of the model domain, but much of this is coming from non-EU countries close the eastern model boundaries.
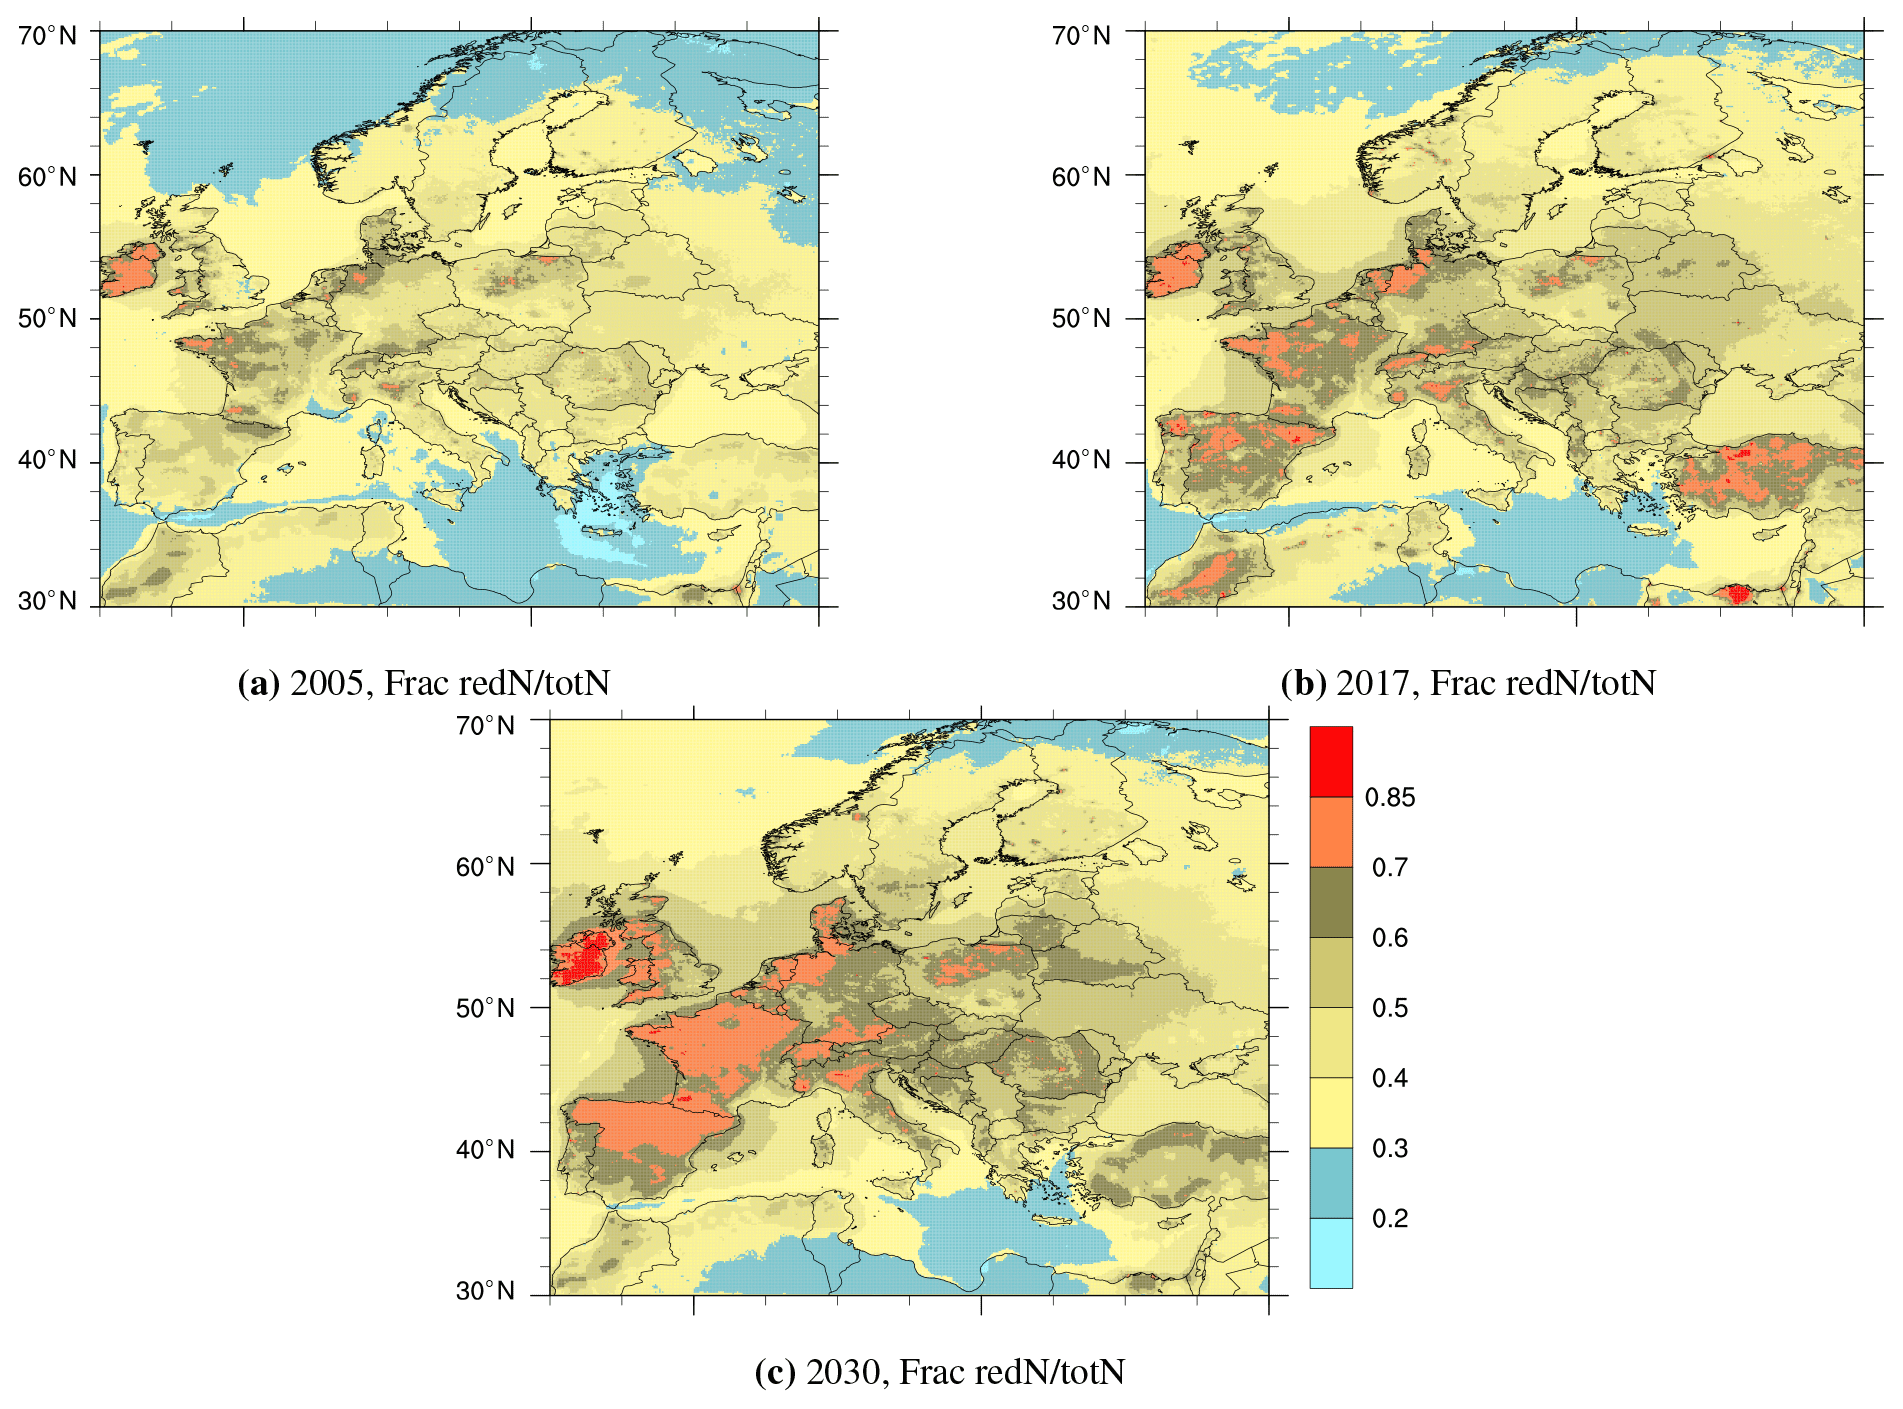
Figure 4Fraction of reduced N deposition relative to total N (reduced plus oxidised nitrogen) deposition, calculated with year 2005, 2017, and 2030 emissions.
As a result of the lower ambitions for reductions in NH3 emissions compared to NOx emissions, a larger portion of the total nitrogen deposition is expected to come from NH3. This is illustrated in Fig. 4, which shows the fraction of reduced nitrogen in the total nitrogen deposition calculated with 2005, 2017, and 2030 emissions. The figure shows that this fraction increases significantly from 2005 to 2017, with a further increase expected from 2017 to 2030. By 2030 the percentage of the total nitrogen deposition resulting from NH3 emissions is expected to exceed 60 % in large parts of Europe. The percentage contributions are also listed as an average for EU28 and as averages for individual European countries in Table 1. This underpins the findings from IIASA (2018) that the potential for further reductions of the exceedances of CL for eutrophication mainly depends on our ability to control future NH3 emissions. As shown in Fig. 5, the calculated CL for eutrophication is exceeded for all three years (2005, 2017, and 2030). Even though the level of exceedance has been substantially reduced from 2005 to 2017 and large reductions in depositions are also expected from 2017 to 2030, the total area in Europe where the CL is exceeded remains high for all three years. The percentage of the area where the CL for eutrophication is exceeded is listed in Table 3 for individual European countries.

Figure 5Calculated exceedances of CL for eutrophication (eq ha−1 yr−1) in 2005, 2017, and 2030.
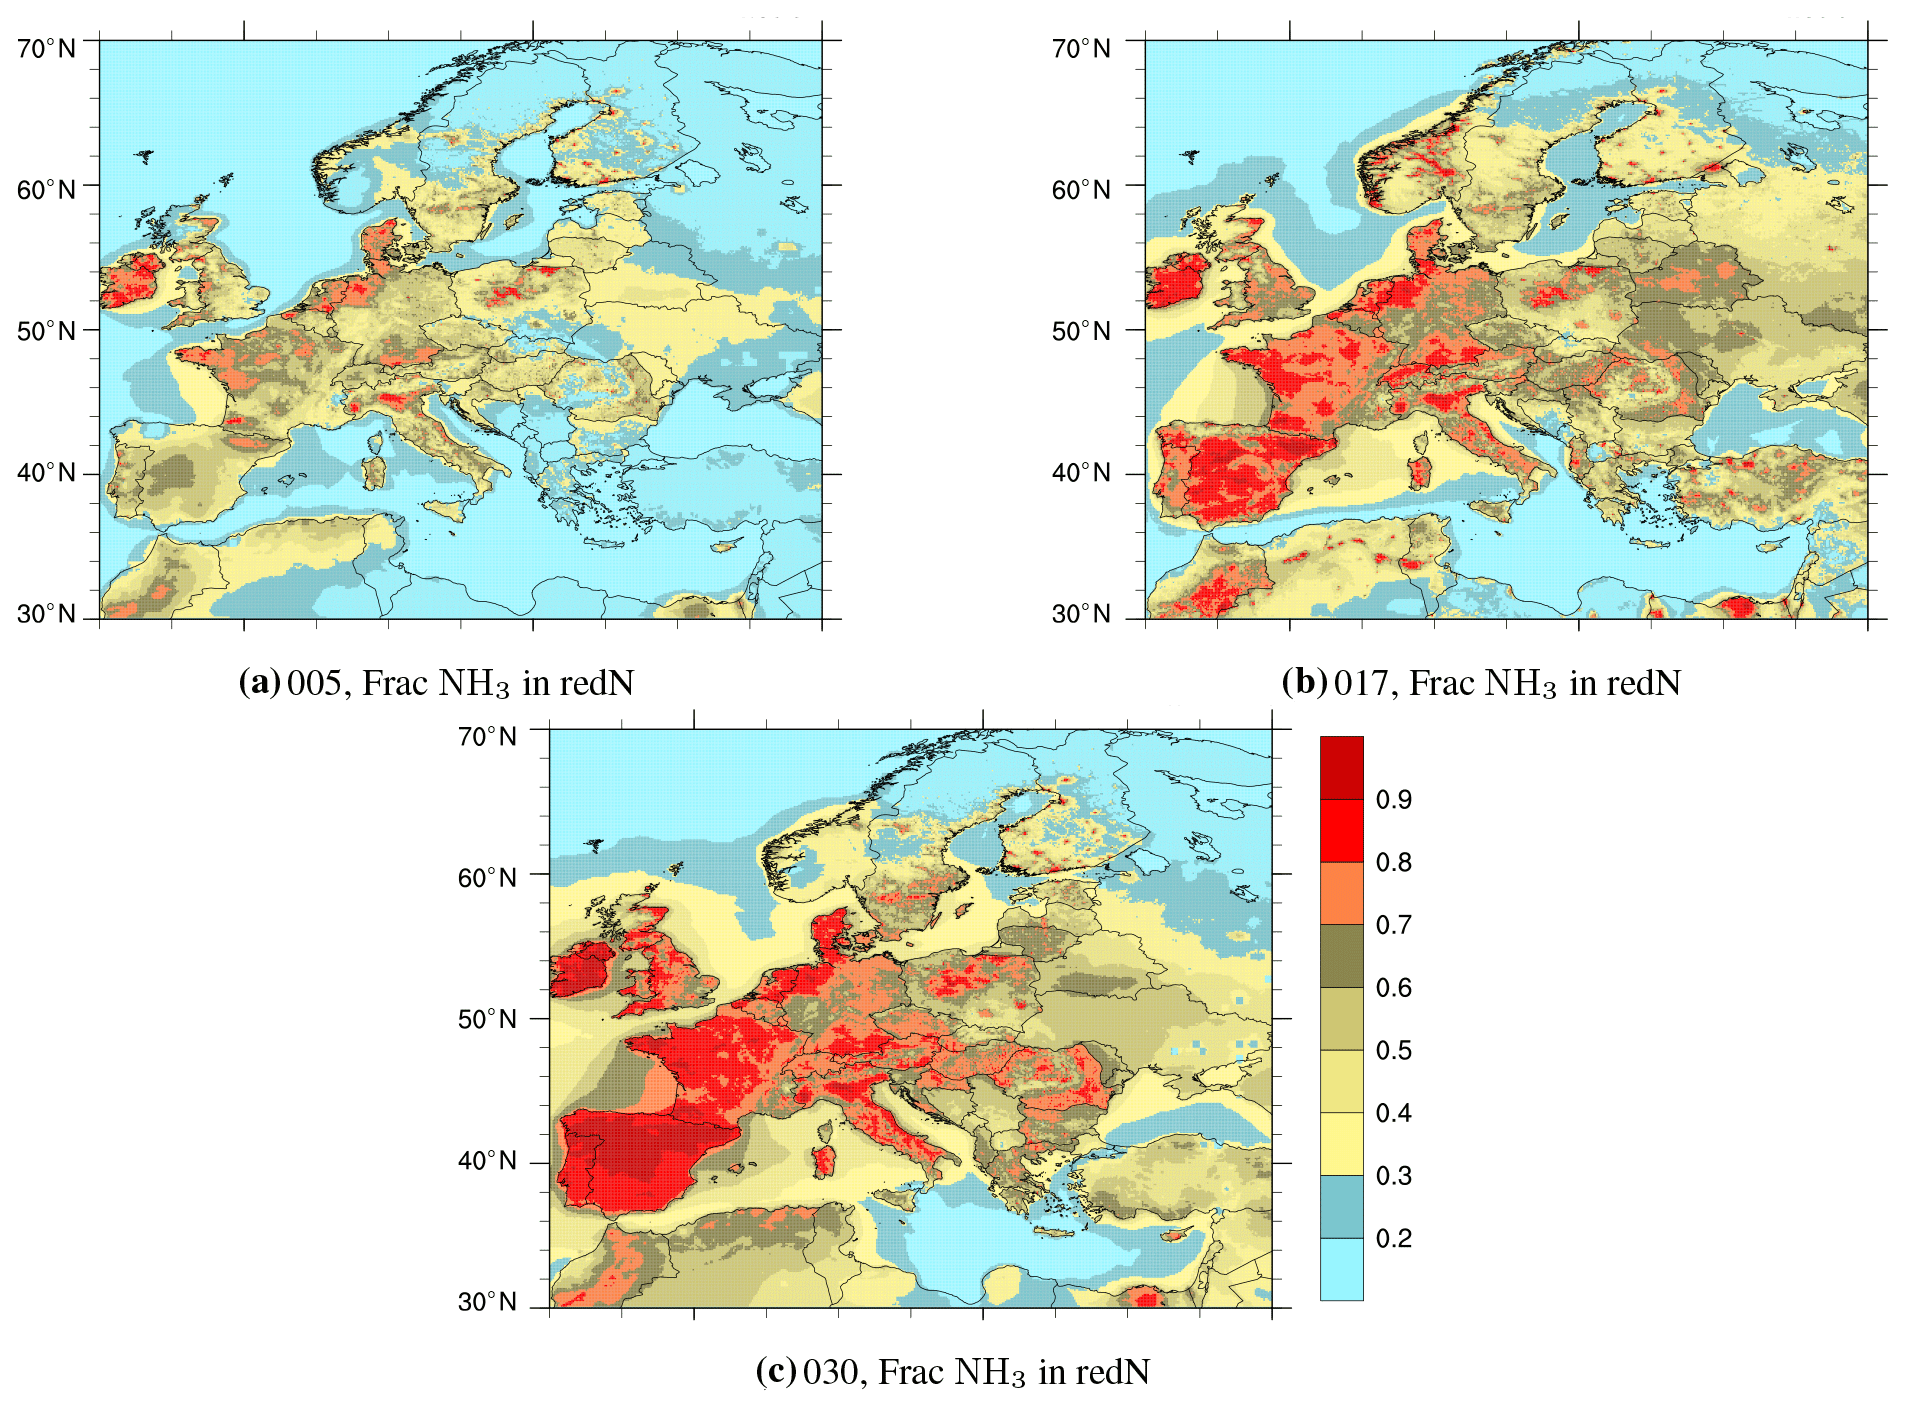
Figure 6Fraction of NH3 in reduced nitrogen () in 2005, 2017, and 2030.
Table 4First column listing annual and seasonal concentrations of PM2.5 as an average for the EU28 countries. Columns 2–5 list the EU28 average reductions calculated in steps of 10 % reductions in NH3 emissions. For PM2.5 the reductions in ng N m−3 per gigagram of reduction of NH3 emissions are shown in brackets. The corresponding effects of 10 and 20 % reductions of NH3 emissions in 2005 are also shown. The effects of 10 % reductions of SOx and NOx emissions in 2030 are also listed. The reductions in PM2.5 in ng N m−3 per gigagram emitted are given in brackets with NH3 counted as NH3 with molecular weight 17, NOx counted as NO2 with molecular weight 46, and SOx counted as SO2 with molecular weight 64.

4.3 Effects of NH3 emission controls
Figure 2c and d show the effects of further 10 % reductions of NH3 emissions on PM2.5 concentrations in 2005 and 2030 respectively. Compared to 2005, the absolute effects of 10 % further emission reductions in 2030 are smaller. Partially, this is because the percentage emission reductions in 2005 give a larger reduction in absolute numbers compared to percentage emission reductions based on the lower 2030 emissions. As an example, 10 % of the emissions from the EU in 2005 (3574 Gg) will give a smaller reduction than 10 % reductions in 2030 (2900 Gg). However, these absolute changes in NH3 emissions are not large enough to explain a decrease in the magnitude seen in Fig. 2c versus 2d. As seen in Fig. 6, there is more free NH3, shown as NH3 over total reduced nitrogen, in 2030 relative to 2005. A larger portion of free NH3 could partially explain the 2 %–4 % annual increase in NH3 observed by satellites between 2008 and 2018 in countries like Belgium, the Netherlands, France, Germany, Poland, Italy, and Spain (Damme et al., 2020). A 10 % reduction in NH3 emissions will gradually a make smaller impact on the formation of in future years. This is exemplified by the EU28 countries in Table 4. For 2005, we find that as an annual average 10 % reductions of NH3 emissions were about 4 times more efficient than 10 % reductions in NOx and almost twice as efficient as SOx in reducing PM2.5 per gigagram emitted. For 2030, we find that as an annual average the efficiency of mitigating PM2.5 concentrations by reducing NH3 emissions by 10 % has been reduced from 0.61 to 0.22 ng N m−3 per Gg NH3 emitted, a reduction of a factor of about 2.6 from 2005. Over the same time span, the efficiency of a further 10 % reduction in NOx emissions has gone up by about a factor of 1.8 (from 0.15 to 0.27) and by about a factor of 1.6 (0.37 to 0.58) for a 10 % further reduction in SOx emissions.
The dry deposition of NH3 is faster than that of . As the fraction of NH3 in total reduced nitrogen increases from 2005 to 2030 (as discussed in Sect. 4.1), reduced nitrogen may be deposited closer to its sources and potentially increasingly more in the same country as it is emitted. A trend in deposition versus emissions for the individual countries (deposition divided by emissions in Table 1) is not readily seen based on the model calculations. The geographical extent of the countries in Europe is relatively small, and there is considerable variability in the emission trends for NH3 between the individual EU28 countries, also affecting the trends in the depositions in neighbouring countries.
As a large portion of the emitted reduced nitrogen is deposited close to its sources, changes in emissions close to the outer EU28 geographical borders should affect this fraction more for EU28 as a whole than emission changes in central parts. NH3 emissions in large EU28 countries such as Germany and France have increased between 2005 and 2017, whereas emissions in several countries close to the eastern and southeastern geographical EU28 borders, such as Bulgaria, Romania, and Greece, have decreased. For the EU28 countries as a whole the fraction of deposited over emitted reduced nitrogen is between 0.7 and 0.8 for all three years considered (2005, 2017, and 2030). It would be possible to investigate the hypothesis of a possible decrease in the transport distance of reduced nitrogen by looking at so-called source receptor matrices for the different years (e.g. studying how the contribution from the country to itself have changed over the years). Such experiments are planned as a follow-up of this paper.
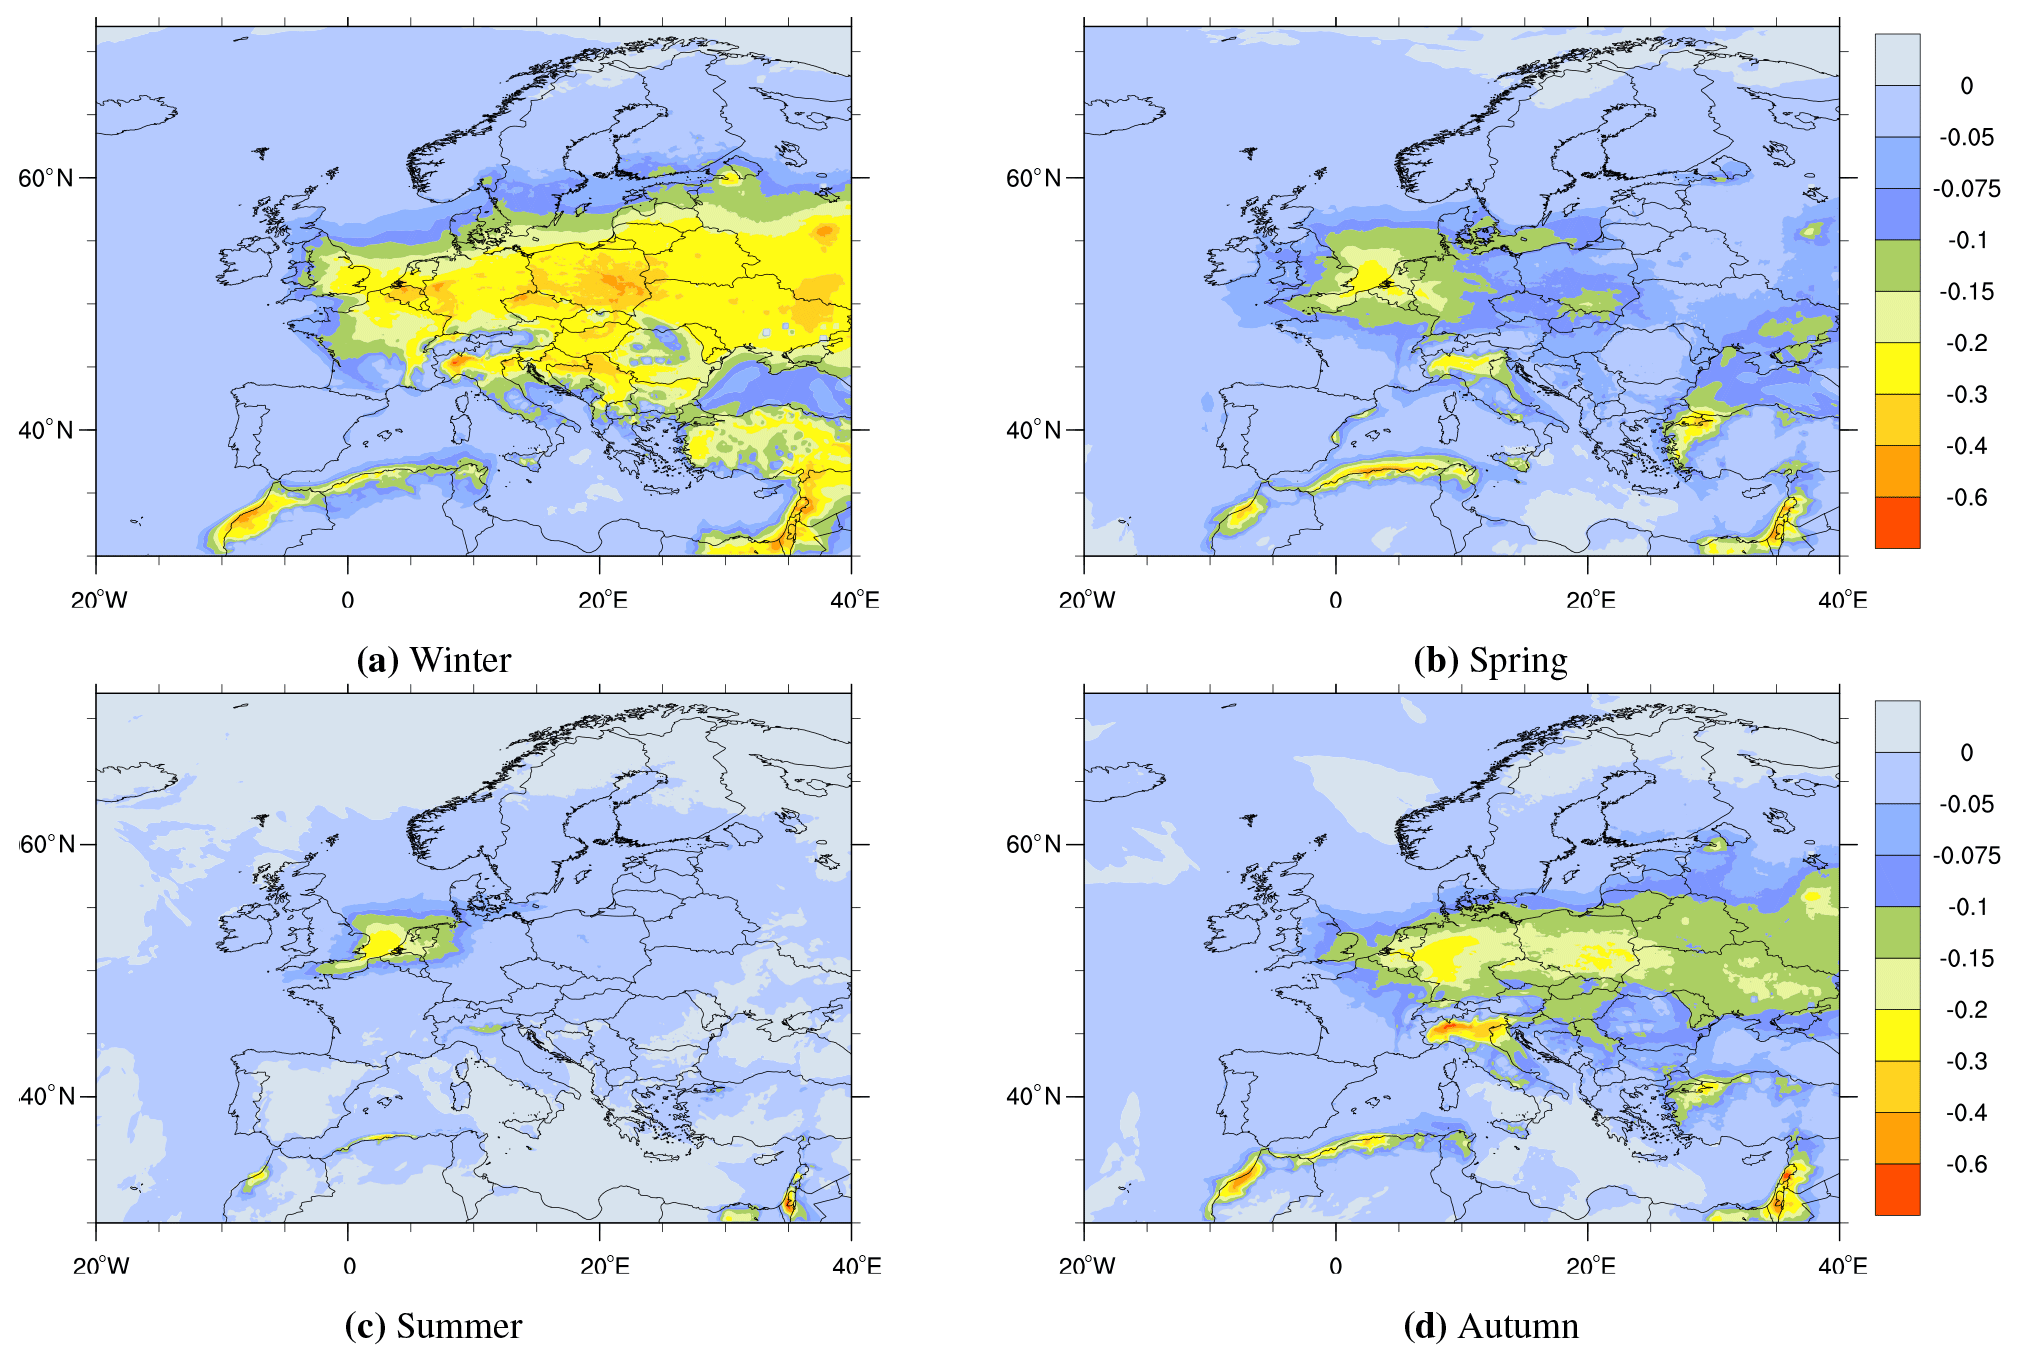
Figure 7Effects of a 10 % decrease in 2030 NH3 emissions on PM2.5 (µg m−3) split by season. Winter: December, January, and February. Spring: March, April, and May. Summer: June, July, and August. Autumn: September, October, and November.
4.3.1 Seasonal effects of NH3 emission reductions on PM2.5
More than 90 % of the NH3 emissions are from agriculture (IIASA, 2020), with low emissions in winter and a maximum in spring, as opposed to both NOx and SOx emissions peaking in winter. As a result, there is more and HNO3 relative to NH3 in winter than in other seasons. Also, the condensation process forming NH4NO3 aerosols is favoured by low temperatures. As a result Fig. 7 shows that for PM2.5 by far the largest effects of further reductions of NH3 emissions are modelled for the winter months. Notably, most of PM2.5 pollution episodes, including exceedances of the EU limits or WHO AQ guidelines for daily mean PM2.5 concentrations, are most frequent in large parts of Europe during the winter period (see Tsyro et al., 2019). The smallest effects are calculated for the summer months, when both SOx and NOx emissions are at a minimum. Thus in summer, reductions are mainly confined to the southwestern parts of the North Sea, where ship emissions of NOx are large. This seasonal behaviour is also seen in the measurements at Preila in Lithuania, with low concentrations in summer and higher concentrations in the cold season (Davuliene et al., 2021). Furthermore, they found that the relative abundance of NH4NO3 has increased at the expense of (NH4)2SO4 as a result of particularly large reductions in SOx emissions in the last decades.
The seasonal behaviour of PM2.5 formation from NH3 is also demonstrated for EU28 in Table 4, showing that the PM2.5 reductions that can be achieved by reducing NH3 emissions are largest in winter and are almost constant (and low) for each 10 % increment in emission reduction in summer. With a large surplus of free NH3 in summer, the impact of further emission reductions is small. In winter the NH3 surplus relative to HNO3 and is much smaller (or nonexistent), and additional NH3 emission reductions will have larger impacts on PM2.5 levels.
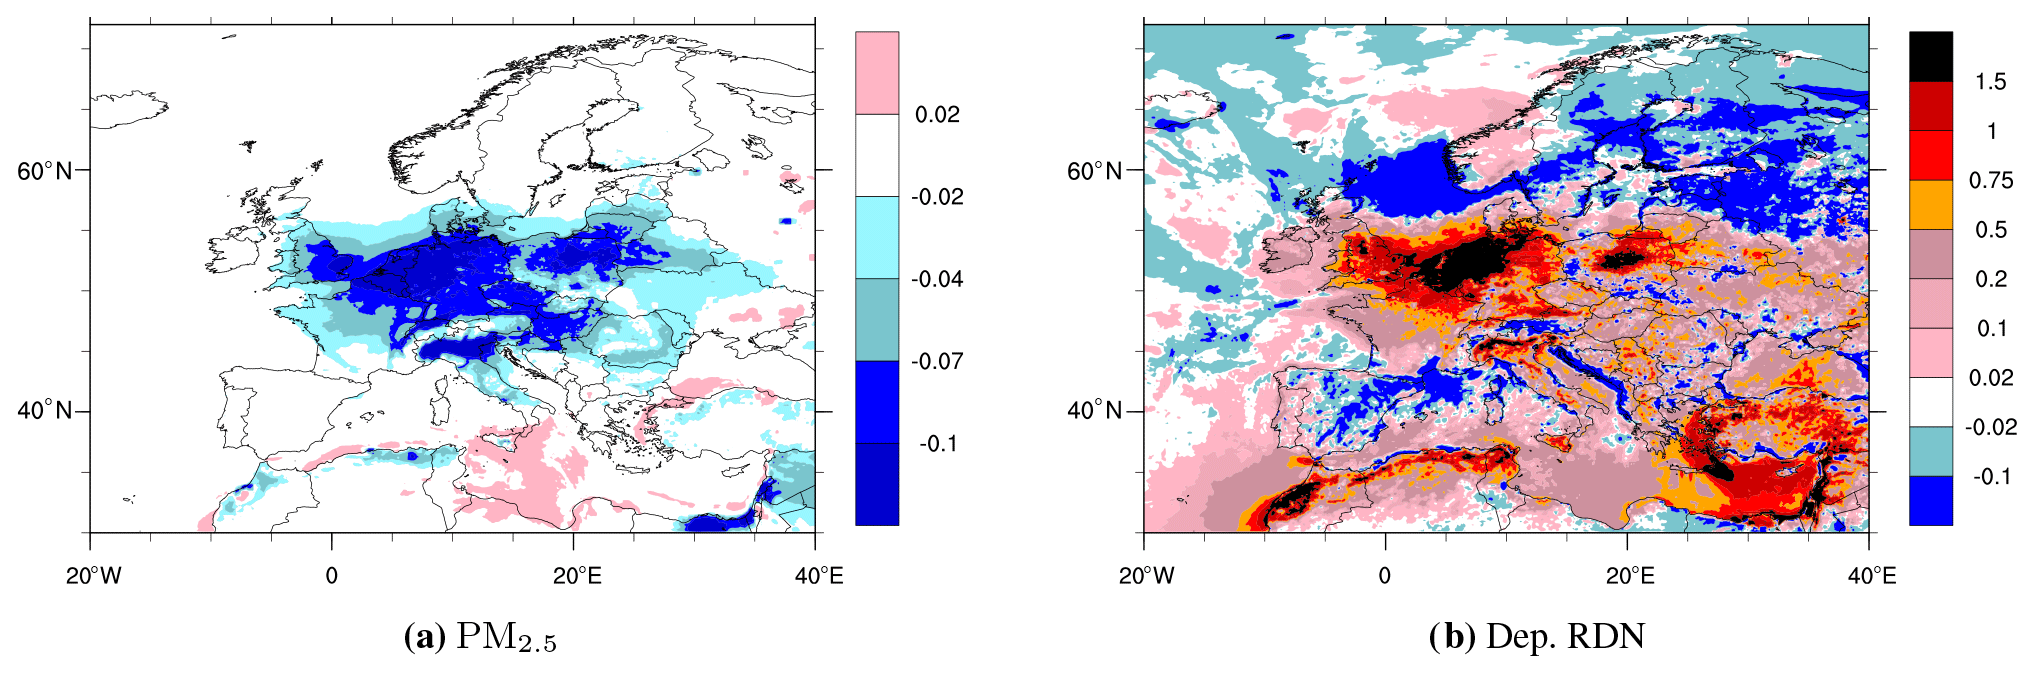
Figure 8Difference between additional 50 %–40 % reduction and additional Base–10 % in NH3 emissions on top of NEC 2030 for PM2.5 concentrations (µg m−3) (a) and deposition of reduced nitrogen (mg N m−2) (b).
4.3.2 Sensitivity tests with additional emission controls
Figure 8 compares the efficiency of NH3 emissions reductions on top of the NEC2030 requirements for PM2.5 concentrations and reduced nitrogen depositions. Starting from the expected emission levels in 2030, the maps compare the effects of the first 10 % reductions (Base–10 %) in NH3 emissions to the effects of further reductions in NH3 emissions from 40 %–50 % relative to Base. If linear, the effects of these 10 % increments in emissions should be equal. However, as shown in Fig. 8a, the reductions in PM2.5 are larger for the 50 %–40 % emission reductions compared to Base–10 % reductions almost everywhere. This is further demonstrated in Table 4, listing the reductions in annual and seasonal PM2.5 concentrations as an average over the EU28 countries in steps of 10 % relative to the 2030 NEC emissions. Both as an annual average and for each season, the reductions in PM2.5 increase for each 10 % increment. The reductions in PM2.5 increase from 0.23 ng m−3 per gigagram of NH3 emitted for the first 10 % additional reductions to 0.35 ng m−3 per gigagram emitted for the 50 %–40 % reductions. The increase in efficiency is a result of a shift in the ratio in NH3 versus SOx and NOx emissions. In Table 4 we also show that with the much higher SOx and NOx emissions versus NH3 emissions, the potential of 10 % additional reductions in NH3 emissions in curbing PM2.5 levels was substantially higher in 2005, even when compared to 40 %–50 % reductions in 2030.
In two additional model runs we separately reduce the 2030 emissions of SOx and NOx by 10 %. As an annual average we find that 10 % reductions in both SOx and NOx emissions will lead to larger reductions in PM2.5 levels in the EU28 than the corresponding 10 % reductions in NH3 emissions. However, as discussed in Sect. 4.3.1, the seasonal variation is large, and in winter reductions of PM2.5 per gigagram emitted could still be larger for NH3 than for NOx.
For depositions of reduced nitrogen the situation is reversed. As shown in Fig. 8b the reductions in depositions achieved with NH3 reduced between 50 % and 40 % compared to the first 10 % reductions are (marginally) smaller in the vicinity of the source regions. This can be explained by a slightly larger portion of the emitted NH3 being converted to aerosols and having a slower dry deposition rate than NH3. As a result, the higher deposition seen in the source areas is compensated for by a much smaller but more widespread decrease elsewhere. As discussed in Sect. 4.2, only a small portion of the reduced nitrogen is advected out of the central parts of the model domain.
Focusing on the effects of NH3 emissions, we have investigated how PM2.5 concentrations and depositions of reduced nitrogen will change from 2005 to 2030, assuming that the NEC2030 emission targets will be met. In addition, we have made a sensitivity study for PM2.5 for post NEC2030, assuming additional emission reductions on top of the NEC2030 requirements.
Emissions of SOx and NOx have decreased in Europe from the year 2005 to present, and further emissions reductions are expected by the year 2030. However, NH3 emissions have so far remained high, and projected NEC2030 emission reductions of NH3 are much smaller than for SOx and NOx. Our model calculations show that these differences in emission trends lead to a smaller fraction of the emitted NH3 being converted to and an increasingly larger portion of free NH3 versus in the atmosphere in Europe. Based on 10 % emission reductions of NH3, NOx, and SOx, we calculate that the potential for PM2.5 formation per gigagram of NH3 emitted is expected to drop by a factor of about 2.6 as an annual average between 2005 and 2030. Over the same time span the potential for forming PM2.5 from NOx per gigagram emitted has increased by a factor of 1.8 and from SOx by a factor of 1.6 per gigagram emitted.
In winter, with low NH3 emissions and relatively higher NOx and SOx emissions, the ratio of NH3 to HNO3 and is higher, and a larger portion of the emitted NH3 will form particulate . Also, the formation of NH4NO3 in equilibrium with HNO3 and NH3 is favoured by low temperatures. As a result we find that in winter the effects of further reductions in NH3 emissions are larger than in other seasons and comparable to additional reductions in SOx and NOx emissions. This is in agreement with the findings in Backes et al. (2016), pointing out that even though the NH3 emissions are highest in spring and summer due to the application of manure on the fields, emission reductions in winter have a stronger impact on the formation of secondary aerosols than in any other season. Furthermore they stated that the potential of reducing NH3 emissions in winter is highest through the reduction of animal farming, as this source accounts for about 80 % of the NH3 emissions in the autumn and winter months.
Following the emission reductions of NH3, deposition of reduced nitrogen is decreasing in Europe. However, the reductions in NOx emissions are much larger than for NH3, resulting in a much faster decline in oxidised nitrogen deposition compared to reduced nitrogen. Thus the fraction of reduced over total deposition of nitrogen is increasing and is expected to reach more than 60 % in large parts of Europe by the year 2030. Our calculations show that with the existing emission projections the CL for nitrogen will also be exceeded in large parts of Europe in 2030. There are also indications that reduced nitrogen inputs are more effective in decreasing biodiversity than oxidised nitrogen, as reduced nitrogen is more readily available, stimulating growth of specific plants at the expense others (see van den Berg et al., 2008, and Erisman et al., 2007, and references therein). Furthermore they also suggest that increased levels of can be toxic to plants (see also Esteban et al., 2016).
Reducing, and preferably removing, these exceedances will require larger reduction in nitrogen emissions than currently projected. Given that reduced nitrogen is responsible for the major fraction of nitrogen depositions, the largest cuts should be made in the NH3 emissions.
As discussed in Nenes et al. (2020, 2021), gas–aerosol partitioning of total reduced and oxidised nitrogen is affected by aerosol pH level and water content, so that low (high) pH is favourable for () formation. The increase in the aerosol fraction in total reduced and oxidised nitrogen would lead to changes in their dry deposition and subsequently their residence times and transport distances. This effect has not been accounted for in the EMEP model. Thus some limited local effects might have been missed in our model simulations. For instance, based on the Nenes et al. (2021) results, there may be additional formation in areas with low acidity, such as coastal or dusty regions. Potentially this may reduce the deposition of total nitrate near these local sources, somewhat enhancing the accumulation of particles. Furthermore, as future emissions of SOx and NOx are expected to decrease, the pH of the particles is likely to increase, potentially favouring formation and thus decreasing dry deposition and increasing the transport distances of oxidised and thereby total nitrogen in some regions. On the other hand, our results show that overall, the fraction of reduced nitrogen in the total nitrogen has been increasing, and this increase is expected to continue until 2030. Assuming that the deposition rates for total nitrogen are mostly driven by those of reduced nitrogen (following Nenes et al., 2021), the local effects of formation bursts would probably not play a major role across the regions in different present and future chemical regimes. Therefore we believe that overall the main conclusions presented in our paper remain valid.
For many countries the latest source-oriented legislation may potentially reduce the emissions of SOx and NOx below their emission reduction requirements, and as a result the EU28 as a whole could be on track to overshoot the reduction requirements for these species by 2030. But for NH3 further efforts are needed in order to meet the 2030 commitments for many countries in Europe (IIASA, 2018). Cost-effective measures to further reduce NH3 emissions differ among various parts of Europe. According to IIASA (2020) the damage cost estimate of EUR 17.50 per kilogram of NH3 emitted is much higher than the average abatement costs. Also, Giannakis et al. (2019) find that much more ambitious commitments for NH3 emission reductions could be applied by EU28 countries with relatively minimal costs. According to Giannakis et al. (2019), low-emission animal housing would be the least cost-effective measure, but still a quarter of the costs of the avoided damage. However, this measure could be the most effective one to reduce emissions in winter, when PM2.5 health-related limits are the most likely to be exceeded in Europe.
In this appendix we show scatter plots of EMEP model results versus measurements for some key species for the years 2005 and 2017. Several of the 2017 scatter plots have already been published in Gauss et al. (2019) but are shown here in order to provide a direct comparison to the year 2005 results. For the year 2017 the comparison to measurements differs slightly from the results shown in Gauss et al. (2019) as several new measurements have been made available since the publication of the above-mentioned report. For both years the scatter plots are shown with all measurements included. However, the selection of available measurements differs between the two years. In general there are more measurements available in 2017 compared to 2005. In Table A1 statistics for the scatter plots are listed for the same species as in the scatter plots, limiting the sites to those having measurements for both 2005 and 2017. The number of common measurements for both years is given in the table. In particular for NH3 in air and HNO3 in air there are very few sites with measurements for both years.
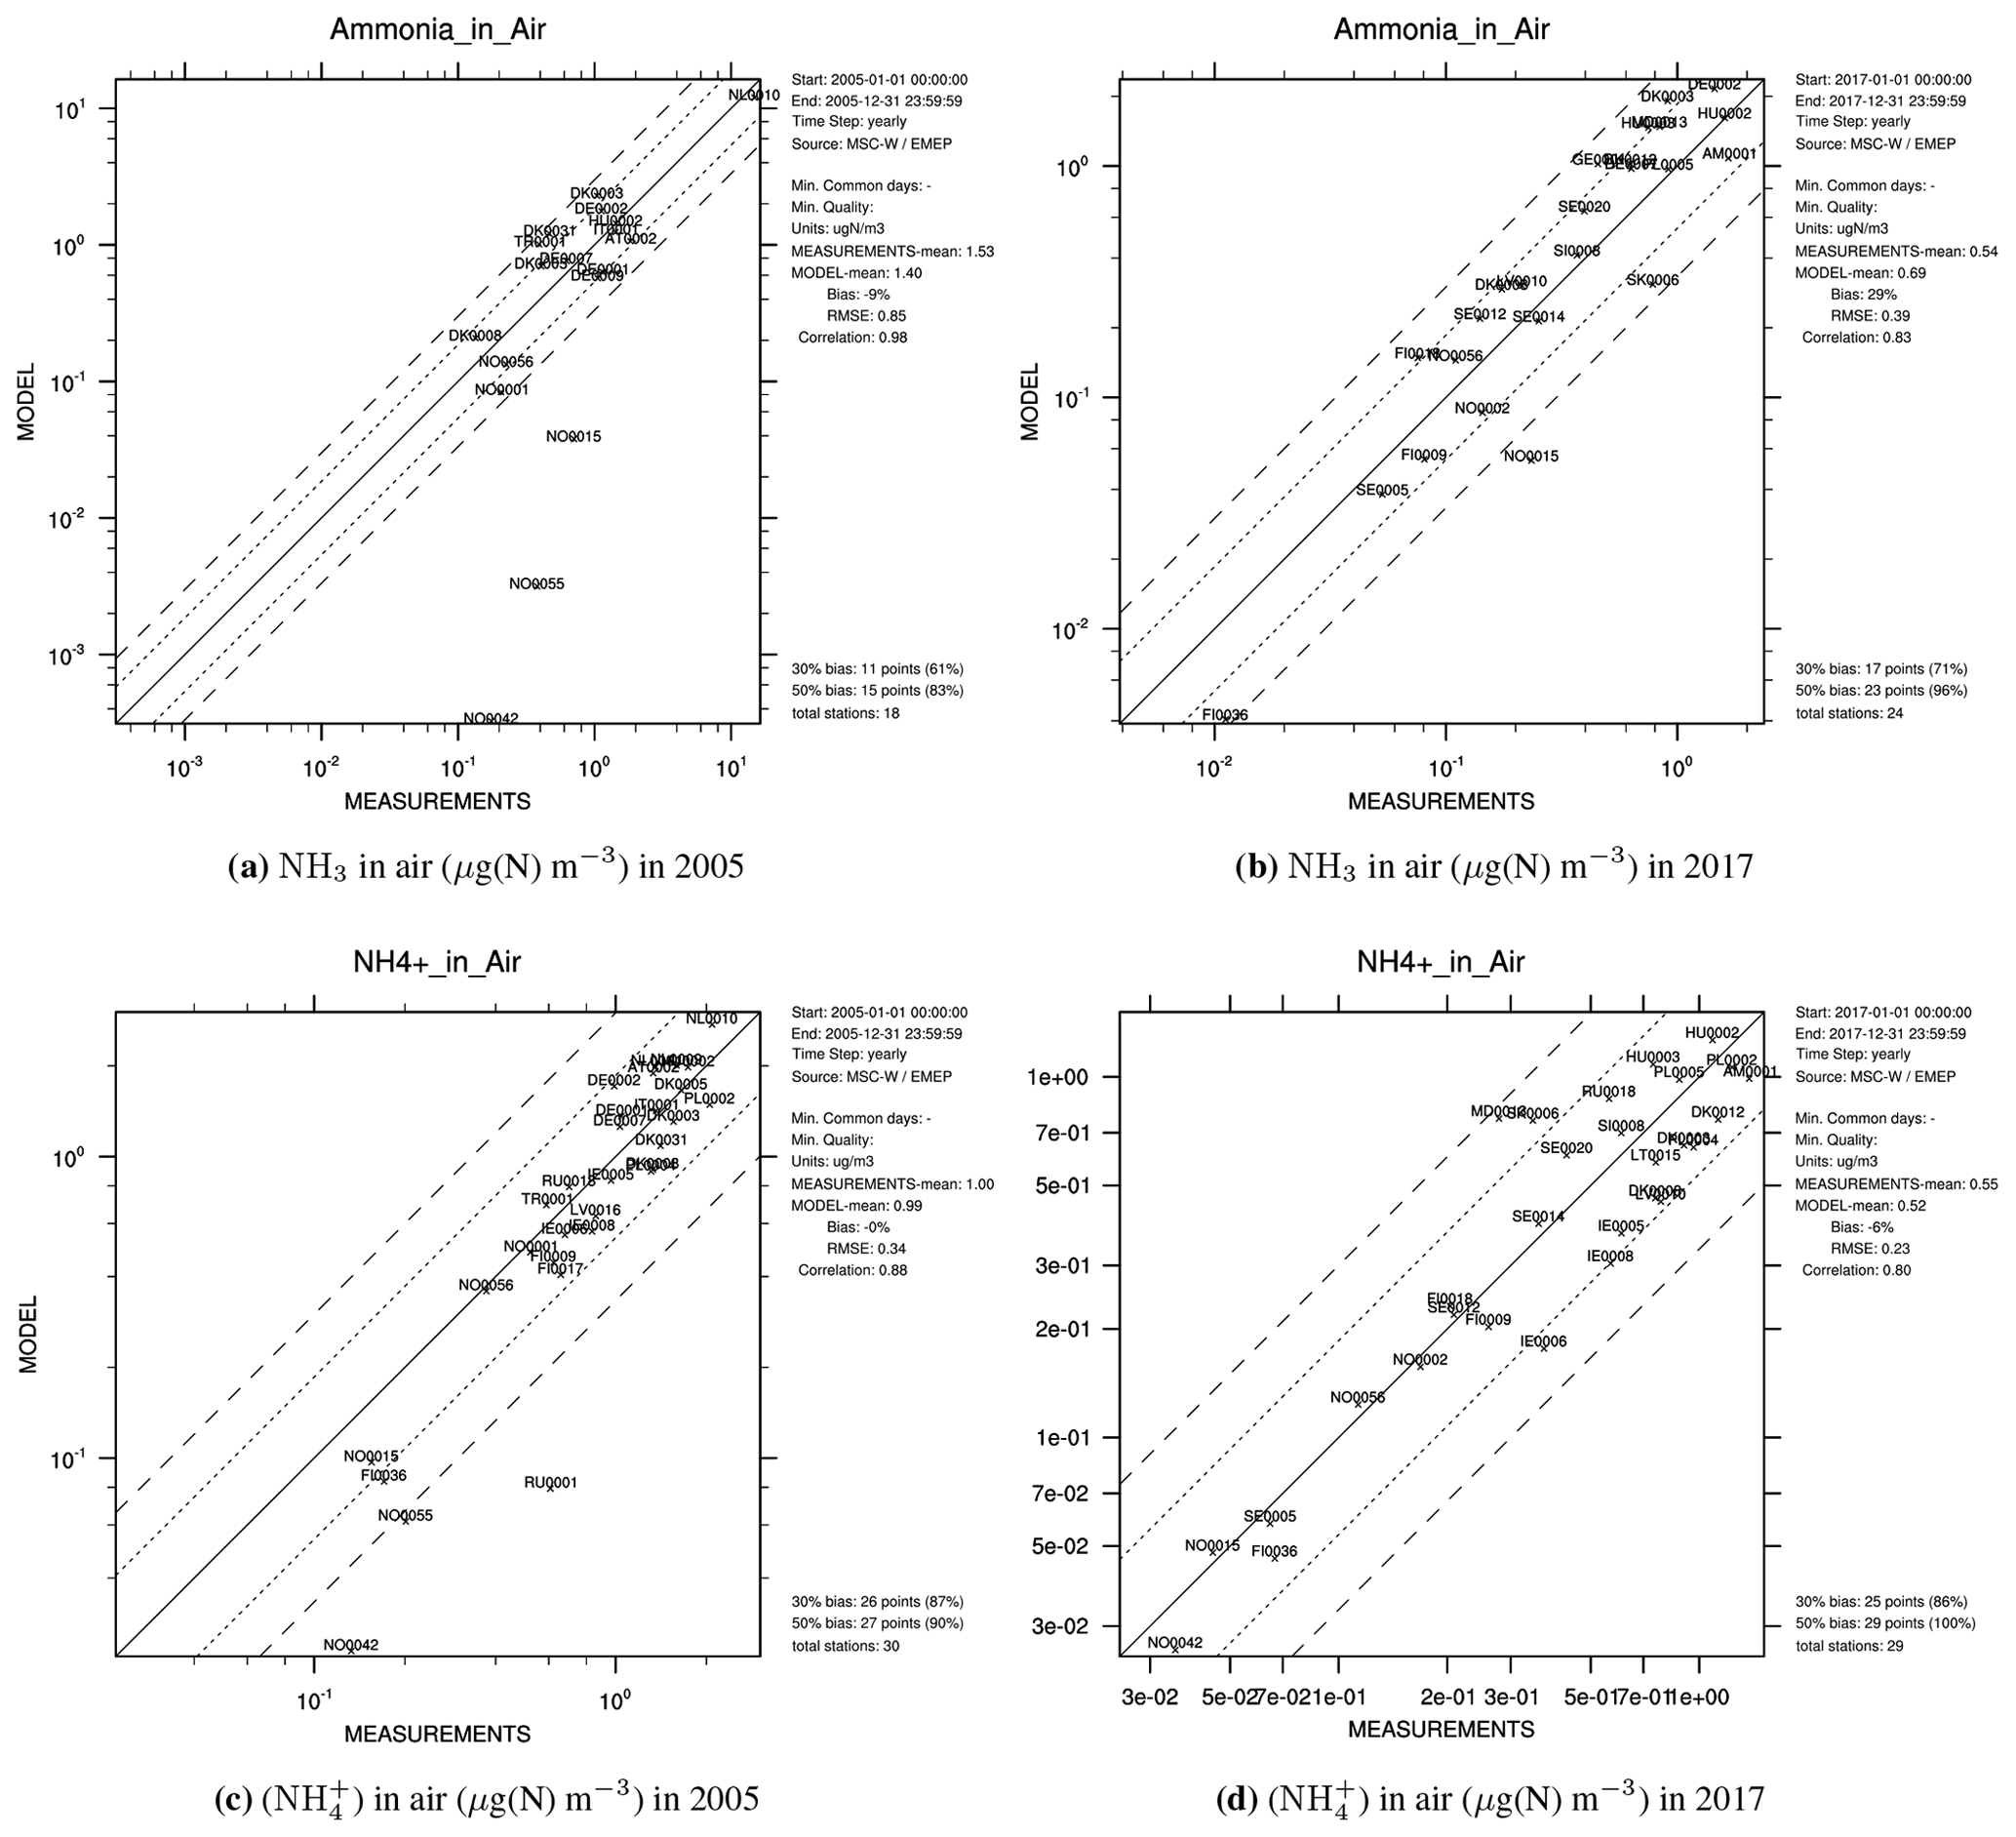
Figure A1Scatter plots of modelled versus observed concentrations of NH3 (a, b) and ammonium (c, d) in air for the years 2005 (a, c) and 2017 (b, d). Statistics with a limited set of common measurement sites are given in Table A1. Site positions are listed in Table A2. Measurements were downloaded from http://ebas.nilu.no (last access: 14 December 2021).
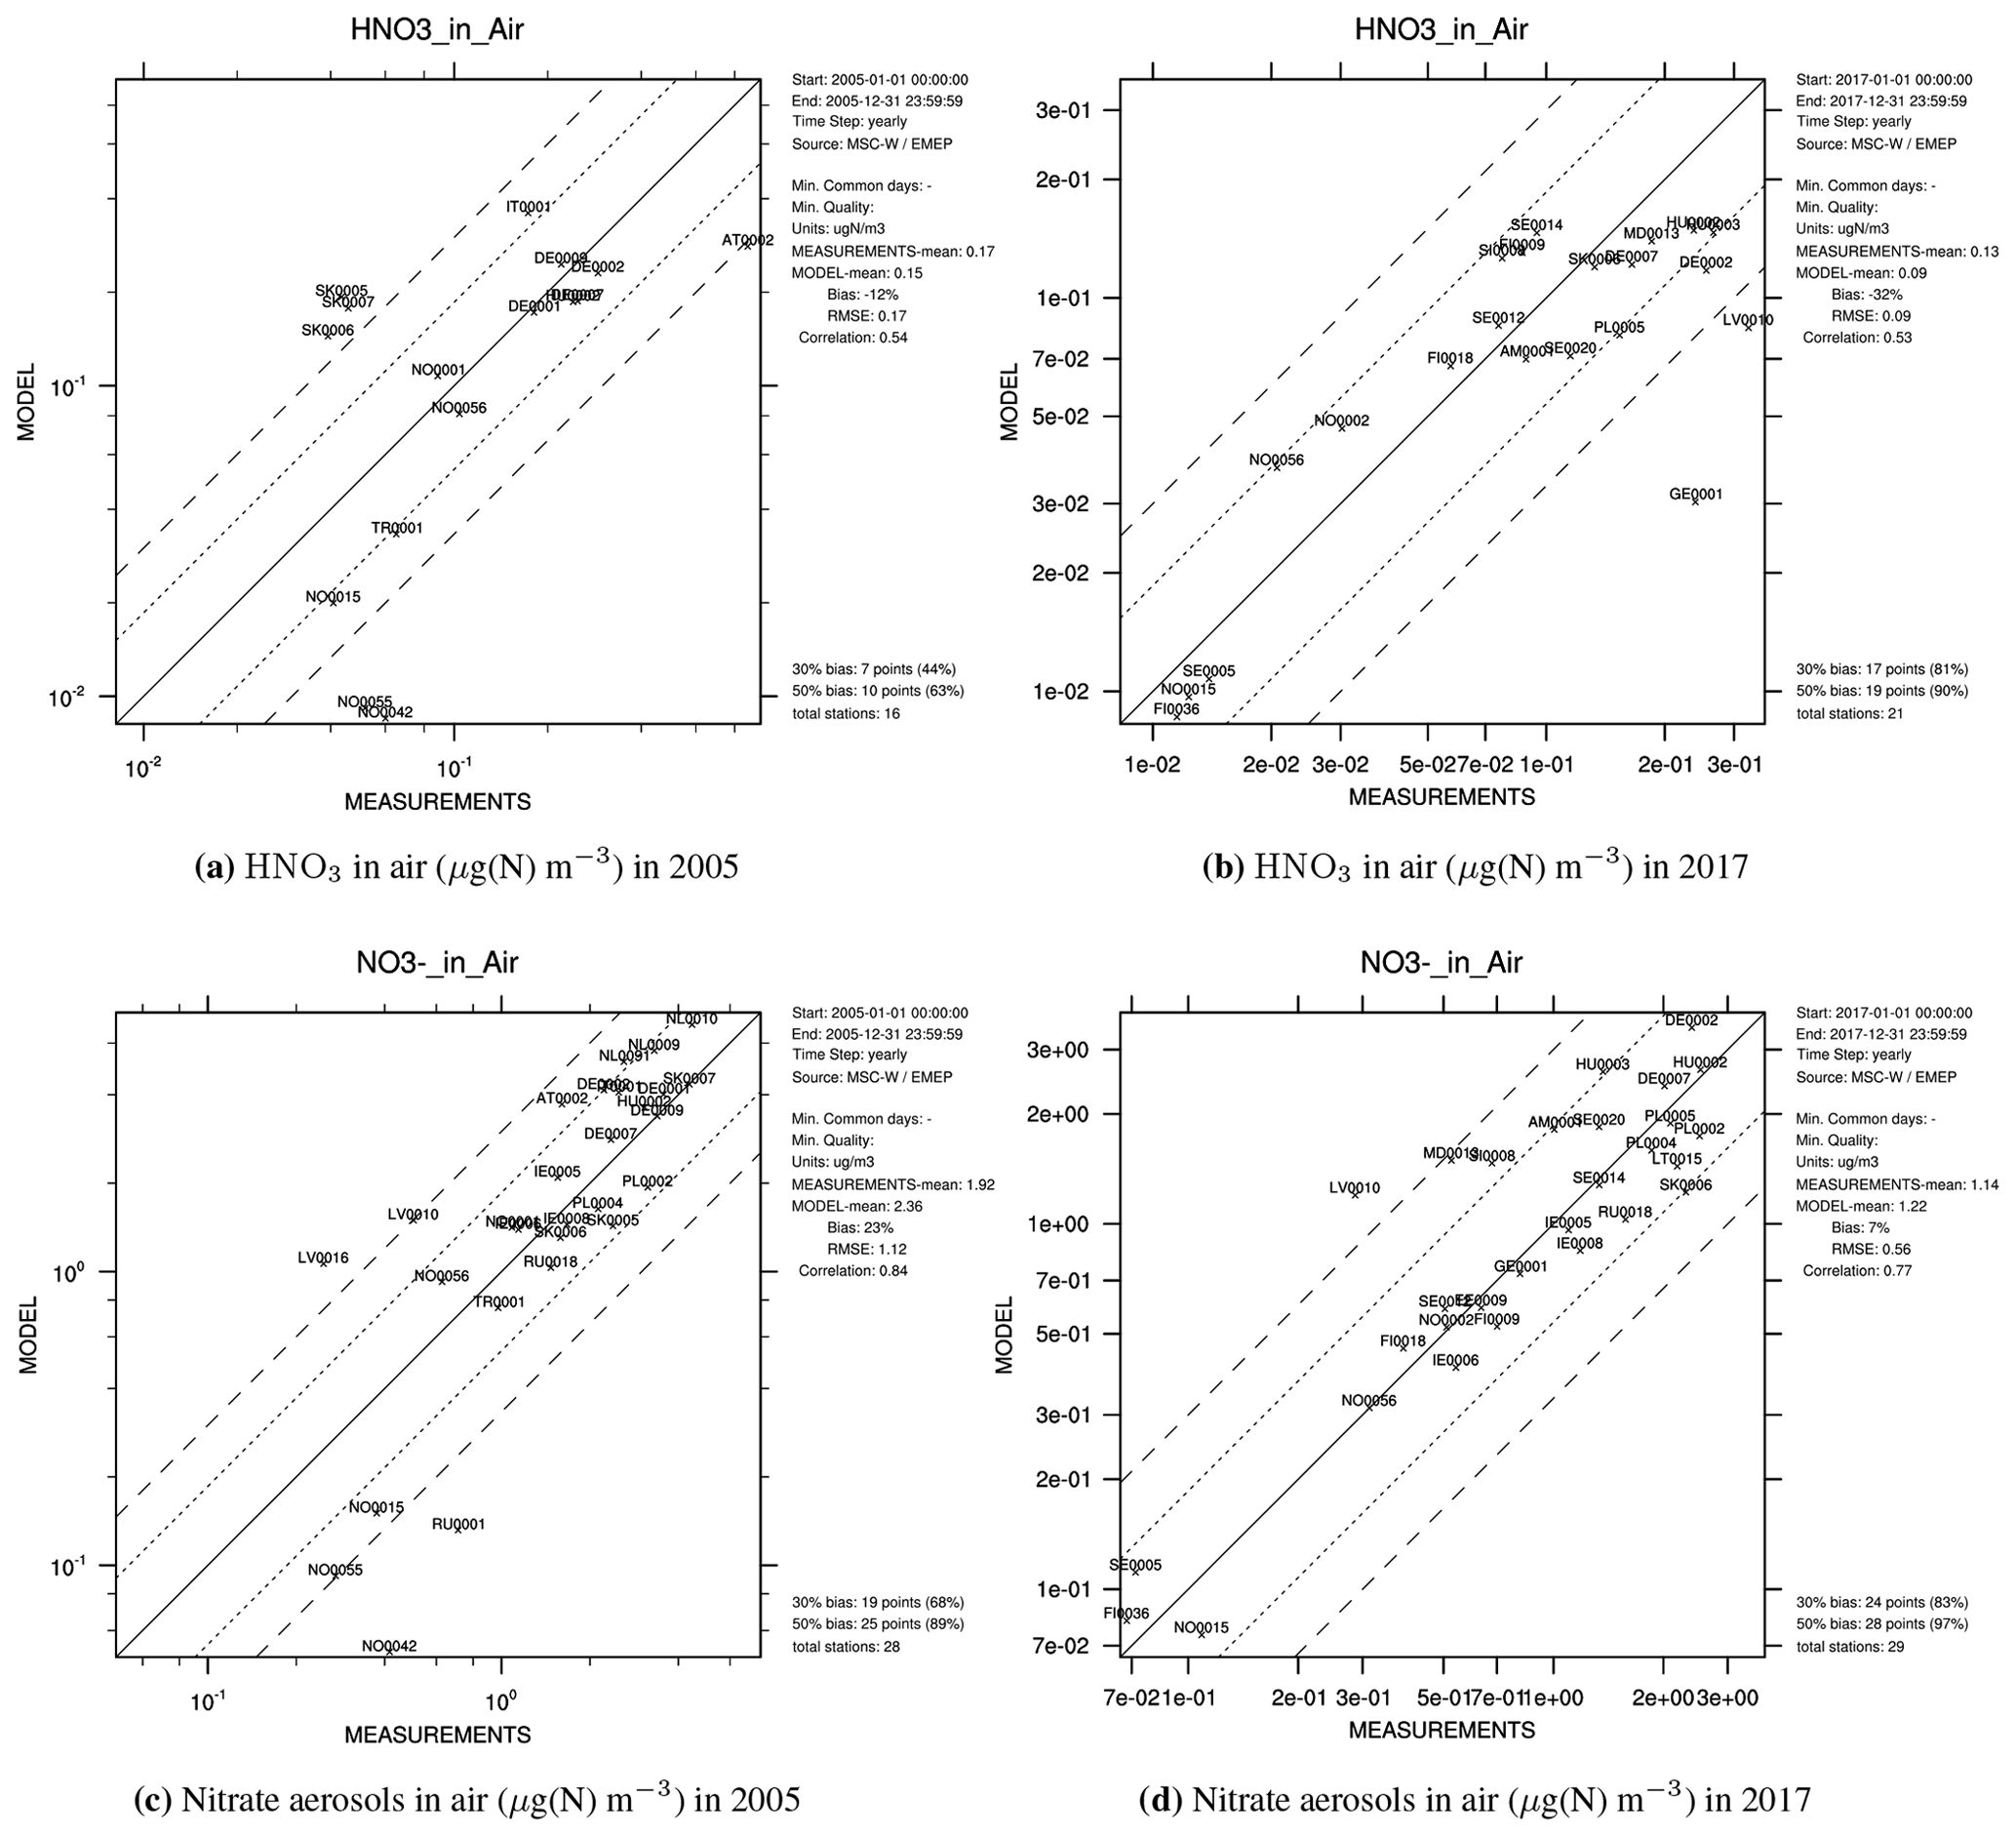
Figure A2Scatter plots of modelled versus observed concentrations of nitric acid (a, b) and nitrate (c, d) in air for the years 2005 (a, c) and 2017 (b, d). Statistics with a limited set of common measurement sites are given in Table A1. Site positions are listed in Table A2. Measurements were downloaded from http://ebas.nilu.no (last access: 14 December 2021).
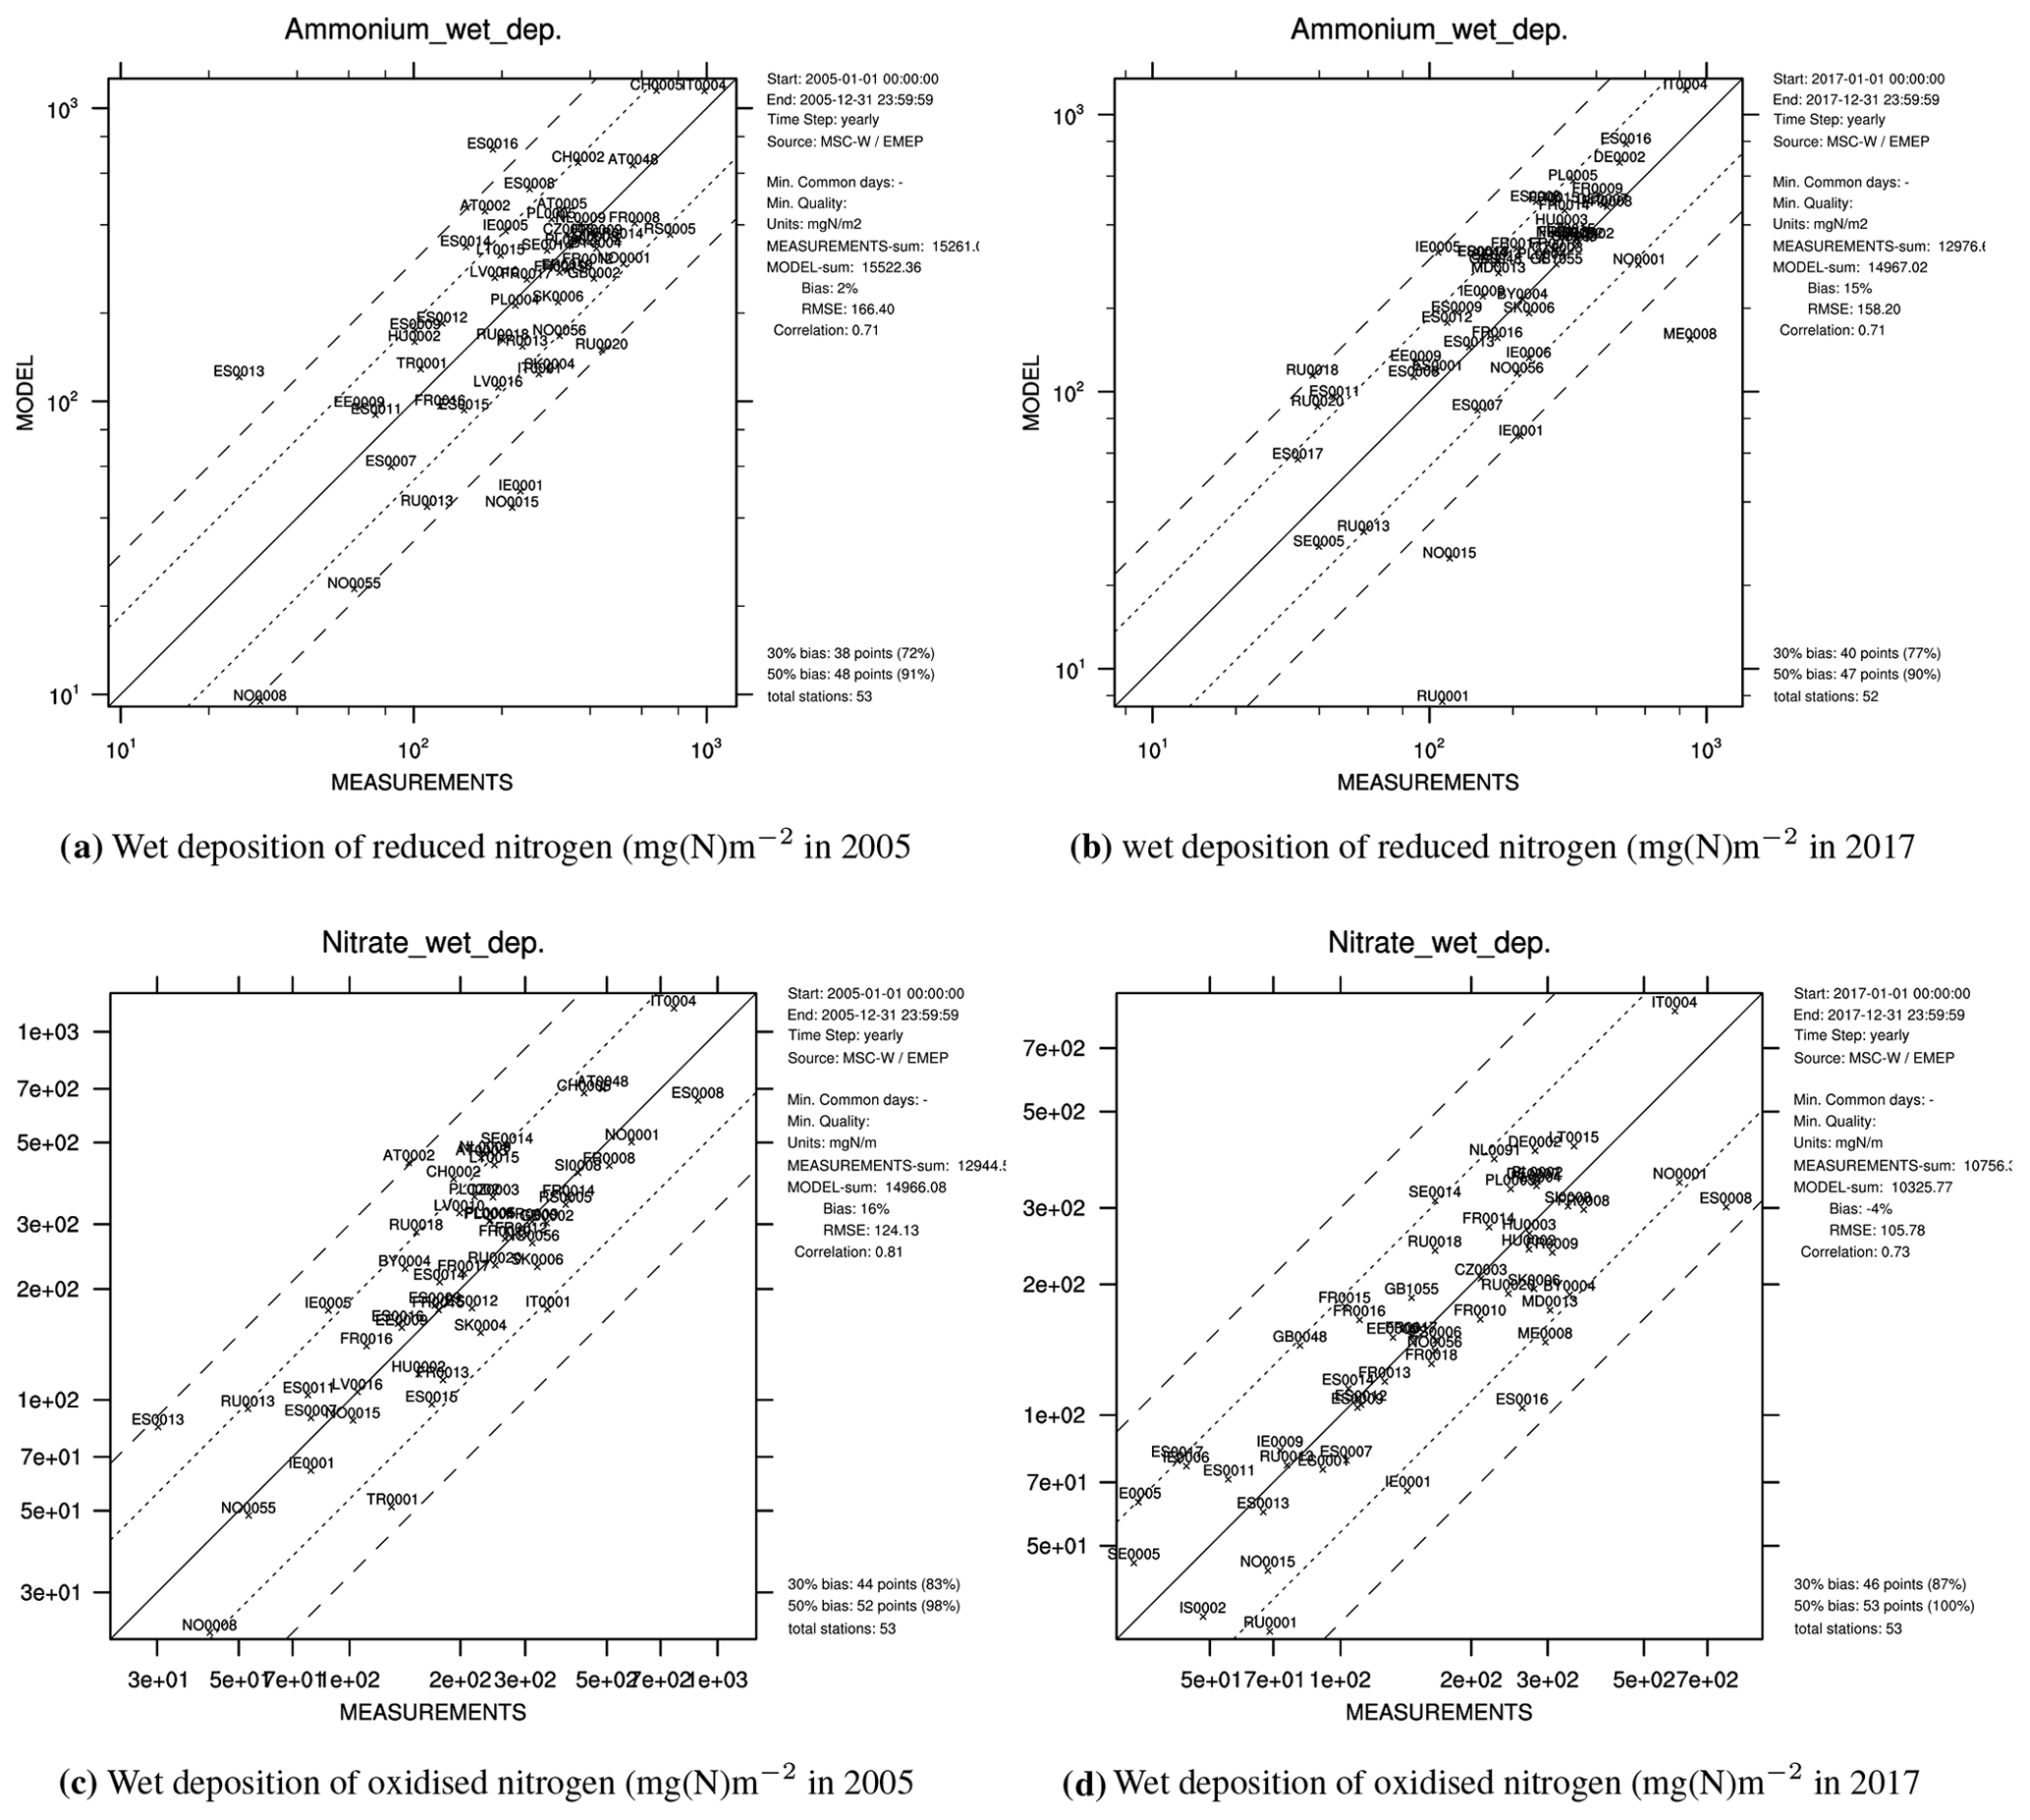
Figure A3Scatter plots of modelled versus observed wet depositions of reduced nitrogen (a, b) and oxidised nitrogen (c, d) for the years 2005 (a, c) and 2017 (b, d). Statistics with a limited set of common measurement sites are given in Table A1. Site positions are listed in Table A2. Measurements were downloaded from http://ebas.nilu.no (last access: 14 December 2021).
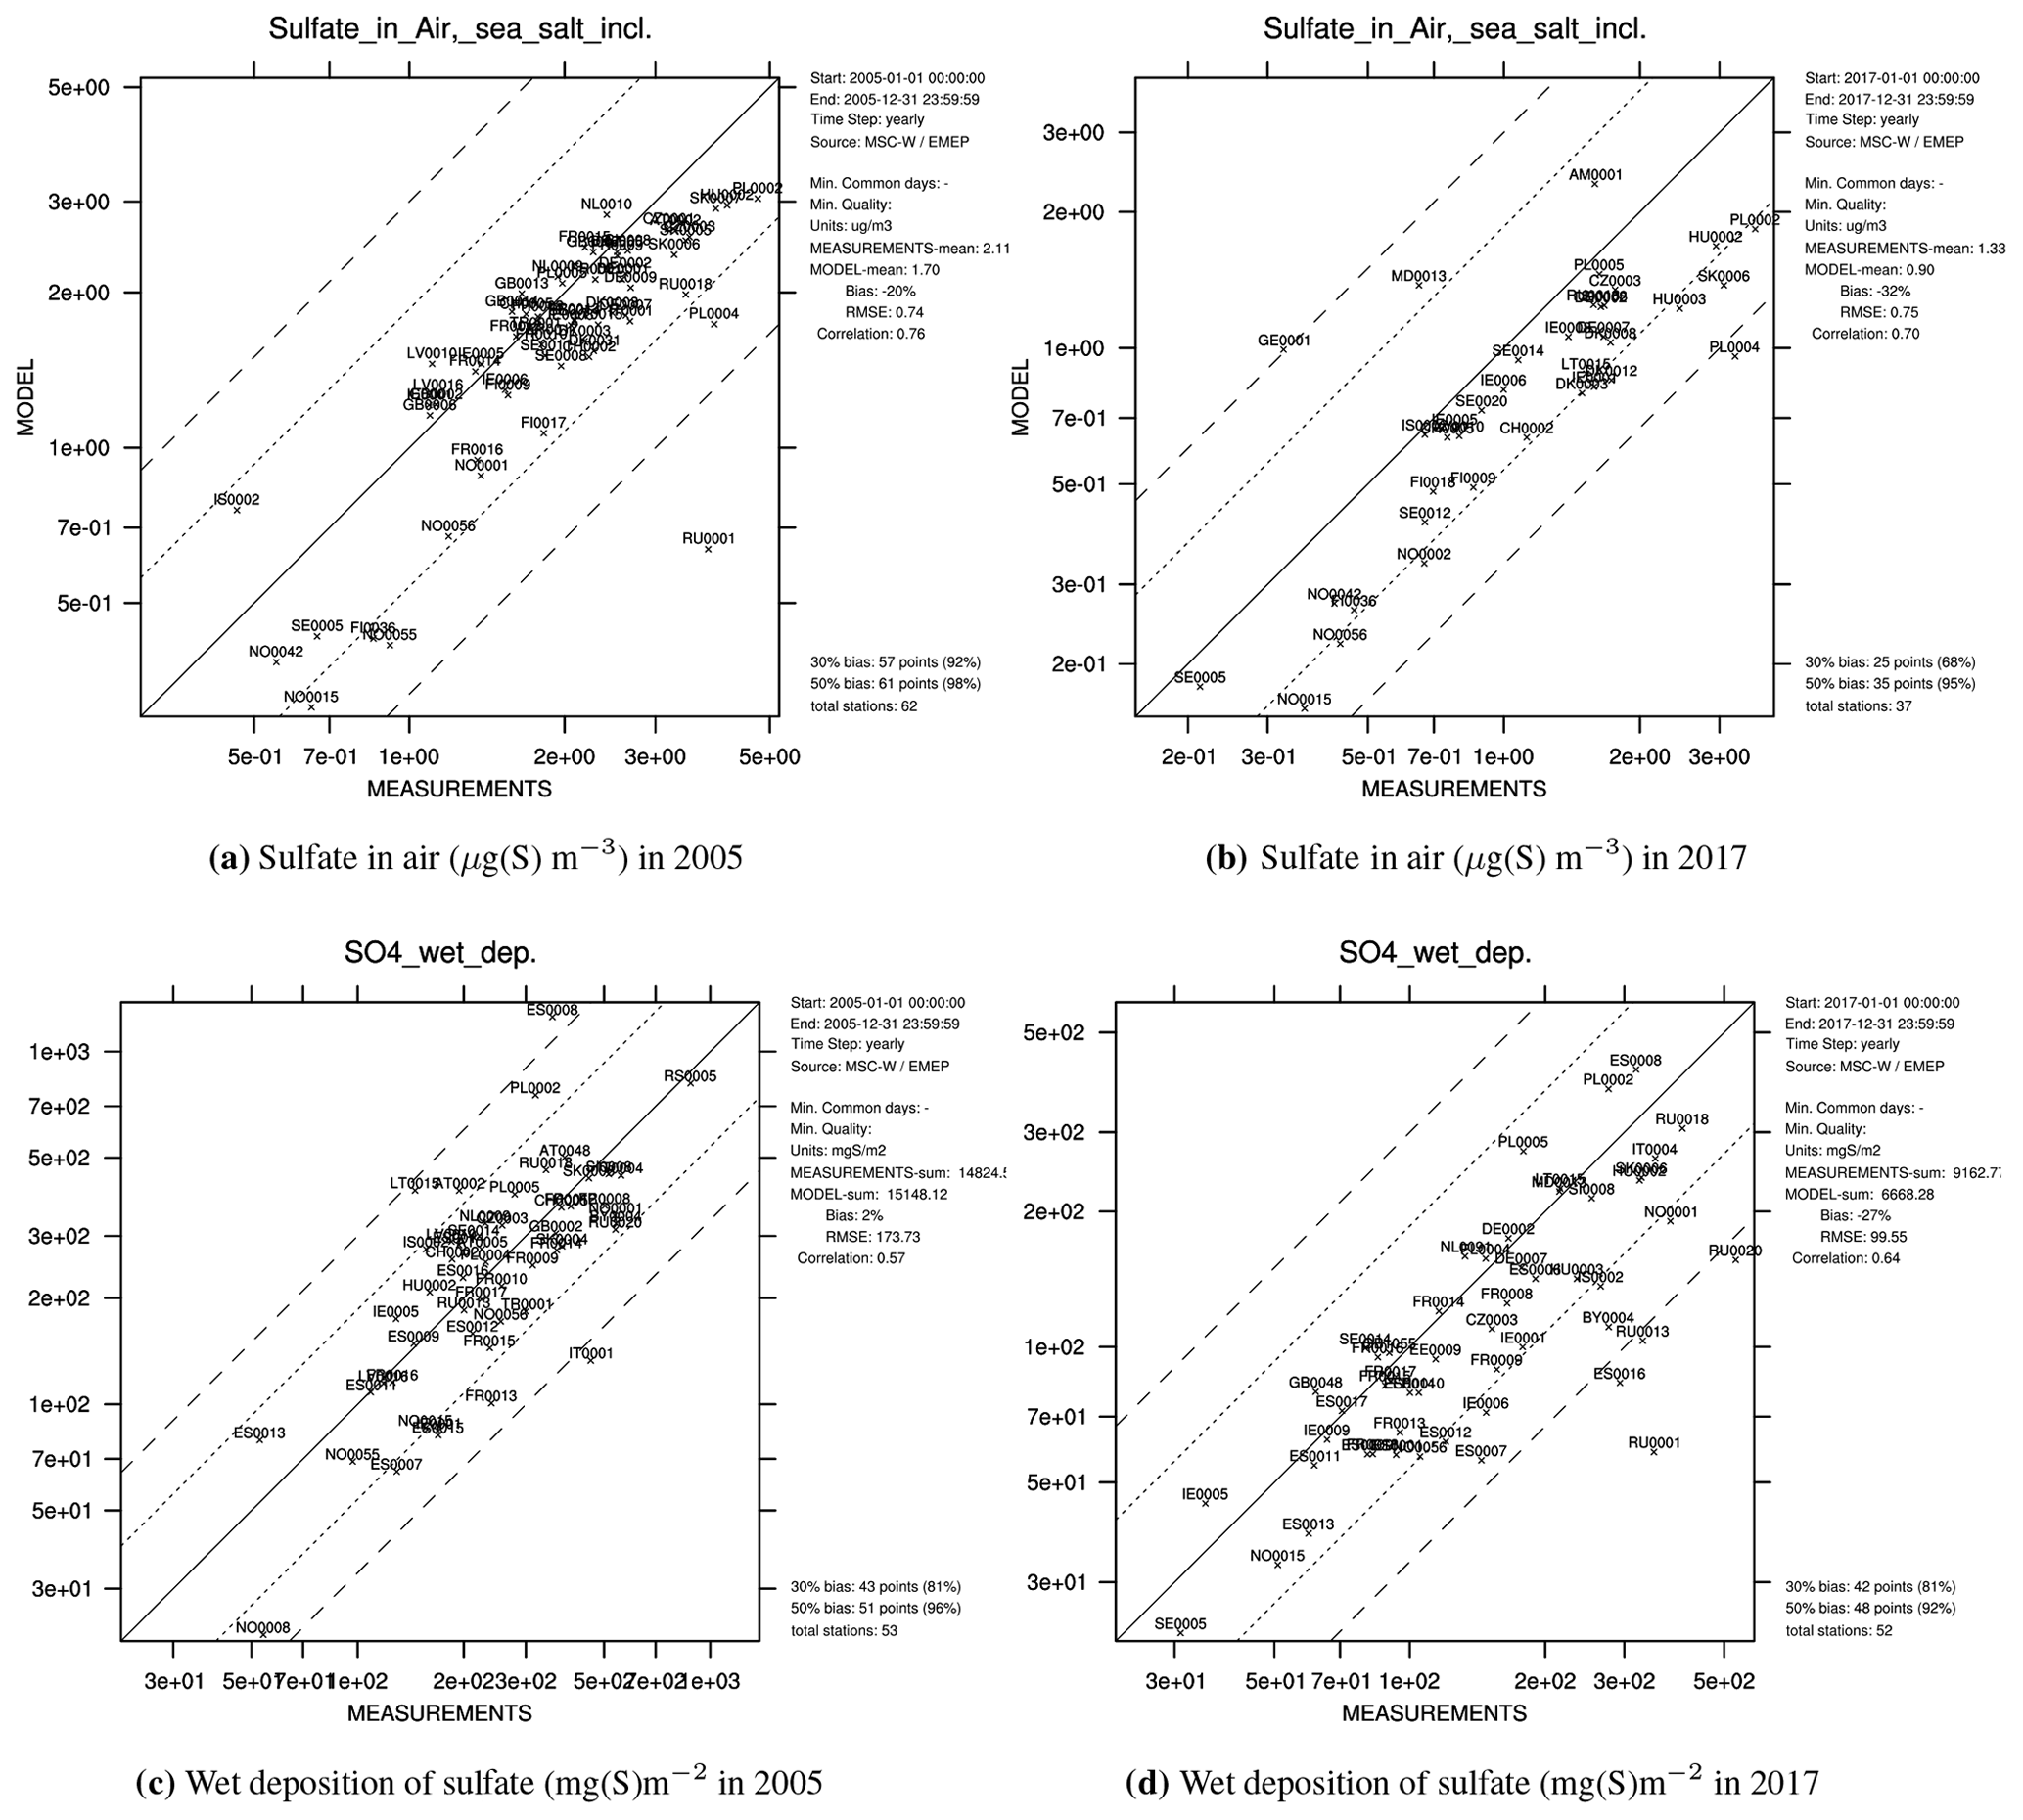
Figure A4Scatter plots of modelled versus observed concentrations of sulfate in air (a, b) and wet deposition of sulfate (c, d) for the years 2005 (a, c) and 2017 (b, d). Statistics with a limited set of common measurement sites are given in Table A1. Site positions are listed in Table A2. Measurements were downloaded from http://ebas.nilu.no (last access: 14 December 2021).
Table A1Year 2005 and year 2017 statistics for scatter plots with common measurement sites for both years. Obs is observed annual mean for the sites. Bias is model bias, and Corr. is correlation between measurements and the model calculations.
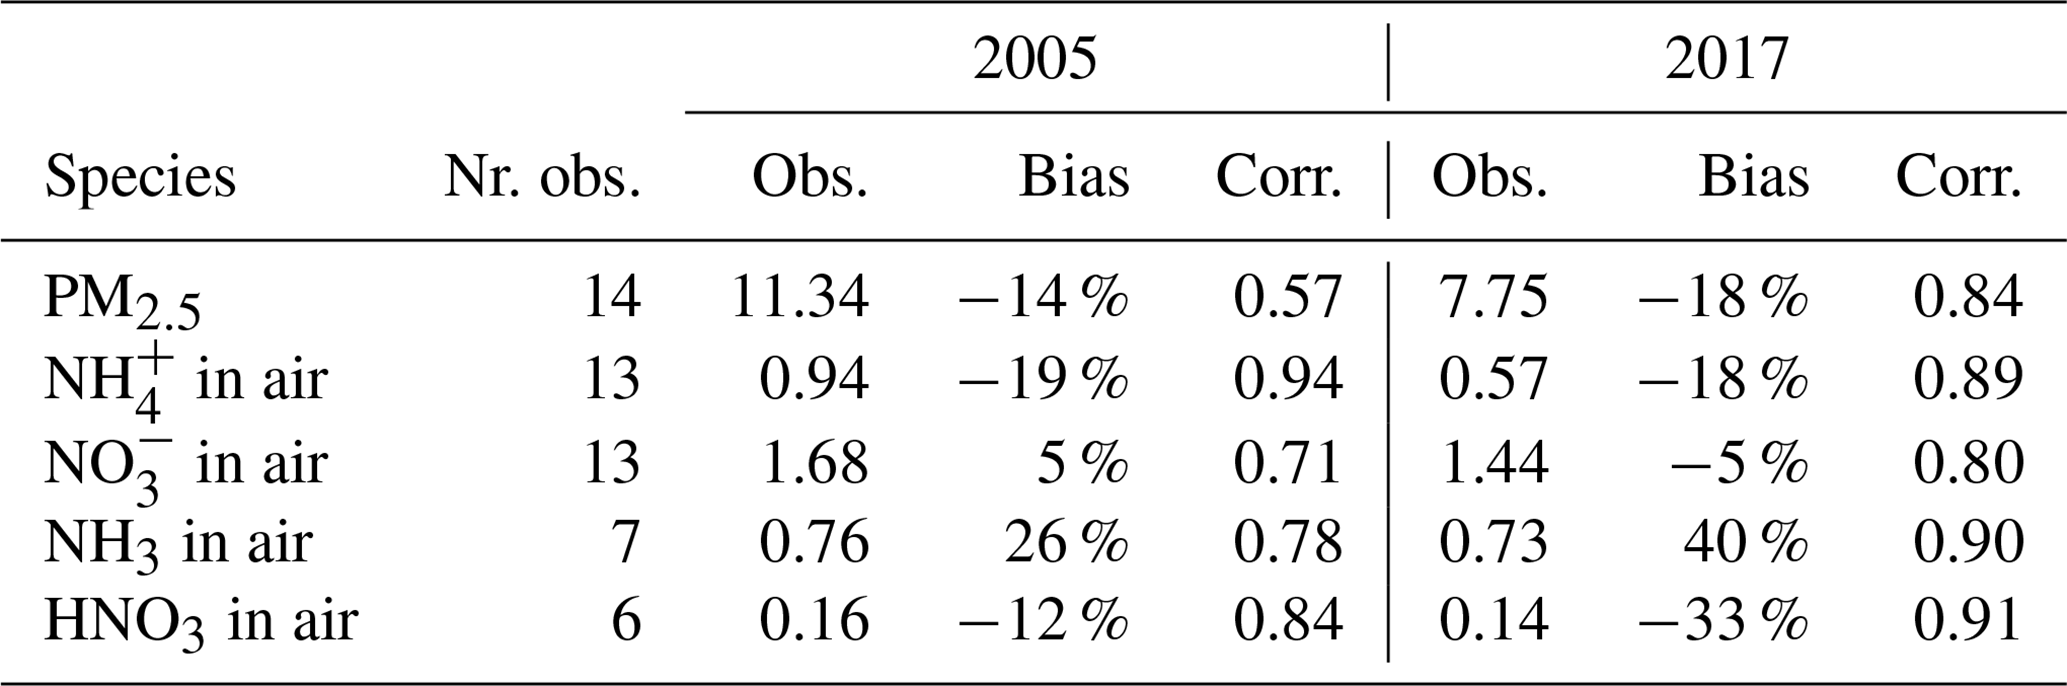
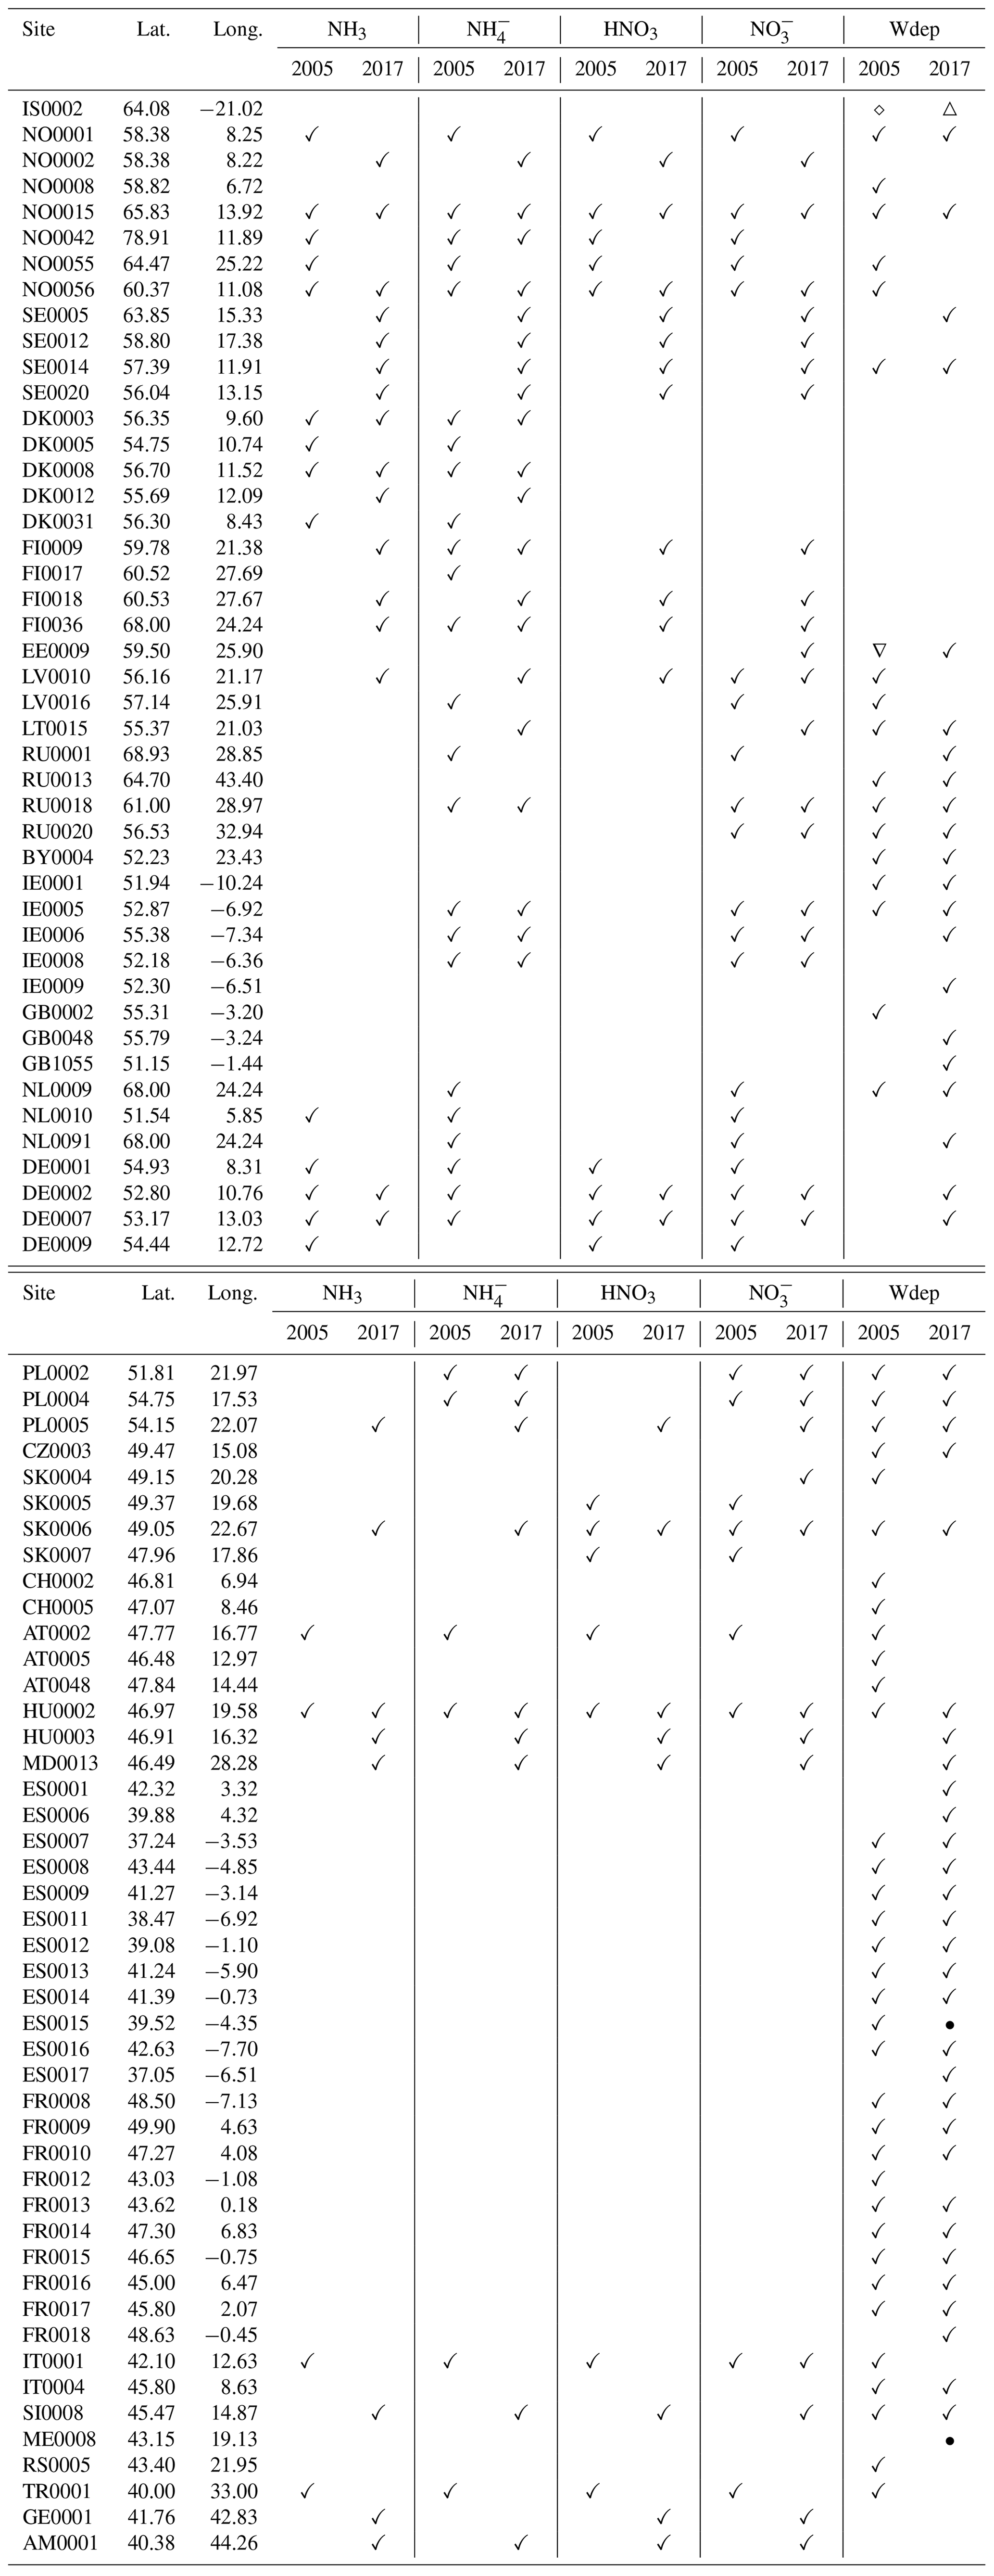
Table A2List of sites included in scatter plots in Figs. A1 to A4. Wet depositions when included for all three species (reduced nitrogen, oxidised nitrogen, and oxidised sulfur) are marked with ✓. Only reduced and oxidised nitrogen marked with ∇, only oxidised N and S marked with △, only reduced N and oxidised S marked with •, and only oxidised sulfur marked with ⋄.
The EMEP model version rv4.34 is available as open-source code through https://doi.org/10.5281/zenodo.3647990 (EMEP MSC-W, 2020).
Model results are available upon request to the first author.
JEJ made the model calculations and wrote most of the paper. HF assisted in designing the model scenarios and in writing the paper. TS calculated the exceedances of critical loads for eutrophication and contributed in the writing of the paper.
The contact author has declared that neither they nor their co-authors have any competing interests.
Publisher's note: Copernicus Publications remains neutral with regard to jurisdictional claims in published maps and institutional affiliations.
Computer time for EMEP model runs was supported by the Research Council of Norway through the NOTUR project EMEP (NN2890K) for CPU and the NorStore project European Monitoring and Evaluation Programme (NS9005K) for storage of data.
This work has been partially funded by EMEP under the United Nations Economic Commission for Europe (UN ECE).
This paper was edited by Maria Kanakidou and reviewed by two anonymous referees.
Aksoyoglu, S., Jiang, J., Ciarelli, G., Baltensperger, U., and Prévôt, A. S. H.: Role of ammonia in European air quality with changing land and ship emissions between 1990 and 2030, Atmos. Chem. Phys., 20, 15665–15680, https://doi.org/10.5194/acp-20-15665-2020, 2020. a, b
Backes, A. M., Aulinger, A., Bieser, J., Matthias, V., and Quante, M.: Ammonia emissions in Europe, part II: How ammonia emission abatement strategies affect secondary aerosols, Atmos. Environ., 126, 153–161, https://doi.org/10.1016/j.atmosenv.2015.11.039, 2016. a
Binkowski, F. and Shankar, U.: The Regional Particulate Matter Model .1. Model description and preliminary results, J. Geophys. Res., 100, 26191–26209, 1995. a
CLRTAP: Chapter V of Manual on methodologies and criteria for modelling and mapping critical loads and levels and air pollution effects, risks and trends., Tech. rep., UNECE Convention on Long-range Transboundary Air Pollution, available at: https://www.umweltbundesamt.de/en/manual-for-modelling-mapping-critical-loads-levels (last access: 14 December 2021), 2017. a, b
Colette, A., Granier, C., Hodnebrog, Ø., Jakobs, H., Maurizi, A., Nyiri, A., Bessagnet, B., D'Angiola, A., D'Isidoro, M., Gauss, M., Meleux, F., Memmesheimer, M., Mieville, A., Rouïl, L., Russo, F., Solberg, S., Stordal, F., and Tampieri, F.: Air quality trends in Europe over the past decade: a first multi-model assessment, Atmos. Chem. Phys., 11, 11657–11678, https://doi.org/10.5194/acp-11-11657-2011, 2011. a
Colette, A., Granier, C., Hodnebrog, Ø., Jakobs, H., Maurizi, A., Nyiri, A., Rao, S., Amann, M., Bessagnet, B., D'Angiola, A., Gauss, M., Heyes, C., Klimont, Z., Meleux, F., Memmesheimer, M., Mieville, A., Rouïl, L., Russo, F., Schucht, S., Simpson, D., Stordal, F., Tampieri, F., and Vrac, M.: Future air quality in Europe: a multi-model assessment of projected exposure to ozone, Atmos. Chem. Phys., 12, 10613–10630, https://doi.org/10.5194/acp-12-10613-2012, 2012. a
Damme, M. V., Clarisse, L., Franco, B., Sutton, M. A., Erisman, J. W., Kruit, R. W., van Zanten, M., Whitburn, S., Hadji-Lazaro, J., Hurtmans, D., Clerbaux, C., and Coheur, P.-F.: Global, regional and national trends of atmospheric ammonia derived from a decadal (2008–2018) satellite record, Environ. Res. Lett., 16, 055017, https://doi.org/10.1088/1748-9326/abd5e0, 2020. a
Davuliene, L., Jasineviciene, D., Garbariene, I., Andriejauskiene, J., Ulevicius, V., and Bycenkiene, S.: Long-term air pollution trend analysis in the South-eastern Baltic region, 1981–2017, Atmos. Res., 247, 105191, https://doi.org/10.1016/j.atmosres.2020.105191, 2021. a
De Vries, W., Hettelingh, J.-P., and Posch, M. (Eds.): Critical Loads and Dynamic Risk Assessments: Nitrogen, Acidity and Metals in Terrestrial and Aquatic Ecosystems, Springer, Dordrecht,, https://doi.org/10.1007/978-94-017-9508-1, 2015. a
EEA: Effects of air pollution on European ecosystems, Tech. Rep. EEA 11/2014, European Environment Agency, Copenhagen, Denmark, https://doi.org/10.2800/18365, 2014. a, b
EMEP MSC-W: metno/emep-ctm: OpenSource rv4.34 (202001) (rv4_34), Zenodo [code], https://doi.org/10.5281/zenodo.3647990, 2020. a
EMEP Status Report 1/2019: Transboundary particulate matter, photo-oxidants, acidifying and eutrophying components, EMEP MSC-W & CCC & CEIP, available at: https://emep.int/publ/reports/2019/EMEP_Status_Report_1_2019.pdf (last access: 14 December 2021), 2019. a
EMEP Status Report 1/2020: Transboundary particulate matter, photo-oxidants, acidifying and eutrophying components, EMEP MSC-W & CCC & CEIP, available at: https://emep.int/publ/reports/2020/EMEP_Status_Report_1_2020.pdf (last access: 14 December 2021), 2020. a, b, c
Erisman, J., Bleeker, A., Galloway, J., and Sutton, M.: Reduced nitrogen in ecology and the environment, Environ. Pollut., 150, 140–149, https://doi.org/10.1016/j.envpol.2007.06.033, 2007. a
Esteban, R., Ariz, I., Cruz, C., and Moran, J. F.: Review: Mechanisms of ammonium toxicity and the quest for tolerance, Plant Sci., 248, 92–101, https://doi.org/10.1016/j.plantsci.2016.04.008, 2016. a
Gauss, M., Tsyro, S., Fagerli, H., Hjellbrekke, A.-G., Aas, W., and Solberg, S.: EMEP MSC-W model performance for acidifying and eutrophying components, photo-oxidants and particulate matter in 2015, Supplementary material to EMEP Status Report 1/2017, available at: http://www.emep.int (last access: 14 December 2021), The Norwegian Meteorological Institute, Oslo, Norway, 2017. a
Gauss, M., Tsyro, S., Fagerli, H., Hjellbrekke, A.-G., Aas, W., and Solberg, S.: EMEP MSC-W model performance for acidifying and eutrophying components, photo-oxidants and particulate matter in 2016., Supplementary material to EMEP Status Report 1/2018, available at: http://www.emep.int (last access: 14 December 2021), The Norwegian Meteorological Institute, Oslo, Norway, 2018. a
Gauss, M., Tsyro, S., Benedictow, A., Fagerli, H., Hjellbrekke, A.-G., Aas, W., and Solberg, S.: EMEP MSC-W model performance for acidifying and eutrophying components, photo-oxidants and particulate matter in 2017., Supplementary material to EMEP Status Report 1/2019, available at: http://www.emep.int (last access: 14 December 2021), The Norwegian Meteorological Institute, Oslo, Norway, 2019. a, b, c
Gauss, M., Tsyro, S., Benedictow, A., Hjellbrekke, A.-G., Aas, W., and Solberg, S.: EMEP MSC-W model performance for acidifying and eutrophying components, photo-oxidants and particulate matter in 2018., Supplementary material to EMEP Status Report 1/2020, available at: http://www.emep.int (last access: 14 December 2021), The Norwegian Meteorological Institute, Oslo, Norway, 2020. a
Ge, Y., Heal, M. R., Stevenson, D. S., Wind, P., and Vieno, M.: Evaluation of global EMEP MSC-W (rv4.34) WRF (v3.9.1.1) model surface concentrations and wet deposition of reactive N and S with measurements, Geosci. Model Dev., 14, 7021–7046, https://doi.org/10.5194/gmd-14-7021-2021, 2021. a
Giannakis, E., Kushta, J., Bruggeman, A., and Llieveld, J.: Costs andf benefits of agriculural ammonia emission abatement options for complience with European air quality regulations, Environ. Sci. Europe, 31, 1–13, https://doi.org/10.1186/s12302-019-0275-0, 2019. a, b
Hettelingh, J.-P., Posch, M., and de Smet, P. E.: Multi-effect critical loads used in multi-pollutant reduction agreements in Europe, Water Air Soil Pollut., 130, 1133–1138, 2001. a
Hettelingh, J.-P., Posch, M., and Slootweg, J.: European critical loads: database, biodiversity and ecosystems at risk, CCE Final Report 2017, RIVM Report 2017-0155, https://doi.org/10.21945/RIVM-2017-0155, 2017. a, b
Höglund-Isaksson, L., Gómez-Sanabria, A., Klimont, Z., Rafaj, P., and Schöpp, W.: Technical potentials and costs for reducing global anthropogenic methane emissions in the 2050 timeframe – results from the GAINS model, Environ. Res. Commun., 2, 025004, https://doi.org/10.1088/2515-7620/ab7457, 2020. a
IIASA: Progress towards the achievement of the EU's air quality and emissions objectives, Tech. rep., IIASA (International Institute for Applied Systems Analysis), available at: https://ec.europa.eu/environment/air/pdf/clean_air_outlook_overview_report.pdf (last access: 14 December 2021), 2018. a, b
IIASA: Assessment Report on Ammonia 2020. Draft April 2020, Tech. rep., IIASA (International Institute for Applied Systems Analysis), available at: https://iiasa.ac.at/web/home/research/researchPrograms/air/policy/Assessment_Report_on_Ammonia_20200410.pdf (last access: 14 December 2021), 2020. a, b, c
Jiang, J., Aksoyoglu, S., Ciarelli, G., Baltensperger, U., and Prévôt, A. S.: Changes in ozone and PM2.5 in Europe during the period of 1990–2030: Role of reductions in land and ship emissions, Sci. Total Environ., 741, 140467, https://doi.org/10.1016/j.scitotenv.2020.140467, 2020. a
Jonson, J. E., Schulz, M., Emmons, L., Flemming, J., Henze, D., Sudo, K., Tronstad Lund, M., Lin, M., Benedictow, A., Koffi, B., Dentener, F., Keating, T., Kivi, R., and Davila, Y.: The effects of intercontinental emission sources on European air pollution levels, Atmos. Chem. Phys., 18, 13655–13672, https://doi.org/10.5194/acp-18-13655-2018, 2018. a
Karl, M., Jonson, J. E., Uppstu, A., Aulinger, A., Prank, M., Sofiev, M., Jalkanen, J.-P., Johansson, L., Quante, M., and Matthias, V.: Effects of ship emissions on air quality in the Baltic Sea region simulated with three different chemistry transport models, Atmos. Chem. Phys., 19, 7019–7053, https://doi.org/10.5194/acp-19-7019-2019, 2019. a
Metzger, S., Steil, B., Abdelkader, M., Klingmüller, K., Xu, L., Penner, J. E., Fountoukis, C., Nenes, A., and Lelieveld, J.: Aerosol water parameterisation: a single parameter framework, Atmos. Chem. Phys., 16, 7213–7237, https://doi.org/10.5194/acp-16-7213-2016, 2016. a
Metzger, S., Abdelkader, M., Steil, B., and Klingmüller, K.: Aerosol water parameterization: long-term evaluation and importance for climate studies, Atmos. Chem. Phys., 18, 16747–16774, https://doi.org/10.5194/acp-18-16747-2018, 2018. a
Nenes, A., Pandis, S. N., Weber, R. J., and Russell, A.: Aerosol pH and liquid water content determine when particulate matter is sensitive to ammonia and nitrate availability, Atmos. Chem. Phys., 20, 3249–3258, https://doi.org/10.5194/acp-20-3249-2020, 2020. a
Nenes, A., Pandis, S. N., Kanakidou, M., Russell, A. G., Song, S., Vasilakos, P., and Weber, R. J.: Aerosol acidity and liquid water content regulate the dry deposition of inorganic reactive nitrogen, Atmos. Chem. Phys., 21, 6023–6033, https://doi.org/10.5194/acp-21-6023-2021, 2021. a, b, c
Nilsson, J. and Grennfelt, P. (Eds.): Critical Loads for Sulphur and Nitrogen, Nordic Council of Ministers, Copenhagen, Denmark, Nord 1988, 97, 418 pp., 1988. a
Petit, J.-E., Amodeo, T., Meleux, F., Bessagnet, B., Menut, L., Grenier, D., Pellan, Y., Ockler, A., Rocq, B., Gros, V., Sciare, J., and Favez, O.: Characterising an intense PM pollution episode in March 2015 in France from multi-site approach and near real time data: Climatology, variabilities, geographical origins and model evaluation, Atmos. Environ., 155, 68–84, https://doi.org/10.1016/j.atmosenv.2017.02.012, 2017. a
Posch, M., Hettelingh, J.-P., and De Smet, P.: Characterization of critical load exceedances in Europe, Water Air Soil Pollut., 130, 1139–1144, 2001. a
Reis, S., Grennfelt, P., Klimont, Z., Amann, M., ApSimon, H., Hettelingh, J., Holland, M., Le Gall, A., Maas, R., Posch, M., Spranger, T., Sutton, M., and Williams, M.: From acid rain to climate change, Science, 338, 1.153–1.154, https://doi.org/10.1126/science.1226514, 2012. a
Seinfeld, J. and Pandis, S.: Atmospheric Chemistry and Physics: From Air Pollution to Climate Change, 3rd edn., John Wiley & Sons, Inc, ISBN 978-1-118-94740-1, 2016. a
Simpson, D., Benedictow, A., Berge, H., Bergström, R., Emberson, L. D., Fagerli, H., Flechard, C. R., Hayman, G. D., Gauss, M., Jonson, J. E., Jenkin, M. E., Nyíri, A., Richter, C., Semeena, V. S., Tsyro, S., Tuovinen, J.-P., Valdebenito, Á., and Wind, P.: The EMEP MSC-W chemical transport model – technical description, Atmos. Chem. Phys., 12, 7825–7865, https://doi.org/10.5194/acp-12-7825-2012, 2012. a, b
Simpson, D., Bergström, Tsyro, S., and Wind, P.: Updates to the EMEP MSC-W model, 2019–2020, in: Transboundary particulate matter, photo-oxidants, acidifying and eutrophying components. EMEP Status Report 1/2020, pp. 155–165, The Norwegian Meteorological Institute, Oslo, Norway, available at: https://emep.int/publ/reports/2020/EMEP_Status_Report_1_2020.pdf (last access: 14 December 2021), 2020. a
Slootweg, J., Posch, M., and Hettelingh , J. (Eds.): Modelling and mapping the impacts of atmospheric deposition of nitrogen and sulphur, Tech. rep., CCE Status Report 2015, RIVM Report 2015-0193, Coordination Centre for Effects, Bilthoven, Netherlands, 182 pp., available at: https://www.umweltbundesamt.de/sites/default/files/medien/4038/dokumente/2_cce_sr2015.pdf (last access: 19 January 2022), 2015. a
Theobald, M. R., Vivanco, M. G., Aas, W., Andersson, C., Ciarelli, G., Couvidat, F., Cuvelier, K., Manders, A., Mircea, M., Pay, M.-T., Tsyro, S., Adani, M., Bergström, R., Bessagnet, B., Briganti, G., Cappelletti, A., D'Isidoro, M., Fagerli, H., Mar, K., Otero, N., Raffort, V., Roustan, Y., Schaap, M., Wind, P., and Colette, A.: An evaluation of European nitrogen and sulfur wet deposition and their trends estimated by six chemistry transport models for the period 1990–2010, Atmos. Chem. Phys., 19, 379–405, https://doi.org/10.5194/acp-19-379-2019, 2019. a, b
Tsyro, S. and Metzgert, S.: EQSAM4clim, in: Transboundary particulate matter, photo-oxidants, acidifying and eutrophying components. EMEP Status Report 1/2019, pp. 133–141, The Norwegian Meteorological Institute, Oslo, Norway, available at: https://emep.int/publ/reports/2019/EMEP_Status_Report_1_2019.pdf (last access: 14 December 2021), 2019. a
Tsyro, S., Aas, W., Solberg, S., Benedictow, A., Fagerli, H., and Scheuschner, T.: Status of transboundary air pollution in 2017, in: Transboundary particulate matter, photo-oxidants, acidifying and eutrophying components. EMEP Status Report 1/2019, 17–42, The Norwegian Meteorological Institute, Oslo, Norway, available at: https://emep.int/publ/reports/2019/EMEP_Status_Report_1_2019.pdf (last access: 14 December 2021), 2019. a
Tsyro, S., Aas, W., Solberg, S., Benedictow, A., Fagerli, H., and Scheuschner, T.: Status of transboundary air pollution in 2018, in: Transboundary particulate matter, photo-oxidants, acidifying and eutrophying components. EMEP Status Report 1/2020, 17–34, The Norwegian Meteorological Institute, Oslo, Norway, available at: https://emep.int/publ/reports/2020/EMEP_Status_Report_1_2020.pdf (last access: 14 December 2021), 2020. a
van den Berg, L., Peters, C., Ashmore, M., and Roelofs, J.: Reduced nitrogen has a greater effect than oxidised nitrogen on dry heathland vegetation, Environ. Pollut., 154, 359–369, https://doi.org/10.1016/j.envpol.2007.11.027, 2008. a
Vieno, M., Heal, M. R., Twigg, M. M., MacKenzie, I. A., Braban, C. F., Lingard, J. J. N., Ritchie, S., Beck, R. C., Móring, A., Ots, R., Marco, C. F. D., Nemitz, E., Sutton, M. A., and Reis, S.: The UK particulate matter air pollution episode of March–April 2014: more than Saharan dust, Environ. Res. Lett., 11, 044004, https://doi.org/10.1088/1748-9326/11/4/044004, 2016. a
Vivanco, M. G., Theobald, M. R., García-Gómez, H., Garrido, J. L., Prank, M., Aas, W., Adani, M., Alyuz, U., Andersson, C., Bellasio, R., Bessagnet, B., Bianconi, R., Bieser, J., Brandt, J., Briganti, G., Cappelletti, A., Curci, G., Christensen, J. H., Colette, A., Couvidat, F., Cuvelier, C., D'Isidoro, M., Flemming, J., Fraser, A., Geels, C., Hansen, K. M., Hogrefe, C., Im, U., Jorba, O., Kitwiroon, N., Manders, A., Mircea, M., Otero, N., Pay, M.-T., Pozzoli, L., Solazzo, E., Tsyro, S., Unal, A., Wind, P., and Galmarini, S.: Modeled deposition of nitrogen and sulfur in Europe estimated by 14 air quality model systems: evaluation, effects of changes in emissions and implications for habitat protection, Atmos. Chem. Phys., 18, 10199–10218, https://doi.org/10.5194/acp-18-10199-2018, 2018. a, b
WHO: Air quality guidelines. Global update 2005. Particulate matter, ozone, nitrogen dioxide and sulfur dioxide, available at: https://www.euro.who.int/__data/assets/pdf_file/0005/78638/E90038.pdf (last access: 14 December 2021), 2005. a