the Creative Commons Attribution 4.0 License.
the Creative Commons Attribution 4.0 License.
 | 07 Oct 2022
NH3 spatiotemporal variability over Paris, Mexico City, and Toronto, and its link to PM2.5 during pollution events
Camille Viatte
Rimal Abeed
Shoma Yamanouchi
William C. Porter
Sarah Safieddine
Martin Van Damme
Lieven Clarisse
Beatriz Herrera
Michel Grutter
Pierre-Francois Coheur
Kimberly Strong
Cathy Clerbaux
Megacities can experience high levels of fine particulate matter (PM2.5) pollution linked to ammonia (NH3) mainly emitted from agricultural activities. Here, we investigate such pollution in the cities of Paris, Mexico, and Toronto, each of which have distinct emission sources, agricultural regulations, and topography. Ten years of measurements from the infrared atmospheric sounding interferometer (IASI) are used to assess the spatiotemporal NH3 variability over and around the three cities.
In Europe and North America, we determine that temperature is associated with the increase in NH3 atmospheric concentrations with a coefficient of determination (r2) of 0.8 over agricultural areas. The variety of the NH3 sources (industry and agricultural) and the weaker temperature seasonal cycle in southern North America induce a lower correlation factor (r2=0.5). The three regions are subject to long-range transport of NH3, as shown using HYSPLIT cluster back trajectories. The highest NH3 concentrations measured at the city scale are associated with air masses coming from the surrounding and north/northeast regions of Paris, the south/southwest areas of Toronto, and the southeast/southwest zones of Mexico City.
Using NH3 and PM2.5 measurements derived from IASI and surface observations from 2008 to 2017, annually frequent pollution events are identified in the three cities. Wind roses reveal statistical patterns during these pollution events with dominant northeast/southwest directions in Paris and Mexico City, and the transboundary transport of pollutants from the United States in Toronto. To check how well chemistry transport models perform during pollution events, we evaluate simulations made using the GEOS-Chem model for March 2011. In these simulations we find that NH3 concentrations are underestimated overall, though day-to-day variability is well represented. PM2.5 is generally underestimated over Paris and Mexico City, but overestimated over Toronto.
- Article
(5702 KB) - Full-text XML
- Companion paper
-
Supplement
(2692 KB) - BibTeX
- EndNote


Paris, Toronto, and Mexico City are cities with over 2 million inhabitants. When their larger metropolitan regions are included, their populations are 10.5 million for Paris (the most populous area in the European Union), 6.5 million for Toronto (the fourth most populous city in North America), and 9.2 million for Mexico City (the most populous city in North America). These cities typically experience strong particulate matter (PM) pollution episodes. Exposure to such particles is harmful to humans and can lead to cardiovascular and respiratory diseases (Murray et al., 2020).
A large proportion of the particles' composition is ammonium sulfate and nitrate, which are formed from ammonia (NH3) (Behera et al., 2013) released into the atmosphere from, e.g., fertilizer spreading practices and both transported to cities, reducing the quality of urban air (Pope et al., 2009). The agricultural sector represents 94 %, 90 %, and 94 % of total NH3 emissions in France (CITEPA, 2018), Canada (ECCC, 2022), and Mexico (INECC and SEMARNAT, 2018), respectively. NH3 is the most poorly understood precursor of PM2.5 (PM with a diameter less than 2.5 µm), primarily because measurements are difficult (von Bobrutzki et al., 2010), sparse, and due to low ambient NH3 concentrations and episodic emissions. Worldwide, only five countries (United States, China, the Netherlands, United Kingdom, and Canada) have included routine measurements of NH3 concentrations in their air quality monitoring networks (Nair and Yu, 2020).
NH3 emissions are associated with very high uncertainties in all inventories (186 % to 294 % uncertainties in EDGAR; McDuffie et al., 2021; Van Damme et al., 2018) due to uncertainties in the reporting of agricultural statistics and emission factors that depend on individual agricultural practices, biological processes, and environmental conditions (Paulot and Jacob, 2014), as well as political disturbances and land-use change (Abeed et al., 2021). The evaporation of NH3 in the atmosphere, as well as its transformation into particulate matter, is highly dependent on the thermodynamic conditions of the atmosphere (Sutton et al., 2013). All these parameters account for the complexity of reproducing NH3 concentrations in atmospheric models, predicting the associated PM2.5 pollution, and, ultimately, implementing relevant regulations to reduce its emissions.
Given the crucial role that NH3 plays in environmental and public health problems, reducing its emissions will be a major challenge. However, NH3 concentrations are increasing in many countries: France, Canada, and Mexico reported increases of 24±11 %, 16.4±8.6 %, and 8.4±5.2 % between 2008 and 2018, respectively (Van Damme et al., 2021). These trends are likely explained by increasing emissions, partly due to increased temperature (Europe) and biomass burning (Canada). However, decreasing concentrations of nitrogen and sulfur oxides, e.g., in Europe and China, also increase the ammonia atmospheric lifetime and play a role in the reported upward trends.
In Paris, PM2.5 are composed of organic matter (38 %–47 %), nitrate (17 %–22 %), non-sea-salt sulfate (13 %–16 %), ammonium (10 %–12 %), and, to a minor extent, elemental carbon, mineral dust (2 %–5 %), and sea salt (Bressi et al., 2014). In spring, it has been shown that NH3 plays a significant role in PM2.5 pollution episodes (Viatte et al., 2021), but long-term observations are needed to properly evaluate the impact of NH3 to PM2.5 formation.
In Toronto, secondary nitrate formed from nitric acids (NOx) and NH3 account for 36 % of the PM2.5 sources (Lee et al., 2003) and ammonium nitrate and sulfate accounted for 20 %–30 % of annual PM2.5 mass over the 14-year period between 2004 and 2017 (Jeong et al., 2020). There is a need for a higher number of surface observations to evaluate the NH3–PM2.5 relationship and its evolution over time (Larios et al., 2018).
In Mexico, PM2.5 concentrations often exceed the national standard of 41 µg m−3 for the 24 h mean (NOM-025-SSA1-2021, 2021). Secondary inorganic aerosols, which are dominated by ammonium sulfate with an average of 14 %, account for 30 % of the chemical composition of PM2.5 (Vega et al., 2010). A better understanding of the particulate pollutants processes in Mexico is still needed (Ojeda-Castillo et al., 2019).
To assess the role of NH3 in the formation of particulate matter, the AmmonAQ (ammonia air quality) project was designed to quantify NH3 spatiotemporal variabilities in regional domains around these three cities. The main objective of this project is to determine the impact of intensive agricultural practices on NH3 and urban air quality, with a focus on Paris, Toronto, and Mexico as benchmark case studies. A schematic representation of the AmmonAQ project and the domains of study are shown in Fig. 1. The “Europe”, “North America”, and “southern North America” domains represent the extended area with NH3 sources that can impact the Paris, Toronto, and Mexico City air composition. The three cities are investigated with the use of different datasets: satellite measurements and model simulation data, and surface measurements when available (see Sect. 2).
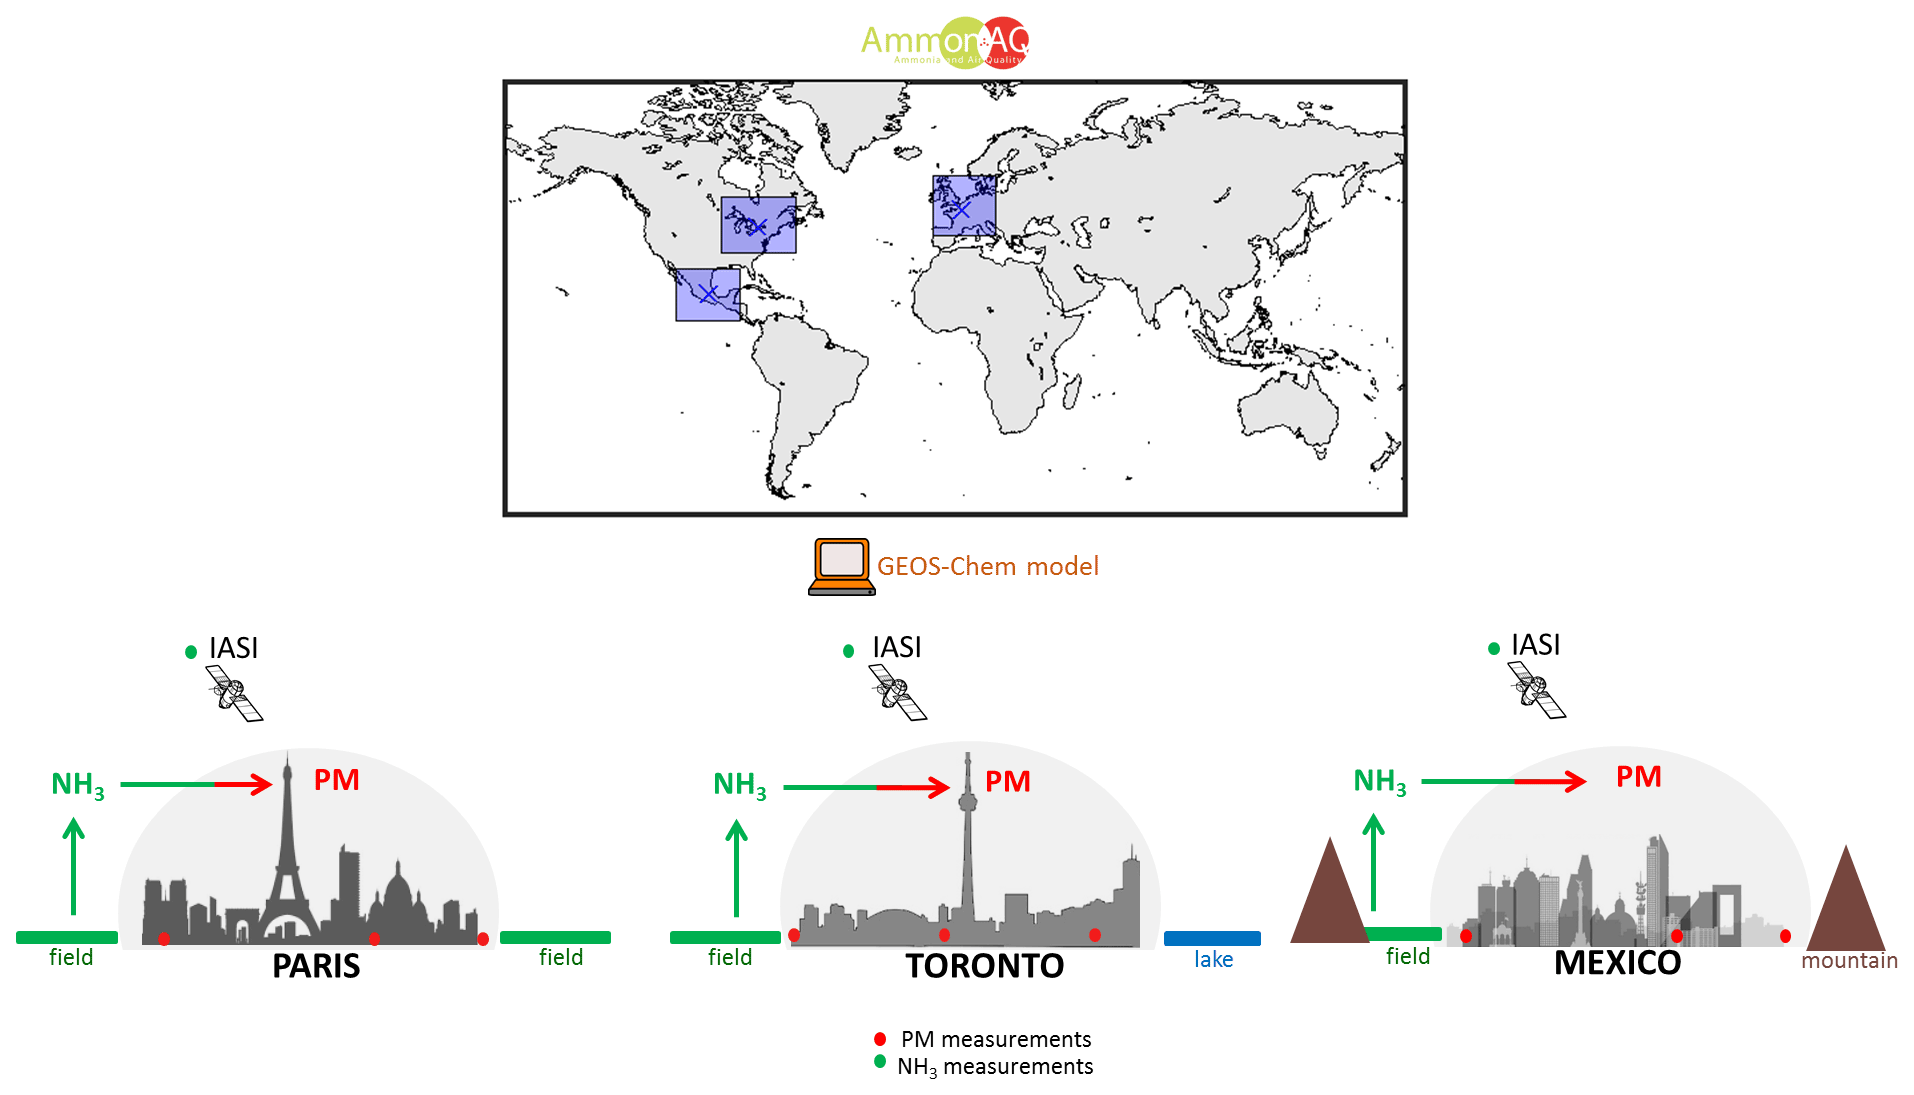
Figure 1Representation of the AmmonAQ project. Upper panel: the three study regions investigated (in blue rectangles). Lower panel: presentation of each city and regional domain and different datasets used.
These cities have been chosen as the focus of this study because of the availability of NH3 and PM2.5 measurements. These three cities differ in terms of the following:
-
The regulation of NH3 emissions: French policies aim to reduce NH3 emissions by 13 % in 2030 relative to 2005 (CITEPA, 2018) following EU ratification of the Gothenburg Protocol in 2017, whereas in Canada and Mexico there are no federal regulations for NH3 emissions yet (Bittman et al., 2017).
-
Agricultural practices affecting NH3 emissions differ in each region as farmers depend on meteorological conditions for fertilizer use.
-
Meteorological and climate conditions are very different in each of the regions: drier winters and wetter summers in Toronto compared with Paris, and weak winds and strong temperature inversions in Mexico City. This influences the NH3 lifetime and chemistry leading to the formation of PM2.5.
-
Topography: Toronto is adjacent to Lake Ontario, Paris is inland, and Mexico City is a basin surrounded by mountains. This will impact the trajectories of air masses.
2.1 NH3 observations derived from IASI
The infrared atmospheric sounding interferometer (IASI) was launched onboard the Metop-A/B/C satellites in 2006, 2012, and 2018, respectively (Clerbaux et al., 2009). The IASI provides twice daily total column measurements of NH3 globally at 09:30 and 21:30 local solar time. With its polar orbit and a swath of 2400 km, IASI pixel size is 12 km in diameter at nadir. In this work, we use version 3 of the ANNI-NH3 product (Van Damme et al., 2021; Guo et al., 2021) from IASI Metop-A/B morning overpasses over the period 2008–2017 gridding a spatial resolution of 0.25∘ × 0.25∘. The detection limit depends both on the atmospheric state (mainly thermal contrast and NH3 abundance) and the instrument characteristics. For IASI, the minimum detection limit is found to be 4–6 × 10¹⁵ molec. cm−2 (Clarisse et al., 2010).
2.2 PM2.5 dataset derived from surface network measurements
To study local scale PM2.5 pollution events in Paris, Toronto, and Mexico City, PM2.5 observations of surface concentrations from 2008 to 2017 are used.
For Paris, we use hourly observations of PM2.5 concentrations derived from 14 stations of the Airparif network (https://data-airparif-asso.opendata.arcgis.com; last access: 1 April 2022). For Toronto, we analyze hourly PM2.5 observations derived from 11 stations supported by the Ministry of the Environment, Conservation and Parks of Ontario (http://www.airqualityontario.com; last access: 1 April 2022). For Mexico, PM2.5 concentrations are derived from 27 stations of the Red Automática de Monitoreo Atmosférico (RAMA; http://www.aire.cdmx.gob.mx/default.php?opc=%27aKBh%27; last access: 1 April 2022) network.
All these stations are located within a 50 km radius circle of the city centers of Paris, Toronto, and Mexico City.
2.3 NH3 and PM2.5 from the GEOS-Chem model
We generate model outputs for March of 2011 because all three cities experienced both separate and combined PM2.5 and NH3 pollution events during this period. We use version 12.7.2 of the GEOS-Chem chemical transport model (Bey et al., 2001) driven by the MERRA-2 reanalysis product, including nested domains over Europe and North America at a 0.5∘ × 0.625∘ horizontal resolution from which we extract modeled surface values for each city. Boundary conditions for these two nested domains are created using a global simulation for the same month at 2∘ × 2.5∘ resolution. Output for the analyzed month of March includes monthly means, as well as hourly means for selected diagnostics, and is preceded by 2 months of discarded model spinup time for the global simulation, and 1 month for each nested run. Anthropogenic emissions are taken primarily from the global Community Emissions Data System (CEDS) inventory (Hoesly et al., 2018), with regional emissions from the 2011 National Emissions Inventory produced by the U.S. EPA (NEI2011) used to override global values over the United States. Biogenic non-agricultural ammonia, as well as ocean ammonia sources, are taken from the Global Emission Inventories Activities database (GEIA; Bouwman et al., 1997). Open fire emissions are generated using the GFED 4.1s inventory (Randerson et al., 2017). Sulfate–nitrate–ammonium aerosol processes are calculated using version 2.2 of the ISORROPIA thermodynamic module (Fountoukis and Nenes, 2007). Black carbon is handled as described in Wang et al. (2014), while secondary organic aerosol is produced using the simplified irreversible scheme described in Pai et al. (2020).
2.4 Back-trajectories analysis from the HYSPLIT model
To determine the effect of long-range transport affecting the local air quality of the three cities, we use the Hybrid Single-Particle Lagrangian Integrated Trajectory model (HYSPLIT; Stein et al., 2015). Note that unlike the GEOS-Chem model, HYSPLIT does not include atmospheric chemistry. For the runs, meteorological data are from the National Centers for Environmental Prediction (NCEP)and National Center for Atmospheric Research (NCAR) reanalysis at 2.5∘ global latitude–longitude projection. Note that visual inspection of the back trajectories shows that using a 2.5∘ resolution meteorological dataset is similar to using a finer meteorological dataset at 1∘ resolution (GDAS). First, we run daily 24 h back trajectories ending in the city centers at the overpass time of the IASI instrument covering the period 2008–2017. Then, for each day we calculate the mean of NH3 total columns derived from IASI observations in a 50 km radius around the cities associated with each back trajectory. Finally, all back trajectories that are near each other are merged in clusters and associated with the corresponding local-scale IASI NH3 concentrations.
2.5 ERA-5 meteorological data
The meteorological variables used in this study are extracted from the hourly ECMWF reanalysis (ERA5; Hersbach et al., 2020). ERA5 data are at 0.25∘ × 0.25∘ resolution (native horizontal resolution of ERA5 is ∼ 31 km) and are interpolated in time and space to the IASI observation. The meteorological parameters considered here are the skin temperature (Tskin), which is the physical temperature of the earth's surface), total precipitation (in meters of water equivalent, i.e., accumulated liquid and frozen water, comprising rain and snow), and relative humidity up to 2 m above the surface calculated from dew and air temperature at 2 m from ERA5.
3.1 NH3 source regions identification and spatiotemporal variability over the Europe, North America, and southern North America domains
Using 10 years of IASI observations, the main source regions of NH3 in the three domains of study are identified (Fig. 2) and listed in Table 1. We identify 10, 9, and 19 NH3 source regions over the Europe, North America, and southern North America regions, respectively. All of the sources over the Europe and North America domains are mostly related to agricultural practices (farming and spreading practices). This is in agreement with previous calculation of worldwide nitrogen inputs from fertilizer and manure (Potter et al., 2010). Around southern North America, three sources are related to fertilizer or soda ash industries (listed with C, G, and O in Fig. 2 and Table 1; Van Damme et al., 2018); the rest is agricultural.
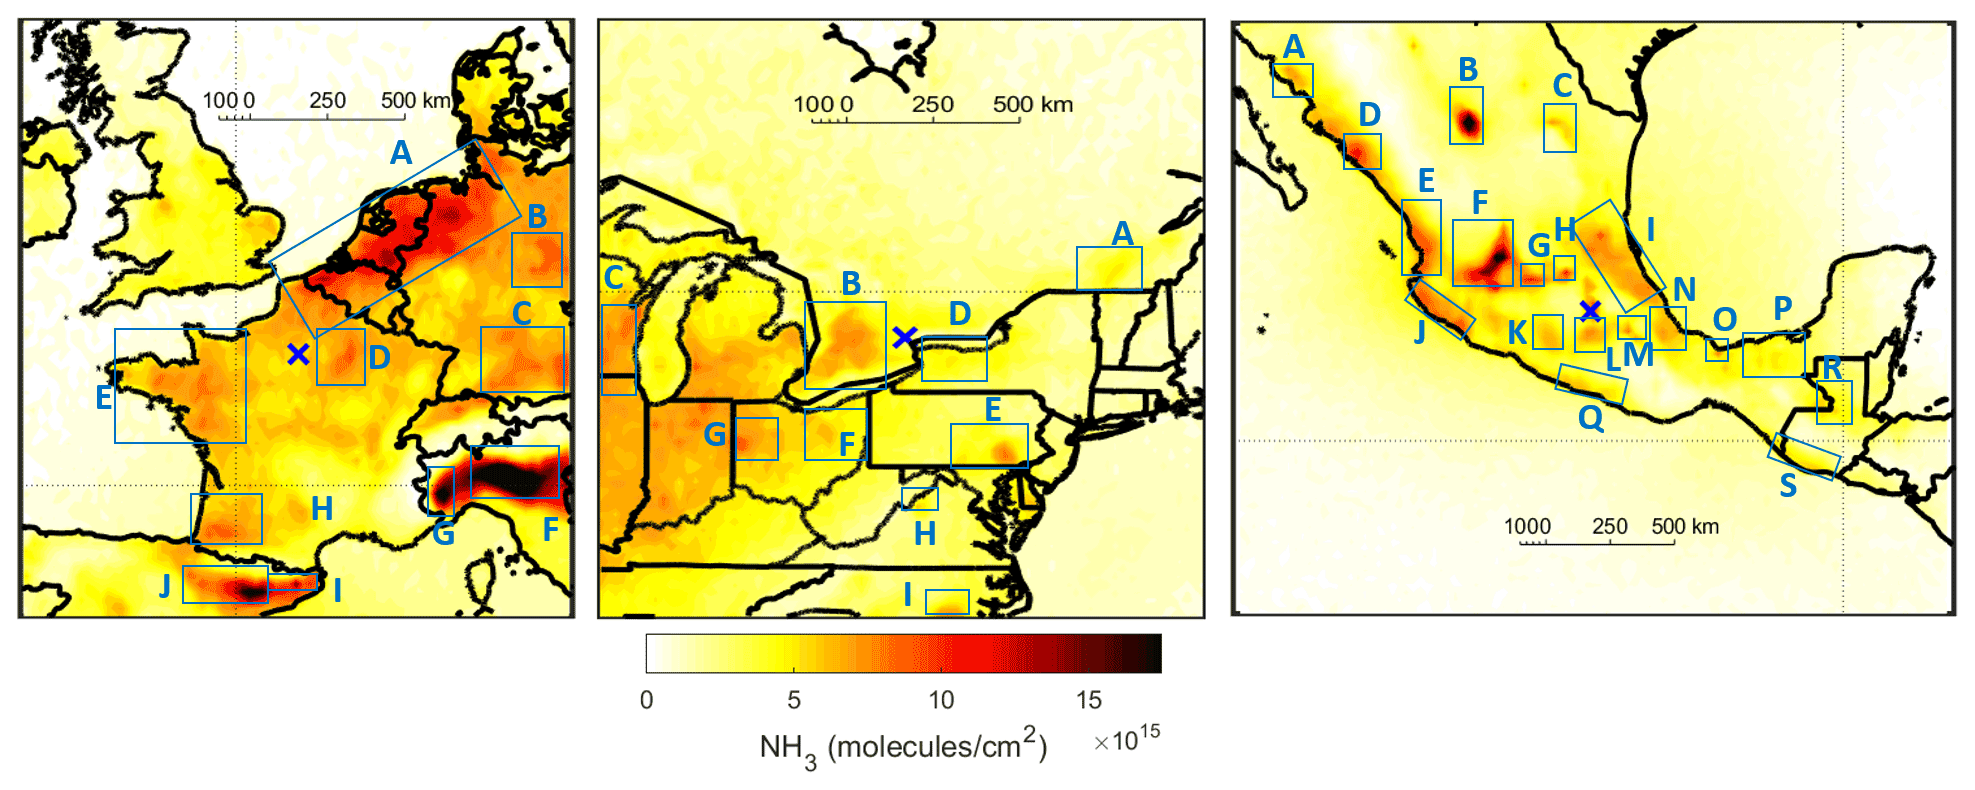
Figure 2Source region identification of NH3 derived from 10-years average of IASI total columns (molec. cm−2) from 2008 to 2017. The blue crosses indicate Paris, Toronto, and Mexico City locations.
Table 1List of NH3 source regions identified using 10-years average of IASI total columns (molec. cm−2) over the Europe, North America, and southern North America regions.
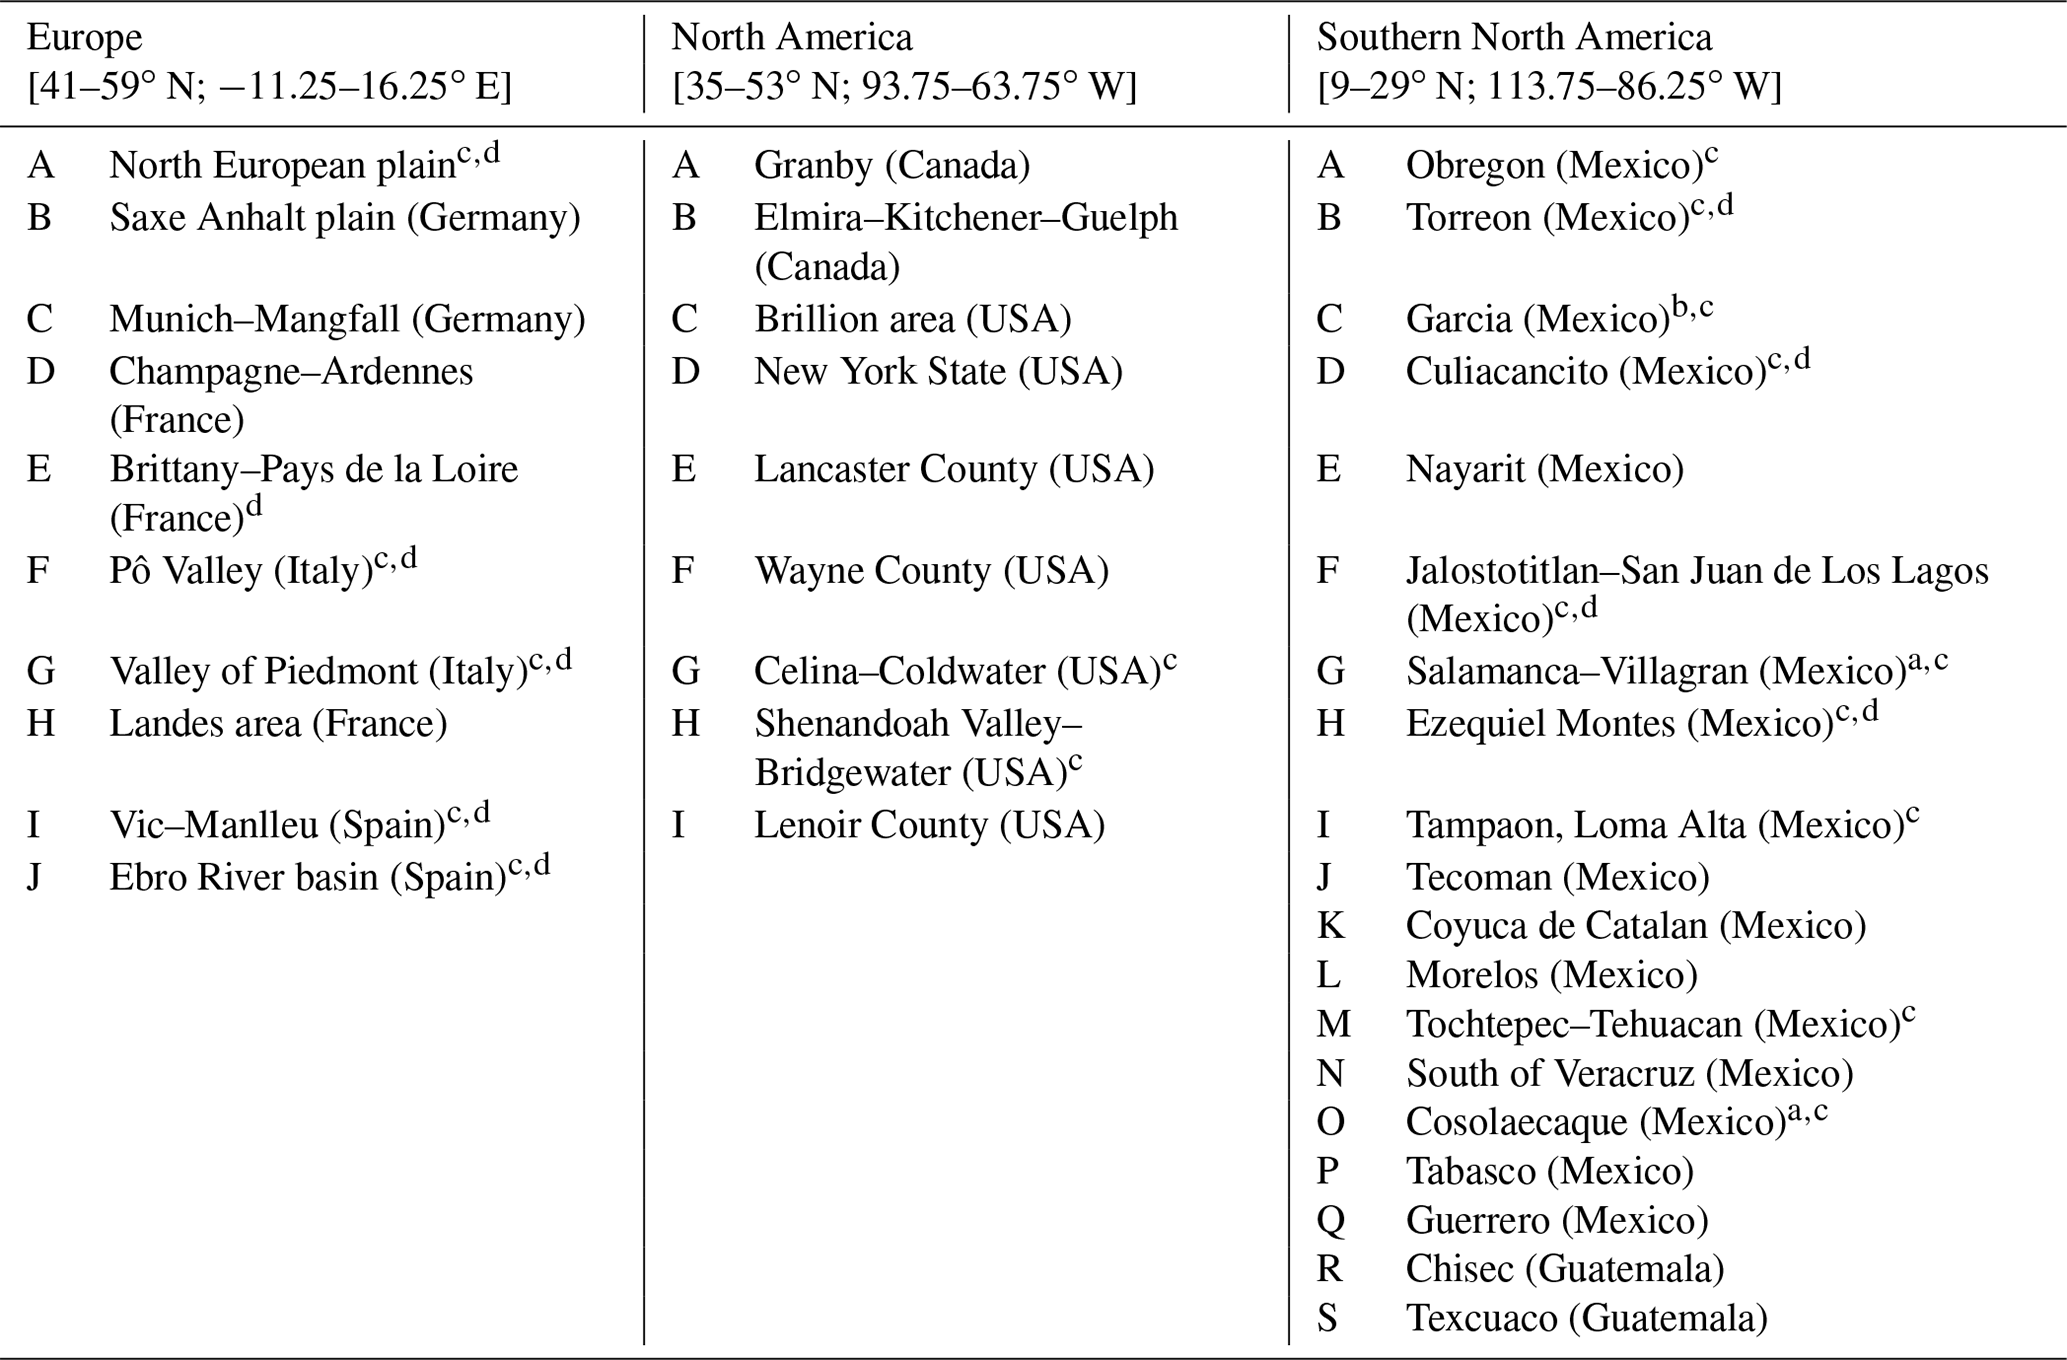
a Fertilizer industry; b soda ash industry; c Van Damme et al. (2018), Clarisse et al. (2019); d Dammers et al. (2019).
Spatiotemporal variabilities in NH3 in the atmosphere in the three regions (Fig. 2) are not expected to be similar: NH3 emissions from industries in the region of southern North America are released all year long, whereas NH3 emissions from agricultural practices (which are dominant over Europe and North America) depend on various surface and meteorological conditions. In order to investigate this, NH3 concentrations using 10 years of IASI observations are assessed against atmospheric temperature and precipitation derived from the ERA5 reanalysis over the three domains in Fig. 3. It shows the seasonal evolution of NH3 from IASI over the three regions (left panel), along with the seasonal evolution of temperature and precipitation (right panel).
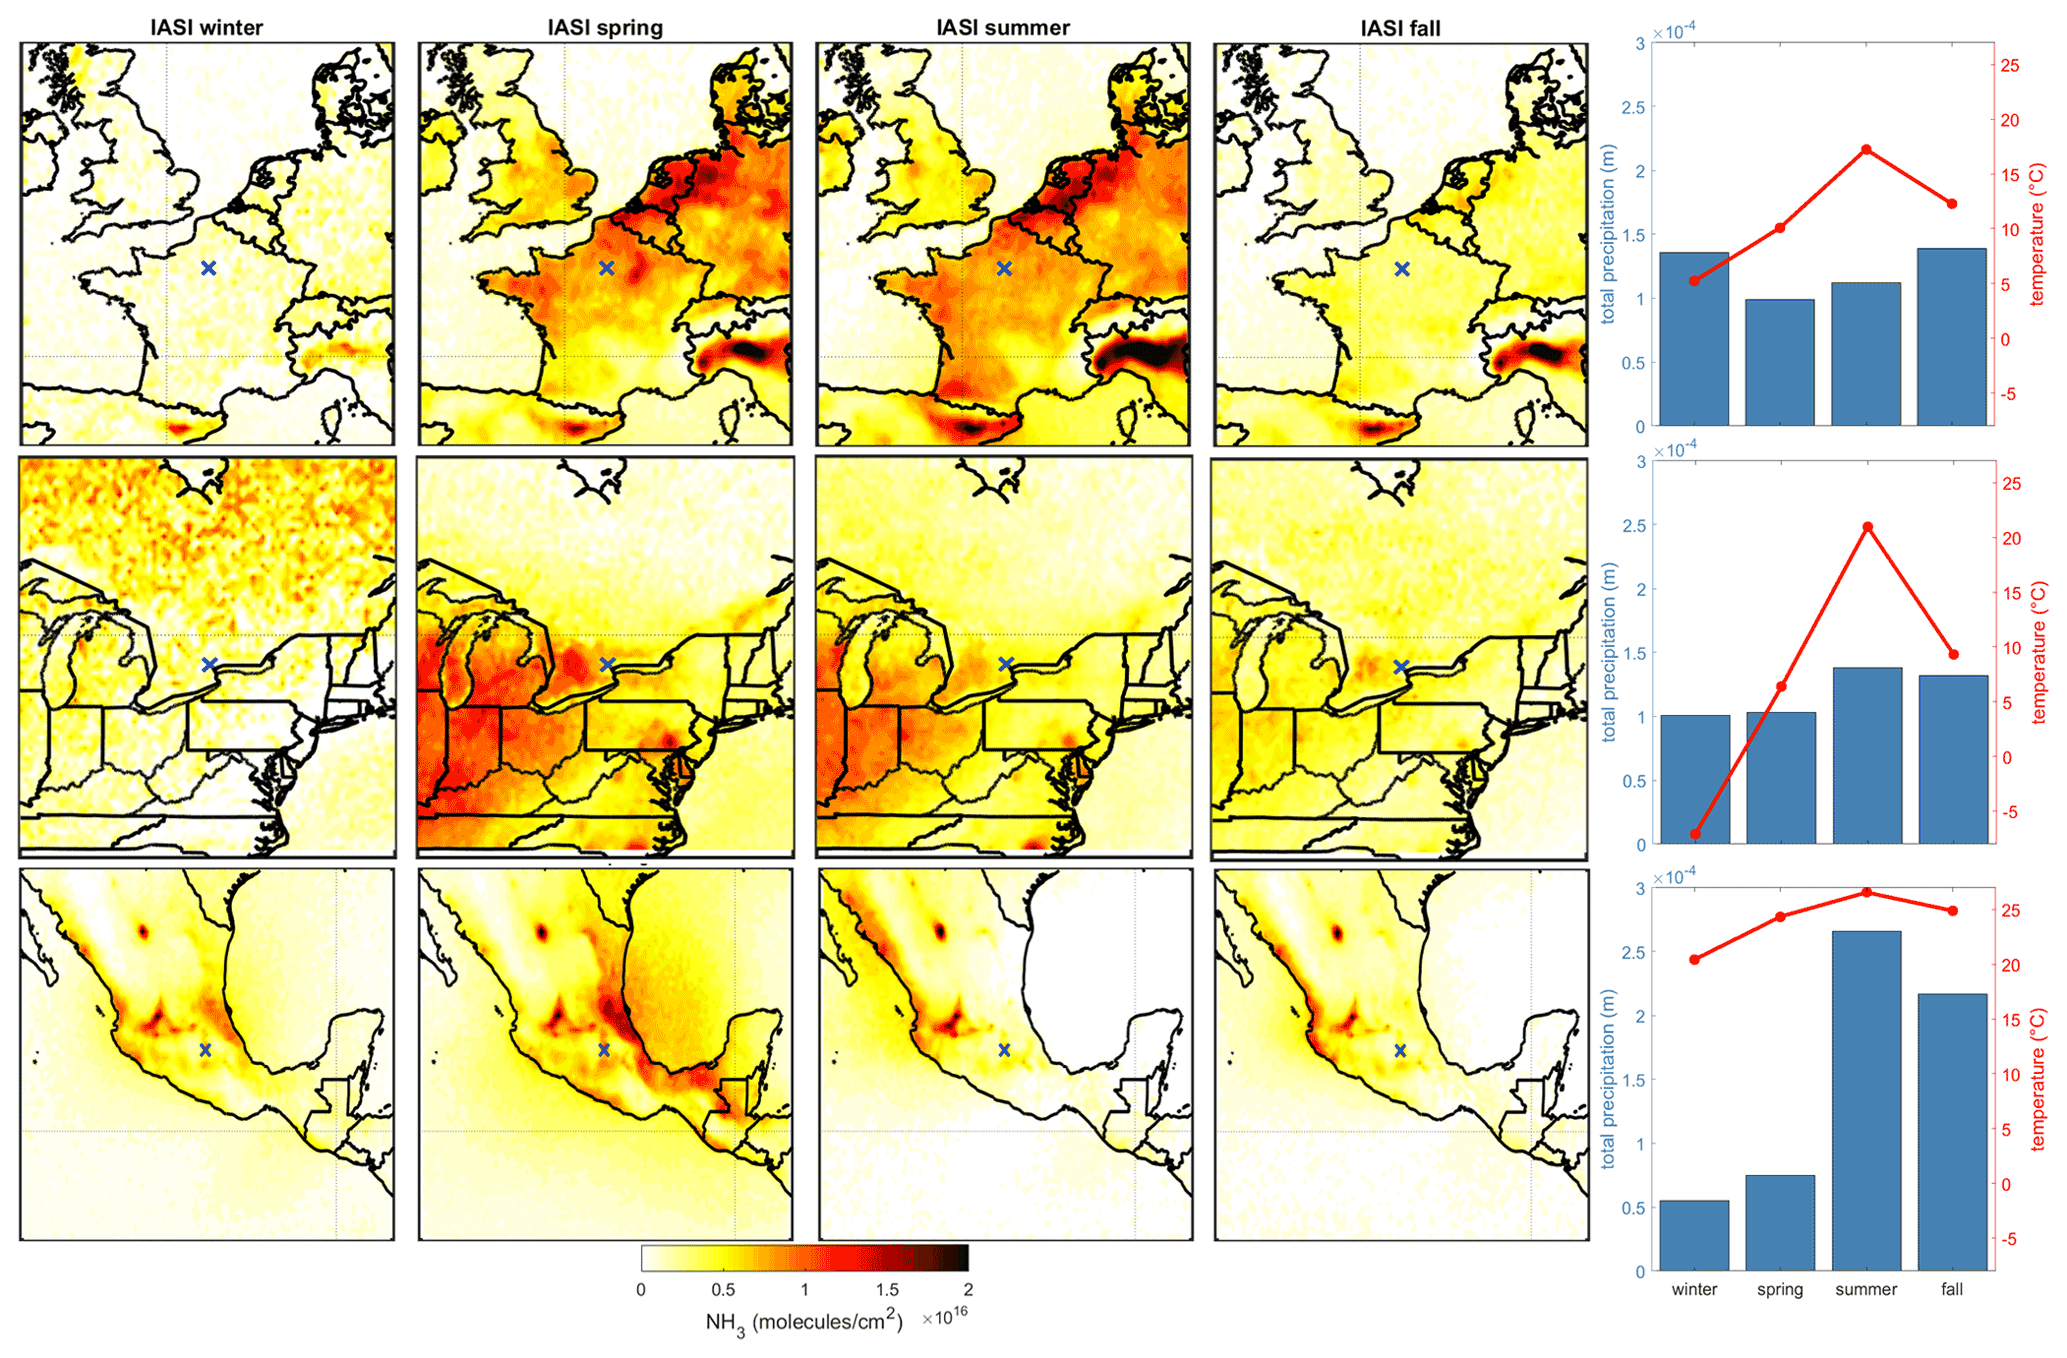
Figure 3Seasonal maps of NH3 total columns (molec. cm−2) derived from 10 years (2008–2017) of IASI observations, along with seasonal means of atmospheric temperature (red line) and precipitation (blue bar chart) over the Europe (upper panels), North America (middle panels), and southern North America (lower panels) regions.
For Europe and North America, NH3 total columns are the highest in spring and summer. In fact, NH3 concentrations over Europe exhibit two seasonal maxima in March and/or April and July and/or August (Fig. S1 in the Supplement), and in North America the maxima are in May and September (Fig. S2). This is consistent with agricultural practices (i.e., fertilizer application) and higher air temperature favoring NH3 volatilization in the atmosphere.
The right panel of Fig. 3 shows how temperature (red lines) and precipitation (blue bars) seasonally evolve over the three regions. In winter, atmospheric temperatures are below 5 ∘C in Europe and North America, and IASI observations reveal almost no NH3 hot spots (Fig. 3, left panel). This can be due to the lack of NH3 abundance, lower volatilization in this temperature range, no agricultural emissions in winter, and/or the reduced sensitivity of the IASI NH3 retrievals in winter (Van Damme et al., 2017). The high value over Canada and the Arctic in winter can be associated with high uncertainties in the NH3 retrievals due to low thermal contrast.
In southern North America, NH3 seasonal variations are less pronounced than in the other two regions. Figure 3 shows that the NH3 concentrations over several sources, such as Torreon and San Juan de Los Lagos (Fig. 2, right panel, boxes B and F), are high during all seasons, which could be associated with the weak seasonal cycle of temperature in this region closer to the Equator.
In spring, seasonal precipitations are the lowest for the three regions. This is reflected in the high NH3 concentrations in the left panel. Over Europe and North America, this can be related to the agricultural spreading practices period and higher atmospheric temperature favoring NH3 volatilization. In southern North America, NH3 concentrations observed by IASI are the highest in spring when atmospheric temperatures are high and precipitation rates are low. In addition, biomass burning, which is often encountered during this period, could explain higher atmospheric NH3 concentrations in spring. NH3 reach maximum values in April and/or May (Fig. S3) just before the start of the rainy season, potentially reducing observed NH3 concentrations due to the wet deposition of atmospheric gaseous ammonia (Asman et al., 1998).
Since in Europe and North America NH3 sources are mostly agriculture related (with small contributions from industries), the temperature and NH3 relationship is expected to be relatively easy to interpret: when the land surface temperature increases, volatilization of ammonia from the fertilized and manured soil is favored, and atmospheric ammonia increases. The corresponding determination factors r2 for this relationship in Europe and North America are 0.85 and 0.80, respectively (polynomial fit of second order). This is not the case in southern North America, in which some of the ammonia sources are also industrial and they contribute greatly to the atmospheric NH3: the concentrations of ammonia are therefore not directly temperature dependent, as we can see in Fig. S4 in the right upper panel in (r2=0.46). There is nonetheless a relationship in southern North America that is due to the fact that we have constant high ammonia sources and temperatures (Fig. 3). In fact, the relationships between NH3 and temperature, on one hand, and precipitation and relative humidity, on the other hand, are not linear; this has been equally shown in a previous study (Sutton et al., 2013).
To further investigate the temperature and NH3 relationship, we show in Fig. 4 the evolution of NH3 with respect to land surface temperature over different subregions of the Europe domain (listed in Table 1). Similar graphics for the North America and southern North America domains are shown in Figs. S5 and S6. We observe a peak of NH3 followed by a local maximum plateau between 10 and 25 ∘C approximately in all of the regions of the Europe domain (Fig. 4). In fact, the NH3 detected in this range of temperature can indicate the fertilizer application period, since most of them (up to 80 %) were detected during the spring and fall seasons. For instance, over the Po Valley (Table 1, region F; Fig. 4), 36 % of the NH3 detected in the bins 10–25 ∘C correspond to the spring season, whereas 35 % correspond to the fall season (not shown). In Celina–Coldwater (Table 1, region G), 82 % of the NH3 detected between 10 and 25 ∘C corresponds to the spring and fall seasons, and the percentage is split equally (Fig. S5).
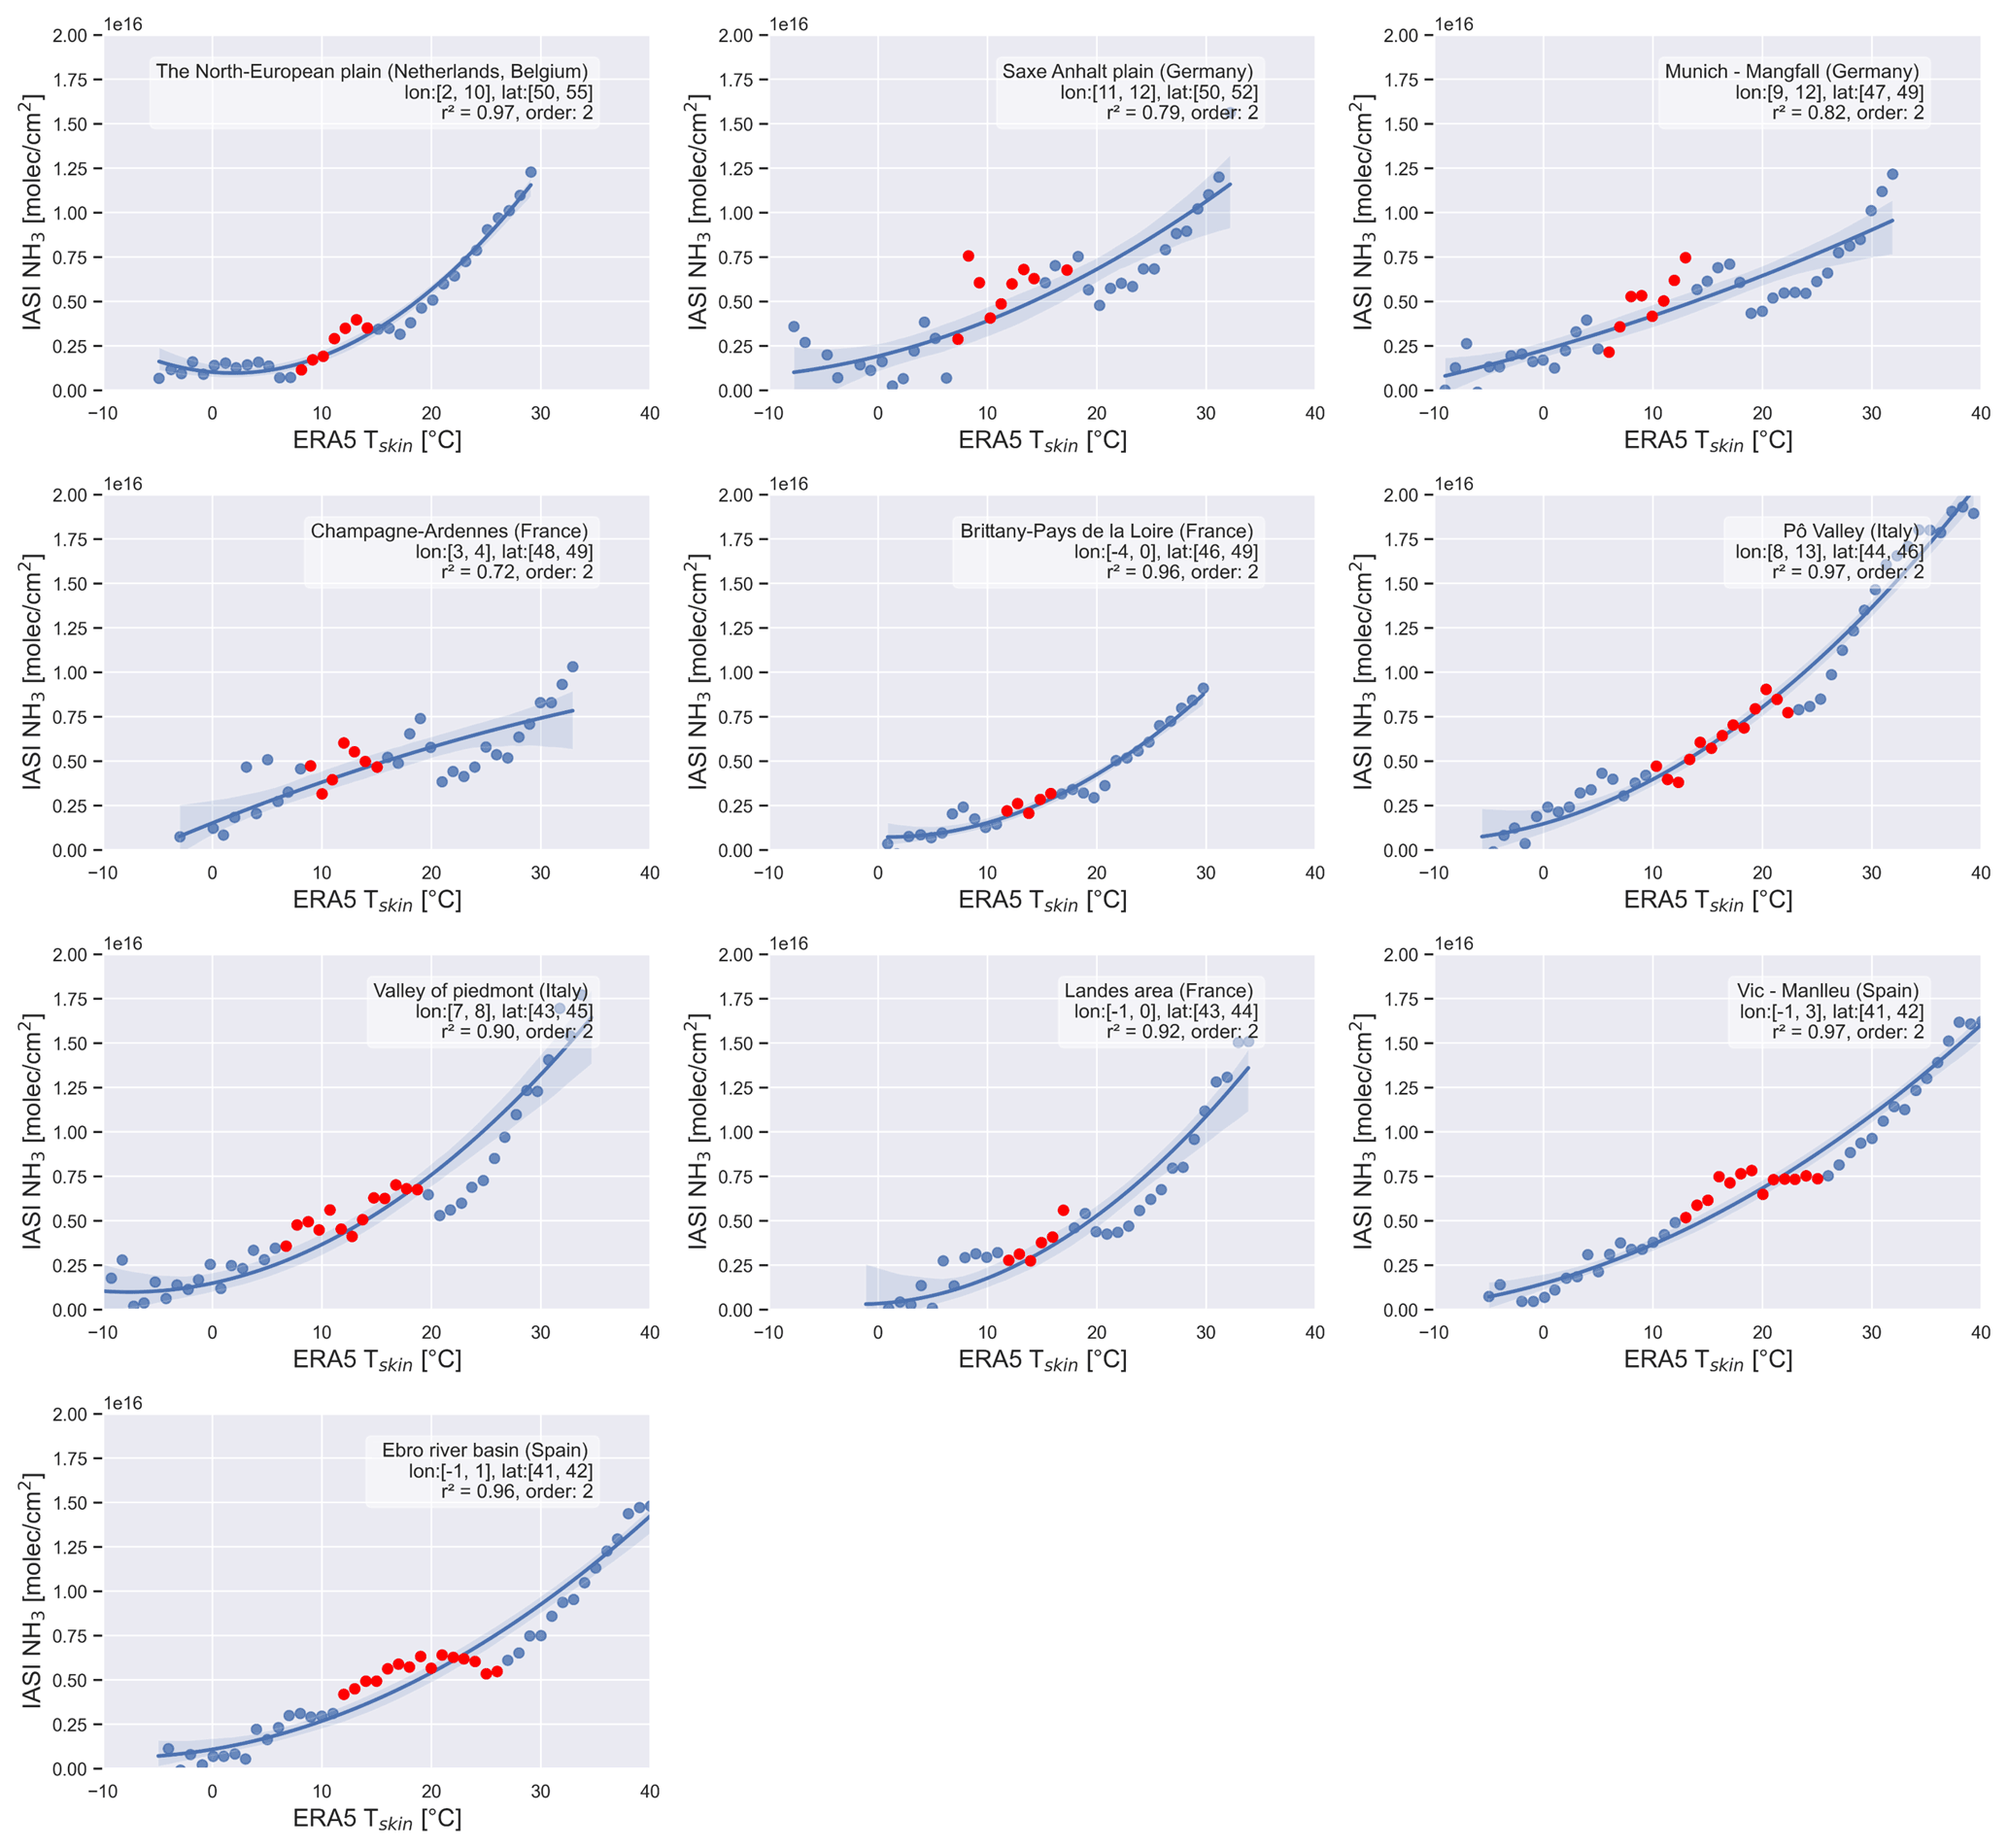
Figure 4Yearly IASI NH3 total columns (molec. cm−2) averaged per bins of ERA5 skin temperatures (∘C), with an interval of 1 ∘C between each consecutive bin. The red circles denote the growing seasons, in which at least 60 % of the NH3 is detected during the March–May and September–November periods. See Fig. 2 and Table 1 for the localization of the subregions around Europe.
We choose to show the subregions in the vicinity of the Europe domain, since they are mostly agricultural sources. The “bumps” corresponding to the fertilizer application are very clear in all of the subregions. This bump was detected to a lower extent for agricultural regions affecting North America (Fig. S5). Over the agricultural regions in the southern North America domain, the bumps are clear in the regions A–D (Fig. S6a). When the seasonal temperatures do not fluctuate during the fertilizer application, any increase in atmospheric NH3 is due to the sudden addition of nitrogen fertilizers to the soil. In southern North America, the regions E–M show that the highest NH3 concentrations were observed as the temperature increased during the growing seasons (Fig. S6). A possible explanation to the resemblance among the regions A –D is that they share similar climate properties (Steppe and Desert), unlike the rest of the subregions in the same domain (tropical and/or subtropical). Since the temperatures in the Europe and southern North America domains are higher (Fig. 3, right panels) in the spring and fall seasons (fertilizer application period) than those in North America, this bump is clearer in the latter. The bumps seen for the Europe regional domain are clearer than those of southern North America, possibly related to the fact that in autumn in Europe precipitation is lower than those in southern North America, leading to lower NH3 loss through wet deposition.
3.2 NH3 budget over Paris, Toronto, and Mexico City
Temperature, relative humidity, and precipitation are not the only factors affecting the NH3 concentrations. In order to analyze the impact of long-range transport on NH3 concentrations measured over (and not domains) of Paris, Toronto, and Mexico City, HYSPLIT back trajectories have been used. For each day of IASI NH3 observations made in a 50 km radius circle from the city center, a 24 h back trajectory has been performed from 2008 to 2017. There are between 3643 and 4008 back trajectories for Paris, Toronto, and Mexico City. Then, a seven-cluster analysis has been applied to these datasets and NH3 mean concentrations measured inside the cities by IASI have been allocated to the different mean cluster trajectories according to the corresponding back trajectories. Details about this analysis are described in Fig. S7. The result is shown in Fig. 5.
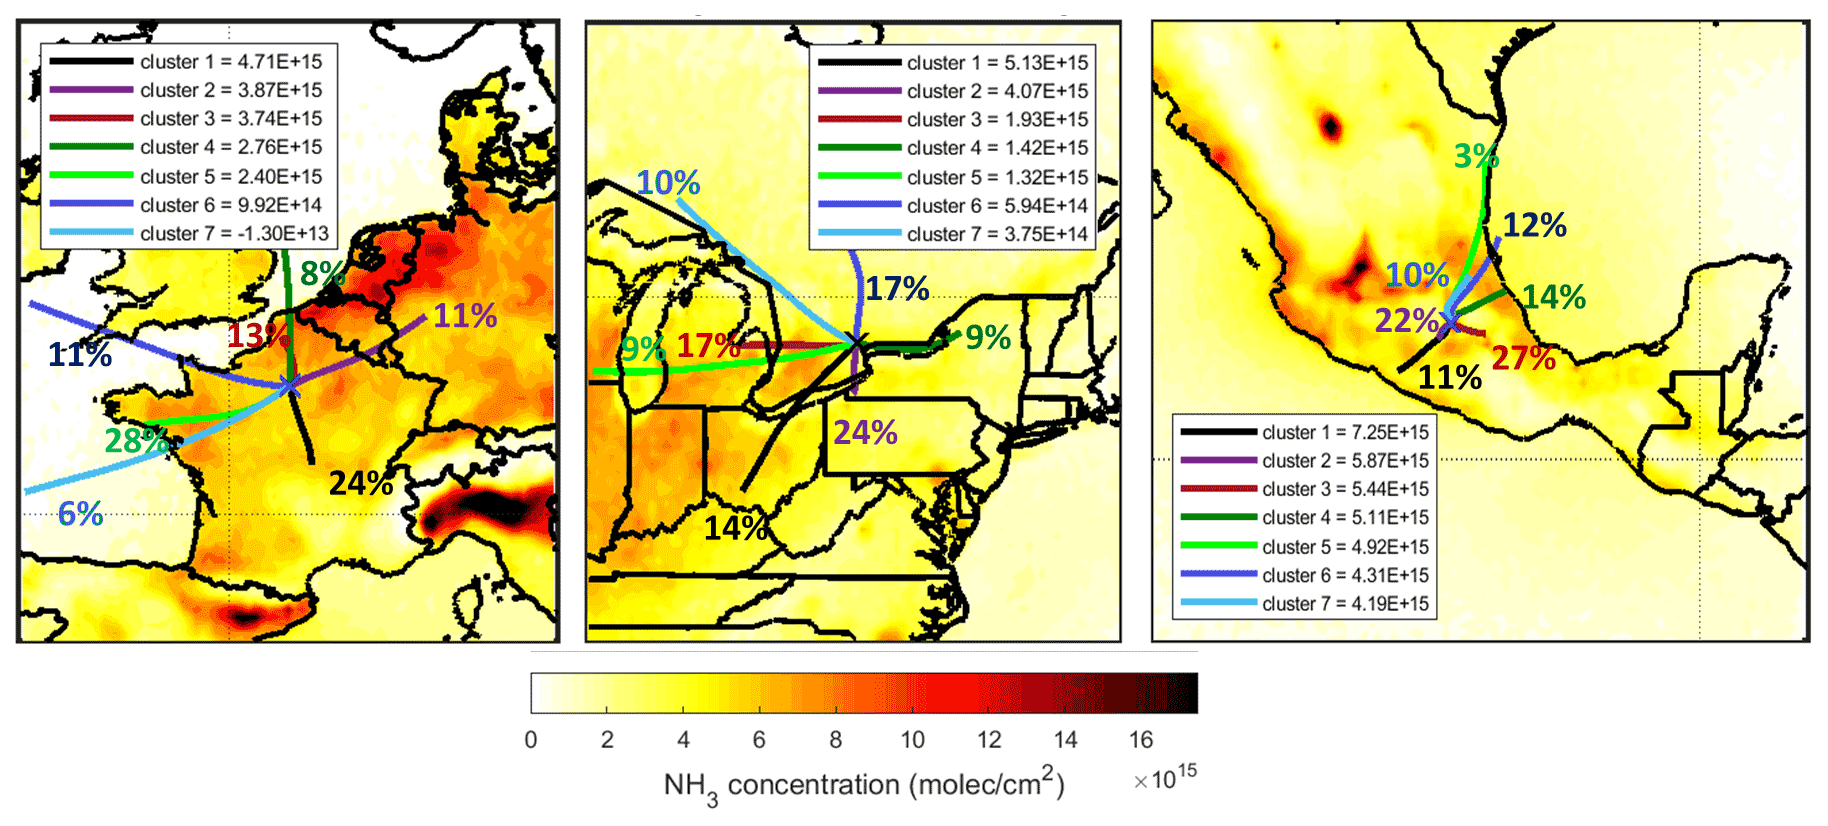
Figure 5Seven cluster–mean backward trajectories over the Europe, North America, and southern North America regions for the whole time period between 2008 and 2017. Back trajectories are color coded in function of the corresponding NH3 concentrations measured inside the cities. The numbers indicate the percentage of trajectories allocated to a cluster.
For Paris, 25 % of all back trajectories (875) that are associated with the highest NH3 concentrations, i.e., 4.71×10¹⁵ molec. cm−2 on average, originate from the surrounding south regions (Fig. 5, black line). Clusters 2 and 3 are also associated with high NH3 concentrations and come from the north/northeast. This is consistent with previous analyses using HYSPLIT (Viatte et al., 2020) and FLEXPART models (Viatte et al., 2021). As expected, the back trajectories coming from the ocean are related with almost no NH3 concentrations (left panel, light and dark blue lines).
Over Toronto, the highest NH3 concentrations (24 % and 14 %) measured in the city are allocated to long-range transport located south/southwest (Fig. 5, middle panel, black and purple lines) coming from the United States where most of the feedlots are. Of NH3 concentrations, 9 %–17 % come from the west and the east of Toronto (clusters 3–5) where atmospheric NH3 has increased in the past decade possibly due to the reduced chemical loss of atmospheric NH3 to form particulate NH (Fig. 2, boxes A and B; Yao and Zhang, 2019). The two back-trajectory clusters that are related to low NH3 concentrations come from the north (Fig. 5, light and dark blue lines) where no NH3 sources have been identified.
In the southern North America domain, back trajectories come from relatively close regions since orographic conditions around Mexico City limit long-range transport. In this city, as shown in the right panel of Fig. 5, the highest NH3 concentrations are associated with air masses coming from the southwest (11 %, black line; 22 %, purple line) and southeast (27 %, red line). Air parcels coming from the north are associated with relatively low NH3 concentrations measured in Mexico City.
3.3 Pollution events over Paris, Toronto, and Mexico City from 2008 to 2017
After assessing the NH3 distribution under average climate conditions, we focus now on pollution events occurring at the three cities. These events are identified by applying the Fourier series of order 3 (Yamanouchi et al., 2021; Herrera et al., 2022) on the surface PM2.5 and satellite NH3 observations at the city scale (i.e., 50 km radius circle from the city centers). The Fourier fit accounts for the “natural” variability (seasonality) in the time series and helps identify pollution events that are 2 standard deviations above this natural variability. It is a robust method commonly used to quantify trends and identify enhancements in long-term time series (Zellweger et al., 2009). Pollution events occurrence per city per year and per season are shown in Fig. 6a and b, respectively.
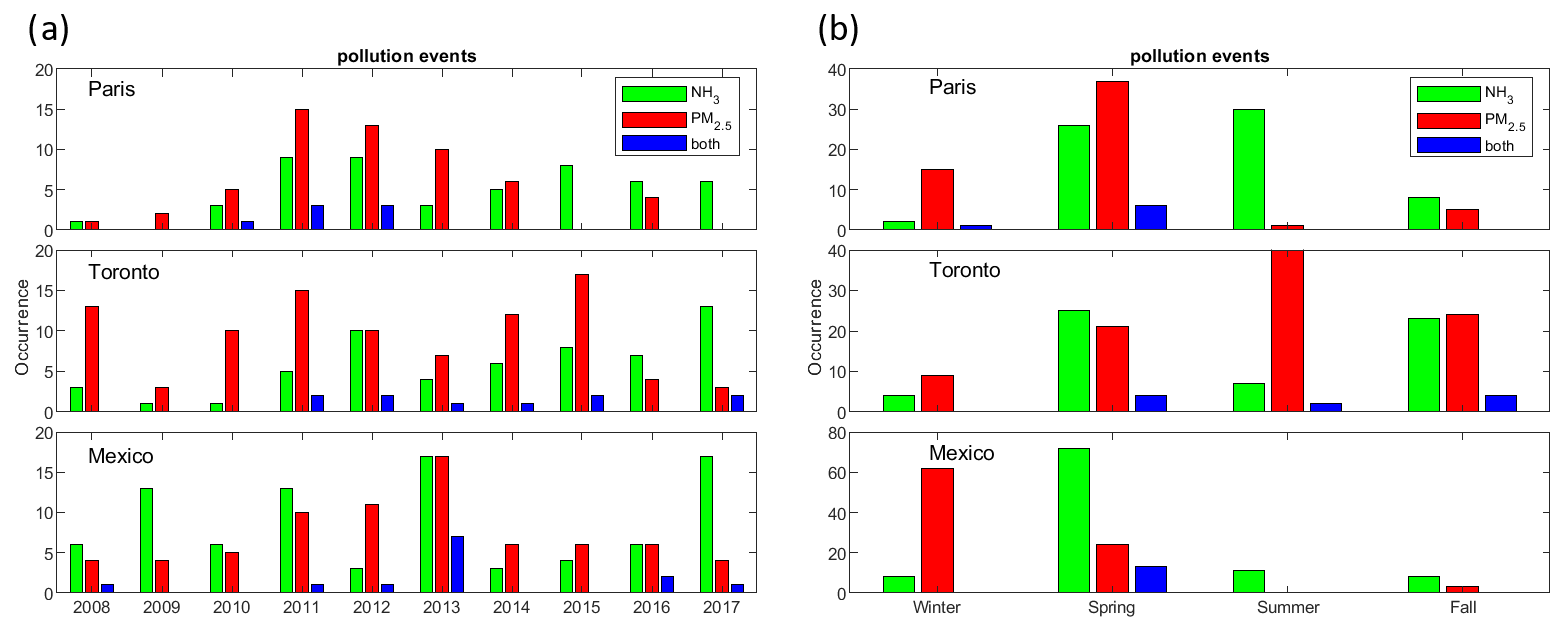
Figure 6Annual (a) and seasonal (b) occurrence of pollution events of NH3 (green bars), PM2.5 (red bars), and NH3 and PM2.5 simultaneously (blue bars) detected from 2008 to 2017 in Paris (upper panel), Toronto (middle panel), and Mexico City (lower panel).
The figure shows that NH3 pollution episodes are found to be annually frequent in the three cities. In Toronto and Mexico City, PM2.5 pollution events are encountered annually (with higher numbers in Mexico City), whereas no events are detected in 2009, 2015, and 2017 in Paris.
Numbers of identified days of PM2.5 pollution events are 88, 58, and 50 in Mexico City, Toronto, and Paris, respectively. For NH3 pollution events, they occur more in Toronto than in Mexico City and Paris, with number of days of 94, 73, and 56, respectively. Common days of high NH3 and PM2.5 concentrations are found in all three cities, especially in spring (Fig. 6b), coinciding with the high seasonal NH3 concentrations shown in Fig. 3.
To further investigate the impact of transport on pollution events occurring in the three cities, we have analyzed the wind fields patterns for different cases: (i) the whole dataset (i.e., ensemble 2008–2017), (ii) days of NH3 and PM2.5 pollution events occurring separately, and (iii) days when high concentrations for both are observed. Figure 7 shows wind roses computed for the ensemble and these different types of pollution events (i.e., PM2.5, NH3, and both occurring during the same day). The radial distance in the wind roses indicates the frequency of the wind direction occurrence. In general, wind speed is lower in Mexico City (max 3 m s−1) compared with Toronto and Paris (up to 10 m s−1) because of the mountainous topography that blocks and slows air masses exchange in Mexico.
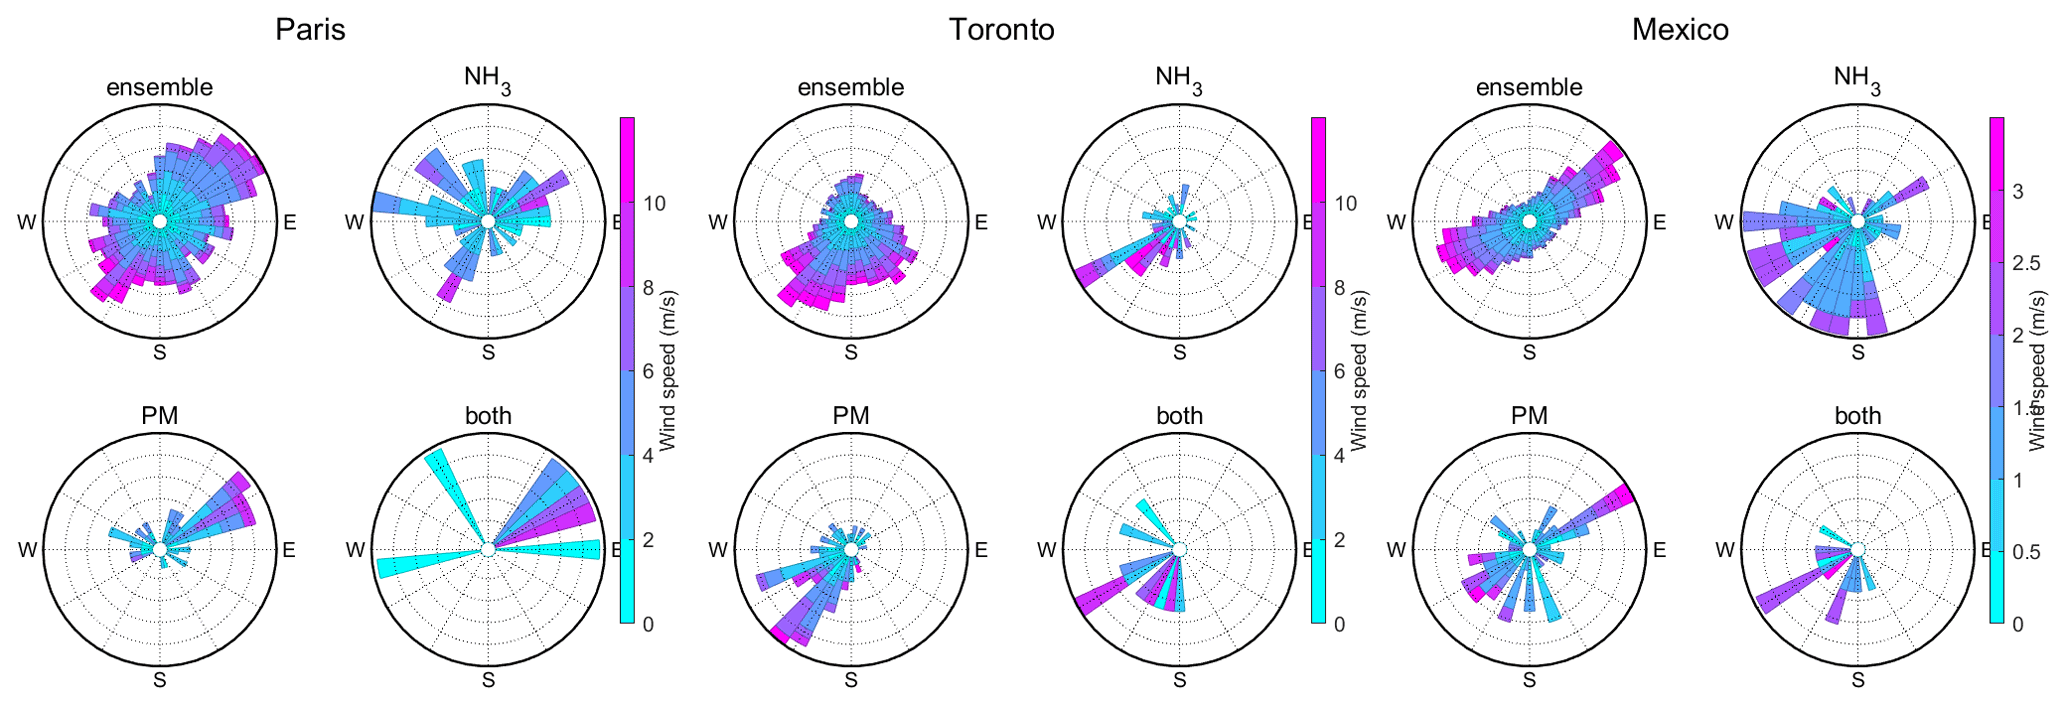
Figure 7Wind roses corresponding to the ensemble of all observations, the NH3, PM2.5, and both NH3 and PM2.5 simultaneous pollution events, derived from 2008 to 2017 over Paris (left panels), Toronto (middle panels), and Mexico City (right panels).
In Paris, the ensemble wind roses show a dominant northeast/southwest pattern. NH3 pollution events are associated with wind coming from various directions at all wind speeds, which was suggested by the HYSPLIT cluster analysis (Fig. 5), whereas PM2.5 events are present mainly under high northeast wind. When both NH3 and PM2.5 high concentrations are observed in Paris, the wind field can have two patterns: low wind speed coming from all directions (except the south) or high wind speed coming from the northeast. This confirms the importance of transport of NH3 and PM2.5 from the northeast and could suggest the interconversion of PM2.5 to NH3 at low wind speed.
In Toronto, the ensemble show that dominant wind pattern is coming from the south. For all the pollution events (NH3, PM2.5, and both) the wind is coming from the southwest, confirming the long-range transport of pollutants from the United States.
In Mexico City, the dominant pattern (ensemble) is southwest/northeast wind fields. For days of NH3 pollution events, wind mainly comes from the south/southwest, and for PM2.5, wind comes from all directions with a significant northeast wind pattern. Days of both pollution events are associated with wind coming from the west/southwest only.
3.4 Case study: NH3 and PM2.5 concentrations comparison with the GEOS-Chem model in March 2011
The occurrence of pollution events varies from year to year (Fig. 6). However, in 2011, all three cities experienced PM2.5 and NH3 separate and combined pollution events. For this reason, GEOS-Chem model simulations were performed in March 2011 to interpret the events and evaluate the model performance.
Spatial and temporal coincidence criteria have been applied to GEOS-Chem outputs to compare with IASI morning observations. For example, model outputs between 08:30 and 11:30 UTC coincident with IASI overpasses have been selected, and only collocated model outputs (at 0.5∘ × 0.625∘ horizontal resolution) have been selected coincident with IASI observations. Averages of numbers of coincident observations are 1324, 1138, and 3000 over the Europe, North America, and southern North America domains of study during March 2011.
Figure 8 shows the 1-month comparison between the two datasets. Over the regional domains, the coefficient of correlation between daily model NH3 concentrations and IASI NH3 observations are R=0.50, R=0.55, and R=0.33, over Europe, North America, and southern North America, respectively, with related p values < 0.01. NH3 columns derived from the GEOS-Chem model are overall underestimated with mean relative difference (MRD = (model − observations)observations) of −37 %, −31 %, and −2 % over Europe, North America, and southern North America, respectively.
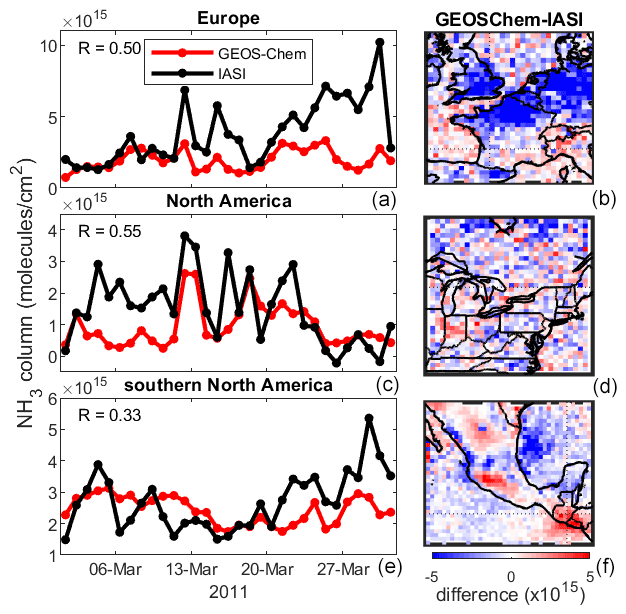
Figure 8(a, c, e) Time series of daily NH3 columns derived from IASI (black lines) and the GEOS-Chem model (red lines) over Europe (a), North America (c), and southern North America (e). (b, d, f) Maps of NH3 columns (in molec. cm−2) differences between IASI and GEOS-Chem model (model observations) for March 2011.
Over Europe and North America, IASI and GEOS-Chem capture some of the same pollution events (on 12, 15, and 30 March over Europe, and 12, 13, and 18 March over North America). In southern North America, the underestimation of the GEOS-Chem NH3 columns is less pronounced (MRD is −2 %) than in the other regions, but the day-to-day variability is not well represented in the model.
The GEOS-Chem model NH3 total columns are lower than those from IASI in March 2011 over specific locations in the southern North America and Europe domains (Fig. 8b, d, f). For the Europe region, GEOS-Chem NH3 columns are smaller than the IASI ones over the north of France, Belgium, the Netherlands, north of Spain (in particular sources A–E, I, and J of Fig. 2) and the United Kingdom. For the southern North America domain, GEOS-Chem NH3 columns are smaller than the IASI ones over the western Mexican coast (sources A, D, E, and J of Fig. 2 and Table 1), central (sources F, G, and H of Fig. 2) and southeastern (sources O and P of Fig. 2) Mexico City, and over the Pacific Ocean, whereas they are higher in Guatemala (sources S and R of Fig. 2) and west of Mexico City.
Over the North America domain, spatial distribution of the differences between NH3 columns derived from GEOS-Chem and IASI are less pronounced than in the Europe and southern North America domains. IASI NH3 columns are smaller than GEOS-Chem outputs over the southern United States and over Lancaster County, Pennsylvania (sources E and I of Fig. 2), and higher over Indiana (both in the United States).
At the city scale of Paris and Mexico City, the daily model NH3 columns are in relatively good agreement with IASI observations within a 50 km radius circle from the city centers (not shown here), since the coefficients of correlation are R=0.42 and R=0.52, respectively. Similar to the regional domains, GEOS-Chem NH3 columns are relatively underestimated at the city scale of Paris and Mexico City, with an MRD of −108 % and −28 %. At the city scale of Toronto, the correlation between the NH3 columns derived from the model and observed by IASI is poor, with a coefficient of correlation of , and a small underestimation of the modeled NH3 concentrations is found with an MRD of −6 %.
Local comparison of PM2.5 concentrations at the city scale (over Paris, Toronto, and Mexico) is shown in Fig. 9a, c, and e, which show that PM2.5 concentrations calculated by the model in March 2011 are in relatively better agreement with the surface observations with R=0.63, R=0.43, and R=0.54 in Paris, Toronto, and Mexico City. In Paris and Mexico City, PM2.5 concentration values derived from the observations are overall higher than the GOES-Chem concentrations with MRD values of −13 % and −20 %, respectively, whereas GEOS-Chem PM2.5 concentrations are higher than those in the observations in Toronto with an MRD value of 519 %.
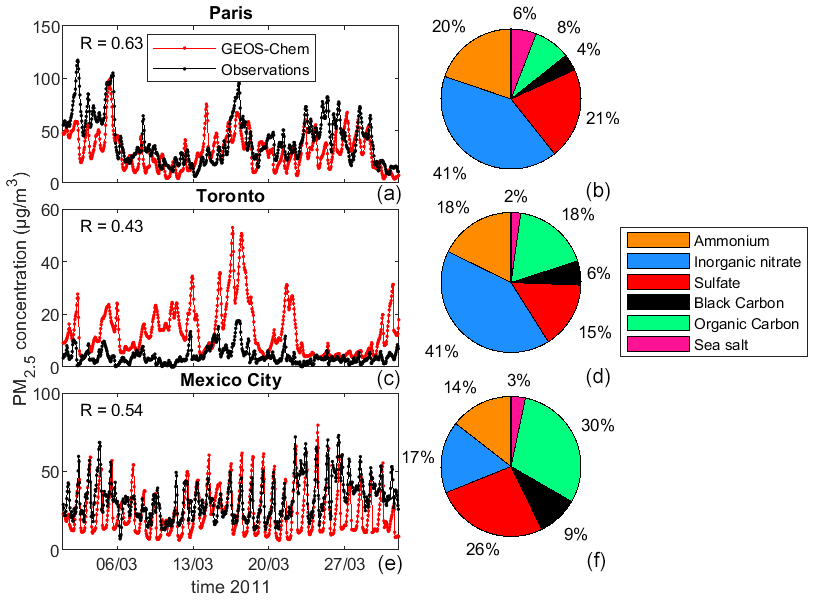
Figure 9(a, c, e) Time series of hourly PM2.5 (µg m−3) derived from surface observations (black lines) and the GEOS-Chem model (red lines) over Paris (a), Toronto (c), and Mexico City(e) for March 2011. (b, d, f) PM2.5 speciation (% in total mass) derived from the GEOS-Chem run for March 2011.
Figure 9b, d, and f show the chemical composition of the PM2.5 from GEOS-Chem and inform us about the different pollution sources. Organic matter sources are split equally between the primary emissions and the oxidation of volatile organic compounds (Day et al., 2015). The SNA (sum of sulfate, nitrate, and ammonium) sources originate in chemical transformation of gaseous precursors in the atmosphere, whereas black carbon comes from primary emissions of industrial and traffic combustion.
According to the GEOS-Chem model, SNA dominates the PM2.5 chemical composition mass in March 2011 over the three cities, meaning that the dominant source of PM2.5 mass comes from the secondary oxidation path. This partition of SNA in March 2011 from the model is higher than what has been reported based on 1-year measurements performed in 2013: 43 %, 42 %, and 33 % of the PM2.5 mass composition in Paris, Toronto, and Mexico City, respectively (Cheng et al., 2016).
In Paris, the March 2011 pollution episode has been analyzed in terms of geographical origins and aerosol properties (Chazette and Royer, 2017) but not in terms of aerosol speciation.
Comparing the GEOS-Chem outputs used in this study with 2 years of observations of aerosol chemical composition in Paris (2011–2013) (Petit et al., 2015), we found that the sulfate component is slightly higher in the GEOS-Chem model than in the springtime observations (21 % compared with 11 %), whereas modeled organic carbon is lower than the observations (8 % compared with 33 %). This springtime underestimation of organics in atmospheric models has previously been reported in Paris (Sciare et al., 2010; Petit et al., 2015; Lanzafame et al., 2021) and could be associated with an underestimation of the organic matter emissions from residential contributions (Denier van der Gon et al., 2015). Regarding the secondary aerosol, observations in Paris during the March 2015 pollution event show that it accounts for more than 50 % of the PM concentration (Petit et al., 2017), which is in agreement with the SNA partition in our GEOS-Chem model simulation.
In Toronto, PM2.5 speciation is monitored by the National Air Pollution Surveillance Program (NAPS; https://www.canada.ca/en/environment-climate-change/services/air-pollution/monitoring-networks-data/national-air-pollution-program.html, last access: 29 September 2022) network. Observations in March 2011 reveal that inorganic nitrate burden is overestimated by a factor of 2 in the GEOS-Chem run (41 % in the model compared with 20 % in the observations), whereas sulfate and black carbon abundances are underestimated by a factor of 2 (15 % and 6 % in the model compared with 27 % and 12 % in the observations).
In Mexico City, the organic matter represents the most abundant fraction of the aerosol, which is consistent with measurements made during several campaigns performed in the dry season of 2006 during the Megacity Initiative: Local And Global Research Observations (MILAGRO; Molina et al., 2010; Karydis et al., 2011) and Aerosoles en Ciudad Universitaria (ACU) in 2015 (Salcedo et al., 2018). Observations performed during the dry and warm season of 2019 reported that SNA correspond to 30 % of the aerosol mass concentration (Retama et al., 2022), which is consistent with what has been reported before (Cheng et al., 2016) and the chemical composition modeled in our study. The organic fraction is found to be dominant in the observations (Retama et al., 2022) as suggested in the GEOS-Chem model over Mexico City. Daily cycles appear exaggerated in the model with maxima well represented and minima greatly underestimated. This could suggest model issues in terms of atmospheric dynamics (removal and transport or planetary boundary layer dynamics) due to coarseness of grid.
The AmmonAQ project aims to determine the impact of intensive agricultural practices on urban pollution in the Paris, Toronto, and Mexico metropolitan areas. For this purpose, PM2.5 and NH3 measurements from in situ instruments and satellite infrared spectrometers, and atmospheric model simulations, have been combined.
Using 10 years of IASI observations, NH3 source regions have been identified. All of the sources are from the agricultural sector (husbandry and fertilizer application) in the Europe and North America domains, whereas some of them are industrial in the southern North America region. Consequently, the spatiotemporal variability of NH3 is different, with stronger seasonal variabilities in Europe and North America. A strong correlation is found between NH3 total columns and surface temperature (Tskin) for all regions, with higher correlation over agricultural regions, and when the temperature seasonal cycle is pronounced. We find that the timing of the fertilizer application can be detected through local maxima in the NH3 and Tskin relationship curve.
According to HYSPLIT cluster analysis, the highest NH3 concentrations measured at the city scale are associated with air masses coming from the surrounding regions: the north/northeast of Paris, the south/southwest of Toronto, and the southeast/southwest of Mexico City. These air masses lead to the exacerbation of the degradation of air quality in each of the three cities.
Pollution episodes are found to be annually frequent at the three cities, especially in spring when high NH3 and PM2.5 are observed. In Paris and Mexico pollution is transported along the northeast/southwest line, whereas in Toronto the transboundary transport of pollutants from the United States is dominant during pollution events.
The evaluation of the GEOS-Chem outputs in March 2011 reveals that NH3 concentrations are overall underestimated by the model at the regional scale, with, however, a good representability of the day-to-day variability in Europe and North America domains. NH3 columns derived from IASI and the GEOS-Chem model exhibit substantial spatial differences in the Europe and southern North America areas. In terms of PM2.5 concentrations at the city scale, we show that they are underestimated in Paris and Mexico City but overestimated in Toronto.
The IASI thermal infrared remote sensors have proved to be valuable to monitor pollution events over cities. The main limitations are associated with the low revisit time (at the beginning and end of the day), the lack of sensitivity to the surface in particular in winter, and the fact that some areas are not well covered during cloudy scenes. In the near future the next generation of instruments will have improved capabilities to sound deeper in the atmosphere (Crevoisier et al., 2014). The IRS-MTG satellite instrument that should be launched in 2024 in geostationary orbit will offer the capacity to enhance this research over Europe thanks to better temporal (measurements every 30–45 min) and spatial (4 km × 4 km pixel) resolution.
The near-real-time IASI NH3 (ANNI NH3-v3) data used in this study are freely available through the Aeris database https://iasi.aeris-data.fr/nh3r-era5/ (Van Damme et al., 2021). All hourly observations of PM2.5 concentrations are available from the Airparif network (https://data-airparif-asso.opendata.arcgis.com/, Airparif, 2022), the Ministry of the Environment, Conservation and Parks of Ontario (http://www.airqualityontario.com/, Ministry of the Environment, Conservation and Parks, 2022), and the Red Automática de Monitoreo Atmosférico (RAMA, http://www.aire.cdmx.gob.mx/default.php?opc='aKBh', Gobierno de la ciudad de México, 2022) network. The GEOS-Chem outputs are currently available upon request. All MATLAB/PYTHON codes used to create any of the figures and/or to create the underlying data are available upon request.
The supplement related to this article is available online at: https://doi.org/10.5194/acp-22-12907-2022-supplement.
CV, CC, SY, and KS designed the AmmonAQ project. MVD and LC provided the IASI data. WCP provided the GEOS-Chem outputs. CV and RA analyzed the data. CV, RA, and SS wrote the manuscript draft. BH, MG, KS, PFC, and CC reviewed and edited the manuscript.
The contact author has declared that none of the authors has any competing interests.
Publisher’s note: Copernicus Publications remains neutral with regard to jurisdictional claims in published maps and institutional affiliations.
The MERRA-2 data used in this study have been provided by the Global Modeling and Assimilation Office (GMAO) at NASA Goddard Space Flight Center.
AmmonAQ results from a joint research program between CNRS (National Center for Scientific Research of France) and the University of Toronto which funded 1 year of common research in 2019. Research at ULB was supported by the Belgian State Federal Office for Scientific, Technical and Cultural Affairs (Prodex HIRS) and the Air Liquide Foundation (TAPIR project). Lieven Clarisse is a research associate supported by the Belgian F.R.S.-FNRS. This project has received funding from the European Research Council (ERC) under the European Union's Horizon 2020 and innovation programme (grant agreement no. 742909, IASI-FT advanced ERC grant).
This paper was edited by Jeffrey Geddes and reviewed by two anonymous referees.
Abeed, R., Clerbaux, C., Clarisse, L., Van Damme, M., Coheur, P.-F., Safieddine, S.: A space view of agricultural and industrial changes during the Syrian civil war, Elementa, 9, 000041, https://doi.org/10.1525/elementa.2021.000041, 2021.
Airparif: Les données ouvertes de qualité de l'air en Île-de-France, Airparif [data set], https://data-airparif-asso.opendata.arcgis.com/, last access: 29 September 2022.
Asman, W., Sutton, M. A., and Schjørring, J. K.: Ammonia: emission, atmospheric transport and deposition, New Phytol., 139, 27–48, 1998.
Behera, S. N., Betha, R., and Balasubramanian, R.: Insights into Chemical Coupling among Acidic Gases, Ammonia and Secondary Inorganic Aerosols, Aerosol Air Qual. Res., 13, 1282–1296, https://doi.org/10.4209/aaqr.2012.11.0328, 2013.
Bey, I., Jacob, D. J., Yantosca, R. M., Logan, J. A., Field, B. D., Fiore, A. M., Li, Q., Liu, H. Y., Mickley, L. J., and Schultz, M. G.: Global modeling of tropospheric chemistry with assimilated meteorology: Model description and evaluation, J. Geophys. Res.-Atmos., 106, 23073–23095, https://doi.org/10.1029/2001JD000807, 2001.
Bittman, S., Sheppard, S. C., and Hunt, D.: Potential for mitigating atmospheric ammonia in Canada, Soil Use Manage, 33, 263–275, https://doi.org/10.1111/sum.12336, 2017.
Bouwman, A. F., Lee, D. S., Asman, W. A. H., Dentener, F. J., Van Der Hoek, K. W., and Olivier, J. G. J.: A global high-resolution emission inventory for ammonia, Global Biogeochem. Cy., 11, 561–587, https://doi.org/10.1029/97GB02266, 1997.
Bressi, M., Sciare, J., Ghersi, V., Mihalopoulos, N., Petit, J.-E., Nicolas, J. B., Moukhtar, S., Rosso, A., Féron, A., Bonnaire, N., Poulakis, E., and Theodosi, C.: Sources and geographical origins of fine aerosols in Paris (France), Atmos. Chem. Phys., 14, 8813–8839, https://doi.org/10.5194/acp-14-8813-2014, 2014.
Chazette, P. and Royer, P.: Springtime major pollution events by aerosol over Paris Area: From a case study to a multiannual analysis, J. Geophys. Res.-Atmos., 122, 8101–8119, https://doi.org/10.1002/2017JD026713, 2017.
Cheng, Z., Luo, L., Wang, S., Wang, Y., Sharma, S., Shimadera, H., Wang, X., Bressi, M., de Miranda, R. M., Jiang, J., Zhou, W., Fajardo, O., Yan, N., and Hao, J.: Status and characteristics of ambient PM2.5 pollution in global megacities, Environ. Int., 89–90, 212–221, https://doi.org/10.1016/j.envint.2016.02.003, 2016.
Clarisse, L., Shephard, M. W., Dentener, F., Hurtmans, D., Cady-Pereira, K., Karagulian, F., Van Damme, M., Clerbaux, C., and Coheur, P.-F.: Satellite monitoring of ammonia: A case study of the San Joaquin Valley, J. Geophys. Res., 115, D13302, https://doi.org/10.1029/2009JD013291, 2010.
Clarisse, L., Van Damme, M., Clerbaux, C., and Coheur, P.-F.: Tracking down global NH3 point sources with wind-adjusted superresolution, Atmos. Meas. Tech., 12, 5457–5473, https://doi.org/10.5194/amt-12-5457-2019, 2019.
Clerbaux, C., Boynard, A., Clarisse, L., George, M., Hadji-Lazaro, J., Herbin, H., Hurtmans, D., Pommier, M., Razavi, A., Turquety, S., Wespes, C., and Coheur, P.-F.: Monitoring of atmospheric composition using the thermal infrared IASI/MetOp sounder, Atmos. Chem. Phys., 9, 6041–6054, https://doi.org/10.5194/acp-9-6041-2009, 2009.
CITEPA: Inventaire des émissions de polluants atmosphériques en France métropolitaine, format CEE-NU, Référence CITEPA no. 1505NFR/2018|UNECE_France_mars2018_encours.docx, https://cibe.fr/wp-content/uploads/2018/08/2018-CITEPA-Inventaire-émissions-polluants.pdf (last access: 29 September 2022), 2018.
Crevoisier, C., Clerbaux, C., Guidard, V., Phulpin, T., Armante, R., Barret, B., Camy-Peyret, C., Chaboureau, J.-P., Coheur, P.-F., Crépeau, L., Dufour, G., Labonnote, L., Lavanant, L., Hadji-Lazaro, J., Herbin, H., Jacquinet-Husson, N., Payan, S., Péquignot, E., Pierangelo, C., Sellitto, P., and Stubenrauch, C.: Towards IASI-New Generation (IASI-NG): impact of improved spectral resolution and radiometric noise on the retrieval of thermodynamic, chemistry and climate variables, Atmos. Meas. Tech., 7, 4367–4385, https://doi.org/10.5194/amt-7-4367-2014, 2014.
Dammers, E., McLinden, C. A., Griffin, D., Shephard, M. W., Van Der Graaf, S., Lutsch, E., Schaap, M., Gainairu-Matz, Y., Fioletov, V., Van Damme, M., Whitburn, S., Clarisse, L., Cady-Pereira, K., Clerbaux, C., Coheur, P. F., and Erisman, J. W.: NH3 emissions from large point sources derived from CrIS and IASI satellite observations, Atmos. Chem. Phys., 19, 12261–12293, https://doi.org/10.5194/acp-19-12261-2019, 2019.
Day, M. C., Zhang, M., and Pandis, S. N.: Evaluation of the ability of the EC tracer method to estimate secondary organic carbon, Atmos. Environ., 112, 317–325, https://doi.org/10.1016/j.atmosenv.2015.04.044, 2015.
Denier van der Gon, H. A. C., Bergström, R., Fountoukis, C., Johansson, C., Pandis, S. N., Simpson, D., and Visschedijk, A. J. H.: Particulate emissions from residential wood combustion in Europe – revised estimates and an evaluation, Atmos. Chem. Phys., 15, 6503–6519, https://doi.org/10.5194/acp-15-6503-2015, 2015.
ECCC (Environment and Climate Change Canada): Canadian Environmental Sustainability Indicators: Air pollutant emissions, Consulted on Month day, year, https://www.canada.ca/en/environment-climate-change/services/environmental-indicators/air-pollutant-emissions.html, last access: 29 September 2022.
Fountoukis, C. and Nenes, A.: ISORROPIA II: a computationally efficient thermodynamic equilibrium model for K+-Ca2+-Mg2+--Na+---Cl−-H2O aerosols, Atmos. Chem. Phys., 7, 4639–4659, https://doi.org/10.5194/acp-7-4639-2007, 2007.
Gobierno de la ciudad de México: Bases de datos – Red Automática de Monitoreo Atmosférico (RAMA), Gobierno de la ciudad de México [data set], last access: 29 September 2022.
Guo, X., Wang, R., Pan, D., Zondlo, M. A., Clarisse, L., Van Damme, M., Whitburn, S., Coheur, P.-F., Clerbaux, C., Franco, B., Golston, L. M., Wendt, L., Sun, K., Tao, L., Miller, D., Mikoviny, T., Müller, M., Wisthaler, A., Tevlin, A. G., Murphy, J. G., Nowak, J. B., Roscioli, J. R., Volkamer, R., Kille, N., Neuman, J. A., Eilerman, S. J., Crawford, J. H., Yacovitch, T. I., Barrick, J. D., and Scarino, A. J.: Validation of IASI Satellite Ammonia Observations at the Pixel Scale Using In Situ Vertical Profiles, J. Geophys. Res.-Atmos., 126, e2020JD033475, https://doi.org/10.1029/2020JD033475, 2021.
Herrera, B., Bezanilla, A., Blumenstock, T., Dammers, E., Hase, F., Clarisse, L., Magaldi, A., Rivera, C., Stremme, W., Strong, K., Viatte, C., Van Damme, M., and Grutter, M.: Measurement report: Evolution and distribution of NH3 over Mexico City from ground-based and satellite infrared spectroscopic measurements, Atmos. Chem. Phys. Discuss. [preprint], https://doi.org/10.5194/acp-2022-217, in review, 2022.
Hersbach, H., Bell, B., Berrisford, P., Hirahara, S., Horányi, A., Muñoz-Sabater, J., Nicolas, J., Peubey, C., Radu, R., Schepers, D., Simmons, A., Soci, C., Abdalla, S., Abellan, X., Balsamo, G., Bechtold, P., Biavati, G., Bidlot, J., Bonavita, M., De Chiara, G., Dahlgren, P., Dee, D., Diamantakis, M., Dragani, R., Flemming, J., Forbes, R., Fuentes, M., Geer, A., Haimberger, L., Healy, S., Hogan, R. J., Hólm, E., Janisková, M., Keeley, S., Laloyaux, P., Lopez, P., Lupu, C., Radnoti, G., de Rosnay, P., Rozum, I., Vamborg, F., Villaume, S., and Thépaut, J.-N.: The ERA5 global reanalysis, Q. J. Roy. Meteor. Soc., 146, 1999–2049, https://doi.org/10.1002/qj.3803, 2020.
Hoesly, R. M., Smith, S. J., Feng, L., Klimont, Z., Janssens-Maenhout, G., Pitkanen, T., Seibert, J. J., Vu, L., Andres, R. J., Bolt, R. M., Bond, T. C., Dawidowski, L., Kholod, N., Kurokawa, J.-I., Li, M., Liu, L., Lu, Z., Moura, M. C. P., O'Rourke, P. R., and Zhang, Q.: Historical (1750–2014) anthropogenic emissions of reactive gases and aerosols from the Community Emissions Data System (CEDS), Geosci. Model Dev., 11, 369–408, https://doi.org/10.5194/gmd-11-369-2018, 2018.
INECC and SEMARNAT: México, Secretaría del Medio Ambiente de la Ciudad de México, Inventario de Emisiones de la Ciudad de México 2016. Dirección General de Gestión de la Calidad del Aire, Dirección de Programas de Calidad del Aire e Inventario de Emisiones, Ciudad de México, Septiembre 2018, http://www.aire.cdmx.gob.mx/descargas/publicaciones/flippingbook/inventario-emisiones-2016/mobile/inventario-emisiones-2016.pdf (last access: 28 May 2021), 2018.
Jeong, C.-H., Traub, A., Huang, A., Hilker, N., Wang, J. M., Herod, D., Dabek-Zlotorzynska, E., Celo, V., and Evans, G. J.: Long-term analysis of PM2.5 from 2004 to 2017 in Toronto: Composition, sources, and oxidative potential, Environ. Pollut., 263, 114652, https://doi.org/10.1016/j.envpol.2020.114652, 2020.
Karydis, V. A., Tsimpidi, A. P., Lei, W., Molina, L. T., and Pandis, S. N.: Formation of semivolatile inorganic aerosols in the Mexico City Metropolitan Area during the MILAGRO campaign, Atmos. Chem. Phys., 11, 13305–13323, https://doi.org/10.5194/acp-11-13305-2011, 2011.
Lanzafame, G. M., Srivastava, D., Favez, O., Bandowe, B. A. M., Shahpoury, P., Lammel, G., Bonnaire, N., Alleman, L. Y., Couvidat, F., Bessagnet, B., and Albinet, A.: One-year measurements of secondary organic aerosol (SOA) markers in the Paris region (France): Concentrations, gas/particle partitioning and SOA source apportionment, Sci. Total Environ., 757, 143921, https://doi.org/10.1016/j.scitotenv.2020.143921, 2021.
Larios, A. D., Chebana, F., Godbout, S., Brar, S. K., Valera, F., Palacios, J. H., Avalos Ramirez, A., Saldoval-Salas, F., Larouche, J. P., Medina-Hernández, D., and Potvin, L.: Analysis of atmospheric ammonia concentration from four sites in Quebec City region over 2010–2013, Atmos. Pollut. Res., 9, 476–482, https://doi.org/10.1016/j.apr.2017.11.001, 2018.
Lee, P. K. H., Brook, J. R., Dabek-Zlotorzynska, E., and Mabury, S. A.: Identification of the Major Sources Contributing to PM2.5 Observed in Toronto, Environ. Sci. Technol., 37, 4831–4840, https://doi.org/10.1021/es026473i, 2003.
McDuffie, E. E., Martin, R. V, Spadaro, J. V, Burnett, R., Smith, S. J., O'Rourke, P., Hammer, M. S., van Donkelaar, A., Bindle, L., Shah, V., Jaeglé, L., Luo, G., Yu, F., Adeniran, J. A., Lin, J., and Brauer, M.: Source sector and fuel contributions to ambient PM2.5 and attributable mortality across multiple spatial scales, Nat. Commun., 12, 3594, https://doi.org/10.1038/s41467-021-23853-y, 2021.
Ministry of the Environment, Conservation and Parks: Air Quality Ontario, Ministry of the Environment, Conservation and Parks [data set], http://www.airqualityontario.com/, last access: 29 September 2022.
Molina, L. T., Madronich, S., Gaffney, J. S., Apel, E., de Foy, B., Fast, J., Ferrare, R., Herndon, S., Jimenez, J. L., Lamb, B., Osornio-Vargas, A. R., Russell, P., Schauer, J. J., Stevens, P. S., Volkamer, R., and Zavala, M.: An overview of the MILAGRO 2006 Campaign: Mexico City emissions and their transport and transformation, Atmos. Chem. Phys., 10, 8697–8760, https://doi.org/10.5194/acp-10-8697-2010, 2010.
Murray, C. J. L., Aravkin, A. Y., Zheng, P., et al.: Global burden of 87 risk factors in 204 countries and territories, 1990–2019: a systematic analysis for the Global Burden of Disease Study 2019, Lancet, 396, 1223–1249, https://doi.org/10.1016/S0140-6736(20)30752-2, 2020.
Nair, A. A. and Yu, F.: Quantification of Atmospheric Ammonia Concentrations: A Review of Its Measurement and Modeling, Atmosphere, 11, 1092, https://doi.org/10.3390/atmos11101092, 2020.
NOM-025-SSA1-2021: NORMA Oficial Mexicana NOM-025-SSA1-2021, Salud ambiental, Criterio para evaluar la calidad del aire ambiente, con respecto a las partículas suspendidas PM10 y PM2.5. Valores normados para la concentración de partículas suspendidas PM10 y PM2.5 en el aire ambiente, como medida de protección a la salud de la población, Diario Oficial de la Federacion 27 octubre 2021, https://www.dof.gob.mx/nota_detalle.php?codigo=5633855&fecha=27/10/2021#gsc.tab=0 (last access: August 2022), 2021.
Ojeda-Castillo, V., Alonso-Romero, S., Mena, L. H.-, Álvarez-Chávez, P. E., and del Real-Olvera, J.: Air Pollution in an Urban Area of Mexico: Sources of Emission (Vehicular, Natural, Industrial, and Brick Production), in Air Pollution, edited by: Olvera, J. D. R., IntechOpen, Rijeka, 2019.
Pai, S. J., Heald, C. L., Pierce, J. R., Farina, S. C., Marais, E. A., Jimenez, J. L., Campuzano-Jost, P., Nault, B. A., Middlebrook, A. M., Coe, H., Shilling, J. E., Bahreini, R., Dingle, J. H., and Vu, K.: An evaluation of global organic aerosol schemes using airborne observations, Atmos. Chem. Phys., 20, 2637–2665, https://doi.org/10.5194/acp-20-2637-2020, 2020.
Paulot, F. and Jacob, D. J.: Hidden Cost of U.S. Agricultural Exports: Particulate Matter from Ammonia Emissions, Environ. Sci. Technol., 48, 903–908, https://doi.org/10.1021/es4034793, 2014.
Petit, J.-E., Favez, O., Sciare, J., Crenn, V., Sarda-Estève, R., Bonnaire, N., Močnik, G., Dupont, J.-C., Haeffelin, M., and Leoz-Garziandia, E.: Two years of near real-time chemical composition of submicron aerosols in the region of Paris using an Aerosol Chemical Speciation Monitor (ACSM) and a multi-wavelength Aethalometer, Atmos. Chem. Phys., 15, 2985–3005, https://doi.org/10.5194/acp-15-2985-2015, 2015.
Petit, J.-E., Amodeo, T., Meleux, F., Bessagnet, B., Menut, L., Grenier, D., Pellan, Y., Ockler, A., Rocq, B., Gros, V., Sciare, J., and Favez, O.: Characterising an intense PM pollution episode in March 2015 in France from multi-site approach and near real time data: Climatology, variabilities, geographical origins and model evaluation, Atmos. Environ., 155, 68–84, https://doi.org/10.1016/j.atmosenv.2017.02.012, 2017.
Pope, C. A., Ezzati, M., and Dockery, D. W.: Fine-Particulate Air Pollution and Life Expectancy in the United States, N. Engl. J. Med., 360, 376–386, https://doi.org/10.1056/NEJMsa0805646, 2009.
Potter, P., Ramankutty, N., Bennett, E. M., and Donner, S. D.: Characterizing the Spatial Patterns of Global Fertilizer Application and Manure Production, Earth Interact., 14, 1–22, https://doi.org/10.1175/2009EI288.1, 2010.
Randerson, J. T., Van Der Werf, G. R., Giglio, L., Collatz, G. J., and Kasibhatla, P. S.: Global Fire Emissions Database, Version 4.1 (GFEDv4), ORNL DAAC [data set], https://doi.org/10.3334/ORNLDAAC/1293, 2017.
Retama, A., Ramos-Cerón, M., Rivera-Hernández, O., Allen, G., and Velasco, E.: Aerosol optical properties and brown carbon in Mexico City, Environ. Sci. Atmos., 2, 315–334, https://doi.org/10.1039/D2EA00006G, 2022.
Salcedo, D., Alvarez-Ospina, H., Peralta, O., and Castro, T.: PM1 Chemical Characterization during the ACU15 Campaign, South of Mexico City, Atmosphere, 9, https://doi.org/10.3390/atmos9060232, 2018.
Sciare, J., d'Argouges, O., Zhang, Q. J., Sarda-Estève, R., Gaimoz, C., Gros, V., Beekmann, M., and Sanchez, O.: Comparison between simulated and observed chemical composition of fine aerosols in Paris (France) during springtime: contribution of regional versus continental emissions, Atmos. Chem. Phys., 10, 11987–12004, https://doi.org/10.5194/acp-10-11987-2010, 2010.
Stein, A. F., Draxler, R. R., Rolph, G. D., Stunder, B. J. B., Cohen, M. D., and Ngan, F.: NOAA's HYSPLIT Atmospheric Transport and Dispersion Modeling System, B. Am. Meteorol. Soc., 96, 2059–2077, https://doi.org/10.1175/BAMS-D-14-00110.1, 2015.
Sutton, M. A., Reis, S., Riddick, S. N., Dragosits, U., Nemitz, E., Theobald, M. R., Tang, Y. S., Braban, C. F., Vieno, M., Dore, A. J., Mitchell, R. F., Wanless, S., Daunt, F., Fowler, D., Blackall, T. D., Milford, C., Flechard, C. R., Loubet, B., Massad, R., Cellier, P., Personne, E., Coheur, P. F., Clarisse, L., Van Damme, M., Ngadi, Y., Clerbaux, C., Skjøth, C. A., Geels, C., Hertel, O., Wichink Kruit, R. J., Pinder, R. W., Bash, J. O., Walker, J. T., Simpson, D., Horváth, L., Misselbrook, T. H., Bleeker, A., Dentener, F., and de Vries, W.: Towards a climate-dependent paradigm of ammonia emission and deposition, Philos. T. R. Soc. Lon. B, 368, 20130166, https://doi.org/10.1098/rstb.2013.0166, 2013.
Van Damme, M., Whitburn, S., Clarisse, L., Clerbaux, C., Hurtmans, D., and Coheur, P.-F.: Version 2 of the IASI NH3 neural network retrieval algorithm: near-real-time and reanalysed datasets, Atmos. Meas. Tech., 10, 4905–4914, https://doi.org/10.5194/amt-10-4905-2017, 2017.
Van Damme, M., Clarisse, L., Whitburn, S., Hadji-Lazaro, J., Hurtmans, D., Clerbaux, C., and Coheur, P.-F.: Industrial and agricultural ammonia point sources exposed, Nature, 564, 99–103, https://doi.org/10.1038/s41586-018-0747-1, 2018.
Van Damme, M., Clarisse, L., Franco, B., Sutton, M. A., Erisman, J. W., Wichink Kruit, R., van Zanten, M., Whitburn, S., Hadji-Lazaro, J., Hurtmans, D., Clerbaux, C., and Coheur, P.-F.: Global, regional and national trends of atmospheric ammonia derived from a decadal (2008–2018) satellite record, Environ. Res. Lett., 16, 55017, https://doi.org/10.1088/1748-9326/abd5e0, 2021 (data available at: https://iasi.aeris-data.fr/nh3r-era5/, last access: 29 September 2022).
Vega, E., Eidels, S., Ruiz, H., López-Veneroni, D., Sosa, G., Gonzalez, E., Watson, J. G., Edgerton, S. A., Gasca, J., Mora, V., Reyes, E., Sánchez-Reyna, G., Villaseñor, R., and Chow, J. C.: Particulate Air Pollution in Mexico City: A Detailed View, Aerosol Air Qual. Res., 10, 193–211, https://doi.org/10.4209/aaqr.2009.06.0042, 2010.
Viatte, C., Wang, T., Van Damme, M., Dammers, E., Meleux, F., Clarisse, L., Shephard, M. W., Whitburn, S., Coheur, P. F., Cady-Pereira, K. E., and Clerbaux, C.: Atmospheric ammonia variability and link with particulate matter formation: a case study over the Paris area, Atmos. Chem. Phys., 20, 577–596, https://doi.org/10.5194/acp-20-577-2020, 2020.
Viatte, C., Petit, J.-E., Yamanouchi, S., Van Damme, M., Doucerain, C., Germain-Piaulenne, E., Gros, V., Favez, O., Clarisse, L., Coheur, P.-F., Strong, K., and Clerbaux, C.: Ammonia and PM2.5 air pollution in paris during the 2020 covid lockdown, Atmosphere, 12, 160, https://doi.org/10.3390/atmos12020160, 2021.
von Bobrutzki, K., Braban, C. F., Famulari, D., Jones, S. K., Blackall, T., Smith, T. E. L., Blom, M., Coe, H., Gallagher, M., Ghalaieny, M., McGillen, M. R., Percival, C. J., Whitehead, J. D., Ellis, R., Murphy, J., Mohacsi, A., Pogany, A., Junninen, H., Rantanen, S., Sutton, M. A., and Nemitz, E.: Field inter-comparison of eleven atmospheric ammonia measurement techniques, Atmos. Meas. Tech., 3, 91–112, https://doi.org/10.5194/amt-3-91-2010, 2010.
Wang, Q., Jacob, D. J., Spackman, J. R., Perring, A. E., Schwarz, J. P., Moteki, N., Marais, E. A., Ge, C., Wang, J., and Barrett, S. R. H.: Global budget and radiative forcing of black carbon aerosol: Constraints from pole-to-pole (HIPPO) observations across the Pacific, J. Geophys. Res.-Atmos., 119, 195–206, https://doi.org/10.1002/2013JD020824, 2014.
Yamanouchi, S., Viatte, C., Strong, K., Lutsch, E., Jones, D. B. A., Clerbaux, C., Van Damme, M., Clarisse, L., and Coheur, P.-F.: Multiscale observations of NH3 around Toronto, Canada, Atmos. Meas. Tech., 14, 905–921, https://doi.org/10.5194/amt-14-905-2021, 2021.
Yao, X. and Zhang, L.: Causes of Large Increases in Atmospheric Ammonia in the Last Decade across North America, ACS omega, 4, 22133–22142, https://doi.org/10.1021/acsomega.9b03284, 2019.
Zellweger, C., Hüglin, C., Klausen, J., Steinbacher, M., Vollmer, M., and Buchmann, B.: Inter-comparison of four different carbon monoxide measurement techniques and evaluation of the long-term carbon monoxide time series of Jungfraujoch, Atmos. Chem. Phys., 9, 3491–3503, https://doi.org/10.5194/acp-9-3491-2009, 2009.