the Creative Commons Attribution 4.0 License.
the Creative Commons Attribution 4.0 License.
 | 29 Sep 2022
Exploring the inorganic composition of the Asian Tropopause Aerosol Layer using medium-duration balloon flights
Hazel Vernier
Neeraj Rastogi
Hongyu Liu
Amit Kumar Pandit
Kris Bedka
Anil Patel
Madineni Venkat Ratnam
Buduru Suneel Kumar
Harish Gadhavi
Frank Wienhold
Gwenael Berthet
Jean-Paul Vernier
Satellite observations have revealed an enhanced aerosol layer near the tropopause over Asia during the summer monsoon, called the “Asian Tropopause Aerosol Layer” (ATAL). In this work, aerosol particles in the ATAL were collected with a balloon-borne impactor near the tropopause region over India, using extended-duration balloon flights, in summer 2017 and winter 2018. The chemical composition of these particles was further investigated by quantitative analysis using offline ion chromatography. Nitrate (NO and nitrite (NO were found to be the dominant ions in the collected aerosols with values ranging between 87 and 343 ng m−3 at STP (standard temperature and pressure) during the summer campaign. In contrast, sulfate (SO levels were found to be above the detection limit (>10 ng m−3 at STP) only in winter. In addition, we determined the origin of the air masses sampled during the flights using the analysis of back trajectories as well as a convective proxy from cloud-top temperature fields derived from a geostationary satellite. The results obtained from this analysis were put into the context of large-scale transport and aerosol distribution using GEOS-Chem chemical transport model simulations. The first flight in summer 2017 which sampled an air mass within the Asian monsoon anticyclone (AMA), influenced by convection over Western China, was associated with particle size diameters from 0.05 to 0.15 µm. In contrast, the second flight sampled air masses at the edge of the AMA associated with a larger particle size radius (>2 µm) with a higher NO concentration. The sampled air masses in winter 2018 were likely affected by smoke from the Pacific Northwest fire event in Canada, which occurred 7 months before our campaign, associated with concentration enhancements of SO and Ca2+. Overall, our results suggest that nitrogen-containing particles represent a large fraction of cloud-free and in-cloud aerosols populating the ATAL, which is partially in agreement with the results from aircraft measurements during the StratoClim (Stratospheric and upper tropospheric processes for better climate predictions) campaign. The exact nature of those particles is still unknown, but their coincidences with subvisible cirrus clouds and their sizes suggest nitric acid trihydrate (NAT) as a possible candidate, as NAT has already been observed in the tropical upper troposphere and lower stratosphere in other studies. Furthermore, GEOS-Chem model simulations indicate that lightning NOx emissions could have significantly impacted the production of nitrate aerosols sampled during the summer of 2017.
- Article
(14934 KB) - Full-text XML
-
Supplement
(645 KB) - BibTeX
- EndNote


1.1 The Asian summer monsoon and the transport of pollution
Over the past 2 decades, rapid economic growth in Asia has led to serious environmental threats to water and air quality. Every winter, pollutants can be observed through satellites in the form of a grayish veil of particulate matter, referred to as the “Asian brown cloud” (Ramanathan and Crutzen, 2003). In summer, the southwest Asian monsoon (SAM) discharges polluted air over very long distances. According to trajectory calculations, about 20 % of air masses in the tropical lower stratosphere have been in contact with air in the boundary layer in Asia (Orbe et al., 2015). Polluted air masses transported from the boundary layer to higher altitudes are confined within the Asian monsoon anticyclone (AMA) (Ploeger et al., 2017). In the AMA, pollution is accumulated and is further dispersed over a large area of the Northern Hemisphere, reaching latitudes from 10 to 40∘ N and longitudes from 10 to 140∘ E (Park et al., 2007; Randel et al., 2010; Ungermann et al., 2016). The air exported from the AMA influences the composition of the entire lowermost stratosphere of the Northern Hemisphere (Ploeger et al., 2017; Santee et al., 2017; Yu et al., 2017). Deep convective clouds represent conduits for air pollution to reach the upper-troposphere–lower-stratosphere (UTLS) region. Aerosols in the UTLS have longer residence times than those in the lower troposphere, influencing the chemistry of the atmosphere and the Earth's climate (Rasch et al., 2008). In addition, they also affect the concentration of chemical species through changes in photolysis rates and heterogenous reactions (Pitari et al., 2014). It has been further reported that aerosols in the UTLS can impact climate by altering the properties of cirrus clouds via homogeneous or heterogeneous ice nucleation (Li et al., 2005, 2009; Yin et al., 2012; Fadnavis et al., 2013; Wagner et al., 2020).
A layer of aerosol enhancements observed by the Cloud-Aerosol Lidar and Pathfinder Satellite Observation (CALIPSO) satellite and the Stratospheric Aerosol and Gas Experiment (SAGE) II spaceborne instruments (Vernier et al., 2011; Thomason and Vernier, 2013), also known as the “Asian Tropopause Aerosol Layer” (ATAL), coincides with the presence of enhanced trace gas pollutants (e.g., carbon monoxide, CO, and hydrogen cyanide, HCN) in the UTLS region. Balloon-borne measurements (Vernier et al., 2015, 2018) confirmed the presence of the ATAL at altitudes of 14–18 km, connected to the AMA. The positive trend in UTLS aerosols inferred from satellite observations since the late 1990s may reflect the increasing influence of anthropogenic emissions on stratospheric aerosol levels. Indeed, global chemical transport model simulations suggest that sulfate, nitrate, and organic aerosols produced from gas-phase precursors populate the UTLS region over Asia in various relative fractions during the summer monsoon (Brabec et al., 2012; Gu et al., 2016; Fairlie et al., 2020).
1.2 What is the significance of the ATAL?
The ATAL constitutes one of the most important sources of UTLS aerosols in the absence of volcanic eruptions (Vernier et al., 2011). It has the potential to affect the Earth's radiative balance (Vernier et al., 2015), stratospheric ozone chemistry, and the properties of cirrus clouds. For example, an increase in the solid-particle concentration relative to the liquid background aerosol levels could trigger heterogeneous freezing and the formation of cirrus clouds at a lower relative humidity with respect to ice (Zawadowicz et al., 2015; Wang et al., 2020). Model simulations suggest that the ATAL represents 20 % of the total column surface area density in the stratosphere of the Northern Hemisphere (Yu et al., 2018) with potential halogen heterogeneous chemistry on aerosols that can affect ozone trends (Solomon et al., 2016). The types of aerosols populating the ATAL could affect those chemical processes. Finally, the presence of absorbing aerosols (e.g., soot) in the UTLS could shift the level of zero net radiative heating upward and enhance troposphere-to-stratosphere transport (Yu et al., 2015).
1.3 What is known about ATAL's composition?
The composition of the ATAL is a very active research topic. Energy-dispersive X-ray analysis (EDX) of aerosols sampled near 10–12 km aboard commercial aircraft as part of the Civil Aircraft for the Regular Investigation of the atmosphere Based on an Instrument Container (CARIBIC) program, at the bottom part of the ATAL, suggests a ratio of carbon to sulfur in the range of 2–10 (Vernier et al., 2015). Aircraft limb infrared measurements carried out during the StratoClim (Stratospheric and upper tropospheric processes for better climate predictions) campaign in Nepal and India show the presence of ammonium nitrate in aerosol particles, validating satellite observations from the Cryogenic Infrared Spectrometers and Telescopes for the Atmosphere (CRISTA) and Michelson Interferometer for Passive Atmospheric Sounding (MIPAS) instruments (Höpfner et al., 2019). A combination of community models and aerosol–climate–chemistry models indicates that, along with surface-emitted and secondary organic aerosols, the ATAL could be comprised of a significant amount of mineral dust either as a major component (Fadnavis et al., 2013; Lau et al., 2018; Ma et al., 2019; Bossolasco et al., 2021) or minor component (Yu et al., 2015, 2017; Gu et al., 2016; Fairlie et al., 2020).
The aerosol particles in the ATAL are looked upon as an insignia of the presence of pollution in the monsoon circulation from large SO2 and NOx emissions in South and Southeastern Asia. Human-induced biomass burning (Van der A et al., 2008), fossil fuel combustion (Ghude et al., 2009), wildfires (Goode et al., 2000; Andrae and Merlet, 2001), and lightning (Martin et al., 2007; Yuan et al., 2019) are the significant anthropogenic and natural sources of NOx. Soil biogenic emission of NOx represents a large fraction of total NOx (Jalié et al., 2004). Reactive nitrogen is emitted from the tropical soils by microbial processes as NO (Yienger and Levy, 1995; Conrad, 1996). Investigations of the composition of the aerosol particles in the ATAL are exiguous, although preliminary data from balloon-borne measurements indicate the presence of nitrate aerosol particles (Vernier et al., 2018). Recent in situ aerosol mass spectrometric measurements also reveal the presence of nitrate, ammonium, and sulfate within the ATAL (Höpfner et al., 2019; Yuan et al., 2019).
Here, we investigate the inorganic composition of the ATAL over India during the summer monsoon and in winter using a balloon-borne aerosol impactor system with offline ion chromatography (IC) analysis. Section 2 describes the concept of the balloon experiment and the impactor system. The results of the IC analysis of the samples collected on the ground (GRND), during the two balloon flights (ZF2 and ZF3) in the summer of 2017, and during the flight (ZFW) in winter 2018 are described in Sect. 3. Section 4 compares those results obtained from balloon-borne measurements and satellite observations. Section 5 describes the influence of the Canadian wildfire event on the Balloon-borne measurement campaigns of the Asian Tropopause Aerosol Layer (BATAL) winter flight. The origin of the air masses sampled during those flights is assessed in Sect. 6 using back-trajectory analysis combined with convective proxies. Section 7 addresses the formation of nitrite and its measurements. The GEOS-Chem model simulations are presented in Sect. 8 in order to put the measurements in the context of regional aerosol transport and distribution; this is followed by a summary and conclusions in Sect. 9.
2.1 Rationale for the experiment
Contingent on measurements during the 2015 BATAL campaign, a concentration of about 20 particles cm−3 was found near the tropopause for aerosols with a radius greater than 75 nm (Vernier et al., 2018). This translates into a mass concentration of 40 ng m−3 at STP (standard temperature and pressure; hereafter STP is assumed when mass concentrations are given), assuming that the aerosols were liquid sulfate droplets. During that time, the lower detection limit for the IC instrument at NASA Langley Research Center was around 20 ng m−3. In order to reach the detection limit of sulfate aerosols, one would need to sample at least 0.5 m3, assuming the sulfate concentration above. Based on those results and weight limitations, we decided to use an impactor with a flow rate of 7 L min−1 which would need to float in the UTLS region for several hours to sample a sufficient air volume (2 h of sampling results in 0.84 m3).
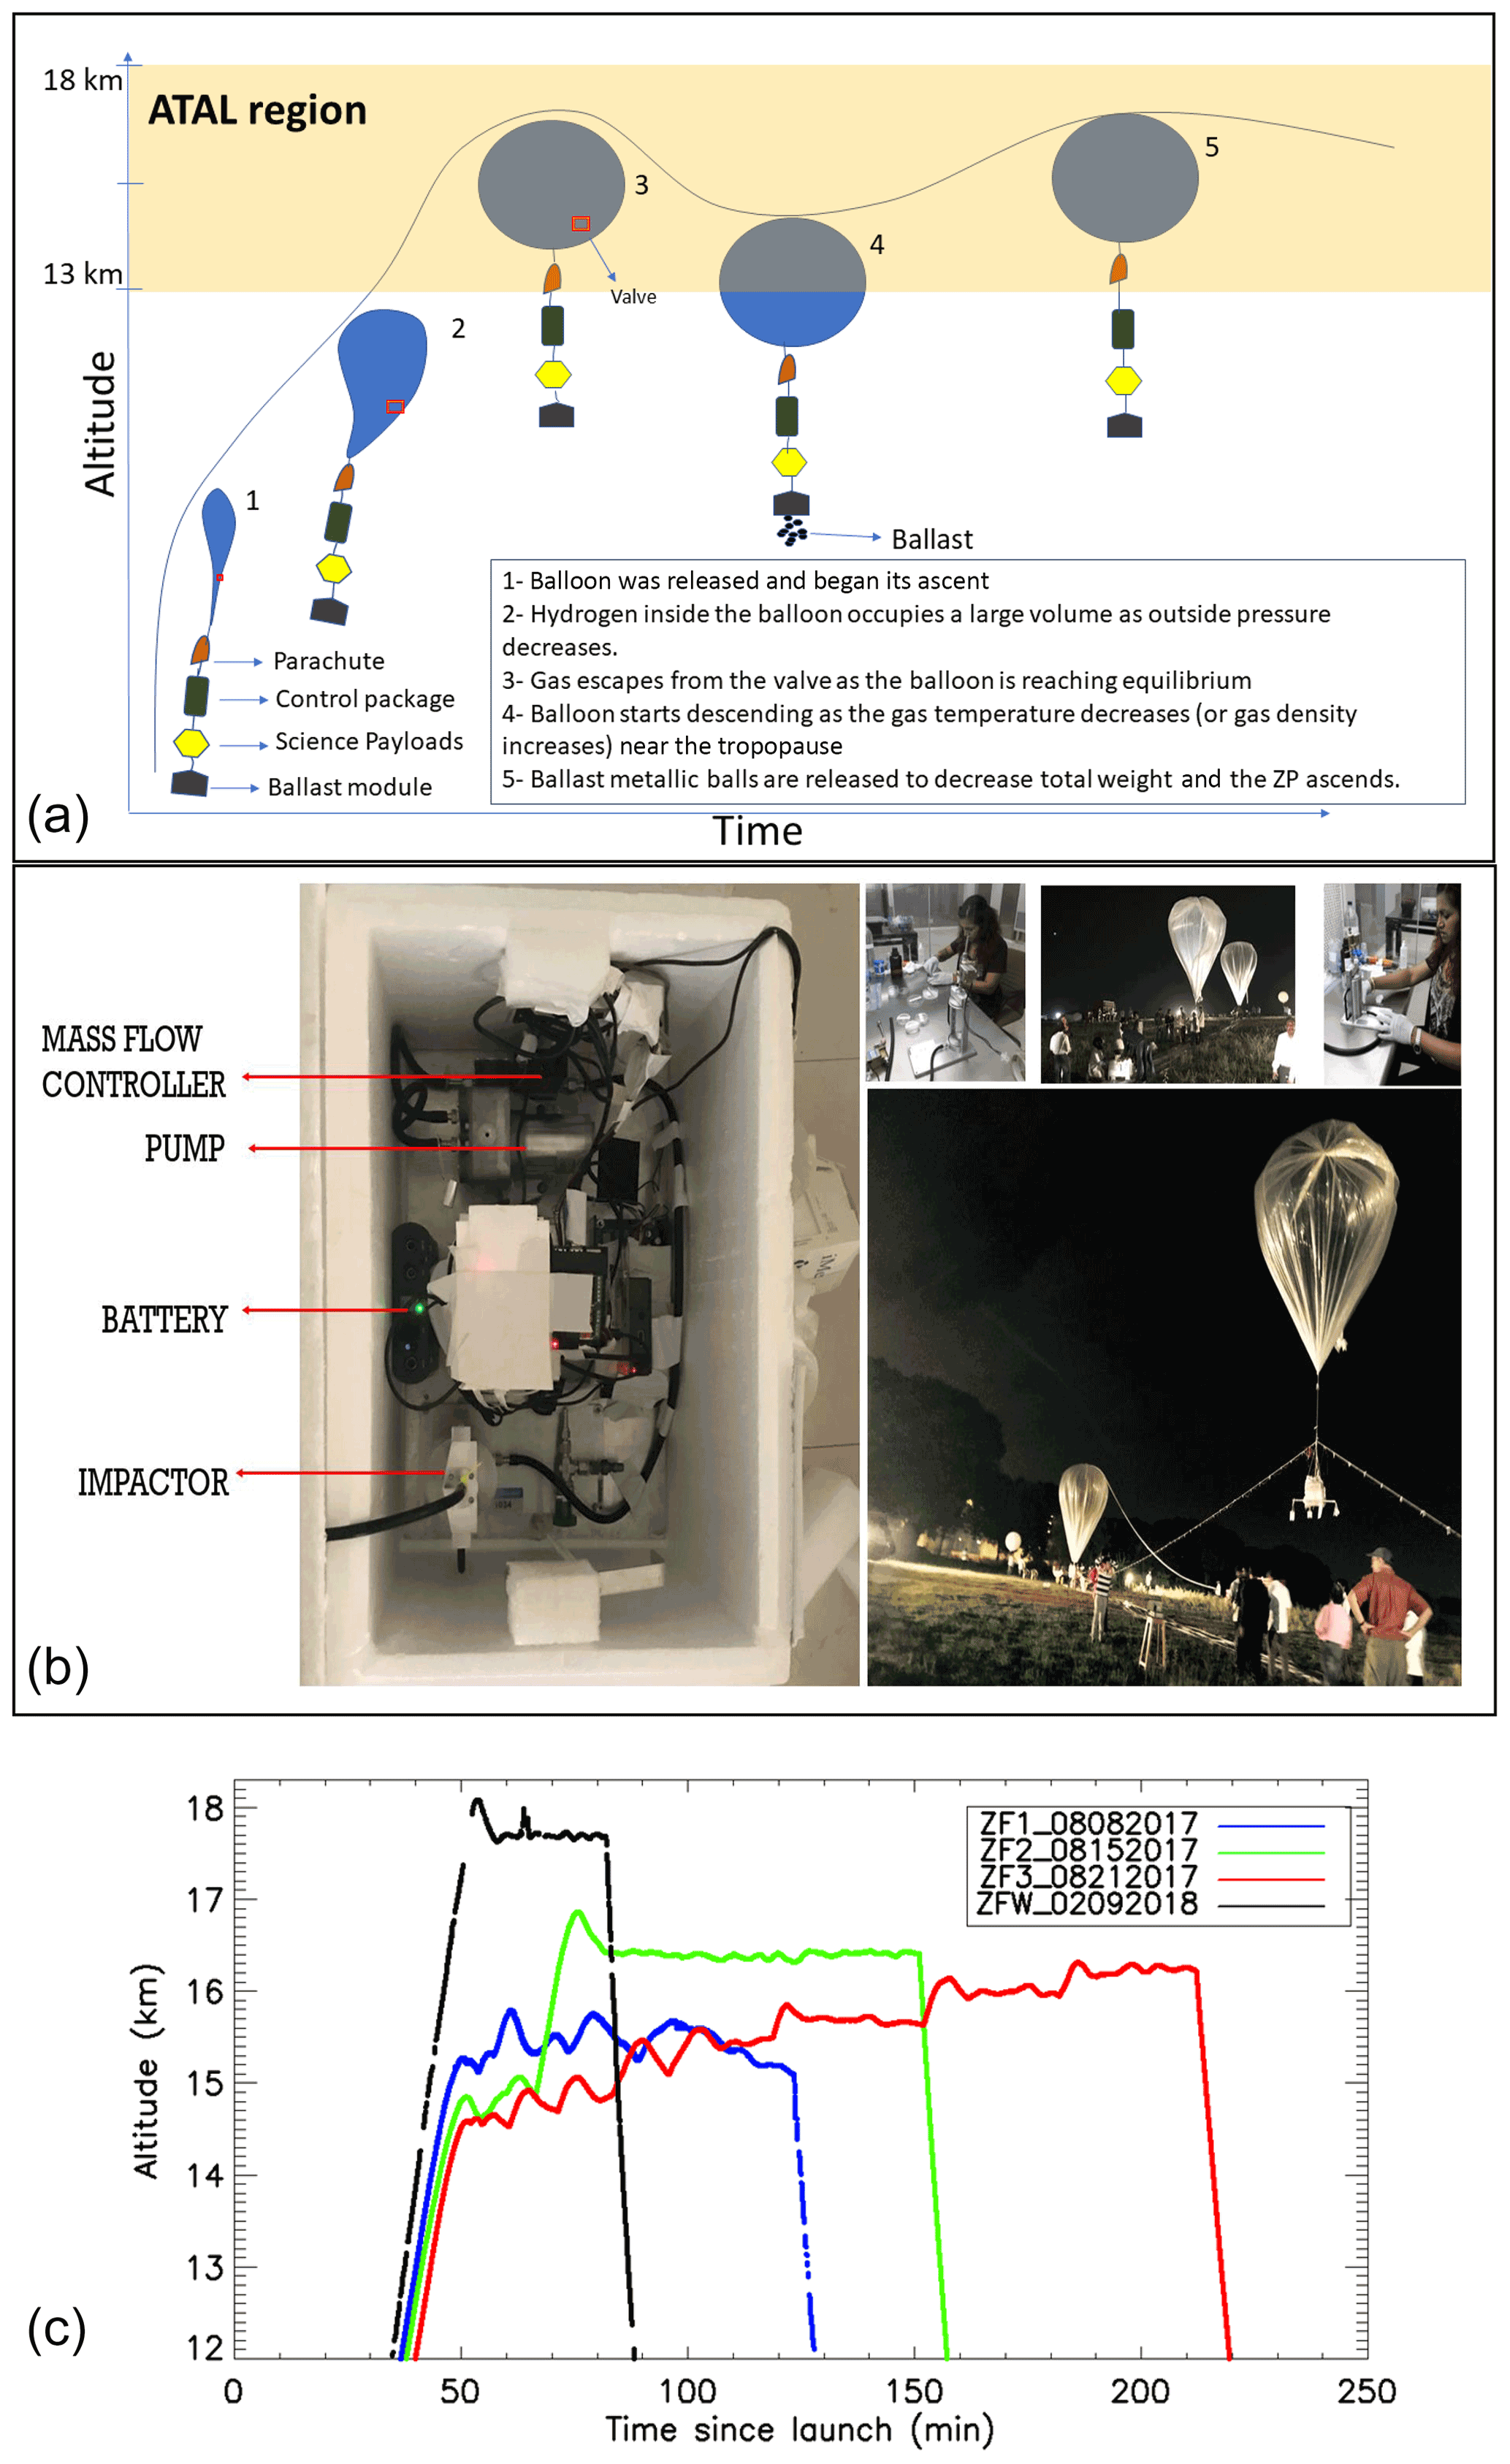
Figure 1(a) Schematic diagram of the zero-pressure flight (ZP) concept. (b) Picture of the science payload, impactor preparation, and balloon flight launch. (c) Time–height curves of the GPS altitudes of the three zero-pressure flights during summer 2017, in comparison with that of winter 2018, launched from TIFR-BF, Hyderabad, India.
2.2 Balloon experiment
We used zero-pressure plastic balloons to achieve a float near the tropopause and sample enough aerosols to reach the detection limit of the IC. The Tata Institute of Fundamental Research Balloon Facility (TIFR-BF) in Hyderabad, India, provided the infrastructure to conduct the experiment. Polyethylene balloons with volumes between 300 and 500 m3 (manufactured by TIFR) were used for the zero-pressure flights (ZF) to carry a communication/control package (developed by TIFR), a science module (including a meteorological radiosonde), a Compact Optical Backscatter and Aerosol Detector (COBALD) system (Vernier et al., 2015; Yu et al., 2017), an aerosol impactor, and a ballast module at the end of the flight train. The schematic diagram shown in Fig. 1a describes a typical balloon flight. During the ascent, the atmospheric pressure decreases allowing gas inside the balloon to occupy a large space (stage 2 in Fig. 1a). The equilibrium point is reached when the hydrogen escapes from the side escape tubes attached at the bottom of the balloon, until the inside pressure equals the outside pressure (stage 3 in Fig. 1a), leading to a pressure differential of zero (zero-pressure balloon). The float altitude depends upon the volume of the balloon, the density of gas, and the total weight of the system following a simple Archimedes principle. Extreme cold temperatures near the tropopause affect the float due to radiative cooling, leading to a reduction in the buoyancy force, which entrains the descent of the system (stage 4 in Fig. 1a). To counterbalance this effect, ballast shots are released from a container to reduce the total weight (stage 5 in Fig. 1a), leading to the ascent of the balloon.
2.3 Balloon-borne aerosol impactor
We developed a balloon-borne aerosol impactor (BAI) for the ZF flights. This aerosol sampler is comprised of a four-stage impactor, a vacuum pump, a volumetric flow controller, and a Raspberry-Pi-based controller connected to a meteorological sonde. The mechanical part of the impactor was designed by California Measurements, Inc. and is based upon the principle of inertia, where the flow and the instrument dimension determine the size cutoff at different stages. The size cutoffs with respect to the particle radius for the impactor's four stages (S-1, S-2, S-3, and S-4) are 2, 0.5, 0.15, and 0.05 µm, respectively, at 7 L min−1 . The pump is controlled electronically based on the pressure measurements from the meteorological sonde. Our objective is to sample aerosols within the ATAL region; to achieve this, the pump was switched on below 150 hPa (∼14 km) and switched off above 70 hPa (∼18 km). However, due to a reduction in the pump efficiency at those levels, the flow rates lay between 5 and 6 L min−1, leading to a small shift in the size cutoff by up to 18 % (e.g., 2.36 µm instead of 2 µm for a flow of 5 L min−1 for S-1).
In 2017, we conducted a series of balloon flights using the BAI and a COBALD sonde for aerosol backscatter measurements of cloud and aerosol layers encountered by the BAI. The time–height evolution of the three ZFs is shown in Fig. 1c, with flight ZF1 being a test flight to understand and maintain the float altitude using ballast. The maximum flight duration was obtained during ZF3, which had a float time of nearly 2 h 50 min above 150 hPa and below 70 hPa. The oscillation of the balloon trajectories is due to the cooling of the gas inside the balloon and the subsequent release of ballast to regain higher altitudes. The BAI was preserved in a foam box containing dry ice during transportation to TIFR; once there, the filters were immediately unloaded and stored in 47 mm petri dishes that were frozen at −24 ∘C until further analysis at the Physical Research Laboratory, Ahmedabad, India. Figure 2 represents the time evolution of altitude, temperature, and relative humidity inside the box containing the impactor and also outlines the different phases of the experiment.
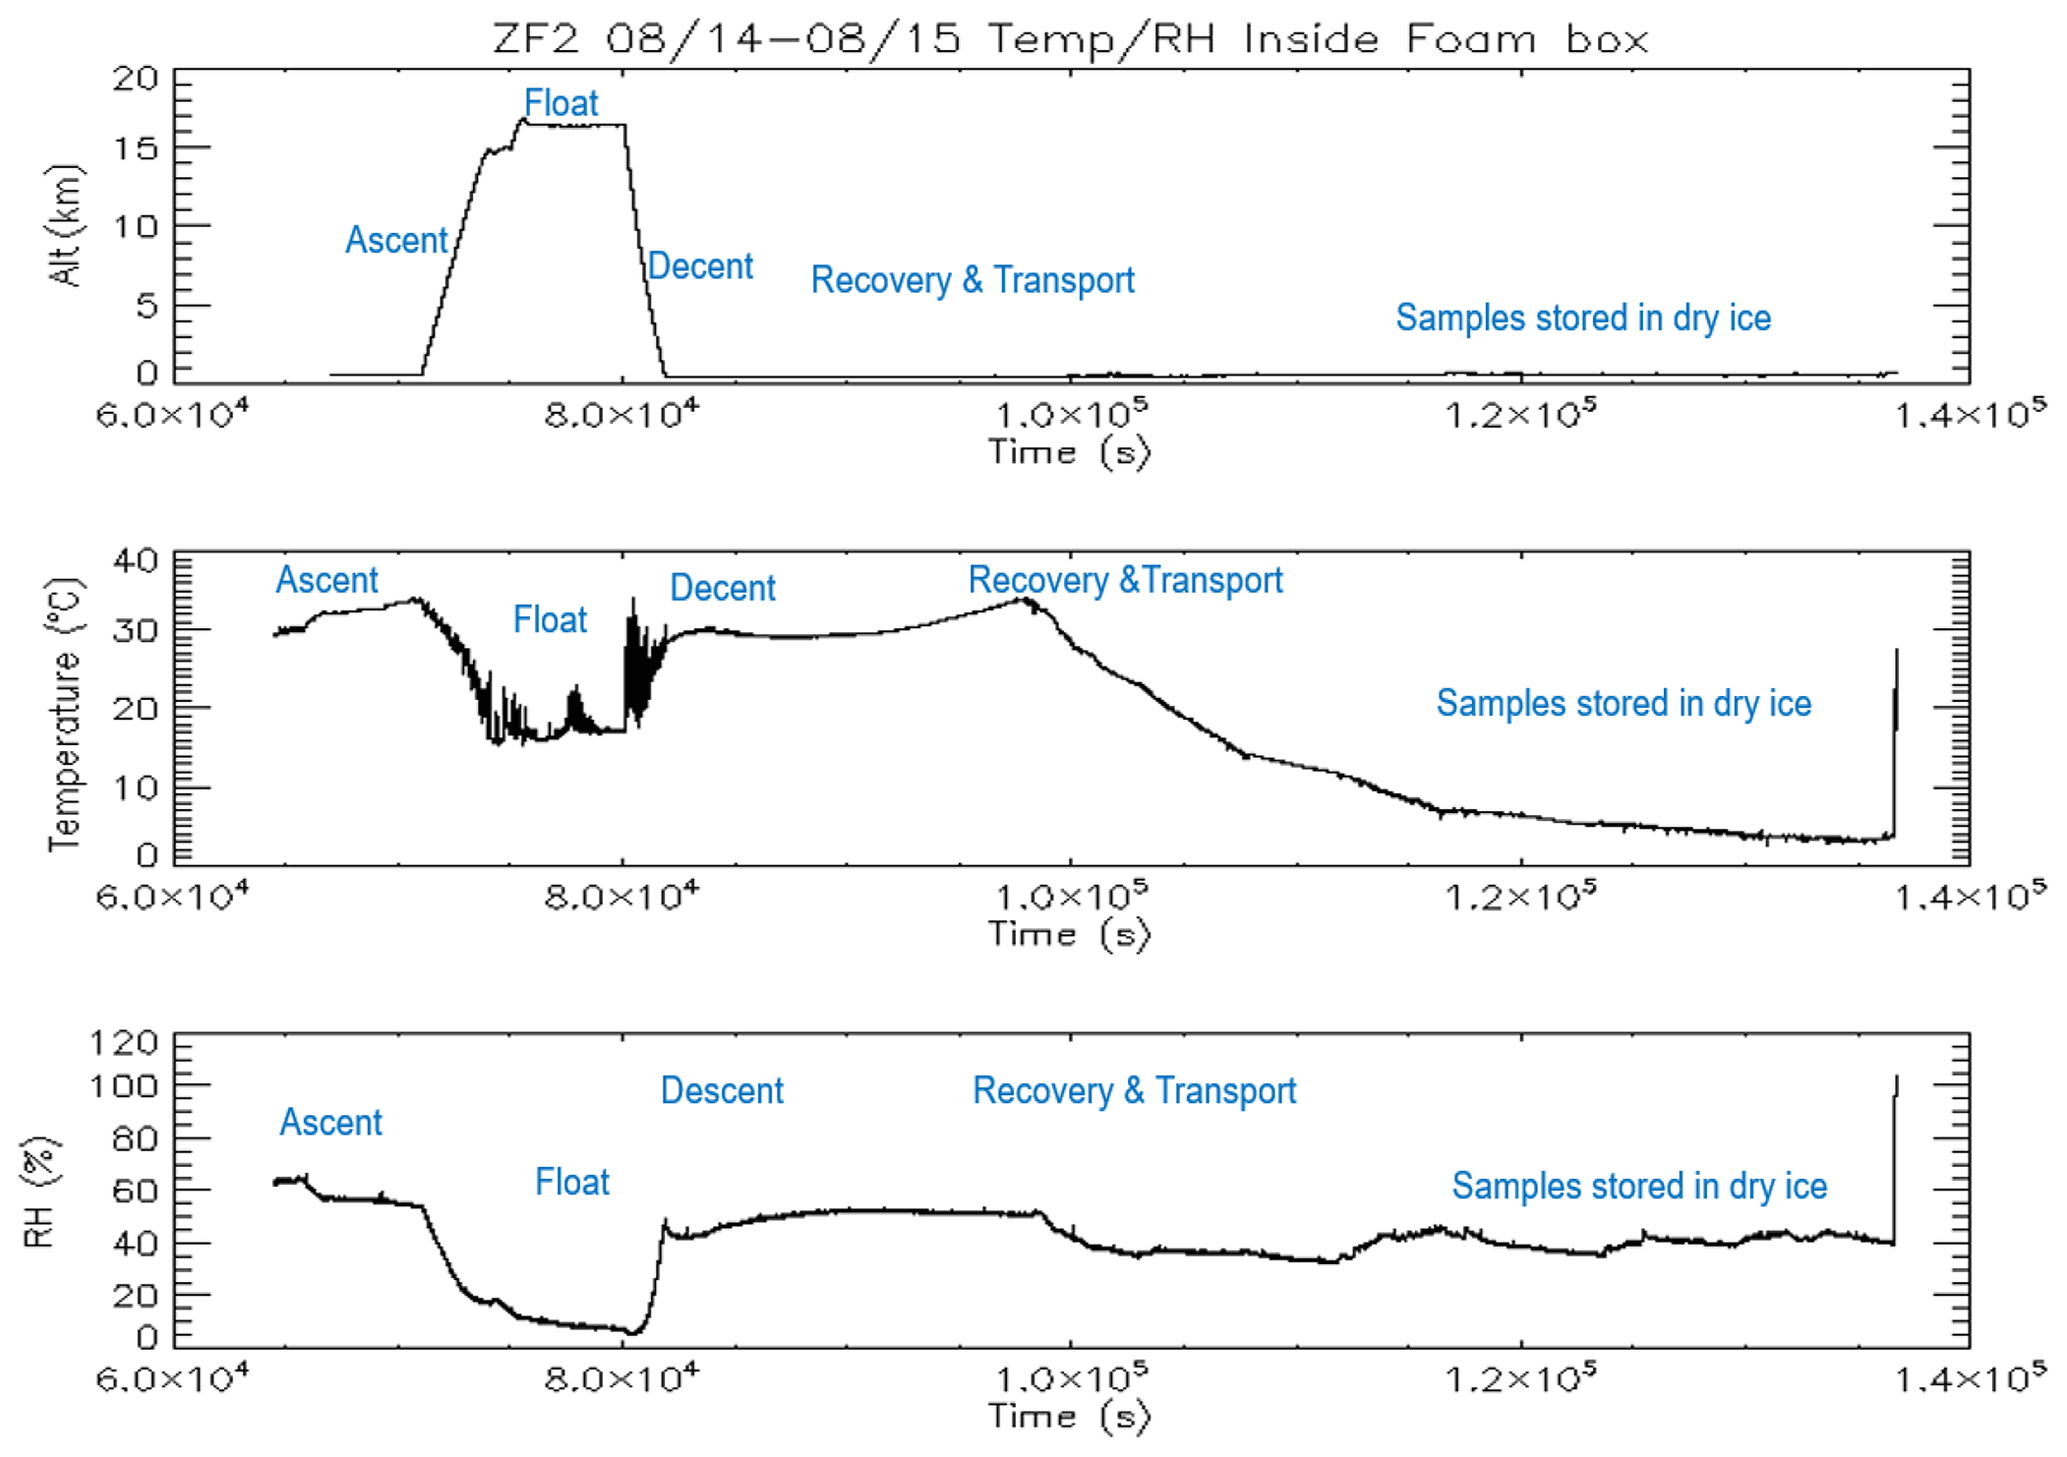
Figure 2Time series of the altitude, temperature, and relative humidity profiles of the samples inside the foam box during the ZF2 flight.
2.4 Analysis of major ions in aerosol samples
Aerosol samples were extracted in deionized water (Milli-Q, specific resistance ≥18.2 M Ω cm) in sterile polypropylene vials for 30 min (three intervals of 10 min each) using ultrasonication. The extract was further analyzed for water-soluble inorganic species (WSIS, such as Na+, K+, Mg2+, Ca2+, NH, Cl−, NO, NO, and SO using an ion chromatograph (Dionex ICS-5000 DC-5, Thermo Scientific). For calibration, 1000 mg L−1 stock solution of each cation (using Merck high-purity analytical-grade NaNO2, (NH4)2SO4, KNO3, CaCl2 ⋅ 2H2O, and Mg metal) were prepared. In addition, mixed standards were prepared by diluting stock solutions in polypropylene vials, thereby satisfying the primary requirement of instrument calibration for cations. Similarly, anion Multi-element standard II (1000 mg L−1 in H2O, reference no. HC 409399, Merck) was diluted subsequently as instrument calibration for anions. Post extraction, the extract of each sample was then separated and eluted in the cation column (Dionex IonPac™ CS16, 5 mm ×250 mm) and anion column (Dionex IonPac™ AS23, 4 mm ×250 mm) via the interaction with the mobile phases, i.e., 30 mM methyl sulfonic acid (MSA) for cations and a mixture of 4.5 mM carbonate +0.8 mM bicarbonate solutions for anions. The quantification of each ion was then performed using the conductivity detector. Several blanks were analyzed along with the samples. The ionic concentrations reported here are blank corrected. As the concentrations of different species were too low in UTLS aerosol samples, only those values which were at least 2 times higher than their respective blanks are reported. More than 50 % of samples were repeated for reproducibility, and they were found to vary by between 2 % and 20 % for all of the analyzed ions. To validate the analysis, Dionex Six Cation-I Standard (product code 040187) and Dionex Combined Seven Anion Standard II (product code 57590) were diluted and checked in the respective cation and anion calibration curves which were found within ±10 % relative standard deviation (RSD).
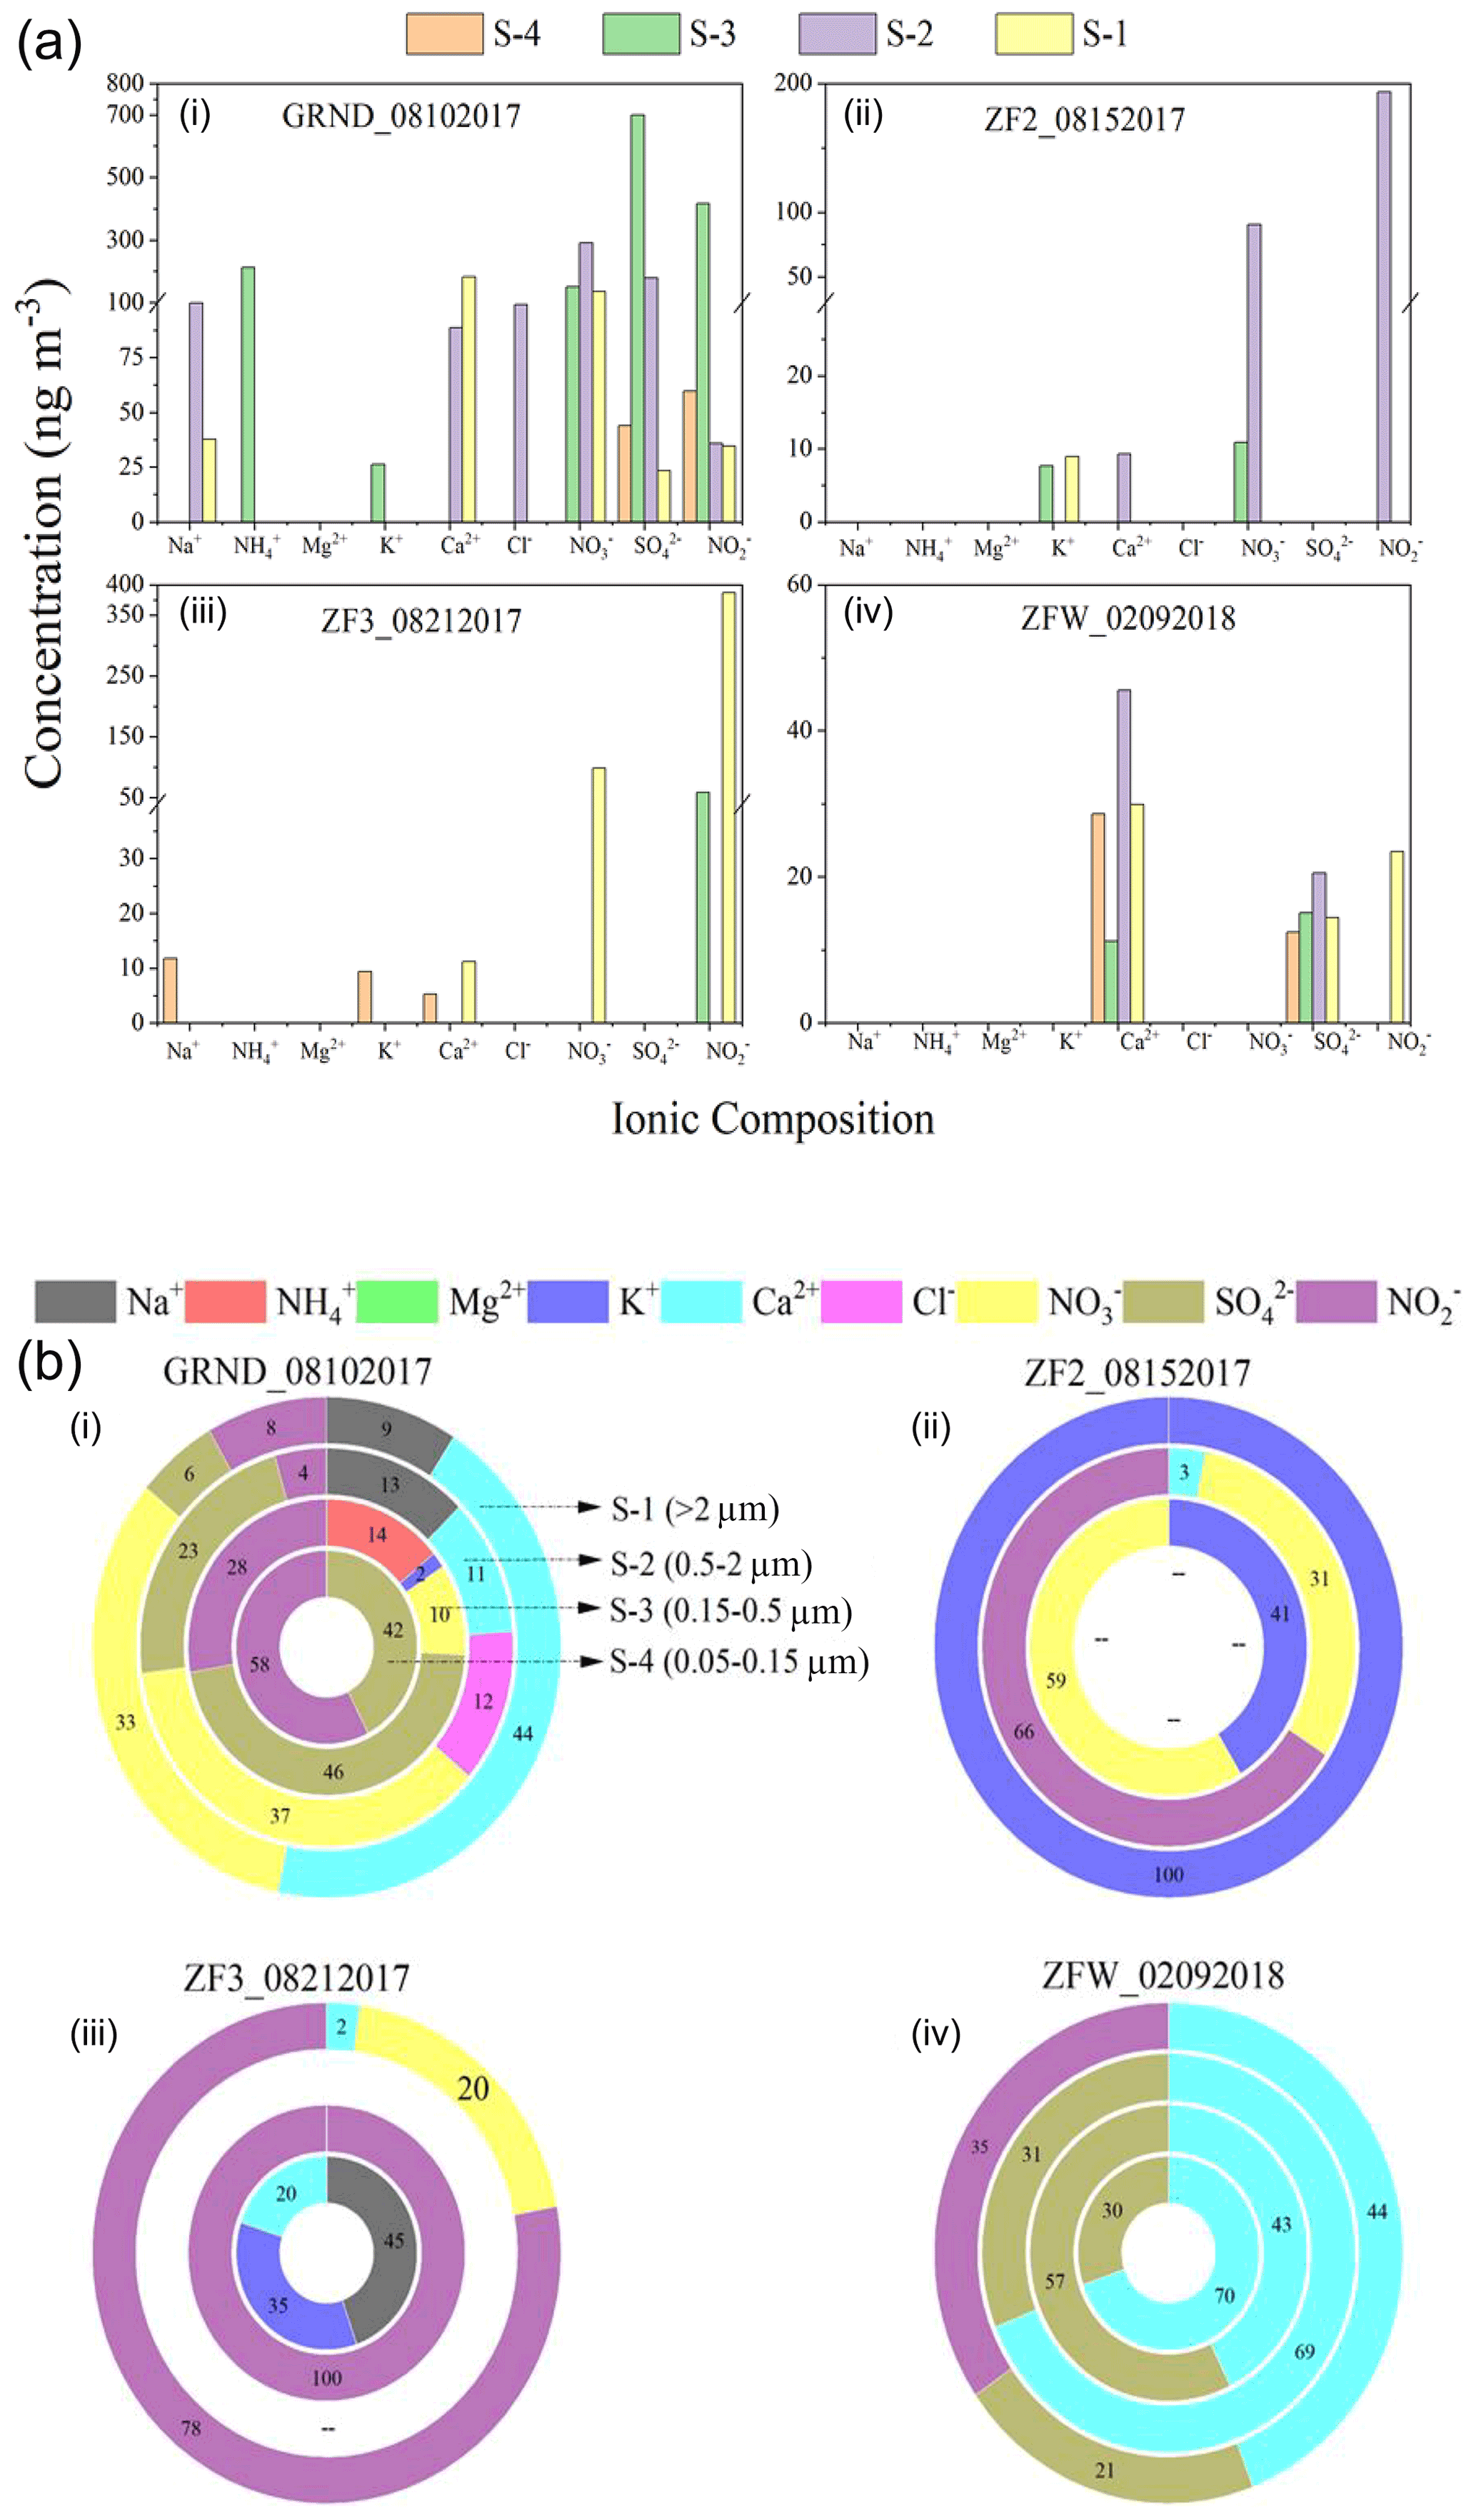
Figure 3(a) Results from the analysis of inorganic aerosol for aerosol ionic composition of the filters collected (i) on the ground (ii) during ZF2, (iii) during ZF3 in summer 2017, and (iv) during ZFW in winter 2018. (b) The percentage distribution of individual ions. S-1 to S-4 indicate the four stages of the impactor. The size cutoffs are >2, 0.5, 0.15, and 0.05 µm for S-1, S-2, S-3, and S-4, respectively.
Figure 3 shows the ionic concentration of ground samples (GRND) as well as those of airborne samples (ZF2 and ZF3) collected aboard zero-pressure flights on 15 and 21 August 2017. Additionally, the figure also shows the ionic concentration of the flight held during the winter 2018 campaign denoted as (ZFW). In GRND samples, Na+ and Ca2+ cations are seen on S-1 and S-2 with corresponding anions (NO, SO, and NO coexisting at the same stage. High NH is observed only on S-3, with a concentration of 212 ng m−3 at STP. K+ was also seen on S-3, with a concentration of 26 ng m−3 at STP (fine mode), and could have originated from biomass burning. City pollution from Hyderabad is likely the source of those aerosols observed on the GRND filters. Flights ZF2 and ZF3 show significant amounts of NO and NO (87–343 ng m−3 at STP) with trace amounts of mineral dust proxies (Ca2+). Biomass burning (K+) was observed in the results of flight ZF2 only. The presence of non-sea-salt Ca2+ in aerosols is often used as a proxy for mineral dust (Schüpbach et al., 2013), whereas non-sea-salt K+ in aerosols is often used as a proxy for biomass burning (Li et al., 2003). Although their concentrations were too low (close to the detection limit), their presence indicates the possibility of trace contributions from mineral dust and biomass burning.
Other species were below 5 (for cations) to 10 (for anions) ng m−3 at STP, the detection limit of the IC instrument for our analytical setup. Charge balance was not achieved due to a higher negative charge, mainly from NO and NO, than positive charge, mainly from NH, Ca2+, and K+ (Fig. 3), implying the existence of NO and NO in forms other than salt. For instance, nitric acid trihydrate (NAT, HNO3 ⋅ 3H2O) could be another aerosol cluster in which NO may be present in the tropical UTLS (Voigt et al., 2000). We did not find a significant amount of ammonium in our ZF flight samples during the summer. Overall, the concentration of nitrate (80–100 ng m−3 at STP) found on both flights seems to be lower than the levels observed during StratoClim (Höpfner et al., 2019). In the only flight during the winter of 2018, Na+ and K+ were almost inexistent. In comparison, the mineral dust proxy (Ca2+) was present in trace amounts on all four impactor stages and could be associated with SO, which was also found on all four stages (Fig. 3b).
Balloon-borne and aircraft sampling techniques have been used since the early 1970s to study the composition of aerosols in the UTLS region (Lazarus et al., 1970). Höpfner et al. (2016) reported the presence of enhanced amounts of NO3 between 12 and 15 km within the Asian summer monsoon region. While sulfate tends to be stable enough to be collected and further analyzed without major chemical transformation, other nitrate-containing particles can be more unstable. NO salts apart from NH4NO3 are not significantly volatile after sampling (Newman, 1993). The dissociation of NH4NO3 into gas-phase HNO3 and NH3 increases sharply with increasing temperature and relative humidity (Stelson and Steinfield, 1982; Lightstone et al., 2000), leading to a significant loss of particulate nitrate (PN). The slight retention of HNO3 (gas) on the PTFE (polytetrafluoroethylene) filter could represent a significant source of particulate nitrate on filters at low concentrations and has been used in the past to estimate stratospheric HNO3 (Lazarus et al., 1970). Additional information available during ZF2 will be discussed to assess the presence of ice clouds.
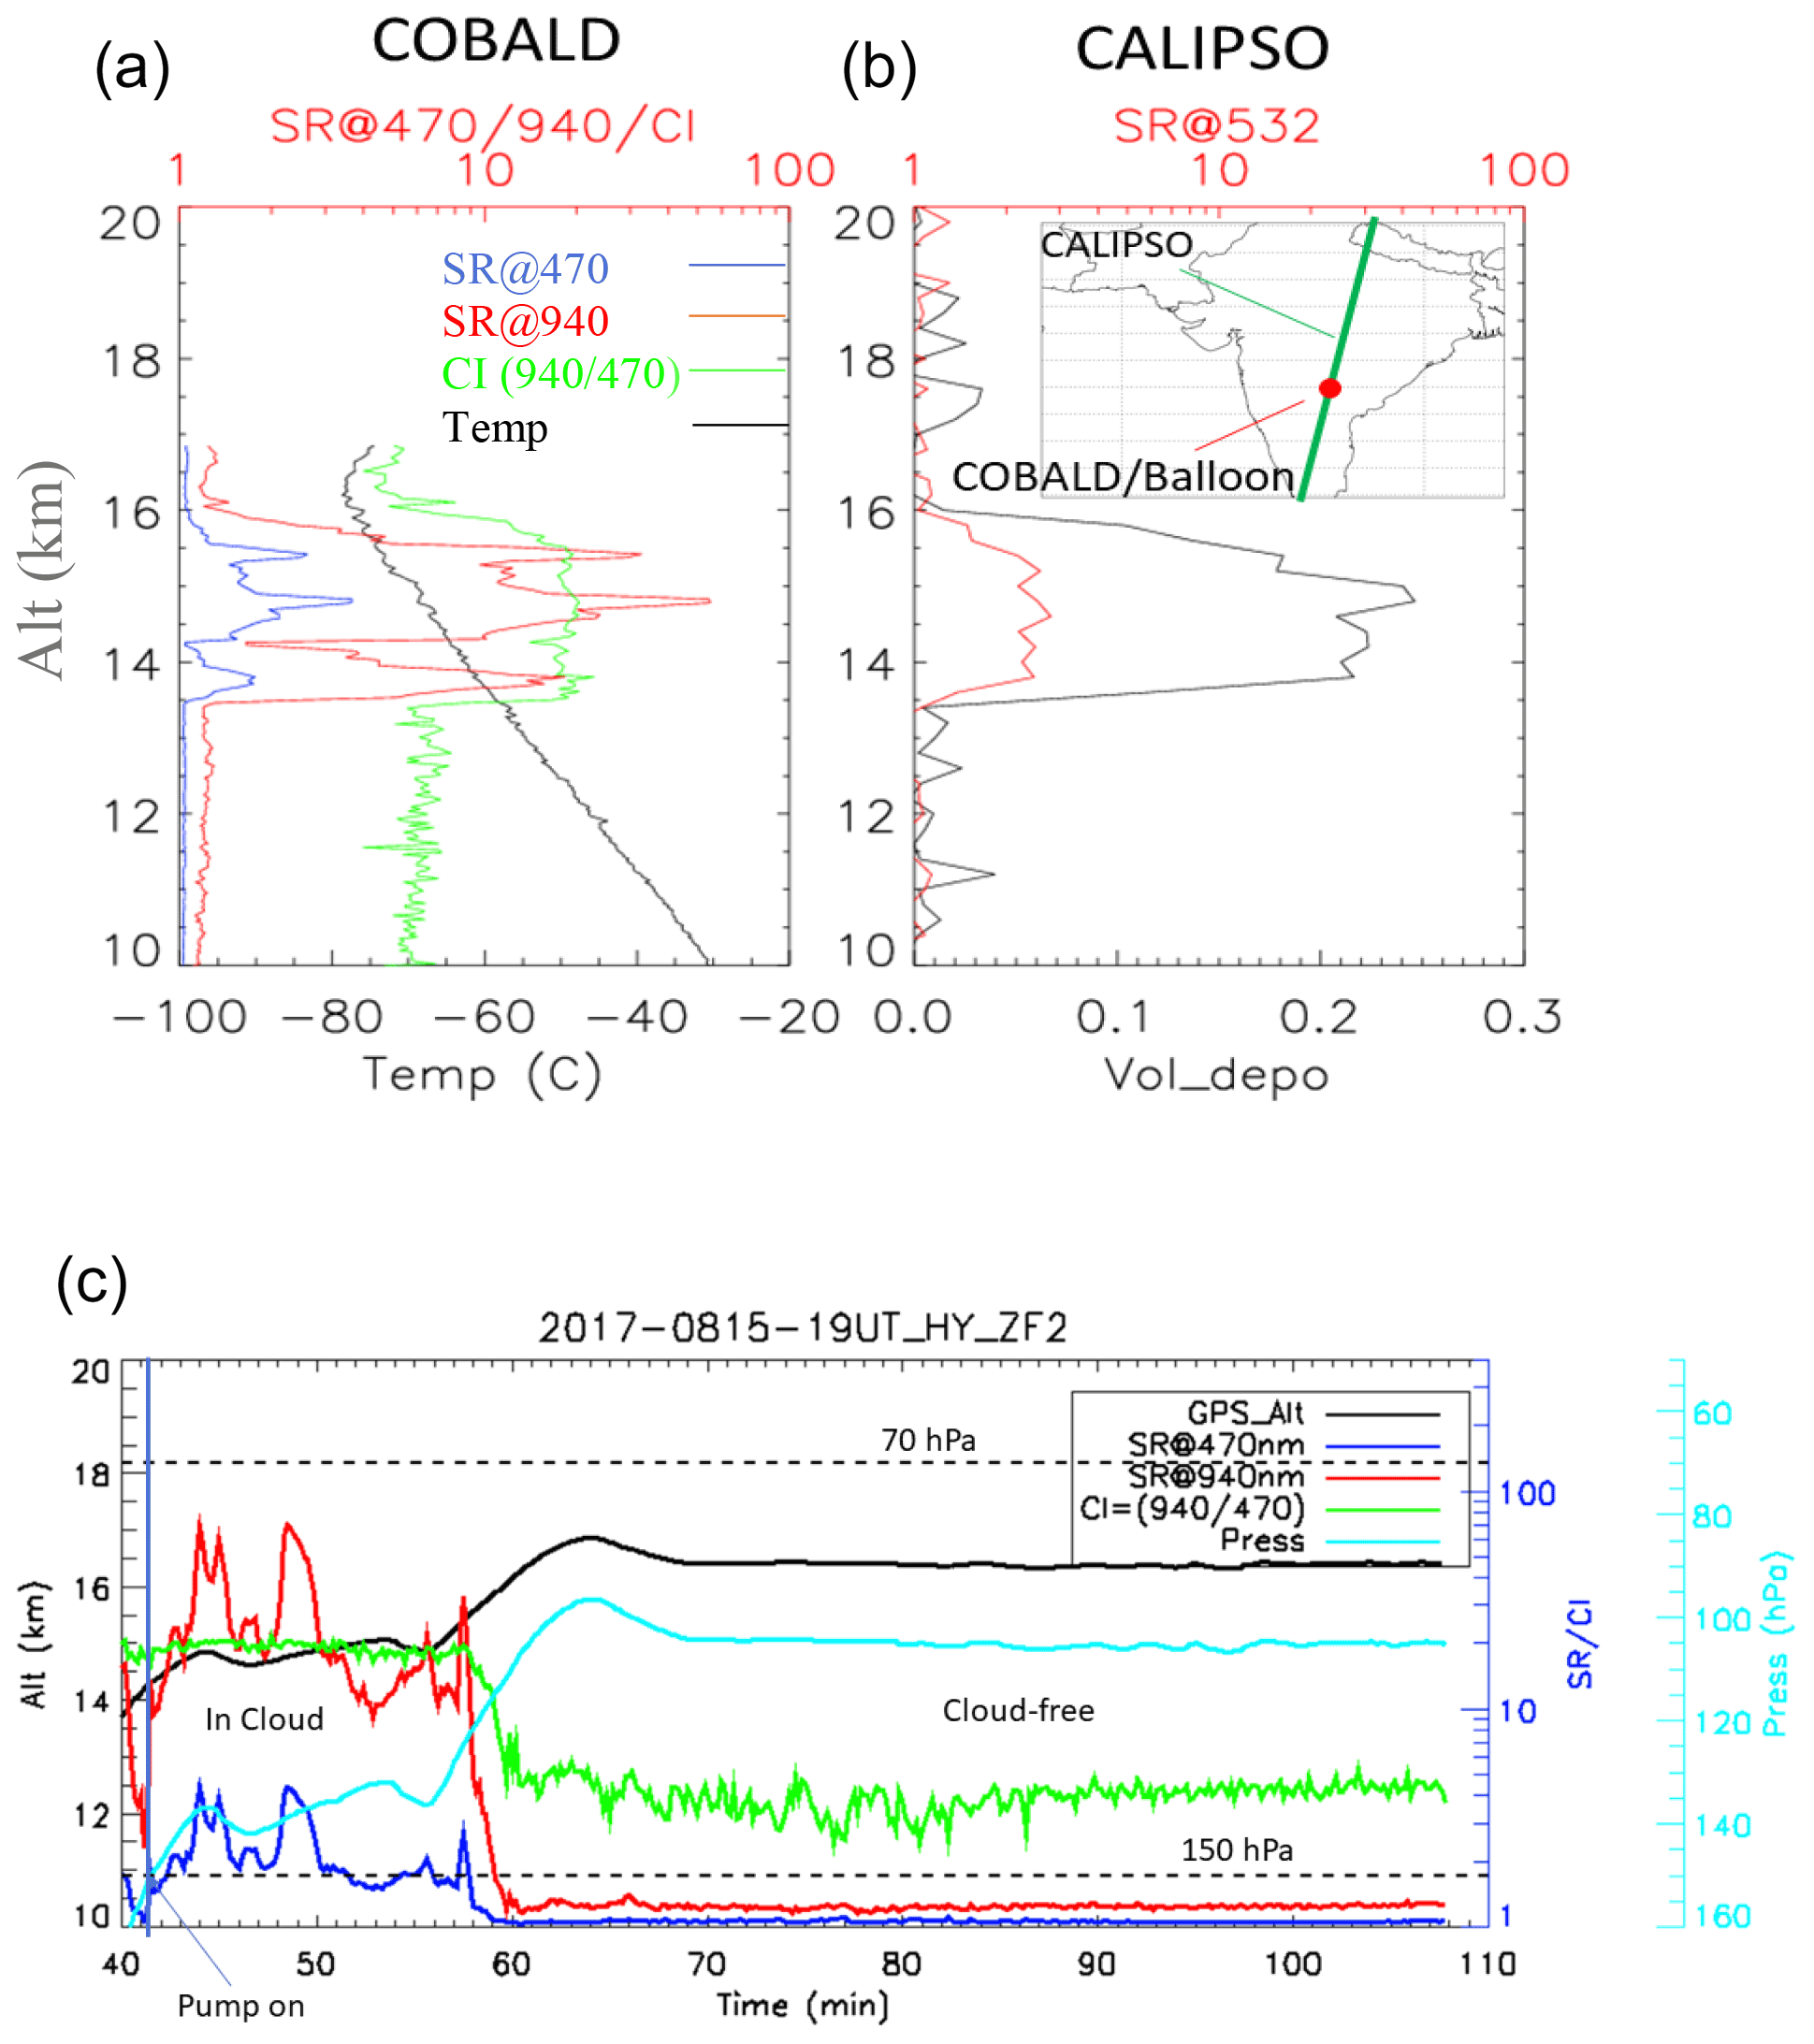
Figure 4(a) COBALD balloon in situ scattering ratio (SR) and color index (CI) profiles and (b) CALIOP satellite SR and volume depolarization profiles co-located in time and space (within 20 km and 1 h, respectively) on 15 August at 19:00 UT. (c) Time series along ZF2 of SRs at 940 and 470 nm from COBALD as well as the GPS altitude and measured pressure from the iMet radiosonde.
We will now focus the discussion on ZF2, which included a COBALD backscatter sonde and was launched to be co-located in space and time (within 20 km and 1 h, respectively) with satellite observations from the CALIOP lidar aboard the CALIPSO satellite. Figure 4a and b show scattering ratio (SR) and color index (CI) profiles from COBALD (470 and 940 nm) as well as CALIOP SR and volume depolarization profiles at 532 nm. Both balloon and satellite observations show a layer between 13.5 and 16 km with high depolarization (CALIOP) and a high color ratio (COBALD), likely made of aspherical particles. The derived particulate depolarization ratio from CALIOP Level 2v4.1 within the layer was (Fig. S3 in the Supplement) and was associated with an optical depth of , indicating the presence of a subvisible cirrus cloud. Flight ZF2 floated near 14.5–17 km for more than 2 h (Fig. 1c). The time series (Fig. 4c) indicate that the measurements took place within two different air masses: first within an ice cloud, as discussed above, and then in a cloud-free region. The pump connected to the impactor was switched on below 150 hPa and run for ∼16 min within the cloud and for ∼1 h 30 min in a cloud-free region.
4.1 In-cloud nitrate particles
The sampling within an ice cloud (Fig. 4) during ZF2 could, therefore, indicate the presence of in-cloud NO. HNO3, (an oxidation product of NOx) and NH3 (released from agricultural sources) are said to be absorbed into cloud droplets which then aid in the conversion of HNO3 to aerosol NO (Hayden et al., 2007). HNO3, being readily soluble, tends to completely dissolve in cloud water (Steinfeld and Pandis, 1998). Bela et al. (2016) found an almost 90 % scavenging efficiency for HNO3 by sampling the inflow and outflow of convective storms over the United States during the Deep Convective Clouds and Chemistry (DC3) field campaign. However, we found that ZF2 sampled 90 ng m−3 at STP of NO for particle sizes between 2 and 0.5 µm on stage 2 and 11 ng m−3 at STP of NO on stage 3, corresponding to particle sizes between 0.5 and 0.15 µm; this indicates that other mechanisms might be taking place for HNO3 and nitrate to survive convection. Our measurements took place at a much higher altitude (16–17 km instead of 10–12 km) and much colder temperature (−70 to −80 ∘C) than DC3, which may explain this apparent contrast between DC3 and our measurements. Bela et al. (2016) found that ice retention had little impact on scavenging efficiency in the Weather Research and Forecasting (WRF) model coupled with Chemistry, suggesting that HNO3 formation in ice clouds via lightning-induced NOx could be a more efficient source than convective transport. The GEOS-Chem chemical transport model (CTM) showed the presence of inorganic nitrate aerosol to be dominant in the ATAL (Gu et al., 2016), with a significant fraction from lightning-induced NOx (Fairlie et al., 2020). The authors concluded that gas–aerosol conversion of HNO3 was the driving factor behind this dominance, via the processes discussed above.
4.2 NAT particles
Another candidate for the presence of nitrate on the filters could be NAT particles. They have been reported in tropical ice clouds by Voigt et al. (2008) with sizes (D<6 µm) consistent with their sampling on stages 1 (>2 µm) and 2 (0.5–2 µm) of our impactor. In addition, NAT nucleation seems to be more efficient in subvisible ice clouds at higher ambient temperature than the temperature associated with NAT formation at −78 ∘C (Voigt et al., 2008). The sampling within the ice cloud at temperatures between −65 and −75 ∘C would allow the presence of NAT. However, in the process of sampling, transport, and extraction, there is the strong possibility of NAT particle losses (if they were collected). In addition, if NO was present in another form (refractory nitrate), it would remain relatively stable during the abovementioned processes. Observed cations were close to or below the detection limit compared with the significant concentrations of NO and NO. This observation along with the higher abundance of NO allowed us to suggest the presence of NAT particles. However, the reported NAT concentrations should be considered as the lower limit, presuming some losses (unquantifiable) during the sampling, transport, and extraction processes.
4.3 In-cloud calcium and its implication
The IC results of flight ZF2 showed the presence of particles of Ca2+ (9 ng m−3 at STP) on stage 2 of the impactor (0.5–2 µm). The erosion of calcareous soils followed by strong convective vertical transport during summer results in cloud water calcium (Issac et al., 1990). Cloud water experiments have shown the formation of Ca(NO3)2 in the presence of NH3. Hill et al. (2007) and Leaitch et al. (1986) found a positive correlation between Ca2+ and NO. In addition to Ca2+, ZF2 also showed the presence of NO (90 ng m−3 at STP) on the same stage of the impactor (large particles <2 µm), further implying the possibility of Ca(NO3)2 formation in the presence of the acid HNO3. Lastly, a high concentration of nitrite (193 ng m−3 at STP) was also found on stage 2 of the impactor. The presence of nitrite in clouds is further discussed in Sect. 7.
For the only flight during the winter of 2018, Na+ and K+ were almost inexistent. In comparison, the mineral dust proxy (Ca2+) was present on all four impactor stages: 30 ng m−3 on stage 1 (particle sizes >2 µm), 46 ng m−3 on stage 2 (particle sizes between 0.5 and 2 µm), 11 ng m−3 on stage 3 (particle sizes between 0.15 and 0.5 µm), and 29 ng m−3 on stage 4 (particle sizes between 0.05 and 0.15 µm). Interestingly, SO was also found on all four stages (Fig. 3b): 14 ng m−3 on stage 1, 21 ng m−3 on stage 2, 15 ng m−3 on stage 3, and 12 ng m−3 on stage 4. Satellite analysis of aerosol extinction at 1020 nm from the Stratospheric Aerosol and Gas Experiment III (SAGE III) was conducted to understand the origin of those particles. We found high aerosol extinction values in the Northern Hemisphere from August 2017 to February 2018, consistent with the presence of smoke from the 2017 Canadian fire (Fig. S2).
Fires that intensify towering thunderstorms have the tendency to inject aerosols into the lower stratosphere that were otherwise thought to have originated from volcanic plumes (Fromm et al., 2010). The 2017 Canadian wildfire event led to the formation of multiple pyrocumulonimbus (PyroCb) episodes, resulting in a vast aerosol cloud. Within a few weeks, a portion of this initial plume was transported by the polar jet streams across the Atlantic Ocean in the Northern Hemisphere (Peterson et al., 2018), causing a strong perturbation of the stratospheric aerosol loads (Stocker et al., 2021). The quantity of smoke injected was enormous – so much so that it was observed for more than 8 months (Yu et al., 2019. The presence of the resultant aerosol layer was pointed out by high ultraviolet aerosol index values and confirmed with CALIOP lidar observations in the UTLS (Torres et al., 2020). The aerosol mass increase and subsequent adiabatic aerosol self-lofting as a result of absorption of solar radiation were also observed by the Earth Polychromatic Imaging Camera (EPIC) sensor aboard the Deep Space Climate Observatory (DSCOVR) satellite. Kloss et al. (2019) used SAGE III aerosol extinction values to show that the fire plume was transported within the AMA circulation in August 2017. Our analysis suggests that the smoke plume was still present at 18 km above Hyderabad between January and February 2018, indicating that aerosols sampled during the winter flight were influenced by this smoke plume.
Deep convection, emanating from Southeast Asia, and maritime convection over surrounding seas serve as a conduit for the transport of boundary layer (BL) pollutants (CO, HCN, CH4) to the UTLS (Belikov et al., 2013; Park et al., 2007, 2006; Randel et al., 2010). Wind-driven physical processes lead to the accumulation of pollutants due to the limited exchanges of air between the interior and exterior of the Asian monsoon anticyclone (Fairlie et al., 2014, 2020; Ploeger et al., 2015).
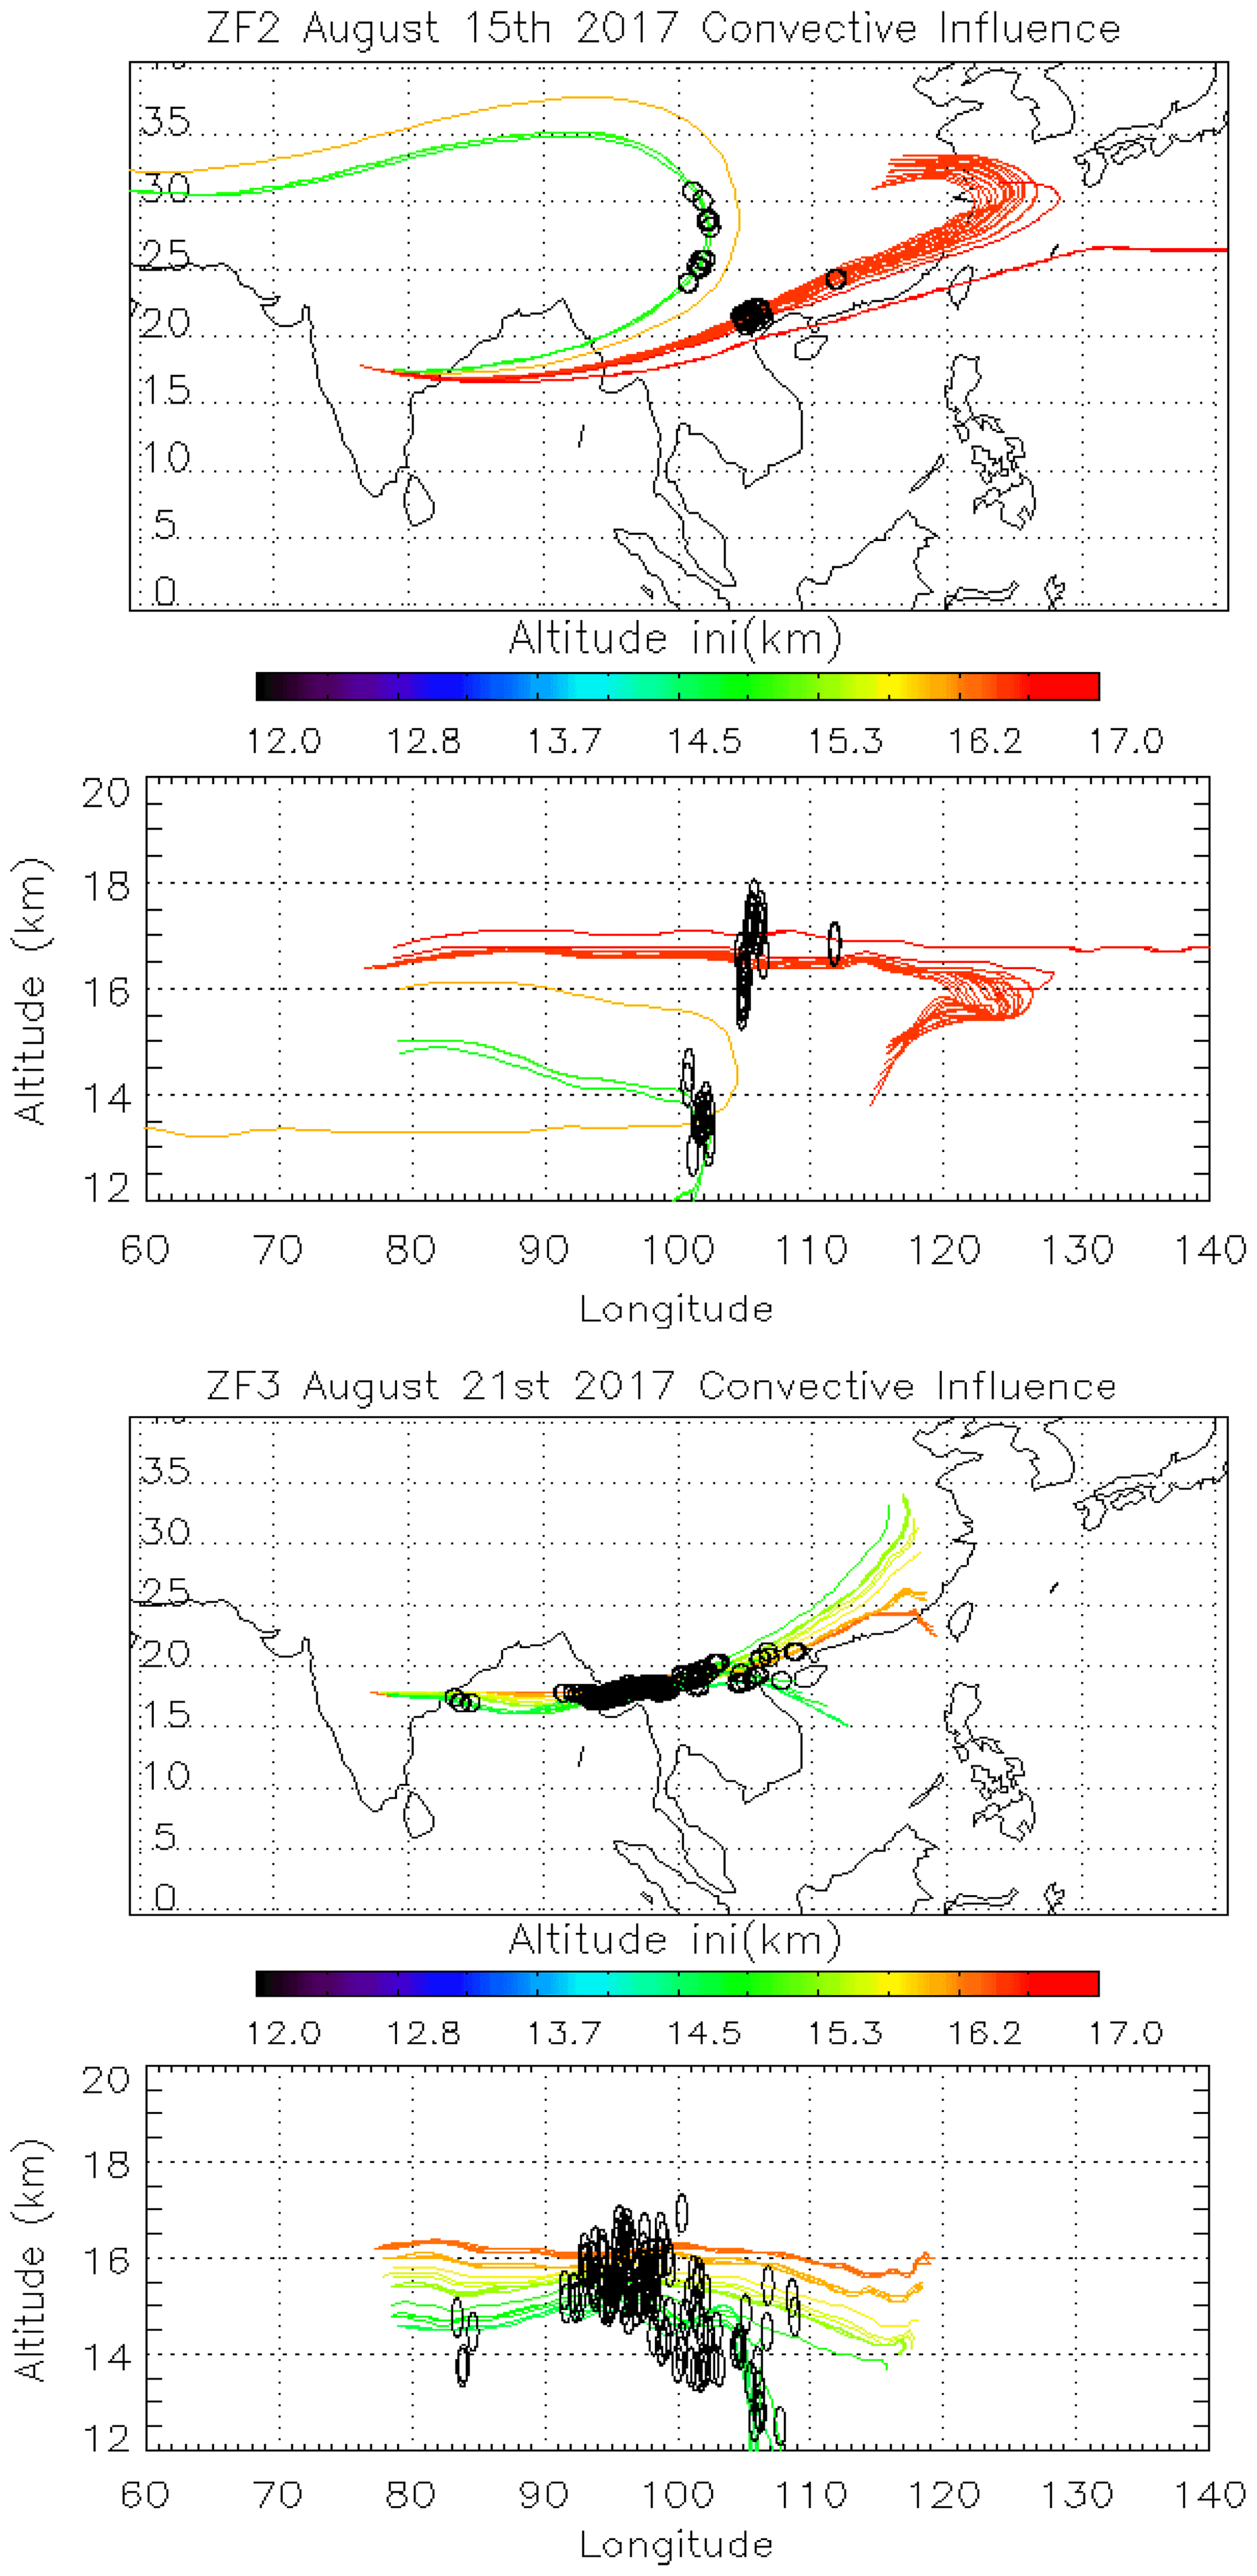
Figure 5Back trajectories initialized from ZF2 (15/08) and ZF3 (21/08) measurements between 150 and 70 hPa. Black dots along the trajectories are the position of convective systems intersecting air masses sampled during the balloon flight.
To study the impact of convection on our measurements, we calculate back trajectories from ZF2 and ZF3 using the Langley Trajectory Model (LaTM; Fairlie et al., 2014) driven by winds from the NASA Global Modelling and Assimilation Office (GMAO) Goddard Earth Observing System, Version 5, Forward Processing (GEOS-5 FP) product (Lucchesi, 2018). We locate the intersection with anvils and deep convective clouds observed through cloud-top brightness temperature from the Himawari-8 satellite (Vernier et al., 2018). Figure 5 shows the position of those 5 d back trajectories (colored lines) and deep convective influences (black dots). Air sampled during ZF2 on 15 August 2017 traveled along two branches influenced by convection over southern/eastern China and western China, respectively. Air masses sampled by ZF3 originated from convection over Laos, Myanmar, the Bay of Bengal, and possibly local convection over the Indian eastern shore close to the measurement location.
The role of clouds in nitrite formation is further discussed in this section. To date, only a few nitrite measurements have been reported, mainly because of its low concentrations and the fact that nitrite ions are easily oxidized (Lammel and Cape, 1996). The first quantitative information on nitrite in cloud water was detected at Mt Tsukuba, Japan: values of 400–1050 µg L−1 with pH levels of 5.7–6.5 were reported. In contrast, acidic cloud water samples (pH of 3.4–4.3) collected at significantly higher altitudes showed low nitrite values (15–104 µg L−1) (Okita, 1968). Nitrite and nitrous acid are short-lived intermediates of reactive oxidized nitrogen in the atmosphere. There is limited information on nitrite measurements in the atmosphere (Lammel and Cape, 1996). Nitrite was also measured in fog water samples in a polluted region in Germany (Lammel and Metzig, 1998). Moreover, Bachmann et al. (1989) directly measured nitrite in rain and fog water samples using ion chromatography; respective values of 1.8 and 16 µmol L−1 were found. Photolysis of particulate nitrate, hydrolysis of NO2, and uptake of HNO2 by particles are the sources of particulate nitrite in the atmosphere (Chen et al., 2019).
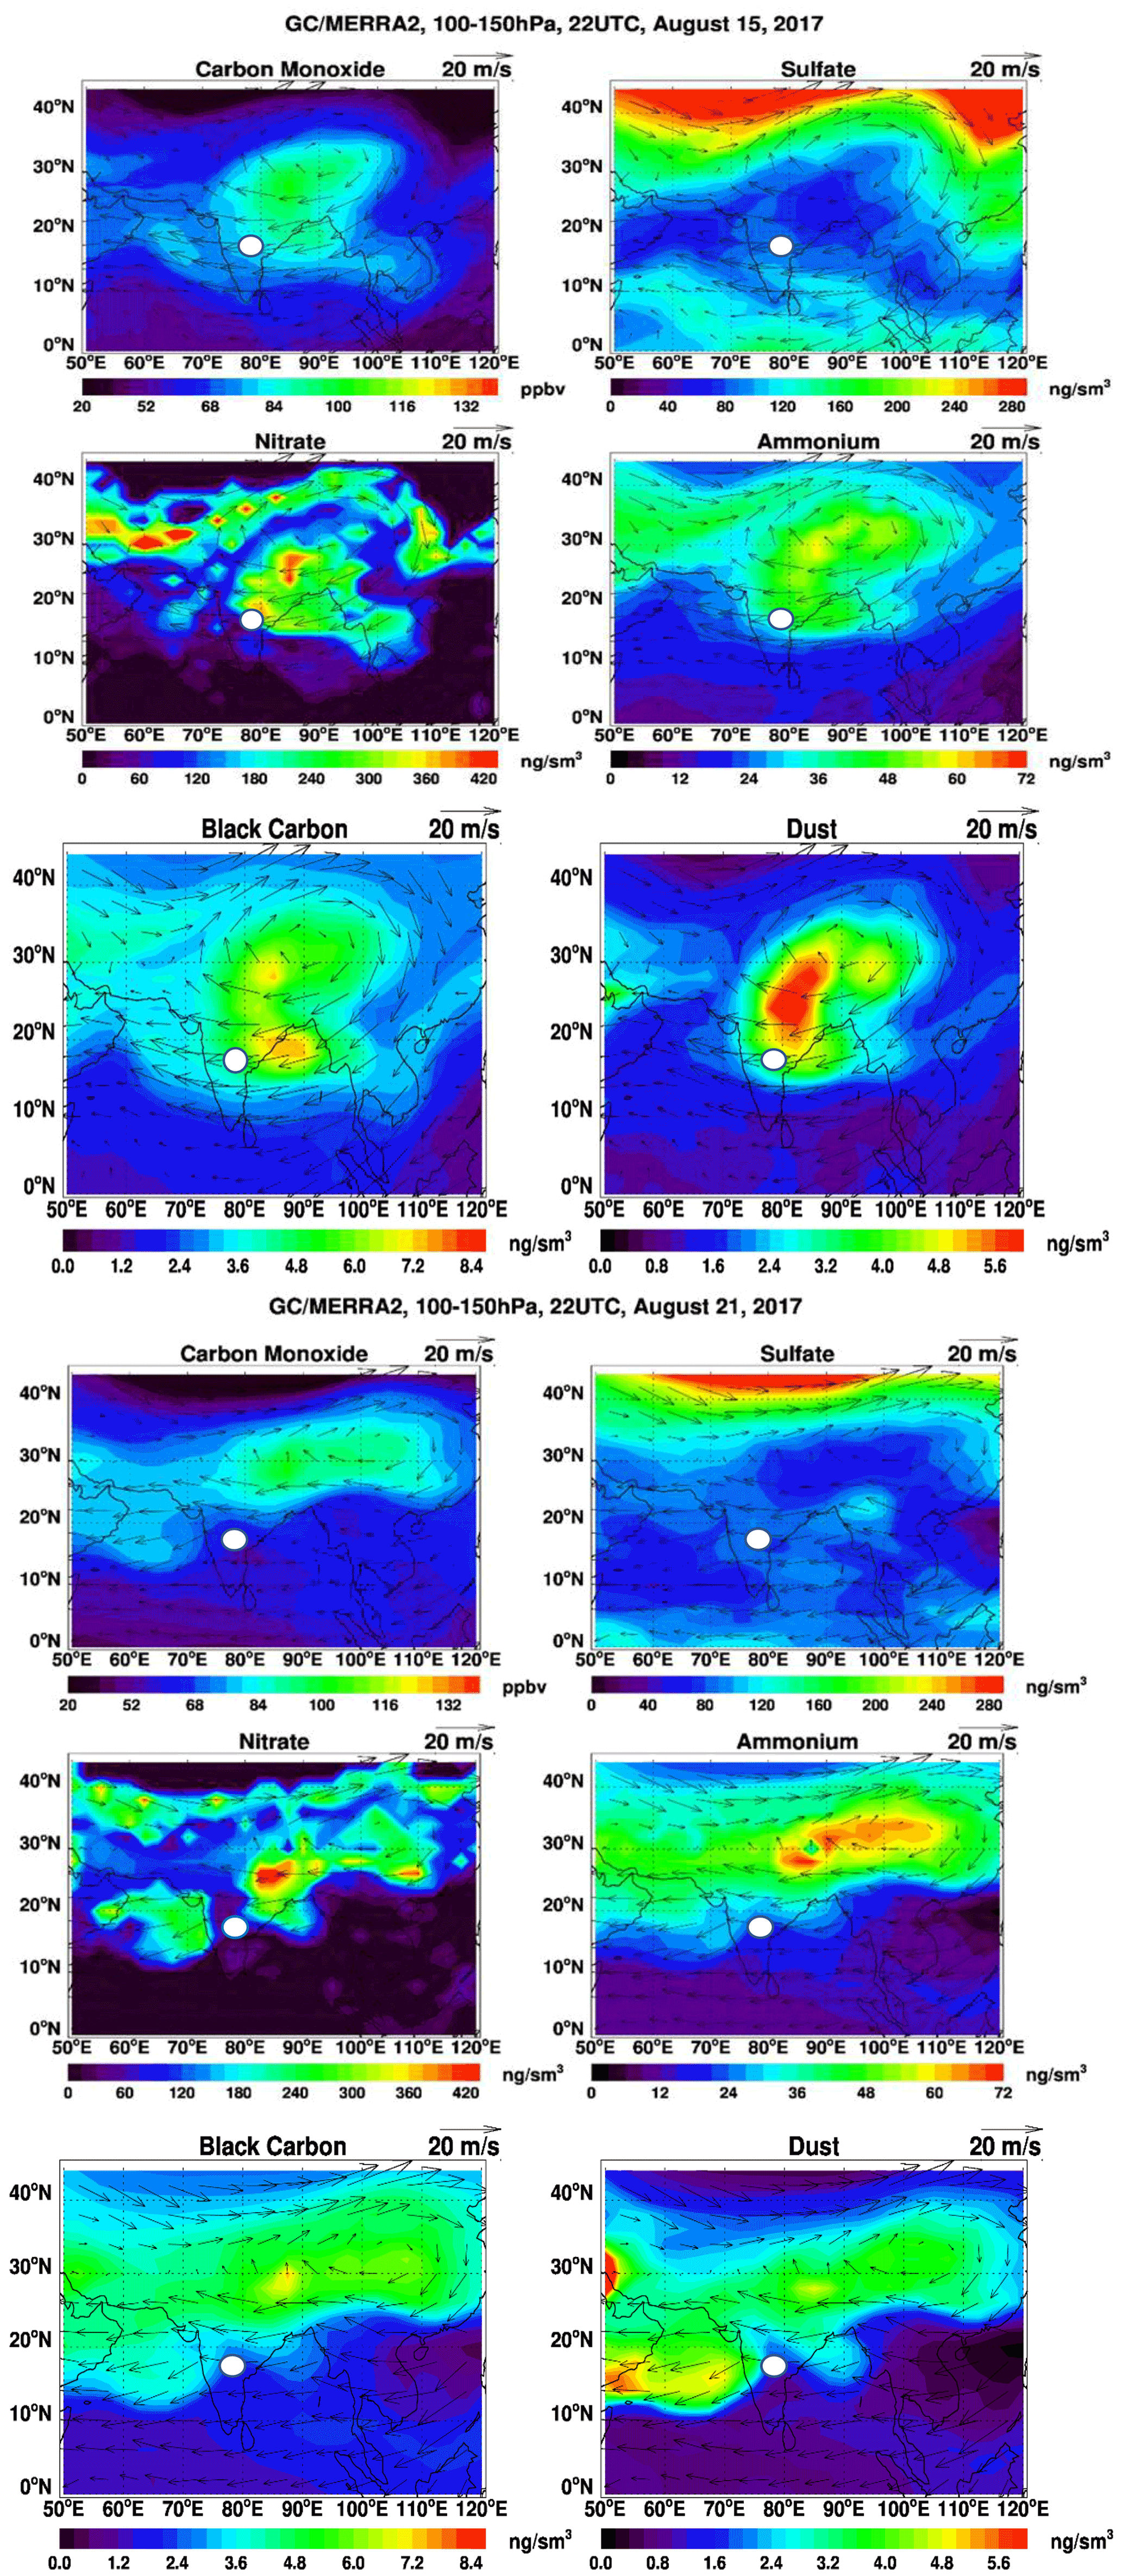
Figure 6The two sets of six panels show the respective GEOS-Chem model-simulated carbon monoxide (CO, ppbv), sulfate (SO, ng m−3 at STP), nitrate (NO, ng m−3 at STP), ammonium (NH,ng m−3 at STP), black carbon (BC, ng m−3 at STP), and dust (Ca2+, ng m−3 at STP) concentrations averaged over 100–150 hPa at 22:00 UTC on 15 August 2017 (top six panels) and 21 August 2017 (bottom six panels). Standard temperature and pressure are 298 K and 1013.25 hPa, respectively. Arrows denote the wind direction, and the white circle indicates the sampling location in Hyderabad, India.
HNO2 is an important precursor for nitrite formation, but there are challenges involved with making reliable HNO2 measurements at desired concentrations, leading to a lack of information about HNO2 in the troposphere. Firstly, due to its short lifetime (because of photolysis) and subsequent very low concentration from sources, HNO2 is a challenging species to observe. Secondly, HNO2, being sticky in nature, may be lost to the walls of sampling tubes or absorbed on filters. Thus, as nitrite is present in very low concentrations and is easily oxidized.
Intensive agricultural activities have led to the Indo-Gangetic Plain having the highest ammonia (NH3) loading worldwide (Wang et al., 2020), as revealed by satellite observations (Van Damme et al., 2018; Warner et al., 2016) and ground-based measurements (Carmichael et al., 2003). Dentener and Crutzen (1994) reported ammonia (NH3) emissions related to DMS (dimethylsulfide). Höpfner et al. (2016) reported the first detection of ammonia in the ATAL. Nitrite and nitrate are formed by the oxidation of NH3 through the process of nitrification [NH3 + O2 → NO + 3H− + 2e−]. In addition, the existence of NH3 in the presence of nitrate leads to the formation of ammonium nitrate which could neutralize aerosol particles and favor the persistence of nitrite, as revealed by a few existing measurements in the polluted region (Lammel and Metzig, 1998). The StratoClim campaign also revealed the presence of ammonium nitrate in the UTLS which would confirm that neutralization of nitrate is effective at high altitudes and may explain the persistence of nitrite found with our balloon measurements.
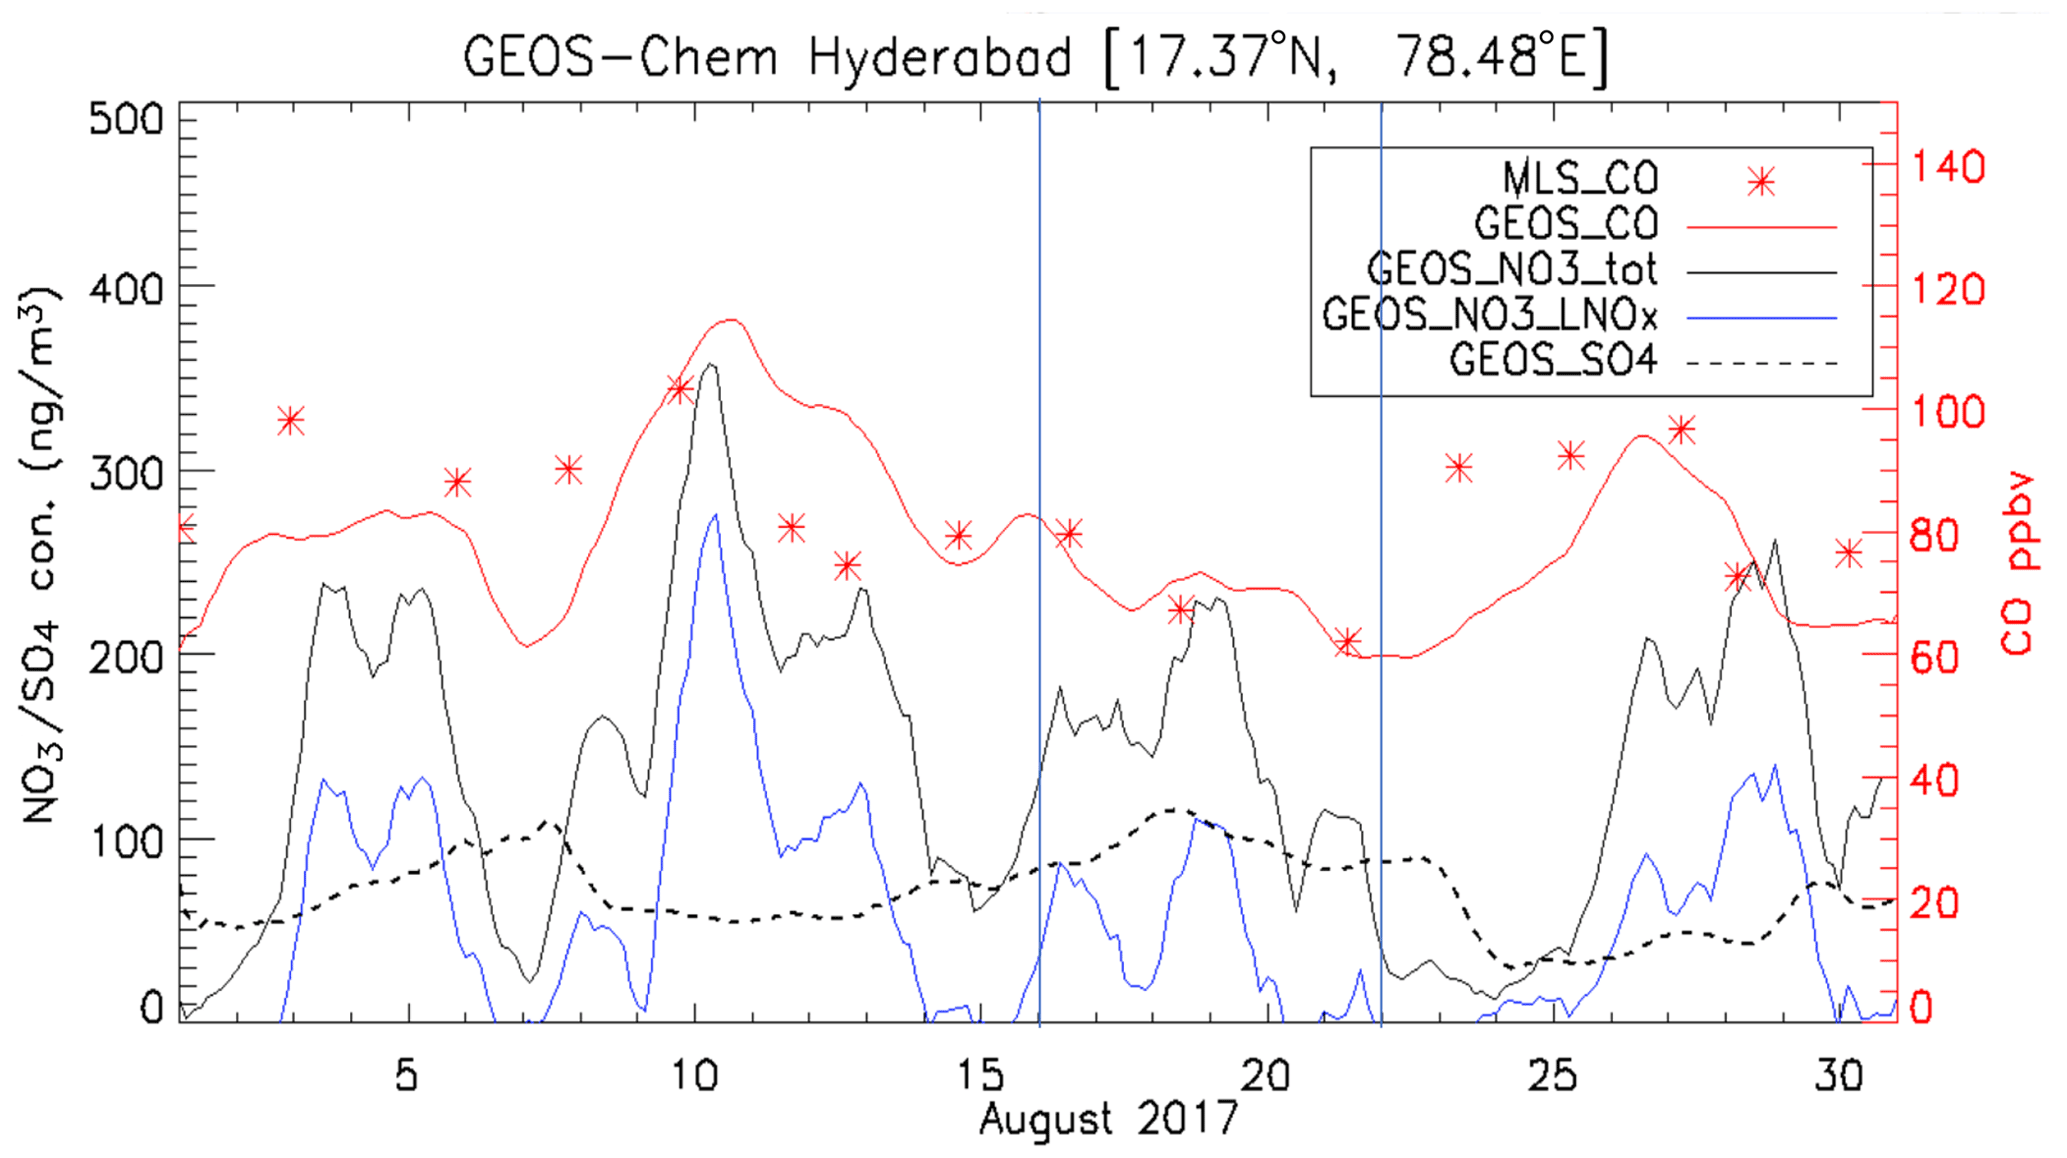
Figure 7Time series of simulated 3-hourly CO, SO, and NO concentrations averaged over 100–150 hPa at Hyderabad during the ZF2 and ZF3 flights on 15 and 21 August 2017. Also shown are concentrations of NO due to lightning NOx emissions (NO3_LNOx). See the text for details.
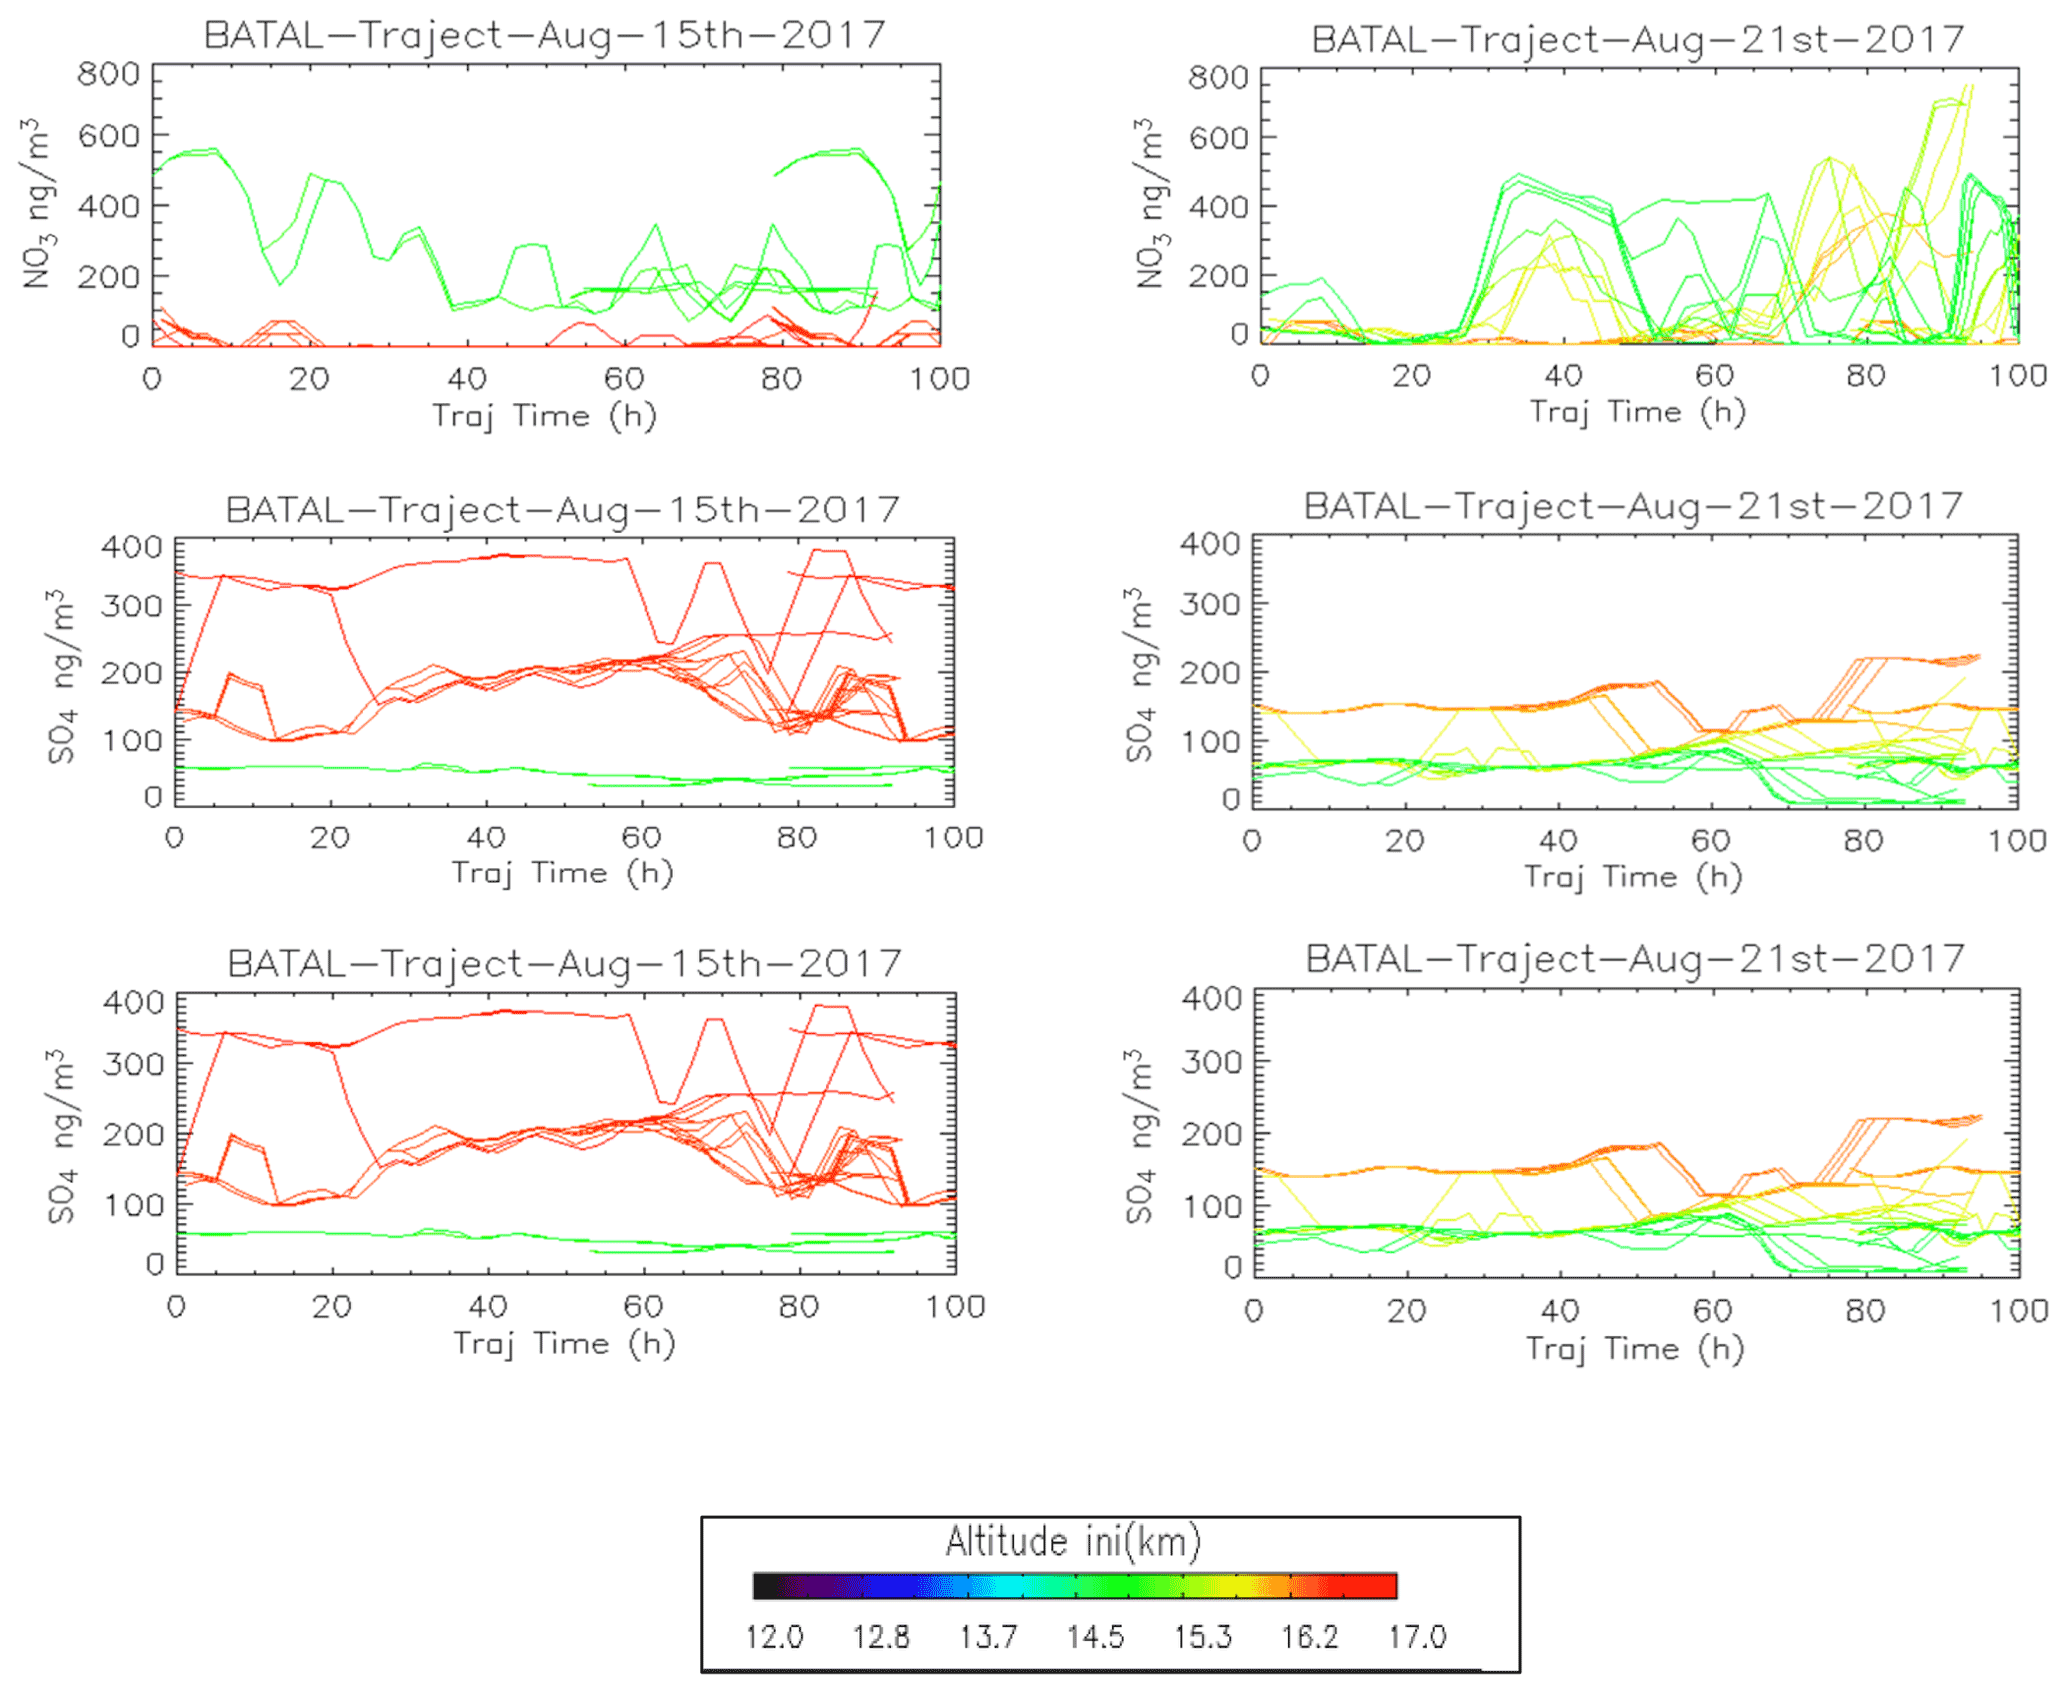
Figure 8GEOS-Chem model-simulated NO, CO, and SO concentrations (at STP) extracted along the trajectory lines during flights ZF2 and ZF3 (as shown in Fig. 5).
We conducted GEOS-Chem model simulations to put our observations in the context of the large-scale transport and distribution of atmospheric composition. GEOS-Chem is a state-of-the-art global 3-D chemical transport model that includes fully coupled ozone–NOx–volatile organic compound–aerosol chemistry for both the troposphere and stratosphere (Bey et al., 2001; Park et al., 2004; Eastham et al., 2014). Here, we use the model version 11-01 (http://wiki.seas.harvard.edu/geos-chem/index.php/GEOS-Chem_v11-01, last access: 29 July 2022). A previous version of the model was used to study the origins of aerosols in the ATAL by Gu et al. (2016) and Fairlie et al. (2020). The model simulates black carbon (Park et al., 2003), primary and secondary organic aerosols (POAs and SOAs, respectively; Pye et al., 2010), sulfate–nitrate–ammonium–aerosol thermodynamics coupled to ozone–NOx–hydrocarbon–aerosol chemistry (Park et al., 2004), mineral dust (Fairlie et al., 2007; Ridley et al., 2014), and sea salt (Jaeglé et al., 2011), treated as an external mixture. SOA simulation uses the volatility-based scheme (VBS) of Pye et al. (2010). Sulfate–nitrate–ammonium thermodynamics is computed using the ISORROPIA II thermodynamic equilibrium model of Fountoukis and Nenes (2007). ISORROPIA has been evaluated with in situ measurements during several campaigns in the United States (Guo et al., 2016, 2020) and, more recently, in Korea (Ibikunle et al., 2020). Aerosol wet deposition includes rainout and washout due to large-scale precipitation as well as scavenging in convective updrafts (Liu et al., 2001). Scavenging of aerosols by snow and mixed precipitation is described by Wang et al. (2011) and Q. Wang et al. (2014). Dry deposition of dust and sea-salt aerosols uses the size-dependent scheme of Zhang et al. (2011). Dry deposition for other aerosols follows the resistance-in-series scheme of Wesely (1989). Anthropogenic emissions use the Emissions Database for Global Atmospheric Research (EDGAR; Olivier and Berdowski, 2001) with regional options, including the MIX inventory over East Asia (Li et al., 2014) and the EPA/NEI 2011 inventory over North America (Travis et al., 2016). Biofuel emissions are from Yevich and Logan (2003). Carbonaceous aerosol emissions are provided by Bond et al. (2007). Biogenic emissions are calculated by the Model of Emissions of Gases and Aerosols from Nature (MEGAN; Guenther et al., 2012). Biomass burning emissions use the Quick Fire Emissions Dataset (QFED; Darmenov and da Silva, 2015). Lightning NOx emissions (LNOx) are as described by Murray et al. (2012) and match the Lightning Imaging Sensor and the Optical Transient Detector (LIS/OTD) climatological observations of lightning flashes. Volcanic SO2 emissions are provided by the AeroCom project (data available from http://wiki.seas.harvard.edu/geos-chem/index.php/Volcanic_SO2_emission, last access: 29 July 2022). The model simulations are driven by the Modern-Era Retrospective analysis for Research and Applications (MERRA-2) reanalysis from the NASA GMAO (Gelaro et al., 2017). For computational efficiency, MERRA-2 fields have been mapped from the native grid to a 2.5∘ × 2∘ (longitude × latitude) horizontal resolution for input to GEOS-Chem. Further, we used the simulations with and without lightning NOx emissions to understand the contribution of lightning to the formation of nitrate aerosol.
In situ chemical analysis are compared with GEOS-Chem simulations. Figure 6 shows the maps of CO, nitrate, sulfate, ammonium, black carbon (BC), and dust aerosol concentrations averaged over 100–150 hPa at 22:00 UTC for 15 and 21 August during the ZF2 and ZF3 flights, respectively (white circle on the map). On 15 August, CO, BC, nitrate, ammonium, and dust aerosol concentrations are enhanced over West China, Nepal, and northeastern India, with the center of the anticyclone positioned over West China. On the contrary, on 21 August during ZF3, the position of the anticyclone was shifted to the east, and the flight apparently sampled air at the edge of the anticyclone. The simulation shows a 20 % and 50 % increase in CO and BC on 21 August, respectively, compared with 15 August. Additionally, the ammonium concentration was decreased by 50 % and dust was reduced by 60 % on 21 August compared with the first flight on 15 August. However, the concentration is seen to be stable at ∼80 ng m−3 for both 15 and 21 August above Hyderabad. The simulated NO3 concentrations near the location of ZF2 and ZF3 are spatially inhomogeneous, with variations between 30 and 2700 ng m3 across South India. Figure 7 shows the time series of model 3-hourly CO, sulfate, and nitrate concentrations averaged over 100–150 hPa within the model grid point where Hyderabad is located during August 2017. The CO concentration shows a decrease of 14 %, while an increase of 21 % in the SO4 concentration is seen in the ZF3 flight that took place on 21 August. The measured nitrate concentration during ZF2 and ZF3 (around ∼100 ng m−3) is within the range of values simulated within 24 h of the observations. The results of the GEOS-Chem model simulation indicate that lightning NOx could significantly contribute (up to ∼75 % on 10 August) to the formation of nitrates during certain time periods. The lifetime of NOx is approximately 3 h in the region of the outflow of thunderstorms due to the production of methyl proxy nitrate and alkyl, and multifunctional nitrate species and their lifetime is believed to increase downwind of the outflow (Nault et al., 2017). Also shown in Fig. 7 are nitrate concentrations attributed to lightning, as determined by the difference between simulations with and without lightning NOx emissions. ZF2 and ZF3 occurred during a period where the levels of nitrate were ≈50 ng m−3 at STP on 15 August and ≈30 ng m3 at STP on 21 August. The influence of lightning NOx emissions was minimal during this time. Nevertheless, CO levels are slightly higher during ZF2 (80 ppbv) than during ZF3 (60 ppbv), indicating that measurements made during ZF2 may have been more influenced by pollution. The latter is also reflected by the higher BC levels during ZF2 in the model.
We extracted CO, nitrate, and sulfate concentrations from the GEOS-Chem simulation along the calculated trajectories initialized from the ZF2 and ZF3 measurement locations in Fig. 8. The lines are colored according to the balloon GPS altitudes that are used to initialize the trajectory model. Figure 5 uses GEOS-FP winds (meteorology) to convey that GEOS-Chem could simulate convective activities reaching levels between 14 and 15 km. This is confirmed by cloud-top heights (black circle) derived from Himawari-8 crossed by trajectories originating from the troposphere for both ZF2 and ZF3. ZF2 was influenced by convective activities over Western China, whereas ZF3 sampled air masses originating from convection in Southeastern Asia (Myanmar, Laos). CO levels with initial altitudes near 14–15 km (green color) for ZF2 are shown to decrease from 120 to 80 ppbv along the back trajectories, confirming the influence of Chinese pollution and its progressive dilution. At the same initial altitudes, the CO levels along ZF3 back trajectories are significantly lower (near 50–80 ppbv), possibly indicating minimal impacts from polluted sources. The levels of NO show significant variability along the trajectories for both cases but are more pronounced in ZF3, with levels above 400 ng m3, again emphasizing the likely importance of LNOx in the production of nitrate aerosols.
Sulfate concentrations are much higher (100–200 ng m3 at STP) for air parcels initialized near 16–17 km for ZF2 and ZF3, likely indicating stratospheric sources, whereas air parcels near 14–15 km show levels below 100 ng m3 at STP. We note that sulfate along the trajectories influenced by Chinese pollution during ZF2 increases by 60 % approximately 50 h before our measurements, which could indicate the formation of sulfate aerosol from SO2. It has previously been reported that sulfate has a lifetime of a few days in the troposphere (Hidy and Blanchard, 2016). The rather short lifetime of sulfate is due to absorption in precipitation or its solubility (Hidy, 1973). The global mean residence time of tropospheric sulfate against dry and wet deposition is approximately a few days (e.g., Park et al., 2004).
The GEOS-Chem model showed higher sulfate levels than the results from IC due to relatively weak scavenging of SO2 and/or SO.
The aircraft field campaigns of the StratoClim project were held in July and August 2017 at the Tribhuvan International Airport (KTM; 27.70∘ N, 85.36∘ E; Katmandu, Nepal). In situ aerosol measurements within the AMA were carried out using the ERICA (European Research Council Instrument for Chemical composition of Aerosols) aerosol mass spectrometer. Flights KTM 01 and KTM 02 held on 27 and 29 July showed a low level of sulfate at 360 K (potential temperature), corresponding to an altitude of 15 km. The sulfate concentration was almost equal to zero on 10 August during flight KTM 08 at 16 km and 370 K (Stephan Borrmann, 4th ACAM workshop, 28 June 2019). The very low levels of sulfate sometimes observed in the StratoClim campaign near 360–380 K are consistent with our IC analysis results with respect to the sulfate ionic concentration during flight ZF2 held on 15 August at the same altitude and potential temperature.
The chemical composition of the ATAL has been investigated using offline IC analysis of aerosol-impacted samples collected aboard zero-pressure balloon flights as part of the BATAL campaigns. The measurements of the 2017 summer campaign indicate the dominant presence of nitrate and nitrite aerosols with concentrations between 88 and 374 ng m−3 at STP. Our first flight (ZF2) on 15 August 2017 occurred within the AMA and, thus, sampled air masses therein. In situ measurements revealed the presence of NO, and NO aerosols (60–200 ng m−3 at STP) with sizes ranging from 0.05 to 2 µm. The second flight (ZF3) on 21 August 2017, however, occurred at the edge of the anticyclone, and subsequent in situ measurements revealed the presence of larger-particle-size NO and NO aerosols at higher concentrations (87.3–343 ng m−3 at STP). Throughout the flights during the 2017 summer campaign, sulfate aerosol remained below the detection limit of the system (10 ng m−3 at STP) and were much lower than the results from the GEOS-Chem model simulation (80–120 ng m−3 at STP). The higher model sulfate levels compared with the values from IC are believed to be due to relatively weak scavenging of SO2 and/or SO in the model. Unlike the summer, Ca2+ and SO were found on all four stages (sizes ranging between 0.2 and 0.05 µm) along with traces of NH, which could not be quantified in the winter campaign. The winter flight sampled residuals from the 2017 Canadian wildfires affected stratospheric aerosol loadings for several months.
We study the influence of convection on those measurements using back-trajectory calculations co-located with geostationary satellite observations. We show that ZF2 and ZF3 were influenced by convection over Western China, the Bay of Bengal, and Myanmar, Thailand, and Laos. The model was able to reproduce the convective transport from the mid-troposphere (9–12 km) to the upper troposphere (14–15 km). There was no indication of the transport of these air parcels from the boundary layer. Although Himawari-8 observations showed the convective transport reproduced in MERRA-2, the mixture between horizontal and vertical transport was not visible in trajectory calculations. Tropical convection could explain the rapid ascent of the air parcels to higher altitudes because other mechanisms, namely radiative heating, would delay the transport of air parcels from the middle to the upper troposphere. While the model seems to represent convection in the upper troposphere (14–15 km), with the rapid ascension of air parcels, the model's ability to simulate convective influence at higher altitudes seems to be limited.
We used the GEOS-Chem model simulations with and without lightning NOx emissions to understand the contribution of lightning to nitrate aerosol. Flights ZF2 (15 August) and ZF3 (21 August) occurred during a period when the levels of nitrate were relatively small (<100 ng m−3 at STP) with minimal influence of lightning NOx, in contrast with other periods largely affected by nitrate produced by LNOx. As shown by trajectory calculations in Fig. 5, flights ZF2 and ZF3 sampled air masses localized at the border of the Asian anticyclone. Fairlie et al. (2020) showed that the eastern part of the ATAL anticyclone depicts a peak of ammonium contribution from Chinese emissions. The western core of the ATAL, on the other hand, is seen to be enriched with 80 % of anthropogenic sources from India, with the southern and eastern flanks of the anticyclone showing peaks of Chinese contribution wherein nitrate concentrations were found to be the highest.
As the ASM (Asian summer monsoon) varies with respect to spatial dimensions and methodology, inconsistencies in the seasonal and interannual contribution to the ATAL are expected. Mineral dust is considered to be the most abundant type in the troposphere, with its main emission source being from arid and semiarid regions (Huneeus et al., 2011). CaCO3 is considered to be one of the most important components of mineral dust, and about 1.3 Tg of CaCO3 is loaded in the troposphere, corresponding to approximately 8 % of the total loading of mineral dust (Scanza et al., 2015). During atmospheric transport, heterogeneous reactions occur with trace gases, forming more soluble species and resulting in the increased CCN (cloud condensation nuclei) activity of mineral dust particles. Flight ZF2 sampled air masses within a cloud showing the presence of Ca2+ and NO3− on the same stage (particle size <0.15 µm). This implies the formation of Ca(NO3)2 in the presence of HNO3.
Indeed, the atmosphere is an amalgamated den in which gaseous species, particulates, and liquid droplets coexist at the same time. Through our balloon campaigns during the ASM with simultaneous offline measurements of inorganic species and, subsequently, comparing these results with model simulations, we were able to understand, if not fully answer, the many unanswered questions regarding the existence and behavioral patterns of these ionic species of interest. We will continue to research this area with improved techniques and additional experimentation.
IC data are available from https://doi.org/10.6084/m9.figshare.20398653 (Vernier, 2022a); the balloon data shown are available from https://doi.org/10.6084/m9.figshare.20398764 (Vernier, 2022b); trajectory data are available from https://doi.org/10.6084/m9.figshare.20398812 (Vernier, 2022c); GEOS-Chem simulation results are available from https://figshare.com/articles/dataset/Goes-Chem_simulation_results-2017/20398839 (Vernier, 2022d); and the NASA MLS and CALIPSO data used are publicly available from https://www.earthdata.nasa.gov/ (last access: 25 August 2022).
The supplement related to this article is available online at: https://doi.org/10.5194/acp-22-12675-2022-supplement.
HV led the preparation of the paper. AP and NR contributed to the chemical analysis of the balloon samples. MVR, HG, JPV, SK, AKP, and GB organized the balloon flights. FW contributed to the analysis of the COBALD data. HL and BZ performed GEOS-Chem model simulations and assisted with model output analysis. KB analyzed Himawari-8 data.
The contact author has declared that none of the authors has any competing interests.
Publisher's note: Copernicus Publications remains neutral with regard to jurisdictional claims in published maps and institutional affiliations.
This article is part of the special issue “StratoClim stratospheric and upper tropospheric processes for better climate predictions (ACP/AMT inter-journal SI)”. It is not associated with a conference.
Hongyu Liu, Kris Bedka, Bo Zhang, and Jean-Paul Vernier acknowledge funding support from the NASA Atmospheric Composition Modeling and Analysis Program (ACMAP) and the Upper Atmospheric Research Program (UARP). The NASA Center for Computational Sciences (NCCS) provided supercomputing resources. The GEOS-Chem model is managed by the Atmospheric Chemistry Modeling Group at Harvard University with support from the NASA ACMAP and MAP programs. The authors acknowledge Duncan T. Fairlie for his contribution to this effort as well as Chaoyang Xue and Christophe Guimbaud from LPC2E for their contribution to this paper.
This research has been supported by the NASA Atmospheric Composition Modeling and Analysis Program (ACMAP) and by the ANR (Agence Nationale de La Recherche; grant ANR-10-LABX-100-01 from Labex VOLTAIRE, managed by the University of Orleans).
This paper was edited by Manvendra Krishna Dubey and reviewed by two anonymous referees.
Andreae, M. O. and Merlet, P.: Emissions of trace gases and aerosols from biomass burning: Global Biogeochem. Cy., 15, 955–966, https://doi.org/10.1029/2000GB001382, 2001.
Bela, M. M., Barth, M. C., Toon, O. B., Fried, A., Homeyer, C. R., Morrison, H., Cummings, K. A., Li, Y., Pickering, K. E., Allen, D. J., et al.: Wet scavenging of soluble gases in DC3 deep convective storms using WRF-Chem simulations and aircraft observations, J. Geophys. Res.-Atmos., 121, 4233–4257, https://doi.org/10.1002/2015JD024623, 2016.
Belikov, D. A., Maksyutov, S., Krol, M., Fraser, A., Rigby, M., Bian, H., Agusti-Panareda, A., Bergmann, D., Bousquet, P., Cameron-Smith, P., Chipperfield, M. P., Fortems-Cheiney, A., Gloor, E., Haynes, K., Hess, P., Houweling, S., Kawa, S. R., Law, R. M., Loh, Z., Meng, L., Palmer, P. I., Patra, P. K., Prinn, R. G., Saito, R., and Wilson, C.: Off-line algorithm for calculation of vertical tracer transport in the troposphere due to deep convection, Atmos. Chem. Phys., 13, 1093–1114, https://doi.org/10.5194/acp-13-1093-2013, 2013.
Bey, I., Jacob, J.D., Yantosca, M. R., Logan, a, J., Field, D.B., Fiore, M. A., Li, Q., Liu, Y. H., Mickley, J. L., and Schultz, G. M.: Global Modeling of Tropospheric Chemistry with Assimilated Meteorology: Model Description and Evaluation, J. Geophys. Res.-Atmos., 106, 23073–23095, https://doi.org/:10.1029/2001JD000807, 2001.
Bond, T. C., Bhardwaj, E., Dong, R., Jogani, R., Jung, S., Roden, C., Streets, D. G., and Trautmann, N.: Historical emissions of black and organic carbon aerosol from energy-related combustion, 1850–2000, Global Biogeochem. Cy., 21, GB2018, https://doi.org/10.1029/2006GB002840, 2007.
Bossolasco, A., Jegou, F., Sellitto, P., Berthet, G., Kloss, C., and Legras, B.: Global modeling studies of composition and decadal trends of the Asian Tropopause Aerosol Layer, Atmos. Chem. Phys., 21, 2745–2764, https://doi.org/10.5194/acp-21-2745-2021, 2021.
Brabec, M., Wienhold, F. G., Luo, B. P., Vömel, H., Immler, F., Steiner, P., Hausammann, E., Weers, U., and Peter, T.: Particle backscatter and relative humidity measured across cirrus clouds and comparison with microphysical cirrus modelling, Atmos. Chem. Phys., 12, 9135–9148, https://doi.org/10.5194/acp-12-9135-2012, 2012.
Conrad, R.: Soil microorganisms as controllers of atmospheric trace gases (H2, CO, CH4, OCS, N2O, and NO), Microb. Rev., 60, 609–640, https://doi.org/10.1128/mr.60.4.609-640, 1996.
Darmenov, A. and da Silva, A.: The Quick Fire Emissions Dataset (QFED): Documentation of versions 2.1, 2.2, and 2.4, NASA Technical Report Series on Global Modeling and Data Assimilation NASA TM-2015-104606, Volume 38, http://gmao.gsfc.nasa.gov/pubs/docs/Darmenov796.pdf, last access: 1 September 2015.
Dentener, F. J. and Crutzen, P. J.: A three-dimensional model of the global Ammonia cycle, J. Atmos. Chem., 19, 331–369, https://doi.org/10.1007/BF00694492, 1994.
Eastham, S. D., Weisenstein, D. K., Barrett, and S. R. H.: Development and evaluation of the unified tropospheric-stratospheric chemistry extension (UCX) for the global chemistrytransport model GEOS-Chem, Atmos. Environ., 89, 52–63, https://doi.org/10.1016/j.atmosenv.2014.02.001, 2014.
Fadnavis, S., Semeniuk, K., Pozzoli, L., Schultz, M. G., Ghude, S. D., Das, S., and Kakatkar, R.: Transport of aerosols into the UTLS and their impact on the Asian monsoon region as seen in a global model simulation, Atmos. Chem. Phys., 13, 8771–8786, https://doi.org/10.5194/acp-13-8771-2013, 2013.
Fairlie, T. D., Jacob, D. J., and Park, R. J.: The impact of transpacific transport of mineral dust in the United States, Atmos. Environ., 41, 1251–1266, https://doi.org/10.1016/j.atmosenv.2006.09.048, 2007.
Fairlie, T. D., Vernier, J.-P., Natarajan, M., and Bedka, K. M.: Dispersion of the Nabro volcanic plume and its relation to the Asian summer monsoon, Atmos. Chem. Phys., 14, 7045–7057, https://doi.org/10.5194/acp-14-7045-2014, 2014.
Fairlie, T. D., Liu, H., Vernier, J.-P., Campuzanoâ-Jost, P., Jimenez, J. L., Jo, D. S., Zhang, B., Natarajan, M., Avery, M. A., and Huey, G.: Estimates of Regional Source Contributions to the Asian Tropopause Aerosol Layer Using a Chemical Transport Model, J. Geophys. Res., 125, e2019JD031506, https://doi.org/10.1029/2019JD031506, 2020.
Fountoukis, C. and Nenes, A.: ISORROPIA II: a computationally efficient thermodynamic equilibrium model for K+-Ca2+-Mg2+-NH-Na+-SO-NO-Cl−-H2O aerosols, Atmos. Chem. Phys., 7, 4639–4659, https://doi.org/10.5194/acp-7-4639-2007, 2007.
Fromm, M., Lindsey, D. T., Servranckx, R., Yue, G., Trickl, T., Sica, R., Doucet, P., and Beekmann, S. B.: The untold story of pyrocumulonimbus, B. Am. Meteorol. Soc., 91, 1193–1210, 2010.
Gelaro, R., McCarthy, W., Suárez, M. J., Todling, R., Molod, A., Takacs, L., Randles, C. A., Darmenov, A., Bosilovich, M. G., Reichle, R., Wargan, K., Coy, L., Cullather, R., Draper, C., Akella, S., Buchard, V., Conaty, A., da Silva, A. M., Gu, W., Kim, G.-K., Koster, R., Lucchesi, R., Merkova, D., Nielsen, J. E., Partyka, G., Pawson, S., Putman, W., Rienecker, M., Schubert, S. D., Sienkiewicz, M., and Zhao, B.: The Modern-Era Retrospective Analysis for Research and Applications, Version 2 (MERRA-2), J. Climate, 30, 5419–5454, https://doi.org/10.1175/JCLI-D-16-0758.1, 2017.
Ghude, D. S., Van der A, R. J., Beig, G., Fadnavis, S., and Polade, S. D.: Satellite derived trends in NO2 over the major global hotspot regions during the past decade and their inter-comparison, Environmental Pollution, 157, 1873–1878, https://doi.org/10.1016/j.envpol.2009.01.013, 2009.
Goode, J. G., Yokelson, R. J., Ward, D. E., Susott, R. A., Babitt, R. E., Davies, A., and Hao, W. M.: Measurements of excess O3, CO2, CO, CH4, C2H4, C2H2, HCN, NO, NH3, HCOOH, HCHO, and CH3OH in 1997 Alaskan biomass burning plumes by Airborne Fourier transform Infrared Spectrometer (AFTIR), J. Geophys. Res., 105, D17, https://doi.org/10.1029/2000JD900287, 2000.
Guenther, A. B., Jiang, X., Heald, C. L., Sakulyanontvittaya, T., Duhl, T., Emmons, L. K., and Wang, X.: The Model of Emissions of Gases and Aerosols from Nature version 2.1 (MEGAN2.1): an extended and updated framework for modeling biogenic emissions, Geosci. Model Dev., 5, 1471–1492, https://doi.org/10.5194/gmd-5-1471-2012, 2012.
Gu, Y., Liao, H., and Bian, J.: Summertime nitrate aerosol in the upper troposphere and lower stratosphere over the Tibetan Plateau and the South Asian summer monsoon region, Atmos. Chem. Phys., 16, 6641–6663, https://doi.org/10.5194/acp-16-6641-2016, 2016.
Guo, H., Sullivan, A. P., Jost, P. C., Schroder, J. C., Hilfiker, J. E., Dibb, J. L., Jimenez, F. D. L., Thornton, J. A., Brown, S. S., Nenes, A., and Weber, R. J.: Fine particle pH and the partitioning of nitric acid during winter in the northeastern United States, J. Geophys. Res.-Atmos., 121, 10355–10376, https://doi.org/10.1002/2016JD025311, 2016.
Guo, H., Liu, J., Froyd, K. D., Roberts, J. M., Veres, P. R., Hayes, P. L., Jimenez, J. L., Nenes, A., and Weber, R. J.: Fine particle pH and gas–particle phase partitioning of inorganic species in Pasadena, California, during the 2010 CalNex campaign, Atmos. Chem. Phys., 17, 5703–5719, https://doi.org/10.5194/acp-17-5703-2017, 2017.
Hayden, K. L., Macdonald, A. M., Gong, W., Toom-Sauntry, D., Anlauf, K. G., Leithead, A., Li, S.-M., Leaitch, W. R., and Noone, K.: Cloud processing of nitrate, J. Geophys. Res., 113, D18201, https://doi.org/10.1029/2007JD009732, 2008.
Hill, K. A., Shepson, P. B., Galbavy, E. S., Anastasio, C., Kourtev, P. S., Konopka, A., and Stirm, B. H.: Processing of atmospheric nitrogen by clouds above a forest environment, J. Geophys. Res., 112, D11301, https://doi.org/10.1029/2006JD008002, 2007.
Höpfner, M., Volkamer, R., Grabowski, U., Grutter, M., Orphal, J., Stiller, G., von Clarmann, T., and Wetzel, G.: First detection of ammonia (NH3) in the Asian summer monsoon upper troposphere, Atmos. Chem. Phys., 16, 14357–14369, https://doi.org/10.5194/acp-16-14357-2016, 2016.
Höpfner, M., Ungermann, J., Borrmann, S., et al.: Ammonium nitrate particles formed in upper troposphere from ground ammonia sources during Asian monsoons, Nat. Geosci., 12, 608–612, 2019.
Huneeus, N., Schulz, M., Balkanski, Y., Griesfeller, J., Prospero, J., Kinne, S., Bauer, S., Boucher, O., Chin, M., Dentener, F., Diehl, T., Easter, R., Fillmore, D., Ghan, S., Ginoux, P., Grini, A., Horowitz, L., Koch, D., Krol, M. C., Landing, W., Liu, X., Mahowald, N., Miller, R., Morcrette, J.-J., Myhre, G., Penner, J., Perlwitz, J., Stier, P., Takemura, T., and Zender, C. S.: Global dust model intercomparison in AeroCom phase I, Atmos. Chem. Phys., 11, 7781–7816, https://doi.org/10.5194/acp-11-7781-2011, 2011.
Ibikunle, I., Beyersdorf, A., Campuzano-Jost, P., Corr, C., Crounse, J. D., Dibb, J., Diskin, G., Huey, G., Jimenez, J.-L., Kim, M. J., Nault, B. A., Scheuer, E., Teng, A., Wennberg, P. O., Anderson, B., Crawford, J., Weber, R., and Nenes, A.: Fine particle pH and sensitivity to NH3 and HNO3 over summertime South Korea during KORUS-AQ, Atmos. Chem. Phys. Discuss. [preprint], https://doi.org/10.5194/acp-2020-501, 2020.
Issac, G. A., Leaitch, W. R., and Strapp, J. W.: The vertical distribu-tion of aerosols and acid related compounds in air and cloudwater, Atmos. Environ., 24, 3033–3046, https://doi.org/10.1016/0960-1686(90)90482-3, 1990.
Issac, G. A., Leaitch, W. R., and Strapp, J. W.: The vertical distribution of aerosols and acid-related compounds in air and cloud water, Atmos. Environ., 24, 3033–3046, 1990.
Jaeglé, L., Quinn, P. K., Bates, T. S., Alexander, B., and Lin, J.-T.: Global distribution of sea salt aerosols: new constraints from in situ and remote sensing observations, Atmos. Chem. Phys., 11, 3137–3157, https://doi.org/10.5194/acp-11-3137-2011, 2011.
Kar, J., Bremer, H., Drummond, J. R., Rochon, Y. I., Jones, D. B. A., Nichitiu, F., Zou, J., Liu, J., Gille, J. C., Edwards, D. P., Deeter, M. N., Francis, G., Juying, D. Z.: Evidence of vertical transport of carbon monoxide from measurements of pollution in the troposphere (MOPITT), Geophys. Res. Lett., 31, L23105, https://doi.org/10.1029/2004GL021128, 2004.
Kloss, C., Berthet, G., Sellitto, P., Ploeger, F., Bucci, S., Khaykin, S., Jégou, F., Taha, G., Thomason, L. W., Barret, B., Le Flochmoen, E., von Hobe, M., Bossolasco, A., Bègue, N., and Legras, B.: Transport of the 2017 Canadian wildfire plume to the tropics via the Asian monsoon circulation, Atmos. Chem. Phys., 19, 13547–13567, https://doi.org/10.5194/acp-19-13547-2019, 2019.
Lau, W. K. M., Yuan, C., and Li, Z.: Origin, Maintenance and Variability of the Asian Tropopause Aerosol Layer (ATAL): The Roles of Monsoon Dynamics, Sci. Rep., 8, 3960, https://doi.org/10.1038/s41598-018-22267-z, 2018.
Lazarus, A. L., Lorange, E., and Lodge, J. P.: Lead and other metal ions in United States Precipitation, Environ. Sci. Technol., 4, 55–58, 1970.
Leaitch, W. R., Strapp, J. W., Wiebe, H. A., Anlauf, K. G., and Issac, G. A.: Chemical and microphysical studies of nonprecipitating summer clouds in Ontario, Canada, J. Geophys. Res., 91, 11821–11831, https://doi.org/10.1029/JD091iD11p11821, 1986.
Lelieveld, J., Bourtsoukidis, E., Brühl, C., Fischer, H., Fuchs, H., Harder,H., Hofzumahaus, A.,Holland, F., Marno, D., Neumaier, M., Pozzer, A., Schlager, H., Williams, J., Zahn, A., and Ziereis, H.: The South Asian monsoon: pollution pump and purifier, Science, 361, 270–273, https://doi.org/10.1126/science.aar2501, 2018.
Li, J., Posfai, M., Hobbs, P. V., and Buseck, P. R.: Individual aerosol particles from biomass burning in southern Africa: 2, Compositions and aging of inorganic particles, J. Geophys. Res., 108, 8484, https://doi.org/10.1029/2002JD002310, 2003.
Li, M., Zhang, Q., Streets, D. G., He, K. B., Cheng, Y. F., Emmons, L. K., Huo, H., Kang, S. C., Lu, Z., Shao, M., Su, H., Yu, X., and Zhang, Y.: Mapping Asian anthropogenic emissions of non-methane volatile organic compounds to multiple chemical mechanisms, Atmos. Chem. Phys., 14, 5617–5638, https://doi.org/10.5194/acp-14-5617-2014, 2014.
Liu, H., Jacob, D. J., Bey, I., and Yantosca, R. M.: “Constraints from 210Pb and 7Be on Wet Deposition and Transport in a Global Three-Dimensional Chemical Tracer Model Driven by Assimilated Meteorological Fields.” J. Geophys. Res.-Atmos., 106, 12109–12128, doi:10.1029/2000jd900839, 2001.
Liu, X., Penner, J. E., and Wang M.: Influence of anthropogenic sul-fate and black carbon on upper tropospheric clouds in the NCARCAM3 model coupled to the IMPACT global aerosol model, J. Geophys. Res., 114, D03204, https://doi.org/10.1029/2008JD010492, 2009.
Lightstone, J. M., Onasch, T. B., Imre, D., and Oatis, S.: Deliquescence Efflorescence, and Water Activity in Ammonium nitrate and mixed Ammonium nitrate/succinic acid Microparticles, J. Phys. Chem. A, 104, 9337–9346, https://doi.org/10.1021/jp002137h, 2000.
Lammel, G. and Cape, N. J.: Nitrous acid and nitrite in the atmo-sphere, Chem. Soc. Rev., 25, 361–369, 1996.
Lammel, G. and Metzig, G.: On the occurrence of nitrite in urbanfog water, Chemosphere, 37, 1603–1614, https://doi.org/10.1016/j.atmores.2007.11.002, 1998.
Lucchesi, R.: File Specification for GEOS FP. GMAO Office Note No. 4 (Version 1.2), 61 pp., https://gmao.gsfc.nasa.gov/pubs/docs/Lucchesi1203.pdf, last access: 7 November 2018.
Ma, J., Brühl, C., He, Q., Steil, B., Karydis, V. A., Klingmüller, K., Tost, H., Chen, B., Jin, Y., Liu, N., Xu, X., Yan, P., Zhou, X., Abdelrahman, K., Pozzer, A., and Lelieveld, J.: Modeling the aerosol chemical composition of the tropopause over the Tibetan Plateau during the Asian summer monsoon, Atmos. Chem. Phys., 19, 11587–11612, https://doi.org/10.5194/acp-19-11587-2019, 2019.
Martin, R. V., Sauvage, B., Folkins, I., Sioris, C. E., Boone, C., Bernath, P., and Ziemke, J.: Space-based constraintson the production of nitric oxide by lightning, J. Geophys. Res., 112, https://doi.org/10.1029/2006JD007831, 2007.
Murray, L. T., Jacob, D. J., Logan, J. A., Hudman, R. C., and Koshak, W. J.: Optimized regional and interannual variability of lightning in a global chemical transport model constrained by LIS/OTD satellite data, J. Geophys. Res., 117, D20307, https://doi.org/10.1029/2012JD017934, 2012.
Nault, B. A., Laughner, J. L., Wooldridge, J., Crounse, J. D., Dibb, J., Diskin, G., and Cohen, R. C.: Lightning NOx emissions: reconciling measured and modeled estimates with updated NOx chemistry, Geophys. Res. Lett., 44, 9479–9488, https://doi.org/10.1002/2017GL074436, 2017.
Newman, L.: Measurement challenges in Atmospheric chemistry-Sampling of Selected Labile Atmospheric Pollutants, Am. Chem. Soc., 1–40, https://doi.org/10.1021/ba-1993-0232.ch001, 1993.
Okita, T.: Concentration of sulfate and other inorganic materials in fog and cloud water and in aerosol, J. Met. Soc. Jpn., 46, 120–127, https://doi.org/10.2151/jmsj1965.46.2_120, 1968.
Olivier, J. G. J. and Berdowski, J. J. M.: Global Emissions Sources and Sinks, in the Climate System, in: The Climate System, edited by: Berdowski, J., Guicherit, R., Heij, B. J., and Lisse, A. A., Balkema Publishers/Swets and Zeitlinger Publishers, The Netherlands, 33–78, 2001.
Orbe, C., Waugh, D. W., and Newman, P. A.: Air-mass origin in the tropical lower stratosphere: The influence of Asian boundary layer air, Geophys. Res. Lett., 42, 4240–4248, https://doi.org/10.1002/2015GL063937, 2015.
Park, M., Randel, W. J., Gettelman, A., Massie, S., and Jiang, J.: Transport above the Asian summer monsoon anticyclone inferred from Aura MLS tracers, J. Geophys. Res., 112, D16309, https://doi.org/10.1029/2006JD008294, 2007.
Park, M., Randel, W. J., Emmons, L. K., Bernath, P. F., Walker, K. A., and Boone, C. D.: Chemical isolation in the Asian monsoon anticyclone observed in Atmospheric Chemistry Experiment (ACE-FTS) data, Atmos. Chem. Phys., 8, 757–764, https://doi.org/10.5194/acp-8-757-2008, 2008.
Park, R. J., Jacob, D. J., Chin, M., and Martin, R. V.: Sources of carbonaceous aerosols over the United States and implications for natural visibility, J. Geophys. Res., 108, 4355, https://doi.org/10.1029/2002JD003190, 2003.
Park, R. J., Jacob, D. J., Field, B. D., Yantosca, R. M., and Chin, M.: Natural and transboundary pollution influences on sulfate-nitrate-ammonium aerosols in the United States: Implications for policy, J. Geophys. Res., 109, D15204, https://doi.org/10.1029/2003JD004473, 2004.
Paugam, R., Wooster, M., Freitas, S., and Val Martin, M.: A review of approaches to estimate wildfire plume injection height within large-scale atmospheric chemical transport models, Atmos. Chem. Phys., 16, 907–925, https://doi.org/10.5194/acp-16-907-2016, 2016.
Peterson, D. A., Hyer, E. S., Campbell, J. R., Solbrig, J. E., and Fromm, M. D.: A conceptual model for development of intense pyro cumulonimbus in western north America, Mon. Weather Rev., 145, 2235–2255, https://doi.org/10.1175/MWR-D-16-0232.1, 2017.
Pitari, G., Aquila, V., Kravitz, B., Robock, A., Watanabe, S., Cionni, I., De Luca, N.;, Di Genova, G., Mancini, E., and Tilmes, S.: Stratospheric Ozone Response to Sulfate Geoengineering: Results from the Geoengineering Model Intercomparison Project (GeoMIP), J. Geophys. Res., 119, 2629–2653, 2014.
Pye, H. O. T., Chan, A. W. H., Barkley, M. P., and Seinfeld, J. H.: Global modeling of organic aerosol: the importance of reactive nitrogen (NOx and NO3), Atmos. Chem. Phys., 10, 11261–11276, https://doi.org/10.5194/acp-10-11261-2010, 2010.
Ploeger, F., Konopka, P., Walker, K., and Riese, M.: Quantifying pollution transport from the Asian monsoon anticyclone into the lower stratosphere, Atmos. Chem. Phys., 17, 7055–7066, https://doi.org/10.5194/acp-17-7055-2017, 2017.
Ramanathan, V. and Crutzen, P. J.: New Directions: Atmospheric Brown “Clouds”, Atmos. Environ., 37, 4033–4035, https://doi.org/10.1016/s1352-2310(03)00536-3, 2003.
Randel, W. J., Park, M., Emmons, L., Kinnison, D., Bernath, P., Walker, K. A., Boone, C., and Pumphrey, H.: Asian Monsoon Transport of Pollution to the Stratosphere, Science, 328, 611–613, https://doi.org/10.1126/science.1182274, 2010.
Rasch, P. J., Tilmes, S., Turco, R. P., Robock, A., Oman, L., and Chen, R. R.: An overview of geoengineering of climate using stratospheric sulphate aerosols, Philos. T. Roy. Soc. A, 366, 4007–4037, https://doi.org/10.1098/rsta. 2008.0131, 2008.
Ridley, D. A., Heald, C. L., and Prospero, J. M.: What controls the recent changes in African mineral dust aerosol across the Atlantic?, Atmos. Chem. Phys., 14, 5735–5747, https://doi.org/10.5194/acp-14-5735-2014, 2014.
Rienecker, M. M., Suarez, M. J., Gelaro, R., et al.: MERRA: NASA's Modern-Era Retrospective Analysis for Research and Applications, J. Climate, 24, 3624–3648, 2011.
Santee, M. L., Manney, G. L., Livesey, N. J., Schwartz, M. J., Neu, J. L., and Read, W. G.: A comprehensive overview of the climatological composition of the Asian summer monsoon Anticyclone based on 10 years of Aura microwave limb sounder measurements, J. Geophys. Res., 122, 5491–5514, https://doi.org/10.1002/2016JD026408, 2017.
Scanza, R. A., Mahowald, N., Ghan, S., Zender, C. S., Kok, J. F., Liu, X., Zhang, Y., and Albani, S.: Modeling dust as component minerals in the Community Atmosphere Model: development of framework and impact on radiative forcing, Atmos. Chem. Phys., 15, 537–561, https://doi.org/10.5194/acp-15-537-2015, 2015.
Schüpbach, S., Federer, U., Kaufmann, P. R., Albani, S., Barbante, C., Stocker, T. F., and Fischer, H.: High-resolution mineral dust and sea ice proxy records from the Talos Dome ice core, Clim. Past, 9, 2789–2807, https://doi.org/10.5194/cp-9-2789-2013, 2013.
Seinfeld, J. H. and Pandis, S. N.: Atmospheric Chemistry and Physics: From Air Pollution to Climate Change, John Wiley, Hoboken, N. J., 1326 pp., 1998.
Solomon, S., Kinnison, D., Garcia, R. R., Justin Bandoro, J., Mills, M., Wilka, C., Neely III, R. R., Schmidt, A., Barnes, J. E., Vernier, J.-P., and Höpfner, M.: Monsoon circulations and tropical heterogeneous chlorine chemistry in the stratosphere, Geophys. Res. Lett., 43, 12624–12633, https://doi.org/10.1002/2016GL071778, 2016.
Stelson, A. W. and Steinfield, J. H.: Relative Humidity and temperature dependence of ammonium nitrate dissociation constant, Atmos. Environ., 16, 983–993, 1982.
Stocker, M., Ladstädter, F., and Steiner, A. K.: Observing the climate impact of large wildfires on stratospheric temperature, Sci. Rep., 11, 22994, https://doi.org/10.11038/541598-021-02335-7, 2021.
Thomason, L. W. and Vernier, J.-P.: Improved SAGE II cloud/aerosol categorization and observations of the Asian tropopause aerosol layer: 1989–2005, Atmos. Chem. Phys., 13, 4605–4616, https://doi.org/10.5194/acp-13-4605-2013, 2013.
Torres, O., Bhartia, P. K., Taha, G., Jethva, H., Das, S., Colarco, P., Krotkov, N., Omar, A., and Ahn, C.: Stratospheric injection of massive smoke plume from Canadian boreal fires in 2017 as seen by DSCOVR-EPIC, CALIOP, and OMPS-LP observations, J. Geophys. Res.-Atmos., 125, e2020JD032579, https://doi.org/10.1029/2020JD032579, 2020.
Travis, K. R., Jacob, D. J., Fisher, J. A., Kim, P. S., Marais, E. A., Zhu, L., Yu, K., Miller, C. C., Yantosca, R. M., Sulprizio, M. P., Thompson, A. M., Wennberg, P. O., Crounse, J. D., St. Clair, J. M., Cohen, R. C., Laughner, J. L., Dibb, J. E., Hall, S. R., Ullmann, K., Wolfe, G. M., Pollack, I. B., Peischl, J., Neuman, J. A., and Zhou, X.: Why do models overestimate surface ozone in the Southeast United States?, Atmos. Chem. Phys., 16, 13561–13577, https://doi.org/10.5194/acp-16-13561-2016, 2016.
Ungermann, J., Ern, M., Kaufmann, M., Müller, R., Spang, R., Ploeger, F., Vogel, B., and Riese, M.: Observations of PAN and its confinement in the Asian summer monsoon anticyclone in high spatial resolution, Atmos. Chem. Phys., 16, 8389–8403, https://doi.org/10.5194/acp-16-8389-2016, 2016.
Vernier, J.-P., Thomason, L. W., and Kar, J..: CALIPSO detection of an Asian tropopause aerosol layer, Geophys. Res. Lett., 38, L07804, https://doi.org/10.1029/2010GL046614, 2011.
Vernier, J.-P., Fairlie, T. D., Natarajan, M., Wienhold, F. G., Bian, J., Martinsson, B. G., Crumeyrolle, S., Thomason, L. W., and Bedka, K. M.: Increase in upper tropospheric and lower stratospheric aerosol levels and its potential connection with Asian pollution, J. Geophys. Res.-Atmos., 120, 1608–1619, https://doi.org/10.1002/2014JD022372, 2015.
Vernier, J. P., Fairlie, T. D., Deshler, T., Venkat Ratnam, M., Gadhavi, H., Kumar, B. S., Natarajan, M., Pandit, A. K., Akhil Raj, S. T., Hemanth Kumar, A., Jayaraman, A., Singh, A. K., Rastogi, N., Sinha, P. R., Kumar, S., Tiwari, S., Wegner, T., Baker, N., Vignelles, D., Stenchikov, G., Shevchenko, I., Smith, J., Bedka, K., Kesarkar, A., Singh, V., Bhate, J., Ravikiran, V., Durga Rao, M., Ravindrababu, S., Patel, A., Vernier, H., Wienhold, F. G., Liu, H., Knepp, T. N., Thomason, L., Crawford, J., Ziemba, L., Moore, J., Crumeyrolle, S., Williamson, M., Berthet, G., Jégou, F., and Renard, J.: BATAL: The Balloon Measurement Campaigns of the Asian Tropopause Aerosol Layer, B. Am. Meteorol. Soc., 99, 955–973, https://doi.org/10.1175/BAMS-D-17-0014.1, 2018.
Vernier, H.: BATAL_S2017_W2018-IC_Data_7-28-2022.xlsx, figshare, [data set], https://doi.org/10.6084/m9.figshare.20398653.v1, 2022a.
Vernier, H.: Imet data inside impactor box (2017/2018) and outside for 2015, figshare, [data set], https://doi.org/10.6084/m9.figshare.20398764.v2, 2022b.
Vernier, H.: Trajectory files ZF2/ZF3, figshare, [data set], https://doi.org/10.6084/m9.figshare.20398812.v1, 2022c.
Vernier, H.: GEOS-Chem simulation results-2017, figshare, [data set], https://doi.org/10.6084/m9.figshare.20398839.v1, 2022d.
Voigt, C., Schlager, H., Roiger, A., Stenke, A., de Reus, M., Borrmann, S., Jensen, E., Schiller, C., Konopka, P., and Sitnikov, N.: Detection of reactive nitrogen containing particles in the tropopause region – evidence for a tropical nitric acid trihydrate (NAT) belt, Atmos. Chem. Phys., 8, 7421–7430, https://doi.org/10.5194/acp-8-7421-2008, 2008.
Voigt, C., Schreiner, J., Kohlmann, A., Zink, P., Mauersberger, K., Larsen, N., Deshler, T., Kröger, C., Rosen, J., Adriani, A., Cairo, F., Di Donfrancesco, G., Viterbini, M., Ovarlez, J., Ovarlez, H., David, C., and Dörnbrack, A.: Nitric acid trihydrate (NAT) in polar stratospheric clouds, Science, 2290, 1756–1758, https://doi.org/10.1126/science.290.5497.1756, 2000.
Wagner, R., Bertozzi, B., Höpfner, M., Höhler, K., Möhler, O., Saathoff, H., and Leisner, T.: Solid ammonium nitrate aerosols as efficient ice nucleating particles at cirrus temperatures, J. Geophys. Res., 125, e2019JD032248, https://doi.org/10.1029/2019JD032248, 2020.
Wang, Q., Jacob, D. J., Fisher, J. A., Mao, J., Leibensperger, E. M., Carouge, C. C., Le Sager, P., Kondo, Y., Jimenez, J. L., Cubison, M. J., and Doherty, S. J.: Sources of carbonaceous aerosols and deposited black carbon in the Arctic in winter-spring: implications for radiative forcing, Atmos. Chem. Phys., 11, 12453–12473, https://doi.org/10.5194/acp-11-12453-2011, 2011.
Wang, X., Zhang, L., and Moran, M. D.: Development of a new semi-empirical parameterization for below-cloud scavenging of size-resolved aerosol particles by both rain and snow, Geosci. Model Dev., 7, 799–819, https://doi.org/10.5194/gmd-7-799-2014, 2014.
Wang, Q., Jacob, D. J., Spackman, J. R., Perring, A. E., Schwarz, J. P., Moteki, N., Marais, E. A., Ge, C., Wang, J., and Barrett, S. R. H.: Global budget and radiative forcing of black carbon aerosol: constraints from pole-to-pole (HIPPO) observations across the Pacific, J. Geophys. Res., 119, 195–206, 2014.
Wang, T., Song, Y., Xu, Z., Liu, M., Xu, T., Liao, W., Yin, L., Cai, X., Kang, L., Zhang, H., and Zhu, T.: Why is the Indo-Gangetic Plain the region with the largest NH3 column in the globe during pre-monsoon and monsoon seasons?, Atmos. Chem. Phys., 20, 8727–8736, https://doi.org/10.5194/acp-20-8727-2020, 2020.
Wesely, M. L.: Parameterization of surface resistances to gaseous dry deposition in regional-scale numerical models, Atmos. Environ., 23, 1293–1304, https://doi.org/10.1016/0004-6981(89)90153-4, 1989.
Yienger, J. J. and Levy, H.: Empirical model of global soil‐biogenic NOχ emissions, J. Geophys. Res.-Atmos., 100, 11447–11464, https://doi.org/10.1029/95JD00370, 1995.
Yevich, R. and Logan, J. A.: An assessment of biofuel uses and burning of agricultural waste in the developing world, Global Biogeochem. Cy., 17, 1095, https://doi.org/10.1029/2002GB001952, 2003.
Yu, P., Toon, O. B., Neely, R. R., Martinson, B. G., and Brenninkmeijer, C. A. M.: Composition and physical properties of the Asian tropopause aerosol layer and the North American tropospheric aerosol layer, Geophys. Res. Lett., 42, 2540–2546 https://doi.org/10.1002/2015GL063181, 2015.
Yu, P., Rosenlof, K. H., Liu, S., Telg, H., Thornberry, T. D., Rollins, A. W., Portmann, R. W., Bai, Z., Ray, E. A., Duan, Y., Pan, L. L., Toon, O. B., Bian, J., and Gao, R.-S.: Efficient transport of tropospheric aerosol into the stratosphere via the Asian summer monsoon anticyclone, P. Natl. Acad. Sci. USA., 114, 6972–6977, https://doi.org/10.1073/pnas.1701170114, 2017.
Yu, K., Keller, C. A., Jacob, D. J., Molod, A. M., Eastham, S. D., and Long, M. S.: Errors and improvements in the use of archived meteorological data for chemical transport modeling: an analysis using GEOS-Chem v11-01 driven by GEOS-5 meteorology, Geosci. Model Dev., 11, 305–319, https://doi.org/10.5194/gmd-11-305-2018, 2018.
Yu, P., Yoon, B. O., Bardeen, G. C., Zhu, Y., Rosenlof, H. K., Thornberry, D. T., Gao, R.-S., Davis, M. S., Wolf, T. E., Gouw, W. J., Peterson, A. D., Fromm, D. M., and Robock, A.: Black carbon lofts wildfire smoke high into the stratosphere to form a persistent plume, Science 365, 587–590, https://doi.org/10.1126/science.aax1748, 2019.
Yuan, C., Lau, W. K. M., Li, Z., and Cribb, M.: Relationship between Asian monsoon strength and transport of surface aerosols to the Asian Tropopause Aerosol Layer (ATAL): interannual variability and decadal changes, Atmos. Chem. Phys., 19, 1901–1913, https://doi.org/10.5194/acp-19-1901-2019, 2019.
Zawadowicz, M. A., Proud, S. R., Seppalainen, S. S., and Cziczo, D. J.: Hygroscopic and phase separation properties of ammonium sulfate/organics/water ternary solutions, Atmos. Chem. Phys., 15, 8975–8986, https://doi.org/10.5194/acp-15-8975-2015, 2015.
- Abstract
- Introduction
- Balloon flights, instrumentation, and chemical analysis approach
- Results of the IC analysis
- COBALD and CALIOP point to the presence of ice clouds during ZF2
- The influence of Canadian wildfire plumes during the winter flight
- Convective influence
- Nitrite measurements
- Comparison with GEOS-Chem simulations
- Summary and conclusions
- Data availability
- Author contributions
- Competing interests
- Disclaimer
- Special issue statement
- Acknowledgements
- Financial support
- Review statement
- References
- Supplement