the Creative Commons Attribution 4.0 License.
the Creative Commons Attribution 4.0 License.
 | 28 Sep 2022
Seasonal modeling analysis of nitrate formation pathways in Yangtze River Delta region, China
Jinjin Sun
Xiaodong Xie
Wenxing Fu
Yang Qin
Li Sheng
Lin Li
Jingyi Li
Ishaq Dimeji Sulaymon
Lei Jiang
Lin Huang
Xingna Yu
Jianlin Hu
Nitrate (NO3−) has been the dominant and the least reduced chemical component of fine particulate matter (PM2.5) since the stringent emission controls implemented in China in 2013. The formation pathways of NO3− vary seasonally and differ substantially in daytime vs. nighttime. They are affected by precursor emissions, atmospheric oxidation capacity, and meteorological conditions. Understanding NO3− formation pathways provides insights for the design of effective emission control strategies to mitigate NO3− pollution. In this study, the Community Multiscale Air Quality (CMAQ) model was applied to investigate the impact of regional transport, predominant physical processes, and different formation pathways to NO3− and total nitrate (TNO3, i.e., HNO3+ NO3−) production in the Yangtze River Delta (YRD) region during the four seasons of 2017. NOPM2.5 and NOTNO3 are the highest in the winter, reaching 21 % and 94 %, respectively. The adjusted gas ratio (adjGR = ([NH3]+ [NO3−]([HNO3]+ [NO3−])) in the YRD is generally greater than 2 in the four seasons across most areas in the YRD, indicating that YRD is mostly in the NH3-rich regime and that NO3− is limited by HNO3 formation. Local emissions and regional transportation contribute to NO3− concentrations throughout the YRD region by 50 %–62 % and 38 %–50 %, respectively. The majority of the regional transport of NO3− concentrations is contributed by indirect transport (i.e., NO3− formed by transported precursors reacting with local precursors). Aerosol (AERO, including condensation, coagulation, new particle formation, and aerosol growth) processes are the dominant source of NO3− formation. In summer, NO3− formation is dominated by AERO and total transport (TRAN, sum of horizontal and vertical transport) processes. The OH + NO2 pathway contributes to 60 %–83 % of the TNO3 production, and the N2O5 heterogeneous (HET N2O5) pathway contributes to 10 %–36 % in the YRD region. HET N2O5 contribution becomes more important in cold seasons than warm seasons. Within the planetary boundary layer in Shanghai, the TNO3 production is dominated by the OH + NO2 pathway during the day (98 %) in the summer and spring and by the HET N2O5 pathway during the night (61 %) in the winter. Local contributions dominate the OH + NO2 pathway for TNO3 production during the day, while indirect transport dominates the HET N2O5 pathway at night.
- Article
(4396 KB) - Full-text XML
-
Supplement
(7148 KB) - BibTeX
- EndNote


The Yangtze River Delta (YRD) region, located in eastern China, is among the most populous and developed economic regions in China. Because of rapid population growth, economic advancement, urbanization, and industrialization during recent decades, the YRD region has frequently suffered from both fine particulate matter (PM2.5) and ozone (O3) pollution problems (Qin et al., 2021; Sun et al., 2019; Dai et al., 2021). Particulate nitrate (NO3−) is a major PM2.5 component, and high concentrations of NO3− are often observed during cold seasons in the YRD region, due to high precursors emissions and regional transport contributions. Huang et al. (2014) reported that the daily average PM2.5 concentrations in Shanghai were 91 µg m−3 during haze pollution events of 5–25 January 2013, whereas NO3− accounted for 14 % total PM2.5 mass. Huang et al. (2020a) observed that PM2.5 concentrations in Nanjing were 271 µg m−3 on 30–31 December 2017 and that the fraction of NO3− was ∼27 %. Lin et al. (2020) found that the peak concentration of NO3− in Nanjing was 85 µg m−3 during haze pollution events in the spring of 2016.
Owing to the stringent emission control strategies since 2013, primary PM2.5, the major precursors, i.e., sulfur dioxide (SO2) and nitrogen oxides (NOx, nitric oxide (NO) + nitrogen dioxide (NO2)), emissions have decreased substantially in China, which led to significant decreases in total PM2.5 and sulfate (SO42−) mass concentrations (Li et al., 2022; Chen et al., 2021). However, compared to SO42− and other PM2.5 components, the reduction rate of NO3− was much less slow (Wen et al., 2018; Zhai et al., 2021; Zhou et al., 2022; Wang et al., 2022). This led to a rise in the ratio of NO3− mass to total PM2.5 in eastern China, rendering NO3− the dominant chemical component of PM2.5 (accounting for 24 %–35 %, especially during the cold season and haze pollution events; Ding et al., 2019; Wen et al., 2018; Lin et al., 2020; Fu et al., 2020; Zhou et al., 2022; Xie et al., 2022). High concentrations of NO3− influence the hygroscopicity and optical properties of particles, contributing to the formation of haze and to visibility degradation (Hu et al., 2021; Xie et al., 2020). Mitigating NO3− pollution has become an urgent concern in the YRD.
NO3− is formed in the atmosphere by a series of chemical reactions leading to the production of nitric acid (HNO3) and then following gas-to-particle partitioning (Griffith et al., 2015; Guo et al., 2018; Lin et al., 2020). The key NO3− formation pathways include the gas-phase oxidation (hydroxyl (OH) and NO2) and the heterogeneous hydrolysis of dinitrogen a dinitrogen pentoxide (HET N2O5) on the wet particles' surface (Fan et al., 2021; Wang et al., 2018; Chen et al., 2020). The chemical transport models (CTMs), field observations, box model, and oxygen and nitrogen isotope techniques apply to quantify the contribution of different pathways to NO3− formation in various locations. For example, He et al. (2020) and Li et al. (2021b) reported that the OH + NO2 pathway dominates daytime NO3− formation in the YRD, accounting for 60 %–92 % and 55 %–86 % in warm and cold seasons, respectively. The HET N2O5 pathway is the main nocturnal NO3− formation in winter, especially in severe haze episodes, with contributions of 44 %–97 % at night (Fu et al., 2020; He et al., 2018). Furthermore, Tan et al. (2021) and Wang et al. (2018) indicated that the chemical formation cannot explain the variation of TNO3 at the surface (sum of NO3− and HNO3), due to the concentrations of N2O5 being close to zero and controlled by high NO emissions at night. Fan et al. (2021) and Kim et al. (2014) further emphasized that the contributions of NO3− formation pathways differ significantly at vertical altitudes, owing to the vertical gradients of nocturnal NO3 and total oxidant (NO2+O3) level within the planetary boundary layer (PBL). Prabhakar et al. (2017) revealed that the active nocturnal NO3− formation from the upper PBL contributed 80 % to daytime surface NO3− concentrations in the winter of 2013 in California.
The complex NO3− formation chemistry involves the anthropogenic emission of precursors (i.e., NOx, and ammonia (NH3)) and atmospheric oxidants (i.e., OH, O3, and NO3; Chan et al., 2021; Womack et al., 2019). Previous studies suggested that NO3− responds nonlinearly to precursor emission reductions in major Chinese regions (i.e., the North China Plain (NCP) and YRD), emphasizing that the uncoordinated control of precursors (i.e., SO2, NH3, and NOx) increases the atmospheric oxidant capacity (AOC) and enhances NO3− formation in NOx-rich regimes (Li et al., 2021b; Huang et al., 2020b; Lu et al., 2021a). Coupled with the chemical formation, regional transport also plays important roles in NO3− pollution formation. Previous modeling studies using the CTMs highlighted the important role of regional transport in NO3− concentrations in major regions of eastern China (Itahashi et al., 2017; Qu et al., 2021; Ying et al., 2014; Shen et al., 2020). For example, Huang et al. (2020a) reported that secondary pollutants are regionally transported between the NCP and YRD regions (a distance of 1000 km), and hence they simultaneously exacerbate the levels of secondary inorganic aerosols (SIAs) in two major Chinese regions. Ying et al. (2014) revealed that the regional air pollution transport from northern and central China contributed about 45 % to NO3− in Shanghai during the winter of 2009. Wu et al. (2017) suggested that the regional transport plays a key role in NO3− sources in Shanghai (accounting for about 90 %), while local emission only contributed 10 % for NO3− in January 2013. Shen et al. (2020) reported that the contribution of regional transport amounted to around 60 %–98 % for the high concentrations of NO3− under severe haze episodes in the two winters of 2015 and 2016 in the YRD. Qu et al. (2021) found that the indirect transport made a contribution of 43 % to NO3− in the Pearl River Delta (PRD) region in cold season of 2015, mainly due to chemical reactions between the locally emitted NOx and transported O3 at night. Du et al. (2020) also revealed that regional transport contributed about 56 % to NO3− in Beijing in winter 2017, mainly produced via indirect transport.
The NO3− chemical pathways and formation-controlling factors may be very different in different seasons in the same studying locations. Most previous studies have focused on only a few short periods of NO3− pollution episodes, and lacked seasonal analysis for the full year. This study aims to obtain a comprehensive understanding of the seasonal variations in the NO3− formation mechanisms, as well as to determine key precursors, dominant processes, and chemical pathways in the YRD. The Community Multiscale Air Quality (CMAQ) model was employed to investigate the contributions of various physical and chemical processes to NO3− and HNO3 formation. Regional transport and chemical reaction pathways were quantified for the YRD region. The analyses were conducted in the four seasons of 2017 to compare and identify the key impact factors for NO3− in different seasons and to provide a scientific basis for designing effective emissions control strategies to mitigate the urgent NO3− pollution in the YRD region.
2.1 Model configuration
The CMAQ v5.2 model (Wyat Appel et al., 2018; Liu et al., 2020b; Sheng et al., 2022) was applied to investigate the major chemical pathways and physical processes that contribute to NO3− and TNO3 formation in the YRD region. Two nested domains were used, as shown in Fig. 1. The outer domain (36 km horizontal resolution) spanned eastern and southeastern China, while the inner domain (12 km horizontal resolution) spanned the entire YRD region. The simulation periods were January, April, July, and October 2017, representing the winter, spring, summer, and autumn, respectively. The simulation began 3 d prior to each of the study periods, and the results were not included in the model analysis as they served as a spin-up of the model.
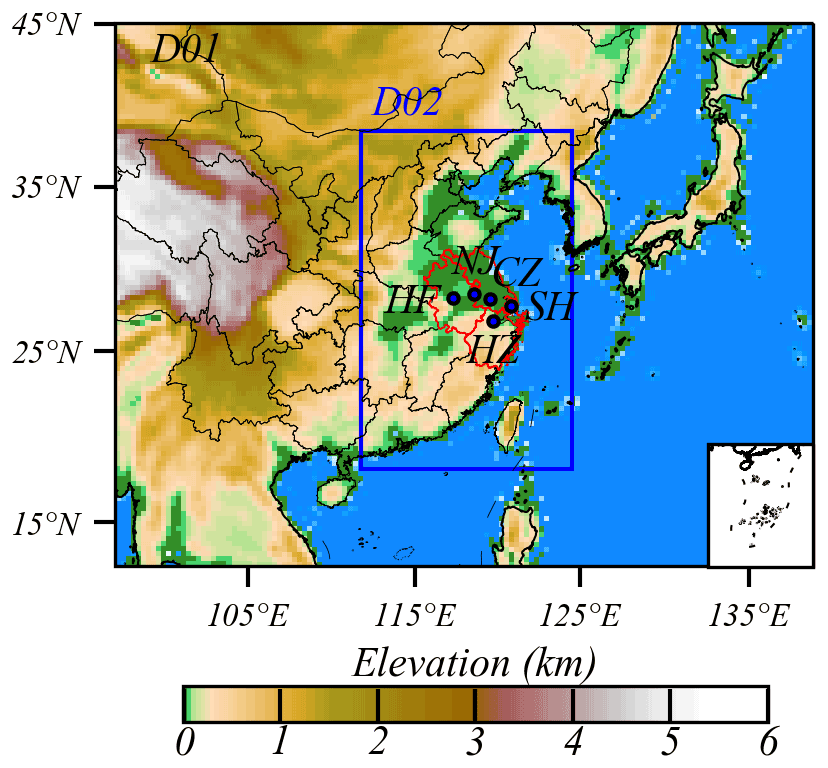
Figure 1The entire YRD region as the target region (marked as red) in two nested simulation domains (36 and 12 km resolutions) and the location of five representative YRD cities used in modeling evaluations in the d02 modeling domain. Publisher's note: please note that the above figure contains disputed territories.
The CMAQ model was configured using the photochemical mechanism of the State-wide Air Pollution Research Center version 07 (SAPRC07tic) and the sixth-generation aerosol (AERO6i) module (Fu et al., 2020; Sulaymon et al., 2021). Further details about the CMAQ modeling system have been provided in previous studies (Hu et al., 2016; Liu et al., 2020b). The Weather Research and Forecasting model (WRF v4.2, https://www2.mmm.ucar.edu/wrf/users/, last access: 30 April 2021) was used to simulate the required meteorological field inputs, with initial and boundary meteorological conditions from the National Centers for Environmental Prediction Final (NCEP/FNL) reanalysis data (https://rda.ucar.edu/datasets/ds083.2/, last access: 30 April 2021). The detailed configurations of the WRF model are shown in Table S1 in the Supplement and are consistent with Hu et al. (2016) and Wang et al. (2021). The anthropogenic emissions for the YRD region in 2017 were established by the Shanghai Academy of Environmental Sciences (SAES), a high-resolution (4 km ×4 km) anthropogenic emission inventory across the entire YRD region (An et al., 2021). The Multi-resolution Emission Inventory for China of the year 2017, with a resolution of (MEIC v1.3, http://meicmodel.org, last access: 30 April 2021), provided the anthropogenic emissions for other Chinese regions outside the YRD (Zheng et al., 2018). Emissions from other regions outside China in the inner domain were calculated using the gridded Regional Emission inventory in ASia (REAS v3.2, resolution) emissions of the year 2015. The Global Model of Emissions of Gases and Aerosols from Nature (MEGAN v2.1) was used to estimate biogenic emissions (Guenther et al., 2012). Biomass burning emissions were based on satellite observations including both gases and aerosols from the 2017 Fire Inventory from NCAR (FINN; Wiedinmyer et al., 2011). Further descriptions of the emission processing have been provided in previous studies by Hu et al. (2016) and Qiao et al. (2015) and are therefore not repeated here.
2.2 Contributions of transport
To quantify the contributions of local and regional transport to the surface concentrations of the nitrate-phase species (i.e., HNO3 and NO3−), four scenarios were simulated under the same meteorological fields. Briefly, in the first (base) scenario, the anthropogenic emissions in the YRD and outside regions for 2017 were included. In the second (YRD-zero) scenario, anthropogenic emissions in the YRD were set to zero, while anthropogenic emissions in regions outside the YRD were used. In the third (outside-zero) scenario, only anthropogenic emissions in the YRD were included, while the regions outside the YRD were set to zero. The fourth (all-zero) scenario represented the background case, where the anthropogenic emissions within the study domain were set to zero.
The predicted concentrations were denoted as Cbase, CYRD-zero, Coutside-zero, and Call-zero, representing NO3− concentrations associated with the base, YRD-zero, outside-zero, and all-zero scenarios, respectively. The contributions of local YRD emissions, regional transport (the sum of direct and indirect transport from outside regions), direct transport (NO3− contributed by transported precursors from outside regions), indirect transport (NO3− contributed by transported and locally emitted precursors via the OH + NO2 and HET N2O5 chemical pathway), and background were defined as FLocal, FRegion,FDirect, FIndirect, and FBackground, respectively, and they were calculated as follows:
Besides NO3−, the major gases pollutants (i.e., NH3, NO2, and HNO3), atmospheric oxidants (i.e., O3 and OH,), and particulate pollutants (i.e., PM2.5 and TNO3) were also quantified. The values of the contributions of the local, direct, and indirect transport emissions can be greater or less than zero, which represents the generation or depletion of pollutants through chemical reactions between local and non-local precursors.
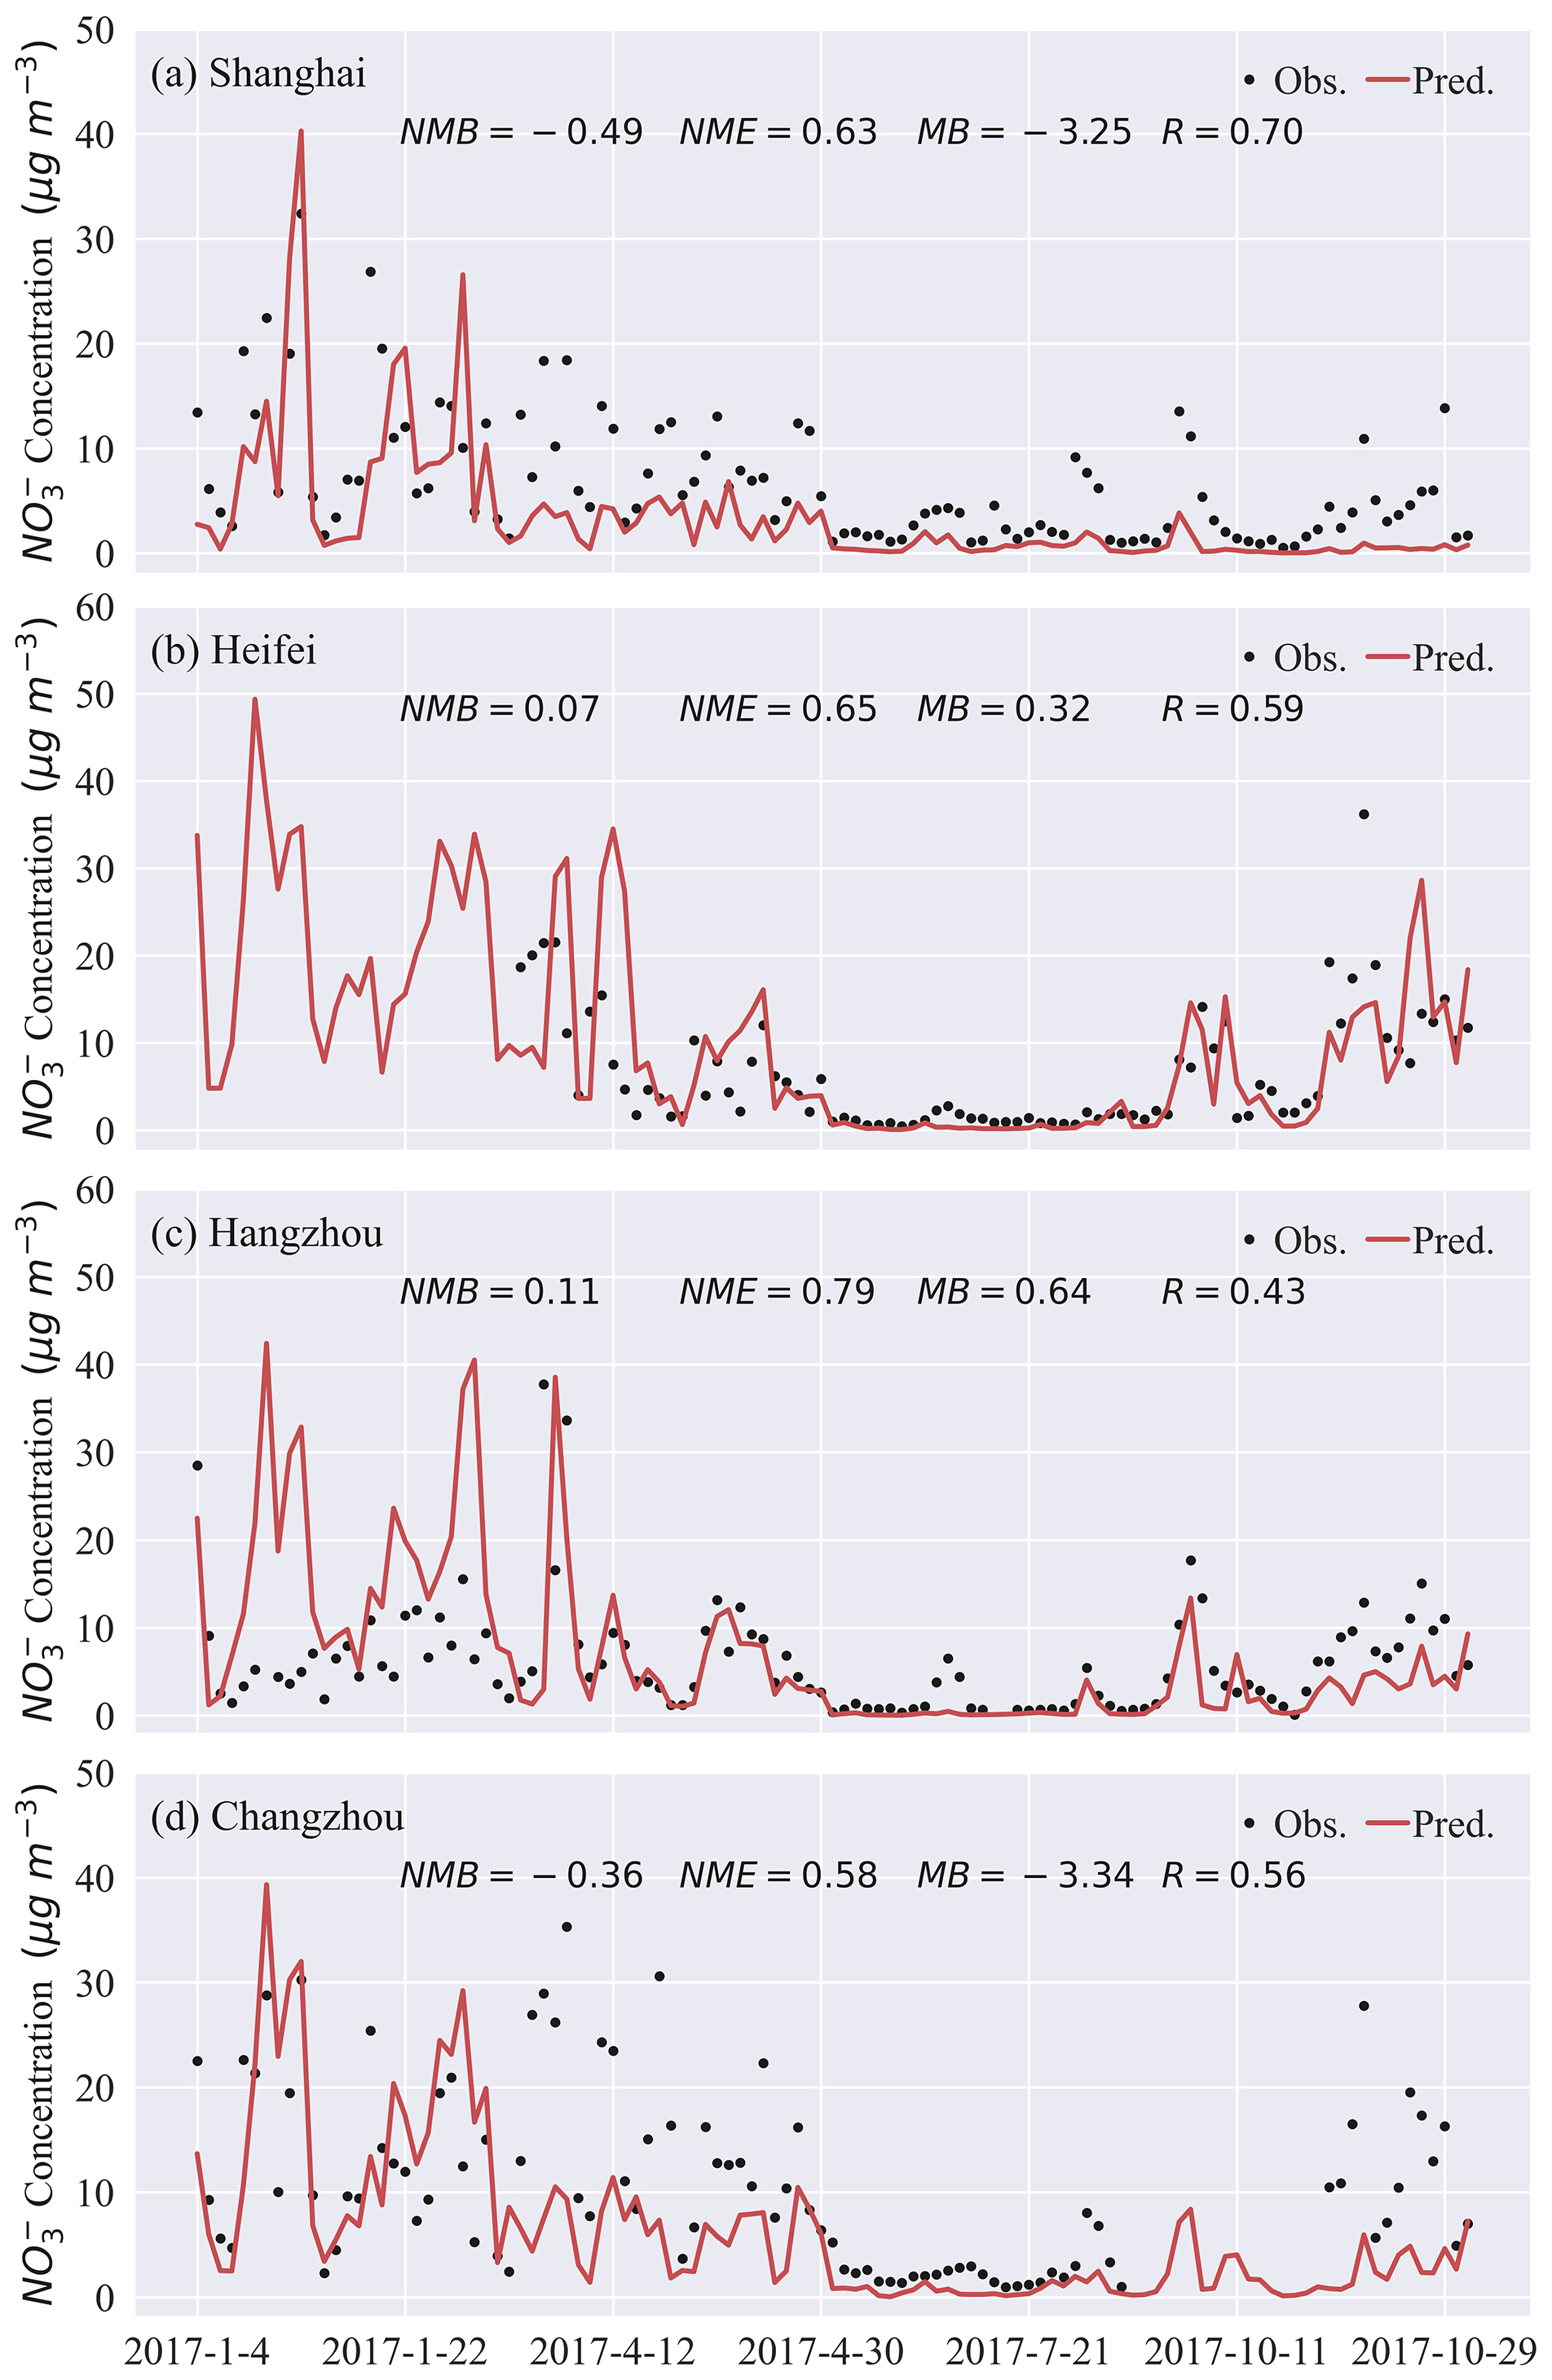
Figure 2Time series of predicted (red) and observed (black) daily NO3− concentrations in four atmospheric environment supersites (a–d) in January, April, July, and October 2017.
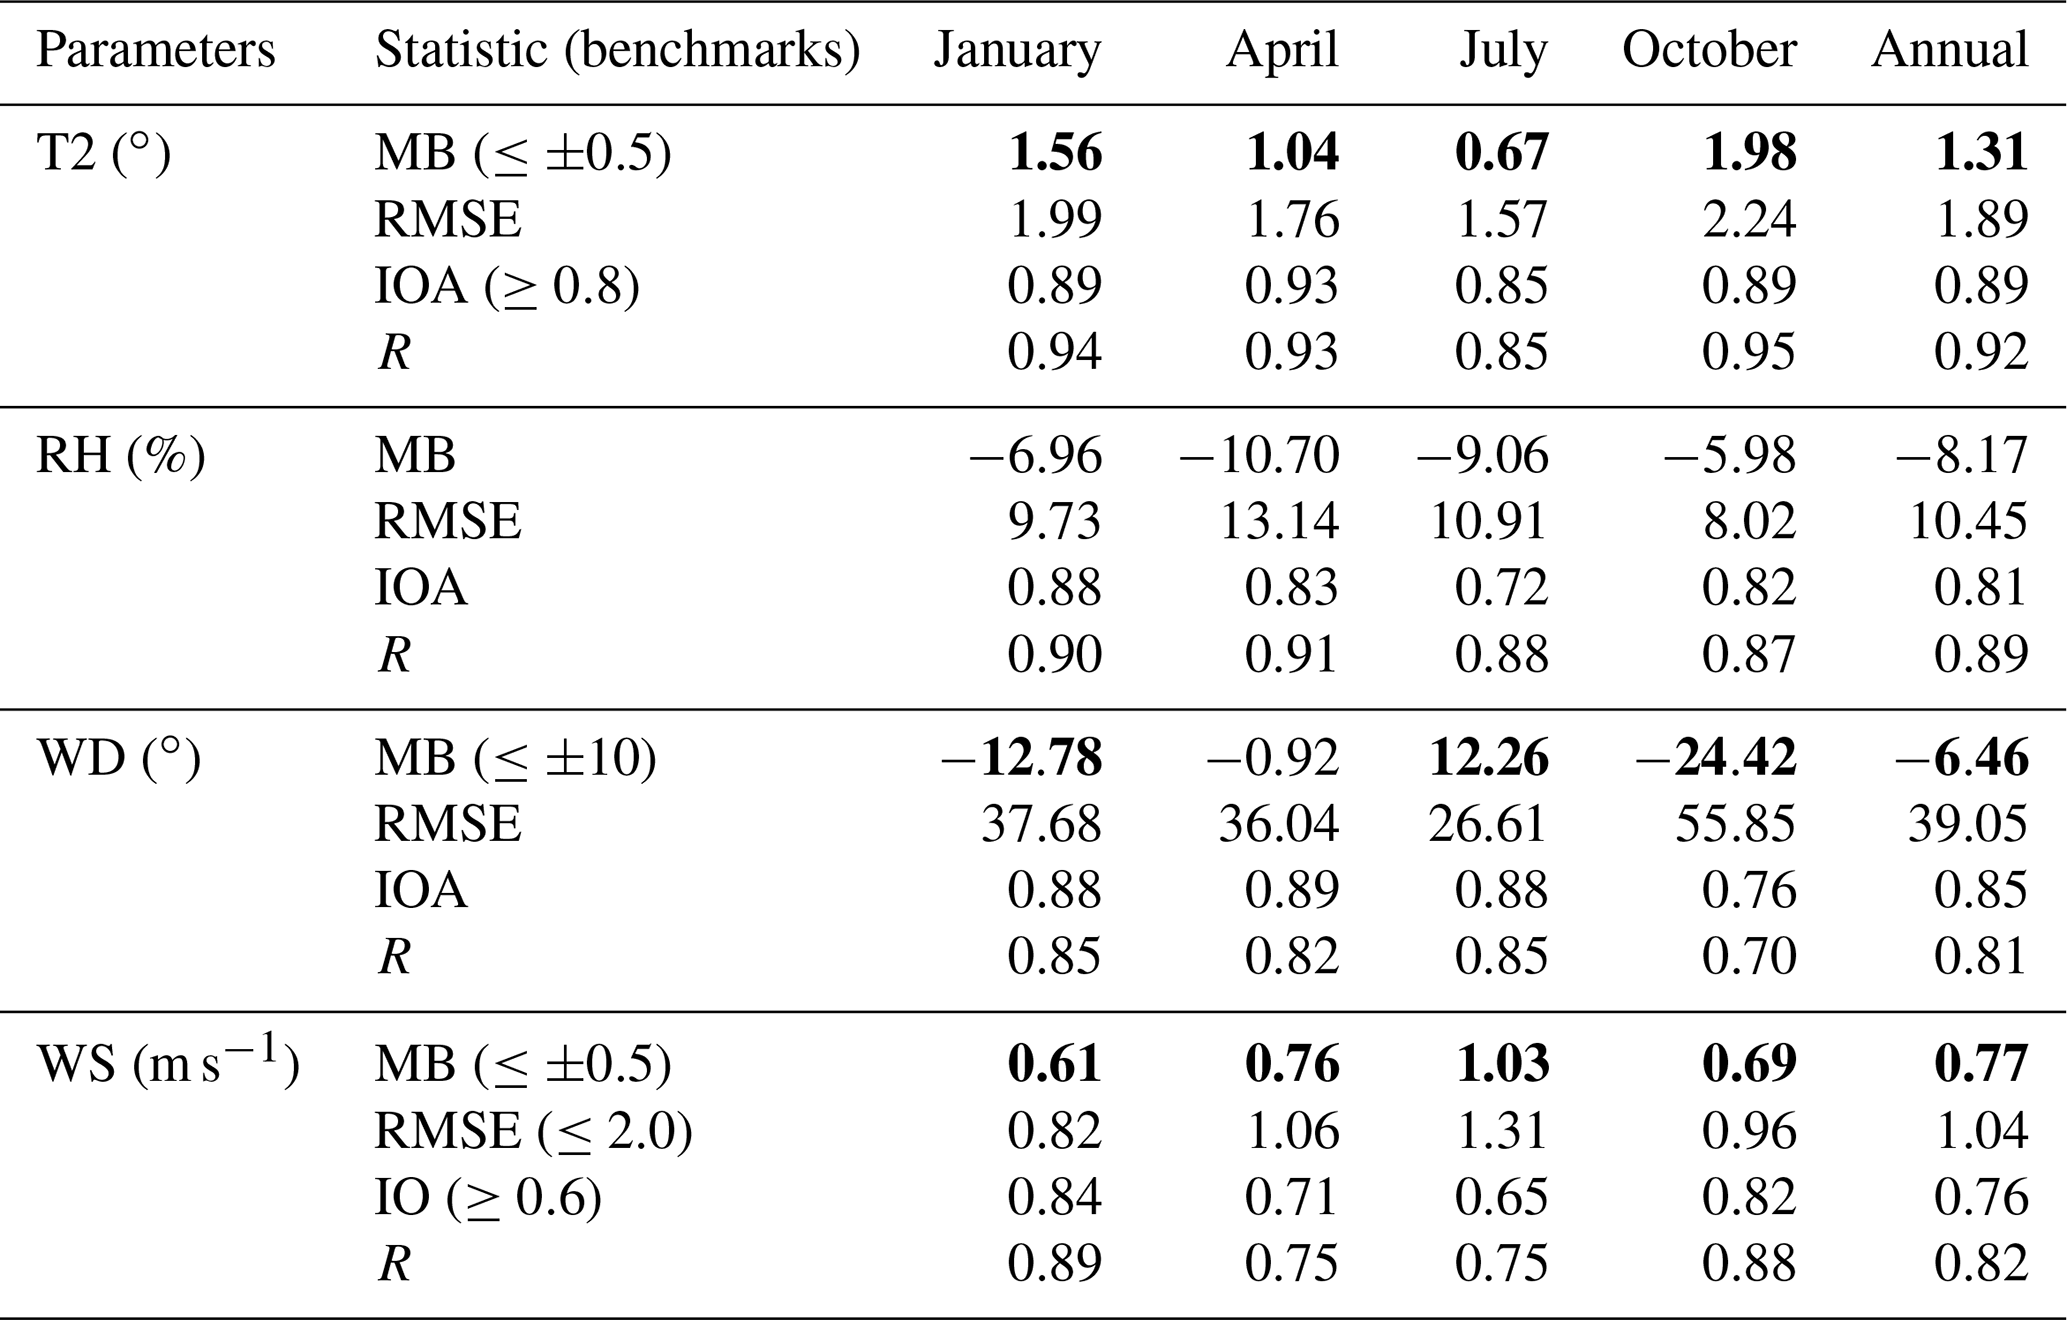
Table 1Model performance for meteorological parameters for January, April, July, October and the annual average of 2017 in the entire YRD region. The values that do not meet the criteria are denoted in bold. The equations for MB, RMSE, and IOA are defined in Table S4. The benchmarks are suggested by Emery and Tai (2001).
2.3 Process analysis
In the CMAQ model system, the process analysis (PA) tool has two components, the integrated process rate (IPR) and integrated reaction rate (IRR; Liu et al., 2011; Byun and Schere, 2006). The IPR analysis was applied to investigate the cumulative effect of chemical and physical processes to NO3− and HNO3 formation and their daily variation within the PBL (Chen et al., 2019; Yang et al., 2020; Kim et al., 2014). These processes, as explained in Table S2, include aerosol processes (AERO), gas chemistry (CHEM), emission (EMIS), horizontal transport (HTRA), vertical transport (VTRA), dry deposition (DDEP), and cloud processes (CLDS). Furthermore, the IRR analysis was employed to quantify the rates of TNO3 chemical reactions pathways (Qu et al., 2021; Fu et al., 2020; Shen et al., 2020). The complex chemical production of TNO3 involves eight reaction pathways, detailed in Table S3 (Qu et al., 2021; Fu et al., 2020; Chuang et al., 2022). In the latter analyses, these pathways are grouped into three major TNO3 production pathways, including the OH + NO2, HET N2O5, and “others” pathways, according to their importance. Shanghai is selected as an example in the IPR and IRR analysis to explore the impacts of physical and chemical processes of NO3− and HNO3 formation because it is the largest city in the YRD and has the most abundant measurement data.
2.4 Observation data
Hourly concentrations of six routine air pollutants (i.e., O3, PM2.5, NO2, SO2, and carbon monoxide (CO)) in five representative YRD cities (i.e., Shanghai, Nanjing, Hefei, Hangzhou, and Changzhou, shown in Fig. 1) during the four seasons were obtained from the China Ministry of Ecology and Environment (http://www.cnemc.cn/, last access: 27 September 2022). Furthermore, hourly NO3− concentrations were measured by the Monitors for AeRosols and Gases (MARGA 1S ADI 2080, Netherlands, Khezri et al., 2013) at four urban atmospheric environment supersites: Shanghai (31.23∘ N, 121.54∘ E), Hefei (31.78∘ N, 117.20∘ E), Hangzhou (30.29∘ N, 120.16∘ E), and Changzhou (31.76∘ N, 119.96∘ E). Observation data of meteorological parameters (temperature (T2, ∘C), relative humidity (RH, %), wind speed (WS, m s−1), and wind direction (WD, ∘)) for 75 weather stations in the YRD were downloaded from the Chinese Meteorological Agency (http://data.cma.cn/en, last access: 30 November 2021).
The statistical metrics used for the WRF-CMAQ model evaluation include the mean bias (MB), normalized mean bias (NMB), normalized mean error (NME), correlation coefficient (R), root-mean-square error (RMSE), and index of agreement (IOA). Definitions and criteria of all statistical metrics are illustrated in Table S4. The benchmarks of major air pollutant (PM2.5, NO2, O3, and NO3−) concentrations are suggested by Emery et al. (2017) and Huang et al. (2021). The benchmarks of major meteorological parameters (T2, WS, and WD) are suggested by Emery and Tai (2001).
3.1 Model evaluation
3.1.1 WRF model performance
Table 1 shows the modeling performance statistics of the meteorological parameters in the four seasons of 2017. Predicted T2 and WS values are slightly higher than the observations, and MB values of T2 and WS exceed the suggested benchmark (MB ) in all seasons. The seasonal and annual IOA values of T2 occur within the suggested benchmark (IOA ≥0.8). For WS, the seasonal and annual values of RMSE and IOA all meet the suggested criterion (RMSE ≤2.0 and IOA ≥0.6). The MB values of WD are slightly above the suggested benchmark (MB ) in the four seasons, except during spring. RH is generally underestimated compared to the observations with averaged MB values of −6.96, −10.7, −9.06, and −5.98 in winter, spring, summer, and autumn, respectively. There is no suggested criterion for the MB value of RH. In addition, high seasonal and annual values of R (0.85–0.95 for T, 0.87–0.91 for RH, 0.70–0.85 for WS, and 0.75–0.89 for WD) are found. The WRF performance in this study is comparable to WRF performance in our previous simulation studies (Wang et al., 2021; Hu et al., 2016; Sulaymon et al., 2021).
3.1.2 CMAQ model performance
Table 2 and Fig. S1 in the Supplement show the model performance and time series of major air pollutants in the four seasons. Overall, the CMAQ model has reasonably reproduced the observed PM2.5, O3, and NO2 concentrations in the YRD region, especially in Shanghai. The daily concentrations of PM2.5 are efficiently simulated in the five cities except Hefei, illustrated by the NMB, NME, and R values meeting the criteria established by Emery et al. (2017; NMB , NME ≤0.50, and R>0.70). MDA8 O3 values are slightly overestimated in Nanjing, Hefei, Hangzhou, and Changzhou. Predicted concentrations of NO2 are generally lower than the observations in all five cities ( NMB , MB ). When compared to our previous studies (Hu et al., 2016; Wang et al., 2021; Ma et al., 2021; Sulaymon et al., 2021; Li et al., 2021a), the statistical results in this study show a better model performance.
Table 2Model performance of major pollutants for the full year of 2017 in five representative YRD citiesa.

a The year of 2017 includes the 4 typical months (January,
April, July, and October). b MDA8 O3, NO2, SO2, and
PM2.5 are given in units of µg m−3 and CO is given in units of mg m−3).
c The equations of NMB, NME, MB, and R
are found in Table S4. The values
that do not meet the criteria are highlighted in bold.
The recommended benchmarks for MDA8 O3, 24 h PM2.5, and
NO3− are suggested by Emery et al. (2017) and Huang et al. (2021).
Figure 2 illustrates the comparison of predicted and observed NO3− concentrations at the four supersites on daily timescales. The general temporal variations of observed NO3− concentrations are efficiently captured by the model. The daily concentrations of NO3− are efficiently predicted in four supersites, all within the benchmark (NMB , NME ≤0.75, and R>0.6). However, in Hefei (Fig. 2b) the wintertime NO3− measurement data are not available, which is when NO3− shows the highest concentrations and is of most concern. Good agreement between predicted and observed values is demonstrated on daily timescales, especially in Shanghai (NMB ; R=0.70), Hangzhou (NMB =0.11; MB =0.64), and Changzhou (NMB =0.36; R=0.56). Overall, the statistical performance metrics of predicted NO3− in this study are comparable to those of our previous works (Shi et al., 2017; Qu et al., 2021; Xie et al., 2022). Figure S2 shows the hourly predicted and observed NO3− concentrations in each season. NO3− concentrations are generally underestimated during the summer and autumn. One possible reason is that RH is slightly underestimated by the WRF model during these seasons (Table 1), which results in a lower buildup of NO3− concentrations. Other reasons could be associated with uncertainties in the NO3− formation mechanisms (missing or insufficient heterogeneous reactions) in the current CMAQ model and uncertainties in NOx and NH3 emissions (Zheng et al., 2020; Lu et al., 2021b; Zheng et al., 2015; Liu et al., 2019; Xie et al., 2022).
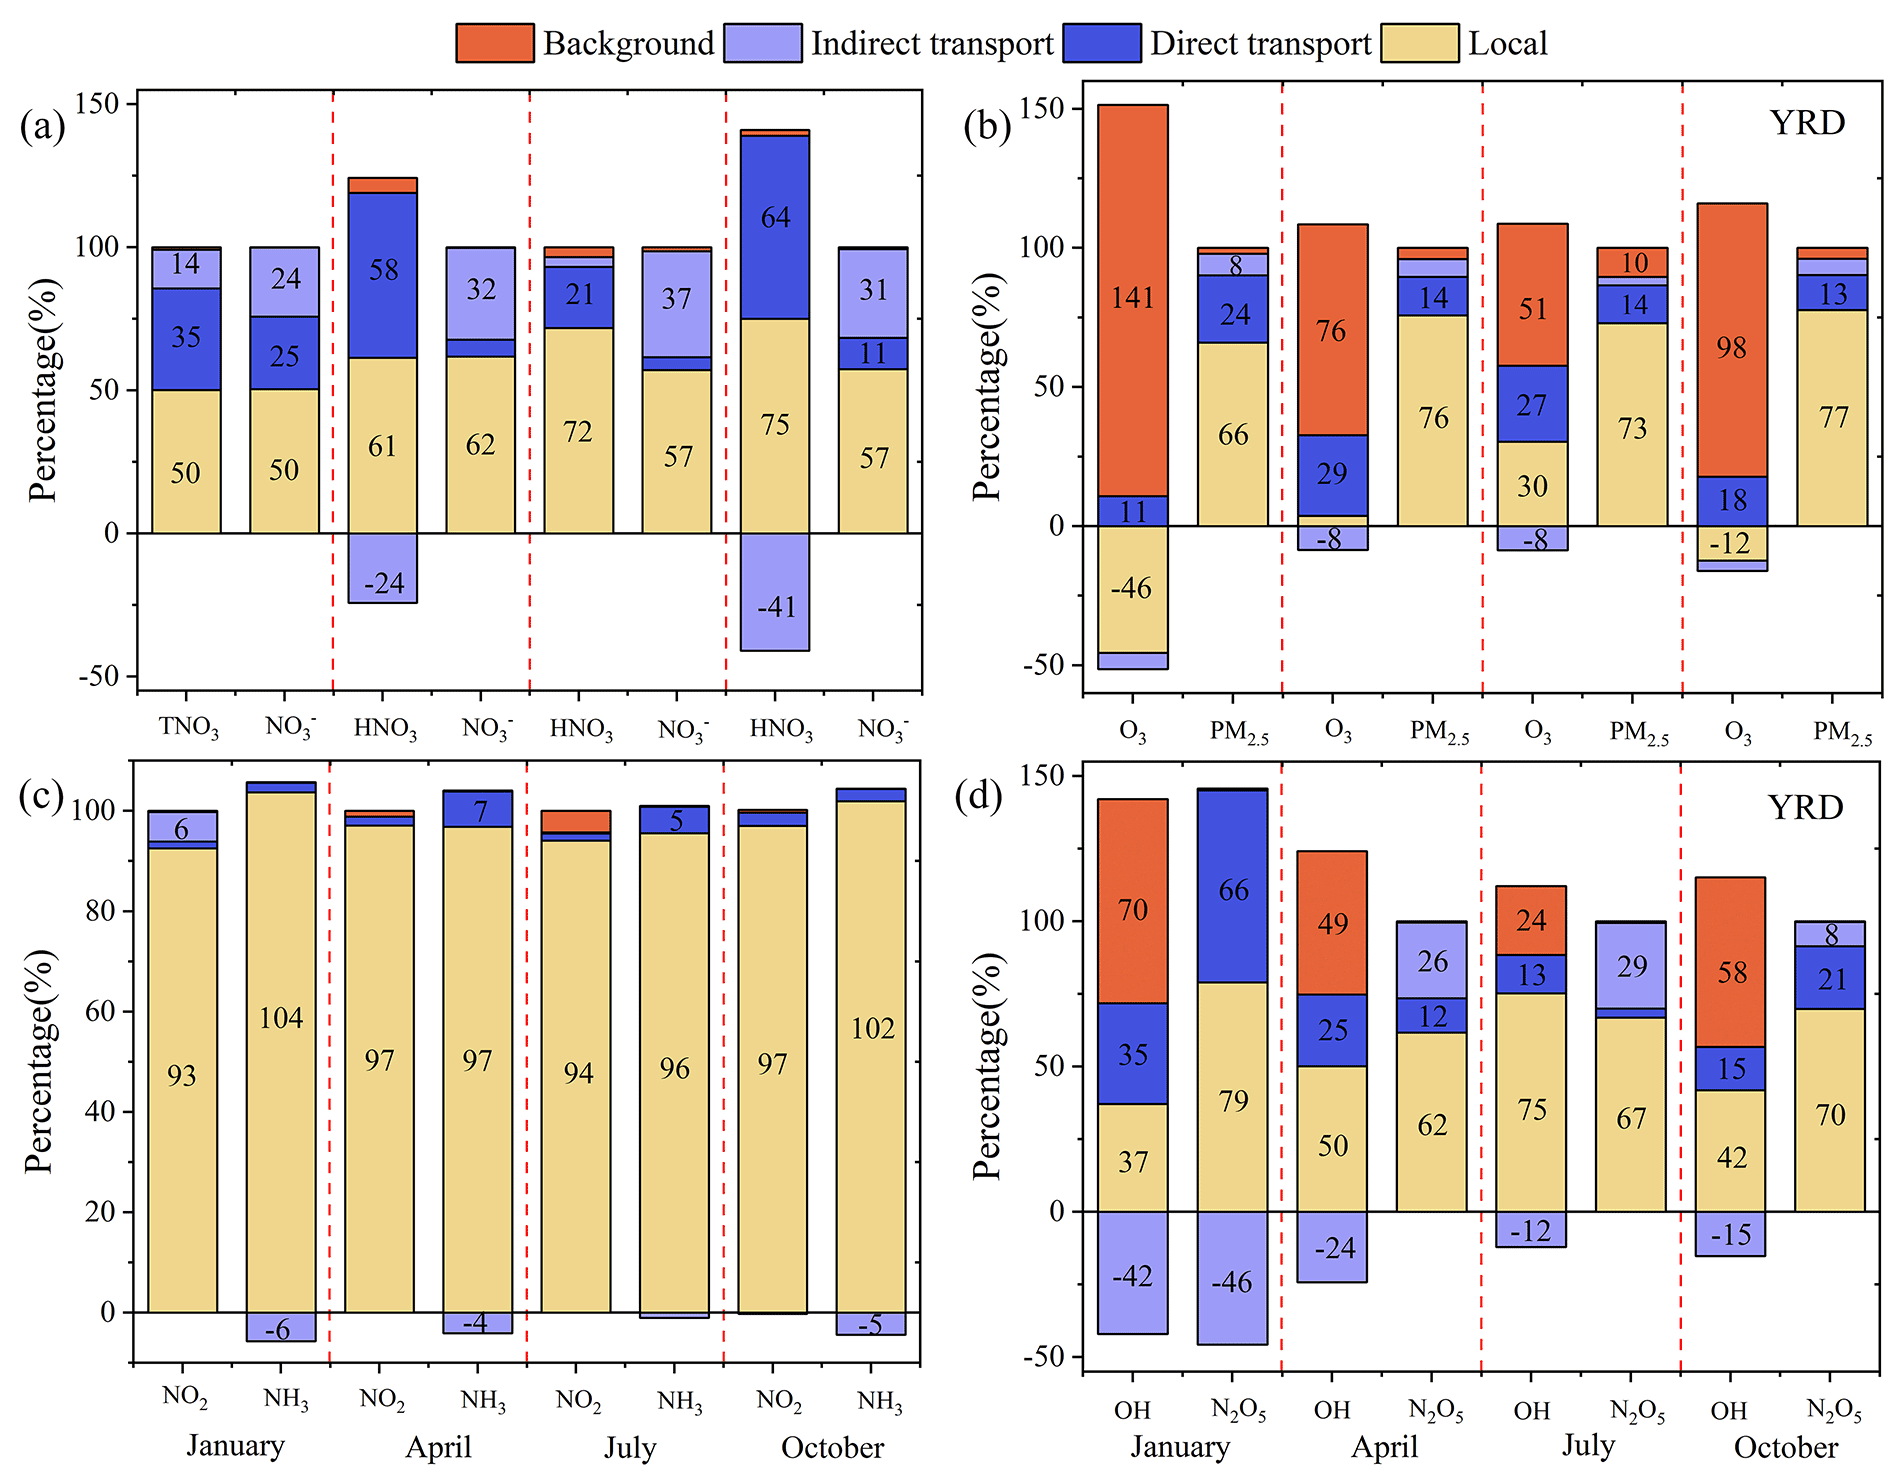
Figure 3Contributions of background, local, indirect, and direct transport to nitrate-related species in 4 months of 2017 for the entire YRD region (a–d). Nitrate-related species represent NO3−, HNO3, PM2.5, O3, NO2, NH3, OH, and N2O5. The contributions of HNO3 in January 2017 are shown in Fig. S6.
3.2 Regional transport contribution to nitrate in YRD
Figure S3 shows the spatial distribution of the seasonal (winter, spring, summer, and autumn) and annual (average of the four seasons) NO3−, HNO3, and TNO3 concentrations under four emission scenarios in the d02 domain. Under Cbase, the seasonal and annual NO3− concentrations for the entire YRD region were 16.0, 7.4, 1.0, 5.4, and 7.4 µg m−3, respectively (Table S5). Compared to Cbase, the seasonal and annual NO3− concentrations in Coutside-zero decreased by 8.0, 2.8, 0.4, 2.2, and 3.3 µg m−3, respectively. Even more significant differences in NO3− are observed between Cbase and CYRD-zero. The NO3− decreased by 12.0, 6.9, 0.9, 4.8, and 6.1 µg m−3 in winter, spring, summer, autumn, and over the whole year, respectively, to become almost twice as high as those between Cbase and Coutside-zero. The results suggest that the local anthropogenic emissions contribute more to the seasonal NO3− concentrations in the YRD.
Figure 3 shows the regional contributions of the background, local, direct, and indirect transport to nitrate-related species in the four seasons (results for Shanghai are shown in Fig. S4). The local emissions dominate NO3− concentrations throughout the YRD, accounting for 50.4 %–62.0 % in the four seasons (Fig. 3a). Figure 3c suggests that the precursors (NO2 and NH3) are dominated by the local emissions (more than 93.0 %). The contributions of the total regional transport are 49.5 %, 38.0 %, 41.6 %, and 42.0 % in winter, spring, summer, and autumn, respectively. The indirect transport contributes 24.2 %–37.0 % of NO3− concentrations and exceeds the contributions from direct transport in the spring, summer, and autumn. Similarly, Qu et al. (2021) reported that the reaction between the locally emitted NO2 and transported O3 dominates the production of indirect NO3− transport in the PRD region.
In Fig. 3b, the local emission and indirect transport have negative contributions to O3 concentration, leading to the depletion of O3 in the four seasons. For O3, the local emissions have negative contribution in winter (−46 %) and autumn (−12 %). The negative contributions of the indirect transport are −6 %, −8 %, −8 %, and −4 % in winter, spring, summer, and autumn, respectively. In Fig. 3d, the indirect transport contributes from −42 % to −12 % of OH concentrations in the four seasons. The negative indirect transport contributions to O3, N2O5, and OH suggest that the atmospheric oxidants are consumed in the YRD, which in turn enhances the chemical production of NO3−.
3.3 Formation processes of nitrate
Figure 4 shows the modeled diurnal variations of three nitrate phases (NO3−, HNO3, and TNO3), the major precursors (i.e., O3, NO2, and NH3), and the major atmospheric oxidants (OH and N2O5) in the four seasons for the entire YRD region in the base scenario. Except for summer, higher predicted TNO3 and NO3− concentrations are observed in early morning hours (06:00–08:00 BJT, Beijing time), while lower TNO3 and NO3− concentrations are observed around 16:00–18:00 BJT. Predicted concentrations of TNO3, HNO3, and O3 show the same diurnal variations in the summer, and peak around 12:00 BJT (the most active photochemical hours). The opposite results in the profiles of TNO3's diurnal variation between summer and non-summer periods are mainly attributed to the temperature effect on the gas-to-particle partitioning between NO3− and HNO3. As shown in Fig. S3, NO3− dominates the TNO3 concentrations and determines its diurnal variations in non-summer periods, while HNO3 dominates the diurnal variation in summer. A two-peak mode diurnal variation of NO2 and NH3 is identified in the four seasons. High concentrations of NO2 and NH3 occur in the early morning (06:00–08:00 BJT) and early evening (18:00–19:00 BJT), due to the local transportation emissions during rush hours. OH and N2O5 have a one-peak-mode diurnal variation in the four seasons. OH peaks around 12:00 BJT, similar to HNO3, while N2O5 peaks around 18:00–20:00 BJT.
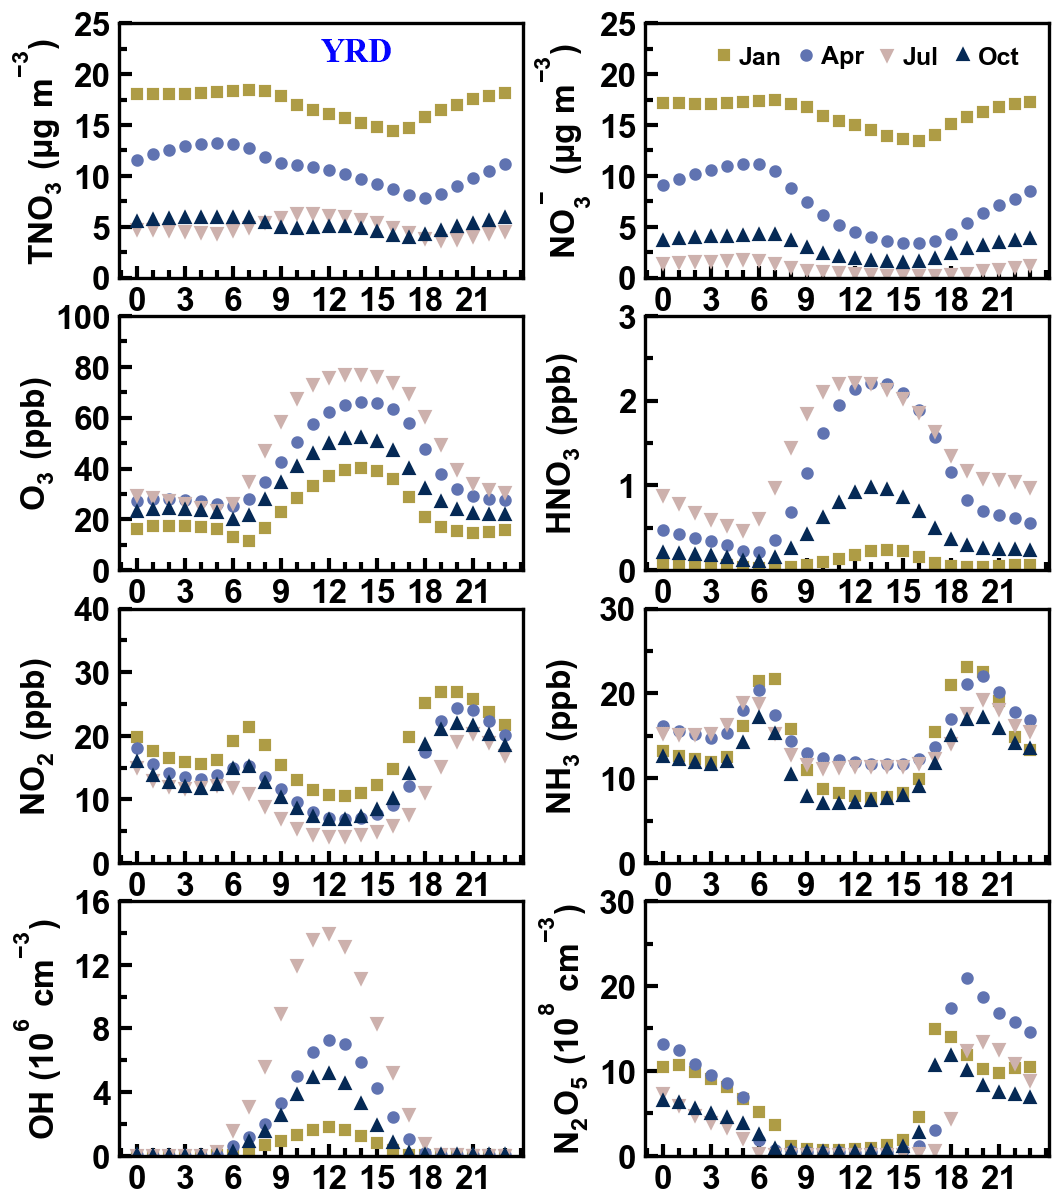
Figure 4Monthly diurnal variations of three nitrate phases (NO3−, HNO3, and TNO3), the major nitrate precursors (NO2, NH3, and N2O5), and atmospheric oxidants (O3 and OH) for the entire YRD region under the base scenario. The x axis marks each hour of the day (local time in Beijing).
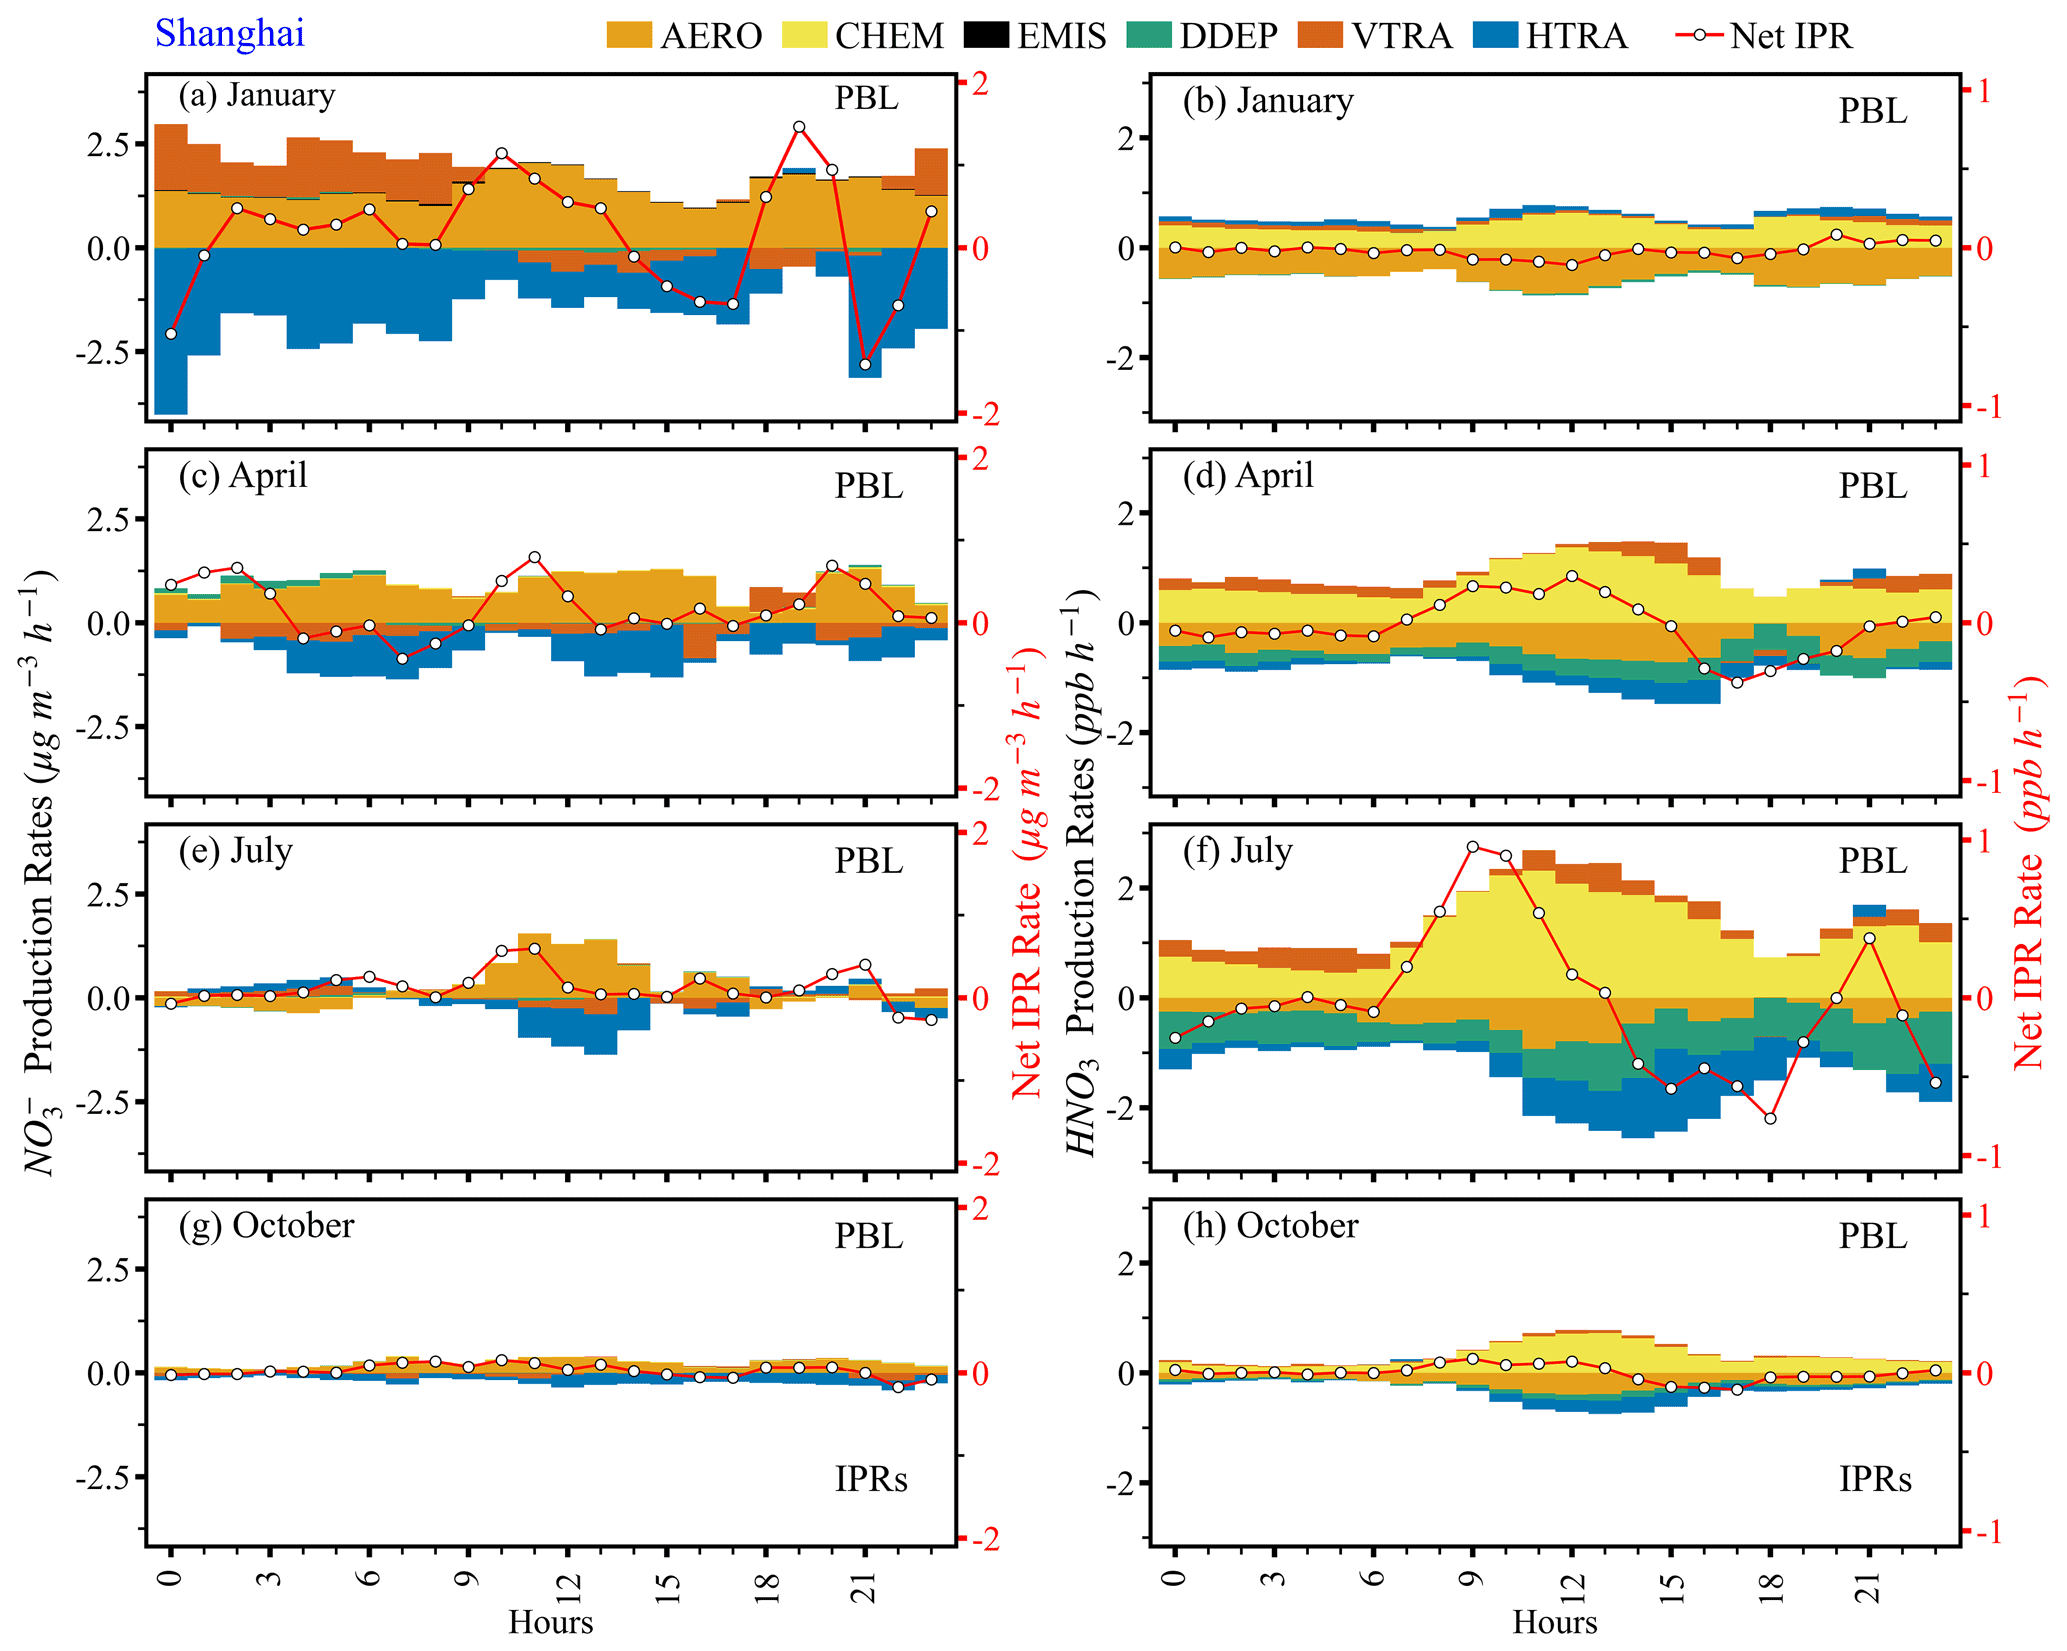
Figure 5Diel variations in physical and chemical processes rates of NO3− and HNO3 production (a–h) within the PBL in Shanghai. The red line represents the net IPR value for each hour of the day; its value scale is on the right y axis.

Figure 6(a) Mean diurnal variations of TNO3 production rates in different pathways in 2017 in Shanghai. (b) Average potential contribution of OH + NO2, HET N2O5, and others to TNO3 chemical production in Shanghai within the PBL under the base case simulation. Daytime (07:00–18:00 BJT) and nighttime (19:00–06:00 BJT) are given separately. OH + NO2 and HET N2O5 pathways are denoted as “OH NO2” and “HET N2O5” in Figs. 6 and 7.
Table 3Seasonal TNO3 production rates (ppb h−1) and contributions (%) of the major production pathways in five representative cities.

Table 4Comparison of contributions of major nitrate formation pathways in China and other regionsa.
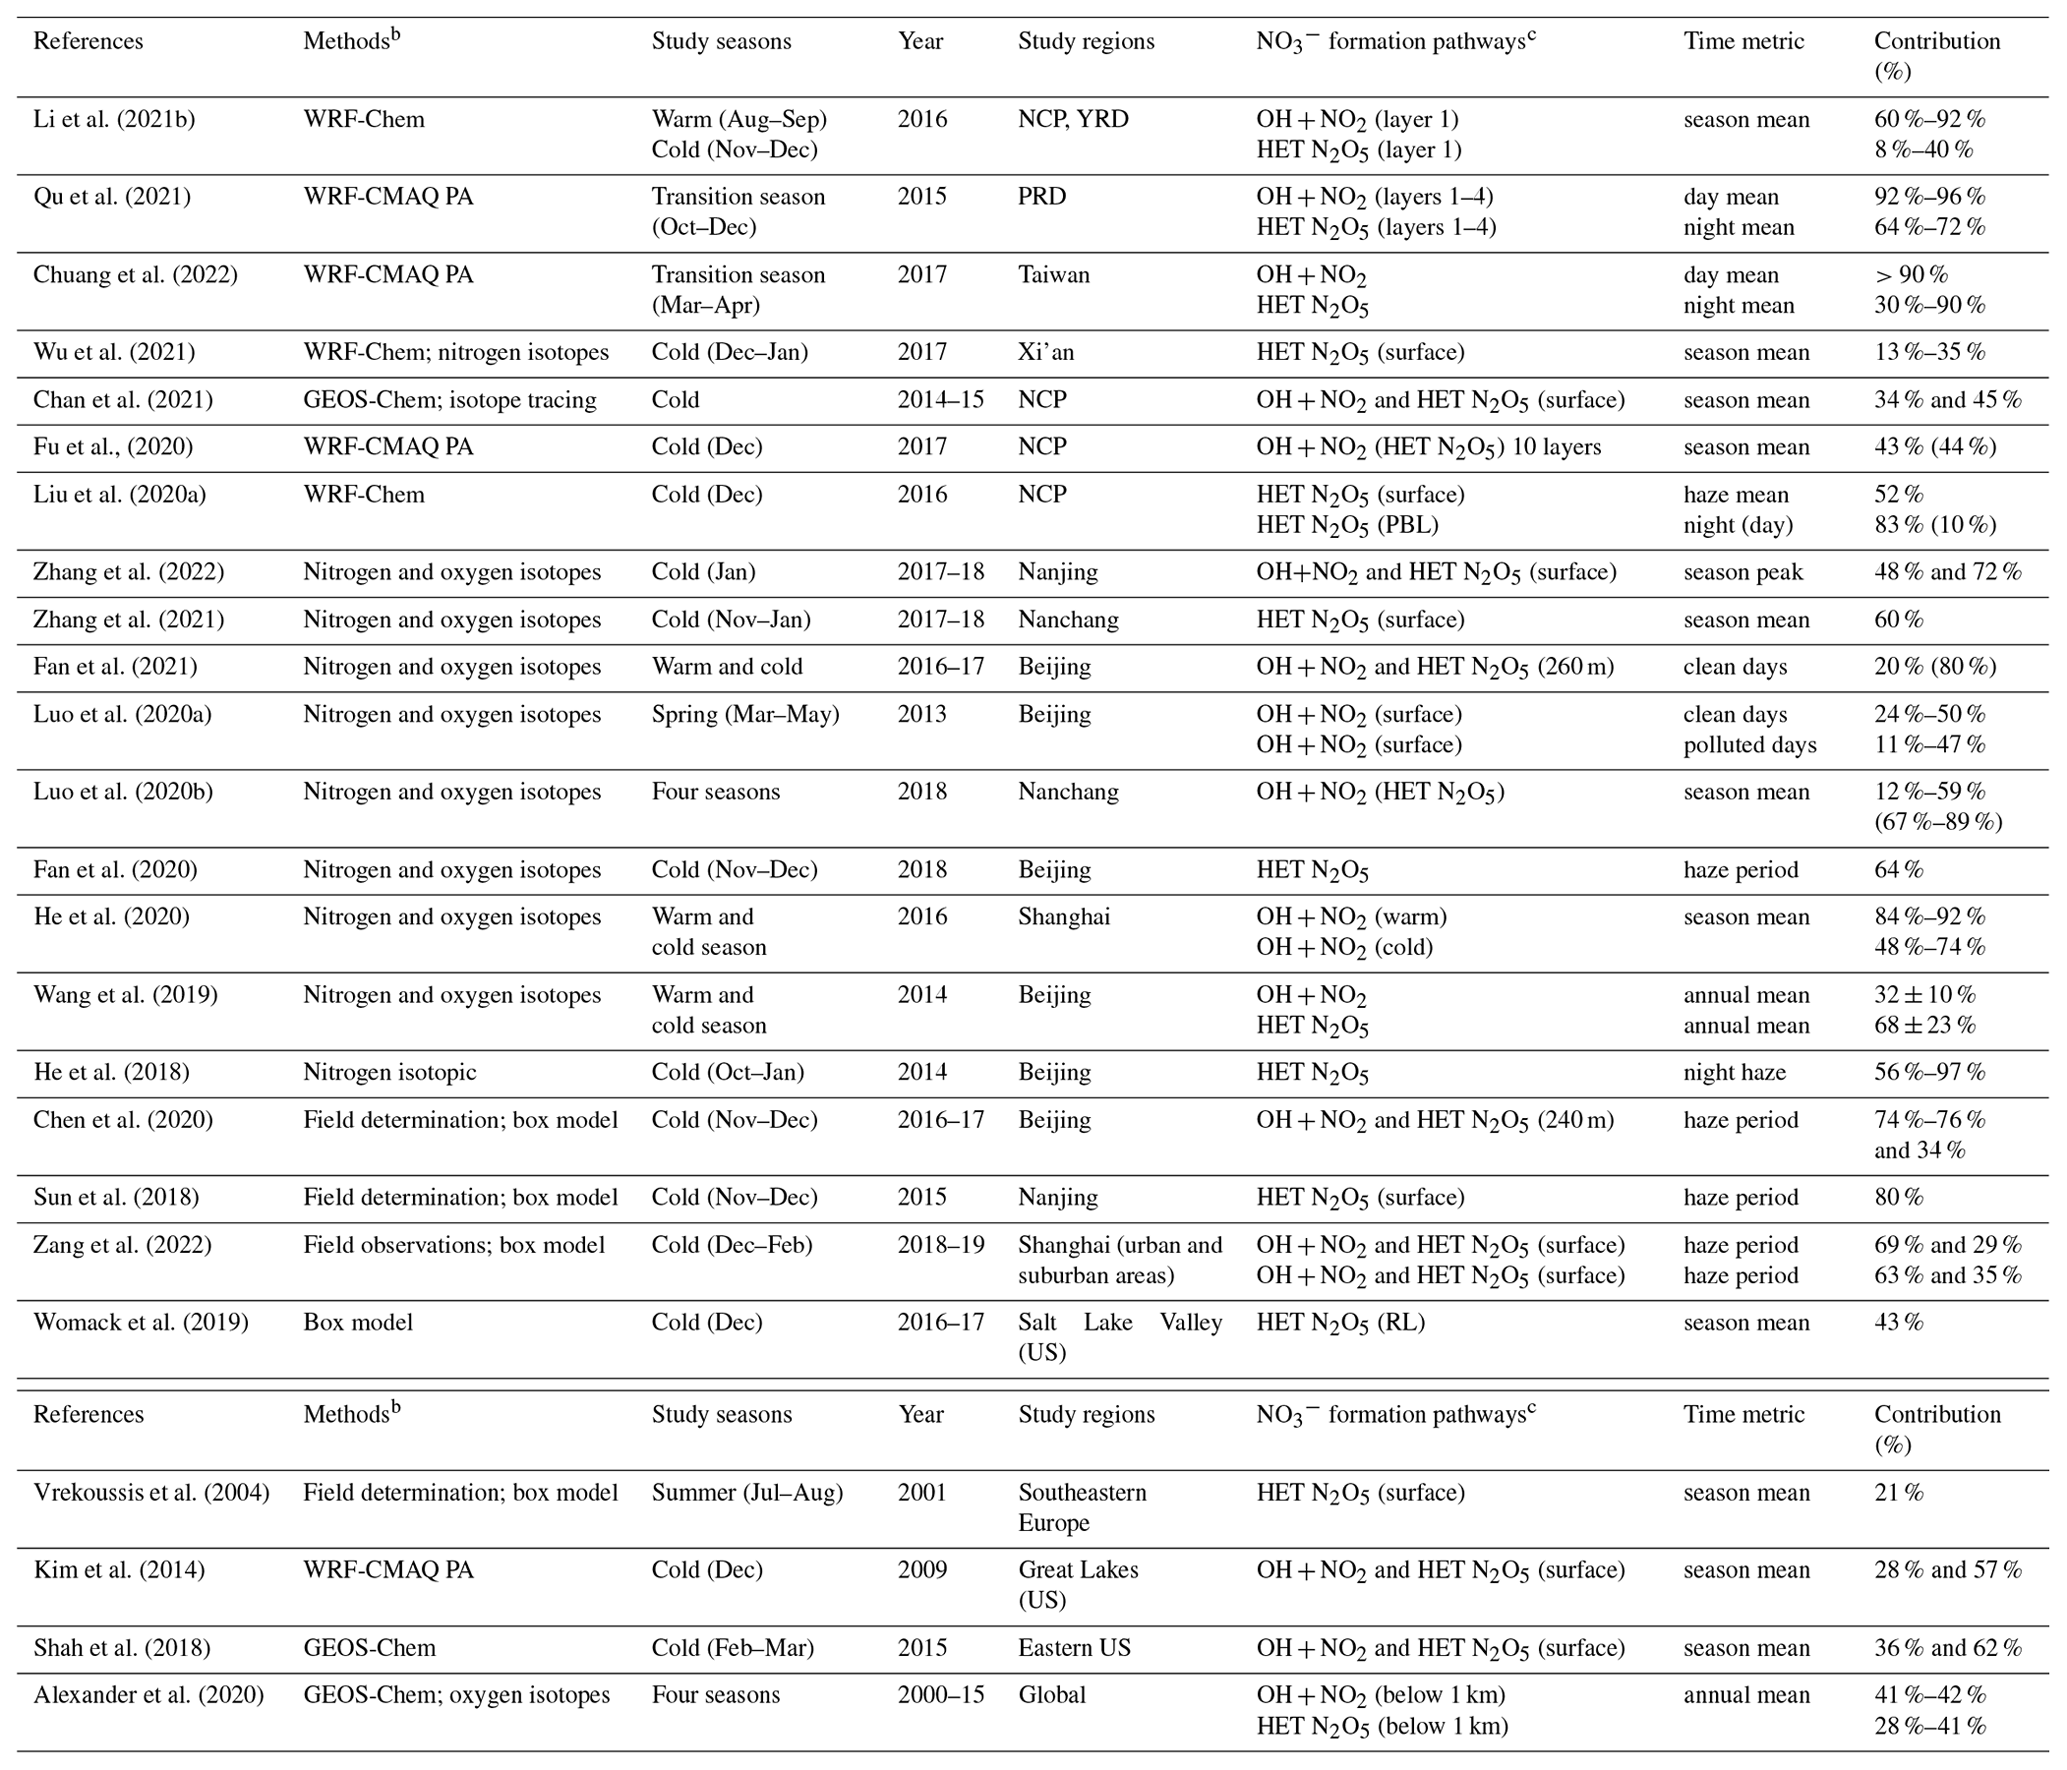
a The 24 peer-reviewed publications are conducted in the major
regions and megalopolises of China (the North China Plain (NCP), Yangtze
River Delta (YRD), Pearl River Delta (PRD)), the United States, and the
global region.
The comparison serves to quantify the relative contribution
of two main nitrate formation pathways in different seasons. b Methods
include the 3D CTMs, nitrogen and oxygen isotopes analysis, field
determination, and box models.
c Surface represents the surface layer.
Figure S6 shows seasonal variations in NOPM2.5, NOTNO3, nitrogen oxidation ratios (NOR = [NO3−]([NO [NO2])), and adjusted gas ratio (adjGR = ([NH3]+ [NO([HNO3]+ [NO3−])) in the YRD. NOPM2.5 and NOTNO3 are the highest in the winter, accounting for 21±5 % and 94±3 %, respectively. The averaged NOR values for the entire YRD region are 0.24, 0.16, 0.03, and 0.13 mol mol−1 in winter, spring, summer, and autumn, respectively. The highest value of NOR in winter suggests a high conversion efficiency of NO2 to NO3−. AdjGR values are generally greater than 2 in the four seasons across most areas in the YRD, indicating that YRD is mostly in the NH3-rich regime. Therefore, NH3 is not a limiting factor of NO3− formation in YRD.
Figure 5 illustrates a two-peak-mode diurnal variation of the net IPR rates of NO3− production in the four seasons. Peak hours are around noon (10:00–11:00 BJT) and in the early evening (19:00–21:00 BJT), with peak rates of 1.2–1.5, 0.7–0.8, 0.4–0.6, and 0.1–0.2 µg m−3 h−1 in the winter, spring, summer, and autumn, respectively. AERO processes (including condensation, coagulation, and aerosol growth) are the dominant contributors to NO3− formation, with peak rates of 2.1, 1.3, 1.5, and 0.4 µg m−3 h−1 in the winter, spring, summer, and autumn, respectively. The sharp decline hours of the net IPRs (around 11:00–18:00 BJT) are mainly dominated by TRAN (sum of HTRA and VTRA) processes, with mean rates of −1.4, −0.8, −0.7, and −0.3 µg m−3 h−1 in the winter, spring, summer, and autumn, respectively. However, in summer, TRAN processes constitute the dominant source after midnight (01:00–06:00 BJT), owing to the stable PBL weakening the contribution of vertical transport and accelerating the accumulation of NO3− concentrations at the surface (Huang et al., 2020c). In Fig. S7, VTRA processes act as the main positive contributor to NO3− buildup production from 00:00 to 23:00 BJT at layer 1 (surface layer), while AERO processes make the negative contribution to NO3− within layers 1–8 (from the surface to 800 m). Above layer 10, AERO processes for NO3− production are positive in the daytime, which is conducive to the accumulation of NO3− concentrations.
For HNO3, a one-peak-mode diurnal variation of the net IPR rates is found, and peak times are at 20:00 BJT in the winter and around 09:00–12:00 BJT in other seasons (Fig. 5). Meanwhile, CHEM (gas chemical processes) processes are the major contributor to HNO3 formation, with the peak rates being 0.6, 1.4, 2.3, and 0.7 ppb h−1 in the winter, spring, summer, and autumn, respectively. In the spring, summer and autumn, the peak times of HNO3 formation are consistent with the first peak times of NO3−. The seasonal net IPR rates reached a maximum of 0.3, 1.0, and 0.1 ppb h−1, respectively. CHEM and VTRA processes are the dominant contributors to HNO3 production, especially from 07:00 to 13:00 BJT (net IPR rates >0), with seasonal peak rates of 1.5, 2.7, and 0.8 ppb h−1, respectively. AERO, DDEP, and HTRA processes are the dominant contributors to the HNO3 sharp decline (14:00–17:00 BJT), with the lowest net IPR rates of −0.8, −0.7, and −0.3 µg m−3 h−1 in the spring, summer, and autumn, respectively. DDEP processes are the dominant sink of HNO3 in summer ( ppb h−1). However, in the winter, the peak times of HNO3 production are the opposite regarding the first peak time of NO3− production but are consistent with the second peak time. HTRA makes a positive contribution to HNO3, with peak rates of 0.18 ppb h−1 at 20:00 BJT. In Fig. S12, the only large sink is the AERO process, consistent with efficient partitioning of HNO3 into particle-phase NO3− in cold seasons.
Table 3 illustrates that in cold seasons (winter and autumn) within the PBL about 60 %–78 % of TNO3 is produced through OH + NO2, 21 %–36 % through HET N2O5, and 2 %–5 % through the others pathways in the five representative YRD cities. Meanwhile, 71 %–83 % of TNO3 is produced through OH + NO2, 10 %–23 % through HET N2O5, and 4 %–13 % through the others pathways (mainly contributed by NO3+ Org and N2O5 H2O) in warm seasons (summer and spring). Table 4 shows the comparison of the contribution of major TNO3 production pathway studies in China and other regions using different methods. The results are in agreement with the contribution of NO3− pathways in previous modeling and observational studies. For example, Li et al. (2021b) modeled that OH + NO2 and HET N2O5 pathways dominate NO3− production in the YRD region in the warm and cold seasons of 2016 using a CTM, accounting for 86 %–92 % and 8 %–14 % in the surface layer, respectively. He et al. (2020) reported that the OH + NO2 pathway dominates NO3− production in Shanghai on the surface layer using nitrogen isotope analysis, accounting for 84 %–92 % and 55 %–77 % in the warm and cold seasons of 2016, respectively. Alexander et al. (2020) highlighted that the OH + NO2 and HET N2O5 pathways contribute the same proportion (both 41 % in the four seasons) to NO3− production in the global region using the CTM and oxygen isotopes analysis.
Figure 6a shows the diurnal variations of TNO3 formation reaction rates through three major pathways in Shanghai within the PBL. The average diurnal trends of TNO3 production rates are consistent with the CHEM process rates of HNO3 production (Figs. 5 and 6). The chemical production of HNO3 quickly transforms to particulate NO3− through AERO processes in the presence of abundant NH3. The averaged TNO3 production rates are 0.31±0.14, 0.65±0.37, 1.09±0.68, and 0.28±0.22 ppb h−1 in the winter, spring, summer, and autumn, respectively (Table S6). Moreover, the seasonal peak rates of TNO3 production are 0.6, 1.4, 2.3, and 0.7 ppb h−1 around 11:00–13:00 BJT, respectively. In accordance with the seasonal variation of HNO3 net IPR rates, TNO3 production rates are the fastest in summer.
In Shanghai, TNO3 chemical production is dominated by the OH + NO2 pathway on the daily timescale, accounting for 69.3 %–86.9 % of the total, while the HET N2O5 pathway is likewise a relatively important pathway (accounting for 11.1 %–28.4 %) in the four seasons (Fig. 6b). Notably, TNO3 production rates are dominated by the OH + NO2 pathway during the daytime (7:00–18:00 BJT, accounting for 88.4 %–97.9 % of the total) in all seasons, while the HET N2O5 pathway becomes more important for the TNO3 production during the nighttime (19:00–06:00 BJT, accounting for 42.5 %–61.6 %). During winter, TNO3 formation via the HET N2O5 pathway becomes dominant over the OH + NO2 pathway, accounting for 62 %, 65 %, and 68 % in Shanghai, Hangzhou, and Nanjing at night, respectively. O3 strongly coordinates TNO3 production via the HET N2O5 pathway during the nighttime. Similarly, He et al. (2018) observed that the HET N2O5 pathway was the major contributor to NO3− production in the winter of Beijing at the surface layer using oxygen and nitrogen isotopes analysis, accounting for 56 %–97 % of the total during the nighttime. In another CTM study in the NCP, the HET N2O5 pathway was the dominant contributor to nocturnal NO3− production within the PBL in winter, with a contribution of 83 % at night (Liu et al., 2020a). In Fig. S8, the seasonal TNO3 production rates (ppb h−1) and contributions (%) of the major pathways have been compared between vertical layers and PBL. The OH + NO2 pathway dominated TNO3 production at all layers, accounting for more than 58 %, 78 %, 80 %, and 83 % in winter, spring, summer, and autumn, respectively. The OH + NO2 pathway rate decreases with altitude at vertical layers, where its contribution decreases from 87 % to 58 %, from 91 % to 78 %, from 93 % to 80 %, and from 95 % to 83 % in the four seasons, respectively. The HET N2O5 pathway becomes more important for the TNO3 production within layers 4–8 (250 to 580 m) in winter, accounting for 37 % (Fig. S8b).
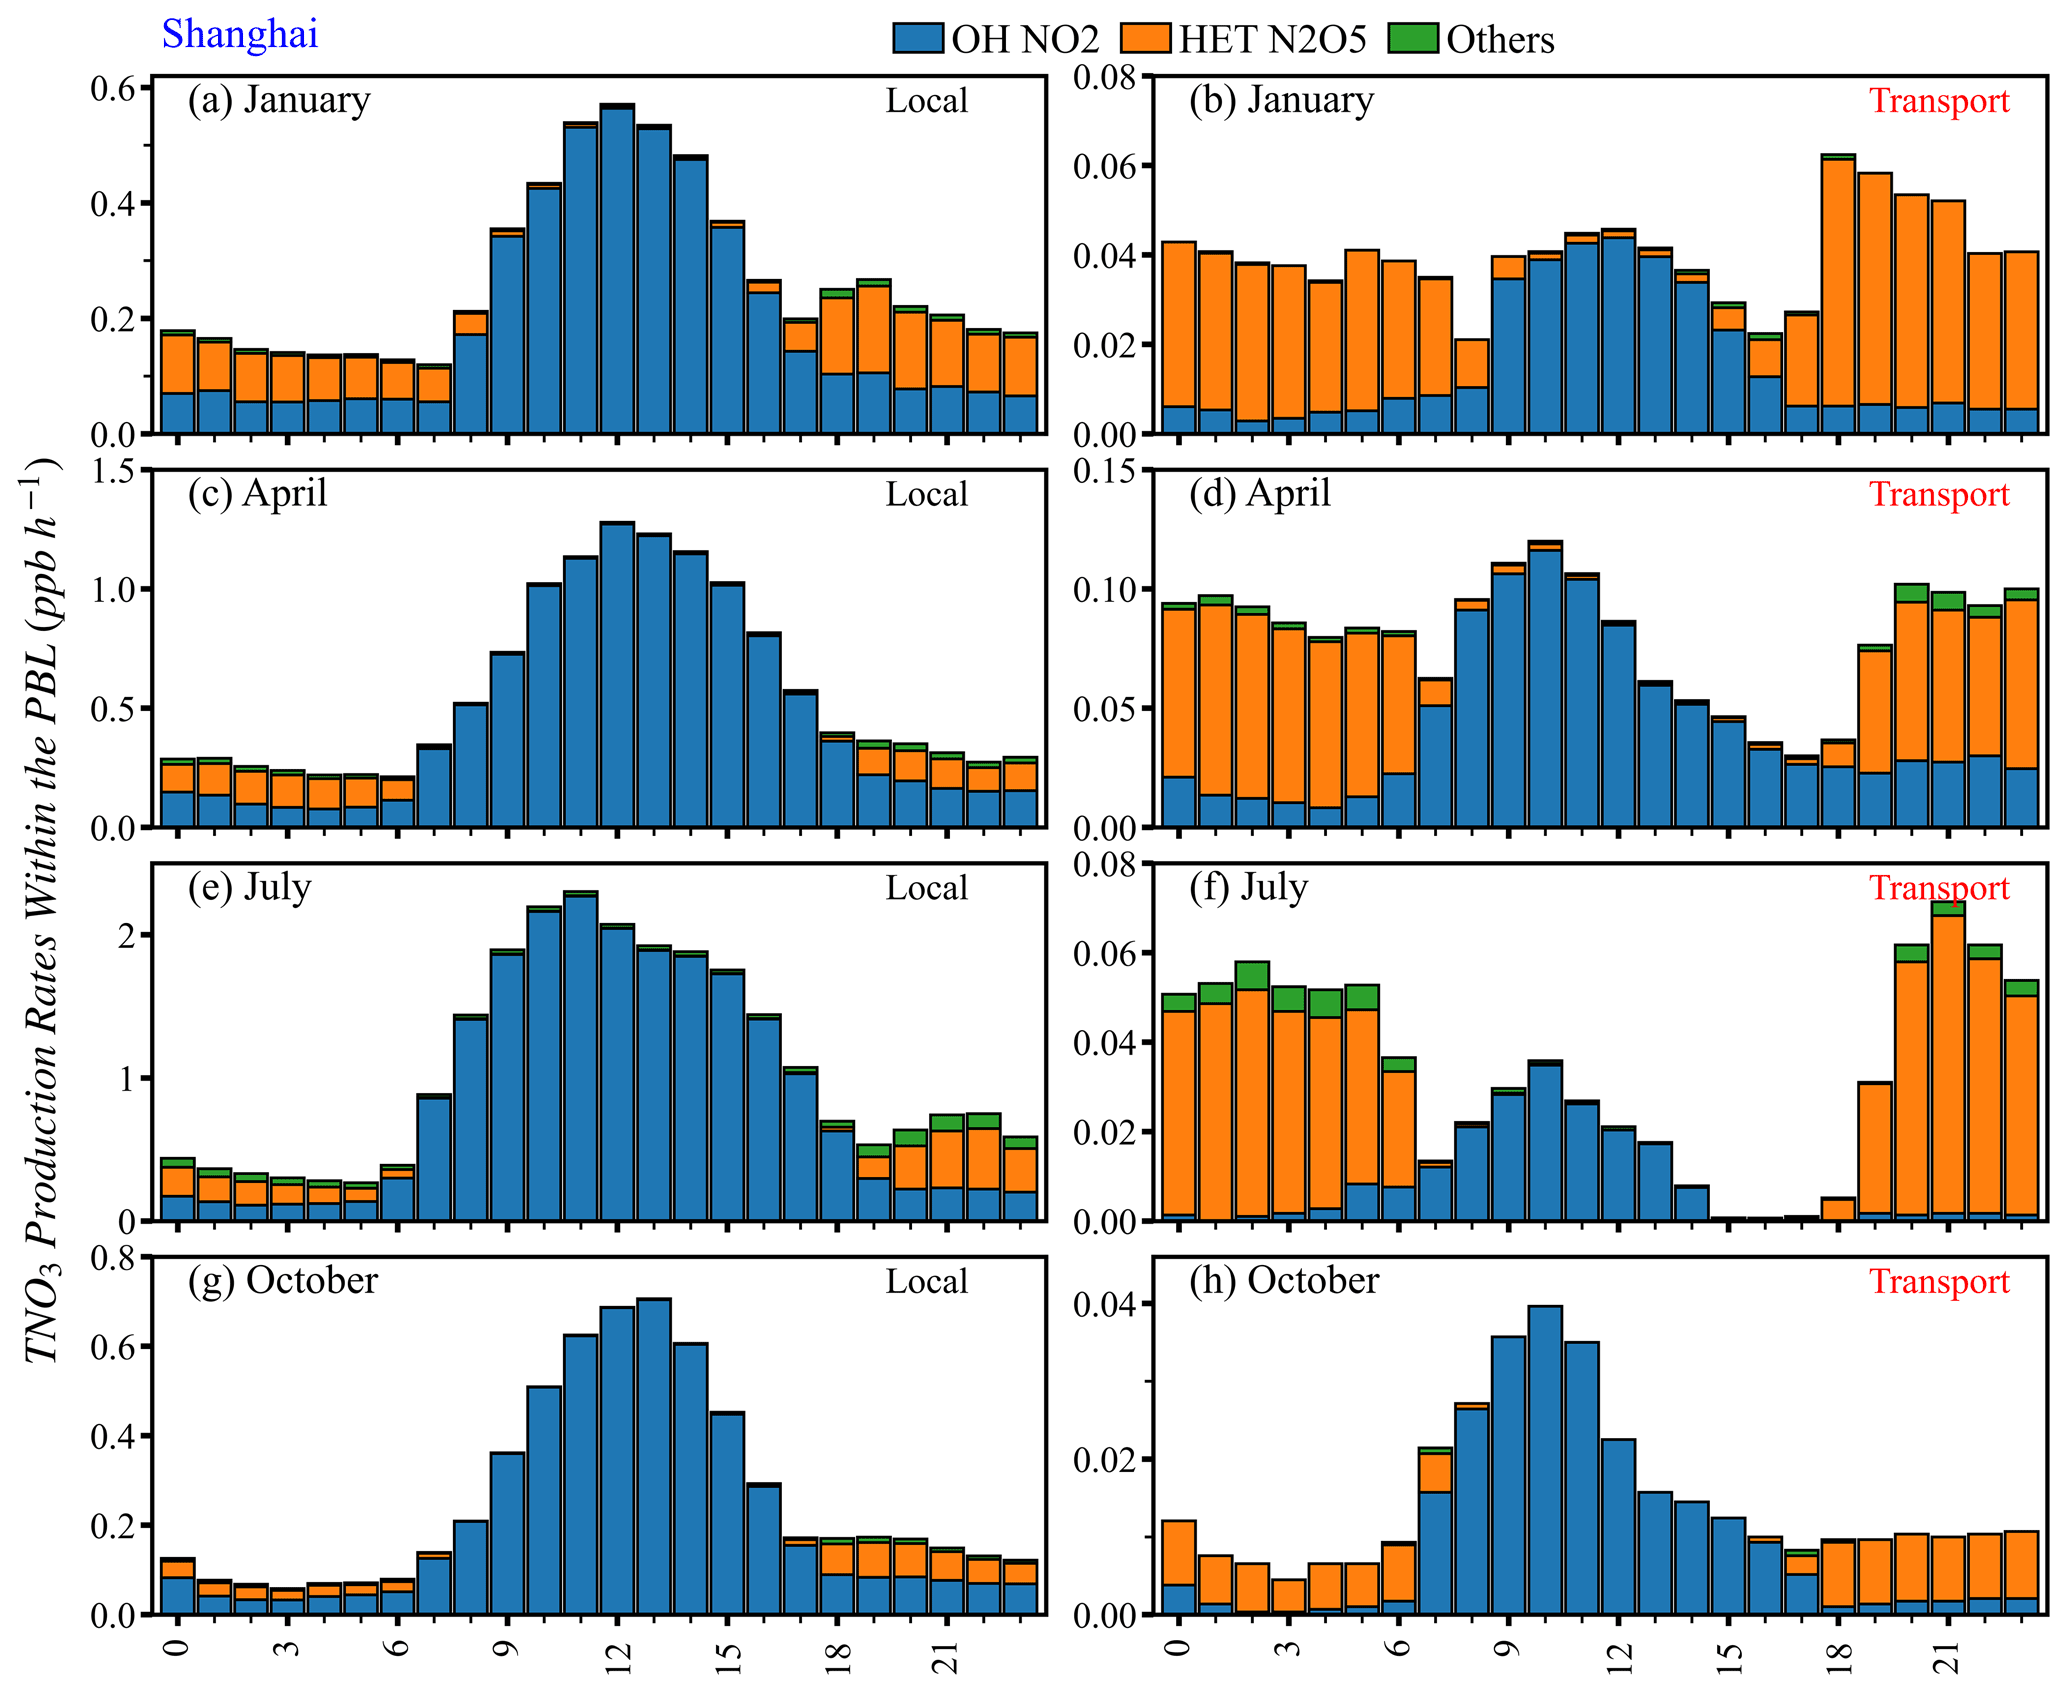
Figure 7Mean diurnal variations of TNO3 production rates in major pathways from the local and transport (sum of indirect and direct transport) contributions.
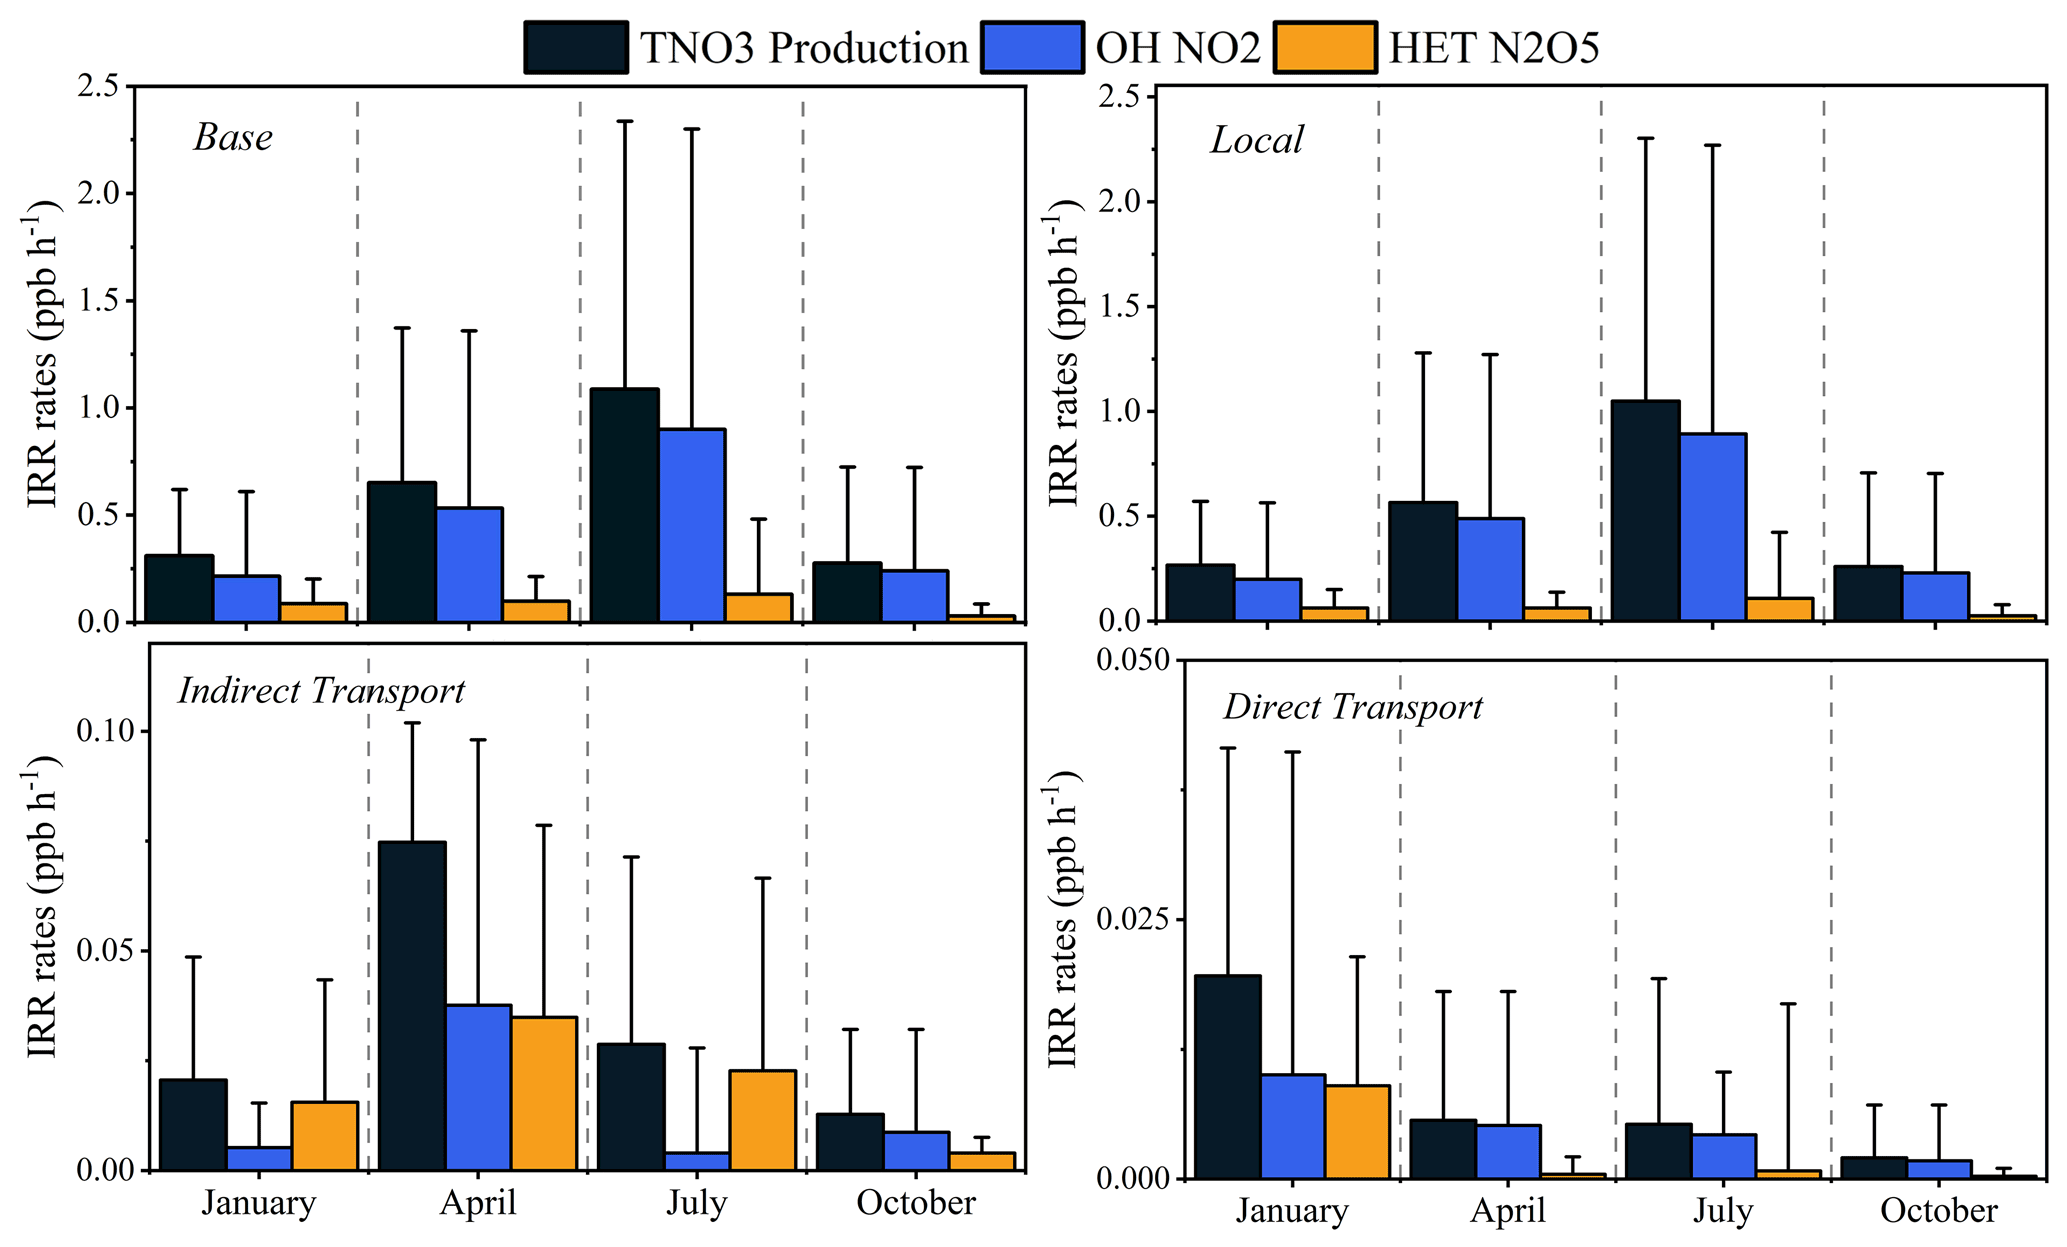
Figure 8The seasonal rates of TNO3− production and the major pathways in the base case and from the local and transport contributions within the PBL. The error bar indicates 1 standard deviation.
Figure 7 displays the contributions of TNO3 formation pathways from the local and transport (sum of indirect and direct transport) contributions. For the local contribution, the averaged TNO3 production rates are 0.27±0.14, 0.56±0.37, 1.05±0.69, and 0.26±0.21 ppb h−1 in the winter, spring, summer, and autumn, respectively (Table S7). During the daytime, the OH + NO2 pathway contributes almost all TNO3 production rates from the local contribution, accounting for about 89 %–98 % of the total, with mean rates of 0.33±0.17, 0.83±0.34, 1.55±0.59, and 0.40±0.22 ppb h−1 in the winter, spring, summer, and autumn, respectively. The results suggest that the locally emitted NO2 reacts with OH-dominated TNO3 production during the day in the YRD region.
For the transport contribution, the averaged TNO3 production rates are 0.04±0.01, 0.08±0.02, 0.03±0.02, and 0.02±0.01 ppb h−1 in the winter, spring, summer, and autumn, respectively (Table S8). The HET N2O5 pathway is noted as the dominant pathway for TNO3 production of the transport contribution, accounting for around 72 %–86 % during the nighttime. Figure 8 compares the seasonal TNO3 production pathways rates between local, indirect, and direct transport contributions within the PBL. The regional production is mainly contributed by indirect transport, especially in the winter and summer. The results suggest that the transported O3 from outside the YRD region reacts with the locally emitted NO2, supporting TNO3 production via the HET N2O5 chemical pathway during the nighttime.
Overall, our findings illustrate that local emissions dominate NO3− formation in the YRD (50 %–62 %) and more specifically locally emitted NOx reacting with OH and partitioning into particles with NH3 (mostly from local sources, more than 93.0 %), indicating that the uncoordinated control of precursors (i.e., NOx and NH3) and reduction of the oxidative capacity of the atmosphere is crucial for NO3− reduction. Furthermore, regional transport contributes 38 %–50 % to NO3− formation in the YRD region. Indirect transport contributes 24 %–37 % through transported O3 reacting with local NOx at night, indicating that the simultaneous controlling of O3 and NO3− in the larger-scale region is also important for NO3− reduction in the YRD.
This paper has investigated the seasonal variations in the NO3− formation mechanisms, including local emission and regional transport contributions, as well as dominant processes and major chemical pathways in the YRD region. However, there are still some limitations in this paper, such as the insufficient heterogeneous chemistry on the dust particles' surface and uncertainties in precursor emissions in the model, and these affect the model performance of NO3− during the spring and autumn (Xie et al., 2022). Furthermore, the integrated reaction rate (IRR) analysis was employed to quantify the rates of TNO3 (sum of NO3− and HNO3) chemical pathways, which potentially lead to differences in chemical pathway rates and contributions between NO3− and TNO3. Figure 6b illustrates that TNO3 chemical production is dominated by the OH + NO2 pathway on the daily timescale, accounting for 69.3 %–86.9 % in Shanghai. Notably, due to the higher temperature during the daytime, the potential production for NO3− is not as high as that of the nocturnal chemical pathway (mainly the HET N2O5 pathway at night), which potentially led to underestimates in the nocturnal pathway contribution to NO3−.
This study investigates the contributions of regional transport and major chemical pathways to NO3− and HNO3 formation in the YRD in different seasons using the WRF-CMAQ model. The modeled results show that local emissions dominate NO3− concentrations in the YRD (50 %–62 %), while regional transport contributes 38 %–50 % to NO3− (indirect transport contributes 24 %–37 %). Except for during winter, HNO3 was dominated by the contributions of local emissions (61 %–75 %), and indirect transport contributed negatively (−24 % to −41 %). In Shanghai, the IPR analysis reveals that AERO processes were the predominant contributors to NO3− formation within the PBL. TRAN processes were the largest sinks in NO3− formation in the winter, spring and autumn, while the positive contributors were at night in summer. For HNO3, CHEM processes were the only positive contributor during the day. The OH + NO2 pathway is the predominant contributor (60 %–83 %) among all chemical pathways, while the HET N2O5 pathway is also important (10 %–36 %) in the YRD region. The TNO3 production is dominated by the OH + NO2 pathway during the day (98 %) in summer, while the HET N2O5 pathway dominates during the night (61 %) in winter. The TNO3 production rates from the local and transport contributions were further elucidated. The OH + NO2 pathway from the local contribution strongly dominates the TNO3 production during the day (89 %–98 %). At night, the HET N2O5 pathway is mainly dominated by indirect transport (via reaction with transported O3 at night).
Hourly concentrations of O3, PM2.5, NO2, SO2, and CO used in this study are freely available through the website of http://www.cnemc.cn/ (last access: 27 September 2022). Observation data of meteorological parameters used in this study are available from https://q-weather.info/weather/58367/history/ (last access: 30 November 2021). The CMAQ outputs are currently available upon request. All python code used to create any of the figures is available upon request.
The supplement related to this article is available online at: https://doi.org/10.5194/acp-22-12629-2022-supplement.
JS, MQ, and JH designed the research. JS, MQ, XX, WF, YQ, LS, and LL contributed to model development, simulations, and data processing. JL, IDS, LJ, LH, and XY contributed to discussion of the results. JS prepared the manuscript, and all co-authors helped improve the manuscript.
The contact author has declared that none of the authors has any competing interests.
Publisher's note: Copernicus Publications remains neutral with regard to jurisdictional claims in published maps and institutional affiliations.
Jinjin Sun would like to gratefully acknowledge support received from the Postgraduate Research & Practice Innovation Program of Jiangsu Province (grant no. KYCX21_0954).
This research has been supported by the National Natural Science Foundation of China (grant nos. 42021004, 92044302, and 42007187).
This paper was edited by Dantong Liu and reviewed by three anonymous referees.
Alexander, B., Sherwen, T., Holmes, C. D., Fisher, J. A., Chen, Q., Evans, M. J., and Kasibhatla, P.: Global inorganic nitrate production mechanisms: comparison of a global model with nitrate isotope observations, Atmos. Chem. Phys., 20, 3859–3877, https://doi.org/10.5194/acp-20-3859-2020, 2020.
An, J., Huang, Y., Huang, C., Wang, X., Yan, R., Wang, Q., Wang, H., Jing, S., Zhang, Y., Liu, Y., Chen, Y., Xu, C., Qiao, L., Zhou, M., Zhu, S., Hu, Q., Lu, J., and Chen, C.: Emission inventory of air pollutants and chemical speciation for specific anthropogenic sources based on local measurements in the Yangtze River Delta region, China, Atmos. Chem. Phys., 21, 2003–2025, https://doi.org/10.5194/acp-21-2003-2021, 2021.
Byun, D. and Schere, K. L.: Review of the Governing Equations, Computational Algorithms, and Other Components of the Models-3 Community Multiscale Air Quality (CMAQ) Modeling System, Appl. Mech. Rev., 59, 51–77, https://doi.org/10.1115/1.2128636, 2006.
Chan, Y.-C., Evans, M. J., He, P., Holmes, C. D., Jaeglé, L., Kasibhatla, P., Liu, X.-Y., Sherwen, T., Thornton, J. A., Wang, X., Xie, Z., Zhai, S., and Alexander, B.: Heterogeneous Nitrate Production Mechanisms in Intense Haze Events in the North China Plain, J. Geophys. Res.-Atmos., 126, e2021JD034688, https://doi.org/10.1029/2021JD034688, 2021.
Chen, T.-F., Chang, K.-H., and Lee, C.-H.: Simulation and analysis of causes of a haze episode by combining CMAQ-IPR and brute force source sensitivity method, Atmos. Environ., 218, 117006, https://doi.org/10.1016/j.atmosenv.2019.117006, 2019.
Chen, X., Jiang, Z., Shen, Y., Li, R., Fu, Y., Liu, J., Han, H., Liao, H., Cheng, X., Jones, D. B. A., Worden, H., and Abad, G. G.: Chinese Regulations Are Working – Why Is Surface Ozone Over Industrialized Areas Still High? Applying Lessons From Northeast US Air Quality Evolution, Geophys. Res. Lett., 48, e2021GL092816, https://doi.org/10.1029/2021GL092816, 2021.
Chen, X. R., Wang, H. C., Lu, K. D., Li, C., Zhai, T., Tan, Z., Ma, X., Yang, X., Liu, Y., Chen, S., Dong, H., Li, X., Wu, Z., Hu, M., Zeng, L., and Zhang, Y.: Field Determination of Nitrate Formation Pathway in Winter Beijing, Environ. Sci. Technol., 54, 9243–9253, https://doi.org/10.1021/acs.est.0c00972, 2020.
Chuang, M.-T., Wu, C.-F., Lin, C.-Y., Lin, W.-C., Chou, C. C. K., Lee, C.-T., Lin, T.-H., Fu, J. S., and Kong, S. S.-K.: Simulating nitrate formation mechanisms during PM2.5 events in Taiwan and their implications for the controlling direction, Atmos. Environ., 269, 118856, https://doi.org/10.1016/j.atmosenv.2021.118856, 2022.
Dai, H. B., Zhu, J., Liao, H., Li, J., Liang, M., Yang, Y., and Yue, X.: Co-occurrence of ozone and PM2.5 pollution in the Yangtze River Delta over 2013–2019: Spatiotemporal distribution and meteorological conditions, Atmos. Res., 249, 105363, https://doi.org/10.1016/j.atmosres.2020.105363, 2021.
Ding, A. J., Huang, X., Nie, W., Chi, X., Xu, Z., Zheng, L., Xu, Z., Xie, Y., Qi, X., Shen, Y., Sun, P., Wang, J., Wang, L., Sun, J., Yang, X. Q., Qin, W., Zhang, X., Cheng, W., Liu, W., Pan, L., and Fu, C.: Significant reduction of PM2.5 in eastern China due to regional-scale emission control: evidence from SORPES in 2011–2018, Atmos. Chem. Phys., 19, 11791–11801, https://doi.org/10.5194/acp-19-11791-2019, 2019.
Du, H., Li, J., Wang, Z., Dao, X., Guo, S., Wang, L., Ma, S., Wu, J., Yang, W., Chen, X., and Sun, Y.: Effects of Regional Transport on Haze in the North China Plain: Transport of Precursors or Secondary Inorganic Aerosols, Geophys. Res. Lett., 47, e2020GL087461, https://doi.org/10.1029/2020gl087461, 2020.
Emery, C. and Tai, E.: Enhanced Meteorological Modeling and Performance Evaluation for Two Texas Ozone Episodes, Final Report Submitted to Texas Natural Resources Conservation Commission, ENVIRON, International Corporation, Novato, USA, Corpus ID: 127579774, https://wayback.archive-it.org/414/20210529063824/https://www.tceq.texas.gov/assets/public/implementation/air/am/contracts/reports/mm/EnhancedMetModelingAndPerformanceEvaluation.pdf, last access: 30 April 2021.
Emery, C., Liu, Z., Russell, A. G., Odman, M. T., Yarwood, G., and Kumar, N.: Recommendations on statistics and benchmarks to assess photochemical model performance, J. Air Waste Manage. Assoc., 67, 582–598, https://doi.org/10.1080/10962247.2016.1265027, 2017.
Fan, M.-Y., Zhang, Y.-L., Lin, Y.-C., Cao, F., Zhao, Z.-Y., Sun, Y., Qiu, Y., Fu, P., and Wang, Y.: Changes of Emission Sources to Nitrate Aerosols in Beijing After the Clean Air Actions: Evidence From Dual Isotope Compositions, J. Geophys. Res.-Atmos., 125, e2019JD031998, https://doi.org/10.1029/2019JD031998, 2020.
Fan, M.-Y., Zhang, Y.-L., Lin, Y.-C., Hong, Y., Zhao, Z.-Y., Xie, F., Du, W., Cao, F., Sun, Y., and Fu, P.: Important Role of NO3 Radical to Nitrate Formation Aloft in Urban Beijing: Insights from Triple Oxygen Isotopes Measured at the Tower, Environ. Sci. Technol., 56, 6870–6879, https://doi.org/10.1021/acs.est.1c02843, 2021.
Fu, X., Wang, T., Gao, J., Wang, P., Liu, Y., Wang, S., Zhao, B., and Xue, L.: Persistent Heavy Winter Nitrate Pollution Driven by Increased Photochemical Oxidants in Northern China, Environ. Sci. Technol., 54, 3881–3889, https://doi.org/10.1021/acs.est.9b07248, 2020.
Griffith, S. M., Huang, X. H. H., Louie, P. K. K., and Yu, J. Z.: Characterizing the thermodynamic and chemical composition factors controlling PM2.5 nitrate: Insights gained from two years of online measurements in Hong Kong, Atmos. Environ., 122, 864–875, https://doi.org/10.1016/j.atmosenv.2015.02.009, 2015.
Guenther, A. B., Jiang, X., Heald, C. L., Sakulyanontvittaya, T., Duhl, T., Emmons, L. K., and Wang, X.: The Model of Emissions of Gases and Aerosols from Nature version 2.1 (MEGAN2.1): an extended and updated framework for modeling biogenic emissions, Geosci. Model Dev., 5, 1471–1492, https://doi.org/10.5194/gmd-5-1471-2012, 2012.
Guo, H., Otjes, R., Schlag, P., Kiendler-Scharr, A., Nenes, A., and Weber, R. J.: Effectiveness of ammonia reduction on control of fine particle nitrate, Atmos. Chem. Phys., 18, 12241–12256, https://doi.org/10.5194/acp-18-12241-2018, 2018.
He, P., Xie, Z., Chi, X., Yu, X., Fan, S., Kang, H., Liu, C., and Zhan, H.: Atmospheric Δ17O(NO3−) reveals nocturnal chemistry dominates nitrate production in Beijing haze, Atmos. Chem. Phys., 18, 14465–14476, https://doi.org/10.5194/acp-18-14465-2018, 2018.
He, P., Xie, Z., Yu, X., Wang, L., Kang, H., and Yue, F.: The observation of isotopic compositions of atmospheric nitrate in Shanghai China and its implication for reactive nitrogen chemistry, Sci. Total Environ., 714, 136727, https://doi.org/10.1016/j.scitotenv.2020.136727, 2020.
Hu, J., Chen, J., Ying, Q., and Zhang, H.: One-year simulation of ozone and particulate matter in China using WRF/CMAQ modeling system, Atmos. Chem. Phys., 16, 10333–10350, https://doi.org/10.5194/acp-16-10333-2016, 2016.
Hu, S., Zhao, G., Tan, T., Li, C., Zong, T., Xu, N., Zhu, W., and Hu, M.: Current challenges of improving visibility due to increasing nitrate fraction in PM2.5 during the haze days in Beijing, China, Environ. Pollut., 290, 118032, https://doi.org/10.1016/j.envpol.2021.118032, 2021.
Huang, L., Zhu, Y., Zhai, H., Xue, S., Zhu, T., Shao, Y., Liu, Z., Emery, C., Yarwood, G., Wang, Y., Fu, J., Zhang, K., and Li, L.: Recommendations on benchmarks for numerical air quality model applications in China – Part 1: PM2.5 and chemical species, Atmos. Chem. Phys., 21, 2725–2743, https://doi.org/10.5194/acp-21-2725-2021, 2021.
Huang, R. J., Zhang, Y. L., Bozzetti, C., Ho, K.-F., Cao, J.-J., Han, Y., Daellenbach, K. R., Slowik, J. G., Platt, S. M., Canonaco, F., Zotter, P., Wolf, R., Pieber, S. M., Bruns, E. A., Crippa, M., Ciarelli, G., Piazzalunga, A., Schwikowski, M., Abbaszade, G., Schnelle-Kreis, J., Zimmermann, R., An, Z., Szidat, S., Baltensperger, U., Haddad, I. E., and Prévôt, A. S. H.: High secondary aerosol contribution to particulate pollution during haze events in China, Nature, 514, 218–222, https://doi.org/10.1038/nature13774, 2014.
Huang, X., Ding, A., Wang, Z., Ding, K., Gao, J., Chai, F., and Fu, C.: Amplified transboundary transport of haze by aerosol–boundary layer interaction in China, Nat. Geosci., 13, 428–434, https://doi.org/10.1038/s41561-020-0583-4, 2020a.
Huang, X., Ding, A. J., Gao, J., Zheng, B., Zhou, D., Qi, X., Tang, R., Wang, J., Ren, C., Nie, W., Chi, X., Xu, Z., Chen, L., Li, Y., Che, F., Pang, N., Wang, H., Tong, D., Qin, W., Cheng, W., Liu, W., Fu, Q., Liu, B., Chai, F., Davis, S. J., Zhang, Q., and He, K.: Enhanced secondary pollution offset reduction of primary emissions during COVID-19 lockdown in China, Nat. Sci. Rev., 8, nwaa137, https://doi.org/10.1093/nsr/nwaa137, 2020b.
Huang, X., Huang, J. T., Ren, C. H., Wang, J., Wang, H., Wang, J., Yu, H., Chen, J., Gao, J., and Ding, A.: Chemical Boundary Layer and Its Impact on Air Pollution in Northern China, Environ. Sci. Technol. Lett., 7, 826–832, https://doi.org/10.1021/acs.estlett.0c00755, 2020c.
Itahashi, S., Uno, I., Osada, K., Kamiguchi, Y., Yamamoto, S., Tamura, K., Wang, Z., Kurosaki, Y., and Kanaya, Y.: Nitrate transboundary heavy pollution over East Asia in winter, Atmos. Chem. Phys., 17, 3823–3843, https://doi.org/10.5194/acp-17-3823-2017, 2017.
Khezri, B., Mo, H., Yan, Z., Chong, S.-L., Heng, A. K., and Webster, R. D.: Simultaneous online monitoring of inorganic compounds in aerosols and gases in an industrialized area, Atmos. Environ., 80, 352–360, https://doi.org/10.1016/j.atmosenv.2013.08.008, 2013.
Kim, Y. J., Spak, S. N., Carmichael, G. R., Riemer, N., and Stanier, C. O.: Modeled aerosol nitrate formation pathways during wintertime in the Great Lakes region of North America, J. Geophys. Res.-Atmos., 119, 12420–412445, https://doi.org/10.1002/2014JD022320, 2014.
Li, C., Hammer, M. S., Zheng, B., and Cohen, R. C.: Accelerated reduction of air pollutants in China, 2017–2020, Sci. Total Environ., 803, 150011, https://doi.org/10.1016/j.scitotenv.2021.150011, 2022.
Li, L., Xie, F., Li, J., Gong, K., Xie, X., Qin, Y., Qin, M., and Hu, J.: Diagnostic analysis of regional ozone pollution in Yangtze River Delta, China: A case study in summer 2020, Sci. Total Environ., 812, 151511, https://doi.org/10.1016/j.scitotenv.2021.151511, 2021a.
Li, M., Zhang, Z., Yao, Q., Wang, T., Xie, M., Li, S., Zhuang, B., and Han, Y.: Nonlinear responses of particulate nitrate to NOx emission controls in the megalopolises of China, Atmos. Chem. Phys., 21, 15135–15152, https://doi.org/10.5194/acp-21-15135-2021, 2021b.
Lin, Y. C., Zhang, Y. L., Fan, M. Y., and Bao, M.: Heterogeneous formation of particulate nitrate under ammonium-rich regimes during the high-PM2.5 events in Nanjing, China, Atmos. Chem. Phys., 20, 3999–4011, https://doi.org/10.5194/acp-20-3999-2020, 2020.
Liu, L., Liu, L., Liu, S., Li, X., Zhou, J., Feng, T., Cao, J., Qian, Y., Cao, J., and Li, G.: Effects of organic coating on the nitrate formation by suppressing the N2O5 heterogeneous hydrolysis: a case study during wintertime in Beijing–Tianjin–Hebei (BTH), Atmos. Chem. Phys., 19, 8189–8207, https://doi.org/10.5194/acp-19-8189-2019, 2019.
Liu, L., Bei, N., Hu, B., Wu, J., Liu, S., Li, X., Wang, R., Liu, Z., Shen, Z., and Li, G.: Wintertime nitrate formation pathways in the north China plain: Importance of N2O5 heterogeneous hydrolysis, Environ. Pollut., 266, 115287, https://doi.org/10.1016/j.envpol.2020.115287, 2020a.
Liu, P., Zhang, Y., Yu, S., and Schere, K. L.: Use of a process analysis tool for diagnostic study on fine particulate matter predictions in the U.S. – Part II: Analyses and sensitivity simulations, Atmos. Pollut. Res., 2, 61–71, https://doi.org/10.5094/APR.2011.008, 2011.
Liu, T., Wang, X. Y., Hu, J. L., Wang, Q., An, J., Gong, K., Sun, J., Li, L., Qin, M., Li, J., Tian, J., Huang, Y., Liao, H., Zhou, M., Hu, Q., Yan, R., Wang, H., and Huang, C.: Driving Forces of Changes in Air Quality during the COVID-19 Lockdown Period in the Yangtze River Delta Region, China, Environ. Sci. Technol. Lett., 7, 779–786, https://doi.org/10.1021/acs.estlett.0c00511, 2020b.
Lu, M., Tang, X., Feng, Y., Wang, Z., Chen, X., Kong, L., Ji, D., Liu, Z., Liu, K., Wu, H., Liang, S., Zhou, H., and Hu, K.: Nonlinear response of SIA to emission changes and chemical processes over eastern and central China during a heavy haze month, Sci. Total Environ., 788, 147747, https://doi.org/10.1016/j.scitotenv.2021.147747, 2021a.
Lu, X., Ye, X., Zhou, M., Zhao, Y., Weng, H., Kong, H., Li, K., Gao, M., Zheng, B., Lin, J., Zhou, F., Zhang, Q., Wu, D., Zhang, L., and Zhang, Y.: The underappreciated role of agricultural soil nitrogen oxide emissions in ozone pollution regulation in North China, Nat. Commun., 12, 5021, https://doi.org/10.1038/s41467-021-25147-9, 2021b.
Luo, L., Kao, S., Wu, Y., Zhang, X., Lin, H., Zhang, R., and Xiao, H.: Stable oxygen isotope constraints on nitrate formation in Beijing in springtime, Environ. Pollut., 263, 114515, https://doi.org/10.1016/j.envpol.2020.114515, 2020a.
Luo, L., Pan, Y.-Y., Zhu, R.-G., Zhang, Z.-Y., Zheng, N.-J., Liu, Y.-H., Liu, C., Xiao, H.-W., and Xiao, H.-Y.: Assessment of the seasonal cycle of nitrate in PM2.5 using chemical compositions and stable nitrogen and oxygen isotopes at Nanchang, China, Atmos. Environ., 225, 117371, https://doi.org/10.1016/j.atmosenv.2020.117371, 2020b.
Ma, J., Shen, J., Wang, P., Zhu, S., Wang, Y., Wang, P., Wang, G., Chen, J., and Zhang, H.: Modeled changes in source contributions of particulate matter during the COVID-19 pandemic in the Yangtze River Delta, China, Atmos. Chem. Phys., 21, 7343–7355, https://doi.org/10.5194/acp-21-7343-2021, 2021.
Prabhakar, G., Parworth, C. L., Zhang, X., Kim, H., Young, D. E., Beyersdorf, A. J., Ziemba, L. D., Nowak, J. B., Bertram, T. H., Faloona, I. C., Zhang, Q., and Cappa, C. D.: Observational assessment of the role of nocturnal residual-layer chemistry in determining daytime surface particulate nitrate concentrations, Atmos. Chem. Phys., 17, 14747–14770, https://doi.org/10.5194/acp-17-14747-2017, 2017.
Qiao, X., Tang, Y., Hu, J., Zhang, S., Li, J., Kota, S. H., Wu, L., Gao, H., Zhang, H., and Ying, Q.: Modeling dry and wet deposition of sulfate, nitrate, and ammonium ions in Jiuzhaigou National Nature Reserve, China using a source-oriented CMAQ model: Part I. Base case model results, Sci. Total Environ., 532, 831–839, https://doi.org/10.1016/j.scitotenv.2015.05.108, 2015.
Qin, Y., Li, J. Y., Gong, K. J., Wu, Z., Chen, M., Qin, M., Huang, L., and Hu, J.: Double high pollution events in the Yangtze River Delta from 2015 to 2019: Characteristics, trends, and meteorological situations, Sci. Total Environ., 792, 148349, https://doi.org/10.1016/j.scitotenv.2021.148349, 2021.
Qu, K., Wang, X. S., Xiao, T., Shen, J., Lin, T., Chen, D., He, L.-Y., Huang, X.-F., Zeng, L., Lu, K., Ou, Y., and Zhang, Y.: Cross-regional transport of PM2.5 nitrate in the Pearl River Delta, China: Contributions and mechanisms, Sci. Total Environ., 753, 142439, https://doi.org/10.1016/j.scitotenv.2020.142439, 2021.
Shah, V., Jaeglé, L., Thornton, J. A., Lopez-Hilfiker, F. D., Lee, B. H., Schroder, J. C., Campuzano-Jost, P., Jimenez, J. L., Guo, H., Sullivan, A. P., Weber, R. J., Green, J. R., Fiddler, M. N., Bililign, S., Campos, T. L., Stell, M., Weinheimer, A. J., Montzka, D. D., and Brown, S. S.: Chemical feedbacks weaken the wintertime response of particulate sulfate and nitrate to emissions reductions over the eastern United States, P. Natl. Acad. Sci. USA, 115, 8110–8115, https://doi.org/10.1073/pnas.1803295115, 2018.
Shen, J., Zhao, Q., Cheng, Z., Wang, P., Ying, Q., Liu, J., Duan, Y., and Fu, Q.: Insights into source origins and formation mechanisms of nitrate during winter haze episodes in the Yangtze River Delta, Sci. Total Environ., 741, 140187, https://doi.org/10.1016/j.scitotenv.2020.140187, 2020.
Sheng, L., Qin, M., Li, L., Wang, C., Gong, K., Liu, T., Li, J., and Hu, J.: Impacts of emissions along the lower Yangtze River on air quality and public health in the Yangtze River delta, China, Atmos. Pollut. Res., 13, 101420, https://doi.org/10.1016/j.apr.2022.101420, 2022.
Shi, Z., Li, J., Huang, L., Wang, P., Wu, L., Ying, Q., Zhang, H., Lu, L., Liu, X., Liao, H., and Hu, J.: Source apportionment of fine particulate matter in China in 2013 using a source-oriented chemical transport model, Sci. Total Environ., 601–602, 1476–1487, https://doi.org/10.1016/j.scitotenv.2017.06.019, 2017.
Sulaymon, I. D., Zhang, Y., Hu, J., Hopke, P. K., Zhang, Y., Zhao, B., Xing, J., Li, L., and Mei, X.: Evaluation of regional transport of PM2.5 during severe atmospheric pollution episodes in the western Yangtze River Delta, China, J. Environ. Manage., 293, 112827, https://doi.org/10.1016/j.jenvman.2021.112827, 2021.
Sun, J. J., Liang, M. J., Shi, Z. H., Shen, F., Li, J., Huang, L., Ge, X., Chen, Q., Sun, Y., Zhang, Y., Chang, Y., Ji, D., Ying, Q., Zhang, H., Kota, S. H., and Hu, J.: Investigating the PM2.5 mass concentration growth processes during 2013–2016 in Beijing and Shanghai, Chemosphere, 221, 452–463, https://doi.org/10.1016/j.chemosphere.2018.12.200, 2019.
Sun, P., Nie, W., Chi, X., Xie, Y., Huang, X., Xu, Z., Qi, X., Xu, Z., Wang, L., Wang, T., Zhang, Q., and Ding, A.: Two years of online measurement of fine particulate nitrate in the western Yangtze River Delta: influences of thermodynamics and N2O5 hydrolysis, Atmos. Chem. Phys., 18, 17177–17190, https://doi.org/10.5194/acp-18-17177-2018, 2018.
Tan, Z. F., Wang, H. C., Lu, K. D., Dong, H. B., Liu, Y. H., Zeng, L. M., Hu, M., and Zhang, Y. H.: An Observational Based Modeling of the Surface Layer Particulate Nitrate in the North China Plain During Summertime, J. Geophys. Res.-Atmos., 126, e2021JD035623, https://doi.org/10.1029/2021JD035623, 2021.
Vrekoussis, M., Kanakidou, M., Mihalopoulos, N., Crutzen, P. J., Lelieveld, J., Perner, D., Berresheim, H., and Baboukas, E.: Role of the NO3 radicals in oxidation processes in the eastern Mediterranean troposphere during the MINOS campaign, Atmos. Chem. Phys., 4, 169–182, https://doi.org/10.5194/acp-4-169-2004, 2004.
Wang, H., Lu, K., Chen, X., Zhu, Q., Wu, Z., Wu, Y., and Sun, K.: Fast particulate nitrate formation via N2O5 uptake aloft in winter in Beijing, Atmos. Chem. Phys., 18, 10483–10495, https://doi.org/10.5194/acp-18-10483-2018, 2018.
Wang, J., Gao, J., Che, F., Wang, Y., Lin, P., and Zhang, Y.: Decade-long trends in chemical component properties of PM2.5 in Beijing, China (2011–2020), Sci. Total Environ., 832, 154664, https://doi.org/10.1016/j.scitotenv.2022.154664, 2022.
Wang, X., Li, L., Gong, K., Mao, J., Hu, J., Li, J., Liu, Z., Liao, H., Qiu, W., Yu, Y., Dong, H., Guo, S., Hu, M., Zeng, L., and Zhang, Y.: Modelling air quality during the EXPLORE-YRD campaign – Part I. Model performance evaluation and impacts of meteorological inputs and grid resolutions, Atmos. Environ., 246, 118131, https://doi.org/10.1016/j.atmosenv.2020.118131, 2021.
Wang, Y.-L., Song, W., Yang, W., Sun, X.-C., Tong, Y.-D., Wang, X.-M., Liu, C.-Q., Bai, Z.-P., and Liu, X.-Y.: Influences of Atmospheric Pollution on the Contributions of Major Oxidation Pathways to PM2.5 Nitrate Formation in Beijing, J. Geophys. Res.-Atmos., 124, 4174–4185, https://doi.org/10.1029/2019JD030284, 2019.
Wen, L., Xue, L., Wang, X., Xu, C., Chen, T., Yang, L., Wang, T., Zhang, Q., and Wang, W.: Summertime fine particulate nitrate pollution in the North China Plain: increasing trends, formation mechanisms and implications for control policy, Atmos. Chem. Phys., 18, 11261–11275, https://doi.org/10.5194/acp-18-11261-2018, 2018.
Wiedinmyer, C., Akagi, S. K., Yokelson, R. J., Emmons, L. K., Al-Saadi, J. A., Orlando, J. J., and Soja, A. J.: The Fire INventory from NCAR (FINN): a high resolution global model to estimate the emissions from open burning, Geosci. Model Dev., 4, 625–641, https://doi.org/10.5194/gmd-4-625-2011, 2011.
Womack, C. C., McDuffie, E. E., Edwards, P. M., Bares, R., de Gouw, J. A., Docherty, K. S., Dubé, W. P., Fibiger, D. L., Franchin, A., Gilman, J. B., Goldberger, L., Lee, B. H., Lin, J. C., Long, R., Middlebrook, A. M., Millet, D. B., Moravek, A., Murphy, J. G., Quinn, P. K., Riedel, T. P., Roberts, J. M., Thornton, J. A., Valin, L. C., Veres, P. R., Whitehill, A. R., Wild, R. J., Warneke, C., Yuan, B., Baasandorj, M., and Brown, S. S.: An Odd Oxygen Framework for Wintertime Ammonium Nitrate Aerosol Pollution in Urban Areas: NOx and VOC Control as Mitigation Strategies, Geophys. Res. Lett., 46, 4971–4979, https://doi.org/10.1029/2019GL082028, 2019.
Wu, C., Liu, L., Wang, G., Zhang, S., Li, G., Lv, S., Li, J., Wang, F., Meng, J., and Zeng, Y.: Important contribution of N2O5 hydrolysis to the daytime nitrate in Xi'an, China during haze periods: Isotopic analysis and WRF-Chem model simulation, Environ. Pollut., 288, 117712, https://doi.org/10.1016/j.envpol.2021.117712, 2021.
Wu, J.-B., Wang, Z., Wang, Q., Li, J., Xu, J., Chen, H., Ge, B., Zhou, G., and Chang, L.: Development of an on-line source-tagged model for sulfate, nitrate and ammonium: A modeling study for highly polluted periods in Shanghai, China, Environ. Pollut., 221, 168–179, https://doi.org/10.1016/j.envpol.2016.11.061, 2017.
Wyat Appel, K., Napelenok, S., Hogrefe, C., Pouliot, G., Foley, K. M., Roselle, S. J., Pleim, J. E., Bash, J., Pye, H. O. T., Heath, N., Murphy, B., and Mathur, R.: Overview and Evaluation of the Community Multiscale Air Quality (CMAQ) Modeling System Version 5.2, in: Air Pollution Modeling and its Application XXV, Cham, 69–73, https://doi.org/10.1007/978-3-319-57645-9_11, 2018.
Xie, X., Hu, J., Qin, M., Guo, S., Hu, M., Wang, H., Lou, S., Li, J., Sun, J., Li, X., Sheng, L., Zhu, J., Chen, G., Yin, J., Fu, W., Huang, C., and Zhang, Y.: Modeling particulate nitrate in China: current findings and future directions, Environ. Int., 166, 107369, https://doi.org/10.1016/j.envint.2022.107369, 2022.
Xie, Y., Wang, G., Wang, X., Chen, J., Chen, Y., Tang, G., Wang, L., Ge, S., Xue, G., Wang, Y., and Gao, J.: Nitrate-dominated PM2.5 and elevation of particle pH observed in urban Beijing during the winter of 2017, Atmos. Chem. Phys., 20, 5019–5033, https://doi.org/10.5194/acp-20-5019-2020, 2020.
Yang, X., Wu, K., Wang, H., Liu, Y., Gu, S., Lu, Y., Zhang, X., Hu, Y., Ou, Y., Wang, S., and Wang, Z.: Summertime ozone pollution in Sichuan Basin, China: Meteorological conditions, sources and process analysis, Atmos. Environ., 226, 117392, https://doi.org/10.1016/j.atmosenv.2020.117392, 2020.
Ying, Q., Wu, L., and Zhang, H.: Local and inter-regional contributions to PM2.5 nitrate and sulfate in China, Atmos. Environ., 94, 582–592, https://doi.org/10.1016/j.atmosenv.2014.05.078, 2014.
Zang, H., Zhao, Y., Huo, J., Zhao, Q., Fu, Q., Duan, Y., Shao, J., Huang, C., An, J., Xue, L., Li, Z., Li, C., and Xiao, H.: High atmospheric oxidation capacity drives wintertime nitrate pollution in the eastern Yangtze River Delta of China, Atmos. Chem. Phys., 22, 4355–4374, https://doi.org/10.5194/acp-22-4355-2022, 2022.
Zhai, S. X., Jacob, D. J., Wang, X., Liu, Z., Wen, T., Shah, V., Li, K., Moch, J. M., Bates, K. H., Song, S., Shen, L., Zhang, Y., Luo, G., Yu, F., Sun, Y., Wang, L., Qi, M., Tao, J., Gui, K., Xu, H., Zhang, Q., Zhao, T., Wang, Y., Lee, H. C., Choi, H., and Liao, H.: Control of particulate nitrate air pollution in China, Nat. Geosci., 14, 389–395, https://doi.org/10.1038/s41561-021-00726-z, 2021.
Zhang, Y.-L., Zhang, W., Fan, M.-Y., Li, J., Fang, H., Cao, F., Lin, Y.-C., Wilkins, B. P., Liu, X., Bao, M., Hong, Y., and Michalski, G.: A diurnal story of Δ17O(NO3−) in urban Nanjing and its implication for nitrate aerosol formation, NPJ Clim. Atmos. Sci., 5, 50, https://doi.org/10.1038/s41612-022-00273-3, 2022.
Zhang, Z., Cao, L., Liang, Y., Guo, W., Guan, H., and Zheng, N.: Importance of NO3 radical in particulate nitrate formation in a southeast Chinese urban city: New constraints by δ15N-δ18O space of NO3−, Atmos. Environ., 253, 118387, https://doi.org/10.1016/j.atmosenv.2021.118387, 2021.
Zheng, B., Zhang, Q., Zhang, Y., He, K. B., Wang, K., Zheng, G. J., Duan, F. K., Ma, Y. L., and Kimoto, T.: Heterogeneous chemistry: a mechanism missing in current models to explain secondary inorganic aerosol formation during the January 2013 haze episode in North China, Atmos. Chem. Phys., 15, 2031–2049, https://doi.org/10.5194/acp-15-2031-2015, 2015.
Zheng, B., Tong, D., Li, M., Liu, F., Hong, C., Geng, G., Li, H., Li, X., Peng, L., Qi, J., Yan, L., Zhang, Y., Zhao, H., Zheng, Y., He, K., and Zhang, Q.: Trends in China's anthropogenic emissions since 2010 as the consequence of clean air actions, Atmos. Chem. Phys., 18, 14095–14111, https://doi.org/10.5194/acp-18-14095-2018, 2018.
Zheng, H., Song, S., Sarwar, G., Gen, M., Wang, S., Ding, D., Chang, X., Zhang, S., Xing, J., Sun, Y., Ji, D., Chan, C. K., Gao, J., and McElroy, M. B.: Contribution of Particulate Nitrate Photolysis to Heterogeneous Sulfate Formation for Winter Haze in China, Environ. Sci. Technol. Lett., 7, 632–638, https://doi.org/10.1021/acs.estlett.0c00368, 2020.
Zhou, M., Nie, W., Qiao, L., Huang, D. D., Zhu, S., Lou, S., Wang, H., Wang, Q., Tao, S., Sun, P., Liu, Y., Xu, Z., An, J., Yan, R., Su, H., Huang, C., Ding, A., and Chen, C.: Elevated formation of particulate nitrate from N2O5 hydrolysis in the Yangtze River Delta region from 2011 to 2019, Geophys. Res. Lett., 49, e2021GL097393, https://doi.org/10.1029/2021GL097393, 2022.