the Creative Commons Attribution 4.0 License.
the Creative Commons Attribution 4.0 License.
 | 26 Sep 2022
Radical chemistry in the Pearl River Delta: observations and modeling of OH and HO2 radicals in Shenzhen in 2018
Xinping Yang
Xuefei Ma
Yue Gao
Zhaofeng Tan
Haichao Wang
Xiaorui Chen
Xiaofeng Huang
Lingyan He
Mengxue Tang
Shiyi Chen
Huabin Dong
Limin Zeng
Yuanhang Zhang
The ambient radical concentrations were measured continuously by laser-induced fluorescence during the STORM (STudy of the Ozone foRmation Mechanism) campaign at the Shenzhen site, located in the Pearl River Delta in China, in the autumn of 2018. The diurnal maxima were 4.5×106 cm−3 for OH radicals and 4.2×108 cm−3 for HO2 radicals (including an estimated interference of 23 %–28 % from RO2 radicals during the daytime), respectively. The state-of-the-art chemical mechanism underestimated the observed OH concentration, similar to the other warm-season campaigns in China. The OH underestimation was attributable to the missing OH sources, which can be explained by the X mechanism. Good agreement between the observed and modeled OH concentrations was achieved when an additional numerical X equivalent to 0.1 ppb NO concentrations was added into the base model. The isomerization mechanism of RO2 derived from isoprene contributed approximately 7 % to the missing OH production rate, and the oxidation of isoprene oxidation products (MACR and MVK) had no significant impact on the missing OH sources, demonstrating further exploration of unknown OH sources is necessary. A significant HO2 heterogeneous uptake was found in this study, with an effective uptake coefficient of 0.3. The model with the HO2 heterogeneous uptake can simultaneously reproduce the OH and HO2 concentrations when the amount of X changed from 0.1 to 0.25 ppb. The ROx primary production rate was dominated by photolysis reactions, in which the HONO, O3, HCHO, and carbonyls photolysis accounted for 29 %, 16 %, 16 %, and 11 % during the daytime, respectively. The ROx termination rate was dominated by the reaction of OH+NO2 in the morning, and thereafter the radical self-combination gradually became the major sink of ROx in the afternoon. As the sum of the respective oxidation rates of the pollutants via reactions with oxidants, the atmospheric oxidation capacity was evaluated, with a peak of 11.8 ppb h−1 around noontime. The ratio of P(O3)net to AOCVOCs, which indicates the yield of net ozone production from VOC oxidation, trended to increase and then decrease as the NO concentration increased. The median ratios ranged within 1.0–4.5, with the maximum existing when the NO concentration was approximately 1 ppb. The nonlinear relationship between the yield of net ozone production from VOC oxidation and NO concentrations demonstrated that optimizing the NOx and VOC control strategies is critical to controlling ozone pollution effectively in the future.
- Article
(3091 KB) - Full-text XML
-
Supplement
(1234 KB) - BibTeX
- EndNote


Severe ambient ozone (O3) pollution is one of China's most significant environmental challenges (Shu et al., 2020; Li et al., 2019; Wang et al., 2020; Ma et al., 2019b; T. Wang et al., 2017). Despite the reduction in emissions of O3 precursors, O3 concentration is increasing, especially in urban cities. The O3 average trends for the focus megacity clusters are 3.1, 2.3, 0.56, and 1.6 ppb yr−1 for the North China Plain (NCP), Yangtze River Delta (YRD), Pearl River Delta (PRD), and Szechwan Basin (SCB), respectively (Li et al., 2019). The nonlinearity between O3 and precursors illustrates that exploring the cause of O3 production is necessary. The tropospheric O3 is only generated in the photolysis of nitrogen dioxide (NO2) which is produced as the by-product within the radical cycling. Thus, the investigation of radical chemistry is critical to controlling secondary pollution.
Hydroxyl radicals (OH), the dominant oxidant, control the atmospheric oxidation capacity (AOC) in the troposphere. The OH radicals convert primary pollutants to secondary pollutants and are simultaneously transformed into peroxy radicals (HO2 and RO2). The HO2 and RO2 radicals are transformed into OH radicals via the reactions with nitrogen oxides (NO). Secondary pollutants are generated within the interconversion of ROx (= OH, HO2, and RO2), indicating that exploring radical chemistry is significant for the further control of secondary pollution. The radical closure experiment, an effective indicator for testing our understanding of radical chemistry, has been conducted since the central role of OH radicals was recognized in the 1970s (Levy, 1971; Hofzumahaus et al., 2009). The underestimation of OH radicals in environments characterized by low NO and high volatile organic compounds (VOCs) has been identified (Lu et al., 2013, 2012; Tan et al., 2017, 2019; Yang et al., 2021; Hofzumahaus et al., 2009; Lelieveld et al., 2008; Whalley et al., 2011). New radical mechanisms involving unclassical OH regeneration have been proposed, mainly including Leuven isoprene mechanism (LIM) and X mechanism (Peeters and Muller, 2010; Peeters et al., 2014, 2009; Hofzumahaus et al., 2009). The LIM, which has been integrated into the current radical mechanism, is still insufficient to explain the OH missing sources. The X mechanism was identified several times, but the amount of the numerical species, X, varied in different environments, and the nature of X is still unknown (Hofzumahaus et al., 2009; Lu et al., 2013, 2012; Tan et al., 2017, 2019; Yang et al., 2021; Ma et al., 2022). Therefore, further exploration of radical regeneration sources is necessary.
Due to the strong photochemistry influenced by high temperatures and strong radiation, severe O3 pollution appeared to occur in YRD and PRD, especially in PRD (Ma et al., 2019b; T. Wang et al., 2017). Radicals, the dominant oxidant in the troposphere, have been measured during warm seasons in NCP (Yufa 2006, Wangdu 2014, and Beijing 2016), YRD (Taizhou 2018), SCB (Chengdu 2019), and PRD (Backgarden 2006 and Heshan 2014) in China (Lu et al., 2013, 2012; Tan et al., 2017, 2019; Yang et al., 2021; Tan et al., 2021; Ma et al., 2022). The radical observations in PRD, where the cities are suffering from severe O3 pollution, have not been conducted since 2014, and thus the oxidation capacity here has not been clear in recent years. Therefore, we carried out a continuous comprehensive field campaign (STudy of the Ozone foRmation Mechanism – STORM) involving radical observations in Shenzhen, one of the megacities in PRD, in the autumn of 2018. Overall, the following will be reported in this study:
-
the observed radical concentrations and the comparison between the radical observations and simulations;
-
the exploration of the unclassical OH regeneration sources based on the experimental budget;
-
the sources and sinks of ROx radicals;
-
the evaluation of the atmospheric oxidation capacity.
2.1 Measurement site and instrumentation
The STORM campaign was conducted from September to October 2018 in Peking University Shenzhen Graduate School (22.60∘ N, 113.97∘ E), in the west of Shenzhen, Guangdong Province. As shown in Fig. 1, this site, which belongs to the urban site, is located in the university town and is surrounded by residential and commercial areas. The northwest of the site is close to the Shenzhen Safari Park, and the northeast is close to the Xili Golf and Country Club (Yu et al., 2020). The Tanglangshan Park with active biogenic emissions is located about 1 km southeast of the site. Overall, this site has no significant local pollution sources nearby but can represent the urban pollution characteristics (Huang et al., 2012a, b; Gao et al., 2018).
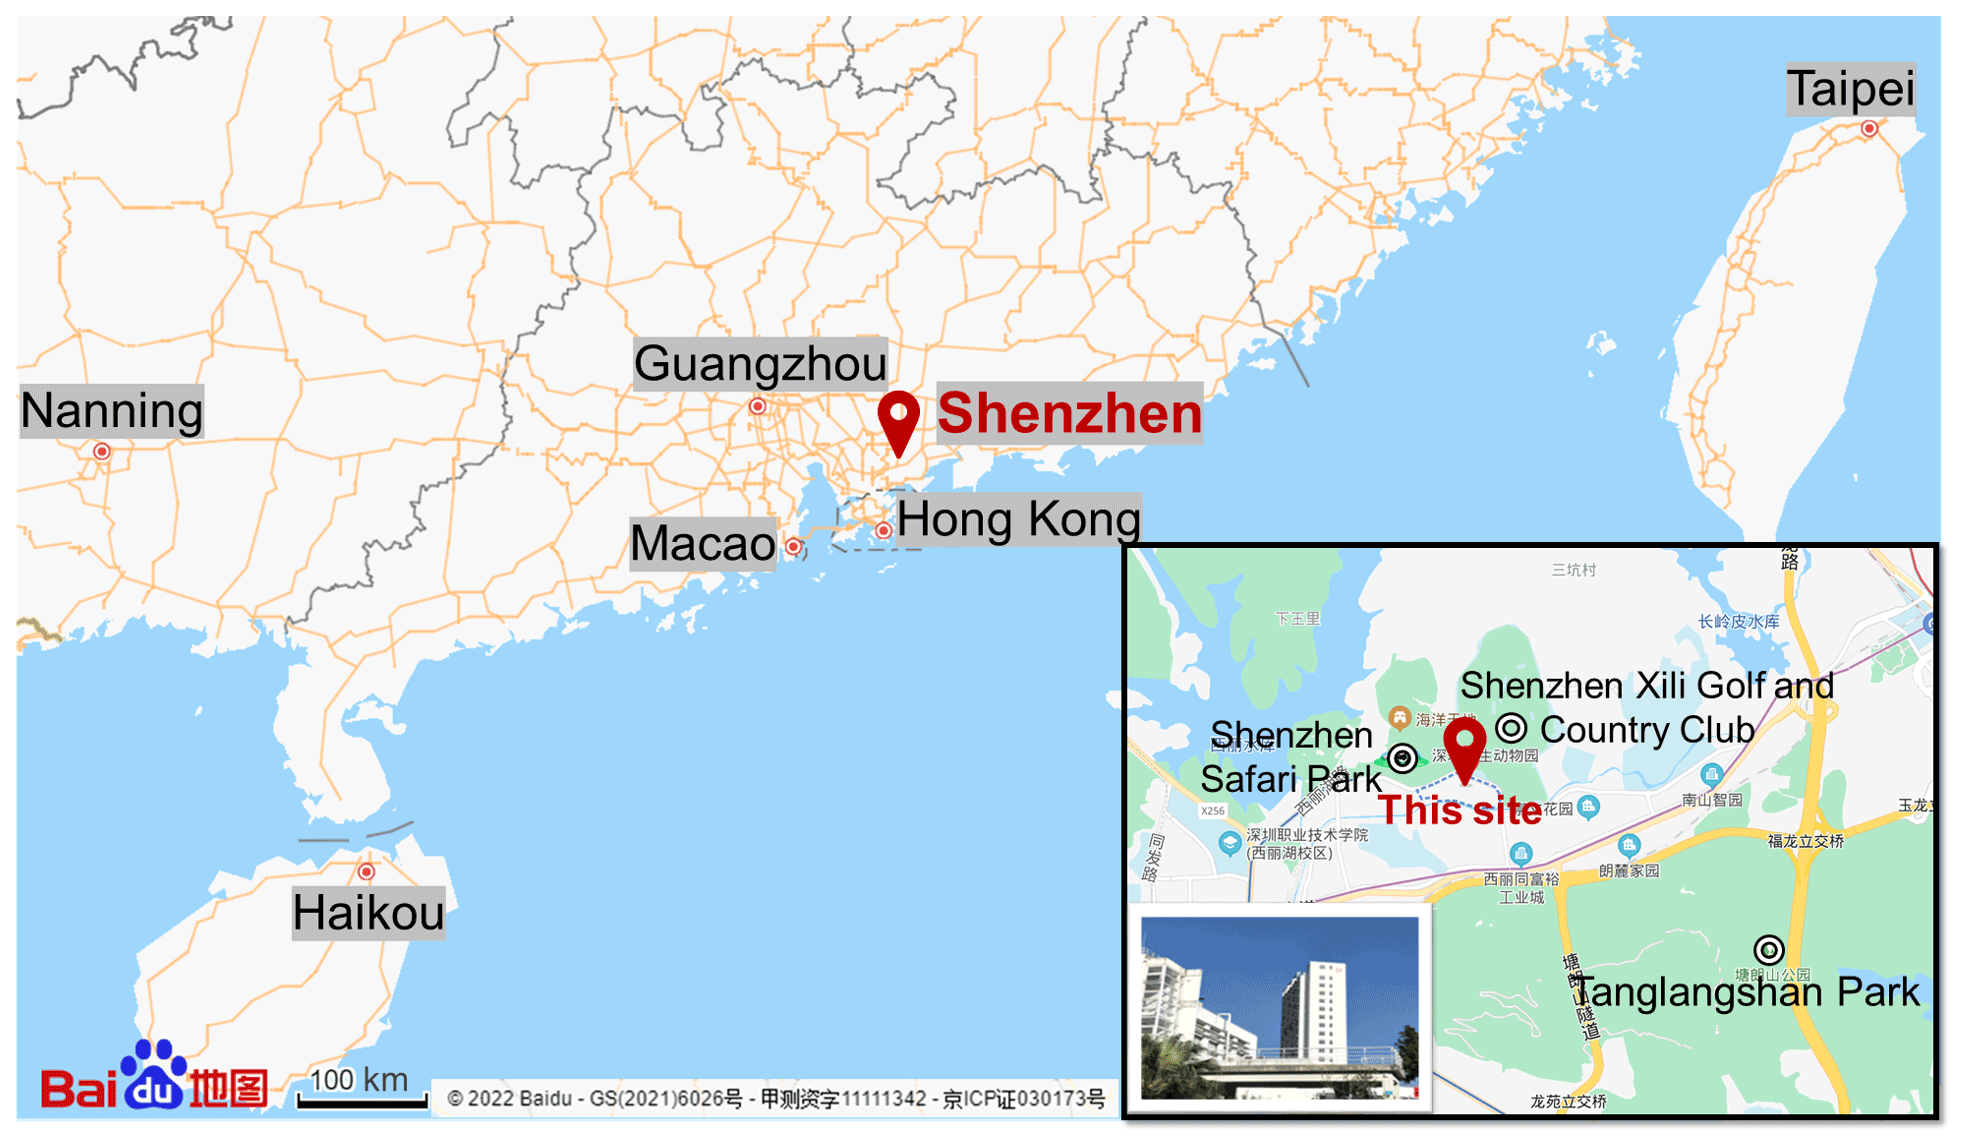
Figure 1Geographical location and surrounding environmental conditions of the measurement site in the STORM campaign (the maps are from https://map.baidu.com, last access: 22 August 2022).
Most instruments were set up on the top of a four-story academic building (about 20 m). Besides HOx radicals measured by the Peking University laser-induced-fluorescence system (PKU-LIF) (see the details in Sect. 2.2), a comprehensive set of trace gases was conducted to support the exploration of radical chemistry, including meteorological parameters (temperature, pressure, relative humidity, etc.), photolysis frequency, OH reactivity (kOH), and the trace gases (NO, NO2, O3, VOCs, etc.). kOH was measured by the laser-flash photolysis laser-induced fluorescence system (LP-LIF). Most of the inorganic trace gases (O3, CO, NO, NO2, and SO2) were simultaneously measured by two sets of instruments, and good agreement was achieved within the uncertainty. VOC species (alkanes, alkenes, aromatics, isoprene, and oxygenated VOCs (OVOCs)) were measured using a gas chromatograph following a mass spectrometer (GC-MS). In addition, HONO and HCHO were measured as well. Table S1 in the Supplement presents the experimental details of the meteorological and chemical parameters during this campaign.
2.2 The OH and HO2 measurements
The OH and HO2 radicals were measured by PKU-LIF based on the fluorescence assay by gas expansion (FAGE) technique. The principle has been reported in previous studies, and only a brief description of the instrument is presented here. Further detailed information on the instrument can be found in previous studies (Heard and Pilling, 2003; Fuchs et al., 2008; Holland et al., 1995; Hofzumahaus et al., 1996; Fuchs et al., 2011).
In principle, OH resonance fluorescence is released in the OH excitation by a 308 nm pulsed laser, and then OH radicals are detected directly. HO2 radicals are converted into OH via NO, and then they are detected. The system contains a laser module and a detection module. Ambient air was drawn into two independent, parallel, low-pressure (3.5 mbar) cells through two parallel nozzles with 0.4 mm diameter pinhole. The OH radicals are excited into resonance fluorescence in the OH detection cell and detected by micro-channel plate detectors (MCP). In the HO2 detection cell, NO is injected and converts HO2 to OH radicals, and then OH radicals are excited by the laser and release resonance fluorescence. Besides, an OH reference cell in which a large OH concentration is generated by pyrolysis of water vapor on a hot filament is applied to automatically correct the laser wavelength.
Owing to the failure of the reference cell in this campaign, the NO mixing ratios injected into the HO2 detection cell were set to be higher than those in other campaigns in China because the HO2 cell needed to be used as a reference cell to correct laser wavelength. In this campaign, NO mixing ratios were switched between 25 ppm (low-NO mode) and 50 ppm (high-NO mode). We calculated the HO2-to-OH conversion efficiencies under the two different NO concentrations by calibrating the PKU-LIF system. HO2-to-OH conversion efficiencies in low-NO mode ranged within 80 %–95 %, while those in high-NO mode reached 100 %, demonstrating that the high NO concentration is sufficient to achieve the complete HO2-to-OH conversion, and thus the HO2 measurement was affected by RO2 radicals. Prior studies have reported the relative detection sensitivities () for the major RO2 species, mainly from alkenes, isoprene, and aromatics. Fuchs et al. (2011) reported that the relative RO2 detection sensitivities are approximately constant when the NO concentration is so high that HO2 conversion in the detection is nearly complete. Thus, when the HO2-to-OH conversion efficiencies reach 100 %, the relative RO2 detection sensitivities reported by Fuchs et al. (2011) and Lu et al. (2012) can be used for the correction of HO2 concentrations (Fuchs et al., 2011; Lu et al., 2012, 2013). Herein, only the HO2 observations in high-NO mode were chosen, and they were denoted as , which was the sum of the true HO2 concentration and a systematic bias from the mixture of RO2 species i which were detected with different relative sensitivities , as shown in Eq. (1) (Lu et al., 2012). The true HO2 concentration was difficult to be calculated because the observed concentrations of RO2 and their speciation were not available. Herein, we simulated the HO2 and HO concentrations by the model, and the RO2 interference yields which were used for correction were the modeled values reported by Lu et al. (2012) in the PRIDE-PRD2006 campaign in which the HO2-to-OH conversion efficiencies also reached 100 % due to the injection of pure NO in the HO2 detection cell. The interference from RO2 radicals was estimated to be the difference between the modeled HO2 and HO concentrations. Overall, the measurement uncertainties of OH and HO radicals were 11 % and 15 %, respectively, as shown in Table S1.
Additionally, prior studies reported that OH measurement might be affected by the potential interference, when the sampled air contains ozone, alkenes, and BVOCs (Mao et al., 2012; Fuchs et al., 2016; Novelli et al., 2014), indicating the environmental conditions are important to the production of interference. The pre-injector is usually used to test the potential OH interference and has been applied to our PKU-LIF system to quantify the possible interferences for several campaigns, including the campaigns conducted at the Wangdu, Heshan, Huairou, Taizhou, and Chengdu sites (Tan et al., 2017, 2019, 2018; Yang et al., 2021; Ma et al., 2022). No significant internal interference was found in the prior studies, demonstrating that the accuracy of the PKU-LIF system has been determined for several times. Moreover, to further explore the potential interference in this campaign, we compared the major environmental conditions, especially O3, alkenes, and isoprene, between Shenzhen and Wangdu sites, as shown in the Supplement. The results indicated that the environmental condition in Shenzhen was less conducive to generating interference than that in Wangdu, and the details were presented in the Supplement. Besides the environmental conditions, the prior studies reported that the product of the reaction of RO2 with OH, trioxides (ROOOH), might lead to an OH interference signal. The reactions of RO2 radicals with OH radicals might be competitive with other sinks for RO2 radicals (Fittschen, 2019; Fittschen et al., 2019; Berndt et al., 2022). Fittschen et al. (2019) reported that the OH interference signals might come from the ROOOH heterogeneous decomposition on the walls of the FAGE cell or the entrance nozzle, but they also noted that the ROOOH interference is highly dependent on the design and measurement conditions of different FAGE instruments. Therefore, we integrated the reactions of the ROOOH production and destruction into the base model herein, with the ROOOH production rate constant of cm3 s−1 and the destruction rate constant of 10−4 s−1 (the details are presented in the Supplement) (Fittschen et al., 2019). Figure S1a presents the modeled ROOOH concentrations during this campaign, with a maximum of about 4.4×109 cm−3. The (i) correlation of the modeled ROOOH concentrations and the ratios of OH observations to OH simulations and the (ii) correlation of the modeled ROOOH concentrations and the difference between OH observations and simulations both demonstrated that no significant relevance between ROOOH and the underestimation of OH radicals, as shown in Fig. S1b–c. Additionally, the ROOOH values modeled in our another campaign (Taizhou, 2018) were comparable to or even slightly higher than the simulations in this study, and the chemical modulation tests in Taizhou confirmed the ROOOH is not a significant OH interference in our PKU-LIF system (Ma et al., 2022). Overall, the OH interference during this campaign was negligible according to the analysis of the behavior of the PKU-LIF system in previous campaigns, the comparison of environmental conditions between this campaign and Wangdu campaign, and the exploration of the impact of ROOOH on the discrepancy of OH observations and simulations. However, we should acknowledge that the unmeasured interference might have an effect on radical measurement. More precise chemical modulation tests are needed in the future.
2.3 Closure experiment
As an effective tool to explore the atmospheric radical chemistry, the radical closure experiment can investigate the state-of-the-art chemical mechanism because of the extremely short lifetime of radicals (Stone et al., 2012; Lu et al., 2019). A zero-dimensional box model was used to conduct the radical closure experiment, and the overall framework was reported by Lu et al. (2019). In this work, we conducted the radical closure experiment based on the Regional Atmospheric Chemistry Mechanism updated with the latest isoprene chemistry (RACM2-LIM1), as Tan et al. (2017) described in detail. The model was constrained by the measured meteorological, the photolysis frequency, and the critical chemical parameters (CO, NO, NO2, VOCs, etc.). The H2 and CH4 mixing ratios were set to 550 and 1900 ppb, respectively. The model was operated in time-dependent mode with a 5 min time resolution, and a 2 d spin-up time was to make the unconstrained species approach the steady state relative to the constrained species.
As Lu et al. (2012) described, there are two types of radical closure experiment. One is the comparison of observed and modeled radical concentrations, and the other is the comparison of radical production and destruction rates. The most significant difference between the above is that the latter is conducted with the observed radical concentrations and kOH constrained. The comparison of radical production and destruction rates, which is also called radical experimental budget, can test the accuracy of the state-of-the-art chemistry mechanisms based on the equivalent relationship between the radical production and destruction rates. The production rates of OH, HO2, and RO2 radicals are quantified from all the known sources. The destruction rates of HO2 and RO2 radicals are the sum of the known sinks, while the OH destruction rate can be directly calculated as the product of the observed OH concentrations and the observed kOH (Tan et al., 2019; Yang et al., 2021). The OH destruction rate is the total sinks of OH radicals because of the direct kOH observation, and thus the discrepancy between the OH destruction and production rates denotes the missing OH sources. The detailed reactions and the reaction rate constants related to OH, HO2, and RO2 radicals can be found in Tan et al. (2019) and Yang et al. (2021).
2.4 AOC evaluation
The lifetime of the trace gases is controlled not only by the oxidant concentration but also by its second-order rate constant, so the atmospheric oxidation capacity (AOC) proposed by Geyer et al. (2001) is most suitable to evaluate the relative importance of each oxidant (Elshorbany et al., 2009). AOC is the core driving force of complex air pollution and determines the removal rate of trace gases and the production rates of secondary pollutants (Liu et al., 2021). As an effective indicator for atmospheric oxidation intensity, the evaluation of AOC can provide crucial information on the atmospheric composition of harmful and climate forcing species (Elshorbany et al., 2009). AOC is defined as the sum of the respective oxidation rates of the pollutants via reactions with oxidants (Elshorbany et al., 2009; Geyer et al., 2001; Zhu et al., 2020). According to the definition of AOC, it can be calculated by the Eq. (2).
where Yi represents the pollutants (CO, CH4, and VOCs), X represents the main atmospheric oxidants (OH, O3, NO3), and is the bimolecular rate constant for the reaction of Yi with X. AOC includes all combination of pollutants Y and oxidants X. The higher the AOC, the higher the removal rate of the atmospheric pollutants, and thus the higher the production rate of secondary pollutants (Yang et al., 2020). Simultaneous measurements of OH and the key trace gases are available in the study. NO3 concentration could be simulated by the box model with the observed parameters constrained.
3.1 Meteorological and chemical conditions
Figure 2 gives an overview of the meteorological and chemical parameters from 5 to 28 October 2018, when OH and HO2 radicals were measured. The diurnal variations of the temperature (T), relative humidity (RH), j(O1D), and j(NO2) followed a regular pattern from day to day. The overall meteorological conditions were characterized by high temperature (about 20 to 30∘), high relative humidity (60 % to 80 %), and intensive radiation with j(O1D) up to s−1 and j(NO2) up to s−1. The relative humidity and photolysis frequency in this autumn campaign were similar to those in the summer campaign conducted in Chengdu (Yang et al., 2021). The temperature in this campaign was lower than that in Chengdu but similar to that in the autumn campaign in Heshan located in PRD as well (Tan et al., 2019; Yang et al., 2021).
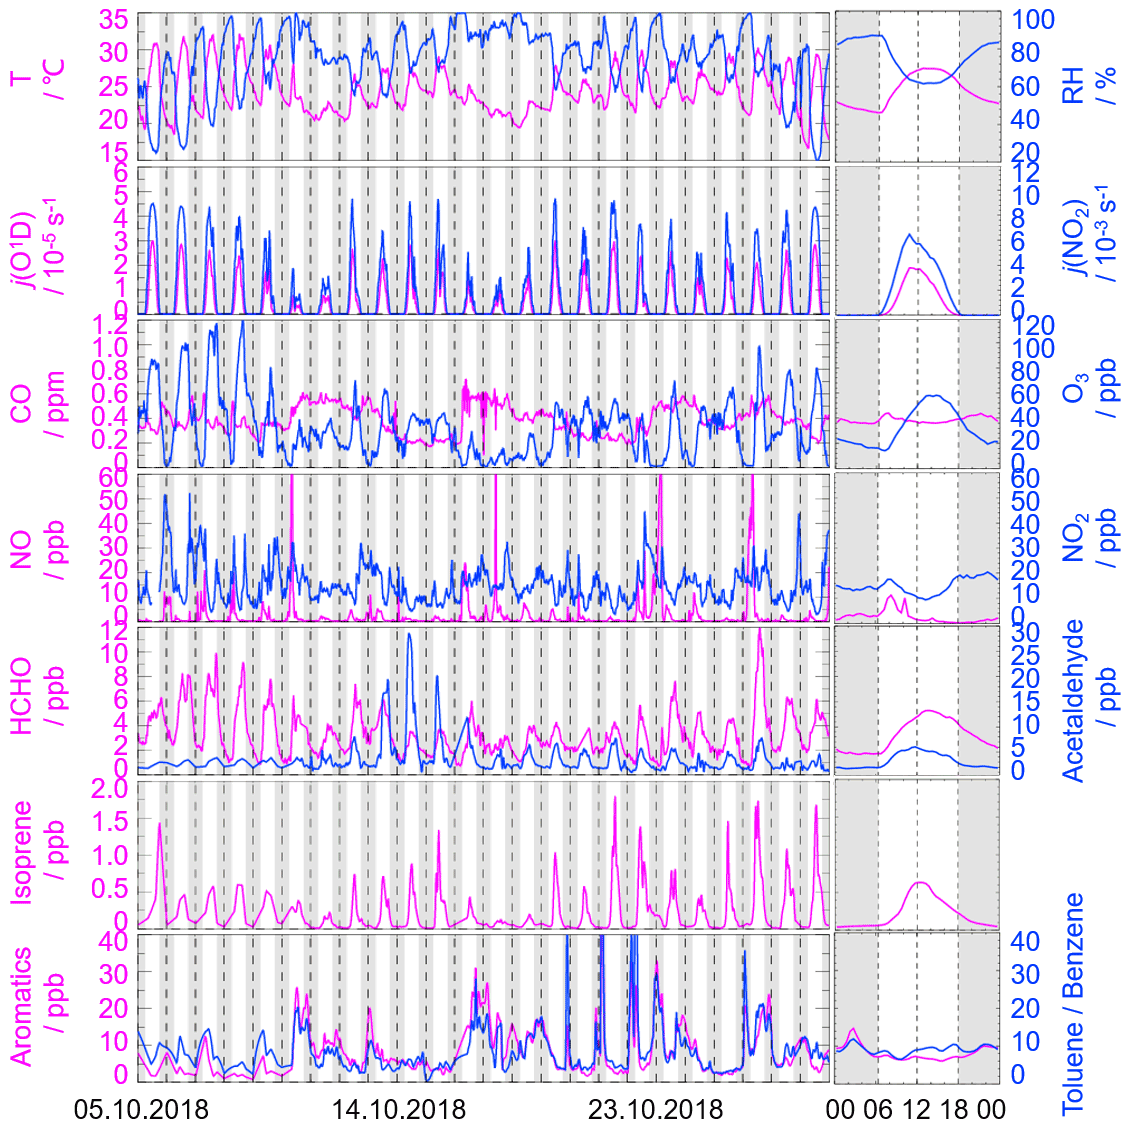
Figure 2Time series and diurnal profiles of the observed meteorological and chemical parameters in the STORM campaign. The grey areas denote nighttime. The time of day in each figure is given in Chinese standard time (CST = UTC+8 h).
The concentration of CO showed a weak diurnal variation, indicating there was the non-obvious accumulation of anthropogenic emissions on a regional scale. NO concentration peaked at 12 ppb during morning rush hour when the traffic emission was severe, and thereafter O3 concentration started to increase with the decreasing of NO concentration. The maxima of O3 hourly concentration were high up to 120 ppb. According to the updated National Ambient Air Quality Standard of China (GB3095-2012), O3 concentration exceeded the class-II limit values (hourly averaged limit 93 ppb) on several days (6, 7, 8, and 26 October) when the environmental condition was characterized by high temperature and low relative humidity. NO2 concentration was high at night because of the titration effect of O3 with NO.
Along with the high O3 concentration on 6, 7, 8, and 26 October, high HCHO concentration was also recorded during the corresponding periods, indicating HCHO was mainly produced as secondary pollutants because of the active photochemistry in this campaign. Isoprene, which is mostly derived from biogenic emissions and mainly affected by temperature, peaked around noontime. Tan et al. (2019) reported the median concentration of HCHO and isoprene concentrations were 6.8 and 0.6 ppb during 12:00–18:00 CST (Chinese standard time: CST = UTC+8 h) at the Heshan site. Similarly, the median concentrations of HCHO and isoprene concentrations in this study were 4.9 and 0.4 ppb during the corresponding periods, respectively. As a proxy for traffic intensity, the toluene-to-benzene ratio (), which is below 2, means the traffic emissions are the major sources of VOCs (Brocco et al., 1997). In this campaign, the gradually dropped from 07:00 CST until it reached the minimum value at 09:00 CST, indicating traffic emission contributed more to VOCs during morning rush hour than during other periods. However, the values, which varied within a range of 7–12, were above 2, and thus VOC emission during this campaign was mainly from other sectors such as those involving solvent evaporation.
Moreover, we compared the environmental conditions between the Backgarden (rural site), Heshan (suburban site), and Shenzhen (urban site) campaigns conducted in PRD in Table S3. No significant discrepancy in temperature was found in the Shenzhen and Heshan campaigns, which were both conducted in autumn. The temperature in the Backgarden campaign conducted in summer was higher than those in Shenzhen and Heshan. The relative humidity in Shenzhen and Backgarden was higher than that in Heshan. Compared to the chemical conditions in the Heshan campaign conducted in autumn as well, the concentrations of CO, NO, NO2, HONO, alkenes, aromatics, and HCHO in Shenzhen were lower, which might be because there were no significant local pollution sources nearby at the Shenzhen site although it was an urban site. However, the concentration of O3, which is the typical secondary pollutant in Shenzhen, was higher than that in Heshan. Compared to the environmental conditions in Heshan, the higher O3 concentration in Shenzhen might benefit from the weather condition, which was characterized by the stronger solar radiation and slightly higher temperatures.
3.2 Observed and modeled OH and HO2 radicals
The OH and HO2 radicals were measured during 5–28 October 2018. The time series of the observed and modeled HOx concentrations are shown in Fig. S2a–b. Data gaps were caused by the rain, calibration, and maintenance. The daily maxima of the observed OH and HO concentrations varied in the range of (2–9) ×106 and (2–14) ×108 cm−3, respectively. As in previous campaigns, the largest OH concentrations appeared around noontime and showed a high correlation with j(O1D), a proxy for the solar UV radiation driving much of the primary radical production (Tan et al., 2019).
Figure 3a–b shows the diurnal profiles of the observed and modeled HOx concentrations. The HOx radicals showed similar diurnal behavior to those reported in other campaigns (Ma et al., 2019a; Tan et al., 2017, 2019, 2018; Yang et al., 2021). The observed OH and HO concentrations reached a maximum around 12:00 and 13:30 CST, respectively. The diurnal maxima of the observed and modeled OH concentrations were 4.5×10⁶ and 3.5×106 cm−3. Compared to the other campaigns conducted in PRD (Backgarden and Heshan), the diurnal maximum of the observed OH concentration in Shenzhen was equal to that observed in Heshan but much lower than that observed in Backgarden where the observed OH concentration was nearly 15×106 cm−3 (Hofzumahaus et al., 2009; Tan et al., 2019). The higher OH concentration at the Backgarden site was closely correlated to the stronger solar radiation, as shown in Table S3. The diurnal observed and modeled OH concentrations agreed within their 1σ uncertainties of measurement and simulation (11 % and 40 %). However, when the NO mixing ratio (Fig. 2) dropped from 10:00 CST gradually, a systematic difference existed, with the observed OH concentration being about 1×106 cm−3 higher than the modeled OH concentration. The OH concentrations observed in the environments with low NO levels were underestimated by the state-of-the-art models at the Backgarden (summer) and Heshan (autumn) sites in PRD as well, and the OH underestimation was identified to be universal at low-NO conditions in China (Lu et al., 2013, 2012; Ma et al., 2019a; Tan et al., 2017; Yang et al., 2021; Ma et al., 2022). The reason of OH underestimation was further discussed in Sect. 4.1.
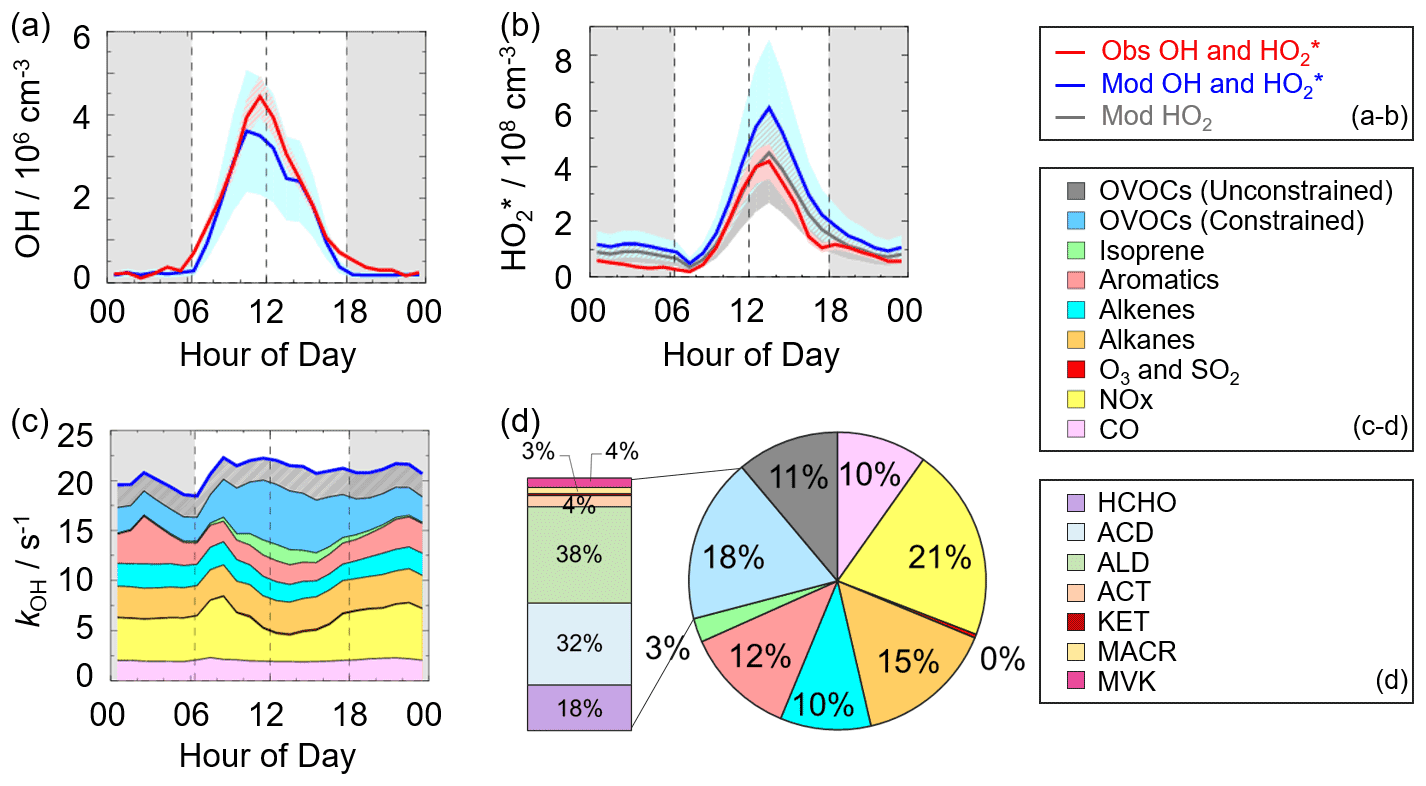
Figure 3(a, b) The diurnal profiles of the observed and modeled OH, HO, and HO2 concentrations. (c) The diurnal profiles of the modeled kOH. (d) The composition of the modeled kOH. The red areas in panels (a)–(b) denote 1σ uncertainties of the observed OH and HO concentrations. The blue areas in panels (a)–(b) denote 1σ uncertainties of the modeled OH and HO concentrations, and the dark grey area in panel (b) denotes 1σ uncertainties of the modeled HO2 concentrations. The grey areas in panels (a)–(c) denote nighttime. ACD denotes acetaldehydes. ALD denotes the C3 and higher aldehydes. ACT and KET denote acetone and ketones. MACR and MVK denote methacrolein and methyl vinyl ketone.
The diurnal maximum of the observed HO, the modeled HO, and the modeled HO2 concentrations were 4.2×10⁸, 6.1×10⁸, and 4.4×108 cm−3, respectively. The difference between the modeled HO and HO2 concentrations can be considered a modeled HO2 interference from RO2 (Lu et al., 2012). The RO2 interference was small in the morning, while it became larger in the afternoon. It ranged within 23 %–28 % during the daytime (08:00–17:00 CST), which was comparable with those at the Backgarden and Yufa sites in China, the Borneo rainforest in Malaysia (OP3 campaign, aircraft), and the UK (RONOCO campaign, aircraft) (Lu et al., 2012, 2013; Jones et al., 2011; Stone et al., 2014). The observed HO was overestimated by the model, indicating the HO2 heterogeneous uptake might have a significant impact during this campaign. The diurnal maximum of HO concentration observed in Shenzhen was much lower than those observed at the Yufa and Backgarden sites (Hofzumahaus et al., 2009; Lu et al., 2012, 2013). The high modeled ratio around noontime (11:00–15:00 CST), which was about 138, was found in this campaign, which was higher than those at the Backgarden and Chengdu sites (Yang et al., 2021; Hofzumahaus et al., 2009). A high ratio is normally found only in clean air at low NOx () concentrations (Hofzumahaus et al., 2009; Stevens et al., 1997). As an indicator that can reflect the interconversion reaction between HO2 and OH, the conversion efficiency in this campaign was slightly slower than those at the Backgarden and Chengdu sites.
3.3 OH reactivity
kOH is the pseudo-first-order loss rate coefficient of OH radicals, and it is equivalent to the reciprocal OH lifetime (Fuchs et al., 2017; Lou et al., 2010; Yang et al., 2019). In this campaign, kOH was measured only for several days (5–19 October 2018) by the LIP-LIF system, which has been reported in the previous study (Liu et al., 2019). The time series of the observed and modeled kOH during 5–19 October 2018 are presented in Fig. S3. A good agreement between the observed kOH and modeled kOH within the uncertainties was achieved, and thus the model can be believed to reproduce the observed kOH values within the whole campaign. Moreover, to reflect the kOH in the whole campaign, the modeled values are shown in the kOH diurnal profiles (Fig. 3c) and kOH time series (Fig. S2c) during 5–28 October 2018. The modeled kOH showed a weak diurnal variation and varied from 18 to 22 s−1. Compared to the kOH variation in Shenzhen, the kOH observed at the Backgarden and Heshan sites in PRD showed a stronger diurnal variation, with a minimum value at around noontime and a maximum value at daybreak. Additionally, the kOH values in this campaign were lower than those at the Backgarden (20–50 s−1) and Heshan (22–32 s−1) sites (Lou et al., 2010; Tan et al., 2019). Similar to the good agreement between the observed and modeled kOH during the several days in Shenzhen, the observed kOH in Backgarden was matched well with the modeled kOH which has included the OVOC reactivity. In terms of the kOH in Heshan, Tan et al. (2019) reported that only half of the observed kOH was explained by the calculated kOH which was calculated from the measured trace gas concentrations. The missing kOH in Heshan was likely caused by unmeasured VOCs, demonstrating the necessity to measure more abundant VOC species, especially OVOC species.
As shown in Fig. 3d, we presented the composition of modeled kOH. The inorganic compounds contributed approximately 31 % to kOH, in which the CO and NOx reactivity accounted for 10 % and 21 %, respectively. The NOx reactivity is displayed versus time, with a maximum during the morning peak. The peak concentration during the morning peak was associated with traffic emissions.
Compared with the inorganic reactivity, the larger fraction of kOH came from the VOC group, with a contribution of 69 % to kOH. The contribution of alkanes, alkenes, and aromatics were 15 %, 10 %, and 12 %, respectively. The isoprene reactivity related to temperature was mainly concentrated during the daytime, whereas the aromatics reactivity at night was higher. As for the OVOC species, we measured several OVOC species, including HCHO, acetaldehydes (ACD) and higher aldehydes (ALD), acetone (ACT), ketones (KET), and isoprene oxidation products (methacrolein (MACR) and methyl vinyl ketone (MVK)), and thus we constrained these species in the model. The constrained OVOC species accounted for 18 % in the total kOH, where HCHO, ACD, and ALD were the major contributors, with contributions of 18 %, 32 %, and 38 % to the constrained OVOCs, respectively. The contribution of aldehydes in this study (16 %) was larger than that in Beijing (Whalley et al., 2021) and smaller than that in Wangdu (Fuchs et al., 2017). The remaining reactivity was attributed to the unconstrained OVOC reactivity, which came from the model-generated intermediate species (glyoxal, methylglyoxal, methyl ethyl ketone, methanol, etc.), with a contribution of 11 % to the total kOH. A large fraction of OVOC reactivities in kOH was also found in some previous studies (Lou et al., 2010; Lu et al., 2013; Fuchs et al., 2017; Whalley et al., 2021). About 50 % of kOH was explained by OVOCs at the Backgarden site, and HCHO, ACD and ALD, and oxygenated isoprene products were the most important OH reactants in OVOCs, with a contribution of 30 %–40 %, and the other 10 %–20 % came from other oxygenated compounds (ketones, dicarbonyl compounds, alcohols, hydroperoxides, nitrates, etc.) (Lou et al., 2010). HCHO, ACD, MVK, MVCR, and glyoxal accounted for one-third of the total kOH at the Wangdu site (Fuchs et al., 2017). The large unconstrained OVOC reactivity indicated it is necessary to measure more VOC species in the future.
4.1 Radical closure experiment
In this study, we conducted the OH radical closure experiment which is called the OH experimental budget as well. As discussed in Sect. 3.3, it is believed that the model can reproduce the observed kOH. Herein, to conduct the OH experiment budget in the whole campaign, we used the modeled kOH to calculate the OH destruction rate because the kOH was only measured on several days. The diurnal profiles of OH production and destruction rates as well as the compositions of the OH production rate are shown in Fig. 4, with maxima of 14 and 17 ppb h−1 around noontime, respectively. The OH production rate from known sources is quantified from the primary sources (photolysis of HONO, photolysis of O3, ozonolysis of alkenes) and secondary sources (dominated by HO2+NO and HO2+O3). The primary and secondary sources accounted for 78 % and 22 % of the total calculated production rate, respectively. Similar to the prior studies, the largest fraction of OH production rate came from HO2+NO, with a contribution up to 76 % of the known OH production rate. As the major primary OH sources, the HONO and O3 photolysis contributed 13 % and 7 % to the total calculated OH production rate, respectively.
The OH production rate matched well with the destruction rate only in the early morning to about 10:00 CST. Thereafter, the OH destruction rate was larger than the production rate, which could explain the underestimation of OH concentration by the model. As shown in Fig. 4b, the discrepancy between the OH production and destruction rates at around 11:00–15:00 CST, which was approximately of (3.1 to 4.6) ppb h−1, cannot be explained by the combined experimental uncertainties. The discrepancy was attributed to the missing OH sources because kOH was constrained in this study. The biggest additional OH source was approximately 4.6 ppb h−1, which occurred at about 12:00 CST, when the OH production and destruction rates were 11.9 and 16.5 ppb h−1, respectively. The unknown OH source accounted for about one-third of the total OH production rate, indicating the exploration of the missing OH source was significant to study the radical chemistry. It is noted that the OH production rate was overestimated because we used HO concentrations instead of HO2 concentrations here. Thus, the missing OH source was the lower limit here, demonstrating that more unknown OH sources need to be further explored. Details on unknown OH sources are given below (Sect. 4.2).
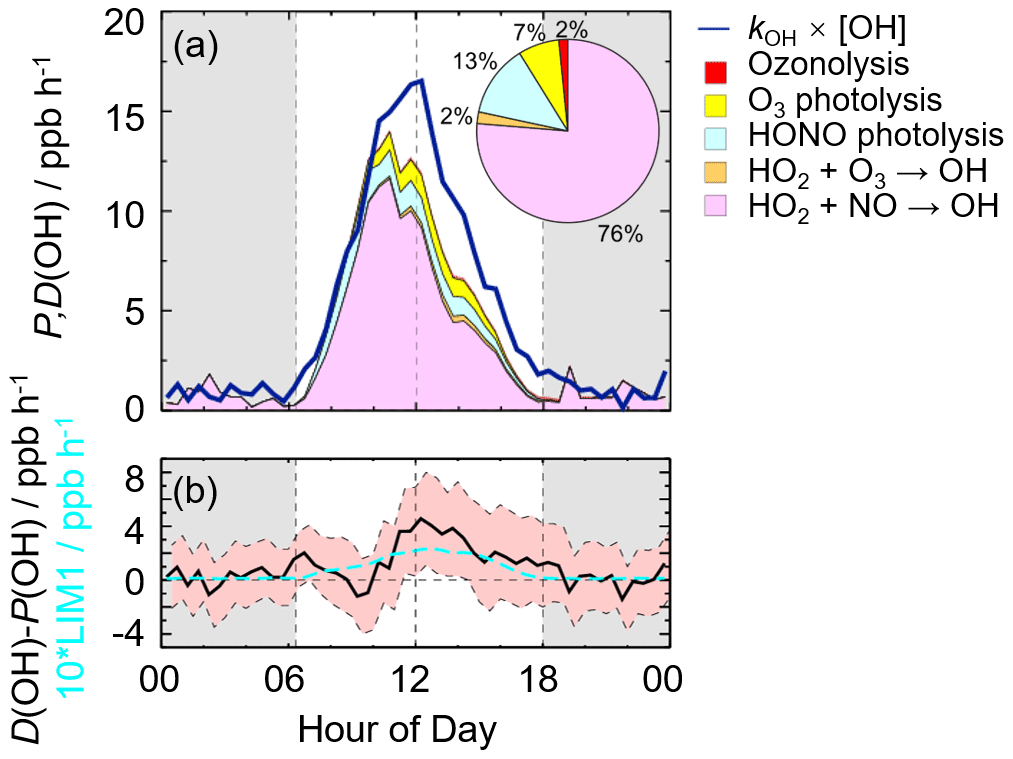
Figure 4(a) The diurnal profiles of OH production and destruction rates and the proportions of different known sources in the calculated production rate during the daytime. The blue line denotes the OH destruction rate, and the colored areas denote the calculated OH production rates from the known sources. (b) The missing OH source, which was the discrepancy between the OH destruction and production rates, and the OH production rate, which was 10 times the production rate derived from the LIM1 mechanism. The red shaded areas denote the combined uncertainty from the experimental errors of the measured quantities (Table S1) and the reaction rate coefficients. The grey areas denote nighttime.
4.2 Radical chemistry in the low-NO regime
4.2.1 Influencing factors of OH underestimation
As analyzed in Sect. 4.1, the underestimation of the OH concentration was attributable to the missing OH source. It is necessary to explore the influencing factor for gaining further insight into the missing source. Scientists reported that more significant OH underestimation would appear with the decreasing NO concentration and increasing isoprene concentration (Lu et al., 2012; Ren et al., 2008; Hofzumahaus et al., 2009; Lelieveld et al., 2008; Whalley et al., 2011; Tan et al., 2017; Yang et al., 2021). Herein, we further explored the effect of NO concentration on the missing OH source. The NO dependence on observed and modeled HOx concentrations and the NO dependence on HOx observed-to-modeled ratios were illustrated in Figs. 5 and S4. The OH concentrations were normalized by the averaged j(O1D) to eliminate the influence of radiation on radicals. The OH concentration showed an increasing trend with the increase in NO concentrations in the low-NO regime (below 1 ppb) due to the increased OH radicals from propagation via peroxy reactions with NO, and then it decreased with the increase in NO concentrations in the high-NO regime (above 1 ppb) due to the OH loss by the reactions via NO2 (Ehhalt, 1999). The modeled and observed OH concentrations agreed well in the high-NO regime, while a continuously increasing underestimation of the observed OH was found towards lower NO concentrations. As for HO radicals, the observed and modeled HO concentrations decreased with the increase in NO concentrations. The model overestimated the observations, indicating that the heterogeneous uptake might play a significant role in HO2 sinks in this campaign. Overall, NOx plays a crucial role in radical chemistry due to their impact on radical propagation and termination reactions.
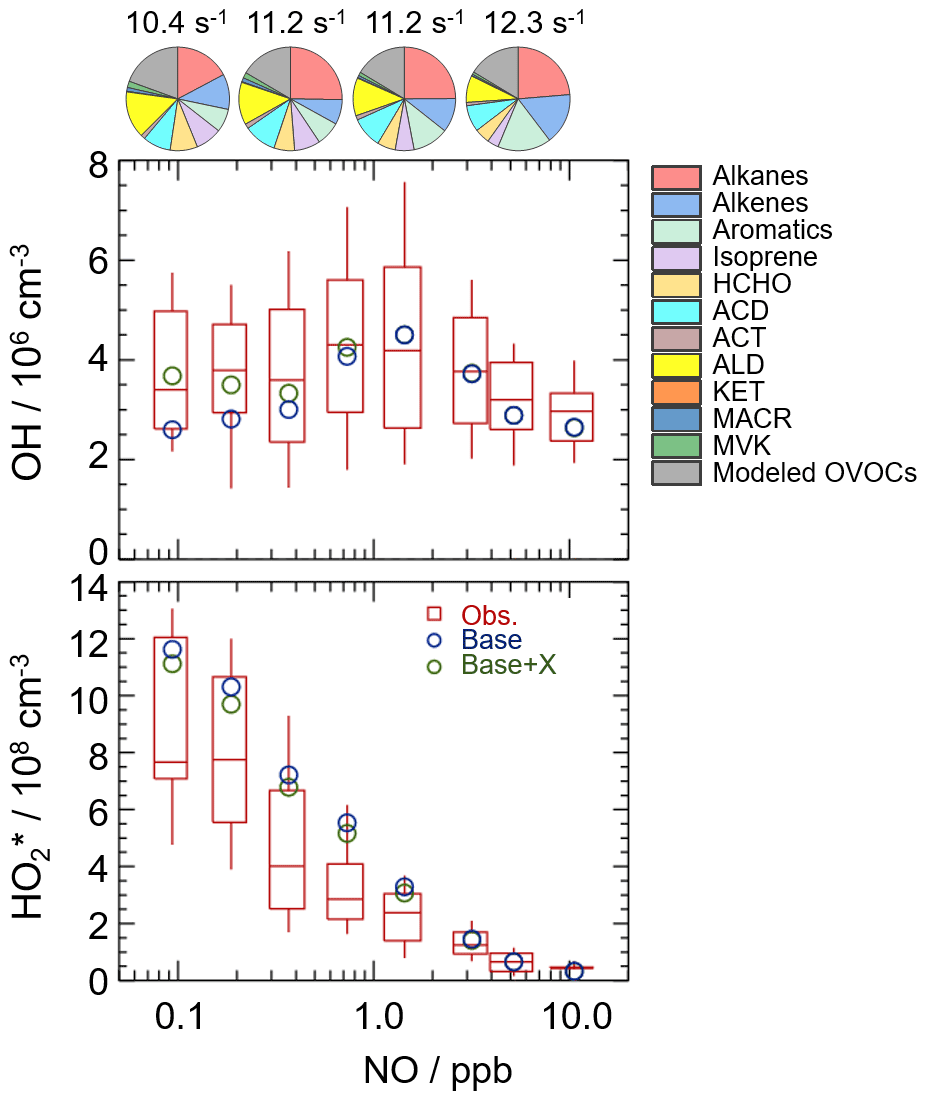
Figure 5NO dependence on OH and HO radicals. The red box–whisker plots give the median, the 75th and 25th percentiles, and the 90th and 10th percentiles of the HOx observations. The blue circles show the median values of the HOx simulations by the base model, and the green circles show the HOx simulations by the model with the X mechanism. Total VOC reactivity and their organic speciation are presented by pie charts at the different NO intervals at the top. Only daytime values and NO concentration above the detection limit of the instrument were chosen. ACD and ACT denote acetaldehyde and acetone, respectively. ALD denotes the C3 and higher aldehydes. KET denotes ketones. MACR and MVK, which are both the isoprene oxidation products, denote methacrolein and methyl vinyl ketone, respectively.
To further explore the influencing factors of OH underestimation, we presented the speciation VOC reactivity under the different NO intervals, as shown in Fig. 5 and Table S4. The isoprene reactivity and total OVOC reactivity (the sum of HCHO, ACD, ACT, ALD, KET, MACR, MVK, and the modeled OVOCs) increased with the decrease in NO concentrations, while the anthropogenic VOC reactivity (alkanes, alkenes, and aromatics) was higher in the high-NO regime. Additionally, the O3 concentration in the low-NO regime was significantly higher than those in the high-NO regime, and the temperature was slightly higher in the low-NO regime, demonstrating the photochemistry was more active in the low-NO regime in this campaign. Overall, the photochemistry and composition of VOC reactivity, especially the isoprene and OVOC species (mainly HCHO, ACD, ALD, and the modeled OVOCs), might closely impact the missing OH sources.
4.2.2 Quantification of missing OH sources
Hofzumahaus et al. (2009) proposed an existence of a pathway for the regeneration of OH independent of NO, including the conversions of RO2→HO2 and HO2→OH by a numerical species called X. With a retrospective analysis, the unclassical OH recycling pathway was identified to be universal at low-NO conditions in China. The amount of X varies with environmental conditions, and the X concentrations were 0.85, 0.4, 0.1, 0.4, 0.1, and 0.25 ppb at the Backgarden, Yufa, Wangdu, Heshan, Taizhou, and Chengdu sites (Hofzumahaus et al., 2009; Lu et al., 2012, 2013; Tan et al., 2017; Yang et al., 2021; Ma et al., 2022).
In this study, we tested this unclassical X mechanism. Good agreement between observations and simulations of OH radicals was achieved when a constant mixing ratio of 0.1 ppb of X was added into the base model. As shown in Fig. 5, the model with the X mechanism agreed with the observed OH concentrations even at low-NO conditions. Unclassical OH recycling was identified again in this study. Nevertheless, X is an artificial species that behaves like NO, and thus the nature of X is still unknown to us. Compared to the Shenzhen site, the required X concentration at the Backgarden and Heshan sites in PRD was higher, which might be affected by the different air masses in the three sites. The kOH at the Shenzhen site was much lower than those at the Backgarden and Heshan sites (Lu et al., 2013), and a weaker diurnal variation of kOH in Shenzhen was observed. Under the influence of the East Asian monsoon, the prevailing wind for the PRD area is mostly southerly during the summer months and mostly northerly during the winter months (Fan et al., 2005; Zhang et al., 2008). The Backgarden site is located in Guangzhou, and the Heshan site is located in Jiangmen. The two cities are along the north–south axis, and thus the air masses of the Backgarden and Heshan sites are intimately linked with each other, while the air mass in Shenzhen is more similar to Hong Kong (Zhang et al., 2008). Compared to the VOC reactivity in the air mass at the Backgarden and Yufa sites reported by Lu et al. (2013), lower isoprene reactivity and OVOC reactivity were observed in the Shenzhen site. As discussed in Sect. 4.2.1, the OH underestimation might be closely related to the composition of VOC reactivity. Therefore, further exploration of this unclassical OH recycling is needed to improve our understanding of radical chemistry, especially the mechanisms related to isoprene and OVOCs.
As for the potential influence of isoprene and OVOCs on the missing OH source, RO2 isomerization reactions have also been shown to be of importance for the atmospheric fate of RO2 from isoprene (Peeters et al., 2009, 2014). The latest isoprene isomerization mechanism, which is called LIM1, has been coupled into our current base model. However, the LIM1 mechanism was not included in the OH experimental budget which was conducted with the observations constrained, as shown in Sect. 4.1. Herein, we evaluated the contribution of the LIM1 mechanism to the missing OH sources, as shown in Fig. 4b. The LIM1 mechanism can explain approximately 7 % of the missing OH sources during 10:00–16:00 CST, when the missing OH production rate and the OH production rate derived from the LIM1 mechanism were 2.47 and 0.17 ppb h−1, respectively.
Additionally, prior studies also reported that OH regeneration might be achieved from the oxidation of MACR and MVK, which are the major first-generated products of isoprene (Fuchs et al., 2018, 2014). As a potential explanation for the high OH concentration, the impacts of MACR and MVK oxidation were evaluated here. The modification of the MACR oxidation scheme added the H-migration reactions of MACR oxidation products (Fuchs et al., 2014). The modification of the MVK oxidation scheme added the reactions of MVK oxidation products with HO2 radicals and the H-migration reactions of MVK oxidation products (Fuchs et al., 2018). As presented in Fig. S5, no significant contribution of the MACR and MVK oxidation schemes was found in this campaign.
Overall, a large part of missing OH sources was not explained by the isoprene chemistry. In the future, the potential impacts of OVOC species on missing OH sources need to be further evaluated.
4.3 HO2 heterogeneous uptake
The HO overestimation was identified by comparing the observed and modeled HO concentrations in Sects. 3.2 and 4.2.1. The HO2 heterogeneous uptake has been proposed to be a potential sink of HO2 radicals and thus could influence the radical chemistry and the formation of secondary pollution, especially in high-aerosol environments (Song et al., 2021, 2022; Tan et al., 2020; Kanaya et al., 2000, 2007; Li et al., 2019). The impact of HO2 uptake chemistry on radical concentration is different under different environmental conditions (Whalley et al., 2015; Mao et al., 2010; Li et al., 2019). To evaluate the contribution of HO2 uptake chemistry to radical concentrations in this study, we coupled HO2 heterogeneous uptake into the base model (RACM2-LIM1) and conducted three sensitivity experiments, as shown in Reaction (R1) and Eq. (3).
where ASA [µm2 cm−3], which represents the aerosol surface area concentration, can be estimated by multiplying the mass concentration of PM2.5 [µg m−3] by 20 here because there were no direct ASA observations in this campaign (Chen et al., 2019; X. Wang et al., 2017). , which can be calculated by Eq. (4), refers to the mean molecular velocity of HO2 with a unit of cm s−1.
where T [K] and R [J mol−1 K−1] denote the ambient temperature and gas constant. γ, the HO2 effective uptake coefficient, parameterizes the influence of some processes (Tan et al., 2020). γ varies in the highly uncertain range of 0–1 (Song et al., 2022) and is the most critical parameter to impact HO2 uptake chemistry. Only several observations of γ have been reported (Taketani et al., 2012; Zhou et al., 2021, 2020). The measured γ values at Mt. Tai and Mt. Mang were 0.13–0.34 and 0.09–0.40, respectively (Taketani et al., 2012). The average value of the measured γ was 0.24 in Kyoto, Japan, in the summer of 2018 (Zhou et al., 2020). Zhou et al. (2021) reported the lower-limit values for median and average values of the measured γ were 0.19 and 0.23±0.21 in Yokohama, Japan, in the summer of 2019. Additionally, Li et al. (2018) set 0.2 as the value of γ in the model, and Tan et al. (2020) calculated the γ of 0.08±0.13 by the analysis of the measured radical budget in Wangdu.
Here, we applied the two γ values (0.2 and 0.08), which have been used in the model, to evaluate the impact of HO2 uptake on radical concentrations, as shown in Fig. 6. The modeled HO cannot match well with the observations when a γ value of 0.08 and 0.2 was set in the model. As the γ increased to approximately 0.3, good agreement between the modeled and observed HO concentration was achieved, demonstrating that a significant heterogeneous uptake might exist in this campaign. It should be noted that the HO2 heterogeneous uptake (γ=0.3) reduced the modeled OH concentrations by around 20 % compared to the OH simulations in the base model during the daytime (08:00–18:00 CST). Sensitivity tests illustrated that good agreements of OH observations–simulations and HO observations–simulations were both achieved when the amount of X changed from 0.1 to 0.25 ppb and the HO2 effective uptake coefficient was 0.3, as shown in Fig. S6. Compared to the Backgarden and Heshan sites, the amount of X in Shenzhen was still lower despite a significant HO2 heterogeneous uptake, which might be closely related to the environmental conditions as discussed in Sect. 4.2.
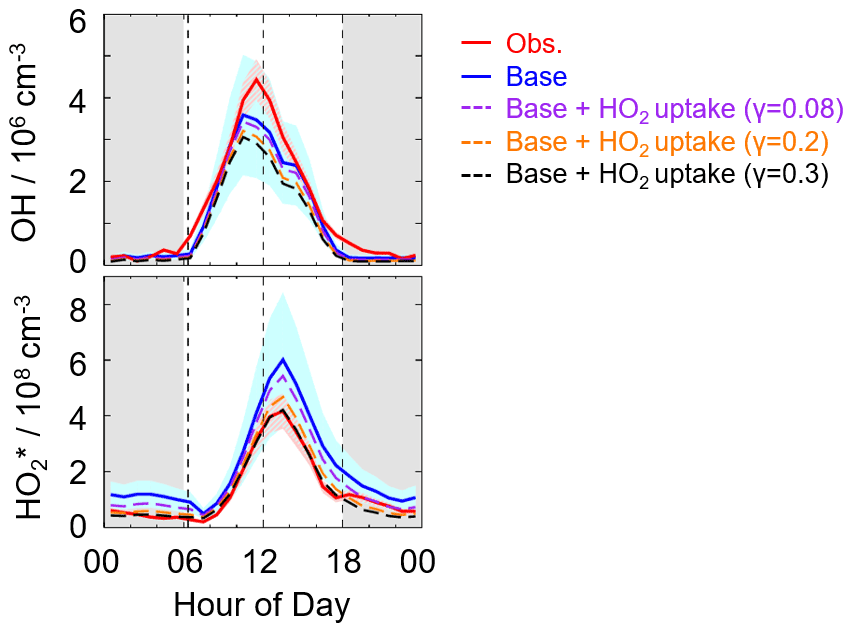
Figure 6The diurnal profiles of the observed and modeled radical concentrations. The red and blue areas denote 1σ uncertainties of measured and simulated radical concentrations by the base model, respectively. The orange, purple, and black lines denote the simulations by the model which added the HO2 heterogeneous uptake with a different uptake coefficient. The grey areas denote nighttime.
It is noted that the estimated strong influence is speculative because of the uncertainties of measurements and simulations. Overall, the γ evaluated in this study was comparable with those observed at Mt. Tai and Mt. Mang in China and Kyoto and Yokohama in Japan.
4.4 Sources and sinks of ROx
The detailed analysis of radical sources and sinks was crucial to exploring radical chemistry. The experimental budget for HO2 and RO2 radicals could not be conducted because RO2 was not measured during this campaign. Herein, we showed the simulated results by the base model. Figure 7 illustrates the diurnal profiles of the ROx primary production rate (P(ROx)) and termination rate (L(ROx)), as well as the contributions of different channels during the daytime.
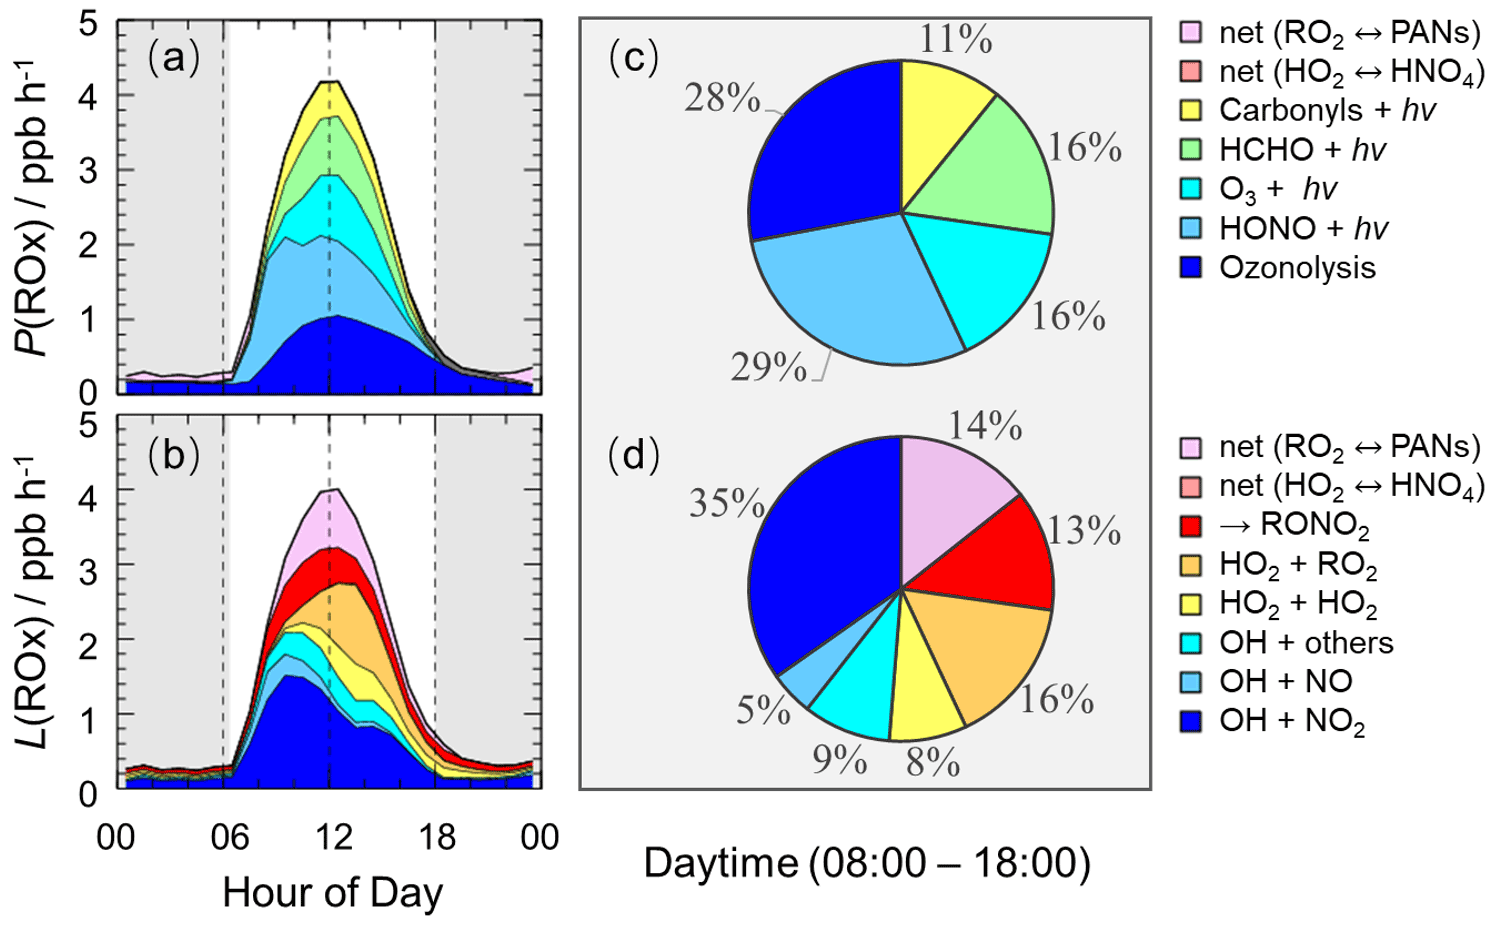
Figure 7The diurnal profiles of the ROx primary production rate (a) and termination rate (b) simulated by the base model, and the contributions of different channels to the ROx primary production rate (c) and termination rate (d) during the daytime (08:00–18:00 CST). The grey areas denote nighttime.
The ROx primary production and termination rates were basically in balance for the entire day, with maxima of 4 ppb h−1 around noontime. The ROx primary production rate was similar to those at Heshan (4 ppb h−1) and Wangdu (5 ppb h−1) sites but lower than those at the Backgarden (11 ppb h−1), Yufa (7 ppb h−1), Taizhou (7 ppb h−1), and Chengdu (7 ppb h−1) sites (Lu et al., 2013, 2012; Tan et al., 2017, 2019; Yang et al., 2021). During the daytime, the P(ROx) mainly came from the OH and HO2 primary production. HONO and O3 photolysis dominated the OH primary production, and HCHO photolysis dominated the HO2 primary production. Thus, P(ROx) was dominated by the photolysis reactions, in which the photolysis of HONO, O3, HCHO, and carbonyls accounted for 29 %, 16 %, 16 %, and 11 % during the daytime, respectively. In the early morning, HONO photolysis was the most important primary source of ROx, and the contribution of O3 photolysis became progressively larger and was largest at noontime. A large discrepancy between the ratio of the HONO photolysis rate to the O3 photolysis rate in summer/autumn and that in winter occurs generally. The vast majority of the OH photolysis source is attributed to HONO photolysis in winter because of the higher HONO concentration and lower O3 concentration. About half of L(ROx) came from OH termination, which occurred mainly in the morning, and thereafter radical self-combination gradually became the major sink of ROx in the afternoon. OH+NO2, OH+NO, and OH+ others contributed 35 %, 5 %, and 9 % to L(ROx), respectively. HO2+HO2 and HO2+RO2 accounted for 8 % and 16 % in L(ROx).
4.5 AOC evaluation
AOC controls the abundance of precursors and the production of secondary pollutants (Yang et al., 2020; Elshorbany et al., 2009), and thus it is necessary to quantify AOC for understanding photochemical pollution. The AOC has been evaluated in previous studies, as shown in Table 1. Overall, the AOC values in summer are higher than those in autumn and winter, and the values at lower latitudes are higher than those at higher latitudes for the same season. The vast majority of AOC in previous studies is evaluated based on the non-observed radical concentrations.
Table 1Summary of OH concentrations and AOC values reported in previous field campaigns.
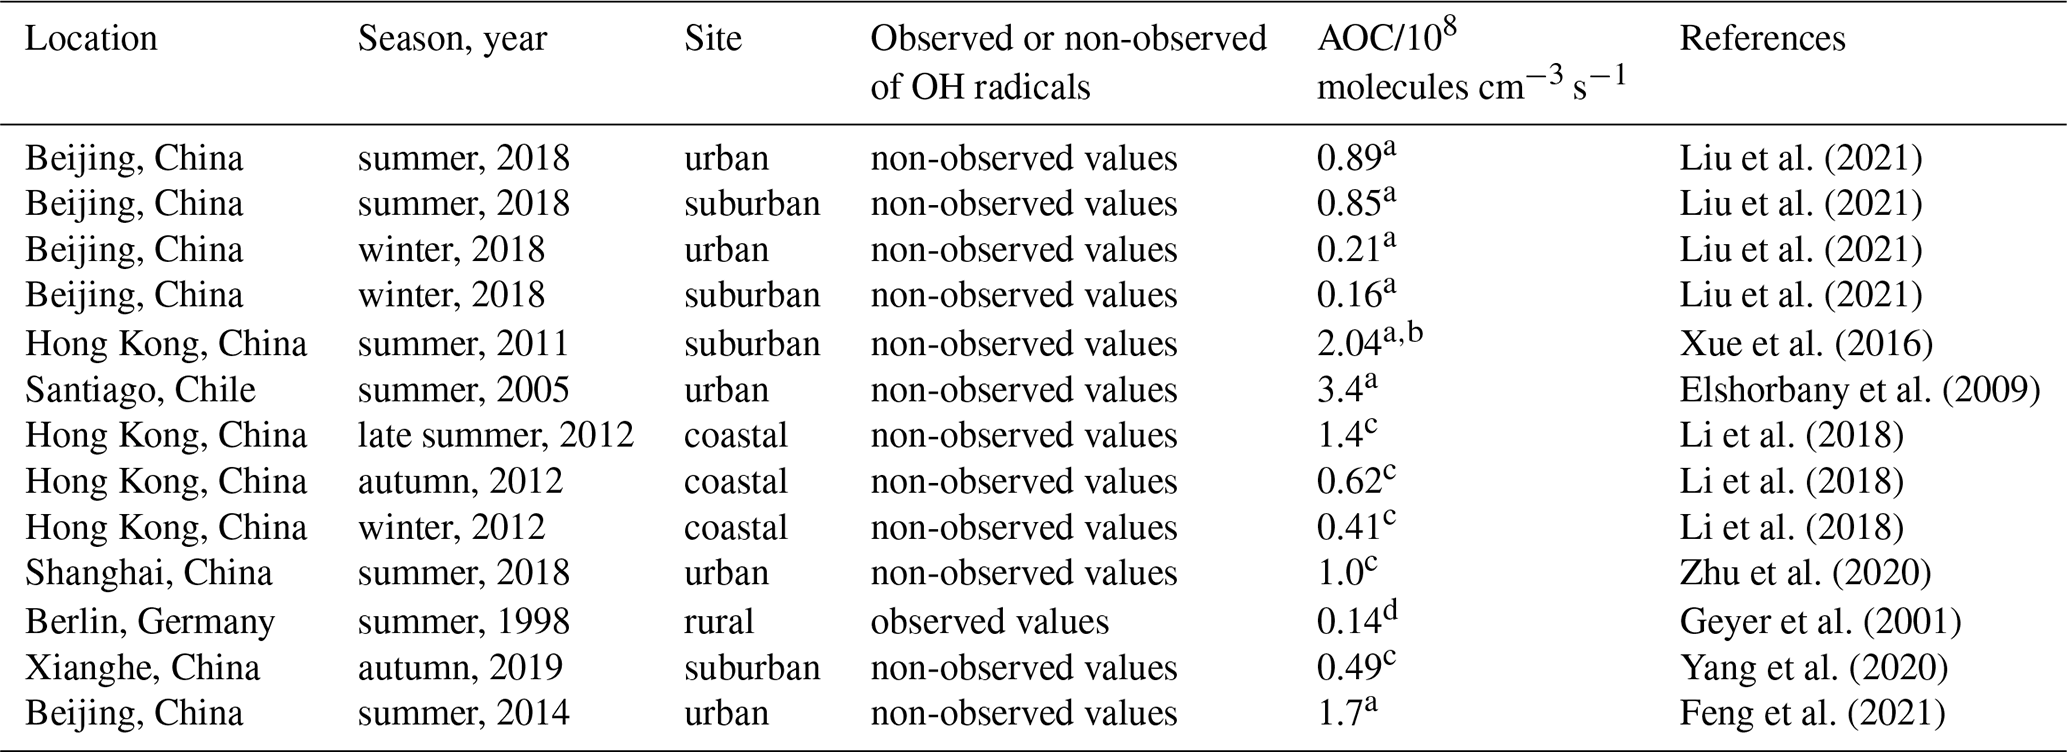
a Peak values in the diurnal profiles. b Values on 25 August 2021. c Maximum over a period of time. d Maximum on 1 d.
Herein, we explored the AOC in Shenzhen based on the observed radical concentrations for the first time. As illustrated in Fig. 8a, the diurnal profile of AOC exhibited a unimodal pattern, which was the same as the diurnal profile of OH concentration and j(NO2), with a peak around noontime. The diurnal peak of AOC was 0.75×10⁸ molecules cm−3 s−1 (11.8 ppb h−1). Comparatively, AOC in this study was comparable to those evaluated in Beijing (summer, 2018) and Hong Kong (autumn, 2012) (Li et al., 2018; Liu et al., 2021) but much lower than those evaluated in Hong Kong (summer, 2011) and Santiago (summer, 2005) (Xue et al., 2016; Elshorbany et al., 2009).

Figure 8(a) The diurnal profiles of AOC in this campaign. (b) NO dependence on P(O3)net during the daytime. (c) NO dependence on AOCVOCs during the daytime, and AOCVOCs denotes the atmospheric oxidation capacity only from the VOC oxidation. (d) NO dependence on the ratio of P(O3)net to AOCVOCs during the daytime. The box–whisker plots in panels (b)–(d) give the median, the 75th and 25th percentiles, and the 90th and 10th percentiles of P(O3)net, AOCVOCs, and the ratio of P(O3)net to AOCVOCs, respectively.
As expected, the dominant contributor to the AOC during this campaign was OH, followed by O3 and NO3. Figure S7 shows the fractional composition of the total AOC. The OH radical contributed about 95.7 % of AOC during the daytime (08:00–18:00 CST). O3, as the second important oxidant, accounted for only 2.9 % of AOC during the daytime. The contribution of NO3 to AOC during the daytime can be ignored, with a contribution of 1.4 %. At night, the contributions of O3 and NO3 to AOC were higher. OH, O3, and NO3 accounted for 75.6 %, 6.4 %, and 18 % in the first half of night (18:00–24:00 CST), and they accounted for 87.7 %, 5 %, and 7.3 % in the second half of night (00:00–08:00 CST).
As the indictor for secondary pollution, net O3 production rate, P(O3)net, can be calculated from the O3 formation rate (F(O3)) and the loss rate (L(O3)), as shown in Eqs. (5)–(7) (Tan et al., 2017). The diurnal profiles of the speciation F(O3) and L(O3) are shown in Fig. S8. The diurnal maxima of the modeled F(O3) and L(O3) were 18.9 and 2.8 ppb h−1, with the maximum P(O3)net of 16.1 ppb h−1 at around 11:00 CST. The modeled P(O3)net in this study was comparable to the net O3 production rate in Wangdu in summer (Tan et al., 2017), while the net ozone production rate in Shenzhen was much higher than the gross O3 production rate in Beijing in winter (Tan et al., 2018).
where θ is the fraction of O1D from ozone photolysis that reacts with water vapor.
Herein, we presented the NO dependence on P(O3)net, AOCVOCs, and the ratio of P(O3)net to AOCVOCs in Fig. 8b–d, in which AOCVOCs denotes the atmospheric oxidation capacity only from the VOC oxidation, which includes the channels of primary VOCs (excluding OVOCs and mainly alkanes, alkenes, aromatics, and isoprene) with OH radicals. An upward trend of P(O3)net was presented with the increase in NO concentration when NO concentration was below 1 ppb, while P(O3)net decreased with the increase in NO concentration because NO2 became the sink of OH radicals gradually when NO concentration was above 1 ppb. In terms of the NO dependence on AOCVOCs, no significant variation was found, indicating VOC oxidation was weakly impacted by NO concentrations in this campaign. Since AOCVOCs can represent the VOC oxidant rate, the ratio of P(O3)net to AOCVOCs can thus reflect the yield of net ozone production from VOC oxidation. Similar to P(O3)net, the ratios increased with the increase in NO concentration when NO concentration was below 1 ppb, while the ratios decreased with the increase in NO concentration when NO concentration was above 1 ppb, indicating the yield of net O3 production from VOC oxidation would be lower within the low-NO regime (<1 ppb) and the high-NO regime (>1 ppb). The median ratios ranged from 1.0 to 4.5, and the maximum of the median ratios existed when NO concentration was approximately 1 ppb, with a value of approximately 4.5. The nonlinear response of the yield of net ozone production to NO indicated that it is necessary to optimize the NOx and VOC control strategies for the reduction of O3 pollution effectively.
The STORM field campaign was carried out at the Shenzhen site in the autumn of 2018, providing the continuous OH and HO observations in PRD since the Heshan campaign in 2014. The maximum diurnal OH and HO concentrations, which were measured by the PKU-LIF system, were 4.5×10⁶ and 4.2×108 cm−3, respectively. The observed OH concentration was equal to that measured at the Heshan site (autumn campaign) but was lower than those measured in the summer campaigns in China (Backgarden, Yufa, Wangdu, Taizhou, and Chengdu sites). The observed HO concentrations, which included the true HO2 concentrations and an interference from RO2 radicals, were much lower than those at the Backgarden and Yufa sites in China.
The base model (RACM2-LIM1) could reproduce the observed OH concentration before 10:00 CST, and thereafter OH was underestimated by the model when NO concentration dropped to low levels. The results of the radical experimental budget indicated that OH underestimation was likely attributable to an unknown missing OH source at the low-NO regime. We diagnosed the missing OH source by sensitivity runs, and unclassical OH recycling was identified again in this study. Good agreement between the modeled and observed OH concentrations was achieved when a constant mixing ratio of the numerical species X, equivalent to 0.1 ppb NO, was added into the base model. Additionally, we found isoprene and OVOCs might closely influence the missing OH sources by comparing the composition of VOC reactivity under the different NO intervals. The isoprene isomerization mechanism (LIM1) can explain approximately 7 % of the missing OH production rate, and no significant contribution of MACR and MVK oxidation was found. As another potential OH source, OVOC species should be further explored to explain the remaining missing OH sources. As for HO2 radicals, the overestimation of HO concentration was found, indicating that HO2 heterogeneous uptake with the effective uptake coefficient of 0.3 might play a significant role in HO2 sinks. Good agreements of OH observations–simulations and HO observations–simulations were both achieved when the amount of X changed from 0.1 to 0.25 ppb and the HO2 effective uptake coefficient was 0.3.
The quantification of production and destruction channels of ROx radicals is essential to explore the chemical processes of radicals. The ROx primary production and termination rates were balanced for the entire day, with maxima of 4 ppb h−1, similar to those at the Heshan and Wangdu sites. Photolysis channels dominated the ROx primary production rate, and the HONO, O3, HCHO, and carbonyls photolysis accounted for 29 %, 16 %, 16 %, and 11 % during the daytime, respectively. The highest fraction of the ROx termination rate came from the reaction of OH+NO2 in the morning. The radical self-combination gradually became the major sink of ROx in the afternoon with the decreasing of NO concentrations. The reaction of OH+NO2 and radical self-combination accounted for 35 % and 24 % during the daytime, respectively.
In this campaign, AOC exhibited well-defined diurnal patterns, with a peak of 11.8 ppb h−1. As expected, OH radicals, which were the dominant oxidant, accounted for 95.7 % of the total AOC during the daytime. O3 and NO3 contributed 2.9 % and 1.4 % to total AOC during the daytime, respectively. The ratio of P(O3)net to AOCVOCs, which denotes the yield of net ozone production from VOC oxidation, trended to increase and then decrease as NO concentration increased, with a range of 1.0–4.5. Optimizing the NOx and VOC control strategies might be significant to realize the reduction of ozone concentrations based on the nonlinear relationship between the yield of net ozone production from VOC oxidation and NO concentrations.
The data used in this study are available from the corresponding author upon request (k.lu@pku.edu.cn).
The supplement related to this article is available online at: https://doi.org/10.5194/acp-22-12525-2022-supplement.
YZ and KL conceived the study. XY analyzed the data and wrote the manuscript with inputs from KL. XY, XM, and YG contributed to the measurements of the HOx concentrations. All authors contributed to the discussed results and commented on the manuscript.
The contact author has declared that none of the authors has any competing interests.
Publisher’s note: Copernicus Publications remains neutral with regard to jurisdictional claims in published maps and institutional affiliations.
The authors thank the science teams of the STORM-2018 campaign.
This research has been supported by the Beijing Municipal Natural Science Foundation (grant no. JQ19031), the National Key Basic Research Program For Youth (grant no. 2019YFC0214800), and the National Natural Science Foundation of China (grant nos. 91544225, 21522701, and 91844301).
This paper was edited by Lisa Whalley and reviewed by three anonymous referees.
Berndt, T., Chen, J., Kjaergaard, E. R., Moller, K. H., Tilgner, A., Hoffmann, E. H., Herrmann, H., Crounse, J. D., Wennberg, P. O., and Kjaergaard, H. G.: Hydrotrioxide (ROOOH) formation in the atmosphere, Science, 376, 979–982, https://doi.org/10.1126/science.abn6012, 2022.
Brocco, D., Fratarcangeli, R., Lepore, L., Petricca, M., and Ventrone, I.: Determination of aromatic hydrocarbons in urban air of Rome, Atmos. Environ., 31, 557–566, https://doi.org/10.1016/s1352-2310(96)00226-9, 1997.
Chen, X., Wang, H., Liu, Y., Su, R., Wang, H., Lou, S., and Lu, K.: Spatial characteristics of the nighttime oxidation capacity in the Yangtze River Delta, China, Atmos. Environ., 208, 150–157, https://doi.org/10.1016/j.atmosenv.2019.04.012, 2019.
Ehhalt, D. H.: Photooxidation of trace gases in the troposphere, Phys. Chem. Chem. Phys., 1, 5401–5408, https://doi.org/10.1039/a905097c, 1999.
Elshorbany, Y. F., Kurtenbach, R., Wiesen, P., Lissi, E., Rubio, M., Villena, G., Gramsch, E., Rickard, A. R., Pilling, M. J., and Kleffmann, J.: Oxidation capacity of the city air of Santiago, Chile, Atmos. Chem. Phys., 9, 2257–2273, https://doi.org/10.5194/acp-9-2257-2009, 2009.
Fan, S., Wang, A., Fan, Q., Liu, J., and Wang, B.: ATMOSPHERIC BOUNDARY LAYER CONCEPT MODEL OF THE PEARL RIVER DELTA AND ITS APPLICATION, Journal of Tropical Meteorology, 21, 286–292, 2005.
Feng, T., Zhao, S. Y., Hu, B., Bei, N. F., Zhang, X., Wu, J. R., Li, X., Liu, L., Wang, R. N., Tie, X. X., and Li, G. H.: Assessment of Atmospheric Oxidizing Capacity Over the Beijing-Tianjin-Hebei (BTH) Area, China, J. Geophys. Res.-Atmos., 126, e2020JD033834, https://doi.org/10.1029/2020jd033834, 2021.
Fittschen, C.: The reaction of peroxy radicals with OH radicals, Chem. Phys. Lett., 725, 102–108, https://doi.org/10.1016/j.cplett.2019.04.002, 2019.
Fittschen, C., Al Ajami, M., Batut, S., Ferracci, V., Archer-Nicholls, S., Archibald, A. T., and Schoemaecker, C.: ROOOH: a missing piece of the puzzle for OH measurements in low-NO environments?, Atmos. Chem. Phys., 19, 349–362, https://doi.org/10.5194/acp-19-349-2019, 2019.
Fuchs, H., Holland, F., and Hofzumahaus, A.: Measurement of tropospheric RO2 and HO2 radicals by a laser-induced fluorescence instrument, Rev. Sci. Instrum., 79, 084104, https://doi.org/10.1063/1.2968712, 2008.
Fuchs, H., Bohn, B., Hofzumahaus, A., Holland, F., Lu, K. D., Nehr, S., Rohrer, F., and Wahner, A.: Detection of HO2 by laser-induced fluorescence: calibration and interferences from RO2 radicals, Atmos. Meas. Tech., 4, 1209–1225, https://doi.org/10.5194/amt-4-1209-2011, 2011.
Fuchs, H., Acir, I.-H., Bohn, B., Brauers, T., Dorn, H.-P., Häseler, R., Hofzumahaus, A., Holland, F., Kaminski, M., Li, X., Lu, K., Lutz, A., Nehr, S., Rohrer, F., Tillmann, R., Wegener, R., and Wahner, A.: OH regeneration from methacrolein oxidation investigated in the atmosphere simulation chamber SAPHIR, Atmos. Chem. Phys., 14, 7895–7908, https://doi.org/10.5194/acp-14-7895-2014, 2014.
Fuchs, H., Tan, Z., Hofzumahaus, A., Broch, S., Dorn, H.-P., Holland, F., Künstler, C., Gomm, S., Rohrer, F., Schrade, S., Tillmann, R., and Wahner, A.: Investigation of potential interferences in the detection of atmospheric ROx radicals by laser-induced fluorescence under dark conditions, Atmos. Meas. Tech., 9, 1431–1447, https://doi.org/10.5194/amt-9-1431-2016, 2016.
Fuchs, H., Tan, Z., Lu, K., Bohn, B., Broch, S., Brown, S. S., Dong, H., Gomm, S., Häseler, R., He, L., Hofzumahaus, A., Holland, F., Li, X., Liu, Y., Lu, S., Min, K.-E., Rohrer, F., Shao, M., Wang, B., Wang, M., Wu, Y., Zeng, L., Zhang, Y., Wahner, A., and Zhang, Y.: OH reactivity at a rural site (Wangdu) in the North China Plain: contributions from OH reactants and experimental OH budget, Atmos. Chem. Phys., 17, 645–661, https://doi.org/10.5194/acp-17-645-2017, 2017.
Fuchs, H., Albrecht, S., Acir, I., Bohn, B., Breitenlechner, M., Dorn, H.-P., Gkatzelis, G. I., Hofzumahaus, A., Holland, F., Kaminski, M., Keutsch, F. N., Novelli, A., Reimer, D., Rohrer, F., Tillmann, R., Vereecken, L., Wegener, R., Zaytsev, A., Kiendler-Scharr, A., and Wahner, A.: Investigation of the oxidation of methyl vinyl ketone (MVK) by OH radicals in the atmospheric simulation chamber SAPHIR, Atmos. Chem. Phys., 18, 8001–8016, https://doi.org/10.5194/acp-18-8001-2018, 2018.
Gao, M., Li, H., Li, Y., Wei, J., Sun, Y., He, L., and Huang, X.: Source characteristics of water-soluble organic matters in PM2.5 in the winter of Shenzhen, China Environmental Science, 38, 4017–4022, 2018.
Geyer, A., Alicke, B., Konrad, S., Schmitz, T., Stutz, J., and Platt, U.: Chemistry and oxidation capacity of the nitrate radical in the continental boundary layer near Berlin, J. Geophys. Res.-Atmos., 106, 8013–8025, https://doi.org/10.1029/2000jd900681, 2001.
Heard, D. E. and Pilling, M. J.: Measurement of OH and HO2 in the troposphere, Chem. Rev., 103, 5163–5198, https://doi.org/10.1021/cr020522s, 2003.
Hofzumahaus, A., Aschmutat, U., Hessling, M., Holland, F., and Ehhalt, D. H.: The measurement of tropospheric OH radicals by laser-induced fluorescence spectroscopy during the POPCORN field campaign, Geophys. Res. Lett., 23, 2541–2544, https://doi.org/10.1029/96GL02205, 1996.
Hofzumahaus, A., Rohrer, F., Lu, K., Bohn, B., Brauers, T., Chang, C.-C., Fuchs, H., Holland, F., Kita, K., Kondo, Y., Li, X., Lou, S., Shao, M., Zeng, L., Wahner, A., and Zhang, Y.: Amplified Trace Gas Removal in the Troposphere, Science, 324, 1702–1704, https://doi.org/10.1126/science.1164566, 2009.
Holland, F., Hessling, M., and Hofzumahaus, A.: In Situ Measurement of Tropospheric OH Radicals by Laser-Induced Fluorescence – A Description of the KFA Instrument, J. Atmos. Sci., 52, 3393–3401, https://doi.org/10.1175/1520-0469(1995)052<3393:Ismoto>2.0.Co;2, 1995.
Huang, X.-F., Chen, D.-L., Lan, Z.-J., Feng, N., He, L.-Y., Yu, G.-H., and Luan, S.-J.: Characterization of organic aerosol in fine particles in a mega-city of South China: Molecular composition, seasonal variation, and size distribution, Atmos. Res., 114–115, 28–37, https://doi.org/10.1016/j.atmosres.2012.05.019, 2012a.
Huang, X.-F., Sun, T.-L., Zeng, L.-W., Yu, G.-H., and Luan, S.-J.: Black carbon aerosol characterization in a coastal city in South China using a single particle soot photometer, Atmos. Environ., 51, 21–28, https://doi.org/10.1016/j.atmosenv.2012.01.056, 2012b.
Jones, C. E., Hopkins, J. R., and Lewis, A. C.: In situ measurements of isoprene and monoterpenes within a south-east Asian tropical rainforest, Atmos. Chem. Phys., 11, 6971–6984, https://doi.org/10.5194/acp-11-6971-2011, 2011.
Kanaya, Y., Sadanaga, Y., Matsumoto, J., Sharma, U. K., Hirokawa, J., Kajii, Y., and Akimoto, H.: Daytime HO2 concentrations at Oki Island, Japan, in summer 1998: Comparison between measurement and theory, J. Geophys. Res.-Atmos., 105, 24205–24222, https://doi.org/10.1029/2000JD900308, 2000.
Kanaya, Y., Cao, R., Kato, S., Miyakawa, Y., Kajii, Y., Tanimoto, H., Yokouchi, Y., Mochida, M., Kawamura, K., and Akimoto, H.: Chemistry of OH and HO2 radicals observed at Rishiri Island, Japan, in September 2003: Missing daytime sink of HO2 and positive nighttime correlations with monoterpenes, J. Geophys. Res.-Atmos., 112, D11308, https://doi.org/10.1029/2006jd007987, 2007.
Lelieveld, J., Butler, T. M., Crowley, J. N., Dillon, T. J., Fischer, H., Ganzeveld, L., Harder, H., Lawrence, M. G., Martinez, M., Taraborrelli, D., and Williams, J.: Atmospheric oxidation capacity sustained by a tropical forest, Nature, 452, 737–740, https://doi.org/10.1038/nature06870, 2008.
Levy II, H.: Normal Atmosphere: Large Radical and Formaldehyde Concentrations Predicted, Science, 173, 141–143, https://doi.org/10.1126/science.173.3992.141, 1971.
Li, K., Jacob, D. J., Liao, H., Shen, L., Zhang, Q., and Bates, K. H.: Anthropogenic drivers of 2013–2017 trends in summer surface ozone in China, P. Natl. Acad. Sci. USA, 116, 422–427, https://doi.org/10.1073/pnas.1812168116, 2019.
Li, Z., Xue, L., Yang, X., Zha, Q., Tham, Y. J., Yan, C., Louie, P. K. K., Luk, C. W. Y., Wang, T., and Wang, W.: Oxidizing capacity of the rural atmosphere in Hong Kong, Southern China, Sci. Total Environ., 612, 1114–1122, https://doi.org/10.1016/j.scitotenv.2017.08.310, 2018.
Liu, S., Li, X., Shen, X., Zeng, L., Huang, X., Zhu, B., Lin, L., and Lou, S.: Measurement and partition analysis of atmospheric OH reactivity in autumn in Shenzhen, Acta Scientiae Circumstantiae, 39, 3600–3610, 2019.
Liu, Z., Wang, Y., Hu, B., Lu, K., Tang, G., Ji, D., Yang, X., Gao, W., Xie, Y., Liu, J., Yao, D., Yang, Y., and Zhang, Y.: Elucidating the quantitative characterization of atmospheric oxidation capacity in Beijing, China, Sci. Total Environ., 771, 145306, https://doi.org/10.1016/j.scitotenv.2021.145306, 2021.
Lou, S., Holland, F., Rohrer, F., Lu, K., Bohn, B., Brauers, T., Chang, C. C., Fuchs, H., Häseler, R., Kita, K., Kondo, Y., Li, X., Shao, M., Zeng, L., Wahner, A., Zhang, Y., Wang, W., and Hofzumahaus, A.: Atmospheric OH reactivities in the Pearl River Delta – China in summer 2006: measurement and model results, Atmos. Chem. Phys., 10, 11243–11260, https://doi.org/10.5194/acp-10-11243-2010, 2010.
Lu, K., Guo, S., Tan, Z., Wang, H., Shang, D., Liu, Y., Li, X., Wu, Z., Hu, M., and Zhang, Y.: Exploring atmospheric free-radical chemistry in China: the self-cleansing capacity and the formation of secondary air pollution, Natl. Sci. Rev., 6, 579–594, https://doi.org/10.1093/nsr/nwy073, 2019.
Lu, K. D., Rohrer, F., Holland, F., Fuchs, H., Bohn, B., Brauers, T., Chang, C. C., Häseler, R., Hu, M., Kita, K., Kondo, Y., Li, X., Lou, S. R., Nehr, S., Shao, M., Zeng, L. M., Wahner, A., Zhang, Y. H., and Hofzumahaus, A.: Observation and modelling of OH and HO2 concentrations in the Pearl River Delta 2006: a missing OH source in a VOC rich atmosphere, Atmos. Chem. Phys., 12, 1541–1569, https://doi.org/10.5194/acp-12-1541-2012, 2012.
Lu, K. D., Hofzumahaus, A., Holland, F., Bohn, B., Brauers, T., Fuchs, H., Hu, M., Häseler, R., Kita, K., Kondo, Y., Li, X., Lou, S. R., Oebel, A., Shao, M., Zeng, L. M., Wahner, A., Zhu, T., Zhang, Y. H., and Rohrer, F.: Missing OH source in a suburban environment near Beijing: observed and modelled OH and HO2 concentrations in summer 2006, Atmos. Chem. Phys., 13, 1057–1080, https://doi.org/10.5194/acp-13-1057-2013, 2013.
Ma, X., Tan, Z., Lu, K., Yang, X., Liu, Y., Li, S., Li, X., Chen, S., Novelli, A., Cho, C., Zeng, L., Wahner, A., and Zhang, Y.: Winter photochemistry in Beijing: Observation and model simulation of OH and HO2 radicals at an urban site, Sci. Total Environ., 685, 85–95, https://doi.org/10.1016/j.scitotenv.2019.05.329, 2019a.
Ma, X., Jia, H. L., Sha, T., An, J. L., and Tian, R.: Spatial and seasonal characteristics of particulate matter and gaseous pollution in China: Implications for control policy, Environ. Pollut., 248, 421–428, https://doi.org/10.1016/j.envpol.2019.02.038, 2019b.
Ma, X., Tan, Z., Lu, K., Yang, X., Chen, X., Wang, H., Chen, S., Fang, X., Li, S., Li, X., Liu, J., Liu, Y., Lou, S., Qiu, W., Wang, H., Zeng, L., and Zhang, Y.: OH and HO2 radical chemistry at a suburban site during the EXPLORE-YRD campaign in 2018, Atmos. Chem. Phys., 22, 7005–7028, https://doi.org/10.5194/acp-22-7005-2022, 2022.
Mao, J., Jacob, D. J., Evans, M. J., Olson, J. R., Ren, X., Brune, W. H., Clair, J. M. St., Crounse, J. D., Spencer, K. M., Beaver, M. R., Wennberg, P. O., Cubison, M. J., Jimenez, J. L., Fried, A., Weibring, P., Walega, J. G., Hall, S. R., Weinheimer, A. J., Cohen, R. C., Chen, G., Crawford, J. H., McNaughton, C., Clarke, A. D., Jaeglé, L., Fisher, J. A., Yantosca, R. M., Le Sager, P., and Carouge, C.: Chemistry of hydrogen oxide radicals (HOx) in the Arctic troposphere in spring, Atmos. Chem. Phys., 10, 5823–5838, https://doi.org/10.5194/acp-10-5823-2010, 2010.
Mao, J., Ren, X., Zhang, L., Van Duin, D. M., Cohen, R. C., Park, J.-H., Goldstein, A. H., Paulot, F., Beaver, M. R., Crounse, J. D., Wennberg, P. O., DiGangi, J. P., Henry, S. B., Keutsch, F. N., Park, C., Schade, G. W., Wolfe, G. M., Thornton, J. A., and Brune, W. H.: Insights into hydroxyl measurements and atmospheric oxidation in a California forest, Atmos. Chem. Phys., 12, 8009–8020, https://doi.org/10.5194/acp-12-8009-2012, 2012.
Novelli, A., Hens, K., Tatum Ernest, C., Kubistin, D., Regelin, E., Elste, T., Plass-Dülmer, C., Martinez, M., Lelieveld, J., and Harder, H.: Characterisation of an inlet pre-injector laser-induced fluorescence instrument for the measurement of atmospheric hydroxyl radicals, Atmos. Meas. Tech., 7, 3413–3430, https://doi.org/10.5194/amt-7-3413-2014, 2014.
Peeters, J. and Muller, J.-F.: HOx radical regeneration in isoprene oxidation via peroxy radical isomerisations. II: experimental evidence and global impact, Phys. Chem. Chem. Phys., 12, 14227–14235, https://doi.org/10.1039/c0cp00811g, 2010.
Peeters, J., Nguyen, T. L., and Vereecken, L.: HOx radical regeneration in the oxidation of isoprene, Phys. Chem. Chem. Phys., 11, 5935–5939, https://doi.org/10.1039/b908511d, 2009.
Peeters, J., Muller, J.-F., Stavrakou, T., and Vinh Son, N.: Hydroxyl Radical Recycling in Isoprene Oxidation Driven by Hydrogen Bonding and Hydrogen Tunneling: The Upgraded LIM1 Mechanism, J. Phys. Chem. A, 118, 8625–8643, https://doi.org/10.1021/jp5033146, 2014.
Ren, X., Olson, J. R., Crawford, J. H., Brune, W. H., Mao, J., Long, R. B., Chen, Z., Chen, G., Avery, M. A., Sachse, G. W., Barrick, J. D., Diskin, G. S., Huey, L. G., Fried, A., Cohen, R. C., Heikes, B., Wennberg, P. O., Singh, H. B., Blake, D. R., and Shetter, R. E.: HOx chemistry during INTEX-A 2004: Observation, model calculation, and comparison with previous studies, J. Geophys. Res.-Atmos., 113, D05310, https://doi.org/10.1029/2007jd009166, 2008.
Shu, L., Wang, T. J., Han, H., Xie, M., Chen, P. L., Li, M. M., and Wu, H.: Summertime ozone pollution in the Yangtze River Delta of eastern China during 2013–2017: Synoptic impacts and source apportionment, Environ. Pollut., 257, 113631, https://doi.org/10.1016/j.envpol.2019.113631, 2020.
Song, H., Zou, Q., and Lu, K.: Parameterization and Application of Hydroperoxyl Radicals(HO2) Heterogeneous Uptake Coefficient, Prog. Chem., 33, 1161–1173, https://doi.org/10.7536/pc200749, 2021.
Song, H., Lu, K., Dong, H., Tan, Z., Chen, S., Zeng, L., and Zhang, Y.: Reduced Aerosol Uptake of Hydroperoxyl Radical May Increase the Sensitivity of Ozone Production to Volatile Organic Compounds, Environ. Sci. Technol. Lett., 9, 22–29, https://doi.org/10.1021/acs.estlett.1c00893, 2022.
Stevens, P. S., Mather, J. H., Brune, W. H., Eisele, F., Tanner, D., Jefferson, A., Cantrell, C., Shetter, R., Sewall, S., Fried, A., Henry, B., Williams, E., Baumann, K., Goldan, P., and Kuster, W.: HOOH and ROHO2 ratios during the Tropospheric OH Photochemistry Experiment: Measurement and theory, J. Geophys. Res.-Atmos., 102, 6379–6391, https://doi.org/10.1029/96jd01704, 1997.
Stone, D., Whalley, L. K., and Heard, D. E.: Tropospheric OH and HO2 radicals: field measurements and model comparisons, Chem. Soc. Rev., 41, 6348–6404, https://doi.org/10.1039/c2cs35140d, 2012.
Stone, D., Evans, M. J., Walker, H., Ingham, T., Vaughan, S., Ouyang, B., Kennedy, O. J., McLeod, M. W., Jones, R. L., Hopkins, J., Punjabi, S., Lidster, R., Hamilton, J. F., Lee, J. D., Lewis, A. C., Carpenter, L. J., Forster, G., Oram, D. E., Reeves, C. E., Bauguitte, S., Morgan, W., Coe, H., Aruffo, E., Dari-Salisburgo, C., Giammaria, F., Di Carlo, P., and Heard, D. E.: Radical chemistry at night: comparisons between observed and modelled HOx, NO3 and N2O5 during the RONOCO project, Atmos. Chem. Phys., 14, 1299–1321, https://doi.org/10.5194/acp-14-1299-2014, 2014.
Taketani, F., Kanaya, Y., Pochanart, P., Liu, Y., Li, J., Okuzawa, K., Kawamura, K., Wang, Z., and Akimoto, H.: Measurement of overall uptake coefficients for HO2 radicals by aerosol particles sampled from ambient air at Mts. Tai and Mang (China), Atmos. Chem. Phys., 12, 11907–11916, https://doi.org/10.5194/acp-12-11907-2012, 2012.
Tan, Z., Fuchs, H., Lu, K., Hofzumahaus, A., Bohn, B., Broch, S., Dong, H., Gomm, S., Häseler, R., He, L., Holland, F., Li, X., Liu, Y., Lu, S., Rohrer, F., Shao, M., Wang, B., Wang, M., Wu, Y., Zeng, L., Zhang, Y., Wahner, A., and Zhang, Y.: Radical chemistry at a rural site (Wangdu) in the North China Plain: observation and model calculations of OH, HO2 and RO2 radicals, Atmos. Chem. Phys., 17, 663–690, https://doi.org/10.5194/acp-17-663-2017, 2017.
Tan, Z., Rohrer, F., Lu, K., Ma, X., Bohn, B., Broch, S., Dong, H., Fuchs, H., Gkatzelis, G. I., Hofzumahaus, A., Holland, F., Li, X., Liu, Y., Liu, Y., Novelli, A., Shao, M., Wang, H., Wu, Y., Zeng, L., Hu, M., Kiendler-Scharr, A., Wahner, A., and Zhang, Y.: Wintertime photochemistry in Beijing: observations of ROx radical concentrations in the North China Plain during the BEST-ONE campaign, Atmos. Chem. Phys., 18, 12391–12411, https://doi.org/10.5194/acp-18-12391-2018, 2018.
Tan, Z., Lu, K., Hofzumahaus, A., Fuchs, H., Bohn, B., Holland, F., Liu, Y., Rohrer, F., Shao, M., Sun, K., Wu, Y., Zeng, L., Zhang, Y., Zou, Q., Kiendler-Scharr, A., Wahner, A., and Zhang, Y.: Experimental budgets of OH, HO2, and RO2 radicals and implications for ozone formation in the Pearl River Delta in China 2014, Atmos. Chem. Phys., 19, 7129–7150, https://doi.org/10.5194/acp-19-7129-2019, 2019.
Tan, Z., Hofzumahaus, A., Lu, K., Brown, S. S., Holland, F., Huey, L. G., Kiendler-Scharr, A., Li, X., Liu, X., Ma, N., Min, K.-E., Rohrer, F., Shao, M., Wahner, A., Wang, Y., Wiedensohler, A., Wu, Y., Wu, Z., Zeng, L., Zhang, Y., and Fuchs, H.: No Evidence for a Significant Impact of Heterogeneous Chemistry on Radical Concentrations in the North China Plain in Summer 2014, Environ. Sci. Technol., 54, 5973–5979, https://doi.org/10.1021/acs.est.0c00525, 2020.
Tan, Z., Ma, X., Lu, K., Jiang, M., Zou, Q., Wang, H., Zeng, L., and Zhang, Y.: Direct evidence of local photochemical production driven ozone episode in Beijing: A case study, Sci. Total Environ., 800, 148868, https://doi.org/10.1016/j.scitotenv.2021.148868, 2021.
Wang, T., Xue, L. K., Brimblecombe, P., Lam, Y. F., Li, L., and Zhang, L.: Ozone pollution in China: A review of concentrations, meteorological influences, chemical precursors, and effects, Sci. Total Environ., 575, 1582–1596, https://doi.org/10.1016/j.scitotenv.2016.10.081, 2017.
Wang, W., Parrish, D. D., Li, X., Shao, M., Liu, Y., Mo, Z., Lu, S., Hu, M., Fang, X., Wu, Y., Zeng, L., and Zhang, Y.: Exploring the drivers of the increased ozone production in Beijing in summertime during 2005–2016, Atmos. Chem. Phys., 20, 15617–15633, https://doi.org/10.5194/acp-20-15617-2020, 2020.
Wang, X., Wang, H., Xue, L., Wang, T., Wang, L., Gu, R., Wang, W., Tham, Y. J., Wang, Z., Yang, L., Chen, J., and Wang, W.: Observations of N2O5 and ClNO2 at a polluted urban surface site in North China: High N2O5 uptake coefficients and low ClNO2 product yields, Atmos. Environ., 156, 125–134, https://doi.org/10.1016/j.atmosenv.2017.02.035, 2017.
Whalley, L. K., Edwards, P. M., Furneaux, K. L., Goddard, A., Ingham, T., Evans, M. J., Stone, D., Hopkins, J. R., Jones, C. E., Karunaharan, A., Lee, J. D., Lewis, A. C., Monks, P. S., Moller, S. J., and Heard, D. E.: Quantifying the magnitude of a missing hydroxyl radical source in a tropical rainforest, Atmos. Chem. Phys., 11, 7223–7233, https://doi.org/10.5194/acp-11-7223-2011, 2011.
Whalley, L. K., Stone, D., George, I. J., Mertes, S., van Pinxteren, D., Tilgner, A., Herrmann, H., Evans, M. J., and Heard, D. E.: The influence of clouds on radical concentrations: observations and modelling studies of HOx during the Hill Cap Cloud Thuringia (HCCT) campaign in 2010, Atmos. Chem. Phys., 15, 3289–3301, https://doi.org/10.5194/acp-15-3289-2015, 2015.
Whalley, L. K., Slater, E. J., Woodward-Massey, R., Ye, C., Lee, J. D., Squires, F., Hopkins, J. R., Dunmore, R. E., Shaw, M., Hamilton, J. F., Lewis, A. C., Mehra, A., Worrall, S. D., Bacak, A., Bannan, T. J., Coe, H., Percival, C. J., Ouyang, B., Jones, R. L., Crilley, L. R., Kramer, L. J., Bloss, W. J., Vu, T., Kotthaus, S., Grimmond, S., Sun, Y., Xu, W., Yue, S., Ren, L., Acton, W. J. F., Hewitt, C. N., Wang, X., Fu, P., and Heard, D. E.: Evaluating the sensitivity of radical chemistry and ozone formation to ambient VOCs and NOx in Beijing, Atmos. Chem. Phys., 21, 2125–2147, https://doi.org/10.5194/acp-21-2125-2021, 2021.
Xue, L., Gu, R., Wang, T., Wang, X., Saunders, S., Blake, D., Louie, P. K. K., Luk, C. W. Y., Simpson, I., Xu, Z., Wang, Z., Gao, Y., Lee, S., Mellouki, A., and Wang, W.: Oxidative capacity and radical chemistry in the polluted atmosphere of Hong Kong and Pearl River Delta region: analysis of a severe photochemical smog episode, Atmos. Chem. Phys., 16, 9891–9903, https://doi.org/10.5194/acp-16-9891-2016, 2016.
Yang, X., Wang, H., Tan, Z., Lu, K., and Zhang, Y.: Observations of OH Radical Reactivity in Field Studies, Acta Chim. Sinica, 77, 613–624, https://doi.org/10.6023/a19030094, 2019.
Yang, X., Lu, K., Ma, X., Liu, Y., Wang, H., Hu, R., Li, X., Lou, S., Chen, S., Dong, H., Wang, F., Wang, Y., Zhang, G., Li, S., Yang, S., Yang, Y., Kuang, C., Tan, Z., Chen, X., Qiu, P., Zeng, L., Xie, P., and Zhang, Y.: Observations and modeling of OH and HO2 radicals in Chengdu, China in summer 2019, Science Total Environ., 772, 144829–144829, https://doi.org/10.1016/j.scitotenv.2020.144829, 2021.
Yang, Y., Wang, Y., Yao, D., Zhao, S., Yang, S., Ji, D., Sun, J., Wang, Y., Liu, Z., Hu, B., Zhang, R., and Wang, Y.: Significant decreases in the volatile organic compound concentration, atmospheric oxidation capacity and photochemical reactivity during the National Day holiday over a suburban site in the North China Plain, Environ. Pollut., 263, 114657, https://doi.org/10.1016/j.envpol.2020.114657, 2020.
Yu, D., Tan, Z., Lu, K., Ma, X., Li, X., Chen, S., Zhu, B., Lin, L., Li, Y., Qiu, P., Yang, X., Liu, Y., Wang, H., He, L., Huang, X., and Zhang, Y.: An explicit study of local ozone budget and NOx-VOCs sensitivity in Shenzhen China, Atmos. Environ., 224, 117304, https://doi.org/10.1016/j.atmosenv.2020.117304, 2020.
Zhang, Y. H., Hu, M., Zhong, L. J., Wiedensohler, A., Liu, S. C., Andreae, M. O., Wang, W., and Fan, S. J.: Regional Integrated Experiments on Air Quality over Pearl River Delta 2004 (PRIDE-PRD2004): Overview, Atmos. Environ., 42, 6157–6173, https://doi.org/10.1016/j.atmosenv.2008.03.025, 2008.
Zhou, J., Murano, K., Kohno, N., Sakamoto, Y., and Kajii, Y.: Real-time quantification of the total HO2 reactivity of ambient air and HO2 uptake kinetics onto ambient aerosols in Kyoto (Japan), Atmospheric Environment, 223, 117189, https://doi.org/10.1016/j.atmosenv.2019.117189, 2020.
Zhou, J., Sato, K., Bai, Y., Fukusaki, Y., Kousa, Y., Ramasamy, S., Takami, A., Yoshino, A., Nakayama, T., Sadanaga, Y., Nakashima, Y., Li, J., Murano, K., Kohno, N., Sakamoto, Y., and Kajii, Y.: Kinetics and impacting factors of HO2 uptake onto submicron atmospheric aerosols during the 2019 Air QUAlity Study (AQUAS) in Yokohama, Japan, Atmos. Chem. Phys., 21, 12243–12260, https://doi.org/10.5194/acp-21-12243-2021, 2021.
Zhu, J., Wang, S., Wang, H., Jing, S., Lou, S., Saiz-Lopez, A., and Zhou, B.: Observationally constrained modeling of atmospheric oxidation capacity and photochemical reactivity in Shanghai, China, Atmos. Chem. Phys., 20, 1217–1232, https://doi.org/10.5194/acp-20-1217-2020, 2020.