the Creative Commons Attribution 4.0 License.
the Creative Commons Attribution 4.0 License.
 | 25 Jan 2022
Influence of organic aerosol molecular composition on particle absorptive properties in autumn Beijing
Jing Cai
Jiandong Wang
Feixue Zheng
Simo Hakala
Xiaolong Fan
Zemin Feng
Yongchun Liu
Jun Zheng
Federico Bianchi
Markku Kulmala
Kaspar R. Daellenbach
Organic aerosol (OA) is a major component of fine particulate matter (PM), affecting air quality, human health, and the climate. The absorptive and reflective behavior of OA components contributes to determining particle optical properties and thus their effects on the radiative budget of the troposphere. There is limited knowledge on the influence of the molecular composition of OA on particle optical properties in the polluted urban environment. In this study, we characterized the molecular composition of oxygenated OA collected on filter samples in the autumn of 2018 in Beijing, China, with a filter inlet for gases and aerosols coupled to a high-resolution time-of-flight chemical ionization mass spectrometer (FIGAERO–CIMS). Three haze episodes occurred during our sampling period with daily maximum concentrations of OA of 50, 30, and 55 µg m−3. We found that the signal intensities of dicarboxylic acids and sulfur-containing compounds increased during the two more intense haze episodes, while the relative contributions of wood-burning markers and other aromatic compounds were enhanced during the cleaner periods. We further assessed the optical properties of oxygenated OA components by combining detailed chemical composition measurements with collocated particle light absorption measurements. We show that light absorption enhancement (Eabs) of black carbon (BC) was mostly related to more oxygenated OA (e.g., dicarboxylic acids), likely formed in aqueous-phase reactions during the intense haze periods with higher relative humidity, and speculate that they might contribute to lensing effects. Aromatics and nitro-aromatics (e.g., nitrocatechol and its derivatives) were mostly related to a high light absorption coefficient (babs) consistent with light-absorbing (brown) carbon (BrC). Our results provide information on oxygenated OA components at the molecular level associated with BrC and BC particle light absorption and can serve as a basis for further studies on the effects of anthropogenic OA on radiative forcing in the urban environment.
- Article
(5730 KB) - Full-text XML
-
Supplement
(5089 KB) - BibTeX
- EndNote


Organic aerosol (OA) makes up a large fraction of submicron aerosol particles globally (Jimenez et al., 2009). As such, OA plays an essential role in numerous atmospheric processes such as photochemical oxidation, new particle formation and growth, and cloud formation and influences atmospheric pollution and human health, as well as global radiative forcing (Jimenez et al., 2009; Riipinen et al., 2012; Lu et al., 2019; Lelieveld et al., 2015; Daellenbach et al., 2020). Secondary organic aerosol (SOA) or oxygenated organic aerosol (OOA, a surrogate of SOA) comprises a large number of organic compounds, many of them unknown, formed via oxidation of gas-phase organic precursors (volatile organic compounds, VOCs). SOA accounts for a large fraction of the total OA burden in the atmosphere (Jimenez et al., 2009). Knowledge gaps remain regarding SOA sources and formation mechanisms, especially in polluted areas with strong anthropogenic emissions (Huang et al., 2014).
OA is found to be an important source of brown carbon (BrC), as light-absorbing OA is denoted. OA can also act as an effective shell of internally mixed black carbon (BC) particles that focuses photons onto the BC core (named the “lensing effect”; Jacobson, 2001), which leads to so-called light absorption enhancement (Eabs) of BC particles (Xie et al., 2019a, b; Zhang et al., 2018; Liu et al., 2015; Wang et al., 2018). For all these optical effects, the chemical composition of OA plays a role (Zhang et al., 2011; Fleming et al., 2020; Laskin et al., 2015); OA light absorption can therefore not be fully quantified based on bulk concentrations only. Certain OA compounds, e.g., nitrophenol derivatives and amorphous carbon spheres (i.e., tarballs), formed from anthropogenic precursors were found to be important components of BrC (Cheng et al., 2016a; Mohr et al., 2013; Y. Wang et al., 2019) and to significantly enhance the light absorption properties of particles even when present in small amounts (Teich et al., 2017). In contrast, certain biogenic SOA compounds seem to be less light-absorbing (Zhang et al., 2011). Generally, OA with a higher degree of oxygenation leads to higher BC Eabs values than less oxygenated OA (Zhang et al., 2018). In fact, less oxygenated OA was estimated to have a negligible or even negative effect on Eabs in a study conducted in Beijing, China (Xie et al., 2019a). To better understand the impact of OA composition on particle optical properties and to estimate effects on radiative forcing on both regional and global scales, detailed OA chemical composition and BrC–BC optical measurements need to be combined.
OA components can be characterized at the molecular level using offline gas or liquid chromatography coupled to mass spectrometry (GC–MS or LC–MS), which allows identification and quantification of a limited number or groups of compounds due to the lack of standards (Schauer et al., 2002; Guo et al., 2012). More recently established online mass spectrometer methods can provide detailed composition information for many OA compounds, albeit without structural information. For example, aerosol mass spectrometers (AMSs) are widely used to yield insights into the chemical evolution of OA when combined with factor analytical methods (Cai et al., 2015; Du et al., 2017; Hu et al., 2017; Sun et al., 2016; Jimenez et al., 2009). Online organic aerosol measurements using the extractive electrospray ionization (EESI) technique could provide in situ molecular composition (Lopez-Hilfiker et al., 2019; Pagonis et al., 2021). Mass spectrometers employing chemical ionization coupled with different inlets such as the filter inlet for gases and aerosols (FIGAERO) (Thornton et al., 2020) or the chemical analysis of aerosol online (CHARON) (Müller et al., 2017) allow for SOA composition analysis in both the gas and the particle phase at the molecular level. In addition to online deployments, these mass spectrometers are also used to analyze particles that were collected offline on filters (Siegel et al., 2021; Daellenbach et al., 2016; Huang et al., 2019; Qi et al., 2020).
In this study, coupled offline filter collection carried out in Beijing in autumn 2018 and a FIGAERO high-resolution time-of-flight chemical ionization mass spectrometer (FIGAERO–CIMS, Aerodyne Research Inc., USA) were used to investigate (1) OA composition at the molecular level during different haze types and (2) its implications for aerosol light-absorptive properties.
2.1 Sampling information
The sampling site (39∘56′31′′ N, 116∘17′50′′ E) is located on the west campus of the Beijing University of Chemical Technology (BUCT), which is near the western Third Ring Road in urban Beijing and surrounded by residential areas with local pollution sources such as traffic, residential heating, and cooking emissions. The site is located on the top floor of a five-floor building, about 20 m above ground level. Detailed information on the sampling site and its characteristics has been reported in previous studies (Kontkanen et al., 2020; Y. Liu et al., 2020; Cai et al., 2020; Zhou et al., 2020; Kulmala et al., 2021; Yan et al., 2021; Yao et al., 2020). During the sampling period (3 to 16 November 2018), particulate matter with a diameter of 2.5 µm or less (PM2.5) was collected on filters using a four-channel sampler (TH-16A, Tianhong Co., China) with a sampling flow rate of 16.7 L min−1. Nighttime (21:30–09:00 the next day, Beijing time, UTC+8) and daytime (09:30–21:00 Beijing time, UTC+8) 12 h PM2.5 samples were collected on 47 mm quartz filters (7202, 47 mm, Pall Corporation, USA), pre-baked for 4.5 h at 550 ∘C before sampling. The pre-baking time was selected following procedures in a previous study (Liu et al., 2016) to ensure the removal of potential organic contamination. A total of 27 samples (the 6 November daytime filter was not analyzed due to a data acquisition error) and 3 blanks were collected (sampling dates are shown in Fig. 1 and Table S1). Samples were kept in the filter holders, wrapped in aluminum foil, sealed in bags, and kept in a freezer at −20 ∘C until analysis at Stockholm University 7 months after collection. The filters were transported in a thermally insulated box with ice packs.
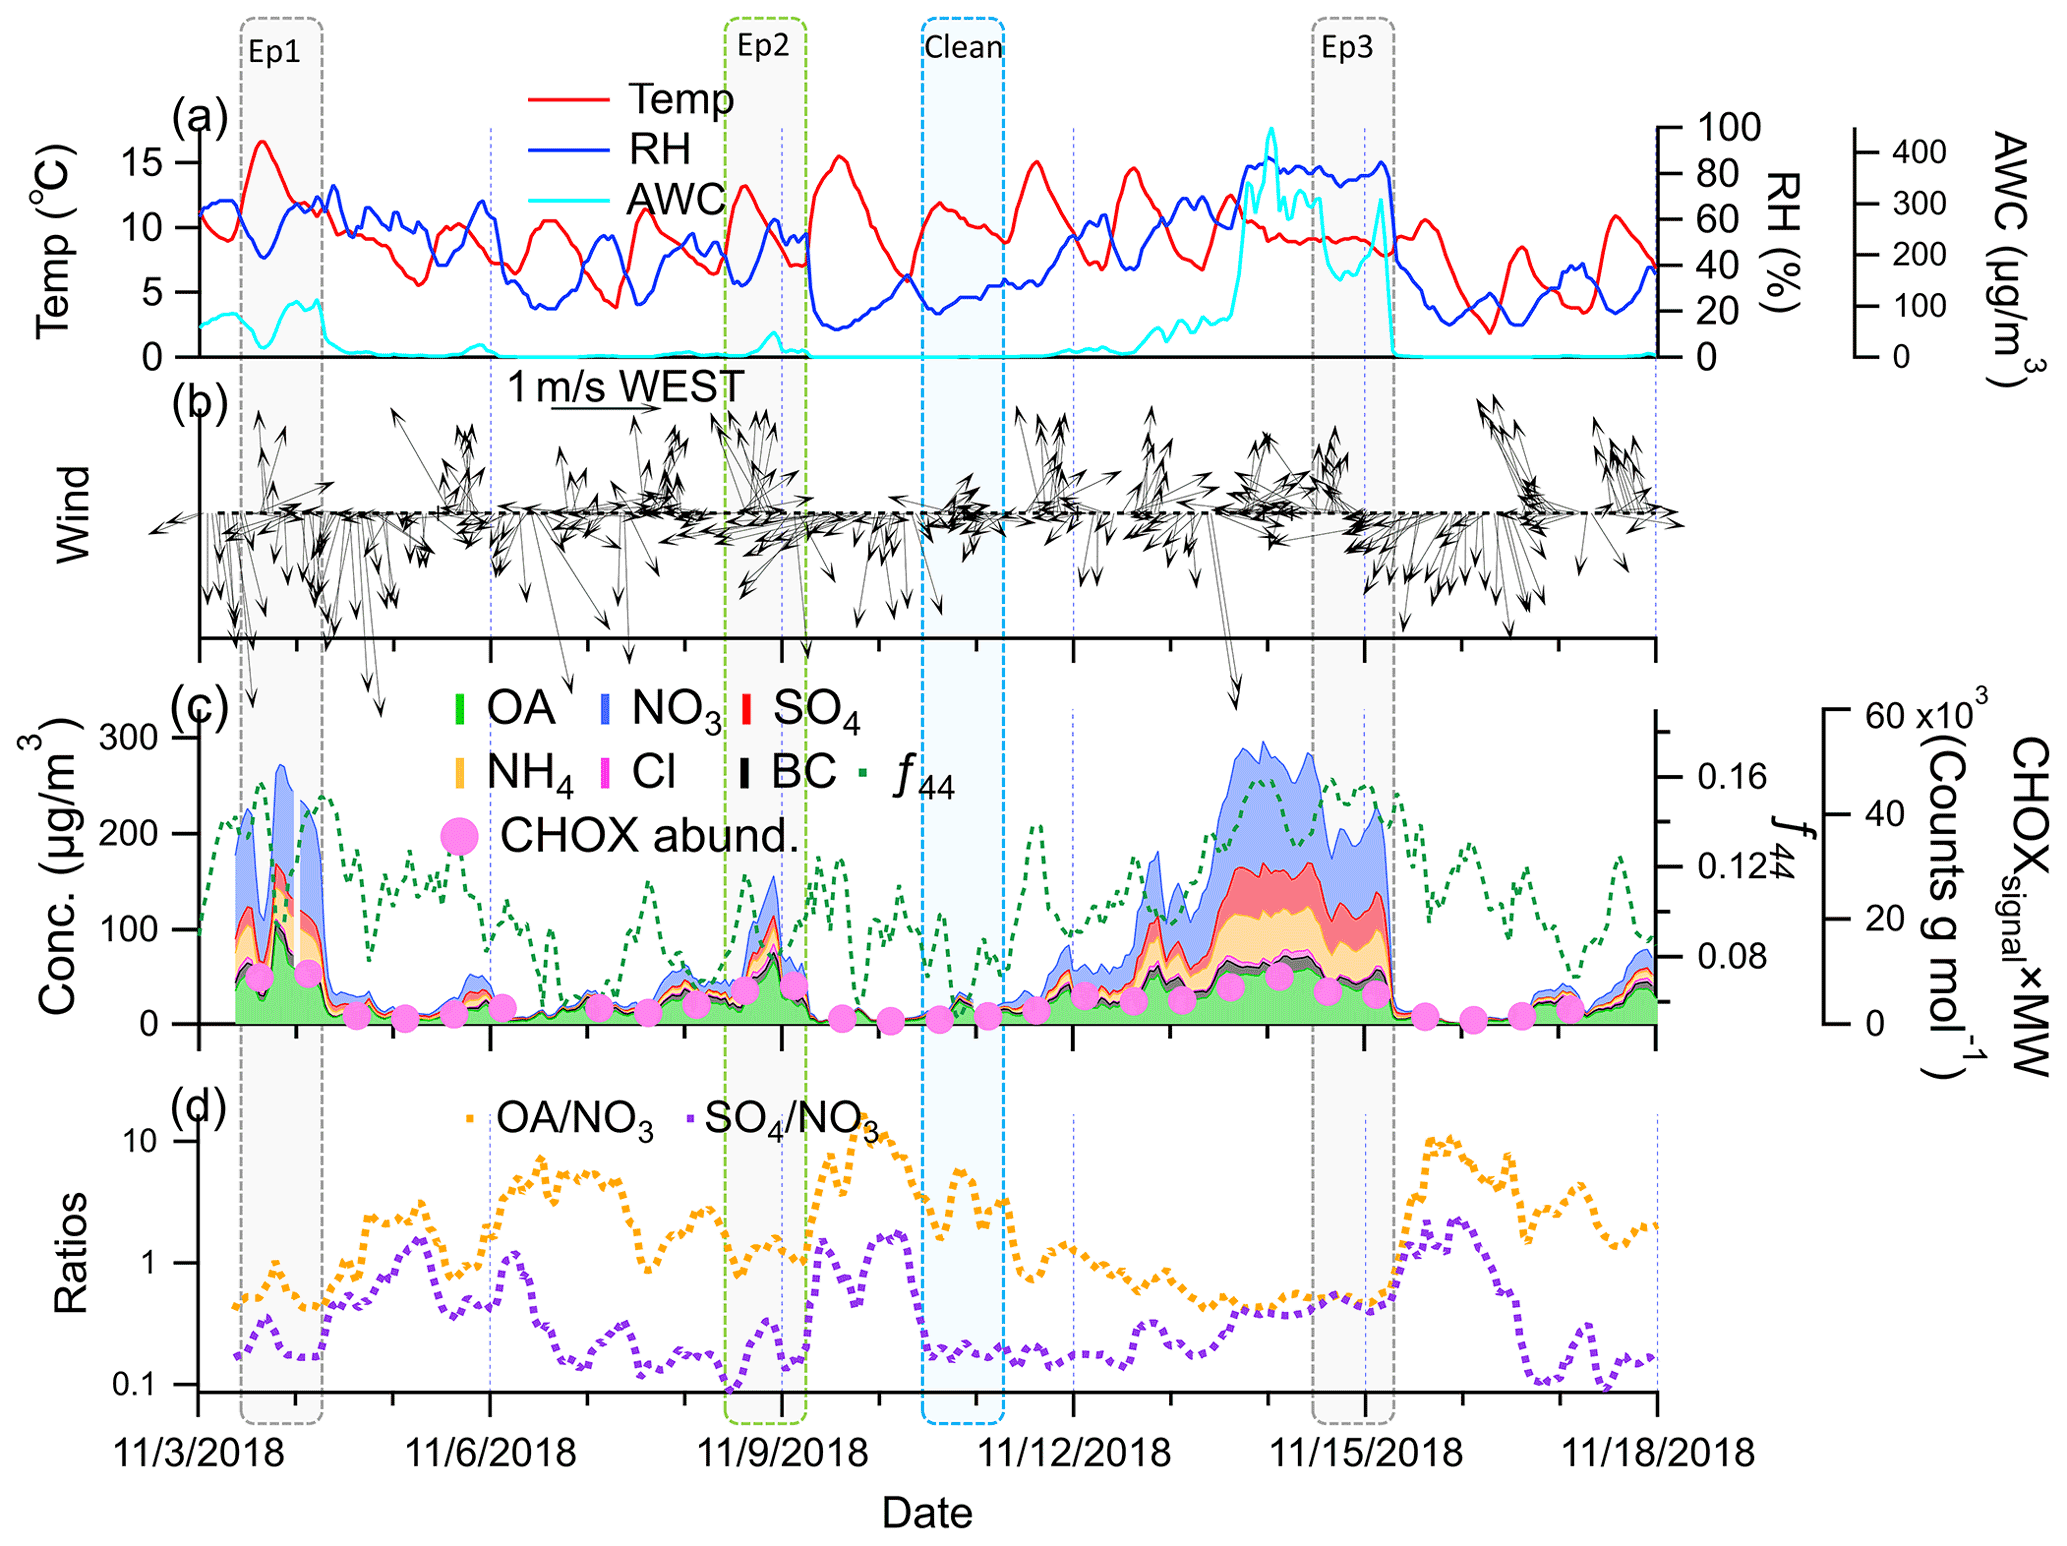
Figure 1Time series of (a) temperature, relative humidity (RH), and aerosol water content (AWC); (b) 1 h averaged wind direction and wind speed; (c) chemical components of NR-PM2.5, BC, and f44 from the ToF-ACSM – CHOX abundance from the FIGAERO–CIMS and their sampling dates are marked by pink dots; and (d) and . The sampling time of episode days is marked by boxes, which last from 09:30 to 09:00 the next day (Beijing time, UTC+8. The date is given in the format month/day/year.
2.2 Offline FIGAERO–CIMS analysis
The filters were analyzed using the FIGAERO–CIMS in offline mode, largely following the approach proposed in previous offline FIGAERO–CIMS analyses (Siegel et al., 2021; Huang et al., 2019). The particles collected on the filter were thermally desorbed by high-purity nitrogen gradually heated from room temperature to 200 ∘C. The desorbed molecules were then charged by the addition of iodide (I−), which is formed via exposure of methyl iodide to a radioactive source, Po210 in this study (Lopez-Hilfiker et al., 2014). The ion–molecule reaction region (IMR) pressure was ∼100 mbar, and the total ion count (TIC) varied between ∼600 000 and 1.2 million counts per second (cps) during analysis. Mass accuracy is within 10 ppm, and the mass resolution is between 5000 and 6000 for ions >200 Th (Th denotes thomsons). In order to reduce reagent ion depletion, we adapted the analytical protocol as follows: (1) we used a “sandwich technique” to hold small punches (2 mm in diameter) of the collected quartz filters (shown in Fig. S1), which allowed a reduction in the amount of measured PM2.5, and (2) we used a non-uniform heating protocol for the FIGAERO–CIMS desorption – a slower temperature ramping rate was applied at heating temperatures between 80 and 100 ∘C to avoid depletion of the reagent ion by the large amount of gaseous HNO3 evaporating (shown in Figs. S2 and S4). More information on the offline method including background determination can be found in the Supplement.
FIGAERO–CIMS data were analyzed with the Tofware package (v.3.1.0, Tofwerk, Switzerland, and Aerodyne, USA) within the Igor Pro software (v.7.08, WaveMetrics, USA). We identified the molecular composition of 946 ions in the range of 46 to 500 Th. Most of them (939 ions) were clustered with I−. The rest comprised 7 inorganic ions with low molecular weight (NO, NO, HSO, HN2O, NO6S−, H2NO7S−, H2N3O) and were not considered in the following discussions. Identified CHOX compounds (compounds with molecular composition Cc≥1, Hh≥2, Oo≥1, and X0−n, where X can be N, S, or both) were grouped into (1) compounds containing only carbon, hydrogen, and oxygen (CHO, 65 ± 5 % of total CHOX signal); (2) nitrogen-containing compounds (CHON, 30 ± 5 %); (3) sulfur-containing compounds (CHOS, 5 ± 1 %); and (4) compounds containing both nitrogen and sulfur (CHONS, 0.2 ± 0.05 %). The time series of the signal intensities of each compound during a heating cycle was normalized to the signal of the reagent ion I−. The background signal was determined using field blanks, which were scaled by the ratio in the signal during the last 1.5–3 min of the soak period of samples and field blanks to account for instrumental backgrounds. Details of the adjustments can be found in the Supplement. The background-subtracted signal intensities over the entire heating cycle, which includes the temperature ramp and soak, were integrated, resulting in a single data point (in total ion counts) per compound and filter sample. The good correlation between the FIGAERO–CIMS and time-of-flight aerosol chemical speciation monitor (ToF-ACSM) (CHOX vs. OA from the ToF-ACSM, HNO3I− vs. NO3 from the ToF-ACSM, SO3I− vs. SO4 from the ToF-ACSM; see Fig. S3) validates the offline FIGAERO–CIMS analyses – at least in terms of bulk PM constituents – and suggests that artifacts related to the method only play a minor role. Given this study's focus on the variability in the molecular composition of oxygenated OA and its relative changes, we did not attempt to convert total ion counts into atmospheric concentrations as the quantification of individual compounds is complicated by the variable sensitivities to different compounds (Lopez-Hilfiker et al., 2016).
In OA compound analysis, double-bond equivalents (DBEs) provide information on the potential number of rings and double bonds in a molecule. DBEs were calculated following the method proposed by Wang et al. (2017), shown as in Eq. (1):
where c, h, and n are the number of C, H, and N atoms in the molecular formulae of the corresponding compounds.
Chemical characterization by the FIGAERO–CIMS, essentially using a thermodesorption technique, is prone to thermal decomposition. For example, more oxygenated multi-functional organic compounds such as citric acid (C6H8O7) and sucrose (C12H22O11) were found to be affected by thermal decomposition in the FIGAERO–CIMS (Yang et al., 2021; Stark et al., 2017). Since thermal decomposition generally occurs at temperatures higher than the desorption temperature of most compounds (Buchholz et al., 2020), multi-modal thermogram shapes can be used as an indicator for signal contributions from thermally fragmented compounds. Based on such analysis of the filter collected on 14 November, among the 10 ions with the highest intensity, only 1 (C2H4O3I−) appeared to be affected strongly by thermal decomposition (Fig. S18).
2.3 Collocated measurements and analyses
An online ToF-ACSM (Aerodyne Research Inc., USA) equipped with a PM2.5 lens and standard vaporizer was operated at the same site. In this study, the ionization efficiency (IE, 230 ions pg−1) and relative ionization efficiencies (RIEs) for NH4 (4.0), NO3 (1.05), SO4 (0.86), and Cl (1.5) were determined by calibrations with pure standards of ammonium nitrate, ammonium sulfate, and ammonium chloride, while the RIE of OA (1.4) was taken from the literature (Canagaratna et al., 2007). A composition-dependent collection efficiency (CE) for the ToF-ACSM was applied following the method proposed by Middlebrook et al. (2012). Organic carbon (OC) and elemental carbon (EC) of PM2.5 were measured by a semi-continuous OC–EC carbon aerosol analyzer (Model-4, Sunset Laboratory Inc., USA) with a time resolution of 1 h. The instrument was routinely calibrated with a solution of sucrose.
Gaseous NH3 was measured by a collocated modified chemical ionization–atmospheric pressure interface–time-of-flight mass spectrometer (CI-APi-TOF, Aerodyne Research Inc., USA) charged by H3O+ or its hydrated clusters. The NH3 measurement method has been described in previous studies (Cai et al., 2021; Zheng et al., 2015). Meteorological parameters, including temperature, relative humidity (RH), wind direction, and wind speed, were measured at the same site. The boundary layer height was calculated by the method proposed by Eresmaa et al. (2012) based on ceilometer (CL51, Vaisala) measurements and used to identify the stagnant conditions typical of haze episodes.
The aerosol water content (AWC) for the sampling period was calculated with ISORROPIA II (Fountoukis and Nenes, 2007) based on the chemical composition of non-refractory PM2.5 (NR-PM2.5) measured by the ToF-ACSM, and gaseous NH3. ISORROPIA II was run in forward and metastable modes to achieve stable performance (Wang et al., 2020; Guo et al., 2017). Here we show the base case, i.e., calculations with RH, temperature, major components, and NH3. Including gaseous HCl, gaseous HNO3, and the effects of particulate organic nitrate (PON) did not significantly influence calculated AWC (see Supplement).
Aerosol light absorption measurements were conducted with a multi-wavelength aethalometer (Model AE33, Magee Scientific Co., USA) equipped with a PM2.5 cyclone. The aethalometer measures the optical attenuation (ATN) of light transmitted through PM collected on filters at seven wavelengths (370, 470, 520, 590, 660, 880, and 950 nm) with a time resolution of 5 min. To fill a data gap from 3 to 6 November due to calibrations at the BUCT site, we also analyzed the data from another AE33 located at the tower branch of the Institute of Atmospheric Physics (IAP), Chinese Academy of Sciences. The IAP site is located ∼6 km northeast of the BUCT site. During the entire month of November, the BC analyses agreed well between the two measurement locations (r of 0.94–0.95 and intercept of 0.33–0.58 µg m−3 for the seven wavelengths, Fig. S6).
2.4 Aerosol optical property calculations
The light absorption coefficient (babs) is determined from the ATN measured by the aethalometer and corrected for the so-called shadowing effect (Virkkula et al., 2015), which represents attenuation variation due to high mass loadings on the filter. BC mass concentrations are derived from the shadowing-effect-corrected babs (Hansen et al., 1983).
The variation in babs as a function of wavelength (λ) is described by the Ångström exponent (AAE), which is typically calculated using observations from a pair of wavelengths (Lack and Langridge, 2013) as in Eq. (2):
In this study, we selected the two wavelengths of 370 nm (λ1) and 880 nm (λ2) from the aethalometer measurements to calculate the AAE, following previous studies (Wang et al., 2018; Tao et al., 2020; Lim et al., 2014). It has been shown that in contrast to BC, light absorption of BrC has a strong wavelength dependence, which results in high AAE values for BrC (4 to 7; Cheng et al., 2016a) and much lower AAE values for BC (0.8 to 1.1; Teich et al., 2017). An AAE value of 1.0 is generally adopted for BC (AAEBC; Teich et al., 2017; Xie et al., 2019b; Cheng et al., 2016a) and also used in this study. Here we have used these differences in the AAE to separate babs for BC and BrC following the method by Lack and Langridge (2013). Due to the low absorption of BrC in the infrared and low concentrations of mineral dust in autumn in Beijing (Zhang et al., 2013), it can be assumed that babs at 880 nm is only from BC particles. babs at 370 nm for BC () and BrC () can then be calculated using Eqs. (3) and (4):
We note that AAEBC can vary with many factors such as BC core size, coating thickness, or morphology (Zhang et al., 2018; Cheng et al., 2009); BC with a core–shell structure can have an AAEBC higher than 1.0 (Bond and Bergstrom, 2007). We also calculated following the empirical equation method proposed by Wang et al. (2018) using Mie theory calculation and observed a high correlation (r=0.98 and intercept of 1.6 Mm−1) of the time series between the two aforementioned methods.
The contribution of BrC to total aerosol absorption at 370 nm (PBrC) is assessed by Eq. (5):
Lack and Langridge (2013) postulated that using different values for AAEBC and AAEBrC to attribute aerosol light absorption to organic and black carbon, respectively, is only valid when there is substantial light absorption contribution (PBrC>23 %) from BrC; the average PBrC in our study period is 34 ± 9 %.
The light absorption of BC can be enhanced due to the lensing effect (BC absorption enhancement Eabs); Jacobson et al. (2001) reported factors of up to 2.9. The Eabs of BC was calculated here as the ratio of light absorption of BC particles measured at 880 nm by the aethalometer to the theoretical absorption from uncoated pure BC at 880 nm (Eq. 6; Zhang et al., 2018; Xie et al., 2019a). The latter is calculated by multiplying EC concentrations (measured by the OC–EC analyzer) by the pure BC mass absorption coefficient (MAC, 7.5 m2 g−1) taken from the literature (Bond and Bergstrom, 2007; Wu et al., 2018).
3.1 Three haze episodes – temporal variation in PM2.5 components and meteorological conditions
During the period of sampling, we observed three particulate pollution or haze episodes (visibility <10 km and RH <90 %; Cai et al., 2020) with NR-PM2.5 + BC concentrations higher than 100 µg m−3, 3 to 4 November, 7 to 9 November, and 11 to 15 November (Fig. 1). Between these episodes, 12 h NR-PM2.5 + BC concentrations decreased to <15 µg m−3. During the cleaner days (5 to 6 November and 9 to 10 November), the OA mass spectra from the FIGAERO–CIMS were generally similar (shown in Fig. S7). We selected the days of 3 November (Ep1), 8 November (Ep2), 14 November (Ep3), and 10 November (clean period) to compare the molecular composition of OA and derive particle optical properties. Even though OA concentrations were similar (Ep1, 49 µg m−3; Ep2, 30 µg m−3; Ep3, 40 µg m−3), the AWC exhibited large differences (Ep1, 65 µg m−3; Ep2, 12 µg m−3; Ep3, 263 µg m−3), indicative of different haze formation mechanisms.
Figure 1 shows the time series of temperature, RH, simulated AWC, wind direction, and wind speed, as well as the time series of the chemical components during the sampling period. We observed strong diel patterns and a slightly decreasing trend in temperature during the whole sampling period. The wind direction and wind speed did not strongly influence the pollution levels, likely due to the relatively low wind speed on average (0.6 m s−1). The ratio of SO4 to NO3 (Fig. 1d) was 0.47 ± 0.45, much lower than in the year 2005 ( = 1.6) in Beijing (Yang et al., 2011) and illustrating that nitrate has become a more important PM component due to SO2 reductions in North China during the last decade. We multiplied the CHOX signals from the FIGAERO–CIMS with their corresponding molecular weight to present the total CHOX abundance. Similar temporal variation was observed between CHOX abundance and the OA concentrations from the ToF-ACSM (r=0.94; Fig. 1c).
Ep1 and Ep3 were strong haze episodes, with hourly concentrations of PM2.5 of over 200 µg m−3 and high concentrations of secondary inorganic aerosol (SIA) compounds such as nitrate, ammonium, and sulfate. The amplitude of the diurnal cycles of temperature and RH were reduced when NR-PM2.5 + BC concentrations were larger than 200 µg m−3 in both episodes. The highest hourly AWC was larger than 100 and 400 µg m−3 in Ep1 and Ep3, respectively. In addition to the similarly high RH and AWC, Ep1 and Ep3 were both characterized by the strong influence of air masses arriving from the south of the North China Plain (NCP) (Fig. S8). Such conditions are typical of the most severe haze episodes observed in Beijing (Sun et al., 2015, 2013), where high RH and AWC lead to heterogeneous processes and a strong increase in SIA. In Ep1 and Ep3, the increase in OA concentrations and f44 – the fraction of signal measured by the ToF-ACSM at a mass-to-charge ratio of 44 and an indicator of more oxygenated and thus secondary OA (Ng et al., 2011) – shows that not only secondary inorganic but also secondary organic species contributed strongly to those two severe haze episodes (shown in Fig. 1). A complete buildup process of haze was observed in the period of 11 to 15 November with Ep3, which seems to occur in two phases: the start of pollution accumulation under relatively dry conditions (11–13 November) and then the development of haze with high AWC (13 to 14 November).
Ep2 (8 November) with the highest hourly PM2.5 concentrations of 150 µg m−3 was characterized by a prominent OA contribution (43 % of NR-PM2.5 + BC) as well as a higher OA-to-NO3 ratio (1.5, Fig. 1d) compared to Ep1 (24 %, 0.50) and Ep3 (27 %, 0.53), more similar to the cleaner periods during the whole sampling period with PM2.5 <35 µg m−3 (52 %, 3.4). In addition, AWC and RH were much lower during Ep2 than during Ep1 and Ep3. This indicates a different haze formation mechanism governing Ep2 compared to Ep1 and Ep3.
The clean period (10 November) is characterized by low PM and AWC levels, with average PM2.5 and OA concentrations of 14 ± 7 and 8.4 ± 4 µg m−3, respectively. These are much lower than the average values of the whole sampling period (76 ± 79 and 22 ± 15 µg m−3, respectively). During the clean period, the highest value of during the sampling period was observed (>10), illustrating the rather small influence of SIA.
3.2 Molecular composition of OA
The three haze episodes varied in the relative contribution of OA to total NR-PM2.5 + BC and in the ratio of OA to inorganic species as exemplified by the ratio in Fig. 1d. In the following, we examine the molecular composition of OA more closely for the three episodes and the clean period. Figure 2a shows the stacked time series of the organic compounds identified by the FIGAERO–CIMS and grouped according to their molecular composition into CHO, CHON, CHOS, and CHONS compounds, with the sum of all compounds referred to as CHOX. The time series of the sum of the signal of the CHOX compounds measured by the FIGAERO–CIMS correlates well with that of the OA mass concentrations measured by the ToF-ACSM (r=0.95), which shows the robustness of our sampling and analysis method. CHO (65 ± 5 %) and CHON (30 ± 5 %) compounds dominated the CHOX signal, even though the relative contributions of the different groups varied between the different episodes. Ep1 and Ep3 showed a high relative contribution of CHO and CHOS compounds (68 % and 6.8 % for Ep1 and 72 % and 7.3 % for Ep3, respectively), which can be associated with the rapid formation of oxygenated OA and organosulfates during haze in Beijing (Wang et al., 2021a; Le Breton et al., 2018) and the relatively low contribution of CHON compounds (28 % and 21 % in Ep1 and Ep3, respectively). On the contrary, for the clean period, the relative contributions of CHO and CHOS were lower (56 and 3.4 %, respectively), and those of CHON compounds were increased by a factor of ∼2 (40 %) compared to Ep1 and Ep3. In Ep2, characterized by low AWC, the CHO compounds had strong signal contributions (73 %), similarly to Ep1 and Ep3, but much lower contributions of CHOS (3.6 %) and a similar contribution of CHON (23 %) were observed.

Figure 2Time series of the (a) abundance of CHO, CHON, CHOS, and CHONS compounds and OA concentrations measured by the ToF-ACSM; (b) signals of compounds grouped according to carbon number and ratio; (c) average carbon number, ratio, the fraction of BC to NR-PM2.5 + BC, and f60 from the ToF-ACSM; (d) signal-weighted total mass of elements C, O, H, N, and S; and (e) relative atom fraction of C, O, H, N, and S. The date is given in the format month/day.
For a more detailed look at the molecular composition of compounds during the different episodes, we further subdivided the compounds measured by the FIGAERO–CIMS based on their number of carbon atoms per molecule (Fig. 2b). In general, during the period analyzed here, compounds with fewer than 10 carbons contributed most to the total CHOX signal (78 % ± 7 %). Although < C10 compounds were dominant, variation in different carbon number compounds was observed for the different periods. In Ep1 and Ep3, the contribution of compounds with low carbon numbers (C2–6) was 83 % and 88 %, respectively, while in the clean period their fractions went down to 73 %. The signal intensities of C2–4 compounds were >20 times higher in Ep1 and Ep3 than in the clean period, which is likely related to aqueous-phase formation of small molecules (e.g., dicarboxylic acids) as indicated by their high correlation with AWC (). Those small compounds are typically assumed to be formed in the aqueous phase since gas–particle partitioning theory would favor larger precursor (> C7) SOA semi-volatile products in the particle phase (Lim et al., 2010). Another indication of aqueous SOA formation in Ep1 and Ep3 is the f44 and f43 ratios of ∼0.14 and ∼0.06, which are within the narrow range of aqueous OA (f44, 0.09–0.16, and f43, ∼0.06) observed in a previous study in Beijing (Zhao et al., 2019). In contrast, the relative contributions of > C10 compounds were higher in the clean period (36 %, compared to Ep3 with 18 %), likely attributable to the stronger relative contributions from combustion emissions. In Ep2, C6 compounds were strongly enhanced (30 %) compared to in the clean period (18 %) and Ep3 (14 %), which we associate with organics emitted from biomass burning (discussed below).
In Fig. 2b we also plot the ratio of CHO group derived from FIGAERO–CIMS data. Similarly to what was shown previously for winter in Beijing (Hu et al., 2017; Sun et al., 2016), the bulk generally followed the trend of the total OA and total CHOX signal; i.e., higher OA concentrations coincided with more oxygenated OA. The highest values (0.6 to 0.7) were observed during Ep1 and Ep3, while during the clean days, the ratio went down to 0.4–0.5. The higher ratios during the haze periods were likely due to the enhanced contribution of SOA. An SOA component related to aqueous-phase processes was found to be a dominant factor for the increase in the degree of oxygenation of OA during a humid pollution period in Beijing (Sun et al., 2016; Zhao et al., 2019). In-cloud or droplet processes may be enhanced and form OA compounds such as small acids (e.g., oxalate) (Guo et al., 2010) and humic-like substances (HULISs) (Laskin et al., 2015). We can therefore expect that the compounds with small carbon numbers that show higher contributions during humid haze periods (e.g., Ep3) may be carboxylic acids and therefore have a relatively high ratio.
With secondary OA species being related to smaller carbon numbers, the temporal variation in the bulk average carbon number was then similar to that of the BC fraction of total PM2.5(fBC) (Fig. 2c). BC is a typical indicator of primary combustion emissions (residential heating, traffic exhaust) in Beijing (Cai et al., 2017, 2020; Sandradewi et al., 2008; Zotter et al., 2017). Through secondary formation and oxidation reactions at a later stage of the haze between 11 and 15 November, the contribution of secondary components increased, resulting in a decrease in fBC and ratios, while the ratio increased. In Ep2, BC and fBC increased to 10 µg m−3 and 9.2 % compared to <2 µg m−3 and 3.1 % on 5 November (clean day, the end of Ep1), suggesting that this episode was more influenced by primary emissions than secondary formation. Also, the signal of C6 compounds was increased (shown in Fig. 2b) due to the increase in C6H10O5I−, which corresponds to anhydrous sugars such as levoglucosan, mannosan, galactosan, and 1,6-anhydro-β-D-glucofuranose from the breakdown of cellulose during wood combustion (Simoneit et al., 1999), tracers for biomass burning activities. Another indicator for biomass burning, f60, was measured by the ToF-ACSM (Cubison et al., 2011) and also increased in Ep2. Ep2 was overall characterized by a larger influence of biomass burning emissions, which is not the case for Ep1 and Ep3. In Fig. S9, we further show the carbon-number-segregated ratios during the sampling period, which confirm the different nature of haze episodes 1 and 3 compared to Ep2: the percentage contributions of C6 compounds to CHO and their ratios were different during Ep2 (42 % and 0.8, respectively) compared to 25 % (19 %) and 0.7 (0.7) for Ep1 (Ep3).
The respective roles of different processes such as gas-to-particle conversion and condensed-phase reactions in the increase in the OA mass and ratio during the haze episodes can be investigated by looking at the mass increase in carbon, oxygen, and hydrogen in the particle phase separately. As shown in Figs. 2d and S10, the signal-weighted mass (defined as the atomic number multiplying their atomic mass) of elements C, H, O, and N generally increased during the three episodes, but the increase in mass concentrations of OA was mainly driven by the addition of both carbon and oxygen, implying that aging and/or oxidation reactions (e.g., functionalization of particle-phase organics and aqueous-phase reactions) and gas-to-particle conversion contributed to SOA formation in haze episodes.
We also calculated the relative atom fraction of the individual atoms of all CHOX compounds (fatom signal) using Eq. (7):
where Signali and MWi, represent the signal intensity and molecular weight of compound i, respectively, and Atom and AMi,j the number and atomic mass of atom j in compound i, respectively. The time series of fatom signal is shown in Fig. 2e. Compared to the clean period, a higher fatom signal of O and slightly lower contributions of C and H were measured in Ep1 and Ep3. This indicates again that oxidation reactions play an important role in the increasing total OA mass in the humid haze periods. We cannot, however, based on this analysis, make any conclusions about the importance of aqueous-phase reactions. The fatom signal of N decreased during the haze periods (Ep3, 21 %; clean period, 29 %) while S increased (Ep3, 1.4 %; clean period, 0.67 %), consistent with the CHON and CHOS group fraction variations (shown in Fig. 2a). Although the mechanism of organosulfur and inorganic sulfate formation in heterogeneous reactions is not fully understood, it seems probable that SO2 is rapidly oxidized and sulfate/organosulfur is formed in aerosol water with different types of oxidants and catalysts (Song et al., 2019; Cheng et al., 2016b; T. Liu et al., 2020; W. Wang et al., 2021).
In the following, we further characterize SOA in the different episodes with respect to (1) compounds across different carbon and oxygen numbers, (2) compounds with different DBEs, and (3) homologous-like series and individual compounds in typical episodes. The distribution of compounds with different carbon and oxygen numbers is shown in Fig. 3. During the clean period, the C6 compounds, especially C6HxO5 (and particularly C6H10O5I−), made up 5.9 % of all CHO compounds, 70 % higher compared to Ep1 and Ep3. This indicates that biomass burning emissions played a more important role during clean periods. Another important characteristic of the clean period was the enhancement of the relative contributions of nitrogen-containing organics, which were dominated by C6H5−11O3N compounds (possibly nitrophenols, 5 % attributed to CHOX, shown in Fig. S11).
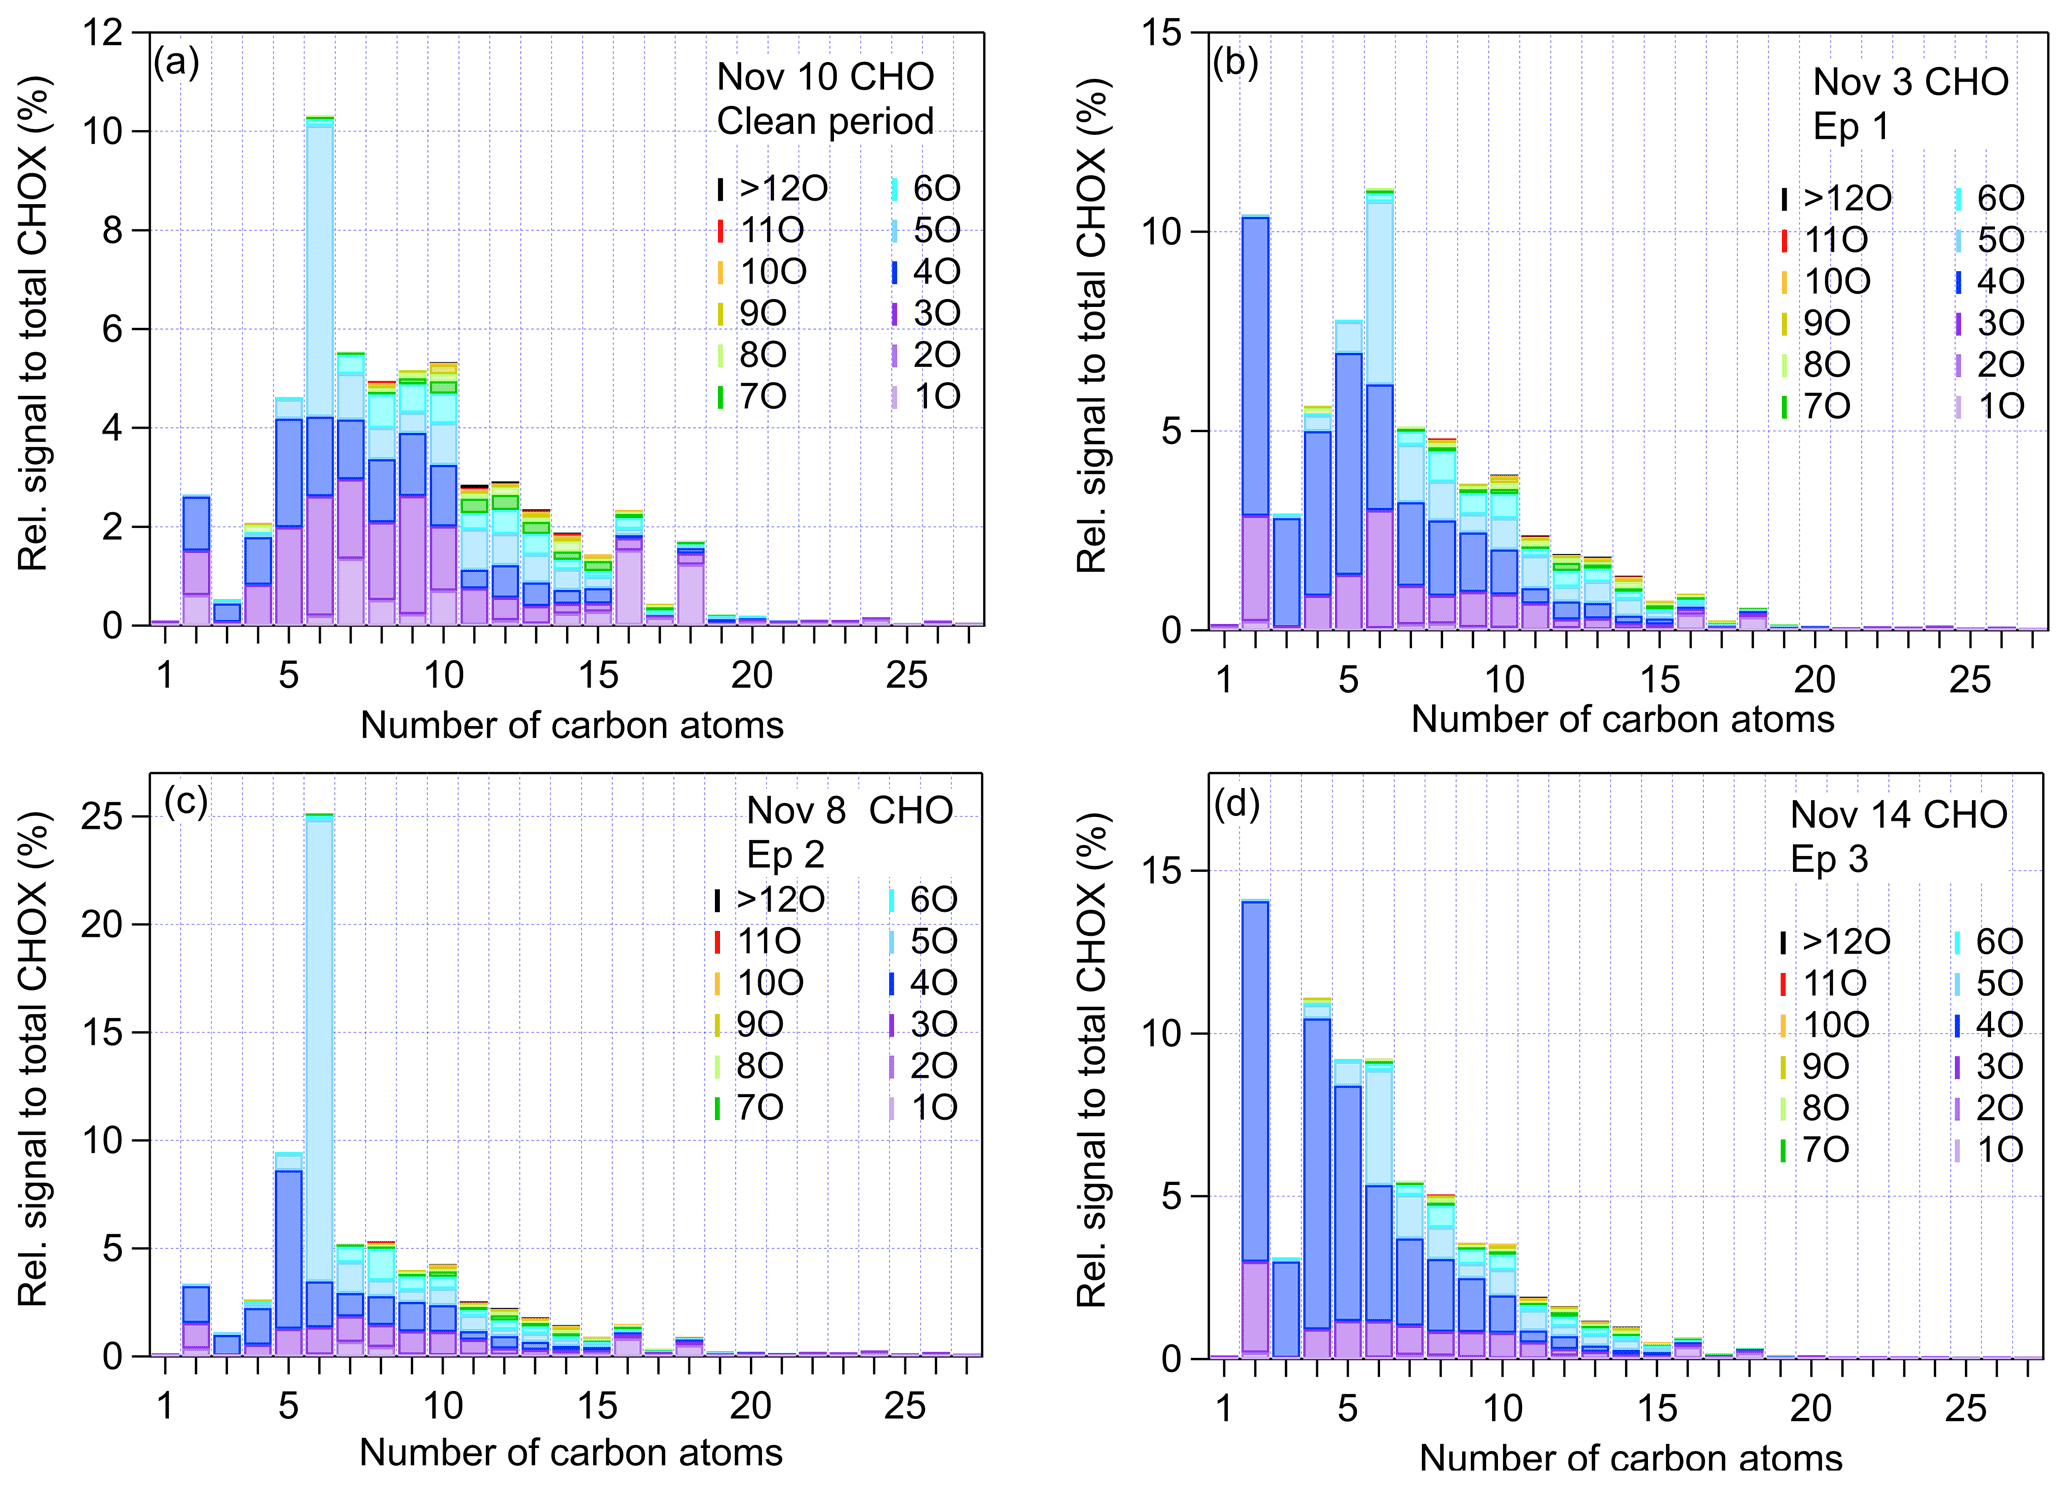
Figure 3Signal fractions to total CHOX for CHO compounds with different numbers of oxygen and carbon atoms in (a) the clean period (10 November), (b) Ep1 (3 November), (c) Ep2 (8 November), and (d) Ep3 (14 November). The same plots for CHON compounds are displayed in Fig. S11.
During Ep2, the signals of C6HxO5 increased to up to 21 % of total CHOX signals, which is a much higher fraction compared to during the clean period (5.9 %) and haze days (3.5 %). Also, during Ep2, C6H10O5I− was the main contributor to this group (shown in Fig. S7). The time series of C6H10O5I− (as well as its fraction of CHOX, ) follows the trend of f60 measured by the ToF-ACSM, and both are strongly enhanced during Ep2 (shown in Figs. 2b and S12). The count median diameter (CMD) of the particles was around 60 nm (Fig. S8) in Ep2, consistent with fresh biomass burning emissions (50–70 nm during flaming; Vu et al., 2015), in contrast to the CMD in the clean period (∼20 nm) and haze episode Ep3 (∼100 nm).
Ep1 and Ep3 were characterized by higher contributions of compounds with small carbon numbers (<6). Here we show that C2–6HxO4 made up 23 % (Ep1) and 27 % (Ep3) of the total CHOX, which is 2 and 3 times higher than in Ep2 and the clean period, respectively. Since Ep1 and Ep3 were characterized by lower UVB radiation (shown in Fig. S8), high AWC, and high f44, this further indicates that these dominant OA compounds with four oxygen atoms are dicarboxylic acids, likely formed in aqueous-phase reactions. The absolute signal intensity of oxalic acid (C2H2O4I−) was 50 and 70 times higher in Ep1 and Ep3, respectively, than in the clean period, and a high correlation was observed between dicarboxylic acids and AWC (r≈0.75 for different dicarboxylic acids). As PM2.5 concentrations increased with RH and AWC in Ep3, the concentrations of OA gradually increased from <10 µg m−3 (daytime of 11 November) to over 50 µg m−3 (nighttime of 13 November) and the OA molecular composition changed as well. On 11 November, the signals of C6 and O5 compounds were prominent (shown in Fig. S13), similarly to in Ep2 and clean periods. As pollution levels increased, on 12 November, the contributions of C2–6 and O4 compounds strongly increased and the compound distribution became more similar to the haze period (Fig. S13), indicative of the important role of AWC in SOA and severe haze formation in Beijing.
In order to further characterize organic compounds detected by the FIGAERO–CIMS, we plot the Van Krevelen (VK) diagrams of CHO and CHON compounds in Figs. 4 and S14, respectively. Each dot in Fig. 4 represents a measured OA compound, which is color-coded by the calculated DBE and sized by the square root of its signal. During the clean period, the OA components displayed a higher contribution of unsaturated species (DBEs ≥ 6, 11 % of total CHOX in the clean period, compared to 7.4 % in Ep3) with lower and ratios. Typically, compounds with a DBE-to-carbon ratio higher than 0.7 are characterized as soot or oxidized polycyclic aromatic hydrocarbons (PAHs) (Cui et al., 2019). The relative contribution of the compounds with a carbon number ≥6 meeting that criterion was around 12 % of the total CHOX signal in clean periods, which was higher compared to Ep3 (7.0 %). Figure 4 shows that the compounds with high DBEs generally have between two and three oxygen atoms, implying that they underwent some oxidation. Those compounds with characteristics representative of oxidation products of aromatics (Molteni et al., 2018) exhibit stronger relative contributions during clean periods. For example, the relative intensity of C6H6O2I−, a benzene (C6H6) oxidation product, was around 3 times higher during the clean period. The relative signal of C7H8O2I−, formed from toluene (C7H8) oxidation, was 40 % to 70 % higher compared to the haze periods. For the CHON compounds, the relative contributions of both C6H5NO3I− (possibly nitrophenol) and C7H7NO3I− (possibly methyl nitrophenol) were 2 to 3 times higher during clean days than during the haze episodes. The average UVB radiation intensity for the daytime of 10 November was around 4 times higher than during the haze episodes (shown in Fig. S8), which might result in higher levels of OH radicals and stronger photo-oxidative potential. In addition, the ratio of the signal intensities of nitrophenol to nitrocatechol (C6H5NO4I−) on clean days was about 5 times higher than during the polluted days of Ep1 and Ep3, also consistent with recent findings in Beijing that the elevated NO2 during polluted days promotes the formation of nitrocatechols over nitrophenols (Y. Wang et al., 2019).
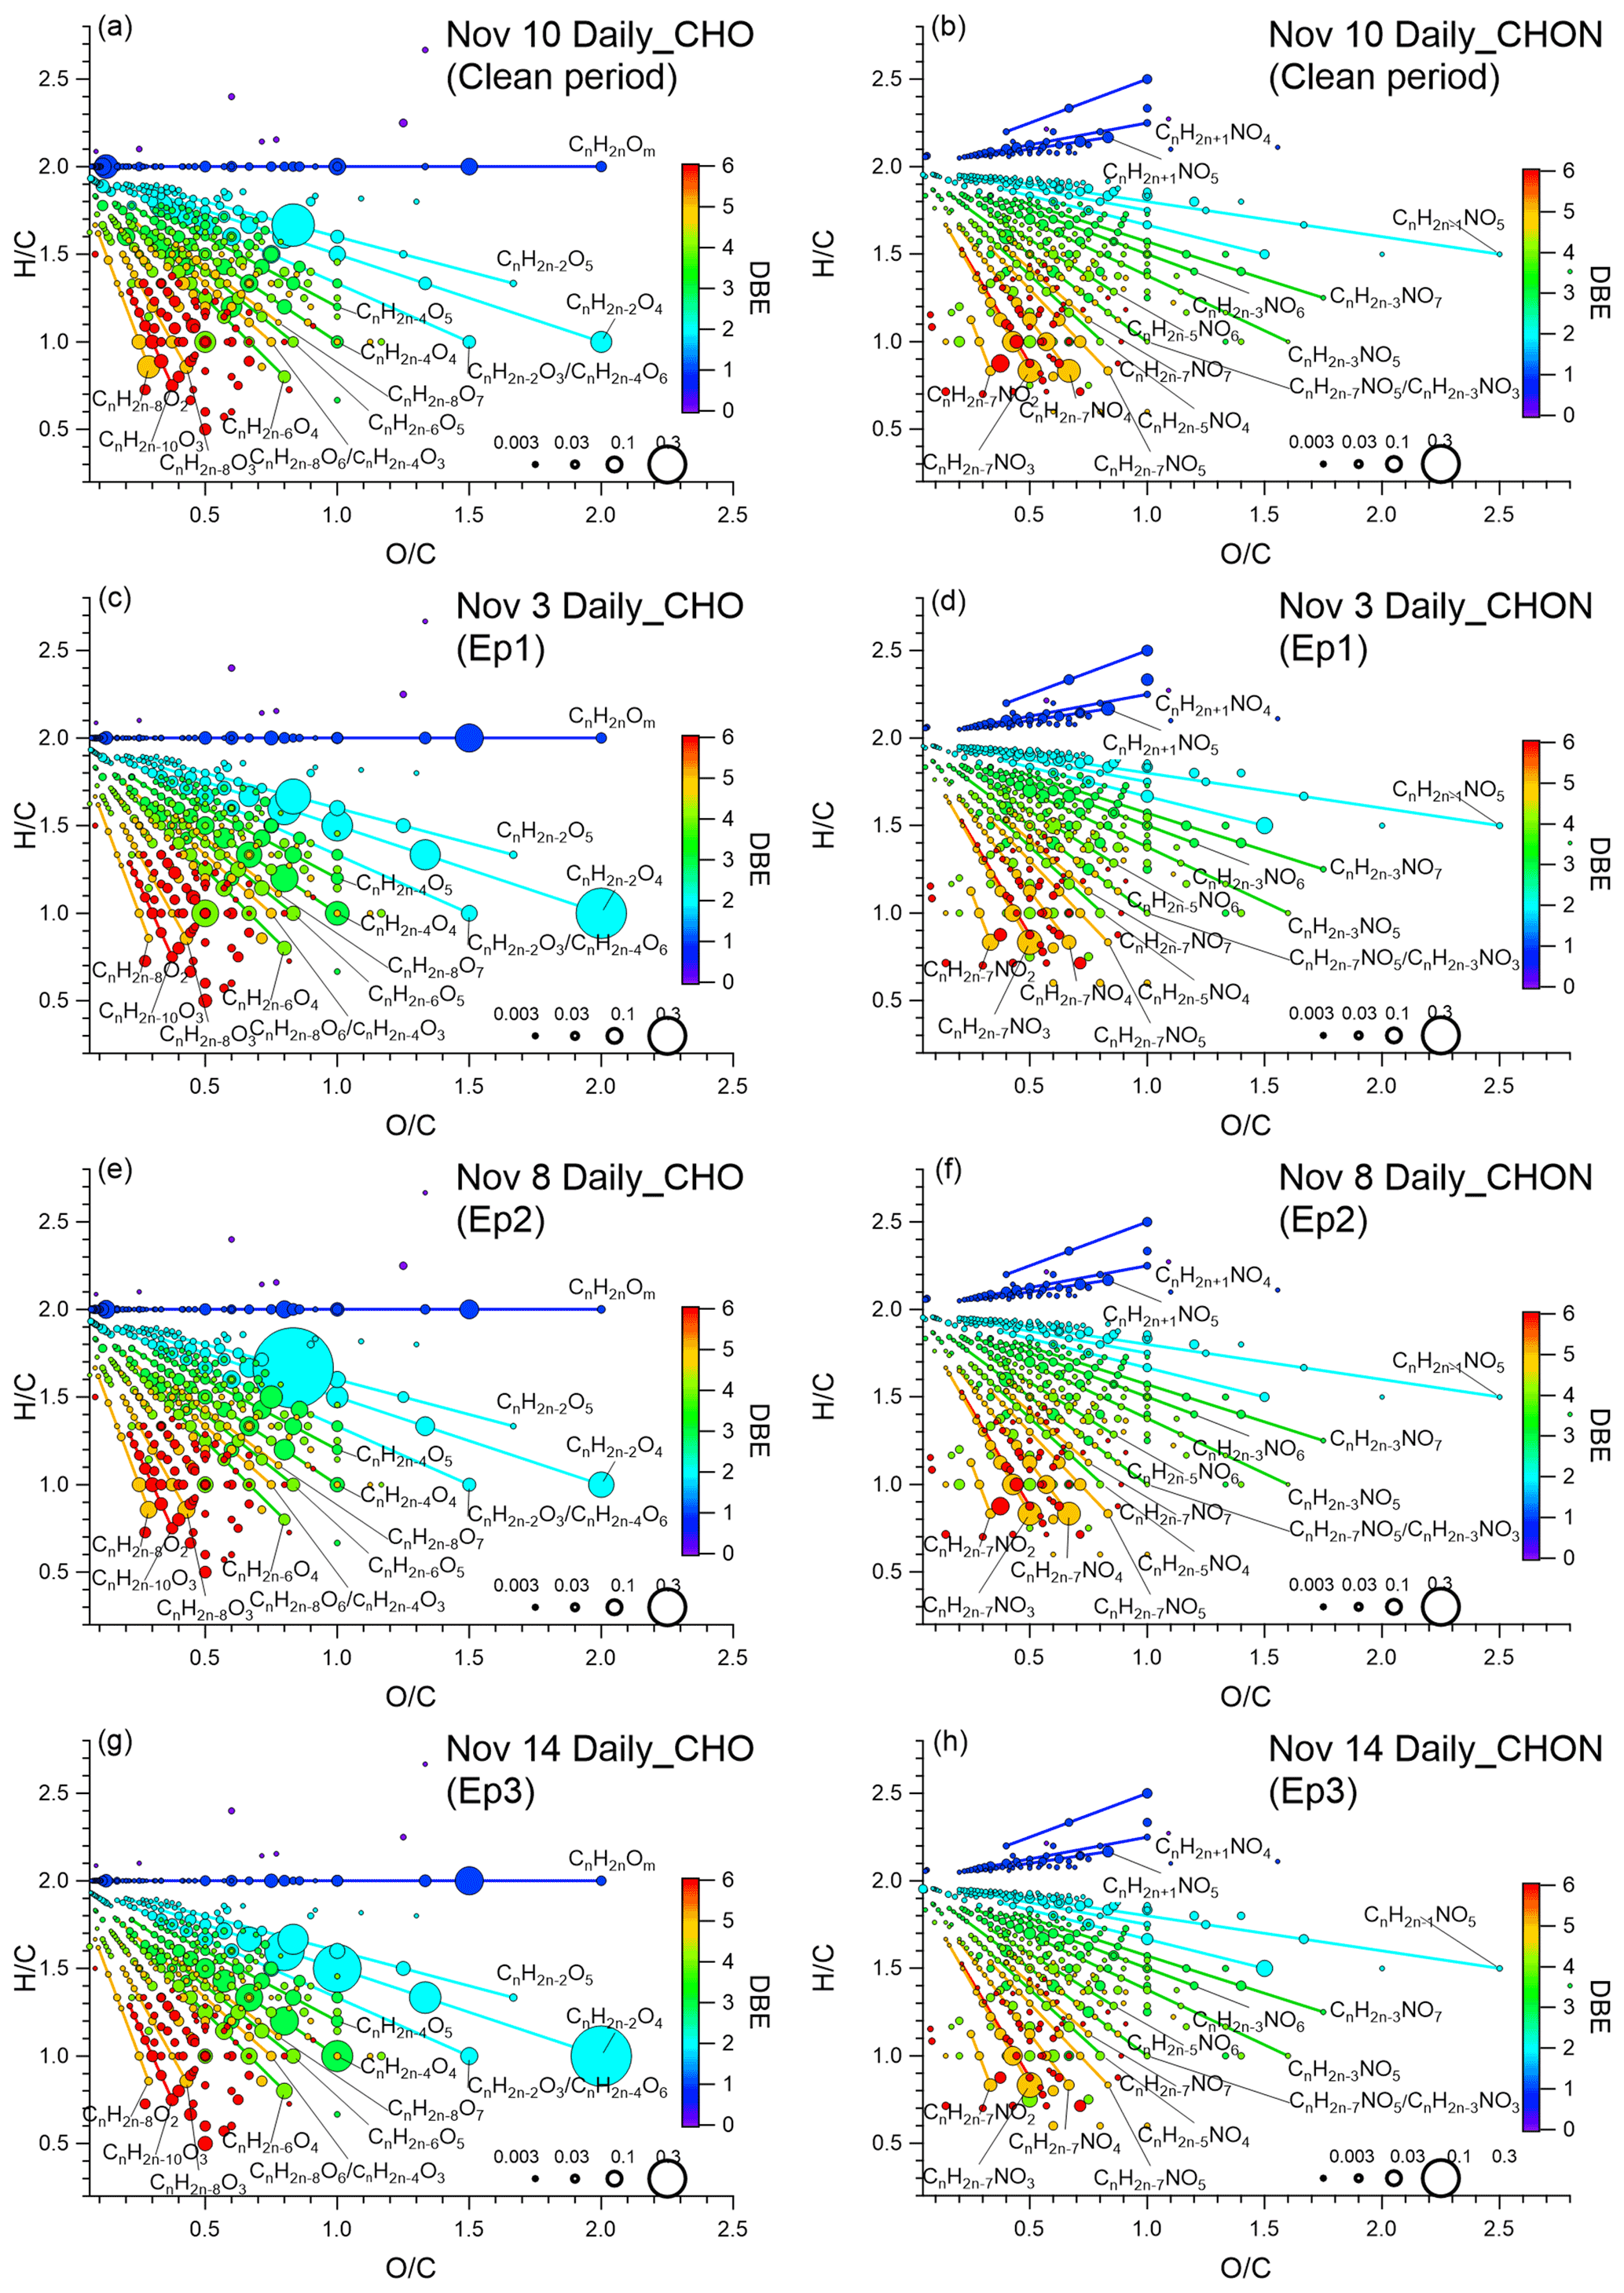
Figure 4(a) Van Krevelen (VK) diagram of CHO compounds in the clean period (10 November); (b) VK diagram of CHON compounds in the clean period (10 November); (c) VK diagram of CHO compounds in Ep1 (3 November); (d) VK diagram of CHON compounds in Ep1 (3 November); (e) VK diagram of CHO compounds in Ep2 (8 November); (f) VK diagram of CHON compounds in Ep2 (8 November); (g) VK diagrams of CHO compounds in Ep3 (14 November); (h) VK diagram of CHON compounds in Ep3 (14 November). Each dot represents an identified compound with its and ratios and color-coded by its DBEs. ratios in CHO and CHON groups were calculated from the atomic numbers in the formulae. The size of symbols is proportional to the square root of the relative contribution to the CHOX signal of each compound. The same Van Krevelen (VK) diagrams of CHO and CHON compounds but color-coded by the compounds' carbon number in the clean period, Ep1, Ep2, and Ep3 are shown in Fig. S14.
Generally, for Ep2 we found a number of CHO and CHON compounds reported from laboratory wood-burning aging experiments and ambient environments strongly influenced by biomass burning emissions (Lin et al., 2012; Mohr et al., 2013; Bertrand et al., 2018; Daellenbach et al., 2019) were enhanced compared to in the clean period, such as C6H10O5I− (24 times), C6H5NO4I− (33 times), and C7H7NO4I− (possibly methyl-nitrocatechol, 7.7 times) (shown in Fig. S7). The 72 h back trajectory (air mass retroplume) calculated for Ep2 shows an influence of southern areas at the receptor site, where residential biomass burning emissions are abundant (Fig. S8c and g).
In Ep1 and Ep3, as shown in Table S2, substantially higher absolute signals of inorganic ions were observed compared to in Ep2 (HNO3I−, 4 times (Ep1) and 3 times (Ep3); SO3I−, 39 times (Ep1) and >500 times (Ep3)) and the clean period (HNO3I−, 43 times (Ep1) and 27 times (Ep3); SO3I−, >200 times (Ep1) and 700 times (Ep3)). As discussed previously, it is worth noting that during heavy haze (Ep1 and Ep3), the signals of CH4SO3I− and C2H4SO4I− were much higher than during Ep2 (CH4SO3I−, 2 times for Ep1 and Ep3; C2H4SO4I−, 7 times (Ep1) and 8 times (Ep3)) and the clean period (C2H4SO4I−, 19 times for both Ep1 and Ep3; C2H4SO4I−, 46 times (Ep1) and 58 times (Ep3)). As shown in Fig. 4c, e, and g, a homologous-like series of dicarboxylic acids (CnH2n−2O4) and a series of compounds with one more DBE (CnH2n−4O4) were enhanced in Ep1 and Ep3 compared to in Ep2. Apart from oxalic acid discussed previously, other dicarboxylic-acid-like compounds such as C3H4O4I− (likely malonic acid), C4H6O4I− (likely succinic acid), and C5H8O4I− (likely glutaric acid) showed much higher (20–60 times) signals compared to in the clean period. These findings show that during humid haze in Beijing, a homologous series of dicarboxylic acids, likely formed in the aqueous phase, may make up a substantial fraction of the more oxygenated OOA (MO-OOA) found in previous studies (Sun et al., 2016). It is also interesting to note that the OA components measured in Ep1 and Ep3 were very similar to those measured at Peking University (PKU), Beijing, in winter 2017 during a haze episode with similar PM2.5 loadings (PKU, 188 µg m−3) and RH levels (PKU, 74 %) (Fig. S15; Zheng et al., 2021).
In summary, the haze episodes during our sampling period can be classified by two different formation pathways: (1) mainly influenced by relatively fresh biomass burning emissions under low RH with strong OA compound signals of levoglucosan, aromatics, and N-containing aromatics and (2) dominated by aqueous-phase reactions with high RH and air masses coming from the south of the NCP with more oxygenated and low-molecular-weight OA such as dicarboxylic acids. In the next section, we will investigate how the OA compounds formed in different haze types affect aerosol optical properties.
3.3 Influence of OA compounds on particle optical properties
3.3.1 Temporal variation in babs and Eabs
To investigate particle optical properties during the sampling period, we display the time series of the AAE, the BrC absorption coefficient, the ratio of BC to EC, and Eabs calculated together with OA (Fig. 5). The time series of BC and OA generally follow each other, with a stronger diel variation in BC, especially during Ep1 and Ep3 (shown in Fig. S8). The AAE exhibited an inverse correlation with OA during Ep1 and Ep3 but not Ep2, when biomass burning occurred. Although still higher than during Ep1 and Ep3, the AAE decreased from the end of Ep2 (8 November) to the clean period of 10 November. The average AAE during our sampling period was 1.4, slightly lower than in winter in Beijing (1.6; Xie et al., 2019b), likely due to the lower contribution of residential heating activities in autumn than in winter. The variation in AAE throughout the sampling period reflects aerosol optical properties being influenced by the variation in sources, compounds, pollution levels, and formation pathways. The temporal evolution of the normalized (to OA) is correlated with f60 (r=0.65) and shows an enhancement during Ep2 and decreases during Ep1 and Ep3 when aqueous-phase reactions may be important. It shows that even though the total OA concentrations and Eabs were strongly increased in Beijing during the humid haze, the light absorption ability of the OA compounds seemed to decrease.
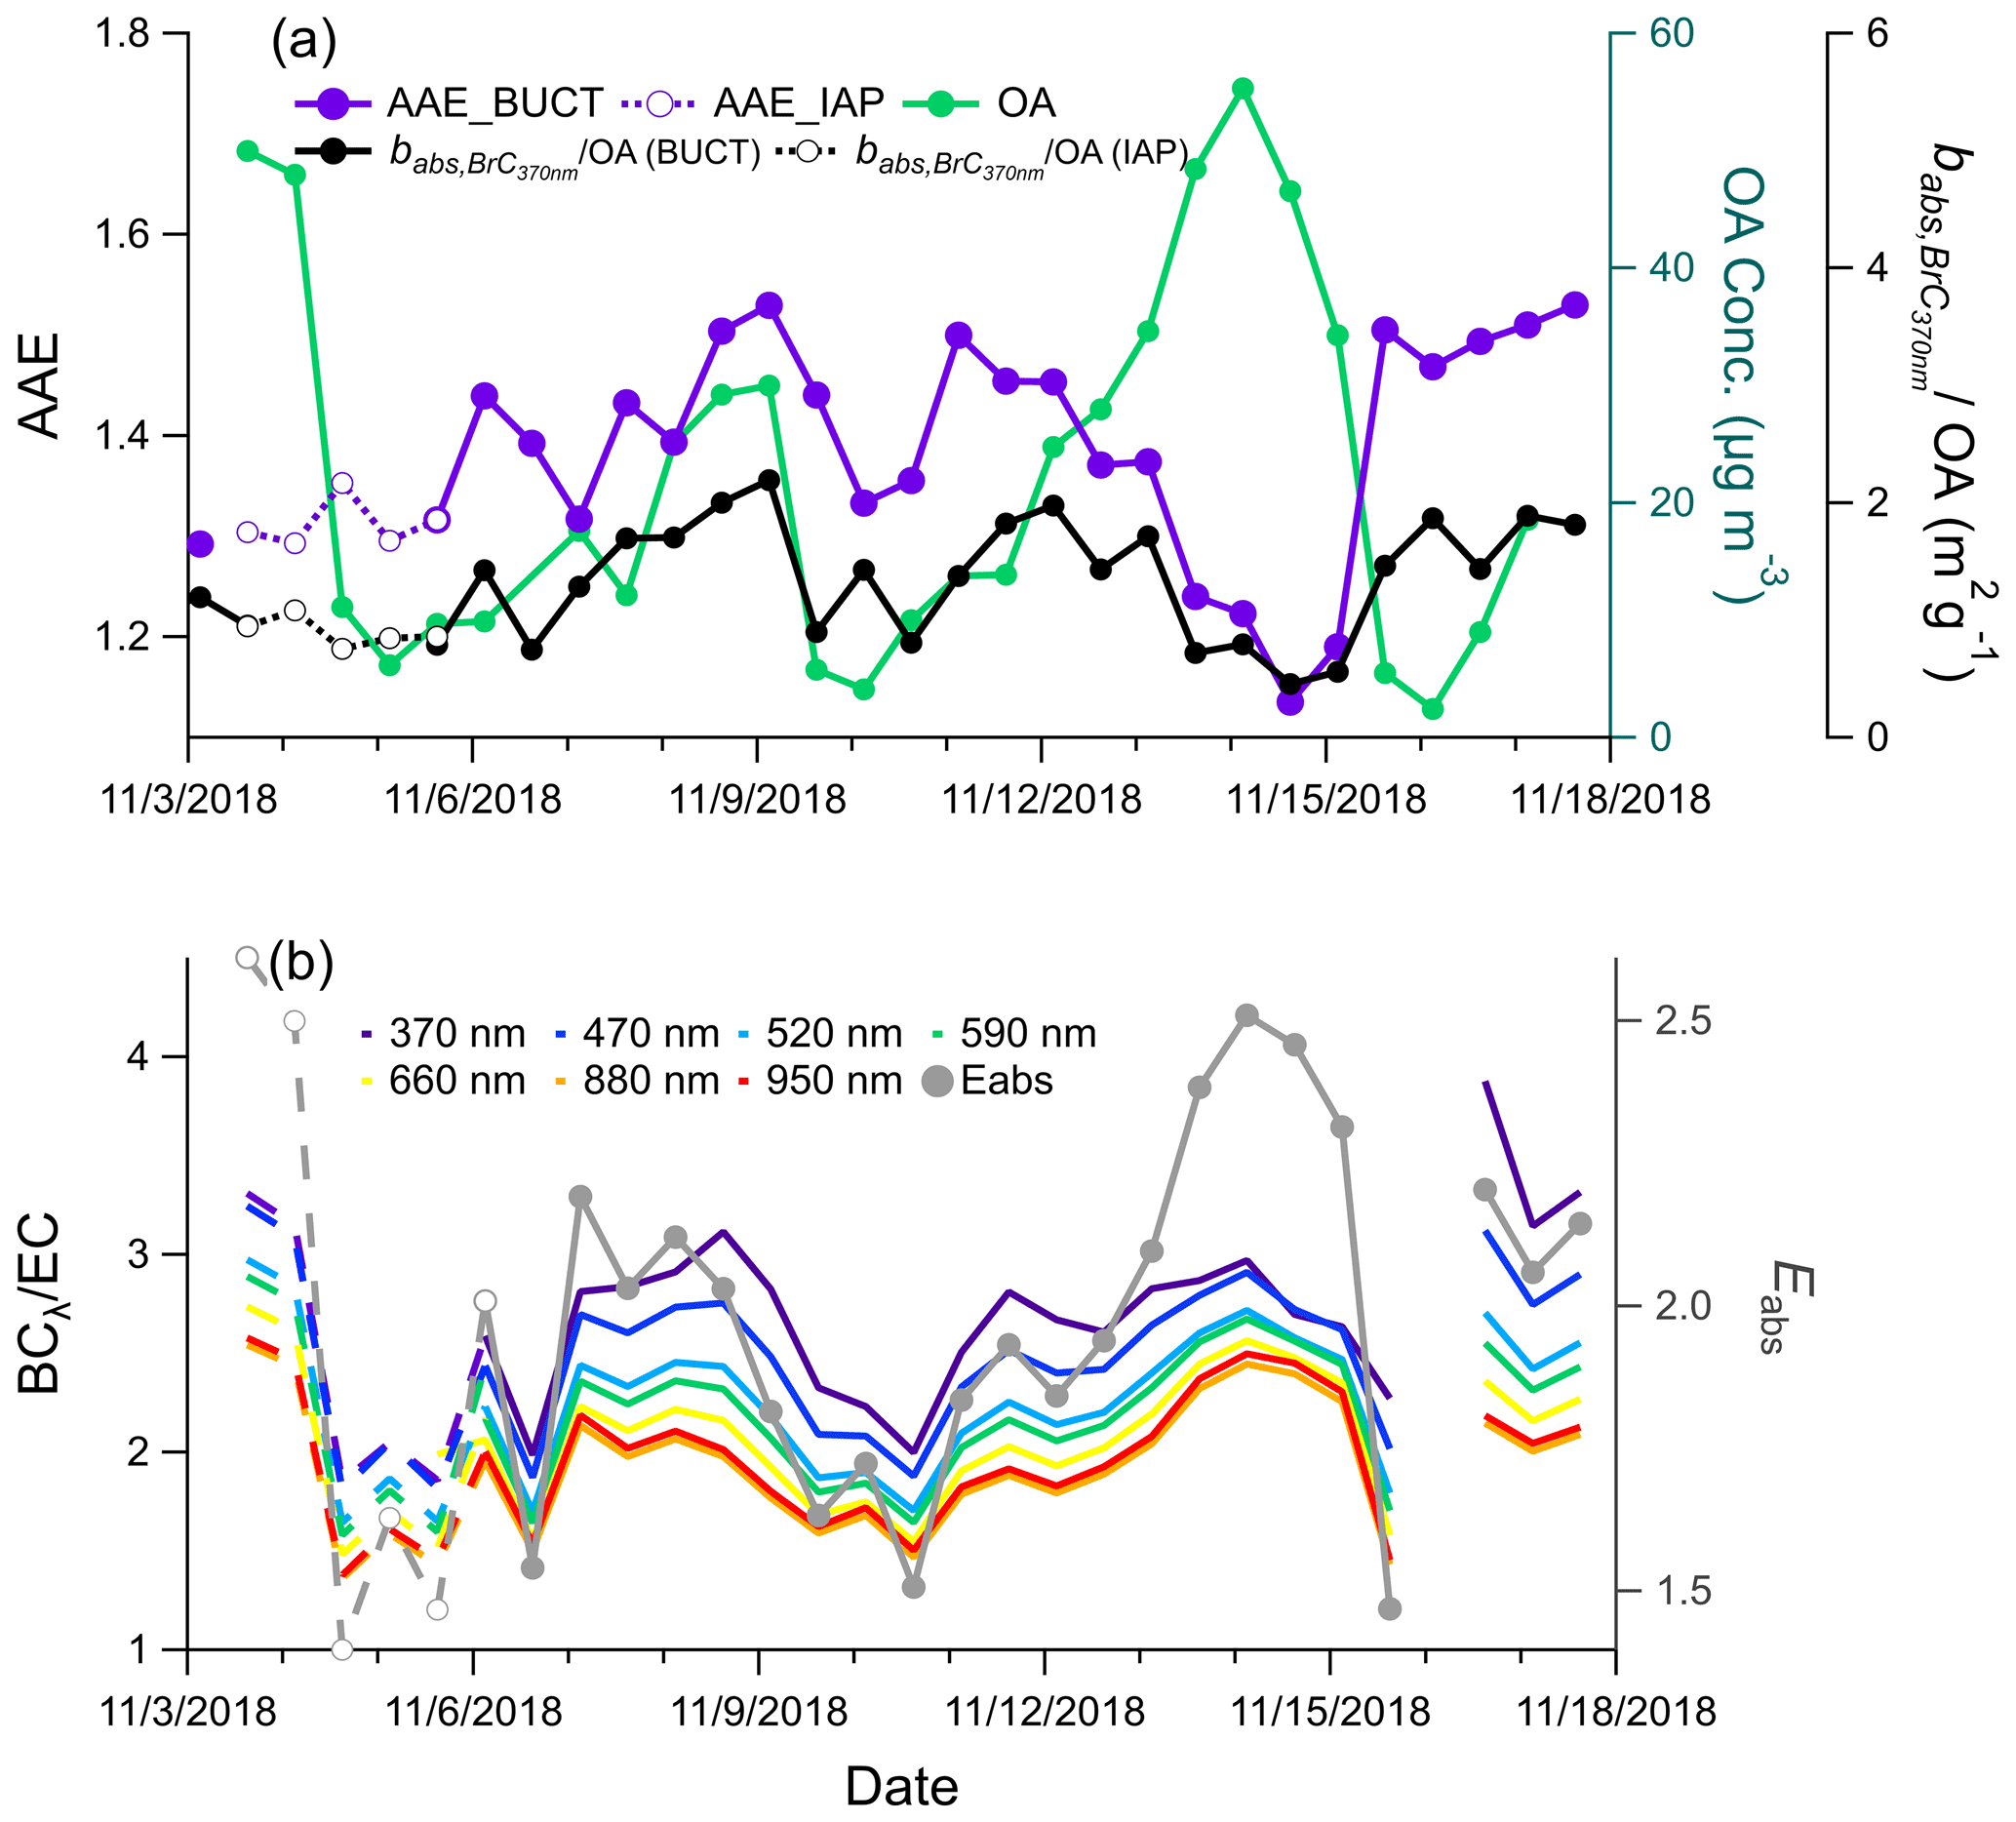
Figure 5(a) Time series of the AAE, normalized (normalized to OA), and OA measured by the ToF-ACSM during the sampling period; (b) ratio of BC to EC and Eabs calculated with BC880 nm and EC. The solid lines represent the parameters measured at the BUCT site, and the dashed lines represent the parameters measured at the IAP site. The date is given in the format month/day/year.
During Ep1 and Ep3, Eabs was higher than during Ep2, indicating that BC particles were more aged and more thickly coated by organic and inorganic constituents (Fig. S17). The lower Eabs of the clean period, on the other hand, implies that BC particles were more likely freshly emitted, and therefore less of a potential lensing effect could be observed. Ratios of PM2.5 major components to EC were used in a previous study to investigate shell effects on BC particles and Eabs (Zhang et al., 2018). Here, we show Eabs variation as a function of SIA-to-EC, primary organic aerosol (POA)-to-EC, and SOA-to-EC ratios (Fig. S16). POA and SOA were estimated based on an empirical formula with f44 and f57 from ToF-ACSM measurements as input (Ng et al., 2011). Consistent with earlier work conducted in Paris, France (Zhang et al., 2018), Eabs was substantially enhanced with an increasing SOA-to-EC ratio (up to 16), while the increase as a function of POA-to-EC and SIA-to-EC ratios was less prominent (shown in Fig. S16). SOA thus has the potential to be a more effective shell for BC particles than SIA and POA. The similarity of the AAE, Eabs patterns, and babs of different wavelengths from two sites ∼6 km apart (BUCT and IAP sites, Fig. S6) implies that these effects are likely to occur on a regional scale in Beijing. They suggest that the light absorption of BC and BrC particles can be strongly affected by different OA components and that the OA compounds formed in the two haze types have different light absorption properties.
3.3.2 Correlations between optical parameters and OA compound signals
OA compounds and their potential optical effects are investigated with a correlation analysis in this study. In Fig. 6, we show the histograms of the correlation coefficients (r) between the OA compound signals (normalized by EC), Eabs (Fig. 6a), and (Fig. 6c). We normalized OA and since BrC and BC could be co-varied due to the same sources and the influence of meteorology. We selected the 20 OA compounds with the highest r as “key compounds” for the Eabs of BC and for brown carbon light absorption. Among those key species, in Fig. 6 we mark the compounds that, according to their thermograms (Fig. S19), are likely influenced by thermal decomposition (C4H6O5I−, C5H12O5I−, C5H3NO3I−, C4H5NO3I−, C6H5NO4I−). Most of the other small compounds (Cnum <6) in the CHO (72 %, ) and CHON or CHOS (73 %, ) groups are not significantly influenced by thermal desorption.
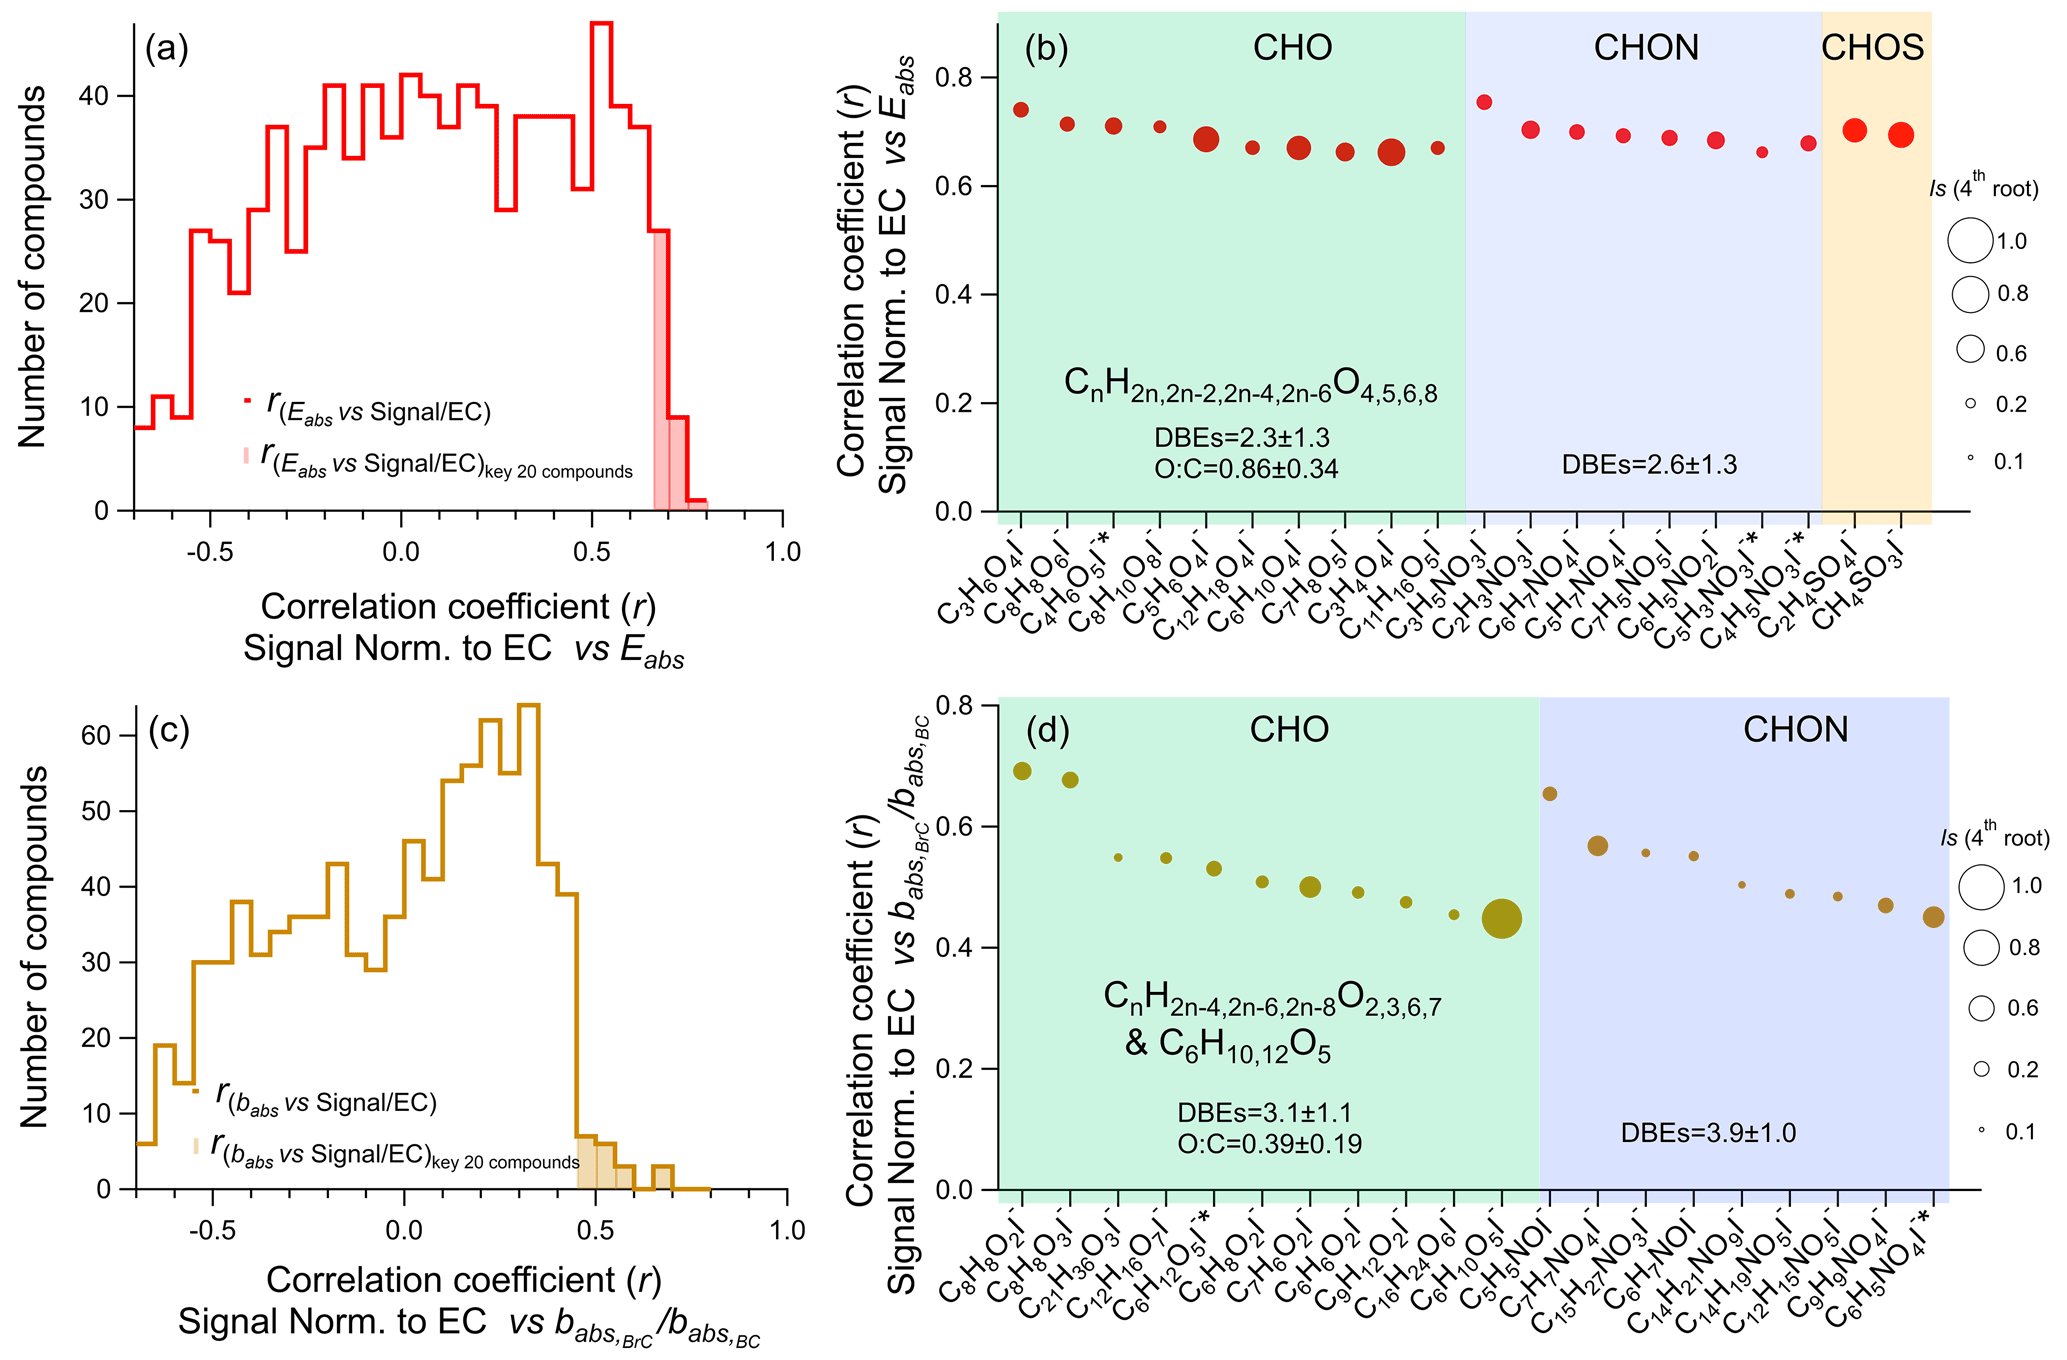
Figure 6(a) Histogram of the correlation coefficients (r) between the normalized OA signals and Eabs at 880 nm for all identified compounds (red line) and the 20 key compounds (red-shaded area); (b) the correlation coefficients of the 20 key compounds for Eabs at 880 nm; (c) histogram of the correlation coefficients between the normalized OA compound signals and at 370 nm for all identified compounds (brown line) and the 20 key compounds (brown-shaded area); (d) the correlation coefficients of the 20 key compounds for at 370 nm. The size of the symbols in (b) and (d) is proportional to the fourth root of the average signal intensities of the corresponding compound during the whole sampling period. Compounds that possibly have a substantial contribution of larger thermally fragmented parent compounds are marked with * in the axis labels.
The key compounds for Eabs generally exhibited relatively low DBEs (2.3 ± 1.3 for the CHO group and 2.6 ± 1.3 for the CHON group) and high ratios (0.86 ± 0.34 for the CHO group). The much higher ratio of those compounds compared to all CHO compounds (0.48 ± 0.31) indicates that highly oxygenated SOA plays an important role in BC lensing effects and the Eabs of BC. CHON with two to four DBEs such as CnH2n−1NO and CnH2n−3NO (e.g., amine/amides and organonitrites as well as organonitrates) also exhibited a high correlation with Eabs. Overall, low-molecular-weight compounds – CHO with four or five oxygen atoms and CHON compounds with three to five oxygen atoms, such as C3H4O4I−, C3H6O4I−, C5H6O4I−, C6H10O4I−, C3H5NO3I−, and C2H3NO3I− – exhibited the highest correlation with Eabs at 880 nm, with r values of 0.66–0.76. Their time series were similar, with strong enhancement during Ep1 and Ep3 (Fig. S17). It has been suggested previously that MO-OOA could be more important for the BC lensing effect than less oxygenated OOA (LO-OOA) and POA (Zhang et al., 2018). Based on our results we conclude that those small compounds (e.g., dicarboxylic acids) potentially act as important coating shells, creating a strong light absorption enhancement for BC during the humid haze events. It should be noted that OA compounds could be both internally and externally mixed with BC-containing particles, and thus, the identified OA compounds may not necessarily be coatings on BC particles. Yet, considering the large proportion total particles that are BC-containing particles during the heating season (60 %–78 %; Chen et al., 2020) as well as the large proportion of organics in BC-containing particles in Beijing (60 %; J. Wang et al., 2019), these OA compounds are very likely important components of the BC coating shells with a high potential to increase Eabs.
Compared to Eabs, the key compounds for babs,BrC such as C8H8O2I−, C8H8O3I−, C5H5NOI−, and C7H7NO4I− in general exhibit higher DBEs (3.1 ± 1.1 for the CHO group and 3.9 ± 1.0 for the CHON group) and lower ratios (0.39 ± 0.19 for the CHO group). These compounds are likely oxidized aromatics and nitro-aromatics. Apart from the aromatic-like compounds, C6H10O5I− (e.g., levoglucosan) and C6H12O5I− were also found to be moderately correlated with , likely due to their co-variation with light-absorbing carbon from biomass burning emissions. The time series of the key compounds for babs all showed a large enrichment during Ep2 (shown in Fig. S17), confirming that biomass-burning-related organics (e.g., aromatics) and N-containing organics (e.g., nitrophenol and nitrocatechol derivatives) were important contributors to the light absorption by brown carbon. The correlation coefficient of the normalized OA compounds' signals and was observed to be lower than the normalized signals with Eabs. The generally higher correlation for Eabs is likely due to the co-varied time series for OA components and Eabs during the haze periods.
In summary, we presented a series of OA compounds that have the potential to influence OA light absorption in two ways in Beijing: (1) during humid haze, more oxygenated OA, with compounds such as dicarboxylic acids likely formed in aqueous-phase reactions, has the potential to strongly increase the absorption by BC due to the lensing effect; (2) during haze dominated by fresh biomass burning emissions, compounds with a high number of DBEs and low O numbers, such as aromatics and N-containing aromatics, can act as brown carbon and potentially lead to more absorption at shorter wavelengths.
Although OA was earlier found to be one of the dominant factors for aerosol optical effects, the chemical composition of OA may act in different roles in aerosol light absorption. To investigate the chemical composition of OA in a polluted megacity and its effects on particle optical properties, in this study for the first time we relied on the molecular composition of OA in autumn in Beijing determined by a FIGAERO–CIMS. We found that during severe humid haze periods, compounds with a low number of DBEs and high ratios (e.g., dicarboxylic acids) were strongly enhanced. In contrast, during a strong biomass burning episode characterized by low AWC, compounds with a high number of DBEs and low ratios were observed. The comparison between low- and high-RH haze conditions indicates different mechanisms for haze formation in Beijing, where the former was mainly influenced by local emissions and the latter was governed by secondary components (potentially formed via aqueous-phase reactions) and more influenced by air masses from the southern NCP areas. This implies that in order to reduce pollution in Beijing, the implementation of local direct particle emission control and gaseous precursor emission control in the areas south of Beijing is necessary.
By combining the molecular composition of OA with aerosol light absorption measurements, we found that the compounds that are highly oxygenated, with a low number of carbon atoms and four oxygen atoms (e.g., dicarboxylic acids), strongly increased during humid haze periods and highly correlated with Eabs. They are thus likely an important contributor to the coating shells of BC particles and also a potentially important contributor of Eabs. Contrarily, the contributions of oxygenated aromatics and nitro-aromatics were found to be closely linked to the light absorption of BrC.
In summary, we determined two kinds of haze episode formed by different mechanisms in autumn in Beijing: (1) driven by high AWC and secondary formation and (2) driven by fresh emissions from biomass burning activities. We also determined the OA molecular composition in those two types of episode and in clean periods, which in turn influenced aerosol optical effects. This is a step towards a better understanding of anthropogenic SOA formation in a highly populated megacity, its impacts on the local climate, and its contribution to the air pollution cocktail.
Data used in figures are available from the Zenodo online repository (DOI https://doi.org/10.5281/zenodo.5771527, Cai, 2021). Supporting data are available from the authors upon request.
The supplement related to this article is available online at: https://doi.org/10.5194/acp-22-1251-2022-supplement.
MK, CM, KRD, and JC designed the research. JC, CW, CM, and KRD analyzed the FIGAERO–CIMS data. JC, JW, XF, and KRD analyzed the aethalometer data for the BUCT site. JW and YS provided aethalometer data for the IAP site. JC, WD, FZ, SH, XF, BC, LY, ZF, YL, WD, JZ, CY, FB, CM, MK, and KRD performed the online measurements and interpreted the results. JW provided the emission inventory for North China, and SH provided back trajectory analysis. MK supported and supervised this research. JC, KRD, and CM wrote the manuscript with contributions from all co-authors. All authors have given approval to the final version of this paper.
The contact author has declared that neither they nor their co-authors have any competing interests
Publisher's note: Copernicus Publications remains neutral with regard to jurisdictional claims in published maps and institutional affiliations.
This article is part of the special issue “Pan-Eurasian Experiment (PEEX) – Part II”. It is not associated with a conference.
This work was supported by the Knut and Alice Wallenberg Foundation (WAF project CLOUDFORM, grant no. 2017.0165), ACCC Flagship funded by the Academy of Finland (337549), the “Quantifying carbon sink, CarbonSink+ and their interaction with air quality” INAR project funded by the Jane and Aatos Erkko Foundation, and the European Research Council (ERC) with the projects ATM-GTP (no. 742206) and CHAPAs (no. 850614). Kaspar Rudolf Daellenbach acknowledges support by the SNF mobility grant P2EZP2_181599. Jing Cai acknowledges support from the Jenny and Antti Wihuri Foundation.
This research has been supported by the Knut and Alice Wallenberg Foundation (WAF project CLOUDFORM, grant no. 2017.0165), ACCC Flagship funded by the Academy of Finland (grant no. 337549), the “Quantifying carbon sink, CarbonSinkC and their interaction with air quality” INAR project funded by the Jane and Aatos Erkko Foundation, and the European Research Council (ERC) with the projects ATM-GTP (grant no. 742206) and CHAPAs (grant no. 850614). Kaspar Rudolf Daellenbach was supported by SNF mobility (grant no. P2EZP2_181599).
The article processing charges for this open-access publication were covered by Stockholm University.
This paper was edited by Lea Hildebrandt Ruiz and reviewed by Arttu Ylisirniö and one anonymous referee.
Bertrand, A., Stefenelli, G., Jen, C. N., Pieber, S. M., Bruns, E. A., Ni, H., Temime-Roussel, B., Slowik, J. G., Goldstein, A. H., El Haddad, I., Baltensperger, U., Prévôt, A. S. H., Wortham, H., and Marchand, N.: Evolution of the chemical fingerprint of biomass burning organic aerosol during aging, Atmos. Chem. Phys., 18, 7607–7624, https://doi.org/10.5194/acp-18-7607-2018, 2018.
Bond, T. C. and Bergstrom, R. W.: Light Absorption by Carbonaceous Particles: An Investigative Review, Aerosol Sci. Tech., 40, 27–67, https://doi.org/10.1080/02786820500421521, 2007.
Buchholz, A., Ylisirniö, A., Huang, W., Mohr, C., Canagaratna, M., Worsnop, D. R., Schobesberger, S., and Virtanen, A.: Deconvolution of FIGAERO–CIMS thermal desorption profiles using positive matrix factorisation to identify chemical and physical processes during particle evaporation, Atmos. Chem. Phys., 20, 7693–7716, https://doi.org/10.5194/acp-20-7693-2020, 2020.
Cai, J.: Influence of organic aerosol composition determined by offline FIGAERO-CIMS on particle absorptive properties in autumn Beijing, Zenodo [data set], https://doi.org/10.5281/zenodo.5771527, 2021.
Cai, J., Zheng, M., Yan, C., Fu, H.-Y., Zhang, Y.-J., Li, M., Zhou, Z., and Zhang, Y.-H.: Application and Progress of Single Particle Aerosol Time-of-Flight Mass Spectrometry in Fine Particulate Matter Research, Chinese J. Anal. Chem., 43, 765–774, https://doi.org/10.1016/S1872-2040(15)60825-8, 2015.
Cai, J., Wang, J., Zhang, Y., Tian, H., Zhu, C., Gross, D. S., Hu, M., Hao, J., He, K., Wang, S., and Zheng, M.: Source apportionment of Pb-containing particles in Beijing during January 2013, Environ. Pollut., 226, 30–40, https://doi.org/10.1016/j.envpol.2017.04.004, 2017.
Cai, J., Chu, B., Yao, L., Yan, C., Heikkinen, L. M., Zheng, F., Li, C., Fan, X., Zhang, S., Yang, D., Wang, Y., Kokkonen, T. V., Chan, T., Zhou, Y., Dada, L., Liu, Y., He, H., Paasonen, P., Kujansuu, J. T., Petäjä, T., Mohr, C., Kangasluoma, J., Bianchi, F., Sun, Y., Croteau, P. L., Worsnop, D. R., Kerminen, V.-M., Du, W., Kulmala, M., and Daellenbach, K. R.: Size-segregated particle number and mass concentrations from different emission sources in urban Beijing, Atmos. Chem. Phys., 20, 12721–12740, https://doi.org/10.5194/acp-20-12721-2020, 2020.
Cai, R., Yan, C., Yang, D., Yin, R., Lu, Y., Deng, C., Fu, Y., Ruan, J., Li, X., Kontkanen, J., Zhang, Q., Kangasluoma, J., Ma, Y., Hao, J., Worsnop, D. R., Bianchi, F., Paasonen, P., Kerminen, V.-M., Liu, Y., Wang, L., Zheng, J., Kulmala, M., and Jiang, J.: Sulfuric acid–amine nucleation in urban Beijing, Atmos. Chem. Phys., 21, 2457–2468, https://doi.org/10.5194/acp-21-2457-2021, 2021.
Canagaratna, M. R., Jayne, J. T., Jimenez, J. L., Allan, J. D., Alfarra, M. R., Zhang, Q., Onasch, T. B., Drewnick, F., Coe, H., Middlebrook, A., Delia, A., Williams, L. R., Trimborn, A. M., Northway, M. J., DeCarlo, P. F., Kolb, C. E., Davidovits, P., and Worsnop, D. R.: Chemical and microphysical characterization of ambient aerosols with the aerodyne aerosol mass spectrometer, Mass Spectrom. Rev., 26, 185–222, https://doi.org/10.1002/mas.20115, 2007.
Chen, L., Zhang, F., Yan, P., Wang, X., Sun, L., Li, Y., Zhang, X., Sun, Y., and Li, Z.: The large proportion of black carbon (BC)-containing aerosols in the urban atmosphere, Environ. Pollut., 263, 114507, https://doi.org/10.1016/j.envpol.2020.114507, 2020.
Cheng, Y., He, K. B., Duan, F. K., Zheng, M., Ma, Y. L., and Tan, J. H.: Measurement of semivolatile carbonaceous aerosols and its implications: a review, Environ. Int., 35, 674–681, https://doi.org/10.1016/j.envint.2008.11.007, 2009.
Cheng, Y., He, K.-B., Du, Z.-Y., Engling, G., Liu, J.-M., Ma, Y.-L., Zheng, M., and Weber, R. J.: The characteristics of brown carbon aerosol during winter in Beijing, Atmos. Environ., 127, 355–364, https://doi.org/10.1016/j.atmosenv.2015.12.035, 2016a.
Cheng, Y., Zheng, G., Wei, C., Mu, Q., Zheng, B., Wang, Z., Gao, M., Zhang, Q., He, K., Carmichael, G., Pöschl, U., and Su, H.: Reactive nitrogen chemistry in aerosol water as a source of sulfate during haze events in China, 2, e1601530, https://doi.org/10.1126/sciadv.1601530, 2016b.
Cubison, M. J., Ortega, A. M., Hayes, P. L., Farmer, D. K., Day, D., Lechner, M. J., Brune, W. H., Apel, E., Diskin, G. S., Fisher, J. A., Fuelberg, H. E., Hecobian, A., Knapp, D. J., Mikoviny, T., Riemer, D., Sachse, G. W., Sessions, W., Weber, R. J., Weinheimer, A. J., Wisthaler, A., and Jimenez, J. L.: Effects of aging on organic aerosol from open biomass burning smoke in aircraft and laboratory studies, Atmos. Chem. Phys., 11, 12049–12064, https://doi.org/10.5194/acp-11-12049-2011, 2011.
Cui, M., Li, C., Chen, Y., Zhang, F., Li, J., Jiang, B., Mo, Y., Li, J., Yan, C., Zheng, M., Xie, Z., Zhang, G., and Zheng, J.: Molecular characterization of polar organic aerosol constituents in off-road engine emissions using Fourier transform ion cyclotron resonance mass spectrometry (FT-ICR MS): implications for source apportionment, Atmos. Chem. Phys., 19, 13945–13956, https://doi.org/10.5194/acp-19-13945-2019, 2019.
Daellenbach, K. R., Bozzetti, C., Křepelová, A., Canonaco, F., Wolf, R., Zotter, P., Fermo, P., Crippa, M., Slowik, J. G., Sosedova, Y., Zhang, Y., Huang, R.-J., Poulain, L., Szidat, S., Baltensperger, U., El Haddad, I., and Prévôt, A. S. H.: Characterization and source apportionment of organic aerosol using offline aerosol mass spectrometry, Atmos. Meas. Tech., 9, 23–39, https://doi.org/10.5194/amt-9-23-2016, 2016.
Daellenbach, K. R., Kourtchev, I., Vogel, A. L., Bruns, E. A., Jiang, J., Petäjä, T., Jaffrezo, J.-L., Aksoyoglu, S., Kalberer, M., Baltensperger, U., El Haddad, I., and Prévôt, A. S. H.: Impact of anthropogenic and biogenic sources on the seasonal variation in the molecular composition of urban organic aerosols: a field and laboratory study using ultra-high-resolution mass spectrometry, Atmos. Chem. Phys., 19, 5973–5991, https://doi.org/10.5194/acp-19-5973-2019, 2019.
Daellenbach, K. R., Uzu, G., Jiang, J., Cassagnes, L.-E., Leni, Z., Vlachou, A., Stefenelli, G., Canonaco, F., Weber, S., Segers, A., Kuenen, J. J. P., Schaap, M., Favez, O., Albinet, A., Aksoyoglu, S., Dommen, J., Baltensperger, U., Geiser, M., El Haddad, I., Jaffrezo, J.-L., and Prévôt, A. S. H.: Sources of particulate-matter air pollution and its oxidative potential in Europe, Nature, 587, 414–419, https://doi.org/10.1038/s41586-020-2902-8, 2020.
Du, W., Zhao, J., Wang, Y., Zhang, Y., Wang, Q., Xu, W., Chen, C., Han, T., Zhang, F., Li, Z., Fu, P., Li, J., Wang, Z., and Sun, Y.: Simultaneous measurements of particle number size distributions at ground level and 260 m on a meteorological tower in urban Beijing, China, Atmos. Chem. Phys., 17, 6797–6811, https://doi.org/10.5194/acp-17-6797-2017, 2017.
Eresmaa, N., Härkönen, J., Joffre, S. M., Schultz, D. M., Karppinen, A., and Kukkonen, J.: A Three-Step Method for Estimating the Mixing Height Using Ceilometer Data from the Helsinki Testbed, J. Appl. Meteorol. Clim., 51, 2172–2187, https://doi.org/10.1175/jamc-d-12-058.1, 2012.
Fleming, L. T., Lin, P., Roberts, J. M., Selimovic, V., Yokelson, R., Laskin, J., Laskin, A., and Nizkorodov, S. A.: Molecular composition and photochemical lifetimes of brown carbon chromophores in biomass burning organic aerosol, Atmos. Chem. Phys., 20, 1105–1129, https://doi.org/10.5194/acp-20-1105-2020, 2020.
Fountoukis, C. and Nenes, A.: ISORROPIA II: a computationally efficient thermodynamic equilibrium model for K+–Ca2+–Mg2+–NH–Na+–SO–NO–Cl−–H2O aerosols, Atmos. Chem. Phys., 7, 4639–4659, https://doi.org/10.5194/acp-7-4639-2007, 2007.
Guo, H., Liu, J., Froyd, K. D., Roberts, J. M., Veres, P. R., Hayes, P. L., Jimenez, J. L., Nenes, A., and Weber, R. J.: Fine particle pH and gas–particle phase partitioning of inorganic species in Pasadena, California, during the 2010 CalNex campaign, Atmos. Chem. Phys., 17, 5703–5719, https://doi.org/10.5194/acp-17-5703-2017, 2017.
Guo, S., Hu, M., Wang, Z. B., Slanina, J., and Zhao, Y. L.: Size-resolved aerosol water-soluble ionic compositions in the summer of Beijing: implication of regional secondary formation, Atmos. Chem. Phys., 10, 947–959, https://doi.org/10.5194/acp-10-947-2010, 2010.
Guo, S., Hu, M., Guo, Q., Zhang, X., Zheng, M., Zheng, J., Chang, C. C., Schauer, J. J., and Zhang, R.: Primary Sources and Secondary Formation of Organic Aerosols in Beijing, China, Environ. Sci. Technol., 46, 9846–9853, https://doi.org/10.1021/es2042564, 2012.
Hansen, A., Rosen, H., and Novakov, T.: Aethalometer – an instrument for the real-time measurement of optical absorption by aerosol particles, Lawrence Berkeley Lab., CA, USA, 1983.
Hu, W., Hu, M., Hu, W.-W., Zheng, J., Chen, C., Wu, Y., and Guo, S.: Seasonal variations in high time-resolved chemical compositions, sources, and evolution of atmospheric submicron aerosols in the megacity Beijing, Atmos. Chem. Phys., 17, 9979–10000, https://doi.org/10.5194/acp-17-9979-2017, 2017.
Huang, R. J., Zhang, Y., Bozzetti, C., Ho, K. F., Cao, J. J., Han, Y., Daellenbach, K. R., Slowik, J. G., Platt, S. M., Canonaco, F., Zotter, P., Wolf, R., Pieber, S. M., Bruns, E. A., Crippa, M., Ciarelli, G., Piazzalunga, A., Schwikowski, M., Abbaszade, G., Schnelle-Kreis, J., Zimmermann, R., An, Z., Szidat, S., Baltensperger, U., El Haddad, I., and Prevot, A. S.: High secondary aerosol contribution to particulate pollution during haze events in China, Nature, 514, 218–222, https://doi.org/10.1038/nature13774, 2014.
Huang, W., Saathoff, H., Shen, X., Ramisetty, R., Leisner, T., and Mohr, C.: Seasonal characteristics of organic aerosol chemical composition and volatility in Stuttgart, Germany, Atmos. Chem. Phys., 19, 11687–11700, https://doi.org/10.5194/acp-19-11687-2019, 2019.
Jacobson, M. Z.: Strong radiative heating due to the mixing state of black carbon in atmospheric aerosols, Nature, 409, 695–697, https://doi.org/10.1038/35055518, 2001.
Jimenez, J. L., Canagaratna, M. R., Donahue, N. M., Prevot, A. S., Zhang, Q., Kroll, J. H., DeCarlo, P. F., Allan, J. D., Coe, H., Ng, N. L., Aiken, A. C., Docherty, K. S., Ulbrich, I. M., Grieshop, A. P., Robinson, A. L., Duplissy, J., Smith, J. D., Wilson, K. R., Lanz, V. A., Hueglin, C., Sun, Y. L., Tian, J., Laaksonen, A., Raatikainen, T., Rautiainen, J., Vaattovaara, P., Ehn, M., Kulmala, M., Tomlinson, J. M., Collins, D. R., Cubison, M. J., Dunlea, E. J., Huffman, J. A., Onasch, T. B., Alfarra, M. R., Williams, P. I., Bower, K., Kondo, Y., Schneider, J., Drewnick, F., Borrmann, S., Weimer, S., Demerjian, K., Salcedo, D., Cottrell, L., Griffin, R., Takami, A., Miyoshi, T., Hatakeyama, S., Shimono, A., Sun, J. Y., Zhang, Y. M., Dzepina, K., Kimmel, J. R., Sueper, D., Jayne, J. T., Herndon, S. C., Trimborn, A. M., Williams, L. R., Wood, E. C., Middlebrook, A. M., Kolb, C. E., Baltensperger, U., and Worsnop, D. R.: Evolution of organic aerosols in the atmosphere, Science, 326, 1525–1529, https://doi.org/10.1126/science.1180353, 2009.
Kontkanen, J., Deng, C., Fu, Y., Dada, L., Zhou, Y., Cai, J., Daellenbach, K. R., Hakala, S., Kokkonen, T. V., Lin, Z., Liu, Y., Wang, Y., Yan, C., Petäjä, T., Jiang, J., Kulmala, M., and Paasonen, P.: Size-resolved particle number emissions in Beijing determined from measured particle size distributions, Atmos. Chem. Phys., 20, 11329–11348, https://doi.org/10.5194/acp-20-11329-2020, 2020.
Kulmala, M., Dada, L., Daellenbach, K. R., Yan, C., Stolzenburg, D., Kontkanen, J., Ezhova, E., Hakala, S., Tuovinen, S., Kokkonen, T. V., Kurppa, M., Cai, R., Zhou, Y., Yin, R., Baalbaki, R., Chan, T., Chu, B., Deng, C., Fu, Y., Ge, M., He, H., Heikkinen, L., Junninen, H., Liu, Y., Lu, Y., Nie, W., Rusanen, A., Vakkari, V., Wang, Y., Yang, G., Yao, L., Zheng, J., Kujansuu, J., Kangasluoma, J., Petaja, T., Paasonen, P., Jarvi, L., Worsnop, D., Ding, A., Liu, Y., Wang, L., Jiang, J., Bianchi, F., and Kerminen, V. M.: Is reducing new particle formation a plausible solution to mitigate particulate air pollution in Beijing and other Chinese megacities?, Faraday Discuss., 226, 334–347, https://doi.org/10.1039/d0fd00078g, 2021.
Lack, D. A. and Langridge, J. M.: On the attribution of black and brown carbon light absorption using the Ångström exponent, Atmos. Chem. Phys., 13, 10535–10543, https://doi.org/10.5194/acp-13-10535-2013, 2013.
Laskin, A., Laskin, J., and Nizkorodov, S. A.: Chemistry of atmospheric brown carbon, Chem. Rev., 115, 4335–4382, https://doi.org/10.1021/cr5006167, 2015.
Le Breton, M., Wang, Y., Hallquist, Å. M., Pathak, R. K., Zheng, J., Yang, Y., Shang, D., Glasius, M., Bannan, T. J., Liu, Q., Chan, C. K., Percival, C. J., Zhu, W., Lou, S., Topping, D., Wang, Y., Yu, J., Lu, K., Guo, S., Hu, M., and Hallquist, M.: Online gas- and particle-phase measurements of organosulfates, organosulfonates and nitrooxy organosulfates in Beijing utilizing a FIGAERO ToF-CIMS, Atmos. Chem. Phys., 18, 10355–10371, https://doi.org/10.5194/acp-18-10355-2018, 2018.
Lelieveld, J., Evans, J. S., Fnais, M., Giannadaki, D., and Pozzer, A.: The contribution of outdoor air pollution sources to premature mortality on a global scale, Nature, 525, 367–371, https://doi.org/10.1038/nature15371, 2015.
Lim, S., Lee, M., Kim, S.-W., Yoon, S.-C., Lee, G., and Lee, Y. J.: Absorption and scattering properties of organic carbon versus sulfate dominant aerosols at Gosan climate observatory in Northeast Asia, Atmos. Chem. Phys., 14, 7781–7793, https://doi.org/10.5194/acp-14-7781-2014, 2014.
Lim, Y. B., Tan, Y., Perri, M. J., Seitzinger, S. P., and Turpin, B. J.: Aqueous chemistry and its role in secondary organic aerosol (SOA) formation, Atmos. Chem. Phys., 10, 10521–10539, https://doi.org/10.5194/acp-10-10521-2010, 2010.
Lin, P., Rincon, A. G., Kalberer, M., and Yu, J. Z.: Elemental Composition of HULIS in the Pearl River Delta Region, China: Results Inferred from Positive and Negative Electrospray High Resolution Mass Spectrometric Data, Environ. Sci. Technol., 46, 7454–7462, https://doi.org/10.1021/es300285d, 2012.
Liu, Q., Baumgartner, J., Zhang, Y., and Schauer, J. J.: Source apportionment of Beijing air pollution during a severe winter haze event and associated pro-inflammatory responses in lung epithelial cells, Atmos. Environ., 126, 28–35, https://doi.org/10.1016/j.atmosenv.2015.11.031, 2016.
Liu, S., Aiken, A. C., Gorkowski, K., Dubey, M. K., Cappa, C. D., Williams, L. R., Herndon, S. C., Massoli, P., Fortner, E. C., Chhabra, P. S., Brooks, W. A., Onasch, T. B., Jayne, J. T., Worsnop, D. R., China, S., Sharma, N., Mazzoleni, C., Xu, L., Ng, N. L., Liu, D., Allan, J. D., Lee, J. D., Fleming, Z. L., Mohr, C., Zotter, P., Szidat, S., and Prevot, A. S. H.: Enhanced light absorption by mixed source black and brown carbon particles in UK winter, Nat. Commun., 6, 8435, https://doi.org/10.1038/ncomms9435, 2015.
Liu, T., Clegg, S. L., and Abbatt, J. P. D.: Fast oxidation of sulfur dioxide by hydrogen peroxide in deliquesced aerosol particles, P. Natl. Acad. Sci. USA, 117, 1354–1359, https://doi.org/10.1073/pnas.1916401117, 2020.
Liu, Y., Zhang, Y., Lian, C., Yan, C., Feng, Z., Zheng, F., Fan, X., Chen, Y., Wang, W., Chu, B., Wang, Y., Cai, J., Du, W., Daellenbach, K. R., Kangasluoma, J., Bianchi, F., Kujansuu, J., Petäjä, T., Wang, X., Hu, B., Wang, Y., Ge, M., He, H., and Kulmala, M.: The promotion effect of nitrous acid on aerosol formation in wintertime in Beijing: the possible contribution of traffic-related emissions, Atmos. Chem. Phys., 20, 13023–13040, https://doi.org/10.5194/acp-20-13023-2020, 2020.
Lopez-Hilfiker, F. D., Mohr, C., Ehn, M., Rubach, F., Kleist, E., Wildt, J., Mentel, Th. F., Lutz, A., Hallquist, M., Worsnop, D., and Thornton, J. A.: A novel method for online analysis of gas and particle composition: description and evaluation of a Filter Inlet for Gases and AEROsols (FIGAERO), Atmos. Meas. Tech., 7, 983–1001, https://doi.org/10.5194/amt-7-983-2014, 2014.
Lopez-Hilfiker, F. D., Iyer, S., Mohr, C., Lee, B. H., D'Ambro, E. L., Kurtén, T., and Thornton, J. A.: Constraining the sensitivity of iodide adduct chemical ionization mass spectrometry to multifunctional organic molecules using the collision limit and thermodynamic stability of iodide ion adducts, Atmos. Meas. Tech., 9, 1505–1512, https://doi.org/10.5194/amt-9-1505-2016, 2016.
Lopez-Hilfiker, F. D., Pospisilova, V., Huang, W., Kalberer, M., Mohr, C., Stefenelli, G., Thornton, J. A., Baltensperger, U., Prevot, A. S. H., and Slowik, J. G.: An extractive electrospray ionization time-of-flight mass spectrometer (EESI-TOF) for online measurement of atmospheric aerosol particles, Atmos. Meas. Tech., 12, 4867–4886, https://doi.org/10.5194/amt-12-4867-2019, 2019.
Lu, K., Fuchs, H., Hofzumahaus, A., Tan, Z., Wang, H., Zhang, L., Schmitt, S. H., Rohrer, F., Bohn, B., Broch, S., Dong, H., Gkatzelis, G. I., Hohaus, T., Holland, F., Li, X., Liu, Y., Liu, Y., Ma, X., Novelli, A., Schlag, P., Shao, M., Wu, Y., Wu, Z., Zeng, L., Hu, M., Kiendler-Scharr, A., Wahner, A., and Zhang, Y.: Fast Photochemistry in Wintertime Haze: Consequences for Pollution Mitigation Strategies, Environ. Sci. Technol., 53, 10676–10684, https://doi.org/10.1021/acs.est.9b02422, 2019.
Middlebrook, A. M., Bahreini, R., Jimenez, J. L., and Canagaratna, M. R.: Evaluation of Composition-Dependent Collection Efficiencies for the Aerodyne Aerosol Mass Spectrometer using Field Data, Aerosol Sci. Tech., 46, 258–271, https://doi.org/10.1080/02786826.2011.620041, 2012.
Mohr, C., Lopez-Hilfiker, F. D., Zotter, P., Prevot, A. S., Xu, L., Ng, N. L., Herndon, S. C., Williams, L. R., Franklin, J. P., Zahniser, M. S., Worsnop, D. R., Knighton, W. B., Aiken, A. C., Gorkowski, K. J., Dubey, M. K., Allan, J. D., and Thornton, J. A.: Contribution of nitrated phenols to wood burning brown carbon light absorption in Detling, United Kingdom during winter time, Environ. Sci. Technol., 47, 6316–6324, https://doi.org/10.1021/es400683v, 2013.
Molteni, U., Bianchi, F., Klein, F., El Haddad, I., Frege, C., Rossi, M. J., Dommen, J., and Baltensperger, U.: Formation of highly oxygenated organic molecules from aromatic compounds, Atmos. Chem. Phys., 18, 1909–1921, https://doi.org/10.5194/acp-18-1909-2018, 2018.
Müller, M., Eichler, P., D'Anna, B., Tan, W., and Wisthaler, A.: Direct Sampling and Analysis of Atmospheric Particulate Organic Matter by Proton-Transfer-Reaction Mass Spectrometry, Anal. Chem., 89, 10889–10897, https://doi.org/10.1021/acs.analchem.7b02582, 2017.
Ng, N. L., Canagaratna, M. R., Jimenez, J. L., Zhang, Q., Ulbrich, I. M., and Worsnop, D. R.: Real-Time Methods for Estimating Organic Component Mass Concentrations from Aerosol Mass Spectrometer Data, Environ. Sci. Technol., 45, 910–916, https://doi.org/10.1021/es102951k, 2011.
Pagonis, D., Campuzano-Jost, P., Guo, H., Day, D. A., Schueneman, M. K., Brown, W. L., Nault, B. A., Stark, H., Siemens, K., Laskin, A., Piel, F., Tomsche, L., Wisthaler, A., Coggon, M. M., Gkatzelis, G. I., Halliday, H. S., Krechmer, J. E., Moore, R. H., Thomson, D. S., Warneke, C., Wiggins, E. B., and Jimenez, J. L.: Airborne extractive electrospray mass spectrometry measurements of the chemical composition of organic aerosol, Atmos. Meas. Tech., 14, 1545–1559, https://doi.org/10.5194/amt-14-1545-2021, 2021.
Qi, L., Vogel, A. L., Esmaeilirad, S., Cao, L., Zheng, J., Jaffrezo, J.-L., Fermo, P., Kasper-Giebl, A., Daellenbach, K. R., Chen, M., Ge, X., Baltensperger, U., Prévôt, A. S. H., and Slowik, J. G.: A 1-year characterization of organic aerosol composition and sources using an extractive electrospray ionization time-of-flight mass spectrometer (EESI-TOF), Atmos. Chem. Phys., 20, 7875–7893, https://doi.org/10.5194/acp-20-7875-2020, 2020.
Riipinen, I., Yli-Juuti, T., Pierce, J. R., Petäjä, T., Worsnop, D. R., Kulmala, M., and Donahue, N. M.: The contribution of organics to atmospheric nanoparticle growth, Nat. Geosci., 5, 453–458, https://doi.org/10.1038/ngeo1499, 2012.
Sandradewi, J., Prévôt, A. S. H., Szidat, S., Perron, N., Alfarra, M. R., Lanz, V. A., Weingartner, E., and Baltensperger, U.: Using Aerosol Light Absorption Measurements for the Quantitative Determination of Wood Burning and Traffic Emission Contributions to Particulate Matter, Environ. Sci. Technol., 42, 3316–3323, https://doi.org/10.1021/es702253m, 2008.
Schauer, J. J., Kleeman, M. J., Cass, G. R., and Simoneit, B. R. T.: Measurement of Emissions from Air Pollution Sources. 4. C1–C27 Organic Compounds from Cooking with Seed Oils, Environ. Sci. Technol., 36, 567–575, https://doi.org/10.1021/es002053m, 2002.
Siegel, K., Karlsson, L., Zieger, P., Baccarini, A., Schmale, J., Lawler, M., Salter, M., Leck, C., Ekman, A. M. L., Riipinen, I., and Mohr, C.: Insights into the molecular composition of semi-volatile aerosols in the summertime central Arctic Ocean using FIGAERO-CIMS, Environmental Science: Atmospheres, 1, 161–175, https://doi.org/10.1039/d0ea00023j, 2021.
Simoneit, B. R. T., Schauer, J. J., Nolte, C. G., Oros, D. R., Elias, V. O., Fraser, M. P., Rogge, W. F., and Cass, G. R.: Levoglucosan, a tracer for cellulose in biomass burning and atmospheric particles, Atmos. Environ., 33, 173–182, https://doi.org/10.1016/S1352-2310(98)00145-9, 1999.
Song, S., Gao, M., Xu, W., Sun, Y., Worsnop, D. R., Jayne, J. T., Zhang, Y., Zhu, L., Li, M., Zhou, Z., Cheng, C., Lv, Y., Wang, Y., Peng, W., Xu, X., Lin, N., Wang, Y., Wang, S., Munger, J. W., Jacob, D. J., and McElroy, M. B.: Possible heterogeneous chemistry of hydroxymethanesulfonate (HMS) in northern China winter haze, Atmos. Chem. Phys., 19, 1357–1371, https://doi.org/10.5194/acp-19-1357-2019, 2019.
Stark, H., Yatavelli, R. L. N., Thompson, S. L., Kang, H., Krechmer, J. E., Kimmel, J. R., Palm, B. B., Hu, W., Hayes, P. L., Day, D. A., Campuzano-Jost, P., Canagaratna, M. R., Jayne, J. T., Worsnop, D. R., and Jimenez, J. L.: Impact of Thermal Decomposition on Thermal Desorption Instruments: Advantage of Thermogram Analysis for Quantifying Volatility Distributions of Organic Species, Environ. Sci. Technol., 51, 8491–8500, https://doi.org/10.1021/acs.est.7b00160, 2017.
Sun, Y., Du, W., Wang, Q., Zhang, Q., Chen, C., Chen, Y., Chen, Z., Fu, P., Wang, Z., Gao, Z., and Worsnop, D. R.: Real-Time Characterization of Aerosol Particle Composition above the Urban Canopy in Beijing: Insights into the Interactions between the Atmospheric Boundary Layer and Aerosol Chemistry, Environ. Sci. Technol., 49, 11340–11347, https://doi.org/10.1021/acs.est.5b02373, 2015.
Sun, Y., Du, W., Fu, P., Wang, Q., Li, J., Ge, X., Zhang, Q., Zhu, C., Ren, L., Xu, W., Zhao, J., Han, T., Worsnop, D. R., and Wang, Z.: Primary and secondary aerosols in Beijing in winter: sources, variations and processes, Atmos. Chem. Phys., 16, 8309–8329, https://doi.org/10.5194/acp-16-8309-2016, 2016.
Sun, Y. L., Wang, Z. F., Fu, P. Q., Yang, T., Jiang, Q., Dong, H. B., Li, J., and Jia, J. J.: Aerosol composition, sources and processes during wintertime in Beijing, China, Atmos. Chem. Phys., 13, 4577–4592, https://doi.org/10.5194/acp-13-4577-2013, 2013.
Tao, J., Surapipith, V., Han, Z., Prapamontol, T., Kawichai, S., Zhang, L., Zhang, Z., Wu, Y., Li, J., Li, J., Yang, Y., and Zhang, R.: High mass absorption efficiency of carbonaceous aerosols during the biomass burning season in Chiang Mai of northern Thailand, Atmos. Environ., 240, 117821, https://doi.org/10.1016/j.atmosenv.2020.117821, 2020.
Teich, M., van Pinxteren, D., Wang, M., Kecorius, S., Wang, Z., Müller, T., Močnik, G., and Herrmann, H.: Contributions of nitrated aromatic compounds to the light absorption of water-soluble and particulate brown carbon in different atmospheric environments in Germany and China, Atmos. Chem. Phys., 17, 1653–1672, https://doi.org/10.5194/acp-17-1653-2017, 2017.
Thornton, J. A., Mohr, C., Schobesberger, S., D'Ambro, E. L., Lee, B. H., and Lopez-Hilfiker, F. D.: Evaluating Organic Aerosol Sources and Evolution with a Combined Molecular Composition and Volatility Framework Using the Filter Inlet for Gases and Aerosols (FIGAERO), Accounts Chem. Res., 53, 1415–1426, https://doi.org/10.1021/acs.accounts.0c00259, 2020.
Virkkula, A., Chi, X., Ding, A., Shen, Y., Nie, W., Qi, X., Zheng, L., Huang, X., Xie, Y., Wang, J., Petäjä, T., and Kulmala, M.: On the interpretation of the loading correction of the aethalometer, Atmos. Meas. Tech., 8, 4415–4427, https://doi.org/10.5194/amt-8-4415-2015, 2015.
Vu, T. V., Delgado-Saborit, J. M., and Harrison, R. M.: Review: Particle number size distributions from seven major sources and implications for source apportionment studies, Atmos. Environ., 122, 114–132, https://doi.org/10.1016/j.atmosenv.2015.09.027, 2015.
Wang, J., Nie, W., Cheng, Y., Shen, Y., Chi, X., Wang, J., Huang, X., Xie, Y., Sun, P., Xu, Z., Qi, X., Su, H., and Ding, A.: Light absorption of brown carbon in eastern China based on 3-year multi-wavelength aerosol optical property observations and an improved absorption Ångström exponent segregation method, Atmos. Chem. Phys., 18, 9061–9074, https://doi.org/10.5194/acp-18-9061-2018, 2018.
Wang, J., Liu, D., Ge, X., Wu, Y., Shen, F., Chen, M., Zhao, J., Xie, C., Wang, Q., Xu, W., Zhang, J., Hu, J., Allan, J., Joshi, R., Fu, P., Coe, H., and Sun, Y.: Characterization of black carbon-containing fine particles in Beijing during wintertime, Atmos. Chem. Phys., 19, 447–458, https://doi.org/10.5194/acp-19-447-2019, 2019.
Wang, J., Ye, J., Zhang, Q., Zhao, J., Wu, Y., Li, J., Liu, D., Li, W., Zhang, Y., Wu, C., Xie, C., Qin, Y., Lei, Y., Huang, X., Guo, J., Liu, P., Fu, P., Li, Y., Lee, H. C., Choi, H., Zhang, J., Liao, H., Chen, M., Sun, Y., Ge, X., Martin, S. T., and Jacob, D. J.: Aqueous production of secondary organic aerosol from fossil-fuel emissions in winter Beijing haze, P. Natl. Acad. Sci. USA, 118, e2022179118, https://doi.org/10.1073/pnas.2022179118, 2021.
Wang, W., Liu, M., Wang, T., Song, Y., Zhou, L., Cao, J., Hu, J., Tang, G., Chen, Z., Li, Z., Xu, Z., Peng, C., Lian, C., Chen, Y., Pan, Y., Zhang, Y., Sun, Y., Li, W., Zhu, T., Tian, H., and Ge, M.: Sulfate formation is dominated by manganese-catalyzed oxidation of SO2 on aerosol surfaces during haze events, Nat. Commun., 12, 1993, https://doi.org/10.1038/s41467-021-22091-6, 2021.
Wang, X. K., Hayeck, N., Bruggemann, M., Yao, L., Chen, H. F., Zhang, C., Emmelin, C., Chen, J. M., George, C., and Wang, L.: Chemical Characteristics of Organic Aerosols in Shanghai: A Study by Ultrahigh-Performance Liquid Chromatography Coupled With Orbitrap Mass Spectrometry, J. Geophys. Res.-Atmos., 122, 11703–11722, https://doi.org/10.1002/2017jd026930, 2017.
Wang, Y., Hu, M., Wang, Y., Zheng, J., Shang, D., Yang, Y., Liu, Y., Li, X., Tang, R., Zhu, W., Du, Z., Wu, Y., Guo, S., Wu, Z., Lou, S., Hallquist, M., and Yu, J. Z.: The formation of nitro-aromatic compounds under high NOx and anthropogenic VOC conditions in urban Beijing, China, Atmos. Chem. Phys., 19, 7649–7665, https://doi.org/10.5194/acp-19-7649-2019, 2019.
Wang, Y., Chen, Y., Wu, Z., Shang, D., Bian, Y., Du, Z., Schmitt, S. H., Su, R., Gkatzelis, G. I., Schlag, P., Hohaus, T., Voliotis, A., Lu, K., Zeng, L., Zhao, C., Alfarra, M. R., McFiggans, G., Wiedensohler, A., Kiendler-Scharr, A., Zhang, Y., and Hu, M.: Mutual promotion between aerosol particle liquid water and particulate nitrate enhancement leads to severe nitrate-dominated particulate matter pollution and low visibility, Atmos. Chem. Phys., 20, 2161–2175, https://doi.org/10.5194/acp-20-2161-2020, 2020.
Wu, C., Wu, D., and Yu, J. Z.: Quantifying black carbon light absorption enhancement with a novel statistical approach, Atmos. Chem. Phys., 18, 289–309, https://doi.org/10.5194/acp-18-289-2018, 2018.
Xie, C., Xu, W., Wang, J., Liu, D., Ge, X., Zhang, Q., Wang, Q., Du, W., Zhao, J., Zhou, W., Li, J., Fu, P., Wang, Z., Worsnop, D., and Sun, Y.: Light absorption enhancement of black carbon in urban Beijing in summer, Atmos. Environ., 213, 499–504, https://doi.org/10.1016/j.atmosenv.2019.06.041, 2019a.
Xie, C., Xu, W., Wang, J., Wang, Q., Liu, D., Tang, G., Chen, P., Du, W., Zhao, J., Zhang, Y., Zhou, W., Han, T., Bian, Q., Li, J., Fu, P., Wang, Z., Ge, X., Allan, J., Coe, H., and Sun, Y.: Vertical characterization of aerosol optical properties and brown carbon in winter in urban Beijing, China, Atmos. Chem. Phys., 19, 165–179, https://doi.org/10.5194/acp-19-165-2019, 2019b.
Yan, C., Yin, R., Lu, Y., Dada, L., Yang, D., Fu, Y., Kontkanen, J., Deng, C., Garmash, O., Ruan, J., Baalbaki, R., Schervish, M., Cai, R., Bloss, M., Chan, T., Chen, T., Chen, Q., Chen, X., Chen, Y., Chu, B., Dällenbach, K., Foreback, B., He, X., Heikkinen, L., Jokinen, T., Junninen, H., Kangasluoma, J., Kokkonen, T., Kurppa, M., Lehtipalo, K., Li, H., Li, H., Li, X., Liu, Y., Ma, Q., Paasonen, P., Rantala, P., Pileci, R. E., Rusanen, A., Sarnela, N., Simonen, P., Wang, S., Wang, W., Wang, Y., Xue, M., Yang, G., Yao, L., Zhou, Y., Kujansuu, J., Petäjä, T., Nie, W., Ma, Y., Ge, M., He, H., Donahue, N. M., Worsnop, D. R., Veli-Matti, K., Wang, L., Liu, Y., Zheng, J., Kulmala, M., Jiang, J., and Bianchi, F.: The Synergistic Role of Sulfuric Acid, Bases, and Oxidized Organics Governing New-Particle Formation in Beijing, Geophys. Res. Lett., 48, e2020GL091944, https://doi.org/10.1029/2020gl091944, 2021.
Yang, F., Tan, J., Zhao, Q., Du, Z., He, K., Ma, Y., Duan, F., Chen, G., and Zhao, Q.: Characteristics of PM2.5 speciation in representative megacities and across China, Atmos. Chem. Phys., 11, 5207–5219, https://doi.org/10.5194/acp-11-5207-2011, 2011.
Yang, L. H., Takeuchi, M., Chen, Y., and Ng, N. L.: Characterization of thermal decomposition of oxygenated organic compounds in FIGAERO-CIMS, Aerosol Sci. Tech., 55, 1321–1342, https://doi.org/10.1080/02786826.2021.1945529, 2021.
Yao, L., Fan, X., Yan, C., Kurten, T., Daellenbach, K. R., Li, C., Wang, Y., Guo, Y., Dada, L., Rissanen, M. P., Cai, J., Tham, Y. J., Zha, Q., Zhang, S., Du, W., Yu, M., Zheng, F., Zhou, Y., Kontkanen, J., Chan, T., Shen, J., Kujansuu, J. T., Kangasluoma, J., Jiang, J., Wang, L., Worsnop, D. R., Petaja, T., Kerminen, V. M., Liu, Y., Chu, B., He, H., Kulmala, M., and Bianchi, F.: Unprecedented Ambient Sulfur Trioxide (SO3) Detection: Possible Formation Mechanism and Atmospheric Implications, Environ. Sci. Technol. Lett., 7, 809–818, https://doi.org/10.1021/acs.estlett.0c00615, 2020.
Zhang, R., Jing, J., Tao, J., Hsu, S.-C., Wang, G., Cao, J., Lee, C. S. L., Zhu, L., Chen, Z., Zhao, Y., and Shen, Z.: Chemical characterization and source apportionment of PM2.5 in Beijing: seasonal perspective, Atmos. Chem. Phys., 13, 7053–7074, https://doi.org/10.5194/acp-13-7053-2013, 2013.
Zhang, X., Lin, Y.-H., Surratt, J. D., Zotter, P., Prévôt, A. S. H., and Weber, R. J.: Light-absorbing soluble organic aerosol in Los Angeles and Atlanta: A contrast in secondary organic aerosol, Geophys. Res. Lett., 38, L21810, https://doi.org/10.1029/2011gl049385, 2011.
Zhang, Y., Favez, O., Canonaco, F., Liu, D., Močnik, G., Amodeo, T., Sciare, J., Prévôt, A. S. H., Gros, V., and Albinet, A.: Evidence of major secondary organic aerosol contribution to lensing effect black carbon absorption enhancement, npj Climate and Atmospheric Science, 1, 47, https://doi.org/10.1038/s41612-018-0056-2, 2018.
Zhao, J., Qiu, Y., Zhou, W., Xu, W., Wang, J., Zhang, Y., Li, L., Xie, C., Wang, Q., Du, W., Worsnop, D. R., Canagaratna, M. R., Zhou, L., Ge, X., Fu, P., Li, J., Wang, Z., Donahue, N. M., and Sun, Y.: Organic Aerosol Processing During Winter Severe Haze Episodes in Beijing, J. Geophys. Res.-Atmos., 124, 10248–10263, https://doi.org/10.1029/2019jd030832, 2019.
Zheng, J., Ma, Y., Chen, M., Zhang, Q., Wang, L., Khalizov, A. F., Yao, L., Wang, Z., Wang, X., and Chen, L.: Measurement of atmospheric amines and ammonia using the high resolution time-of-flight chemical ionization mass spectrometry, Atmos. Environ., 102, 249–259, https://doi.org/10.1016/j.atmosenv.2014.12.002, 2015.
Zheng, Y., Chen, Q., Cheng, X., Mohr, C., Cai, J., Huang, W., Shrivastava, M., Ye, P., Fu, P., Shi, X., Ge, Y., Liao, K., Miao, R., Qiu, X., Koenig, T. K., and Chen, S.: Precursors and Pathways Leading to Enhanced Secondary Organic Aerosol Formation during Severe Haze Episodes, Environ. Sci. Technol., 55, 15680–15693, https://doi.org/10.1021/acs.est.1c04255, 2021.
Zhou, Y., Dada, L., Liu, Y., Fu, Y., Kangasluoma, J., Chan, T., Yan, C., Chu, B., Daellenbach, K. R., Bianchi, F., Kokkonen, T. V., Liu, Y., Kujansuu, J., Kerminen, V.-M., Petäjä, T., Wang, L., Jiang, J., and Kulmala, M.: Variation of size-segregated particle number concentrations in wintertime Beijing, Atmos. Chem. Phys., 20, 1201–1216, https://doi.org/10.5194/acp-20-1201-2020, 2020.
Zotter, P., Herich, H., Gysel, M., El-Haddad, I., Zhang, Y., Močnik, G., Hüglin, C., Baltensperger, U., Szidat, S., and Prévôt, A. S. H.: Evaluation of the absorption Ångström exponents for traffic and wood burning in the Aethalometer-based source apportionment using radiocarbon measurements of ambient aerosol, Atmos. Chem. Phys., 17, 4229–4249, https://doi.org/10.5194/acp-17-4229-2017, 2017.