the Creative Commons Attribution 4.0 License.
the Creative Commons Attribution 4.0 License.
 | 24 Jan 2022
An integrated analysis of contemporary methane emissions and concentration trends over China using in situ and satellite observations and model simulations
Haiyue Tan
Lin Zhang
Yuanhong Zhao
Bo Yao
Robert J. Parker
Hartmut Boesch
China, being one of the major emitters of greenhouse gases, has taken strong actions to tackle climate change, e.g., to achieve carbon neutrality by 2060. It also becomes important to better understand the changes in the atmospheric mixing ratios and emissions of CH4, the second most important human-influenced greenhouse gas, in China. Here we analyze the sources contributing to the atmospheric CH4 mixing ratios and their trends in China over 2007–2018 using the GEOS-Chem model simulations driven by two commonly used global anthropogenic emission inventories: the Emissions Database for Global Atmospheric Research (EDGAR v4.3.2) and the Community Emissions Data System (CEDS). The model results are interpreted with an ensemble of surface, aircraft, and satellite observations of CH4 mixing ratios over China and the Pacific region. The EDGAR and CEDS estimates show considerable differences reflecting large uncertainties in estimates of Chinese CH4 emissions. Chinese CH4 emission estimates based on EDGAR and natural sources increase from 46.7 Tg per annum (Tg a−1) in 1980 to 69.8 Tg a−1 in 2012 with an increase rate of 0.7 Tg a−2, and estimates with CEDS increase from 32.9 Tg a−1 in 1980 and 76.7 Tg a−1 in 2014 (a much stronger trend of 1.3 Tg a−2 over the period). Both surface, aircraft, and satellite measurements indicate CH4 increase rates of 7.0–8.4 ppbv a−1 over China in the past decade. We find that the model simulation using the CEDS inventory and interannually varying OH levels can best reproduce these observed CH4 mixing ratios and trends over China. Model results over China are sensitive to the global OH level, with a 10 % increase in the global tropospheric volume-weighted mean OH concentration presenting a similar effect to that of a 47 Tg a−1 decrease in global CH4 emissions. We further apply a tagged tracer simulation to quantify the source contributions from different emission sectors and regions. We find that domestic CH4 emissions account for 14.0 % of the mean surface mixing ratio and drive 66.7 % of the surface trend (mainly via the energy sector) in China over 2007–2018. We emphasize that intensive CH4 measurements covering eastern China will help us better assess the driving factors of CH4 mixing ratios and support the emission mitigation in China.
- Article
(11049 KB) - Full-text XML
-
Supplement
(1053 KB) - BibTeX
- EndNote


Atmospheric methane (CH4) is the second most important anthropogenic greenhouse gas, contributing more than a quarter of the human-induced radiative imbalance since 1750 (IPCC, 2013). It also plays an important role in atmospheric chemistry as an essential precursor for tropospheric ozone and stratospheric water vapor (Turner et al., 2019). Global mean atmospheric CH4 surface mixing ratios increased from about 1650 ppbv in the mid 1980s to about 1770 ppbv in the late 1990s, then stabilized around this level in the early 2000s, and started increasing again from 2007 (Dlugokencky et al., 2009; Nisbet et al., 2019). The regrowth of the atmospheric CH4 mixing ratio has drawn worldwide attention and led to many different or even contradictory explanations (Zhang et al., 2021; Yin et al., 2021; Zhao et al., 2019; Turner et al., 2019; Maasakkers et al., 2019). Difficulties in the attribution of the trends are mainly associated with large uncertainties in changes in the CH4 emissions from various sources, as well as the chemical loss via oxidation by hydroxyl radical (OH) (Turner et al., 2019). A better understanding and quantification of the interannual variability in CH4 emissions and the drivers of the concentration growth in the recent decade is important to support its mitigation.
CH4 has both important anthropogenic and natural sources. It can be emitted from human activities including coal mining, oil and gas exploitation, livestock, rice cultivation, waste deposit, and wastewater treatment. It also has a large natural source from wetlands, with small sources from forest fires, termites, and geological seeps. Global bottom-up estimates of CH4 emissions based on statistics of source activities or process-based models have reported a wide range of total CH4 emissions of 542–852 Tg a−1 in the 2000s (Kirschke et al., 2013). Atmospheric top-down analyses constrained by surface, satellite, and aircraft observations of CH4 mixing ratios tend to suggest lower total CH4 emissions of 526–569 Tg a−1 in the period (Kirschke et al., 2013) and find even greater uncertainties in the relative contributions from different CH4 emission sectors (Kirschke et al., 2013; Saunois et al., 2016, 2020). Over 90 % of atmospheric CH4 is lost via oxidation by OH in the troposphere, leading to a lifetime of 9.14 (±10 %) years against this sink (IPCC, 2013). Additional minor sinks include soil absorption, loss in the stratosphere, and reactions with chlorine radicals (IPCC, 2013). The contemporary growth of atmospheric CH4 levels reflect an imbalance between its global sources and sinks.
China is one of the most significant methane producers, especially for anthropogenic sources such as coal mining (Saunois et al., 2016). Anthropogenic sources in China contributed about 13 % of the global anthropogenic CH4 emissions in the 2000s (Kirschke et al., 2013). The recent bottom-up emission inventory of Peng et al. (2016) found that the total Chinese CH4 emissions increased from 24.4 Tg a−1 in 1980 to 45.0 Tg a−1 in 2010, with the largest source sector being rice cultivation in 1980 which was replaced by coal mining after 2005. However, large uncertainties exist in our understanding of the contemporary changes in CH4 emissions over China (Saunois et al., 2020), e.g., whether the Chinese CH4 emissions from coal mining have decreased due to the mitigation policy in recent years (Miller et al., 2019; Sheng et al., 2019). Atmospheric inversion analyses are typically applied at global scales due to very limited in situ CH4 measurements over this region in the 2000s. The increases in spatiotemporal observations (from satellite or aircraft) and the development of atmospheric transport models would be helpful in constraining methane sources over China, but different datasets and methods could provide discrepant information (Thompson et al., 2015; Miller et al., 2019). China has pledged to peak the carbon dioxide emissions by 2030 and to reach carbon neutrality by 2060 for tackling climate change. As CH4 is the second most important anthropogenic greenhouse gas, it also becomes crucial to quantify its emissions and concentration trends in China.
In this study, we aim to better understand the recent trends in CH4 emissions and mixing ratios in China using the GEOS-Chem (Goddard Earth Observing System-Chemistry) chemical transport model driven by two commonly used global anthropogenic emission inventories: the Emission Database for Global Atmospheric Research (EDGAR, version 4.3.2) (Janssens-Maenhout et al., 2019) and the Community Emissions Data System (CEDS, version 2017-05-18) (Hoesly et al., 2018). We use an ensemble of surface, aircraft, and satellite observations to assess the CH4 mixing ratios and trends from the surface to the troposphere and conduct a series of model simulations to examine their driving factors, as well as the influence of the interannual variability in global volume-weighted OH concentrations. An improved tagged CH4 tracer simulation (with 100 region- and sector-specific tracers) is applied to identify and quantify the contributions to the spatial patterns of CH4 mixing ratios and trends over China in the recent decade of 2007–2018.
2.1 Surface and aircraft measurements
We use the surface CH4 mixing ratio measurements from the Global Monitoring Division (GMD) of the Earth System Research Laboratory (ESRL) at the National Oceanic and Atmospheric Administration (NOAA). The CH4 mixing ratios are measured by gas chromatography with flame ionization detection (Dlugokencky, 2005). The measurement database (https://www.esrl.noaa.gov/gmd/dv/data/, last access: 3 March 2021) includes 95 sites globally providing monthly averages of mixing ratios (ppbv). The database has been widely used in assessing regional and global CH4 mixing ratios and budgets (Bergamaschi et al., 2013; Fraser et al., 2013; Cressot et al., 2014; Turner et al., 2016; Miller et al., 2019).
Table 1CH4 measurements and GEOS-Chem model simulations at four NOAA surface sites over China. Date format is year.month.
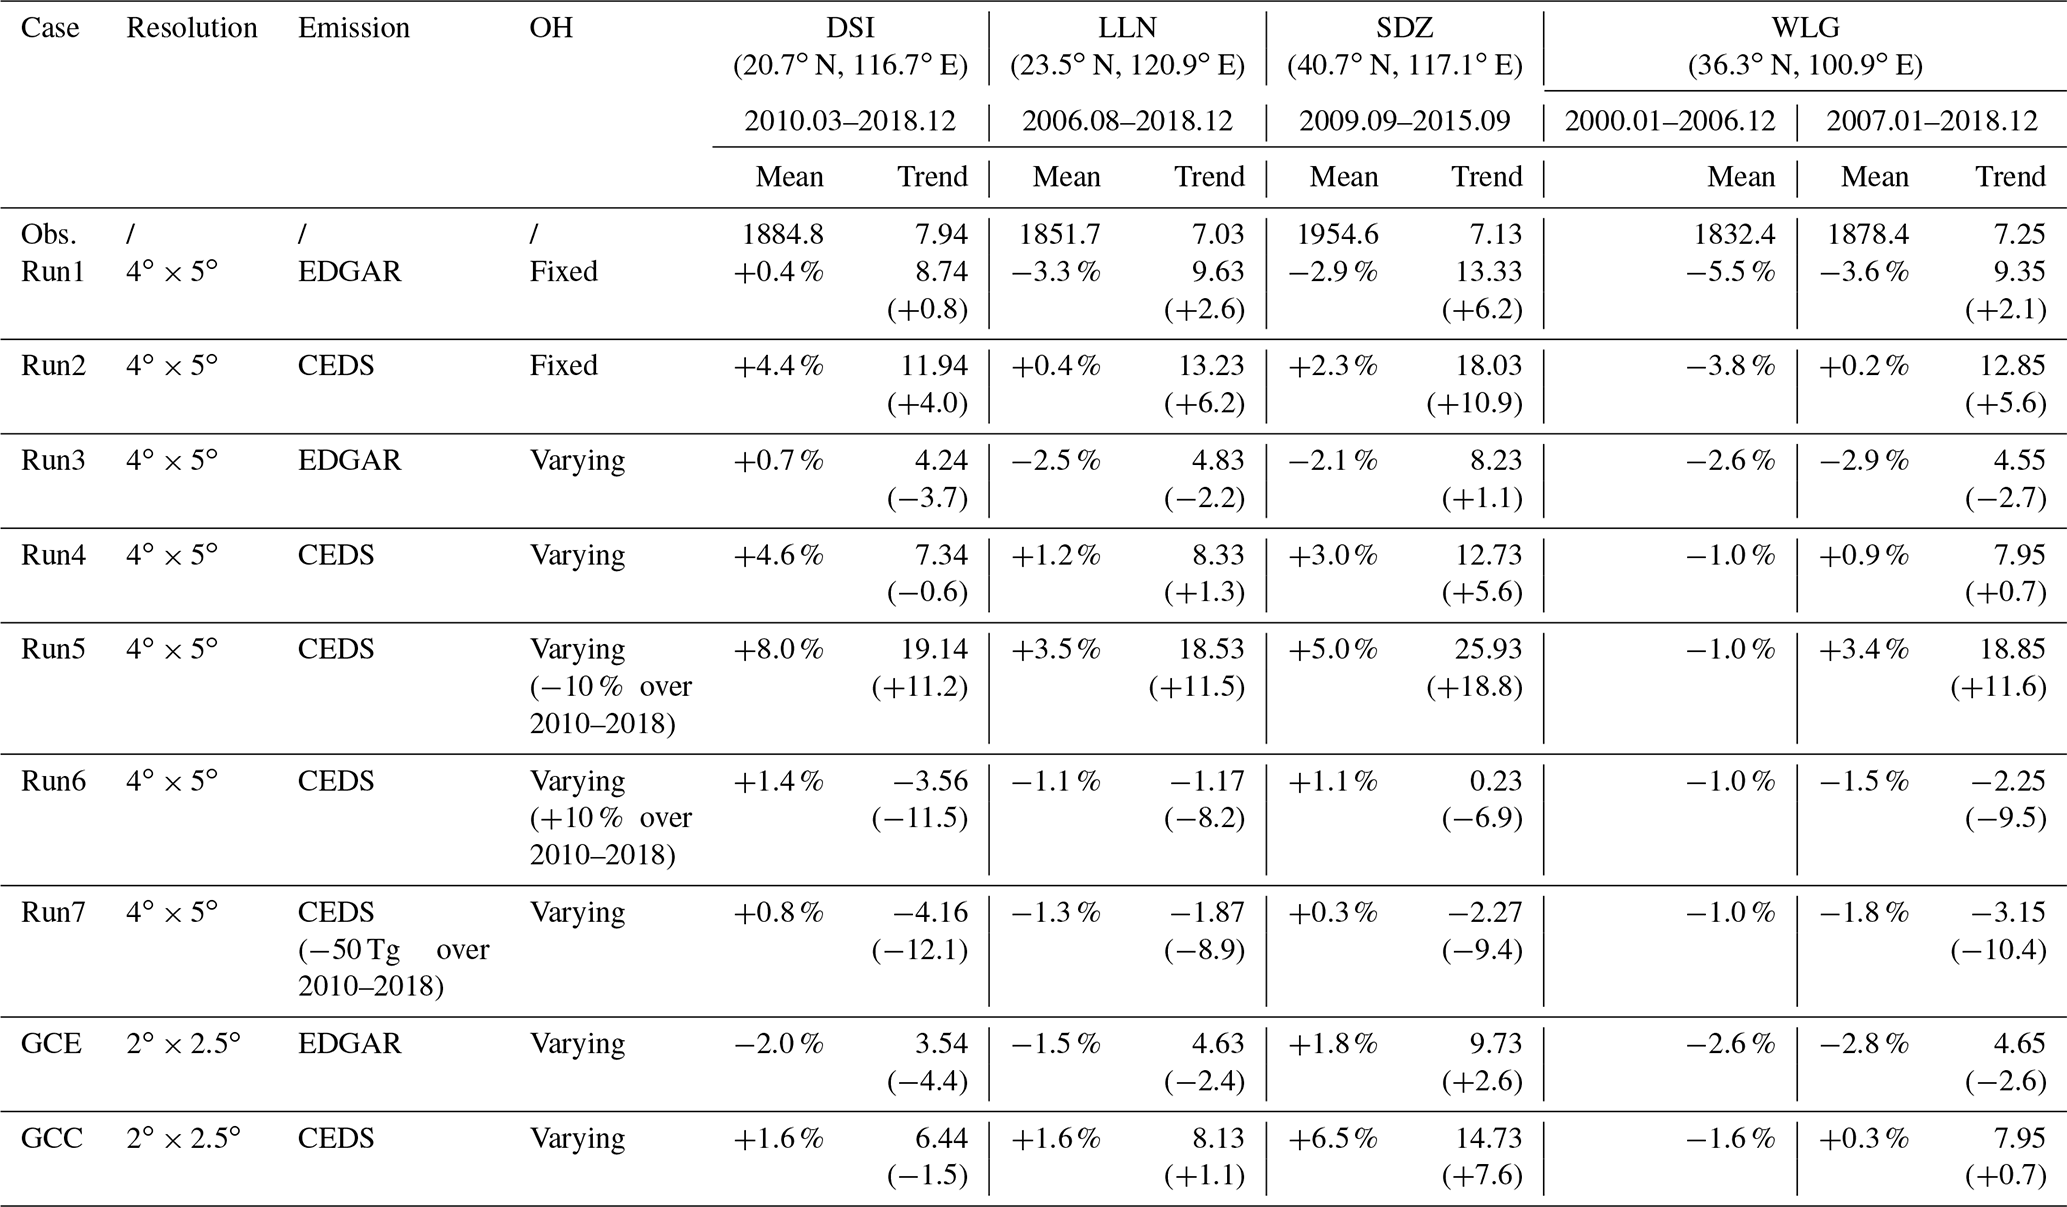
Here we focus on four sites located in China, as summarized in Table 1, including Dongsha Island (DSI; 20.7∘ N, 116.7∘ E) measuring from March 2010 to December 2018, Lulin (LLN; 23.5∘ N, 120.9∘ E) from August 2006 to December 2018, Shangdianzi (SDZ; 40.7∘ N, 117.1∘ E) from September 2009 to September 2015, and Waliguan (WLG; 36.3∘ N, 100.9∘ E) from May 1991 to December 2018. Three of these sites (LLN, SDZ, and WLG) are mountain-top sites, while DSI is located in the marine boundary layer. The WLG site located in the Qinghai–Tibet Plateau at 3810 m above sea level is the first baseline observatory in China, providing continuous measurements since the year 1991.
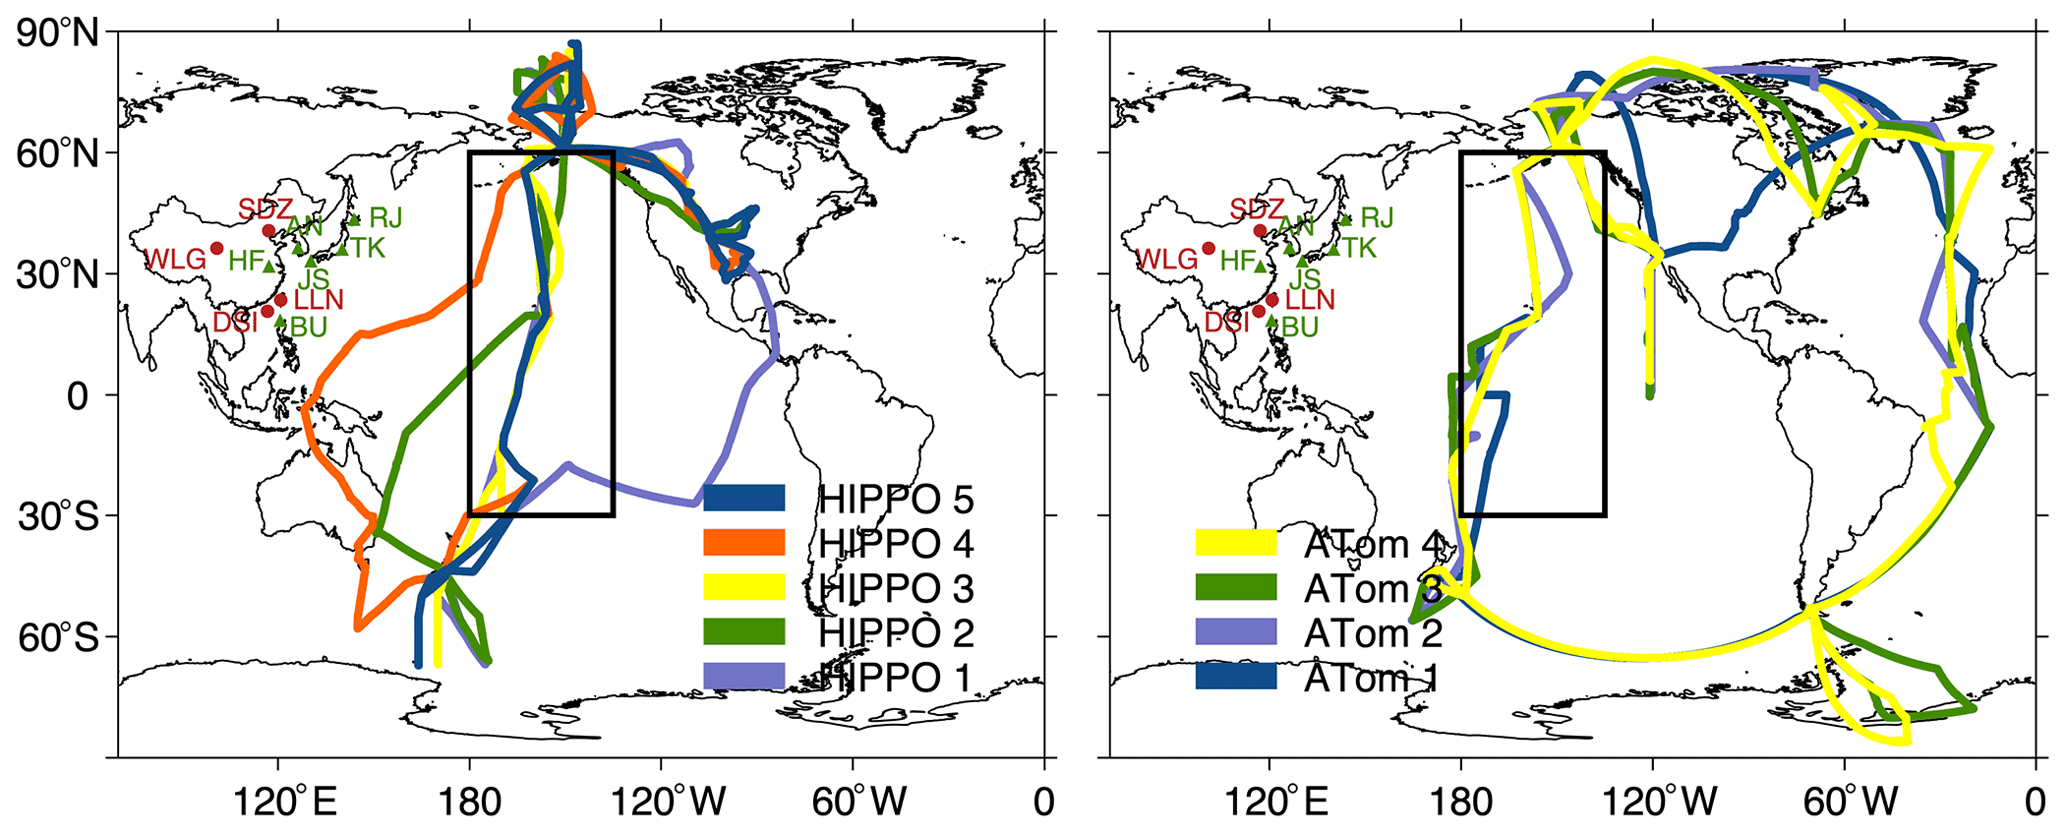
Figure 1Locations of NOAA surface sites (red circles), TCCON sites (green triangles) in China, and aircraft flight tracks of HIPPO and ATom campaigns.
We analyze measurements of CH4 mixing ratios from two aircraft campaigns: the High-performance Instrumented Airborne Platform for Environmental Research (HIAPER) Pole-to-Pole Observation (HIPPO) and the Atmospheric Tomography Mission (ATom). HIPPO consists of five campaigns from January 2009 to September 2011 (Wofsy et al., 2011). ATom consists of four campaigns from July 2016 to May 2018 (Wofsy et al., 2018). Figure 1 shows the flight tracks from the two campaigns. Both HIPPO and ATom datasets provide the merged 10 s data products for all flights (Wofsy et al., 2017, 2018), which cover the four seasons temporally and the regions over the Pacific Ocean and North America spatially. Both campaigns provide global-scale measurements of atmospheric composition in all seasons and conduct continuous profiling between ∼0.15 and 8.5 km altitude with many profiles extending to nearly 14 km. Here we sample the model results at the hourly resolution along flight tracks as shown in Fig. 1 and average them in 2∘ latitude bins for the comparison.
2.2 GOSAT satellite observations
The TANSO-FTS ((Thermal And Near infrared Sensor for carbon Observation – Fourier Transform Spectrometer) instrument on board the Greenhouse Gases Observing Satellite (GOSAT) launched in early 2009 measures the backscattered solar radiation from a sun-synchronous orbit at around 13:00 LT (Butz et al., 2011; Kuze et al., 2016). The observations have a pixel resolution of around 10 km diameter and are separated by about 250 km along the observing track with a global coverage every 3 d (Parker et al., 2015). GOSAT retrieves column-averaged dry-air CO2 and CH4 mixing ratios from the shortwave infrared (SWIR) spectrum with near-unit sensitivity down to the surface (Butz et al., 2011). We use the University of Leicester version 7.2 GOSAT XCH4 proxy retrieval over China from January 2010 to December 2017. The glint data over the oceans are not used in this study due to the sparse data coverage. The CH4 product has been validated by Parker et al. (2015) against the Total Carbon Column Observing Network (TCCON) and MACC-II (Monitoring Atmospheric Composition and Climate) model XCH4 data, and a precision of 0.7 % is suggested.
To compare with the GEOS-Chem model results as described below, the GOSAT CH4 observations and satellite averaging kernels are averaged over the or model grid. We use the satellite observations which pass the criteria that the grid has more than 12 months of valid observations which have passed their quality control. The simulated vertical profiles (VMRmod) are applied with the satellite averaging kernels (AKs) and a priori estimates (VMRapr) using Eq. (1) following Parker et al. (2020).
where AKi is the retrieval averaging kernel and hi is the pressure weight for the vertical level i. This provides column mean CH4 mixing ratios (), with the vertical sensitivity of satellite retrievals accounted for.
2.3 The GEOS-Chem model description and simulation design
We use the GEOS-Chem global chemical transport model v11-02 release candidate (http://geos-chem.org, last access: 3 March 2021) driven by MERRA-2 meteorological fields from the NASA Global Modeling and Assimilation Office (GMAO). The MERRA-2 dataset has a native horizontal resolution of 0.5∘ latitude × 0.625∘ longitude and is degraded to or resolutions for input to GEOS-Chem. We use the CH4 simulation that calculates the CH4 sinks using prescribed global distributions of OH concentrations or loss frequencies. The model has been applied in a number of studies to understand the global and regional CH4 emissions and mixing ratios (Wecht et al., 2014; Turner et al., 2015; Maasakkers et al., 2019, 2021; Lu et al., 2021; Zhang et al., 2021). All the simulations are initiated in the year 1980, and we focus on the model results in the period of 2007–2018. We find that changes in the initial CH4 conditions in January 1980 would not affect simulation results after January 2000, indicating that a spin-up time of over 20 years is sufficient for our analyses.
We use and compare two global anthropogenic CH4 inventories: the Emissions Database for Global Atmospheric Research (EDGAR v4.3.2) covering 1970–2012 (Janssens-Maenhout et al., 2019) and the Community Emissions Data System (CEDS, version 2017-05-18) (Hoesly et al., 2018) covering 1970–2014. A detailed comparison of the two emission estimates will be presented in Sect. 3. The EDGAR CH4 emissions do not account for seasonal variations. Here we have applied seasonal scalars to CH4 emissions from manure management based on a temperature dependence described by Maasakkers et al. (2016) and to those from rice cultivation following Zhang et al. (2016) in the EDGAR inventory. The CEDS inventory as used in this study provides gridded emission estimates with monthly variations.
For natural sources, monthly wetland emissions are from the WetCHARTs version 1.0 extended ensemble mean for 2001–2015 (Bloom et al., 2017) and are scaled by 1.1 to match the estimates in Kirschke et al. (2013) and Saunois et al. (2020). Open fire emissions are from the Quick Fire Emissions Database version 2.4 with daily variability over 2009–2015 (Darmenov and Da Silva, 2013). Termite and seepage emissions are, respectively, from Fung et al. (1991) and Maasakkers et al. (2019).
The oxidation of CH4 by tropospheric OH is calculated in the model using 3-D monthly averaged OH concentrations archived from a standard GEOS-Chem tropospheric chemistry simulation in Wecht et al. (2014). Global uniform scalers are then applied to account for the interannual variability in OH concentrations during 1980–2010 as simulated by the CESM model in Zhao et al. (2019). As shown in Fig. S1 in the Supplement, the resulting global volume-weighted mean OH increases by 0.20 % a−1 in 1980–2000 and 0.37 % a−1 in 2000–2010, finally reaching to 10.9×10⁵ . Other minor sinks include tropospheric oxidation by chlorine atoms using monthly chlorine concentration fields of Sherwen et al. (2016), stratospheric loss computed with monthly loss frequencies of Murray et al. (2012), and soil uptake of Fung et al. (1991) with a temperature-dependent seasonality (Ridgwell et al., 1999).
We have conducted a series of model simulations over 1980–2018 as summarized in Table 1 to investigate the impacts of OH concentrations and model resolution. For all the datasets of emissions (using EDGAR and CEDS) and sinks as described above, the closest available year will be used for simulation years beyond their available time ranges as recent studies suggested weak trends in Chinese CH4 emissions after 2010 (Sheng et al., 2021; Liu et al., 2021). Since CH4 has a long lifetime of about 9 years, model results in the later years (e.g., after 2012 for EDGAR and after 2014 for CEDS) are strongly affected by the emissions in earlier years. Evaluations of these model results with the NOAA surface measurements at the four Chinese sites indicate that the simulation with CEDS and interannually varying OH at resolution (GCC in Table 1) relatively better captures the measured mixing ratios and trends from 2007 onwards, as will be discussed in Sect. 3.2.
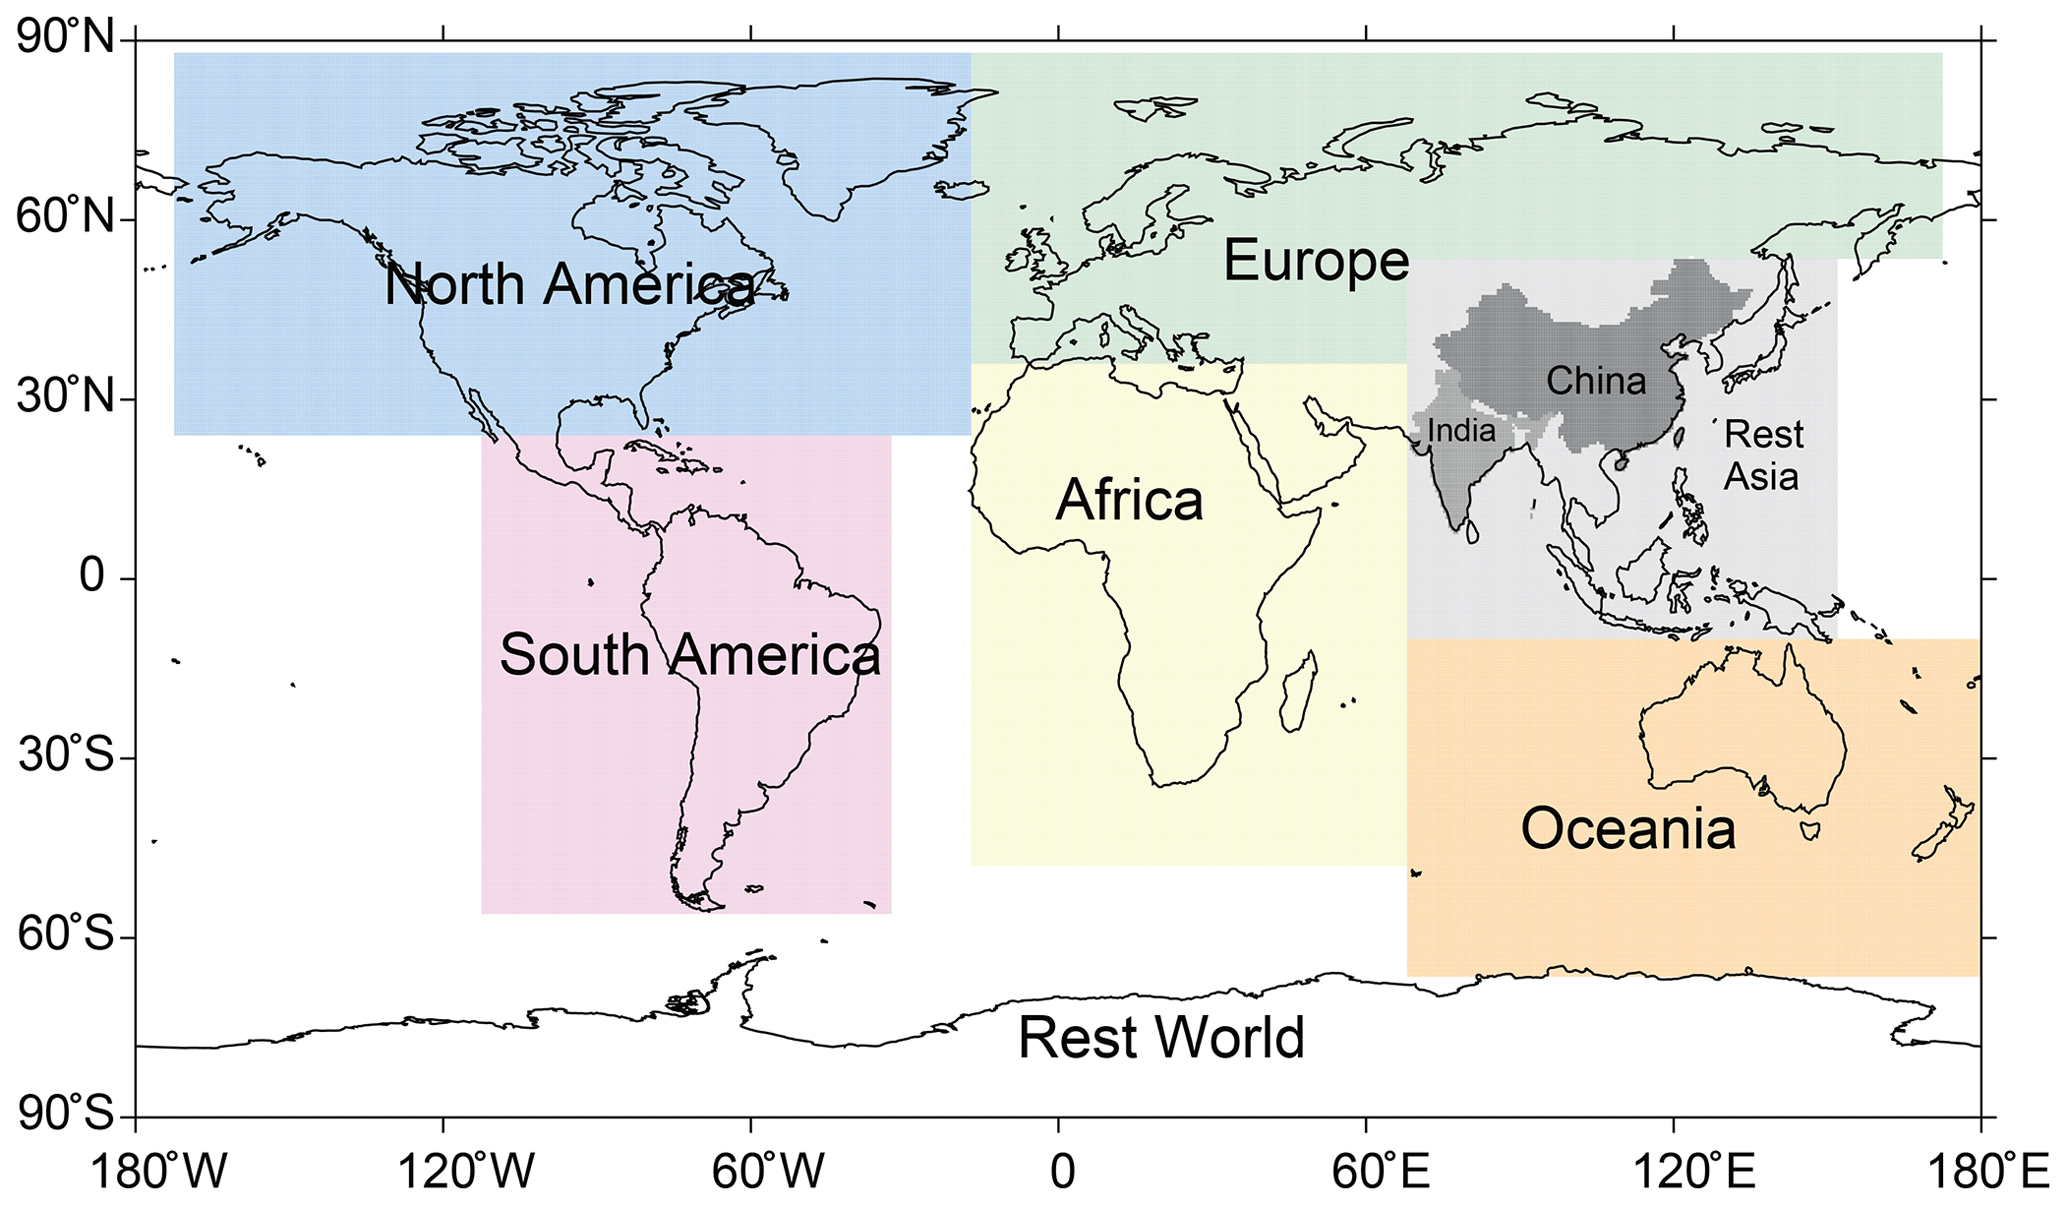
Figure 2Regions defined in the tagged CH4 tracer simulation. The regions are North America (NA), South America (SA), Europe (EU), Africa (AF), Oceania (OC), China (CHN), India (IND), and Rest of Asia (RtAS). All other areas are included in the rest of the world (RW) region.
We further apply a tagged CH4 tracer simulation to quantify the sources contributing to CH4 mixing ratios and trends in China over 2007–2018. The tagged CH4 tracer approach has been recently applied in GEOS-Chem to quantify source contributions in the US Midwest (Yu et al., 2021) and GFDL-AM4.1 with focuses on the global CH4 budget (He et al., 2020). We implement 100 tracers that tag CH4 emissions from different source types (agriculture, energy, industry, transportation, wastewater, residents, shipping, biomass burning, wetlands, seeps, and termites) and different regions (China, India, Europe, South America, North America, Africa, Oceania, etc.). The regions used for the tagged simulation are shown in Fig. 2, mainly based on Bey et al. (2001) with additional tagged regions for China and India in Asia. Global soil uptake is also tagged as a sink of CH4. We run the tagged CH4 simulation using the model settings of GCC (i.e., CEDS and interannually varying OH) for the period of 1980–2018. The results allow us to quantify the detailed source contributions to CH4 mixing ratios and trends over China.
3.1 CH4 emissions and sinks over the globe and China
Figure 3 and Table S1 in the Supplement compare the anthropogenic emissions of EDGAR and CEDS, natural emissions, and sinks in our model simulations (GCE (GEOS-Chem with EDGAR emissions) and GCC (GEOS-Chem with CEDS emissions) as shown in Table 1) with the estimates in the literature summarized by Saunois et al. (2020). The emissions in the two decades of 2000–2009 and 2008–2017 from both bottom-up and top-down studies are reported in Saunois et al. (2016, 2020) and are thus compared with corresponding estimates in this study. The anthropogenic emission source categories are different in the EDGAR and CEDS inventories, and we organize all sources into five main categories (agriculture and waste, biomass burning, fossil fuels, wetlands, and other sources) following Saunois et al. (2020), as also summarized in Table S2 in the Supplement.
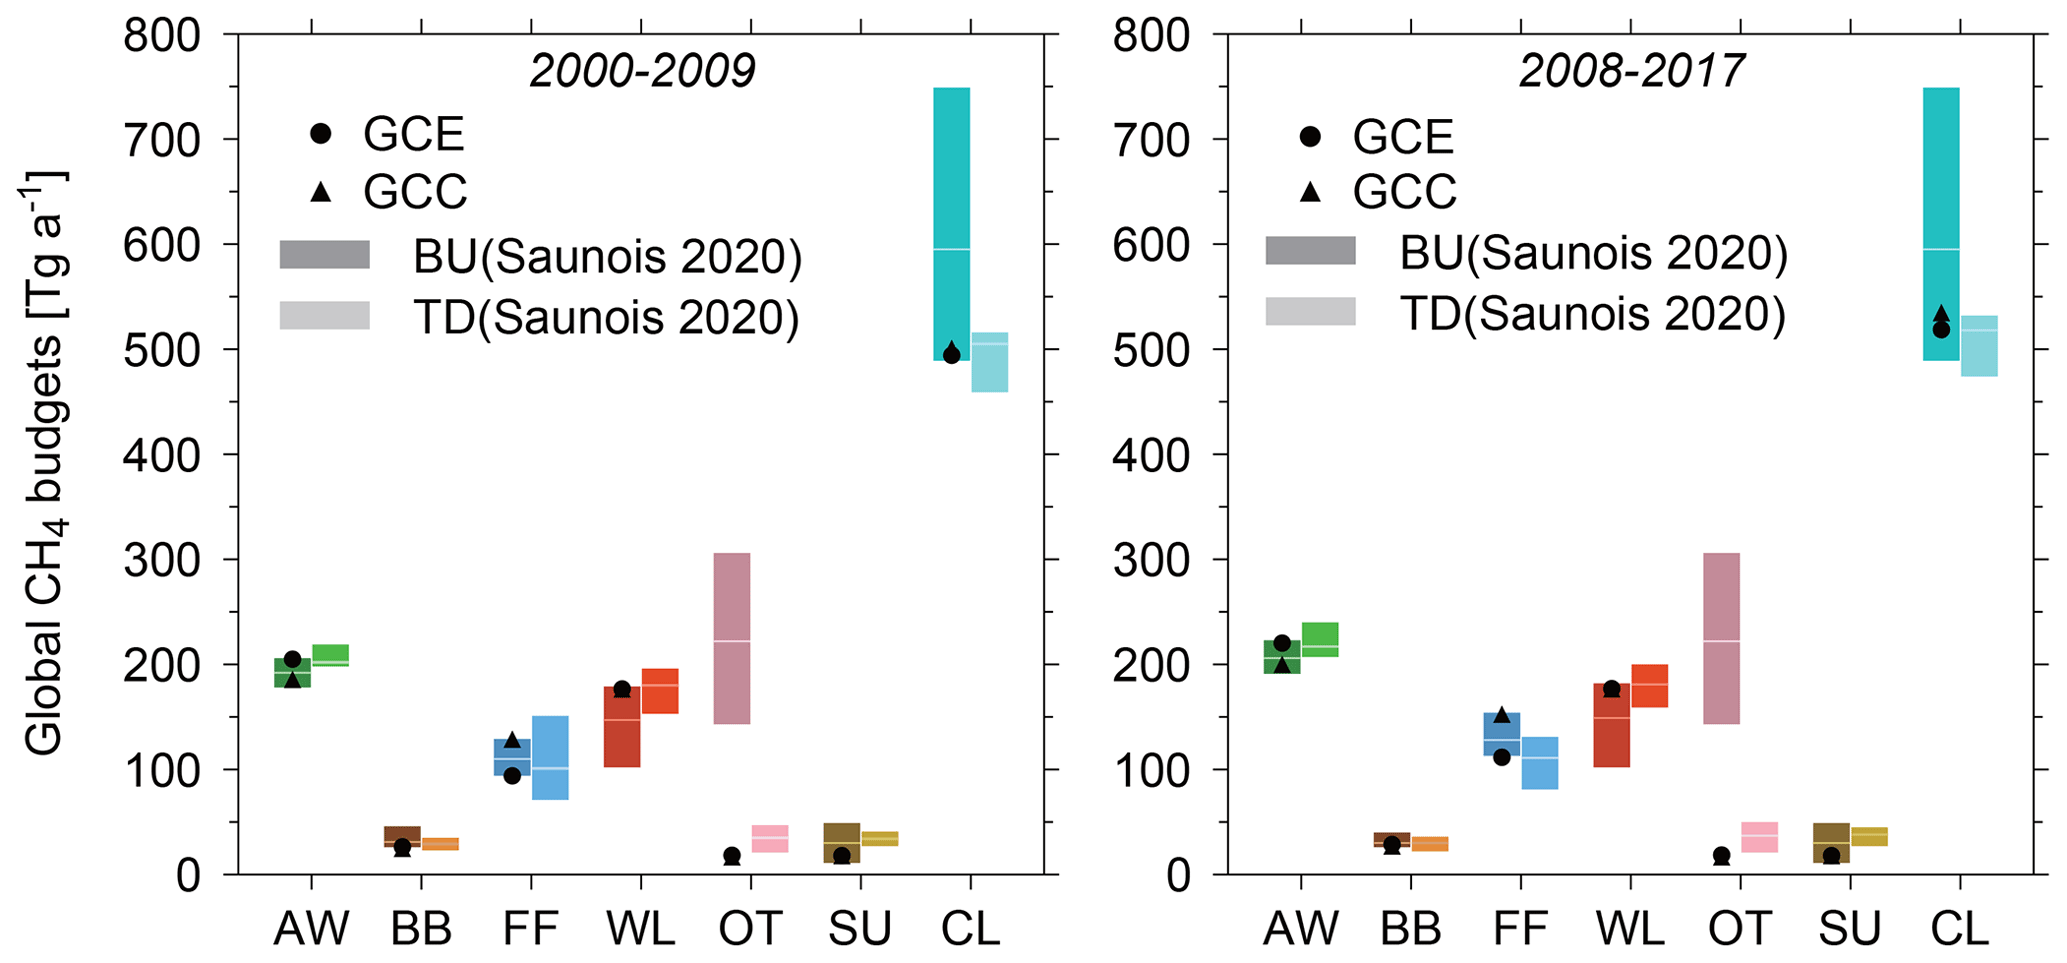
Figure 3Global CH4 budgets from main source categories and sinks for the 2000–2009 (2000s) and 2008–2017 (2010s) periods. Categories are grouped based on Table S2 including emissions from agriculture and waste (AW), fossil fuels (FF), wetlands (WL), biomass burning (BB), others (OT), and sinks due to soil uptake (SU) and chemical loss (CL). The bar charts show bottom-up (dark-colored bars) and top-down (light-colored bars) estimates in previous studies as summarized by Saunois et al. (2020). The global CH4 sources and sinks in the GCE (black circles) and GCC (black triangles) model simulations are also shown. Table S1 summarizes the values presented in the figure.
As shown in Fig. 3, the global total (anthropogenic and natural) emissions over 2000–2009 are 520 Tg a−1 for GCE and 533 Tg a−1 for GCC. These total emissions are in the low end of the top-down estimates of 547 Tg a−1 with a range of 524–560 Tg a−1 and are smaller than the bottom-up estimates of 703 (566–842) Tg a−1. The bottom-up estimates summarized by Saunois et al. (2020) included EDGAR and CEDS, and we can see that the differences from our emissions are largely driven by the underestimates of some natural emissions (e.g., geological, termite, and freshwater emissions), which are substantially reduced in the top-down estimates. In the 2008–2017 period, global total CH4 emissions in GCE and GCC have increased to 556 Tg a−1 in GCE and to 574 Tg a−1 in GCC and are within the top-down emission range of 576 (550–594) Tg a−1. The contributions of anthropogenic sources on total CH4 emissions are about 63 % (2000–2009) and 65 % (2008–2017) in GCE and 65 % (2000–2009) and 67 % (2008–2017) in GCC, which are slightly larger than 60 % and 62 % in the top-down estimates of Saunois et al. (2020). The global CH4 chemical losses simulated in GCE and GCC are also consistent with the top-down estimates for both periods, while the sink of soil uptake might be underestimated in the model.
Table 2 and Fig. 4 compare the annual CH4 emissions and sinks in China simulated in GCE and GCC with the results reviewed by Saunois et al. (2020) and Kirschke et al. (2013) and a bottom-up anthropogenic emission inventory of Peng et al. (2016) for the period of 2000–2009. Total Chinese CH4 emissions are 57.2 Tg a−1 (2000–2009) and 67.6 Tg a−1 (2008–2017) in GCE and 55.5 Tg a−1 (2000–2009) and 73.7 Tg a−1 (2008–2017) in GCC. Considerable differences between GCE and GCC can be seen for the emission estimates of different sectors. The CH4 emissions from fossil fuels over 2000–2009 are 23.4 Tg a−1 in GCC, which are at the high end of the bottom-up estimates (12.6–23.9 Tg a−1) summarized in Saunois et al. (2020). The CH4 emissions from fossil fuels in GCE are lower (15.8 Tg a−1 over 2000–2009) and are slightly higher than the estimate of 12.8 in Peng et al. (2016). By contrast, CH4 emissions from agriculture and waste in GCE (33.3 Tg a−1 over 2000–2009) are much higher than those in GCC (25.3 Tg a−1 over 2000–2009), and they are, respectively, at the high and low ends of the bottom-up (24.0–33.0 Tg a−1) estimates in Saunois et al. (2020). The natural sources (e.g., wetlands, biomass burning) and the soil uptake in our study are relatively low compared with the estimates in Saunois et al. (2020). For the period of 2008–2017, the CH4 emissions from fossil fuels increase to 22.8 Tg a−1 in GCE and 38.4 Tg a−1 in GCC, which are also at the averaged level and the high end of the bottom-up estimate (16.6–39.6 Tg a−1) in Saunois et al. (2020).
Table 2CH4 sources and sinks over China in the 2000s and 2010s*.

* Bottom-up (B-U) and top-down (T-D) sources and soil uptake estimates of mean (range) values reported from Saunois et al. (2020) and Peng et al. (2016). OH chemical loss estimates in the 2000s are from Kirschke et al. (2013).
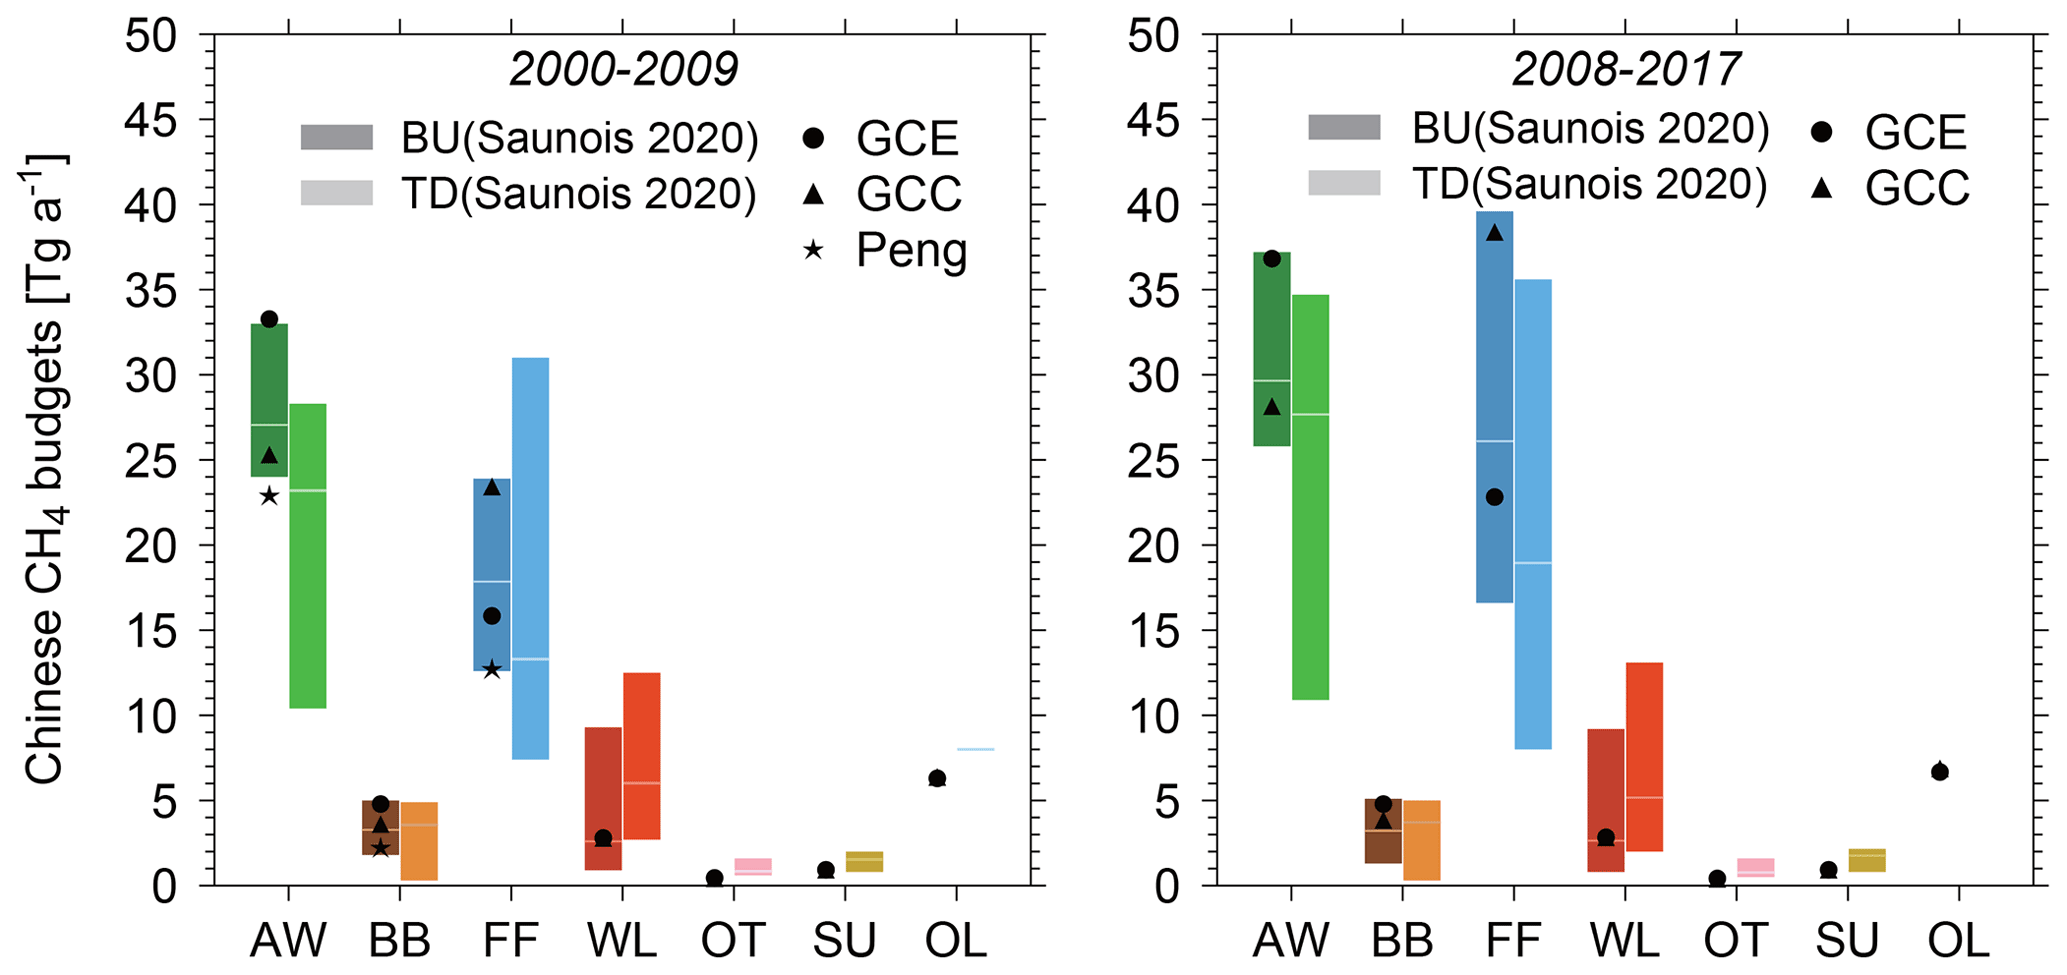
Figure 4Similar to Fig. 3 but for CH4 sources and sinks over China averaged for the 2000–2009 and 2008–2017 periods. The bar charts show previous Chinese bottom-up (dark-colored bars on the left) and top-down (light-colored bars on the right) estimates as summarized by Saunois et al. (2020) and Kirschke et al. (2013) and are compared with model results in the GCE (black circles) and GCC (black triangles) simulations. The bottom-up estimates of 2000–2009 mean Chinese CH4 emissions by Peng et al. (2016) are also shown as black stars. Values presented in the figure are summarized in Table 2.
Figure 5 further shows annual total Chinese CH4 emissions from different sectors and their percentage contributions during 1980–2018 in both GCE and GCC simulations. Chinese total CH4 emissions in GCE are 46.7 Tg a−1 in the year 1980 and increase to 69.8 Tg a−1 (49.5 % increase) in 2012 (the last available year for EDGAR v4.3.2), presenting an increasing trend of 0.7 Tg a−2 over 1980–2018. GCC simulations have a stronger trend of 1.3 Tg a−2 over the period than GCE, with total emissions of 32.9 Tg a−1 in 1980 and 76.7 Tg a−1 in 2014 (the last available year of CEDS). Both GCE and GCC show faster increases after 2003 than the years before, which are largely driven by the emissions from the fossil fuels or energy sector. The largest differences between GCE and GCC, as also discussed in Fig. 4, come from the sectors of fossil fuels and agriculture. Agricultural sources in GCE account for 54.7 % of the total CH4 emissions in 1980 and gradually decrease to 37.0 % in 2018, which mainly results from decreases in emissions from rice cultivation with some offset due to increases in the livestock emission. The contributions of agricultural sources in GCC are much smaller with values of 36.3 % in 1980 and 21.5 % in 2018. The energy or fossil fuels sector becomes the largest contributor of Chinese CH4 emissions in recent years in GCC, accounting for 52.2 % of the total emissions in 2018, and largely drives the larger positive trend in GCC than GCE.
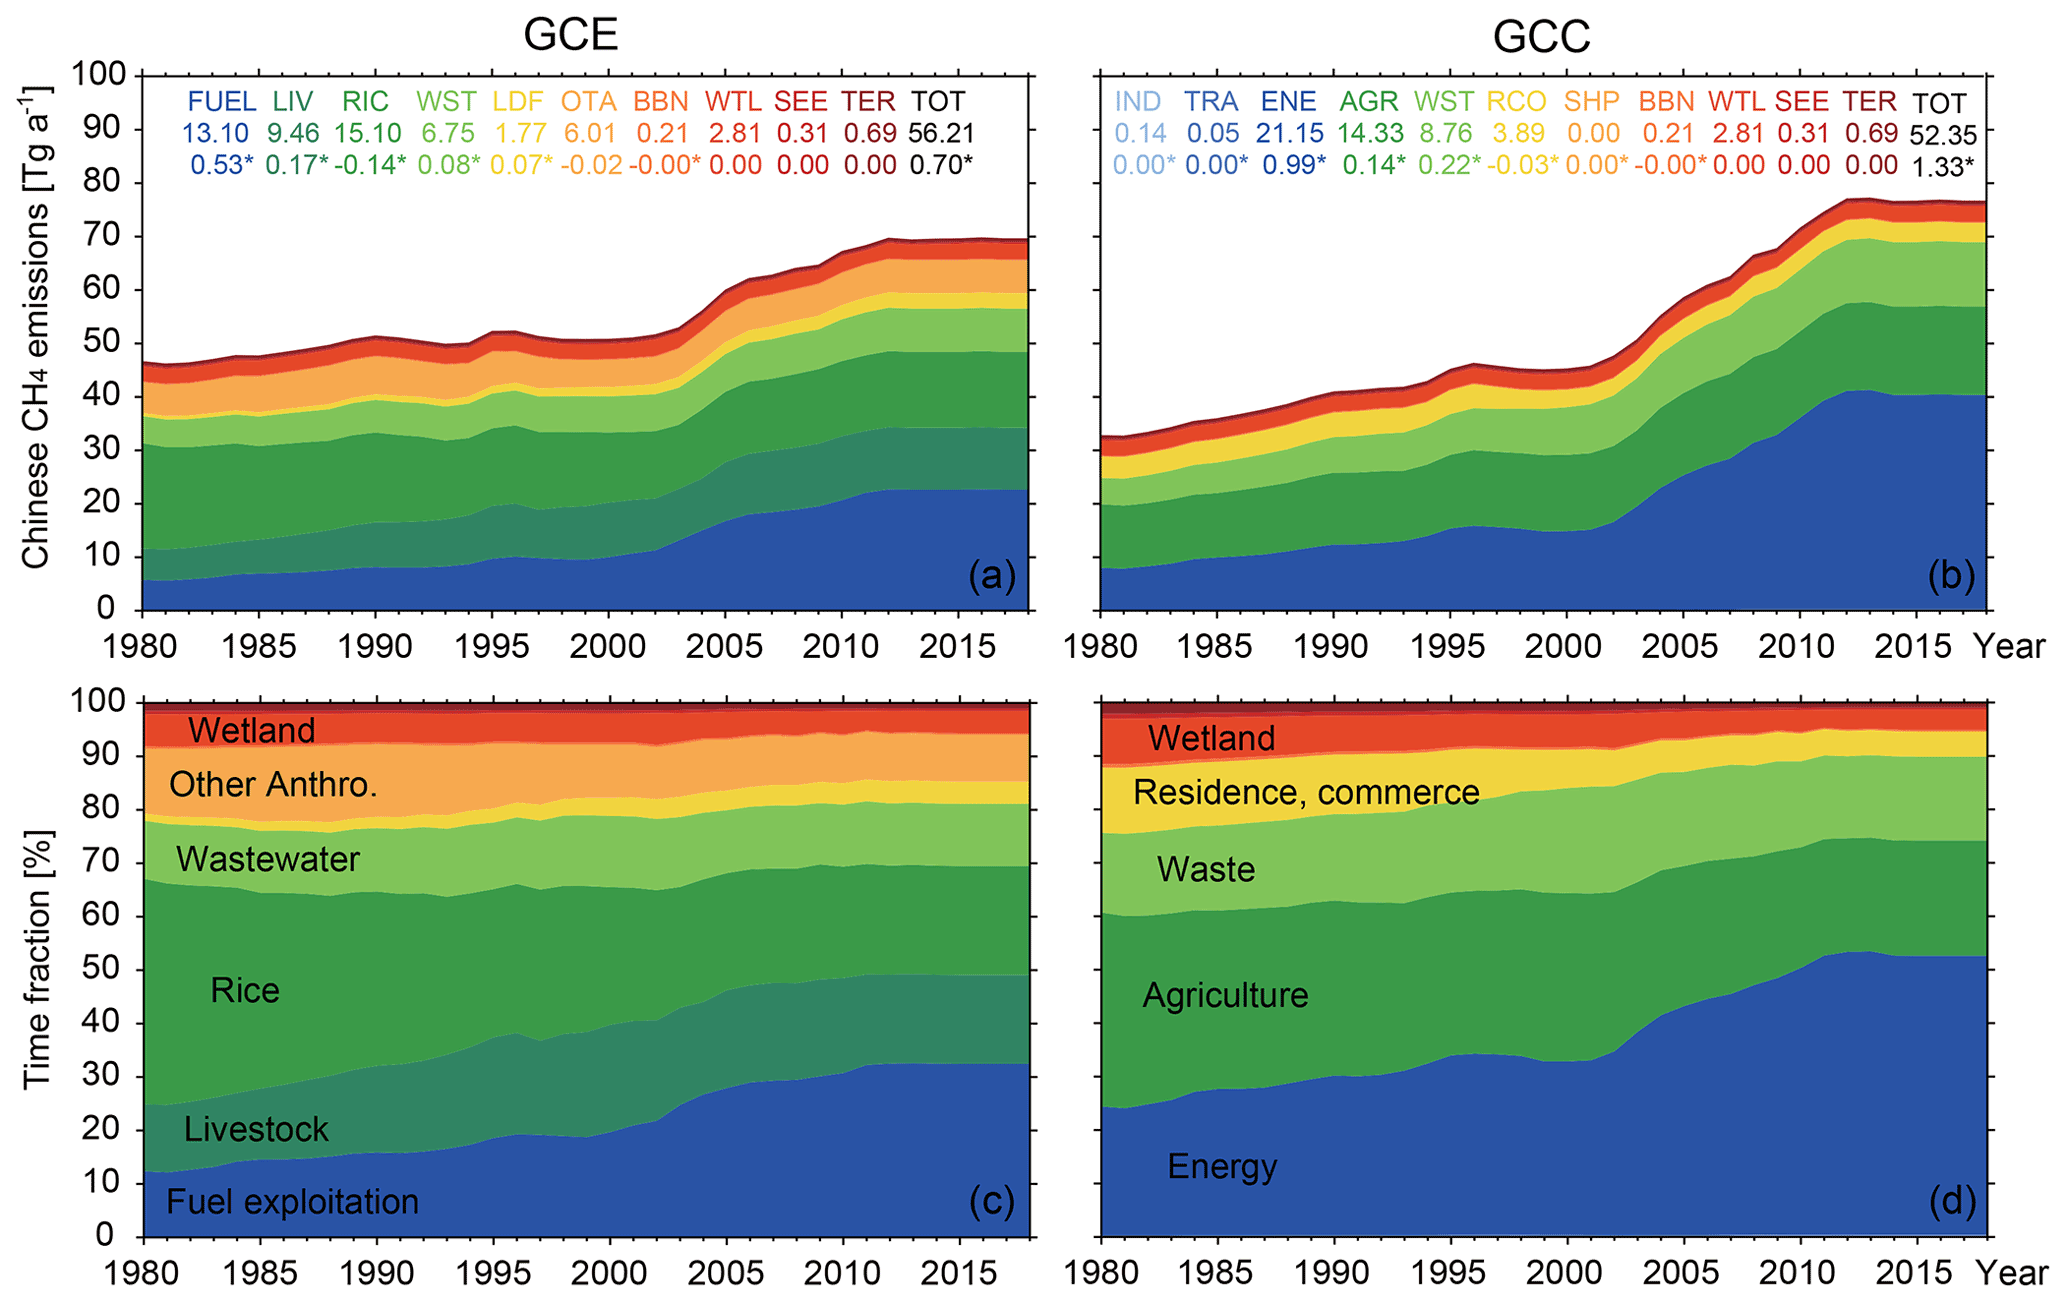
Figure 5Time series of annual Chinese CH4 emissions from different sectors (a, b) and their percentage contributions (c, d) in the GCE (a, c) and GCC (b, d) model simulations during the period of 1980–2018. The emission sectors and their abbreviations are listed in Table S2. Annual mean emission totals and trends over 1980–2018 (with asterisks denoting the statistical significance of p value < 0.05) are shown inset.
The comparisons above indicate large uncertainties in the Chinese CH4 emission estimates, as to some extent covered by the EDGAR and CEDS anthropogenic emission inventories. The magnitude and temporal variations of methane budgets over the past decades are known to have large uncertainties (Kirschke et al., 2013; Turner et al., 2019; Saunois et al., 2020). Relative uncertainties are about 20 %–35 % for anthropogenic emissions such as fuel exploitation and agriculture and waste, about 50 % for biomass burning and wetlands, and up to 100 % or greater for other natural sources (Saunois et al., 2020). Uncertainties in the methane sinks are about 10 %–20 % by proxy methods such as using methyl chloroform and are 20 %–40 % by atmospheric chemistry models (Saunois et al., 2016). More detailed regional methane datasets can help improve assessing the global budget (Xu and Tian, 2012; Valentini et al., 2014; Saunois et al., 2016). We will further discuss the uncertainties in CH4 emissions in the last section.
3.2 Observed and simulated methane mixing ratios and trends in China
Based on the emissions described above, we have conducted a series of model simulations as summarized in Table 1 and evaluated the model results with surface CH4 measurements at the four Chinese sites. We find that when using the interannually fixed OH (global tropospheric volume-weighted mean of 10.6×10⁵ as shown in Fig. S1), both model simulations with the EDGAR and CEDS emissions overestimate the observed CH4 trends from 2007 onwards by 0.8–6.2 ppbv a−1 with EDGAR (Run1) and by 4.0–10.9 ppbv a−1 with CEDS (Run2). The model simulated CH4 mixing ratios and trends over China are rather sensitive to the global OH levels. In the sensitivity simulations with global OH decreasing 10 % (Run5) or increasing 10 % (Run6) relative to the fixed levels (global mean of 10.9×10⁵ ) over 2010–2018, CH4 mixing ratios would, respectively, increase by 2.0 %–3.4 % or decrease by 1.9 %–3.2 % at the four Chinese sites (Fig. S2 in the Supplement). Increasing OH levels by 10 % would lead to negative trends in CH4 mixing ratios at all four sites over 2010–2018 (Fig. S2). Such effects are also found in the simulation with global CH4 emissions decreasing by 50 Tg a−1 over the same period (Run 7 in Table 1 and Fig. S2).
The uses of interannually varying OH (Fig. S1) in model simulations (Run3 and Run4 in Table 1) overall correct the high biases in simulated CH4 trends in simulations with fixed OH (Run1 and Run2) at the Chinese sites. We find that changing model horizontal resolution from to does not significantly affect the simulated surface CH4 trends. Hereafter, we will focus our analyses on the model simulations at resolution and with interannually varying OH (i.e., GCE and GCC in Table 1).
Figure 6 shows the measured and simulated time series of monthly CH4 mixing ratios at the four Chinese sites. Both GCE and GCC model results are shown, and distinct differences in CH4 mixing ratios can be seen between the two simulations. Among the four Chinese sites, the largest CH4 mixing ratio is observed at the SDZ site, a rural site near Beijing surrounded by high anthropogenic emissions, compared with the other three Chinese background sites (DSI, LLN, and WLG). GCC with high anthropogenic emission estimates simulate on average 1.0 %–4.7 % higher CH4 mixing ratios than GCE results and are 0.3 %–6.5 % higher than measurements at the four Chinese sites. Measured CH4 mixing ratios at the four sites have been increasing at the rates of 7.0–7.9 ppbv a−1 since 2007. The GCC model results reproduce the trends in CH4 mixing ratios at the DSI, LLN, and WLG sites, while they overestimate the 2009–2015 trend measured at SDZ by a factor of 2. The GCE model results in general underestimate the measured trends except for that at the SDZ site. These results can be explained by the higher CH4 emission estimates and increases in CEDS than EDGAR since 2007 and may also reflect that the regional CH4 emissions around SDZ (i.e., North China) are too high in CEDS. Further evaluations of the two model simulations with CH4 column mixing ratio measurements (since 2011) at six TCCON sites in Asia (Wunch et al., 2011) show similar results, with small biases of 0.2 %–1.0 % in CH4 mixing ratios for GCC and negative biases of 2.6 %–3.7 % for GCE (Fig. S3 in the Supplement). This again reflects the higher Chinese CH4 emission estimates in years around 2012 in CEDS than EDGAR, which then affect the model simulations afterwards by using their emissions of the latest available years.
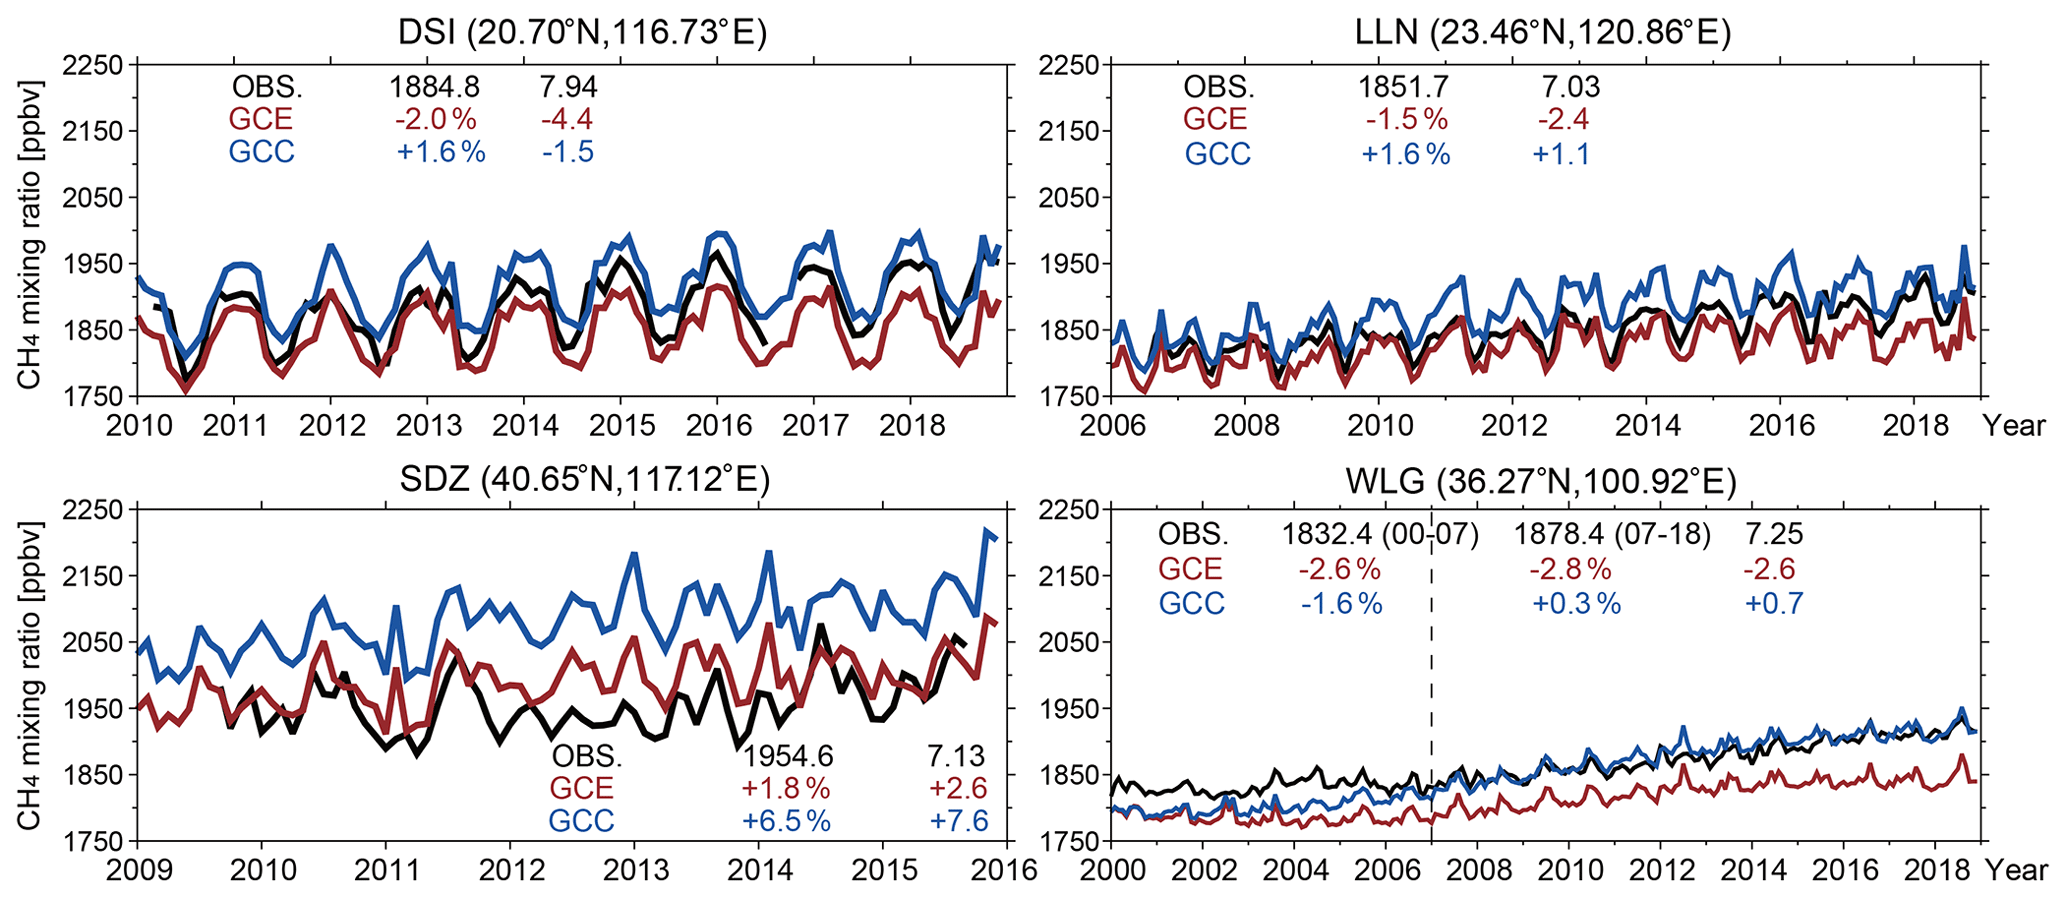
Figure 6Comparison of GCE-simulated (with EDGAR anthropogenic emissions and interannually varying OH; red lines) and GCC-simulated (with CEDS and interannually varying OH; blue lines) monthly mean CH4 mixing ratios with NOAA in situ observations (black lines) in China. The observed mean mixing ratios (in unit of ppbv), trends (ppbv a−1), and corresponding model biases are shown inset.
Comparisons with satellite and aircraft observations further provide spatially and vertically resolved evaluations of the model simulations. Figures 7 and 8 show, respectively, the GOSAT-observed and model-simulated spatial distributions of seasonal mean CH4 mixing ratios and trends over 2010–2017. The latitude-dependent biases between simulations and observations have been found to be noticeable at the resolution but are significantly smaller at (Stanevich et al., 2020). The GOSAT-observed CH4 column mixing ratios over China peak in autumn (1825.6 ppbv on average) and reach a minimum in spring (1797.4 ppbv). There is a stronger seasonality in the CH4 mixing ratio in the South China (1856.9 ppbv in autumn vs. 1826.8 ppbv in spring) likely attributed to the seasonal variation in agriculture emissions. The GOSAT-observed 2010–2017 trends show small spatial and seasonal variations over China with values of 7.67–8.43 ppbv a−1. Both GCE and GCC model-simulated CH4 mixing ratios present similar spatial patterns with high correlation coefficients (r>0.90), while GCE-simulated mixing ratios are on average biased low by 23.5–32.4 ppbv (∼1.6 %), and GCC results are overestimated by 25.6–36.8 ppbv (∼1.7 %). This discrepancy between the two simulations is mainly due to the CH4 emissions from fossil fuels, which are 23.5 Tg a−1 for the GCE and 39.9 Tg a−1 for the GCC in China over 2010–2017. As for the CH4 trends during 2010–2017 over China, both GCC and GCE show similar spatial patterns as those observed by GOSAT with moderate correlations of 0.2–0.5, while GCC model results have smaller biases of −1.7–0.4 ppbv a−1, compared to GCE results that in general underestimate the trends by 2.6–4.7 ppbv a−1.
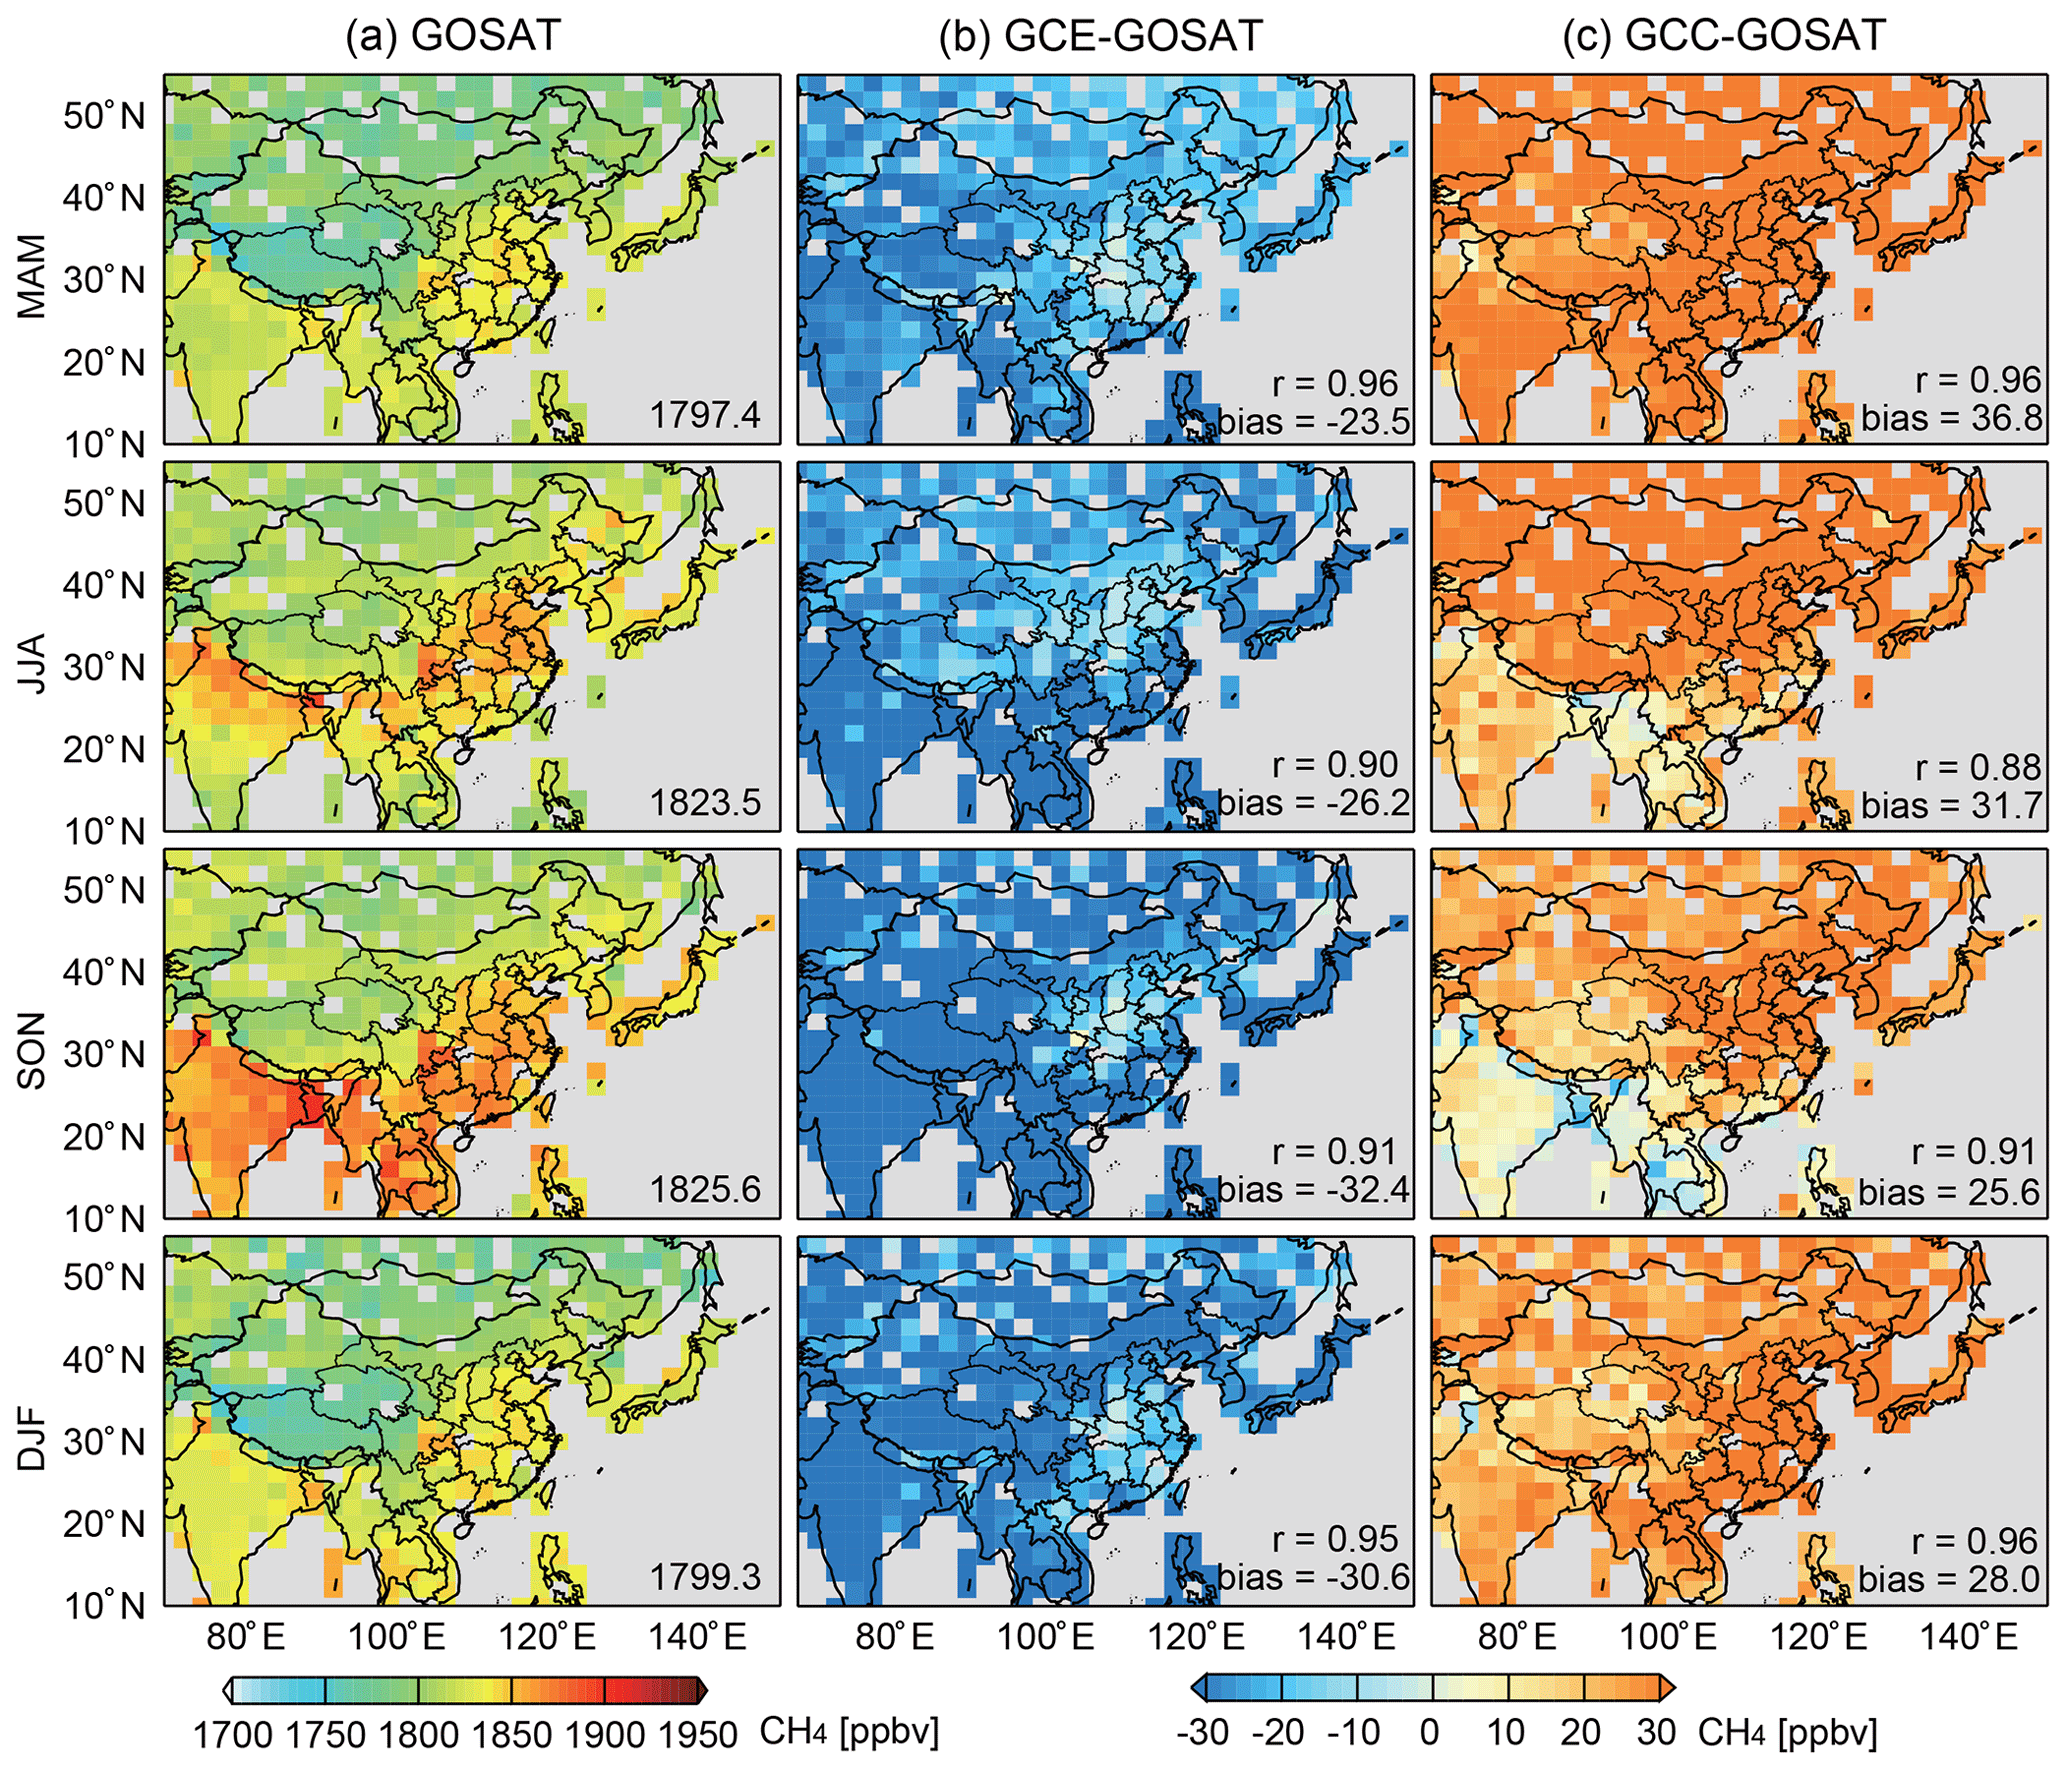
Figure 7The 2010–2017 seasonal mean GOSAT-observed and model-simulated atmospheric CH4 mixing ratios over Asia. Both observations and the GEOS-Chem model simulations are re-grided to the model resolution. The model results are then applied with satellite averaging kernels. The middle and right panels show, respectively, GCE (with EDGAR anthropogenic emissions and interannually varying OH; column b) minus GOSAT (column a) and GCC (with CEDS and interannually varying OH; column c) minus GOSAT differences. The observed mean atmospheric CH4 mixing ratio, GOSAT vs. model correlation coefficients (r), and mean model biases over China are shown inset. The seasonal means are averages of March–April–May (MAM), June–July–August (JJA), September–October–November (SON), and December–January–February (DJF).
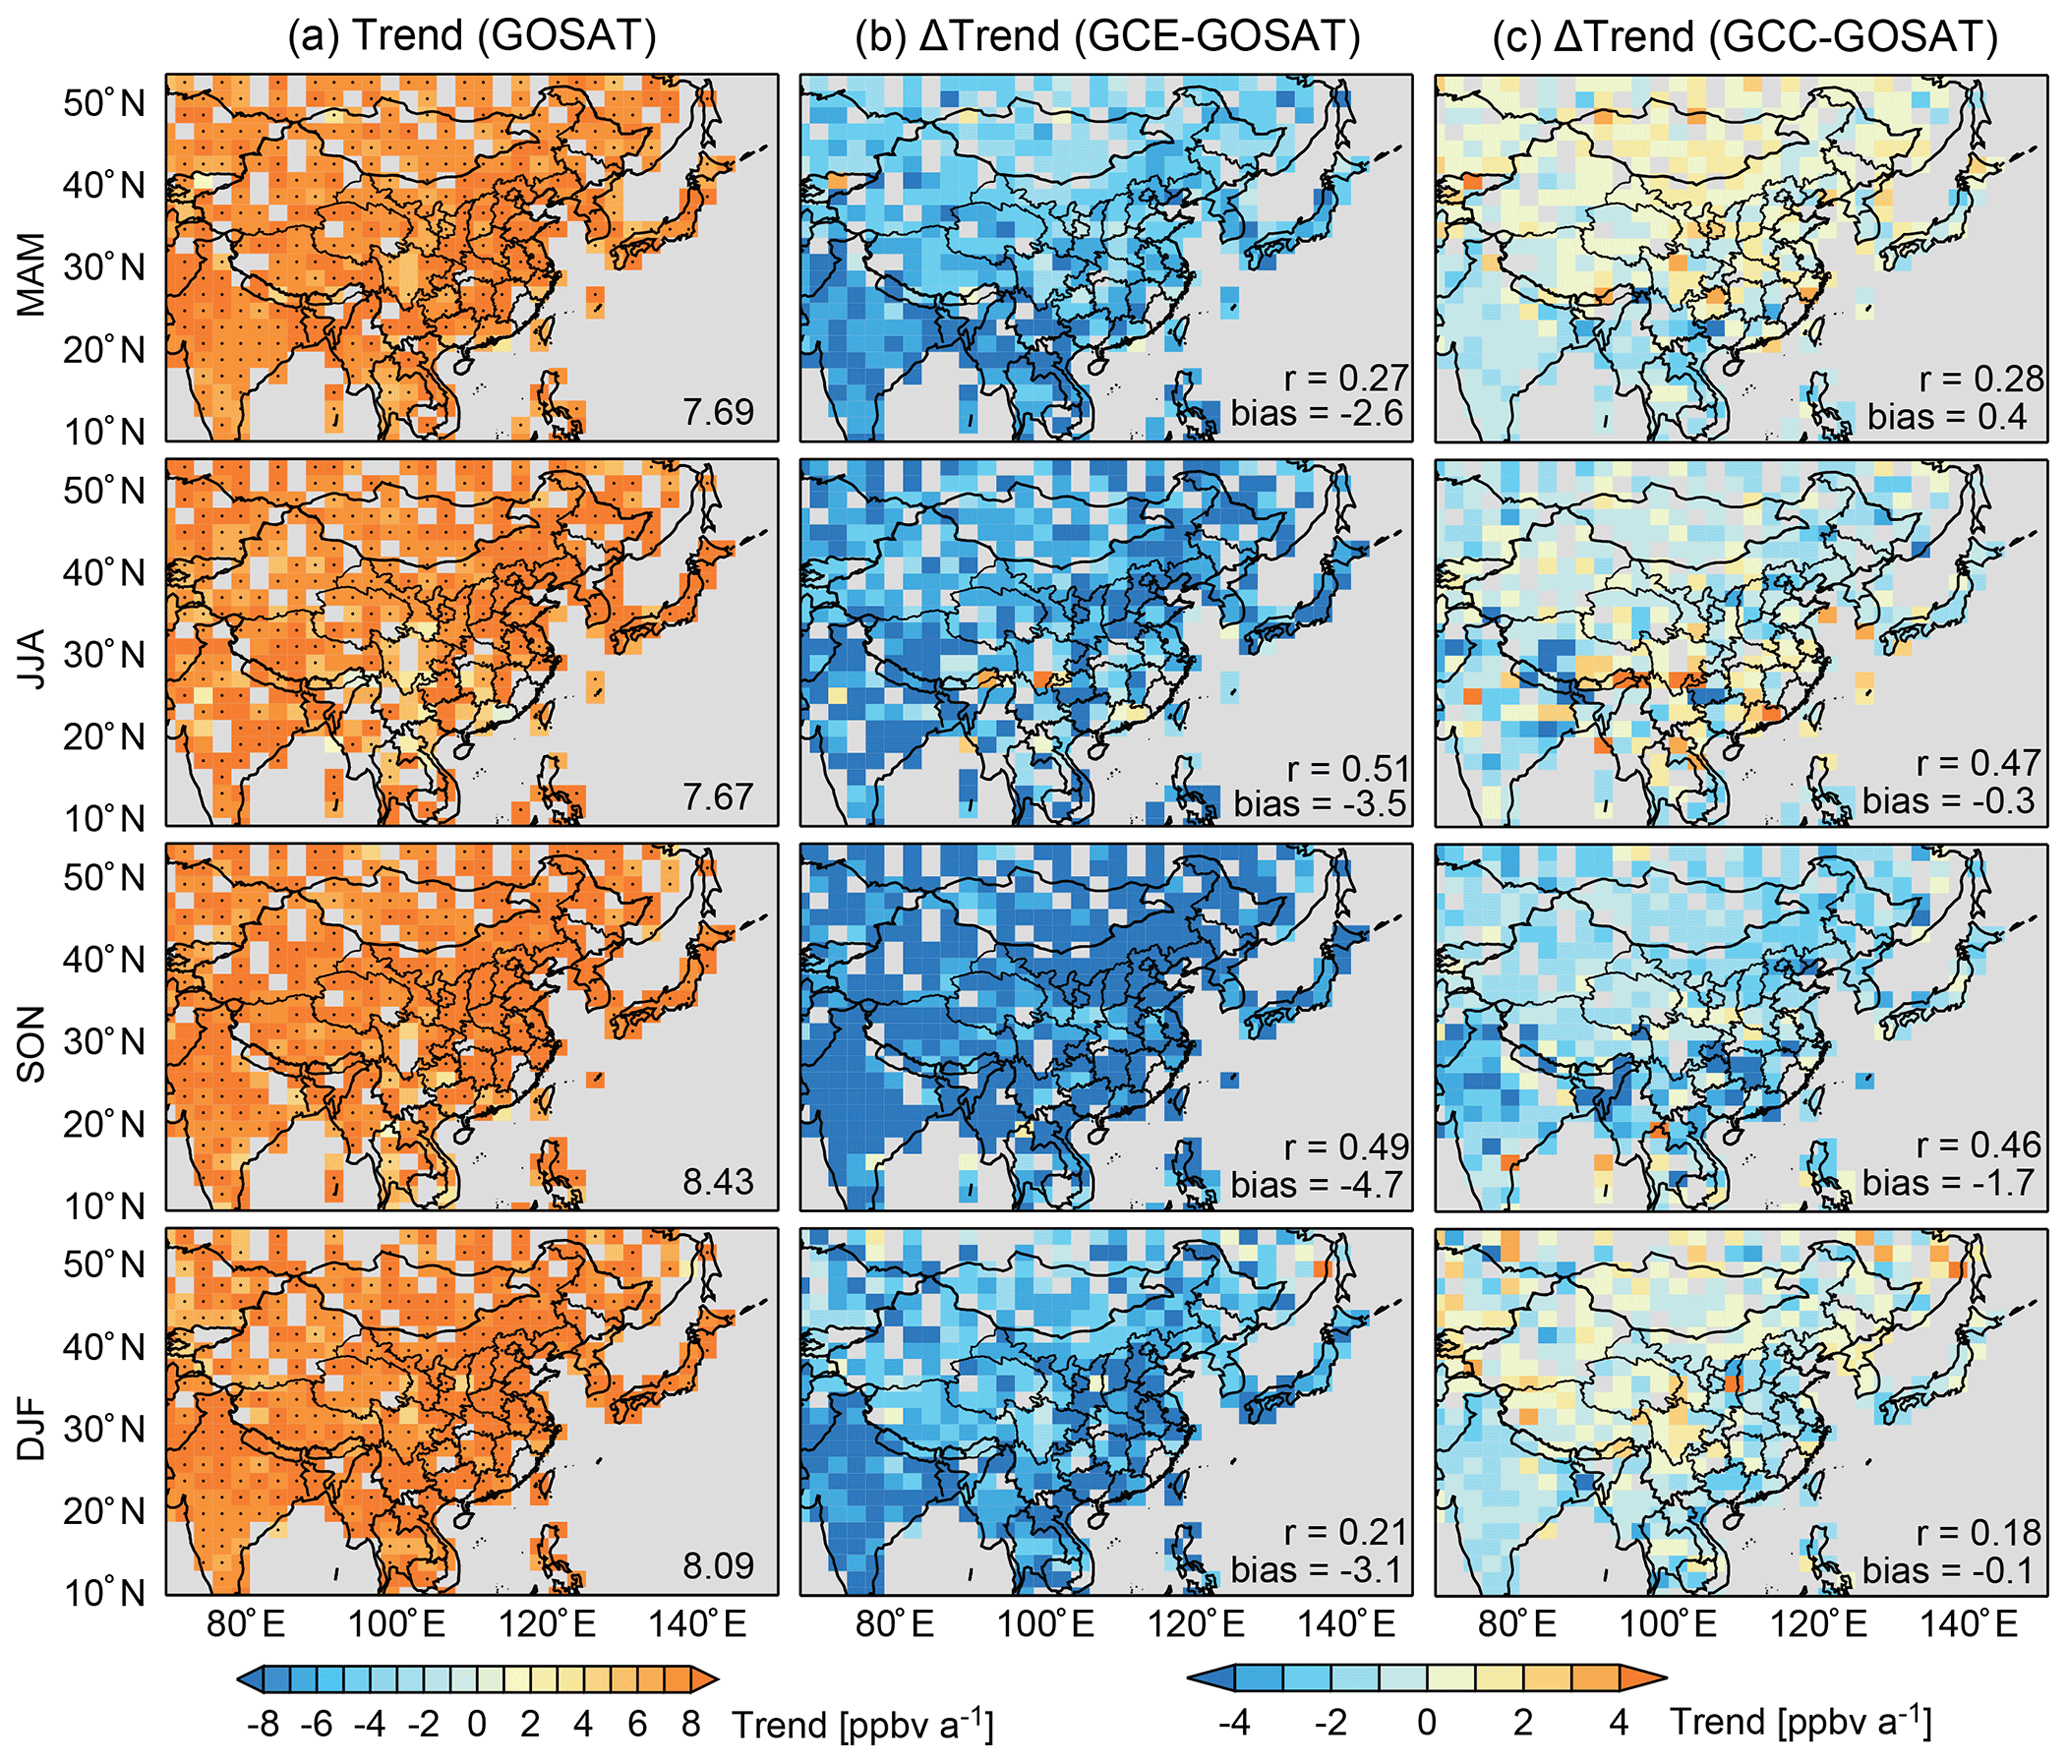
Figure 8The same as Fig. 7 but for seasonal mean trends in atmospheric CH4 mixing ratios over 2010–2017. The middle and right panels show, respectively, GCE (with EDGAR anthropogenic emissions and interannually varying OH; column b) minus GOSAT (column a) and GCC (with CEDS and interannually varying OH; column c) minus GOSAT differences. The observed mean CH4 concentration trend, GOSAT vs. model correlation coefficients (r), and mean model biases over China are shown inset.
Figure 9 shows the latitudinal distribution of annual mean CH4 mixing ratios as observed by HIPPO and ATom aircraft campaigns at three altitude layers (1–2, 4–5, and 7–8 km). Model results sampled along the flight tracks at their observing time are also shown. Both aircraft measurements and model results are then averaged in 2∘ latitude bins. As shown in Fig. 9, large latitudinal gradients in the tropospheric CH4 mixing ratios between the northern and southern hemispheres, in particular in the lowest 2 km of the tropics, are observed by the aircraft measurements and are captured by the model results with the two emission inventories. Similar to the comparison with GOSAT observations, GCE model-simulated CH4 mixing ratios tend to be lower than those in GCC due to the lower estimate of global emissions in GCE (556 Tg a−1) than GCC (574 Tg a−1) since 2008 (Table S1). GCE model results underestimate the aircraft measurements with mean negative biases of 27.5–31.1 ppbv at the three altitude layers for HIPPO and even larger negative biases of 61.5–73.7 ppbv for ATom. By contrast, GCC model results are in general too high with biases of 18.4–22.8 ppbv for HIPPO and −1.7–9.4 ppbv for ATom. The biases in GCC are overall smaller than those in GCE.
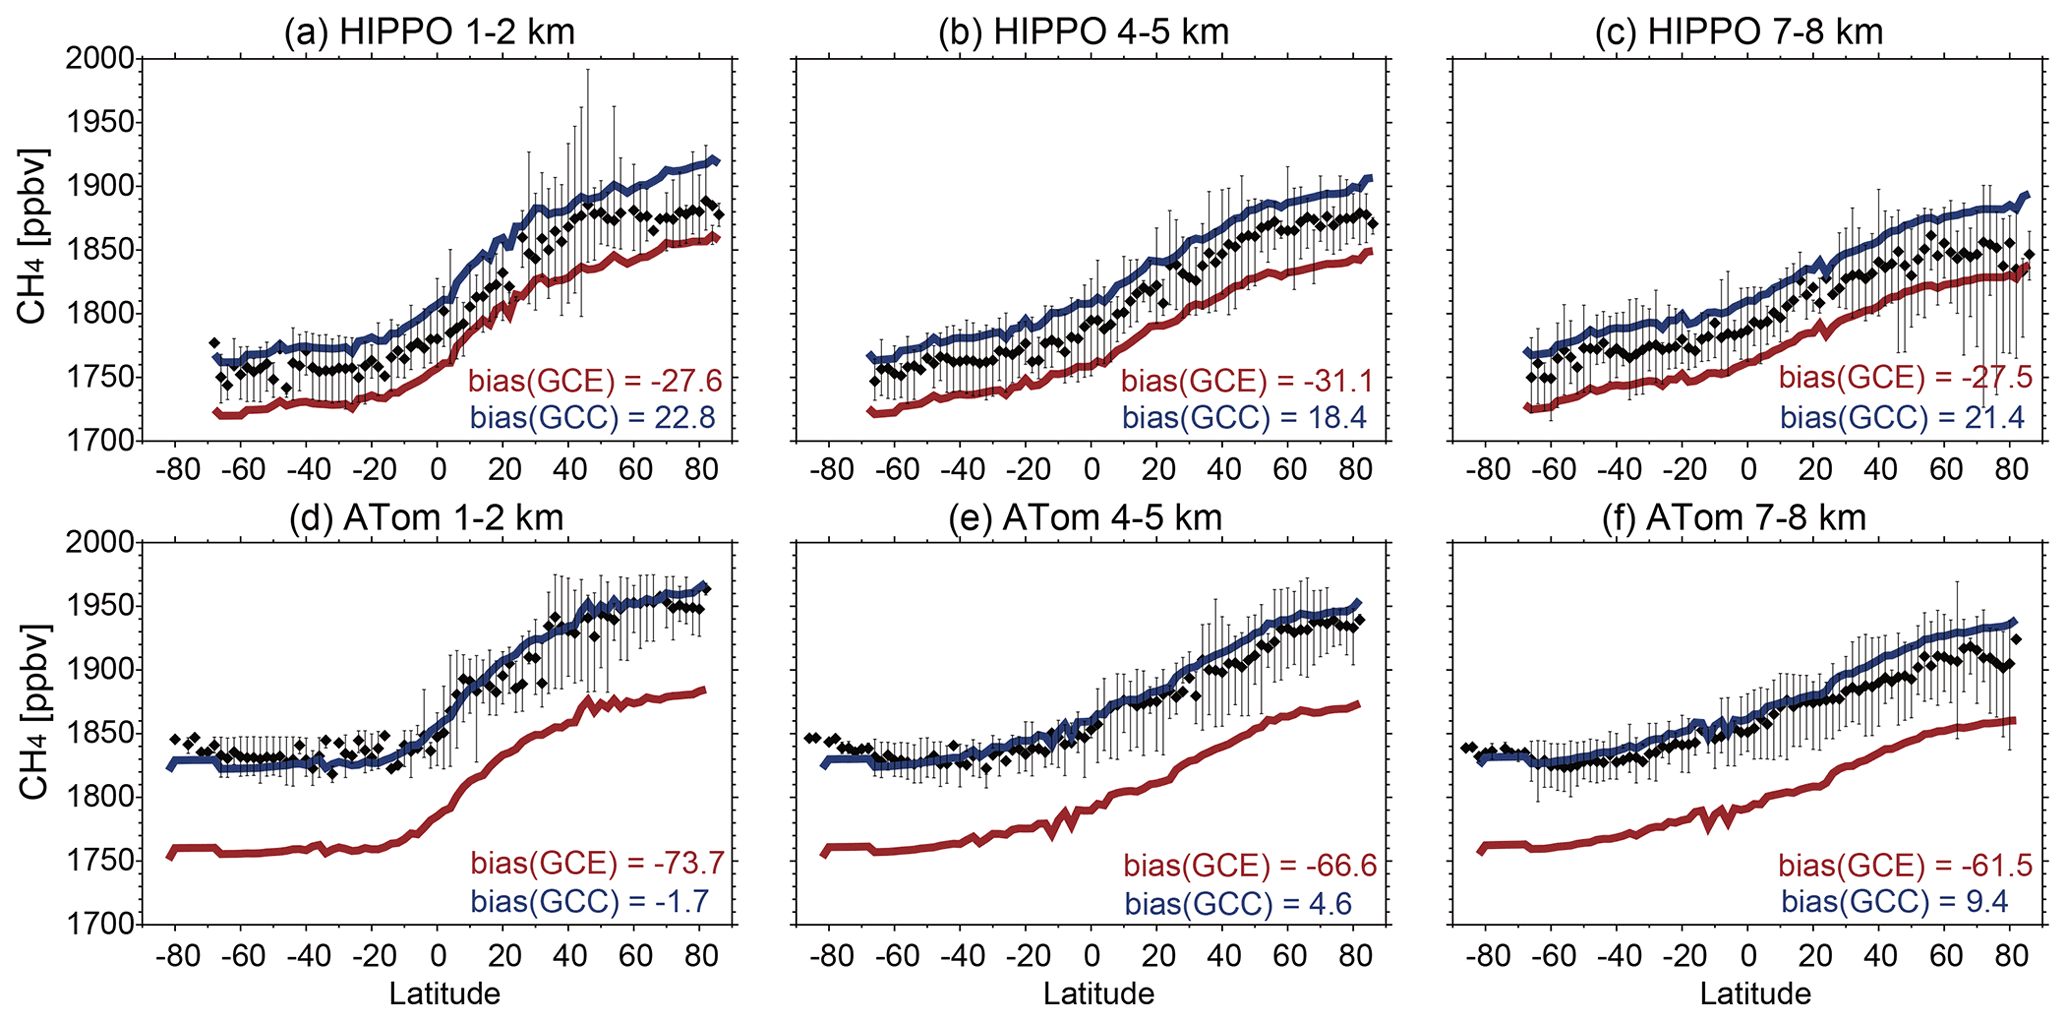
Figure 9HIPPO and ATom aircraft-measured latitudinal gradients of CH4 mixing ratios. Measurements from HIPPO (a–c) and ATom (d–f) flights are averaged in 2∘ latitude bins and at three altitude levels (a, d: 1–2 km; b, e: 4–5 km; and c, f: 7–8 km). The black symbols and bars represent the mean values and ranges for each bin. The corresponding model results from the GCE (with EDGAR anthropogenic emissions and interannually varying OH; red lines) and GCC (with CEDS and interannually varying OH; blue lines) simulations are also shown, and the values inset present the mean model biases relative to aircraft measurements.
The changes in the model bias for the comparisons with HIPPO and ATom measurements reflect their simulated trends in the CH4 mixing ratios. Since both HIPPO (2009–2011) and ATom (2016–2018) provide measurements over the Pacific (black box in Fig. 1), we calculate the differences between HIPPO and ATom measurements as the observed CH4 concentration trends over this region, and these trends also largely reflect the influences from upwind Asian CH4 sources and levels. Figure 10 shows aircraft-observed and corresponding model-simulated trends separated for four seasons. The HIPPO (2009–2011) and ATom (2016–2018) CH4 trends as estimated by the aircraft measurements range from 5.8 to 10.7 ppbv a−1 for the different seasons and altitudes, with typically higher increasing rates in boreal summer and autumn than those in boreal spring and winter. Both GCE and GCC model results tend to underestimate the trends, but the biases in GCC are much smaller than GCE. A distinct feature that can be seen from aircraft observations is the high CH4 increasing rates over the tropics in boreal summer and autumn (reaching 15 ppbv a−1), while both model results do not capture it and show weak latitudinal gradients in the CH4 trends. These tropical CH4 increases are likely driven by the increasing tropical microbial emissions either from wetlands or livestock shown in some recent papers (Nisbet et al., 2016; Saunois et al., 2017; Worden et al., 2017; Maasakkers et al., 2019; Yin et al., 2021; Zhang et al., 2021), which have not been found in the model simulations.
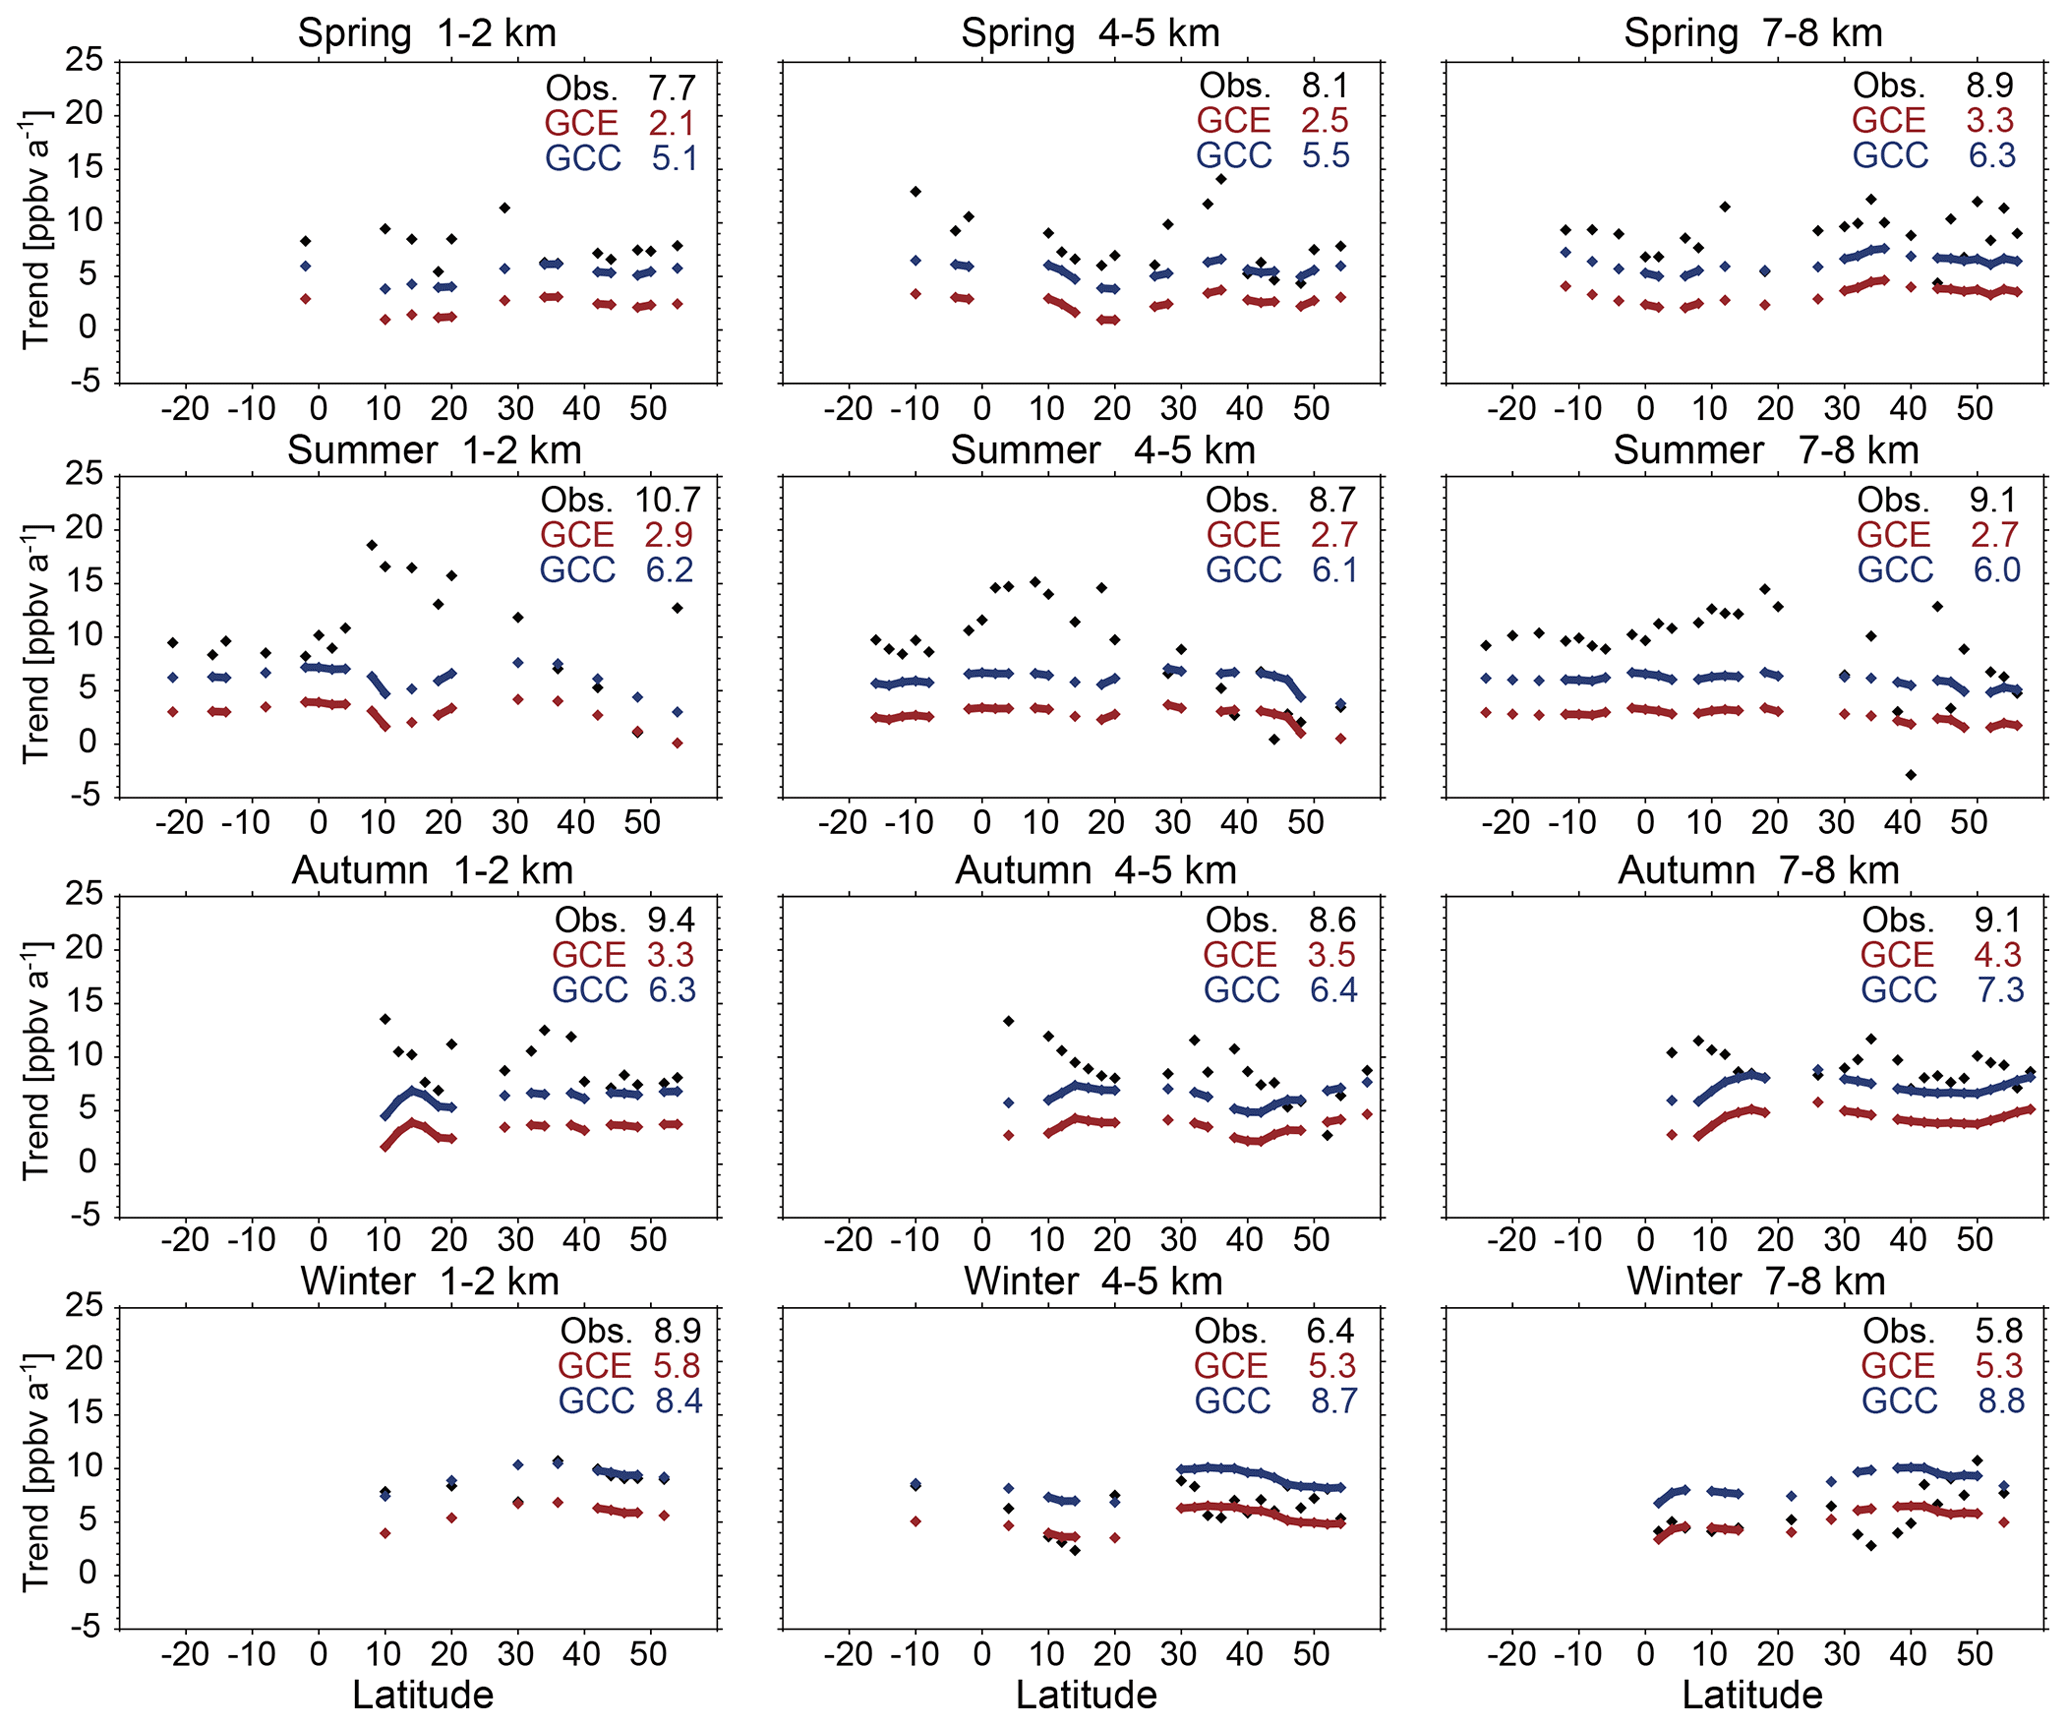
Figure 10Comparisons of simulated CH4 trends in GCE (with EDGAR anthropogenic emissions and interannually varying OH; red dots) and GCC (with CEDS and interannually varying OH; blue dots) against aircraft observation trends (black symbols) in four seasons (spring: March–April–May; summer: June–July–August; autumn: October–November; winter: January–February). All observations and model results sampled along the flight tracks are averaged in 2∘ latitude bins and at three altitude levels (left: 1–2 km; middle: 4–5 km; and right: 7–8 km). Mean observed and simulated CH4 trends are shown inset.
Summarizing the comparisons of model results with all available measurements over China and the Pacific, we find that the surface, aircraft, and satellite CH4 measurements have indicated rather consistent increase rates of CH4 mixing ratios over China with values ranging from 7.0 to 8.4 ppbv a−1 in recent years. As CH4 has a lifetime of about 9 years, such increases reflect changes in not only domestic emissions but also global emissions. The GCE and GCC model simulations with the interannually varying OH levels both capture the main features of the observed CH4 mixing ratios and trends over China, and the GCC results show much smaller model biases than GCE. We will thus use the GCC model simulation to quantify the domestic and global sources contributing to the CH4 mixing ratios and trends over China.
3.3 Source attribution of CH4 mixing ratios and trends in 2007–2018
Here we apply the GCC model configuration (i.e., the CEDS inventory and interannually varying OH) in the tagged CH4 simulation. The GCC model results can generally reproduce the spatial distribution of GOSAT-observed CH4 levels and trends as shown in Fig. S4 in the Supplement, with mean biases of 27.4 ppbv (observed 1805 ppbv vs. simulated 1833 ppbv) in the global CH4 mixing ratio and −0.8 ppbv a−1 (observed 7.08 ppbv a−1 vs. simulated 6.26 ppbv a−1) in the trend. As described in the Sect. 2.3, our tagged CH4 simulation includes 100 region- and sector-specific CH4 tracers. The tagged CH4 simulation is conducted over 1980–2018, and we analyze the results for 2007–2018. Figure 11 shows contributions of CH4 emissions from different source regions and different sectors on the mean surface mixing ratios and trends in China during this time period, and the values are also summarized in Table 3 for mixing ratios and Table 4 for trends. As for mixing ratios, we find that the largest contributor of the Chinese CH4 mixing ratio averaged over 2007–2018 is the wetland emission in South America, accounting for 10.5 % due to the large emission magnitude. Together with other sources, emissions in South America contribute 20.2 % of the surface CH4 levels over China, followed by the sources from Africa (17.0 %) and Europe (15.0 %). The Chinese domestic emissions account for 14.0 % of the CH4 mixing ratio. The emission contributions to the mixing ratio are generally proportional to their emission magnitudes because of the CH4 lifetime of about 9 years, and seasonal variations in the percentage contributions are small, as can be seen in Fig. 11 (the top left panel).
Table 3Sources contributing to the mean surface CH4 mixing ratio in China over 2007–2018*.
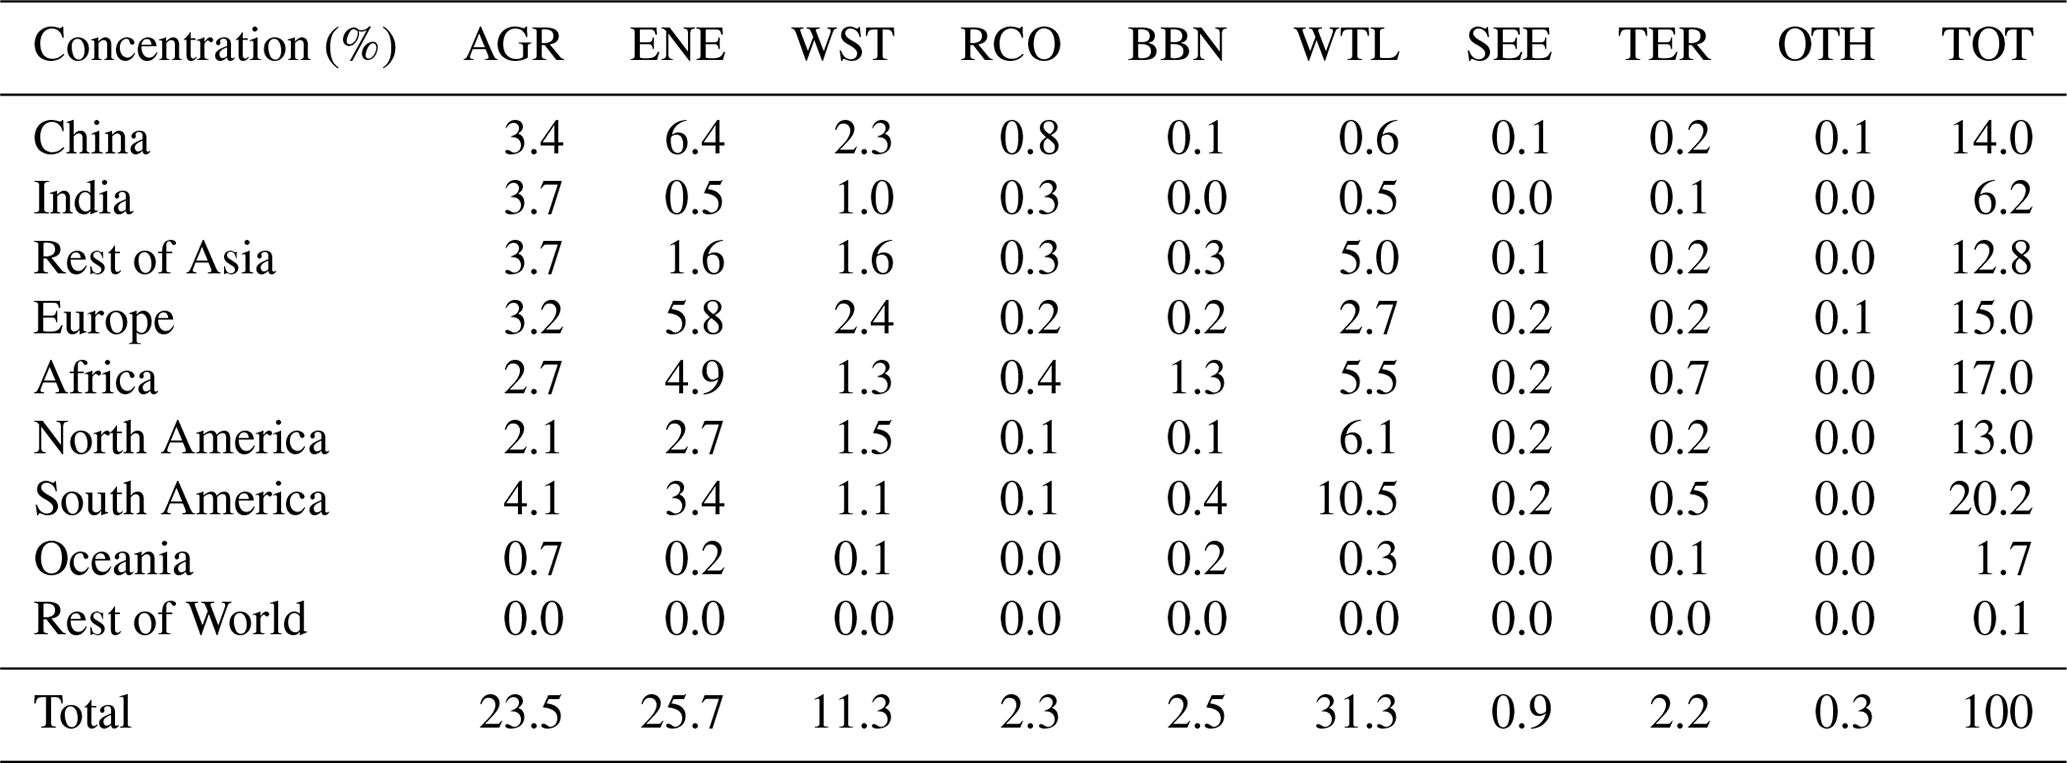
* Percentage contributions of CH4 emissions from the CEDS sectors (Table S2) including agriculture (AGR), energy (ENE), wastewater (WST), residents (RCO), biomass burning (BBN), wetlands (WTL), seeps (SEE), termites (TER), and others (OTH) including industry (IND), transportation (TRA), and shipping (SHP), as well as from different regions (Fig. 2). Values are estimated using the tagged CH4 tracer simulation.
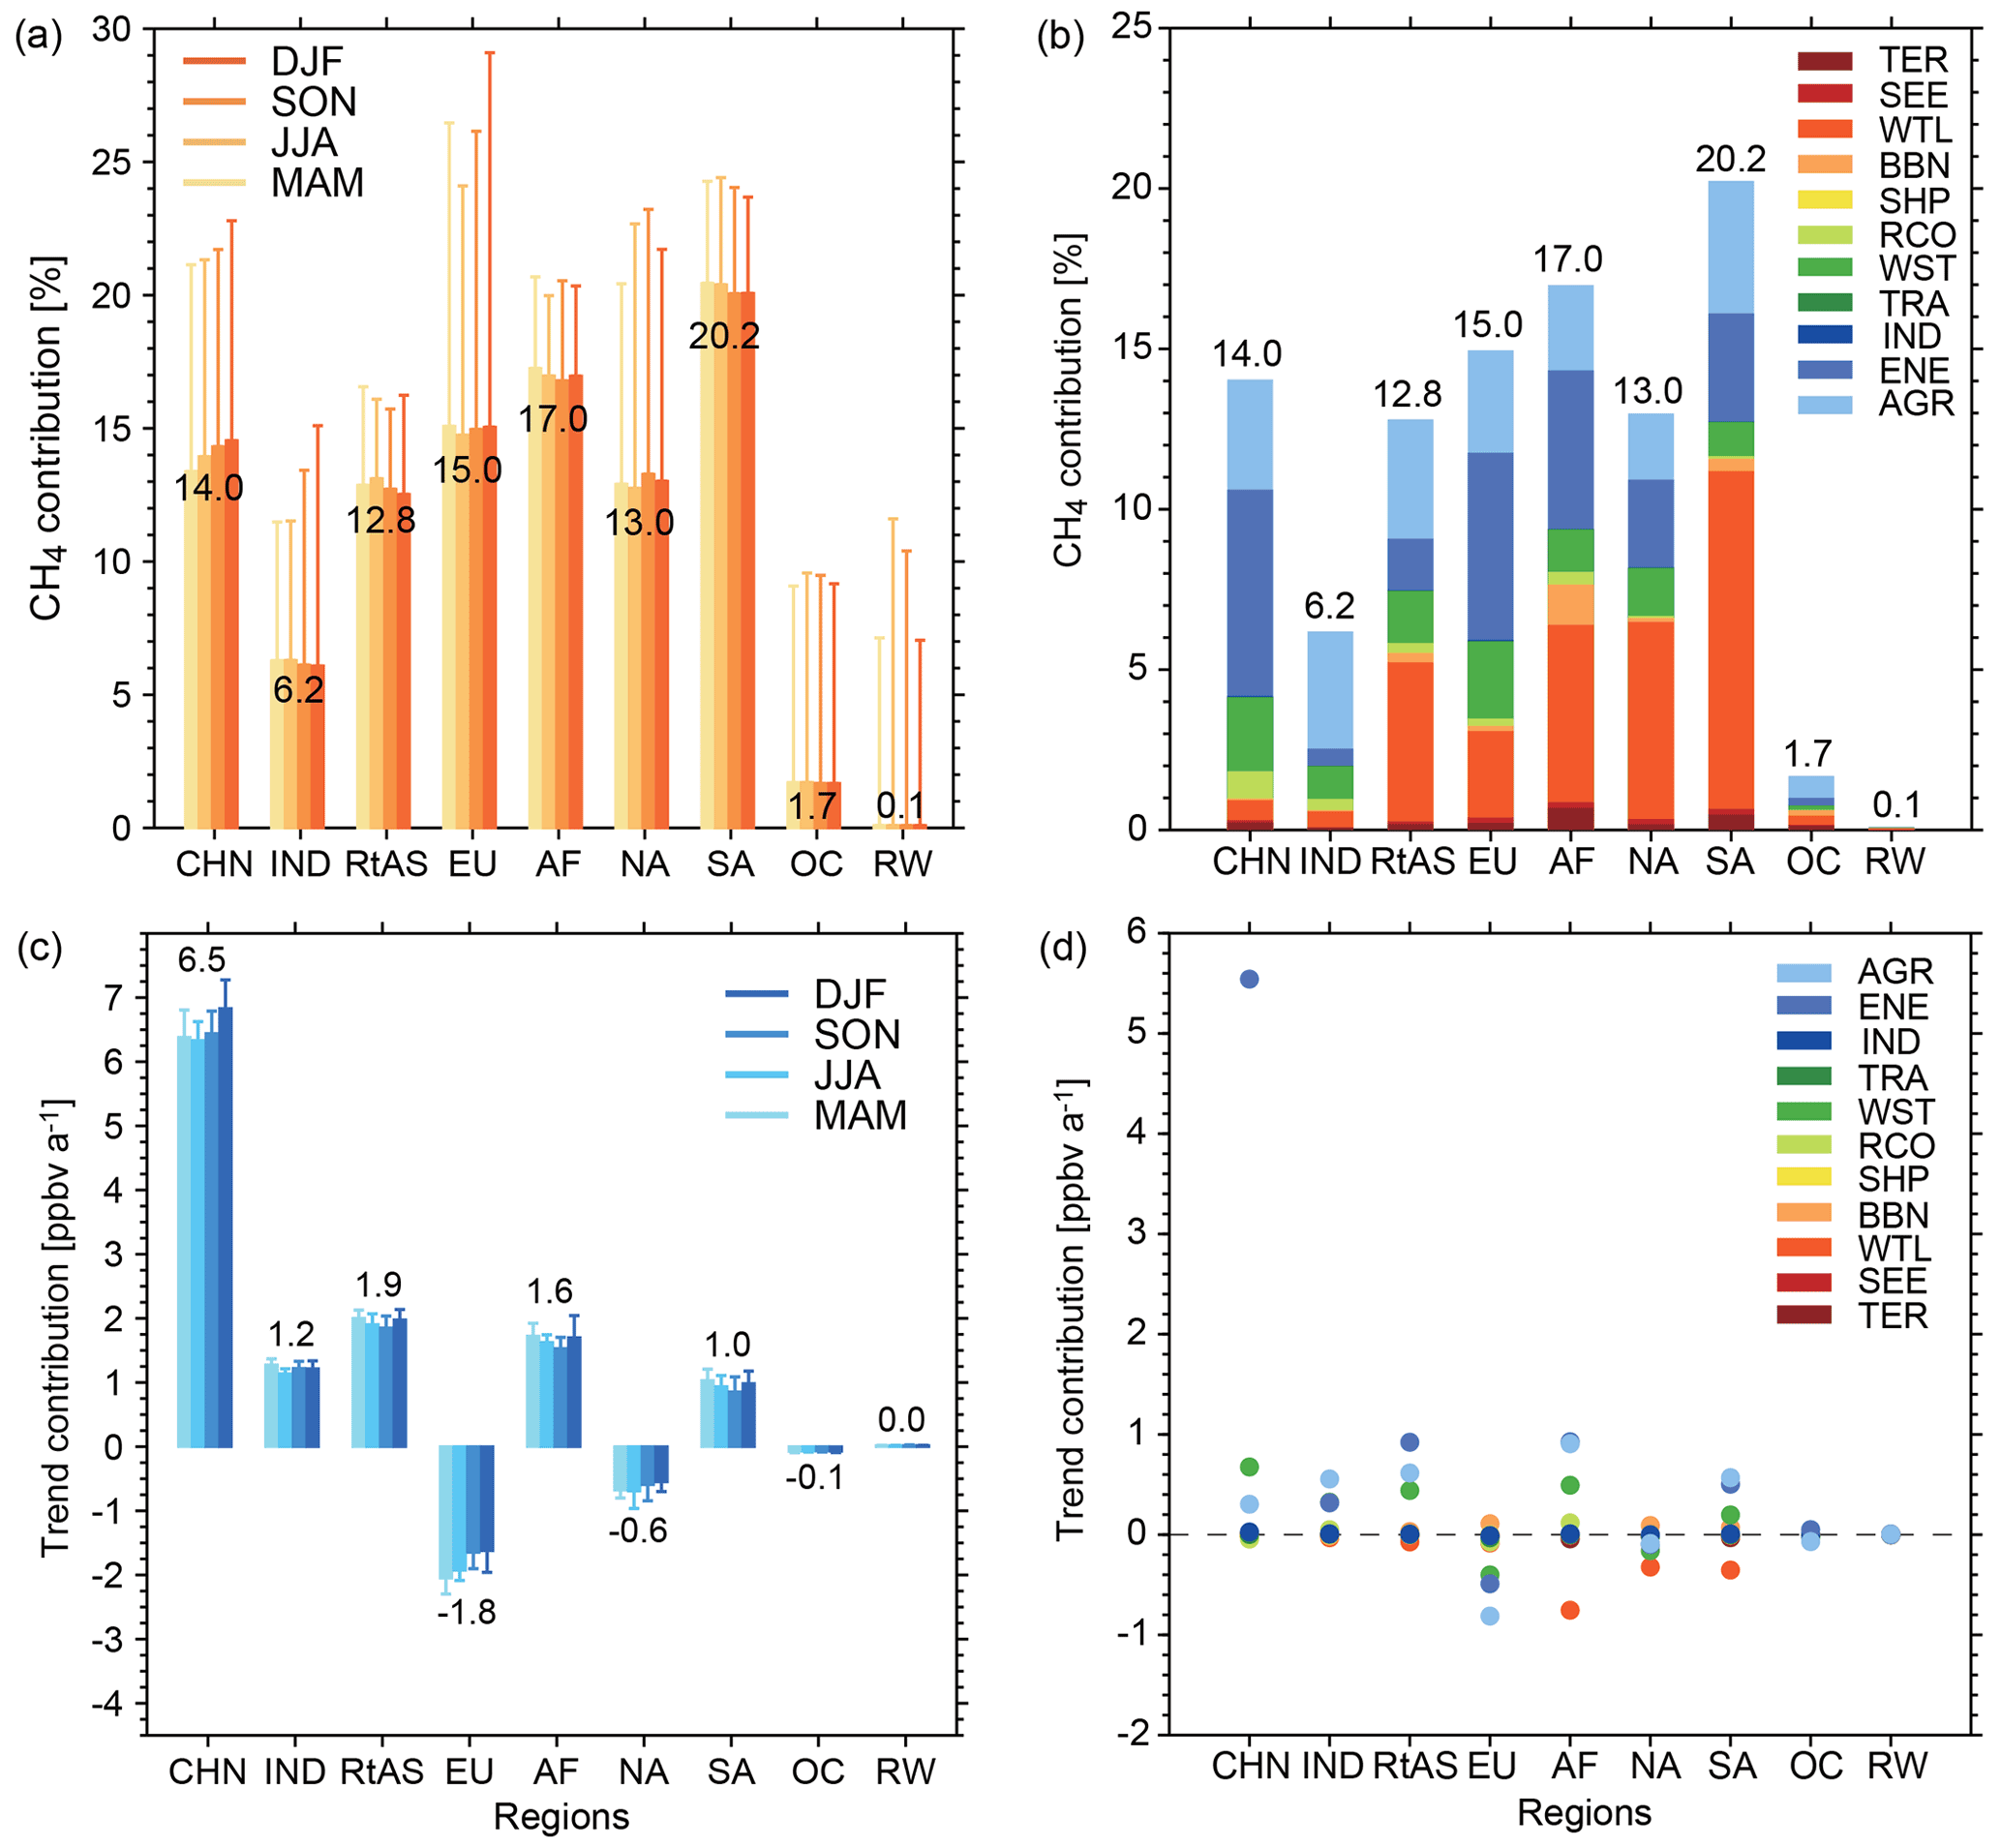
Figure 11Contributions of CH4 emissions from different regions and different source sectors on the mean surface CH4 mixing ratios (a, b) and trends (c, d) in China over 2007–2018. Panels (a) and (c) show region-specific source contributions for different seasons, and error bars are standard deviations denoting spatial variation in contributions over China. Panels (b) and (d) show region- and sector-specific contributions for the annual values. Source contributions are estimated using the tagged CH4 tracers accounting for emission sources from agriculture (AGR), energy (ENE), industry (IND), transportation (TRA), residents (RCO), wastewater (WST), shipping (SHP), biomass burning (BBN), wetlands (WTL), seeps (SEE), and termites (TER) and from nine regions (Africa, China, Europe, India, Asia excluding China and India, Oceania, South America, North America, and the rest of the world).
Figure 11 and Table 4 also show the source contributions to the 2007–2018 trends in the surface CH4 mixing ratio over China. Based on the emission inventory in GCC, the simulated mean trend in the surface CH4 mixing ratio is 9.75 ppbv a−1 over the land of China. The domestic energy sector is identified as the largest driver of the trend in China contributing an increase rate of 5.54 ppbv a−1. Accounting for the trends driven by emissions from the agricultural and wastewater sectors, domestic contributions can reach 6.50 ppbv a−1 (67 % of 9.75 ppbv a−1). The remaining trends of 3.25 ppbv a−1 are then contributed by emission changes outside China. We find that the anthropogenic sources (mainly from energy, agricultural, and wastewater sectors) in Africa and other Asian regions (India and Rest of Asia) contribute, respectively, trends of 3.25 and 2.45 ppbv a−1 over China, highlighting the strong CH4 emission increases in these regions such as large emission increases from livestock sources over South Asia and tropical Africa in 2010–2018 (Zhang et al., 2021). On the contrary, Europe is the only region where CH4 emissions from nearly all sectors have been decreasing (Jackson et al., 2020), which leads to a negative trend of −1.81 ppbv a−1 over China. We find strong spatial variation in the contribution values over different regions of China with standard deviations up to 11 % for the contributions to CH4 mixing ratios and up to 0.4 ppbv a−1 to the trends (Fig. 11). Not only near the surface, we find similar results for the CH4 mixing ratios throughout the troposphere over China with slightly smaller growth rates in the upper troposphere (Fig. S5 in the Supplement).
Table 4Contributions of region- and sector-specific emissions to the surface CH4 trends in China over 2007–2018*.

* Contributions of CH4 sources from different CEDS sectors and from different regions to the mean surface trends in China over 2007–2018. The CEDS sectors include agriculture (AGR), energy (ENE), wastewater (WST), residents (RCO), wetland (WTL), and others (OTH) combining industry, transportation, shipping, biomass burning, seeps, and termites (Table S2). Values are estimated using the tagged CH4 tracer simulation as described in the text.
Our results indicate that trends in China are dominated by energy emissions from coal, oil, and gas, with significant contributions from the wastewater and agricultural sectors. This is consistent with the top-down emission inversion results by Miller et al., (2019) that found the Chinese coal emission is increasing in 2010–2015, while the bottom-up emission estimates of Sheng et al. (2019) suggested decreases in the coal emission in 2012–2016. The lack of sub-country emission factors may result in large uncertainties in the bottom-up emission estimates. A recent global emission inversion study using the EDGAR v4.3.2 inventory as the prior estimate also found large overestimates in the Chinese emissions from coal (Maasakkers et al., 2019). Using the overestimated emissions from the domestic coal sector in the model would offset the influence of missing increases in microbial emissions in the tropics as discussed in Sect. 3.2.
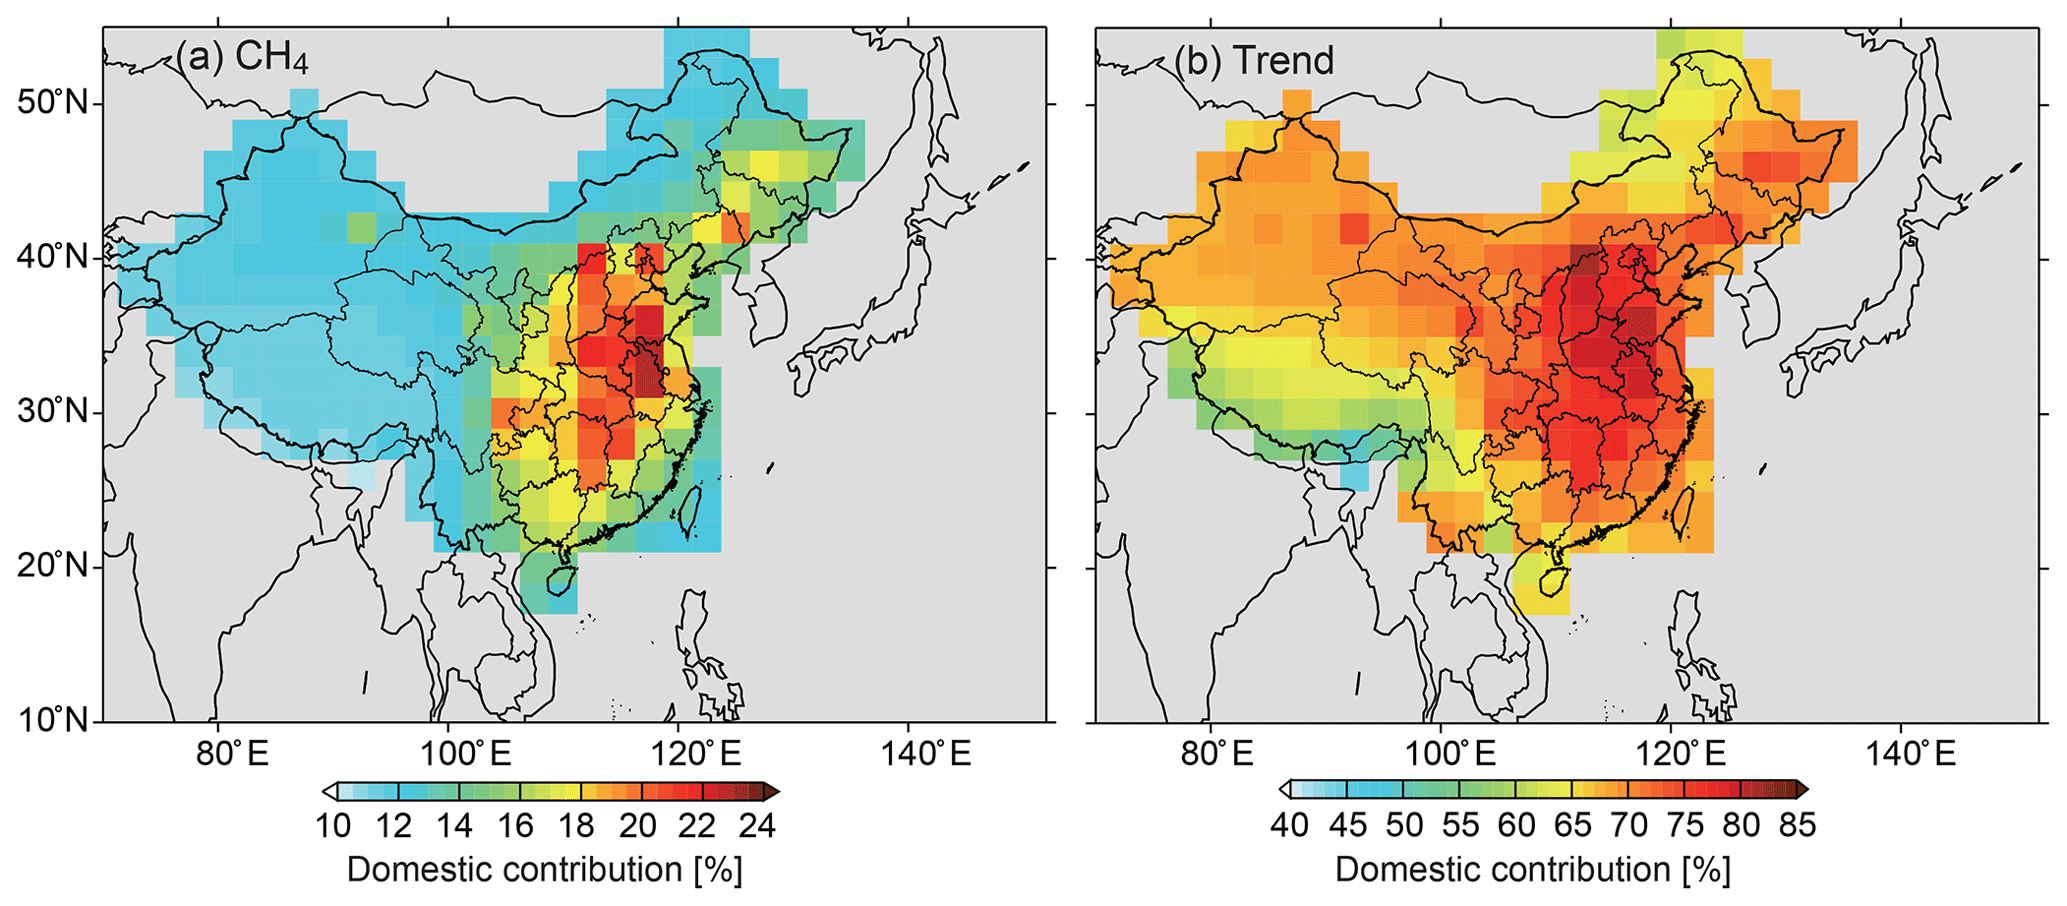
Figure 12Spatial distributions of Chinese domestic emission contributions in percentage for CH4 surface mixing ratios (a) and trends (b) in 2007–2018 over China. The percentage contributions are estimated by summing up all the Chinese-tagged CH4 tracers divided by the total CH4 tracers in the tagged simulation.
The analyses above demonstrate strong foreign source contributions to the CH4 mixing ratios, as well as CH4 trends over China. We further find large spatial heterogeneity in the domestic vs. foreign contributions. Figure 12 shows the spatial distributions of domestic emission contributions to Chinese CH4 surface mixing ratios and trends over 2007–2018 calculated as the percentages of sums of all Chinese-tagged tracers to the total levels. We can see that the domestic contribution to the CH4 surface mixing ratio ranges from 12.4 % in the western China to 15.1 % in central China, and to the trends ranges from 62.6 % over the Tibet Plateau to 70.1 % in the central China. The largest domestic contributions for both surface mixing ratios and trends are found in the central eastern China, so that measurements over this region would most reflect the CH4 emission changes in China.
In summary, we have investigated the sources contributing to the CH4 mixing ratios and trends over China in the recent decade (2007–2018) using the GEOS-Chem global model. The CH4 model simulations are conducted considering two different commonly used anthropogenic emission inventories (EDGAR v4.3.2 and CEDS) and are evaluated with available surface, aircraft, and satellite measurements of CH4 mixing ratios over China and the Pacific region. The surface, aircraft, and satellite measurements have shown CH4 concentration increase rates of 7.0–8.4 ppbv a−1 over China in recent years. We find that model results are sensitive to the selection of anthropogenic emission inventories and OH levels. By using the CEDS anthropogenic emission inventory and interannually varying OH levels (Fig. S2), the model can generally reproduce the measured CH4 mixing ratios and trends over China. This corresponds to mean Chinese anthropogenic CH4 emissions of 69.4 Tg a−1 (with an increase rate of 1.2 Tg a−2) and global tropospheric volume-weighted mean OH concentrations of 10.8×10⁵ (with an increase rate of 0.25 % a−1) over 2007–2018.
We apply a tagged CH4 tracer simulation that implements region- and sector-specific tracers to diagnose and to understand their emission contributions. Using the model simulation with CEDS and interannually varying OH, we find strong influences from foreign sources on both CH4 mixing ratios and recent increases over China due to the long lifetime of CH4. For the mean surface CH4 mixing ratio over China (1873.0 ppbv over 2007–2018), domestic CH4 emissions account for 14.0 %, and contributions from the sources outside China reach 86.0 %, including 20.2 % from South America, 17.0 % from Africa, 15.0 % from Europe, 13.0 % from North America, and 12.8 % from the Rest of Asia group. For the mean CH4 concentration trend over China (9.75 ppbv a−1 over 2007–2018), the largest driver is estimated to be the domestic energy source contributing 5.54 ppbv a−1, and other important domestic source contributions include emissions from wastewater (0.68 ppbv a−1) and agriculture (0.30 ppbv a−1); natural sources such as wetland emissions have insignificant trend contributions. Emission changes in foreign sources are also significant. The increase rate of 3.14 ppbv a−1 in the Chinese surface CH4 mixing ratio can be attributed to sources in other Asian countries (India and Rest of Asia), 1.64 ppbv a−1 to Africa, and 0.95 ppbv a−1 to South America (Table 4).
It should be noted that our source attribution results can be biased by the use of CEDS and the uncertainty in the interannual variations in OH levels. The Chinese anthropogenic CH4 emissions in the CEDS inventory are higher and have increased more rapidly than EDGAR v4.3.2 in the past decade. The two emission inventories significantly differ in the sectors of fossil fuels and agriculture. CEDS estimates higher CH4 emissions from fossil fuels while lower emissions from agriculture compared with EDGAR v4.3.2. A number of top-down emission inversion studies using surface and satellite observations have found that the EDGAR v4.3.2 (Maasakkers et al., 2019; Miller et al., 2019) and previous EDGAR versions (Alexe et al., 2015; Thompson et al., 2015; Turner et al., 2015; Pandey et al., 2016) overestimated the CH4 emissions from coal production in China likely due to the CH4 emission factors for coal mining being too high in the region (Peng et al., 2016). A recent bottom-up estimate suggested that Chinese coal mining CH4 emissions have been decreasing since 2012 driven by China's coal mine regulation (Sheng et al., 2019), but the interannual trend in Chinese coal emissions still has large uncertainties among studies (Miller et al., 2019; Sheng et al., 2019; Lu et al., 2021).
We also find that the interannual variability in OH concentrations can strongly affect the simulated CH4 concentration trends. Using interannually fixed OH concentrations, the model would overestimate the observed CH4 growth from 2007 onwards in China with both the EDGAR and CEDS anthropogenic emissions. The influence of a 10 % increase in the global volume-weighted mean OH concentration (from 10.9×10⁵ to 12.0×10⁵ ) on the simulated Chinese CH4 mixing ratios is equivalent to that of a 47 Tg a−1 decrease in global CH4 emissions. The use of interannual variability in OH provided by Zhao et al. (2019) improves the model-simulated Chinese CH4 mixing ratios and trends. However, large discrepancies exist in the different model OH simulations that would lead to a wide range ( ppbv) of simulated CH4 mixing ratios (Zhao et al., 2019). Despite these uncertainties, our study emphasizes the importance of emission changes in both domestic and foreign and anthropogenic and natural sources on the Chinese CH4 concentration trends. Future work with more intensive CH4 measurements covering eastern China will help us better assess the driving factors of Chinese CH4 mixing ratios and recent growth.
NOAA surface observations are available at https://doi.org/10.15138/VNCZ-M766 (Dlugokencky et al., 2019). The GOSAT Proxy XCH4 data can be accessed through the Copernicus C3S Climate Data Store (https://cds.climate.copernicus.eu, Parker et al., 2015). TCCON data were obtained from the TCCON Data Archive hosted by CaltechDATA through https://data.caltech.edu/records/266 (Goo et al., 2017), https://data.caltech.edu/records/1092 (Liu et al., 2018), https://data.caltech.edu/records/957, https://data.caltech.edu/records/1090, https://data.caltech.edu/records/958 (Morino et al., 2017a, b, c), and https://data.caltech.edu/records/288 (Shiomi et al., 2017). The HIPPO data used in this study can be obtained at https://doi.org/10.3334/CDIAC/hippo_010 (Wofsy et al., 2017). The ATom data are available at https://doi.org/10.3334/ORNLDAAC/1581 (Wofsy et al., 2018). Modeling dataset can be accessed by contacting the corresponding author.
The supplement related to this article is available online at: https://doi.org/10.5194/acp-22-1229-2022-supplement.
HT and LZ designed the study. HT conducted the modeling and data analyses with contributions from LZ, XL, YZ, and BY. RJP and HB provided the GOSAT CH4 data and contributed to the interpretation and discussion of their use in the study. HT and LZ wrote the paper with input from all authors.
The contact author has declared that neither they nor their co-authors have any competing interests.
Publisher's note: Copernicus Publications remains neutral with regard to jurisdictional claims in published maps and institutional affiliations.
This work was supported by the National Natural Science Foundation of China (NSFC, 41922037, 41475112) and the National Key Research and Development Program of China (2017YFC0210102). Robert J. Parker and Hartmut Boesch are funded via the UK National Centre for Earth Observation (NE/N018079/1 and NE/R016518/1). We thank the Japanese Aerospace Exploration Agency, National Institute for Environmental Studies, and the Ministry of Environment for the GOSAT data and their continuous support as part of the joint research agreement. This research used the ALICE High Performance Computing Facility at the University of Leicester for the GOSAT retrievals. We thank Kathryn McKain and Steven C. Wofsy for offering the CH4 dataset from ATom campaigns.
This research has been supported by the National Natural Science Foundation of China (grant nos. 41922037 and 41475112) and the National Key Research and Development Program of China (grant no. 2017YFC0210102). Robert J. Parker and Hartmut Boesch are supported by the UK National Centre for Earth Observation (grant nos. NE/N018079/1 and NE/R016518/1).
This paper was edited by Tim Butler and reviewed by three anonymous referees.
Alexe, M., Bergamaschi, P., Segers, A., Detmers, R., Butz, A., Hasekamp, O., Guerlet, S., Parker, R., Boesch, H., Frankenberg, C., Scheepmaker, R. A., Dlugokencky, E., Sweeney, C., Wofsy, S. C., and Kort, E. A.: Inverse modelling of CH4 emissions for 2010–2011 using different satellite retrieval products from GOSAT and SCIAMACHY, Atmos. Chem. Phys., 15, 113–133, https://doi.org/10.5194/acp-15-113-2015, 2015.
Bergamaschi, P., Houweling, S., Segers, A., Krol, M., Frankenberg, C., Scheepmaker, R. A., Dlugokencky, E., Wofsy, S. C., Kort, E. A., Sweeney, C., Schuck, T., Brenninkmeijer, C., Chen, H., Beck, V., and Gerbig, C.: Atmospheric CH4 in the first decade of the 21st century: Inverse modeling analysis using SCIAMACHY satellite retrievals and NOAA surface measurements, J. Geophys. Res.-Atmos., 118, 7350–7369, https://doi.org/10.1002/jgrd.50480, 2013.
Bey, I., Jacob, D. J., Logan, J. A., and Yantosca, R. M.: Asian chemical outflow to the Pacific in spring: Origins, pathways, and budgets, J. Geophys. Res.-Atmos., 106, 23097–23113, https://doi.org/10.1029/2001jd000806, 2001.
Bloom, A. A., Bowman, K. W., Lee, M., Turner, A. J., Schroeder, R., Worden, J. R., Weidner, R., McDonald, K. C., and Jacob, D. J.: A global wetland methane emissions and uncertainty dataset for atmospheric chemical transport models (WetCHARTs version 1.0), Geosci. Model Dev., 10, 2141–2156, https://doi.org/10.5194/gmd-10-2141-2017, 2017.
Butz, A., Guerlet, S., Hasekamp, O., Schepers, D., Galli, A., Aben, I., Frankenberg, C., Hartmann, J. M., Tran, H., Kuze, A., Keppel-Aleks, G., Toon, G., Wunch, D., Wennberg, P., Deutscher, N., Griffith, D., Macatangay, R., Messerschmidt, J., Notholt, J., and Warneke, T.: Toward accurate CO2 and CH4 observations from GOSAT, Geophys. Res. Lett., 38, L14812, https://doi.org/10.1029/2011gl047888, 2011.
Cressot, C., Chevallier, F., Bousquet, P., Crevoisier, C., Dlugokencky, E. J., Fortems-Cheiney, A., Frankenberg, C., Parker, R., Pison, I., Scheepmaker, R. A., Montzka, S. A., Krummel, P. B., Steele, L. P., and Langenfelds, R. L.: On the consistency between global and regional methane emissions inferred from SCIAMACHY, TANSO-FTS, IASI and surface measurements, Atmos. Chem. Phys., 14, 577–592, https://doi.org/10.5194/acp-14-577-2014, 2014.
Darmenov, A. and da Silva, A.: The quick fire emissions dataset (QFED)–documentation of versions 2.1, 2.2 and 2.4, NASA Technical Report Series on Global Modeling and Data Assimilation, NASA TM-2013-10460632, 183 pp., 2013.
Dlugokencky, E. J.: Conversion of NOAA atmospheric dry air CH4 mole fractions to a gravimetrically prepared standard scale, J. Geophys. Res., 110, D18306, https://doi.org/10.1029/2005jd006035, 2005.
Dlugokencky, E. J., Bruhwiler, L., White, J. W. C., Emmons, L. K., Novelli, P. C., Montzka, S. A., Masarie, K. A., Lang, P. M., Crotwell, A. M., and Miller, J. B.: Observational constraints on recent increases in the atmospheric CH4 burden, Geophys. Res. Lett., 36, 252–260, 2009.
Dlugokencky, E. J., Crotwell, A. M., Mund, J. W., Crotwell, M. J., and Thoning, K. W.: Atmospheric Methane Dry Air Mole Fractions from the NOAA GML Carbon Cycle Cooperative Global Air Sampling Network, 1983–2018, Version: 2019-07, NOAA Global Monitoring Laboratory Data Repository [data set], https://doi.org/10.15138/VNCZ-M766, 2019.
Fraser, A., Palmer, P. I., Feng, L., Boesch, H., Cogan, A., Parker, R., Dlugokencky, E. J., Fraser, P. J., Krummel, P. B., Langenfelds, R. L., O'Doherty, S., Prinn, R. G., Steele, L. P., van der Schoot, M., and Weiss, R. F.: Estimating regional methane surface fluxes: the relative importance of surface and GOSAT mole fraction measurements, Atmos. Chem. Phys., 13, 5697–5713, https://doi.org/10.5194/acp-13-5697-2013, 2013.
Fung, I., John, J., Lerner, J., Matthews, E., Prather, M., Steele, L. P., and Fraser, P. J.: Three-dimensional model synthesis of the global methane cycle, J. Geophys. Res.-Atmos., 96, 13033–13065, 1991.
Goo, T. Y., Oh, Y. S., and Velazco, V. A.: TCCON data from Anmyeondo, South Korea, Release GGG2014R0, TCCON data archive, CaltechDATA [data], available at: https://data.caltech.edu/records/266 (last access: 20 January 2022), 2017.
He, J., Naik, V., Horowitz, L. W., Dlugokencky, E., and Thoning, K.: Investigation of the global methane budget over 1980–2017 using GFDL-AM4.1, Atmos. Chem. Phys., 20, 805–827, https://doi.org/10.5194/acp-20-805-2020, 2020.
Hoesly, R. M., Smith, S. J., Feng, L., Klimont, Z., Janssens-Maenhout, G., Pitkanen, T., Seibert, J. J., Vu, L., Andres, R. J., Bolt, R. M., Bond, T. C., Dawidowski, L., Kholod, N., Kurokawa, J.-I., Li, M., Liu, L., Lu, Z., Moura, M. C. P., O'Rourke, P. R., and Zhang, Q.: Historical (1750–2014) anthropogenic emissions of reactive gases and aerosols from the Community Emissions Data System (CEDS), Geosci. Model Dev., 11, 369–408, https://doi.org/10.5194/gmd-11-369-2018, 2018.
IPCC: Carbon and other biogeochemical cycles, in: Climate Change 2013: The Physical Science Basis. Contribution of Working Group I to the Fifth Assessment Report of the Intergovernmental Panel on Climate Change, edited by: Stocker, T. F., Qin, D., Plattner, G.-K., Tignor, M., Allen, S. K., Boschung, J., Nauels, A., Xia, Y., Bex, V., and Midgley, P. M., Cambridge University Press, Cambridge, United Kingdom and New York, NY, USA, 465–570, https://doi.org/10.1017/cbo9781107415324.022, 2013.
Jackson, R. B., Saunois, M., Bousquet, P., Canadell, J. G., Poulter, B., Stavert, A. R., Bergamaschi, P., Niwa, Y., Segers, A., and Tsuruta, A.: Increasing anthropogenic methane emissions arise equally from agricultural and fossil fuel sources, Environ. Res. Lett., 15, 071002, https://doi.org/10.1088/1748-9326/ab9ed2, 2020.
Janssens-Maenhout, G., Crippa, M., Guizzardi, D., Muntean, M., Schaaf, E., Dentener, F., Bergamaschi, P., Pagliari, V., Olivier, J. G. J., Peters, J. A. H. W., van Aardenne, J. A., Monni, S., Doering, U., Petrescu, A. M. R., Solazzo, E., and Oreggioni, G. D.: EDGAR v4.3.2 Global Atlas of the three major greenhouse gas emissions for the period 1970–2012, Earth Syst. Sci. Data, 11, 959–1002, https://doi.org/10.5194/essd-11-959-2019, 2019.
Kirschke, S., Bousquet, P., Ciais, P., Saunois, M., Canadell, J. G., Dlugokencky, E. J., Bergamaschi, P., Bergmann, D., Blake, D. R., Bruhwiler, L., Cameron-Smith, P., Castaldi, S., Chevallier, F., Feng, L., Fraser, A., Heimann, M., Hodson, E. L., Houweling, S., Josse, B., Fraser, P. J., Krummel, P. B., Lamarque, J.-F., Langenfelds, R. L., Le Quéré, C., Naik, V., O'Doherty, S., Palmer, P. I., Pison, I., Plummer, D., Poulter, B., Prinn, R. G., Rigby, M., Ringeval, B., Santini, M., Schmidt, M., Shindell, D. T., Simpson, I. J., Spahni, R., Steele, L. P., Strode, S. A., Sudo, K., Szopa, S., van der Werf, G. R., Voulgarakis, A., van Weele, M., Weiss, R. F., Williams, J. E., and Zeng, G.: Three decades of global methane sources and sinks, Nat. Geosci., 6, 813–823, https://doi.org/10.1038/ngeo1955, 2013.
Kuze, A., Suto, H., Shiomi, K., Kawakami, S., Tanaka, M., Ueda, Y., Deguchi, A., Yoshida, J., Yamamoto, Y., Kataoka, F., Taylor, T. E., and Buijs, H. L.: Update on GOSAT TANSO-FTS performance, operations, and data products after more than 6 years in space, Atmos. Meas. Tech., 9, 2445–2461, https://doi.org/10.5194/amt-9-2445-2016, 2016.
Liu, C., Wang, W., and Sun, Y.: TCCON data from Hefei, China, Release GGG2014R0, TCCON data archive, CaltechDATA, available at: https://data.caltech.edu/records/1092 (last access: 20 January 2022), 2018.
Liu, G., Peng, S., Lin, X., Ciais, P., Li, X., Xi, Y., Lu, Z., Chang, J., Saunois, M., Wu, Y., Patra, P., Chandra, N., Zeng, H., and Piao, S.: Recent Slowdown of Anthropogenic Methane Emissions in China Driven by Stabilized Coal Production, Environ. Sci. Technol. Lett., 8, 739–746, https://doi.org/10.1021/acs.estlett.1c00463, 2021.
Lu, X., Jacob, D. J., Zhang, Y., Maasakkers, J. D., Sulprizio, M. P., Shen, L., Qu, Z., Scarpelli, T. R., Nesser, H., Yantosca, R. M., Sheng, J., Andrews, A., Parker, R. J., Boesch, H., Bloom, A. A., and Ma, S.: Global methane budget and trend, 2010–2017: complementarity of inverse analyses using in situ (GLOBALVIEWplus CH4 ObsPack) and satellite (GOSAT) observations, Atmos. Chem. Phys., 21, 4637–4657, https://doi.org/10.5194/acp-21-4637-2021, 2021.
Maasakkers, J. D., Jacob, D. J., Sulprizio, M. P., Turner, A. J., Weitz, M., Wirth, T., Hight, C., DeFigueiredo, M., Desai, M., Schmeltz, R., Hockstad, L., Bloom, A. A., Bowman, K. W., Jeong, S., and Fischer, M. L.: Gridded National Inventory of U. S. Methane Emissions, Environ. Sci. Technol., 50, 13123–13133, https://doi.org/10.1021/acs.est.6b02878, 2016.
Maasakkers, J. D., Jacob, D. J., Sulprizio, M. P., Scarpelli, T. R., Nesser, H., Sheng, J.-X., Zhang, Y., Hersher, M., Bloom, A. A., Bowman, K. W., Worden, J. R., Janssens-Maenhout, G., and Parker, R. J.: Global distribution of methane emissions, emission trends, and OH concentrations and trends inferred from an inversion of GOSAT satellite data for 2010–2015, Atmos. Chem. Phys., 19, 7859–7881, https://doi.org/10.5194/acp-19-7859-2019, 2019.
Maasakkers, J. D., Jacob, D. J., Sulprizio, M. P., Scarpelli, T. R., Nesser, H., Sheng, J., Zhang, Y., Lu, X., Bloom, A. A., Bowman, K. W., Worden, J. R., and Parker, R. J.: 2010–2015 North American methane emissions, sectoral contributions, and trends: a high-resolution inversion of GOSAT observations of atmospheric methane, Atmos. Chem. Phys., 21, 4339–4356, https://doi.org/10.5194/acp-21-4339-2021, 2021.
Miller, S. M., Michalak, A. M., Detmers, R. G., Hasekamp, O. P., Bruhwiler, L. M. P., and Schwietzke, S.: China's coal mine methane regulations have not curbed growing emissions, Nat. Commun., 10, 303, https://doi.org/10.1038/s41467-018-07891-7, 2019.
Morino, I., Yokozeki, N., Matzuzaki, T., and Shishime, A.: TCCON data from Rikubetsu, Hokkaido, Japan, Release GGG2014R2, TCCON data archive, CaltechDATA [data set], available at: https://data.caltech.edu/records/957 (last access: 20 January 2022), 2017a.
Morino, I., Velazco, V. A., Akihiro, H., Osamu, U., and Griffith, D. W. T.: TCCON data from Burgos, Philippines, Release GGG2014R0, TCCON data archive, CaltechDATA [data set], available at: https://data.caltech.edu/records/1090 (last access: 20 January 2022), 2017b.
Morino, I., Matsuzaki, T., and Shishime, A.: TCCON data from Tsukuba, Ibaraki, Japan, 125HR, Release GGG2014R2, TCCON data archive, CaltechDATA [data set], available at: https://data.caltech.edu/records/958 (last access: 20 January 2022), 2017c.
Murray, L. T., Jacob, D. J., Logan, J. A., Hudman, R. C., and Koshak, W. J.: Optimized regional and interannual variability of lightning in a global chemical transport model constrained by LIS/OTD satellite data, J. Geophys. Res.-Atmos., 117, D20307, https://doi.org/10.1029/2012jd017934, 2012.
Nisbet, E. G., Dlugokencky, E. J., Manning, M. R., Lowry, D., Fisher, R. E., France, J. L., Michel, S. E., Miller, J. B., White, J. W. C., Vaughn, B., Bousquet, P., Pyle, J. A., Warwick, N. J., Cain, M., Brownlow, R., Zazzeri, G., Lanoisellé, M., Manning, A. C., Gloor, E., Worthy, D. E. J., Brunke, E. G., Labuschagne, C., Wolff, E. W., and Ganesan, A. L.: Rising atmospheric methane: 2007–2014 growth and isotopic shift, Global Biogeochem. Cy., 30, 1356–1370, https://doi.org/10.1002/2016gb005406, 2016.
Nisbet, E. G., Manning, M. R., Dlugokencky, E. J., Fisher, R. E., Lowry, D., Michel, S. E., Myhre, C. L., Platt, S. M., Allen, G., Bousquet, P., Brownlow, R., Cain, M., France, J. L., Hermansen, O., Hossaini, R., Jones, A. E., Levin, I., Manning, A. C., Myhre, G., Pyle, J. A., Vaughn, B. H., Warwick, N. J., and White, J. W. C.: Very Strong Atmospheric Methane Growth in the 4 Years 2014–2017: Implications for the Paris Agreement, Global Biogeochem. Cy., 33, 318–342, https://doi.org/10.1029/2018gb006009, 2019.
Pandey, S., Houweling, S., Krol, M., Aben, I., Chevallier, F., Dlugokencky, E. J., Gatti, L. V., Gloor, E., Miller, J. B., Detmers, R., Machida, T., and Röckmann, T.: Inverse modeling of GOSAT-retrieved ratios of total column CH4 and CO2 for 2009 and 2010, Atmos. Chem. Phys., 16, 5043–5062, https://doi.org/10.5194/acp-16-5043-2016, 2016.
Parker, R. J., Boesch, H., Byckling, K., Webb, A. J., Palmer, P. I., Feng, L., Bergamaschi, P., Chevallier, F., Notholt, J., Deutscher, N., Warneke, T., Hase, F., Sussmann, R., Kawakami, S., Kivi, R., Griffith, D. W. T., and Velazco, V.: Assessing 5 years of GOSAT Proxy XCH4 data and associated uncertainties, Atmos. Meas. Tech., 8, 4785–4801, https://doi.org/10.5194/amt-8-4785-2015, 2015 (data available at: https://cds.climate.copernicus.eu, last access: 20 January 2022).
Parker, R. J., Webb, A., Boesch, H., Somkuti, P., Barrio Guillo, R., Di Noia, A., Kalaitzi, N., Anand, J. S., Bergamaschi, P., Chevallier, F., Palmer, P. I., Feng, L., Deutscher, N. M., Feist, D. G., Griffith, D. W. T., Hase, F., Kivi, R., Morino, I., Notholt, J., Oh, Y.-S., Ohyama, H., Petri, C., Pollard, D. F., Roehl, C., Sha, M. K., Shiomi, K., Strong, K., Sussmann, R., Té, Y., Velazco, V. A., Warneke, T., Wennberg, P. O., and Wunch, D.: A decade of GOSAT Proxy satellite CH4 observations, Earth Syst. Sci. Data, 12, 3383–3412, https://doi.org/10.5194/essd-12-3383-2020, 2020.
Peng, S., Piao, S., Bousquet, P., Ciais, P., Li, B., Lin, X., Tao, S., Wang, Z., Zhang, Y., and Zhou, F.: Inventory of anthropogenic methane emissions in mainland China from 1980 to 2010, Atmos. Chem. Phys., 16, 14545–14562, https://doi.org/10.5194/acp-16-14545-2016, 2016.
Ridgwell, A. J., Marshall, S. J., and Gregson, K.: Consumption of atmospheric methane by soils: A process-based model, Global Biogeochem. Cy., 13, 59–70, https://doi.org/10.1029/1998gb900004, 1999.
Saunois, M., Bousquet, P., Poulter, B., Peregon, A., Ciais, P., Canadell, J. G., Dlugokencky, E. J., Etiope, G., Bastviken, D., Houweling, S., Janssens-Maenhout, G., Tubiello, F. N., Castaldi, S., Jackson, R. B., Alexe, M., Arora, V. K., Beerling, D. J., Bergamaschi, P., Blake, D. R., Brailsford, G., Brovkin, V., Bruhwiler, L., Crevoisier, C., Crill, P., Covey, K., Curry, C., Frankenberg, C., Gedney, N., Höglund-Isaksson, L., Ishizawa, M., Ito, A., Joos, F., Kim, H.-S., Kleinen, T., Krummel, P., Lamarque, J.-F., Langenfelds, R., Locatelli, R., Machida, T., Maksyutov, S., McDonald, K. C., Marshall, J., Melton, J. R., Morino, I., Naik, V., O'Doherty, S., Parmentier, F.-J. W., Patra, P. K., Peng, C., Peng, S., Peters, G. P., Pison, I., Prigent, C., Prinn, R., Ramonet, M., Riley, W. J., Saito, M., Santini, M., Schroeder, R., Simpson, I. J., Spahni, R., Steele, P., Takizawa, A., Thornton, B. F., Tian, H., Tohjima, Y., Viovy, N., Voulgarakis, A., van Weele, M., van der Werf, G. R., Weiss, R., Wiedinmyer, C., Wilton, D. J., Wiltshire, A., Worthy, D., Wunch, D., Xu, X., Yoshida, Y., Zhang, B., Zhang, Z., and Zhu, Q.: The global methane budget 2000–2012, Earth Syst. Sci. Data, 8, 697–751, https://doi.org/10.5194/essd-8-697-2016, 2016.
Saunois, M., Bousquet, P., Poulter, B., Peregon, A., Ciais, P., Canadell, J. G., Dlugokencky, E. J., Etiope, G., Bastviken, D., Houweling, S., Janssens-Maenhout, G., Tubiello, F. N., Castaldi, S., Jackson, R. B., Alexe, M., Arora, V. K., Beerling, D. J., Bergamaschi, P., Blake, D. R., Brailsford, G., Bruhwiler, L., Crevoisier, C., Crill, P., Covey, K., Frankenberg, C., Gedney, N., Höglund-Isaksson, L., Ishizawa, M., Ito, A., Joos, F., Kim, H.-S., Kleinen, T., Krummel, P., Lamarque, J.-F., Langenfelds, R., Locatelli, R., Machida, T., Maksyutov, S., Melton, J. R., Morino, I., Naik, V., O'Doherty, S., Parmentier, F.-J. W., Patra, P. K., Peng, C., Peng, S., Peters, G. P., Pison, I., Prinn, R., Ramonet, M., Riley, W. J., Saito, M., Santini, M., Schroeder, R., Simpson, I. J., Spahni, R., Takizawa, A., Thornton, B. F., Tian, H., Tohjima, Y., Viovy, N., Voulgarakis, A., Weiss, R., Wilton, D. J., Wiltshire, A., Worthy, D., Wunch, D., Xu, X., Yoshida, Y., Zhang, B., Zhang, Z., and Zhu, Q.: Variability and quasi-decadal changes in the methane budget over the period 2000–2012, Atmos. Chem. Phys., 17, 11135–11161, https://doi.org/10.5194/acp-17-11135-2017, 2017.
Saunois, M., Stavert, A. R., Poulter, B., Bousquet, P., Canadell, J. G., Jackson, R. B., Raymond, P. A., Dlugokencky, E. J., Houweling, S., Patra, P. K., Ciais, P., Arora, V. K., Bastviken, D., Bergamaschi, P., Blake, D. R., Brailsford, G., Bruhwiler, L., Carlson, K. M., Carrol, M., Castaldi, S., Chandra, N., Crevoisier, C., Crill, P. M., Covey, K., Curry, C. L., Etiope, G., Frankenberg, C., Gedney, N., Hegglin, M. I., Höglund-Isaksson, L., Hugelius, G., Ishizawa, M., Ito, A., Janssens-Maenhout, G., Jensen, K. M., Joos, F., Kleinen, T., Krummel, P. B., Langenfelds, R. L., Laruelle, G. G., Liu, L., Machida, T., Maksyutov, S., McDonald, K. C., McNorton, J., Miller, P. A., Melton, J. R., Morino, I., Müller, J., Murguia-Flores, F., Naik, V., Niwa, Y., Noce, S., O'Doherty, S., Parker, R. J., Peng, C., Peng, S., Peters, G. P., Prigent, C., Prinn, R., Ramonet, M., Regnier, P., Riley, W. J., Rosentreter, J. A., Segers, A., Simpson, I. J., Shi, H., Smith, S. J., Steele, L. P., Thornton, B. F., Tian, H., Tohjima, Y., Tubiello, F. N., Tsuruta, A., Viovy, N., Voulgarakis, A., Weber, T. S., van Weele, M., van der Werf, G. R., Weiss, R. F., Worthy, D., Wunch, D., Yin, Y., Yoshida, Y., Zhang, W., Zhang, Z., Zhao, Y., Zheng, B., Zhu, Q., Zhu, Q., and Zhuang, Q.: The Global Methane Budget 2000–2017, Earth Syst. Sci. Data, 12, 1561–1623, https://doi.org/10.5194/essd-12-1561-2020, 2020.
Sheng, J., Song, S., Zhang, Y., Prinn, R. G., and Janssens-Maenhout, G.: Bottom-Up Estimates of Coal Mine Methane Emissions in China: A Gridded Inventory, Emission Factors, and Trends, Environ. Sci. Tech. Let., 6, 473–478, https://doi.org/10.1021/acs.estlett.9b00294, 2019.
Sheng, J., Tunnicliffe, R., Ganesan, A. L., Maasakkers, J. D., Shen, L., Prinn, R. G., Song, S., Zhang, Y., Scarpelli, T., Anthony Bloom, A., Rigby, M., Manning, A. J., Parker, R. J., Boesch, H., Lan, X., Zhang, B., Zhuang, M., and Lu, X.: Sustained methane emissions from China after 2012 despite declining coal production and rice-cultivated area, Environ. Res. Lett., 16, 104018, https://doi.org/10.1088/1748-9326/ac24d1, 2021.
Sherwen, T., Schmidt, J. A., Evans, M. J., Carpenter, L. J., Großmann, K., Eastham, S. D., Jacob, D. J., Dix, B., Koenig, T. K., Sinreich, R., Ortega, I., Volkamer, R., Saiz-Lopez, A., Prados-Roman, C., Mahajan, A. S., and Ordóñez, C.: Global impacts of tropospheric halogens (Cl, Br, I) on oxidants and composition in GEOS-Chem, Atmos. Chem. Phys., 16, 12239–12271, https://doi.org/10.5194/acp-16-12239-2016, 2016.
Shiomi, K., Kawakami, S., Ohyama, H., Arai, K., Okumura, H., Taura, C., Fukamachi, T., and Sakashita, M.: TCCON data from Saga, Japan, Release GGG2014R0, TCCON data archive, CaltechDATA [data set], available at: https://data.caltech.edu/records/288 (last access: 20 January 2022), 2017.
Stanevich, I., Jones, D. B. A., Strong, K., Parker, R. J., Boesch, H., Wunch, D., Notholt, J., Petri, C., Warneke, T., Sussmann, R., Schneider, M., Hase, F., Kivi, R., Deutscher, N. M., Velazco, V. A., Walker, K. A., and Deng, F.: Characterizing model errors in chemical transport modeling of methane: impact of model resolution in versions v9-02 of GEOS-Chem and v35j of its adjoint model, Geosci. Model Dev., 13, 3839–3862, https://doi.org/10.5194/gmd-13-3839-2020, 2020.
Thompson, R. L., Stohl, A., Zhou, L. X., Dlugokencky, E., Fukuyama, Y., Tohjima, Y., Kim, S. Y., Lee, H., Nisbet, E. G., Fisher, R. E., Lowry, D., Weiss, R. F., Prinn, R. G., O'Doherty, S., Young, D., and White, J. W. C.: Methane emissions in East Asia for 2000–2011 estimated using an atmospheric Bayesian inversion, J. Geophys. Res.-Atmos., 120, 4352–4369, https://doi.org/10.1002/2014jd022394, 2015.
Turner, A. J., Jacob, D. J., Wecht, K. J., Maasakkers, J. D., Lundgren, E., Andrews, A. E., Biraud, S. C., Boesch, H., Bowman, K. W., Deutscher, N. M., Dubey, M. K., Griffith, D. W. T., Hase, F., Kuze, A., Notholt, J., Ohyama, H., Parker, R., Payne, V. H., Sussmann, R., Sweeney, C., Velazco, V. A., Warneke, T., Wennberg, P. O., and Wunch, D.: Estimating global and North American methane emissions with high spatial resolution using GOSAT satellite data, Atmos. Chem. Phys., 15, 7049–7069, https://doi.org/10.5194/acp-15-7049-2015, 2015.
Turner, A. J., Jacob, D. J., Benmergui, J., Wofsy, S. C., Maasakkers, J. D., Butz, A., Hasekamp, O., and Biraud, S. C.: A large increase in U. S. methane emissions over the past decade inferred from satellite data and surface observations, Geophys. Res. Lett., 43, 2218–2224, https://doi.org/10.1002/2016gl067987, 2016.
Turner, A. J., Frankenberg, C., and Kort, E. A.: Interpreting contemporary trends in atmospheric methane, P. Natl. Acad. Sci. USA, 116, 2805–2813, https://doi.org/10.1073/pnas.1814297116, 2019.
Valentini, R., Arneth, A., Bombelli, A., Castaldi, S., Cazzolla Gatti, R., Chevallier, F., Ciais, P., Grieco, E., Hartmann, J., Henry, M., Houghton, R. A., Jung, M., Kutsch, W. L., Malhi, Y., Mayorga, E., Merbold, L., Murray-Tortarolo, G., Papale, D., Peylin, P., Poulter, B., Raymond, P. A., Santini, M., Sitch, S., Vaglio Laurin, G., van der Werf, G. R., Williams, C. A., and Scholes, R. J.: A full greenhouse gases budget of Africa: synthesis, uncertainties, and vulnerabilities, Biogeosciences, 11, 381–407, https://doi.org/10.5194/bg-11-381-2014, 2014.
Wecht, K. J., Jacob, D. J., Frankenberg, C., Jiang, Z., and Blake, D. R.: Mapping of North American methane emissions with high spatial resolution by inversion of SCIAMACHY satellite data, J. Geophys. Res.-Atmos., 119, 7741–7756, https://doi.org/10.1002/2014jd021551, 2014.
Wofsy, S. C., Team, T. H. S., Modellers, C., and Teams, S.: HIAPER Pole-to-Pole Observations (HIPPO): fine-grained, global-scale measurements of climatically important atmospheric gases and aerosols, Philos. T. R. Soc. A, 369, 2073–2086, 2011.
Wofsy, S. C., Daube, B. C., Jimenez, R., Kort, E., Pittman, J. V., Park, S., Commane, R., Xiang, B., Santoni, G., Jacob, D., Fisher, J., Pickett-Heaps, C., Wang, H., Wecht, K., Wang, Q.-Q., Stephens, B. B., Shertz, S., Watt, A. S., Romashkin, P., Campos, T., HaGggerty, J., Cooper, W. A., Rogers, D., Beaton, S., Hendershot, R., Elkins, J. W., Fahey, D. W., Gao, R. S., Moore, F., Montzka, S. A., Schwarz, J. P., Perring, A. E., Hurst, D., Miller, B. R., Sweeney, C., Oltmans, S., Nance, D., Hintsa, E., Dutton, G., Watts, L. A., Spackman, J. R., Rosenlof, K. H., Ray, E. A., Hall, B., Zondlo, M. A., Diao, M., Keeling, R., Bent, J., Atlas, E. L., Lueb, R., and Mahoney, M. J.: HIPPO Merged 10-second Meteorology, Atmospheric Chemistry, Aerosol Data Version 1.0, UCAR/NCAR – Earth Observing Laboratory [data set], https://doi.org/10.3334/CDIAC/hippo_010, 2017.
Wofsy, S. C., Afshar, S., Allen, H. M., Apel, E. C., Asher, E. C., Barletta, B., Bent, J., Bian, H., Biggs, B. C., Blake, D. R., Blake, N., Bourgeois, I., Brock, C. A., Brune, W. H., Budney, J. W., Bui, T. P., Butler, A., Campuzano-Jost, P., Chang, C. S., Chin, M., Commane, R., Correa, G., Crounse, J. D., Cullis, P. D., Daube, B. C., Day, D. A., Dean-Day, J. M., Dibb, J. E., DiGangi, J. P., Diskin, G. S., Dollner, M., Elkins, J. W., Erdesz, F., Fiore, A. M., Flynn, C. M., Froyd, K. D., Gesler, D. W., Hall, S. R., Hanisco, T. F., Hannun, R. A., Hills, A. J., Hintsa, E. J., Hoffman, A., Hornbrook, R. S., Huey, L. G., Hughes, S., Jimenez, J. L., Johnson, B. J., Katich, J. M., Keeling, R. F., Kim, M. J., Kupc, A., Lait, L. R., Lamarque, J. F., Liu, J., McKain, K., McLaughlin, R. J., Meinardi, S., Miller, D. O., Montzka, S. A., Moore, F. L., Morgan, E. J., Murphy, D. M., Murray, L. T., Nault, B. A., Neuman, J. A., Newman, P. A., Nicely, J. M., Pan, X., Paplawsky, W., Peischl, J., Prather, M. J., Price, D. J., Ray, E. A., Reeves, J. M., Richardson, M., Rollins, A. W., Rosenlof, K. H., Ryerson, T. B., Scheuer, E., Schill, G. P., Schroder, J. C., Schwarz, J. P., St.Clair, J. M., Steenrod, S. D., Stephens, B. B., Strode, S. A., Sweeney, C., Tanner, D., Teng, A. P., Thames, A. B., Thompson, C. R., Ullmann, K., Veres, P. R., Vieznor, N., Wagner, N. L., Watt, A., Weber, R., Weinzierl, B., Wennberg, P. O., Williamson, C. J., Wilson, J. C., Wolfe, G. M., Woods, C. T., and Zeng, L. H.: ATom: Merged Atmospheric Chemistry, Trace Gases, and Aerosols, ORNL Distributed Active Archive Center [data set], https://doi.org/10.3334/ORNLDAAC/1581, 2018.
Worden, J. R., Bloom, A. A., Pandey, S., Jiang, Z., Worden, H. M., Walker, T. W., Houweling, S., and Rockmann, T.: Reduced biomass burning emissions reconcile conflicting estimates of the post-2006 atmospheric methane budget, Nat. Commun., 8, 2227, https://doi.org/10.1038/s41467-017-02246-0, 2017.
Wunch, D., Toon, G. C., Blavier, J. F., Washenfelder, R. A., Notholt, J., Connor, B. J., Griffith, D. W., Sherlock, V., and Wennberg, P. O.: The total carbon column observing network, Philos. T. R. Soc. A, 369, 2087–2112, https://doi.org/10.1098/rsta.2010.0240, 2011.
Xu, X. and Tian, H.: Methane exchange between marshland and the atmosphere over China during 1949–2008, Global Biogeochem. Cy., 26, GB2006, https://doi.org/10.1029/2010gb003946, 2012.
Yin, Y., Chevallier, F., Ciais, P., Bousquet, P., Saunois, M., Zheng, B., Worden, J., Bloom, A. A., Parker, R. J., Jacob, D. J., Dlugokencky, E. J., and Frankenberg, C.: Accelerating methane growth rate from 2010 to 2017: leading contributions from the tropics and East Asia, Atmos. Chem. Phys., 21, 12631–12647, https://doi.org/10.5194/acp-21-12631-2021, 2021.
Yu, X., Millet, D. B., Wells, K. C., Henze, D. K., Cao, H., Griffis, T. J., Kort, E. A., Plant, G., Deventer, M. J., Kolka, R. K., Roman, D. T., Davis, K. J., Desai, A. R., Baier, B. C., McKain, K., Czarnetzki, A. C., and Bloom, A. A.: Aircraft-based inversions quantify the importance of wetlands and livestock for Upper Midwest methane emissions, Atmos. Chem. Phys., 21, 951–971, https://doi.org/10.5194/acp-21-951-2021, 2021.
Zhang, B., Tian, H., Ren, W., Tao, B., Lu, C., Yang, J., Banger, K., and Pan, S.: Methane emissions from global rice fields: Magnitude, spatiotemporal patterns, and environmental controls, Global Biogeochem. Cy., 30, 1246–1263, https://doi.org/10.1002/2016gb005381, 2016.
Zhang, Y., Jacob, D. J., Lu, X., Maasakkers, J. D., Scarpelli, T. R., Sheng, J.-X., Shen, L., Qu, Z., Sulprizio, M. P., Chang, J., Bloom, A. A., Ma, S., Worden, J., Parker, R. J., and Boesch, H.: Attribution of the accelerating increase in atmospheric methane during 2010–2018 by inverse analysis of GOSAT observations, Atmos. Chem. Phys., 21, 3643–3666, https://doi.org/10.5194/acp-21-3643-2021, 2021.
Zhao, Y., Saunois, M., Bousquet, P., Lin, X., Berchet, A., Hegglin, M. I., Canadell, J. G., Jackson, R. B., Hauglustaine, D. A., Szopa, S., Stavert, A. R., Abraham, N. L., Archibald, A. T., Bekki, S., Deushi, M., Jöckel, P., Josse, B., Kinnison, D., Kirner, O., Marécal, V., O'Connor, F. M., Plummer, D. A., Revell, L. E., Rozanov, E., Stenke, A., Strode, S., Tilmes, S., Dlugokencky, E. J., and Zheng, B.: Inter-model comparison of global hydroxyl radical (OH) distributions and their impact on atmospheric methane over the 2000–2016 period, Atmos. Chem. Phys., 19, 13701–13723, https://doi.org/10.5194/acp-19-13701-2019, 2019.